Embed Size (px)
Citation preview
Edinburgh Research Explorer
The genome of a songbirdCitation for published version:Warren, WC, Clayton, DF, Ellegren, H, Arnold, AP, Hillier, LW, Künstner, A, Searle, S, White, S, Vilella, AJ,Fairley, S, Heger, A, Kong, L, Ponting, C, Jarvis, ED, Mello, CV, Minx, P, Lovell, P, Velho, TAF, Ferris, M,Balakrishnan, CN, Sinha, S, Blatti, C, London, SE, Li, Y, Lin, Y-C, George, J, Sweedler, J, Southey, B,Gunaratne, P, Watson, M, Nam, K, Backström, N, Smeds, L, Nabholz, B, Itoh, Y, Whitney, O, Pfenning, AR,Howard, J, Völker, M, Skinner, BM, Griffin, DK, Ye, L, McLaren, WM, Flicek, P, Quesada, V, Velasco, G,Lopez-Otin, C, Puente, XS, Olender, T, Lancet, D, Smit, AFA, Hubley, R, Konkel, MK, Walker, JA, Batzer,MA, Gu, W, Pollock, DD, Chen, L, Cheng, Z, Eichler, EE, Stapley, J, Slate, J, Ekblom, R, Birkhead, T,Burke, T, Burt, D, Scharff, C, Adam, I, Richard, H, Sultan, M, Soldatov, A, Lehrach, H, Edwards, SV, Yang,S-P, Li, X, Graves, T, Fulton, L, Nelson, J, Chinwalla, A, Hou, S, Mardis, ER & Wilson, RK 2010, 'Thegenome of a songbird', Nature, vol. 464, no. 7289, pp. 757-762. https://doi.org/10.1038/nature08819
Digital Object Identifier (DOI):10.1038/nature08819
Link:Link to publication record in Edinburgh Research Explorer
Document Version:Peer reviewed version
Published In:Nature
Publisher Rights Statement:Published in final edited form as:Nature. 2010 April 1; 464(7289): 757–762. doi:10.1038/nature08819.
General rightsCopyright for the publications made accessible via the Edinburgh Research Explorer is retained by the author(s)and / or other copyright owners and it is a condition of accessing these publications that users recognise andabide by the legal requirements associated with these rights.
Take down policyThe University of Edinburgh has made every reasonable effort to ensure that Edinburgh Research Explorercontent complies with UK legislation. If you believe that the public display of this file breaches copyright pleasecontact [email protected] providing details, and we will remove access to the work immediately andinvestigate your claim.
Download date: 22. May. 2020

The genome of a songbird
Wesley C. Warren1, David F. Clayton2, Hans Ellegren3, Arthur P. Arnold4, LaDeana W.Hillier1, Axel Künstner3, Steve Searle5, Simon White5, Albert J. Vilella6, Susan Fairley5,Andreas Heger7, Lesheng Kong7, Chris P. Ponting7, Erich D. Jarvis8, Claudio V. Mello9, PatMinx1, Peter Lovell9, Tarciso A. F. Velho9, Margaret Ferris2, Christopher N. Balakrishnan2,Saurabh Sinha2, Charles Blatti2, Sarah E. London2, Yun Li2, Ya-Chi Lin2, Julia George2,Jonathan Sweedler2, Bruce Southey2, Preethi Gunaratne10, Michael Watson11, KiwoongNam3, Niclas Backström3, Linnea Smeds3, Benoit Nabholz3, Yuichiro Itoh4, OsceolaWhitney8, Andreas R. Pfenning8, Jason Howard8, Martin Völker11, Bejamin M. Skinner12,Darren K. Griffin12, Liang Ye1, William M. McLaren6, Paul Flicek6, Victor Quesada13, GloriaVelasco13, Carlos Lopez-Otin13, Xose S. Puente13, Tsviya Olender14, Doron Lancet14, ArianF. A. Smit15, Robert Hubley15, Miriam K. Konkel16, Jerilyn A. Walker16, Mark A. Batzer16,Wanjun Gu17, David D. Pollock17, Lin Chen18, Ze Cheng18, Evan E. Eichler18, JessicaStapley18, Jon Slate19, Robert Ekblom19, Tim Birkhead19, Terry Burke19, David Burt20,Constance Scharff21, Iris Adam21, Hugues Richard22, Marc Sultan22, Alexey Soldatov22,Hans Lehrach22, Scott V. Edwards23, Shiaw-Pyng Yang24, XiaoChing Li25, Tina Graves1,Lucinda Fulton1, Joanne Nelson1, Asif Chinwalla1, Shunfeng Hou1, Elaine R. Mardis1, andRichard K. Wilson1
1The Genome Center, Washington University School of Medicine, Campus Box 8501, 4444Forest Park Avenue, St Louis, Missouri 63108, USA2University of Illinois, Urbana-Champaign, Illinois 61801 USA3Uppsala University, Institute for Evolution and Genetics Systems, Norbyvägen 18D 752 36Uppsala, Sweden4University of California- Los Angeles, Los Angeles, California 90056, USA
Correspondence and requests for materials should be addressed to W.C.W. ([email protected]), D.F.C([email protected]), H.E. ([email protected]) or A.P.A. ([email protected]).Supplementary Information is linked to the online version of the paper at www.nature.com/nature.Author Contributions W.C.W., D.F.C., H.E. and A.P.A. comprise the organizing committee of the zebra finch genome sequencingproject. Project planning, management and data analysis: W.C.W., D.F.C., H.E. and A.P.A. Assembly annotation and analysis:L.W.H., P.M., S.-P.Y., L.Y., J.N., A.C., S.H., J.Sl., J.St., D.B. and S.-P.Y. Protein coding and non-coding gene prediction: S.S., C.B.,P.F., S.W., A.H., C.P.P. and L.K. SNP analysis: P.F. and W.M.M. Orthology prediction and analysis: A.J.V., A.H., C.P.P., S.F. andL.K. Repeat element analysis: M.A.B., A.F.A.S., R.H., M.K.K., J.A.W., W.G. and D.D.P. Segmental duplication and gene duplicationanalysis: L.C., Z.C., E.E.E., L.K., C.P.P., M.F., C.N.B., R.E., J.G. and S.E.L. Protease annotation and analysis: X.S.P., V.Q., G.V. andC.L.-O. Neuropeptide hormone annotation: J.Sw. and B.S. Small non-coding RNA analysis: Y-C.L., Y.L., P.G., M.W. and X.L.Comparative mapping: D.K.G., M.V. and B.M.S. Singing induced gene network analysis: E.D.J., A.R.P., O.W. and J.H. Z-chromosome analysis: Y.I. and A.P.A. Gene expression and in situ analysis and synapsin synteny/loss analysis: C.V.M., P.L. andT.A.F.V. Adaptive evolution analysis: A.K., K.N., N.B., L.S., B.N. and C.N.B. Gene expression in the brain analysis: C.S., I.A., A.S.,H.L., H.R. and M.S. MHC analysis: S.E., C.N.B. and R.E. Olfactory receptor analysis: T.O., D.L. and L.K. Sequencing management:R.K.W., E.R.M. and L.F. Physical map construction: T.G. Zebra finch tissue resources: T.Bu. and T.Bi. Zebra finch cDNA resources:D.F.C., E.D.J. and X.L.Author Information The Taeniopygia guttata whole-genome shotgun project has been deposited in DDBJ/EMBL/GenBank underthe project accession ABQF00000000.Reprints and permissions information is available at www.nature.com/reprints.This paper is distributed under the terms of the Creative Commons Attribution-Non-Commercial-Share Alike licence, and is freelyavailable to all readers at www.nature.com/nature.The authors declare no competing financial interests.
NIH Public AccessAuthor ManuscriptNature. Author manuscript; available in PMC 2011 October 5.
Published in final edited form as:Nature. 2010 April 1; 464(7289): 757–762. doi:10.1038/nature08819.
NIH
-PA Author Manuscript
NIH
-PA Author Manuscript
NIH
-PA Author Manuscript

5Wellcome Trust Sanger Institute, Wellcome Trust Genome Campus, Hinxton, Cambridge CB101SA, UK6EMBL-EBI, Wellcome Trust Genome Campus, Hinxton, Cambridge CB10 1SD, UK7MRC Functional Genomics Unit, University of Oxford, Department of Physiology, Anatomy andGenetics, South Parks Road, Oxford OX1 3QX, UK8Howard Hughes Medical Institute, Department of Neurobiology, Box 3209, Duke UniversityMedical Center, Durham, North Carolina 27710, USA9Department of Behavioral Neuroscience, Oregon Health & Science University, Portland, Oregon97239, USA10Department of Biology & Biochemistry, University of Houston, Houston, Texas 77204, USA11Department of Bioinformatics, Institute for Animal Health, Compton Berks RG20 7NN, UK12Department of Biosciences, University of Kent, Canterbury, Kent CT2 7NJ, UK13Instituto Universitario de Oncologia, Departamento de Bioquimica y Biologia Molecular,Universidad de Oviedo, 33006-Oviedo, Spain14Crown Human Genome Center, Department of Molecular Genetics, Weizmann Institute ofScience, Rehovot 76100, Israel15Institute for Systems Biology, 1441 North 34th Street, Seattle, Washington 98103-8904, USA16Department of Biological Sciences, Louisiana State University, 202 Life Sciences Building,Baton Rouge, Louisiana 70803, USA17Department of Biochemistry & Molecular Genetics, University of Colorado Health SciencesCenter, Mail Stop 8101, Aurora, Colorado 80045, USA18University of Washington, Genome Sciences, Seattle, Washington 98195, USA19Department of Animal & Plant Sciences, University of Sheffield, Sheffield S10 2TN, UK20The Roslin Institute and Royal (Dick) School of Veterinary Studies, Edinburgh University, EH259OS, UK21Freie Universitaet Berlin, Institut Biology, Takustr.6, 14195 Berlin, Germany22Department of Vertebrate Genomics, Max Planck Institute for Molecular Genetics, IhnestraBe73 14195 Berlin, Germany23Department of Organismic and Evolutionary Biology, Harvard University, Cambridge,Massachusetts 02138, USA24Monsanto Company, 800 North Lindbergh Boulevard, St Louis, Missouri 63167, USA25Neuroscience Center, Louisiana State University Health Sciences Center, New Orleans,Louisiana 70112, USA
AbstractThe zebra finch is an important model organism in several fields1,2 with unique relevance tohuman neuroscience3,4. Like other songbirds, the zebra finch communicates through learnedvocalizations, an ability otherwise documented only in humans and a few other animals andlacking in the chicken5—the only bird with a sequenced genome until now6. Here we present astructural, functional and comparative analysis of the genome sequence of the zebra finch(Taeniopygia guttata), which is a songbird belonging to the large avian order Passeriformes7. Wefind that the overall structures of the genomes are similar in zebra finch and chicken, but they
Warren et al. Page 2
Nature. Author manuscript; available in PMC 2011 October 5.
NIH
-PA Author Manuscript
NIH
-PA Author Manuscript
NIH
-PA Author Manuscript

differ in many intrachromosomal rearrangements, lineage-specific gene family expansions, thenumber of long-terminal-repeat-based retrotransposons, and mechanisms of sex chromosomedosage compensation. We show that song behaviour engages gene regulatory networks in thezebra finch brain, altering the expression of long non-coding RNAs, microRNAs, transcriptionfactors and their targets. We also show evidence for rapid molecular evolution in the songbirdlineage of genes that are regulated during song experience. These results indicate an activeinvolvement of the genome in neural processes underlying vocal communication and identifypotential genetic substrates for the evolution and regulation of this behaviour.
As in all songbirds, singing in the zebra finch is under the control of a discrete neural circuitthat includes several dedicated centres in the forebrain termed the ‘song control nuclei’ (foran extensive series of reviews see ref. 8). Neurophysiological studies in these nuclei duringsinging have yielded some of the most illuminating examples of how vocalizations areencoded in the motor system of a vertebrate brain9,10. In the zebra finch, these nucleidevelop more fully in the male than in the female (who does not sing), and they changemarkedly in size and organization during the juvenile period when the male learns to sing11.Analysis of the underlying cellular mechanisms of plasticity led to the unexpected discoveryof neurogenesis in adult songbirds and life-long replacement of neurons12. Sex steroidhormones also contribute to songbird neural plasticity, in part by influencing the survival ofnew neurons13. Some of these effects are probably caused by oestrogen and/or testosteronesynthesized within the brain itself rather than just in the gonads14.
Song perception and memory also involve auditory centres that are present in both sexes,and the mere experience of hearing a song activates gene expression in these auditorycentres15. The gene response itself changes as a song becomes familiar over the course of aday16 or as the context of the experience changes17. The act of singing induces geneexpression in the male song control nuclei, and these patterns of gene activation also varywith the context of the experience18. The function of this changing genomic activity is notyet understood, but it may support or suppress learning and help integrate information overperiods of hours to days19.
The chicken genome is the only other bird genome analysed to date6. The chicken and zebrafinch lineages diverged about 100 million years ago near the base of the avian radiation7. Bycomparing their genomes we can now discern features that are shared (and thus generallycharacteristic of birds), and features that are most conspicuously different between the twolineages—some of which will be related to the distinctive neural and behavioural traits ofsongbirds.
We sequenced and assembled a male zebra finch genome using methods describedpreviously6,20. A male (the homogametic sex in birds) was chosen to maximize coverage ofthe Z chromosome. Of the 1.2 gigabase (Gb) draft assembly, 1.0 Gb has been assigned to 33chromosomes and three linkage groups, by using zebra finch genetic linkage21 and bacterialartificial chromosome (BAC) fingerprint maps. The genome assembly is of sufficient qualityfor the analysis presented here (see Supplementary Note 1 and Supplementary Table 1). Atotal of 17,475 protein-coding genes were predicted from the zebra finch genome assemblyusing the Ensembl pipeline supplemented by Gpipe gene models (Supplementary Note 1).To extend further the characterization of genes relevant to brain and behaviour, we alsosequenced complementary DNAs from the forebrain of zebra finches at 50 (juvenile, duringthe critical song learning period) and 850 (adult) days post-hatch, mapping these reads(Illumina GA2) to the protein-coding models (Supplementary Note 1). Of the 17,475protein-coding gene models we find 9,872 (56%) and 10,106 (57%) genes expressed in theforebrain at these two ages (90.7% overlap), respectively. In addition to evidence for
Warren et al. Page 3
Nature. Author manuscript; available in PMC 2011 October 5.
NIH
-PA Author Manuscript
NIH
-PA Author Manuscript
NIH
-PA Author Manuscript

developmental regulation, these reads show further splice forms, new exons and untranslatedsequences (Supplementary Figs 1 and 2).
To address issues of large-scale genome structure and evolution, we compared thechromosomes of zebra finch and chicken using both sequence alignment and fluorescent insitu hybridization. These analyses showed overall conservation of synteny and karyotype inthe two species, although the rate of intrachromosomal rearrangement was high(Supplementary Note 2). We were also surprised to see genes of the majorhistocompatibility complex (MHC) dispersed across several chromosomes in the zebrafinch, in contrast to the syntenic organization of both chicken and human MHCs(Supplementary Note 2).
We assessed specific gene losses and expansions in the zebra finch lineage by constructingphylogenies of genes present in the last common ancestor of birds and mammals(Supplementary Note 2 and Supplementary Fig. 3). Both the zebra finch and the chickengenome assemblies lack genes encoding vomeronasal receptors, casein milk proteins,salivary-associated proteins and enamel proteins—not surprisingly, as birds lackvomeronasal organs, mammary glands and teeth. Unexpectedly, both species lack the genefor the neuronal protein synapsin 1 (SYN1); comparative analyses suggest that the loss ofSYN1 and flanking genes probably occurred in an ancestor to modern birds, possibly withinthe dinosaur lineage (Supplementary Note 2, Supplementary Table 2 and SupplementaryFig. 4). Both zebra finch and chicken have extensive repertoires of olfactory receptor-likesequences (Supplementary Note 2 and Supplementary Fig. 5), proteases (SupplementaryTable 3), and a rich repertoire of neuropeptide and pro-hormone genes.
Compared to mammals, zebra finch has duplications of genes encoding several proteins withknown neural functions, including growth hormone, (Supplementary Fig. 3), caspase-3 andβ-secretase (Supplementary Table 3). Two large expansions of gene families expressed inthe brain seem to have occurred in the zebra finch lineage after the split from mammals. Oneinvolves a family related to the PAK3 (p21-activated kinase) gene. Thirty-one uninterruptedPAK3-like sequences have been identified in the zebra finch genome, of which 29 areexpressed in testis and/or brain (Supplementary Note 2). The second involves the PHF7gene, which encodes a zinc-finger-containing transcriptional control protein. Humans onlyhave a single PHF7 gene, but remarkably the gene has been duplicated independently, manytimes in both the zebra finch and chicken lineages to form species-specific clades of 17 and18 genes, respectively (Supplementary Fig. 6). In the zebra finch these genes are expressedin the brain (Supplementary Note 2).
An intriguing puzzle in avian genomics has been the evident lack of a chromosome-widedosage compensation mechanism to balance the expression of genes on the Z sexchromosome, which is present in two copies in males but only one in females22,23. Thechicken has been suspected of exerting dosage compensation on a more local level, by thenon-coding RNA MHM (male hypermethylated)24,25, to cause a characteristic variation ofgene expression along the Z chromosome. The zebra finch genome assembly, however,lacks an MHM sequence, and genes adjacent to the comparable MHM chromosomalposition show no special cluster of dosage compensation (Fig. 1 and Supplementary Note 2).Thus, the putative MHM-mediated mechanism of restricted Z-chromosome dosagecompensation is not common to all birds. Chromosomal sex differences in the brain couldhave a direct role in the sex differences so evident in zebra finch neuroanatomy and singingbehaviour.
In mammals, as much as half of their genomes represent interspersed repeats derived frommobile elements, whereas the interspersed repeat content of the chicken genome is only
Warren et al. Page 4
Nature. Author manuscript; available in PMC 2011 October 5.
NIH
-PA Author Manuscript
NIH
-PA Author Manuscript
NIH
-PA Author Manuscript

8.5%. We find that the zebra finch genome also has a low overall interspersed repeat content(7.7%), containing a little over 200,000 mobile elements (Supplementary Tables 4 and 5).The zebra finch, however, has about three times as many retrovirus-derived long terminalrepeat (LTR) element copies as the chicken, and a low copy number of short interspersedelements (SINEs), which the chicken lacks altogether. Expressed sequence tag (EST)analysis shows that mobile elements are present in about 4% of the transcripts expressed inthe zebra finch brain, and some of these transcripts are regulated by song exposure (nextsection, Table 1). Figure 2 shows an example of an RNA that was identified in a microarrayscreening for genes specifically enriched in song control nuclei26 and now seems torepresent a long non-coding RNA (ncRNA) containing a CR1-like mobile element. Theseresults indicate that further experiments investigating a possible role of mobile-element-derived repeated sequences in vocal communication are warranted.
A large portion of the genome is directly engaged by vocal communication. A recent study27
defined distinct sets of RNAs in the auditory forebrain that respond in different ways to songplaybacks during the process of song-specific habituation, a form of learning16. We nowmap each of these song-responsive RNAs to the genome assembly (Table 1 andSupplementary Note 3). Notably, we find evidence that ∼40% of transcripts in theunstimulated auditory fore-brain are non-coding and derive from intronic or intergenic loci(Table 1). Among the RNAs that are rapidly suppressed in response to new vocal signals(‘novel down’), two-thirds are ncRNAs.
The robust involvement of ncRNAs in the response to song led us to ask whether songexposure alters the expression of microRNAs—small ncRNAs that regulate gene expressionby binding to target messenger RNAs. Indeed we find that miR-124, a conserved microRNAimplicated in neurological function in other species28, is rapidly suppressed in response tosong playbacks (Fig. 3). We independently measured this effect by direct Illuminasequencing of small RNAs in the auditory forebrain, and also identified other known andnew microRNAs, several of which also change in expression after song stimulation(Supplementary Note 2).
A potential site of action for microRNAs was shown by genomic mapping of transcripts thatincrease rapidly after new song exposure (Table 1, ‘novel up’). Two of the cDNA clonesthat measured the most robust increases27 align to an unusually long (3 kilobases (kb)) 3′untranslated region (UTR) in the human gene that encodes the NR4A3 transcription factorprotein (Fig. 4a). The entire UTR is similar in humans and zebra finches, with several longsegments of >80% identity (Fig. 4b). Within these segments we find conserved predictedbinding sites for 11 different microRNAs, including five new microRNAs found by directsequencing of small RNAs from the zebra finch forebrain (Fig. 4b). These findings indicatethat this NR4A3 transcript element may function in both humans and songbirds to integratemany conserved microRNA regulatory pathways.
The act of singing also alters gene expression in song control nuclei29, and we used thegenome assembly to analyse the transcriptional control structure of this response. Usingoligonucleotide microarrays, we identified 807 genes in which expression significantlychanged as a result of singing. These were grouped by k-means clustering into 20 distinctexpression profile clusters (Fig. 5a and Supplementary Note 3). Gene regulatory sequences(transcription-factor-binding sites) were predicted across the genome using a new motif-scanning approach (Supplementary Note 1), and we observed significant correlationbetween changes in expression of transcription factor genes and their predicted targets (Fig.5b and Supplementary Table 6). Thus, the experience of singing and hearing song engagescomplex gene regulatory networks in the forebrain, altering the expression of microRNAs,
Warren et al. Page 5
Nature. Author manuscript; available in PMC 2011 October 5.
NIH
-PA Author Manuscript
NIH
-PA Author Manuscript
NIH
-PA Author Manuscript

transcription factor genes, and their targets, as well as of non-coding RNA elements thatmay integrate transcriptional and post-transcriptional control systems.
Learned vocal communication is crucial to the reproductive success of a songbird, and thisbehaviour evolved after divergence of the songbird lineage5. Thus, it seems likely that genesinvolved in the neurobiology of vocal communication have been influenced by positiveselection in songbirds. With this in mind, we examined the intersection of two sets of genes:(1) those that respond to song exposure in the auditory forebrain as discussed in the previoussection; and (2) those that contain residues that seem to have been positively selected in thezebra finch lineage, as determined using phylogenetic analysis by maximum likelihood(PAML) (Supplementary Note 4). There are 214 genes that are common to both lists. Ofthese, 49 are suppressed by song exposure (Supplementary Table 7), and 6 of these 49 areexplicitly annotated for ion channel activity (Table 2). This yields a highly significantstatistical enrichment for the term ‘ion channel activity’ (P = 0.0016, false discovery rate(FDR) adjusted Fisher's exact test) and other related terms in this subset of genes(Supplementary Tables 8 and 9). Independent evidence has also demonstrated differentialanatomical expression of ion channel genes in song control nuclei26,30. Ion channel geneshave important roles in many aspects of behaviour, neurological function and disease31. Thisclass of genes is highly likely to be linked to song behaviour and should be a major targetfor future functional studies.
Passerines represent one of the most successful and complex radiations of terrestrialanimals7. Here we present the first, to our knowledge, analysis of the genome of a passerinebird. The zebra finch was chosen because of its well-developed status as a model organismfor a number of fields in biology, including neurobiology, ethology, ecology, biogeographyand evolution. In the zebra finch as in the chicken, we see a smaller, tighter genomecompared to mammals, with a marked reduction of interspersed repeats. The zebra finchpresents a picture of greater genomic plasticity than might have been expected from thechicken and other precedents, with a high degree of intrachromosomal rearrangementsbetween the two avian species, gene copy number variations and transcribed mobileelements. Yet we also see an overall similarity to mammals in protein-coding gene contentand core transcriptional control systems.
Our analysis suggests several channels through which evolution may have acted to producethe unique neurobiological properties of songbirds compared to the chicken and otheranimals. These include the management of sex chromosome gene expression, acceleratedevolution of neuronal ion transport genes, gene duplications to produce new variants ofPHF7, PAK3 and other neurobiologically important genes, and a new arrangement of MHCgenes. Most notably, our analyses suggest a large recruitment of the genome during vocalcommunication, including the extensive involvement of ncRNAs. It has been proposed thatncRNAs have a contributing role in enabling or driving the evolution of greater complexityin humans and other complex eukaryotes32. Seeing that learned vocal communication itselfis a phenomenon that has emerged only in some of the most complex organisms, perhapsncRNAs are a nexus of this phenomenon.
Much work will be needed to establish the actual functional significance of many of theseobservations and to determine when they arose in avian evolution. This work can now beexpedited with the recent development of a method for transgenesis in the zebra finch33. Animportant general lesson, however, is that dynamic and serendipitous aspects of the genomemay have unexpected roles in the elaborate vocal communicative capabilities of songbirds.
Warren et al. Page 6
Nature. Author manuscript; available in PMC 2011 October 5.
NIH
-PA Author Manuscript
NIH
-PA Author Manuscript
NIH
-PA Author Manuscript

Methods SummarySequence assembly
Sequenced reads were assembled and attempts were made to assign the largest contiguousblocks of sequence to chromosomes using a genetic linkage map21, fingerprint map andsynteny with the chicken genome assembly Gallus_gallus-2.1, a revised version of theoriginal draft6 (Supplementary Note 1).
GenesGene orthology assignment was performed using the EnsemblCompara GeneTrees pipelineand the OPTIC pipeline (Supplementary Note 1). Orthology rate estimation was performedwith PAML (pairwise model = 0, Nssites = 0). In all cases, codon frequencies wereestimated from the nucleotide composition at each codon position (F3X4 model).
Gene expression and evolutionMethods for Illumina read counting, in situ hybridization, TaqMan RT–PCR, microarrays,regulatory motif and evolutionary rate analyses are given in Supplementary Notes 1–4.
Supplementary MaterialRefer to Web version on PubMed Central for supplementary material.
AcknowledgmentsAcknowledgements The sequencing of zebra finch was funded by the National Human Genome Research Institute(NHGRI). Further research support included grants to D.F.C. (NIH RO1 NS045264 and RO1 NS051820), H.E.(Swedish Research Council and Knut and Alice Wallenberg Foundation), E.D.J. (HHMI, NIH Directors PioneerAward and R01 DC007218), M.A.B. (NIH RO1 GM59290) and J.S. (Biotechnology and Biological SciencesResearch Council grant number BBE0175091). Resources for exploring the sequence and annotation data areavailable on browser displays available at UCSC (http://genome.ucsc.edu), Ensembl (http://www.ensembl.org), theNCBI (http://www.ncbi.nlm.nih.gov) and http://aviangenomes.org. We thank K. Lindblad-Toh for permission touse the green anole lizard genome assembly, the Production Sequencing Group of The Genome Center atWashington University School of Medicine for generating all the sequence reads used for genome assembly, andthe Clemson University Genome Institute for the construction of the BAC library. We would like to recognize allthe important published work that we were unable to cite owing to space limitations.
Warren et al. Page 7
Nature. Author manuscript; available in PMC 2011 October 5.
NIH
-PA Author Manuscript
NIH
-PA Author Manuscript
NIH
-PA Author Manuscript

Appendix
Accessory Figure 1. Predicted motif genome location distribution(A) Density of predicted motifs (y axis) for different categories of regions (x axis) in termsof location with respect to their nearest genes, shown in blue. The horizontal pink line is thegenome-wide average. See text for definitions of motif density and various regioncategories. (B) P-values of enrichment or depletion of motif occurrence in each category ofregions, using one-tailed Fishers exact tests. Negative logarithms are shown.
Warren et al. Page 8
Nature. Author manuscript; available in PMC 2011 October 5.
NIH
-PA Author Manuscript
NIH
-PA Author Manuscript
NIH
-PA Author Manuscript

Accessory Figure 2. Motif target counts by defined locationCounts of targets windows of individual motifs in different categories of regions arecompared to the respective expected values, with colors shown indicating whether the countis greater or less than expectation. Green cells correspond to counts that are higher than theaverage and red cells correspond to regions with below-average counts.
Warren et al. Page 9
Nature. Author manuscript; available in PMC 2011 October 5.
NIH
-PA Author Manuscript
NIH
-PA Author Manuscript
NIH
-PA Author Manuscript

Warren et al. Page 10
Nature. Author manuscript; available in PMC 2011 October 5.
NIH
-PA Author Manuscript
NIH
-PA Author Manuscript
NIH
-PA Author Manuscript

Warren et al. Page 11
Nature. Author manuscript; available in PMC 2011 October 5.
NIH
-PA Author Manuscript
NIH
-PA Author Manuscript
NIH
-PA Author Manuscript

Warren et al. Page 12
Nature. Author manuscript; available in PMC 2011 October 5.
NIH
-PA Author Manuscript
NIH
-PA Author Manuscript
NIH
-PA Author Manuscript

Warren et al. Page 13
Nature. Author manuscript; available in PMC 2011 October 5.
NIH
-PA Author Manuscript
NIH
-PA Author Manuscript
NIH
-PA Author Manuscript

Accessory Figure 3.Comparative analysis of marker order on chicken chromosomes 2-8 and Z (GGA2-8,GGAZ) and their zebra finch orthologues (TGU2-8, TGUZ). The central part of each figurewas created by aligning whole chromosomal sequences using the program GenAlyzer. Linecolour indicates the length of sequences with 100% sequence identity. The tentativechromosomal rearrangements suggested by this analysis were verified using fluorescent insitu hybridization (FISH). Letters indicate the position of chicken and zebra finch BACswith orthologous sequence content in the genome sequences of both species (see accessoryfile Physical mapping table 2009-09-16.xls for details on the FISH probes used). Red dotson the ideograms illustrate the physical chromosomal position as determined by FISH.
Warren et al. Page 14
Nature. Author manuscript; available in PMC 2011 October 5.
NIH
-PA Author Manuscript
NIH
-PA Author Manuscript
NIH
-PA Author Manuscript
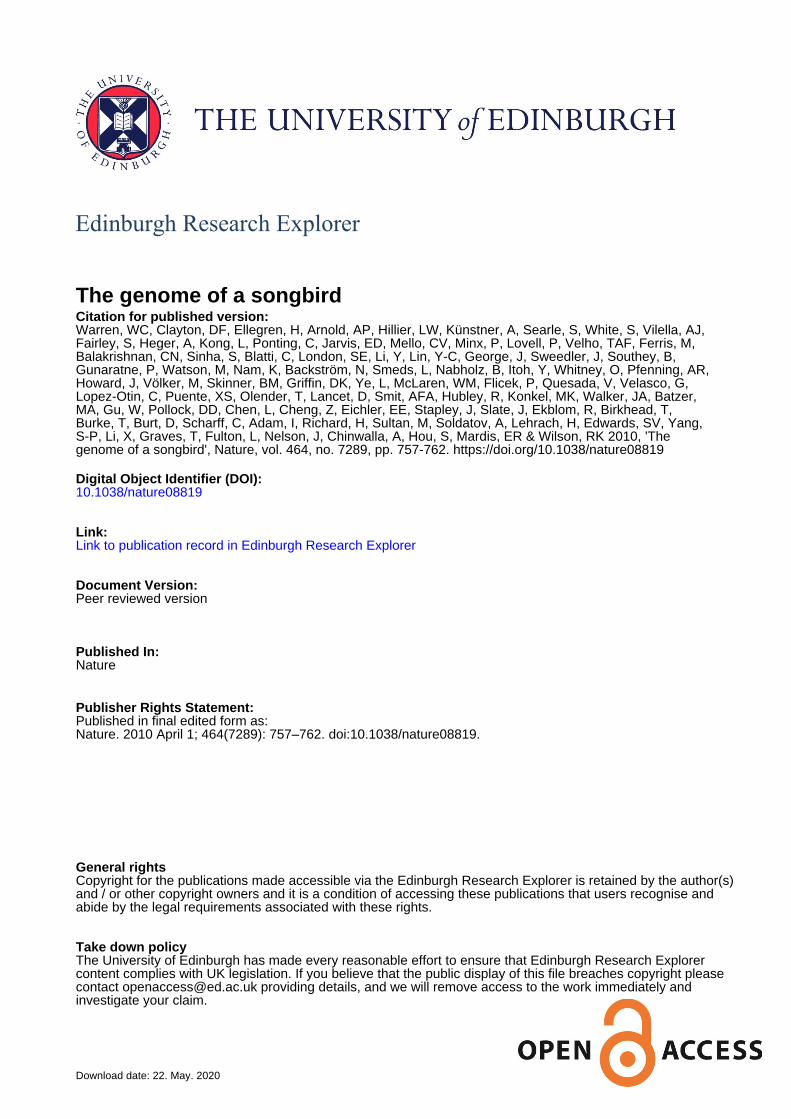
Accessory Figure 4. Bayesian phylogenies of zebra finch MHC genes(A) Class I genes and (B) Class IIB genes were compared to sequences from the chickenMHC-B complex. Putatively functional zebra finch genes with open reading frames aregiven numerical suffixes and putative pseudogenes are given lettered suffixes. For Class Iwe also include a chicken sequence from the MHC-Y region (YFV). For zebra finch class I,we show the placement of eight brain ESTs (indicated by their GenBank accession numbers)supporting the expression of MHC Class I genes in the brain. Posterior probabilities aregiven for well-supported nodes in the tree.
Warren et al. Page 15
Nature. Author manuscript; available in PMC 2011 October 5.
NIH
-PA Author Manuscript
NIH
-PA Author Manuscript
NIH
-PA Author Manuscript

Accessory Figure 5.General view showing WGAC (>5kb) and WSSD on all chromosomes. Grey above lines isWSSD and red below lines is WGAC. ChrUn was treated as a “distinct” chromosome.
Warren et al. Page 16
Nature. Author manuscript; available in PMC 2011 October 5.
NIH
-PA Author Manuscript
NIH
-PA Author Manuscript
NIH
-PA Author Manuscript

Accessory Figure 6.(A) Characteristics of co-expressed gene sets from Dong et al. 58 (See S3 supplementarynotes). “Gene set”: name of the gene set, as in the original paper. “All genes” refers to thegenes on the array in Dong et al. Numbers in parentheses indicate component subsets of aset. “Size”: number of genes in set. “terr_len”: average gene territory length of a gene set.“gene_len”: average coding sequence length. “intergenic_length”: average of (territorylength – gene length). “p-value”: statistical significance of enrichment for short (pink cells)or long (green cells) territories, as measured by 2-tailed Wilcoxon Rank Sum tests. (B)Average gene length and intergenic length of a gene set (y axis) versus average geneterritory length. Each point corresponds to a gene set.
Accessory Table 1Zebra finch chromosome nomenclature and length
Chicken (GGA) and finch (TGU) chromosome names suggested by Itoh et al., 2005(Supplementary Notes 1).
Ordered Random
TGU GGA Itoh et al.,2005
TGU length TGU %GC TGU length TGU %GC
Tgu1 1 3 118548696 0.39 1193292 0.4
Tgu1A 1 4 73657157 0.39 689636 0.46
Tgu1B 1 NA 1083483 0.5 142794 0.45
Tgu2 2 1 156412533 0.39 1793874 0.39
Tgu3 3 2 112617285 0.39 1378982 0.46
Tgu4 4 5 69780378 0.39 5148506 0.4
Tgu4A 4 micro 20704505 0.43 258280 0.44
Tgu5 5 6 62374962 0.41 2517995 0.42
Tgu6 6 7 36305782 0.41 2096744 0.43
Tgu7 7 8 39844632 0.41 603983 0.44
Tgu8 8 9 27993427 0.41 5113623 0.46
Tgu9 9 10 27241186 0.43 369730 0.42
Warren et al. Page 17
Nature. Author manuscript; available in PMC 2011 October 5.
NIH
-PA Author Manuscript
NIH
-PA Author Manuscript
NIH
-PA Author Manuscript

Ordered Random
TGU GGA Itoh et al.,2005
TGU length TGU %GC TGU length TGU %GC
Tgu10 10 NA 20806668 0.43 559132 0.46
Tgu11 11 NA 21403021 0.42 295904 0.44
Tgu12 12 NA 21576510 0.43 345412 0.43
Tgu13 13 NA 16962381 0.44 2653678 0.47
Tgu14 14 NA 16419078 0.45 252098 0.5
Tgu15 15 NA 14428146 0.46 359589 0.46
Tgu16 16 NA 9909 0.48 187953 0.49
Tgu17 17 NA 11648728 0.48 210589 0.48
Tgu18 18 NA 11201131 0.46 474824 0.48
Tgu19 19 NA 11587733 0.46 200344 0.46
Tgu20 20 NA 15652063 0.46 300503 0.47
Tgu21 21 NA 5979137 0.46 1862743 0.49
Tgu22 22 NA 3370227 0.48 803674 0.5
Tgu23 23 NA 6196912 0.49 548500 0.48
Tgu24 24 NA 8021379 0.48 186162 0.49
Tgu25 25 NA 1275379 0.52 472805 0.48
Tgu26 26 NA 4907541 0.5 1627540 0.49
Tgu27 27 NA 4618897 0.49 208747 0.49
Tgu28 28 NA 4963201 0.5 199714 0.51
TguLGE22 LGE22C19W28_E50C23 NA 883365 0.51 454016 0.5
TguLGE22A LGE22C19W28_E50C23 NA
Tgun2 NA NA 109741 0.49
Tgun5 NA NA 16416 0.42
TguZ Z Z 72861351 0.39 2969867 0.41
TguUn Un Un 175225315 0.42
Abbreviations are as follows TGU – zebra finch, GGU – chicken, ordered presents linkage or other ordering informationthat allowed unambiguous contig or supercontig chromosomal placement, random – represents partial ordering informationthat only allows chromosome placement but not order on the chromosome. GC% is the percentage of G and C bases pertotal bases counted.
Accessory Table 2
Summary of gene orthologs defined from sequence homology, gene trees and conservationof synteny.
Species Comparison No Homologs 1:1 Orthologs 1:M Orthologs M:M Orthologs Total Orthologs Total Genes
Zebra finch/Chicken 3,863 10,161 3,563 135 13,859 17,722
Zebra finch/Human 4,695 10,861 2,028 140 13,029 17,724
Chicken/Human 5,035 11,429 1,141 119 12,689 17,724
Warren et al. Page 18
Nature. Author manuscript; available in PMC 2011 October 5.
NIH
-PA Author Manuscript
NIH
-PA Author Manuscript
NIH
-PA Author Manuscript

Accessory Table 3
All (motif, region category) pairs with z-scores greater than 3 or less than -3 are shown.
Factor Region Z-Score Factor Region Z-Score Factor Region Z-Score
FOXL1 NearUp 8.33 Arnt Intronic 3.58 MIZF FarDown -3.09
CREB1 CDS 7.75 NFYA FarDown 3.58 Klf4 Intronic -3.14
FOXC1 Intronic 7.25 STAT1 NearDown 3.58 Myf NearUp -3.27
YY1 CDS 6.83 Evi1 NearDown 3.45 Sox5 NearDown -3.35
Gata1 CDS 6.76 GATA3 FarDown 3.42 REL FarDown -3.36
NFYA NearUp 6.03 USF1 Intronic 3.38 ETS1 FarUp -3.39
ZEB1 CDS 5.07 MIZF Intronic 3.36 PPARG NearUp -3.41
NF-kappaB NearDown 4.06 PPARG FarDown 3.32 Arnt FarDown -3.45
E2F1 NearUp 3.93 MAX Intronic 3.23 ZEB1 NearUp -3.47
RORA_1 FarUp 3.92 Mycn Intronic 3.23 ETS1 FarDown -3.49
NFIL3 Intronic 3.87 GABPA CDS 3.22 TFAP2A Intronic -3.5
Sox5 MedDown 3.82 SRF MedDown 3.17 Mycn FarDown -3.59
Myf Intronic 3.8 Myb CDS 3.09 REST NearUp -3.88
Evi1 FarDown 3.78 TFAP2A NearUp 3.08 MZF1_5-13 Intronic -3.91
Ar Intronic 3.76 Myf CDS 3.01 SRF NearUp -4.02
SOX9 FarUp 3.75 FOXC1 MedDown -3.04 GATA2 Intronic -4.09
RELA NearDown 3.71 TBP CDS -3.04 FOXC1 FarDown -4.23
RORA_1 FarDown 3.71 REL FarUp -3.05 NFYA Intronic -5.18
TBP NearUp 3.65 MIZF MedDown -3.09 Evi1 Intronic -5.56
Accessory Table 4Comparison of motif – region preferences
Comparisons were made to human (see S1 Supplementary notes; Blanchette et al. 2006).Shown are the z-scores for motifs that were common to the two studies. We note thatBlanchette et al. studied only one “FOX” motif, one “GATA” motif and one “RORA” motif,whereas our compendium includes multiple versions (marked in gray, column 1). Columns 2– 6 are z-scores from this study, columns 7 – 9 indicate overrepresentation (“u”, pink) ordepletion (“d”, green) of a motif in a particular region category as reported by Blanchette etal. Cells with bold outlines in columns 7 – 9 are cases where our findings agree with those ofBlanchette et al (our z-score is > 2 or < -2). Cells with bold outlines in columns 2 – 6 arecases where our findings disagree with those of Blanchette et al. In all other cases, either ofthe two studies reports a non-significant enrichment or depletion.
Songbird (this study) Human (Blanchette et al.)
factor FarUp MedUp NearUp CDS Intronic farup nearup intron
CREB1 -2.72 -0.98 2.31 7.75 -0.39 u
E2F1 0.2 0.52 3.93 -1.09 -2.16 d u u
ELK1 -1.02 1.01 1.82 -0.6 -2.49 u
Foxa2 2.4 0.27 -1.18 -0.67 -1.29 d u
FOXC1 -2.36 -2.15 0.17 1.15 7.25 d u
Warren et al. Page 19
Nature. Author manuscript; available in PMC 2011 October 5.
NIH
-PA Author Manuscript
NIH
-PA Author Manuscript
NIH
-PA Author Manuscript

Songbird (this study) Human (Blanchette et al.)
factor FarUp MedUp NearUp CDS Intronic farup nearup intron
FOXD1 -1.11 -0.9 1.74 -0.9 1.23 d u
Foxd3 0.5 -1.13 0.03 -0.79 -0.88 d u
FOXF2 0.43 0.21 0.07 -0.55 0.19 d u
FOXI1 -0.55 -0.59 2.11 -0.09 0.9 d u
FOXL1 -2.71 -0.23 8.33 -2.58 -2.87 d u
Foxq1 -1.44 2.23 -0.8 -0.9 -0.2 d u
GABPA 0.4 0.9 0.67 3.22 0.29 u
Gata1 -0.67 -0.7 -0.86 6.76 0.4 u d
GATA2 1.12 -1.24 1.41 2.15 -4.09 u d
GATA3 1.7 -0.4 -0.03 -1.09 -3 u d
MEF2A -1.56 1.63 2.66 -1.13 -0.16 d u
NFYA 0.65 -2.9 6.03 -2.84 -5.18 u d
NR2F1 -0.41 0.11 0.19 -0.29 1.23 u
Pbx 2.6 -0.13 -1.25 0.46 -0.83 u
RORA_1 3.92 -0.85 -1.68 0.09 -1.66 u d
RORA_2 0.03 2.17 -0.91 -0.46 -0.95 u d
Spz1 -0.3 0.62 -0.71 -0.87 -0.6 d u
SRY 0.67 -1.86 -0.53 0.01 -1.06 d u
TAL1-TCF3 0.48 1.04 -2.7 0.96 1.18 u d
TBP -0.88 -0.55 3.65 -3.04 -1.23 d u
Accessory Table 5Orthologs predicted with the OPTIC pipeline
Orphaned genes have no ortholog predicted in any of the other species. These oftenrepresent rapidly evolving genes or those in large families whole phylogeny may not havebeen inferred accurately.
Species Genes Transcripts Genes with orthologs Orphaned genes
H. sapiens 20,907 46,259 18,485 88% 2,422
M. musculus 22,848 40,052 19,067 83% 3,781
C. familiaris 19,292 25,546 17,436 90% 1,856
M. domestica 19,458 32,544 17,025 87% 2,433
O. anatinus 17,936 26,821 14,879 83% 3,057
G. gallus 16,723 22,181 14,465 86% 2,258
T. guttata 17,475 18,191 15,820 91% 1,655
T. nigroviridis 19,581 23,097 15,371 78% 4,210
Warren et al. Page 20
Nature. Author manuscript; available in PMC 2011 October 5.
NIH
-PA Author Manuscript
NIH
-PA Author Manuscript
NIH
-PA Author Manuscript

Accessory Table 6Strict 1:1 orthologs across eight species
Each set contains exactly one gene of each species.
Species (1:1)n ortholog sets Species (1:1)n ortholog sets
Human 20,907 100% Zebrafinch 17,475 100%
+Mouse 15,272 73% +Chicken 10,868 62%
+Dog 14,229 68% +Platypus 8,024 46%
+Opossum 12,411 59% +Opossum 7,238 41%
+Platypus 9,508 45% +Dog 6,850 39%
+Chicken 7,884 38% +Mouse 6,615 38%
+Zebrafinch 5,262 25% +Human 6,474 37%
+Tetraodon 4,344 21% +Tetraodon 4,344 25%
Accessory Table 7Location of novel transcript models with respect toENSEMBL gene models
Associated transcript models are within 1kb of an ENSEMBL exon, while intergenicsequences are more than 1kb distant from the closest ENSEMBL exon. Note that thenumbers do not sum to 100% as some transcript models contain both intronic and intergenic
Set total Intronic Associated Intergenic
array 8,409 915 11% 2,275 27% 5,019 60%
chicken 24,249 7,844 32% 1,970 8% 14,020 58%
estima 13,036 1,778 14% 3,230 25% 7,651 59%
Embryo 110,634 28,349 26% 13,324 12% 68,464 62%
Liver 176,210 49,068 28% 8,971 5% 117,604 67%
Muscle 128,814 34,783 27% 6,704 5% 86,892 67%
Skin 107,841 26,999 25% 11,035 10% 69,348 64%
Spleen 108,492 28,411 26% 9,922 9% 69,673 64%
Testes 63,418 12,223 19% 10,486 17% 40,307 64%
Accessory Table 8
Annotation of transcribed loci (TL). Based on the overlap with ENSEMBL exons TL areannotated first into “known”, “novel”, and “ambiguous” sets. This first level annotation isfollowed by a second level annotation. Known TL are annotated as protein coding (“pc”),pseudogene (“pseudo”), non-protein coding (“npc”) or UTR (“utr”) depending on the kindor part of an ENSEMBL gene with which they overlap. Novel TL are classified by theirlocation as gene-associated (“assoc”), “intronic” or “intergenic” TL. The category “assoc”contains TL that extend at least partially within 1kb of either terminal exon of anENSEMBL gene.
set total known novel ambiguous pc pseudo npc utr intronic associated intergenic
all 15009 3301 8409 3299 3253 5 3 40 915 2275 5019
Warren et al. Page 21
Nature. Author manuscript; available in PMC 2011 October 5.
NIH
-PA Author Manuscript
NIH
-PA Author Manuscript
NIH
-PA Author Manuscript

set total known novel ambiguous pc pseudo npc utr intronic associated intergenic
unchanged 12248 2565 7060 2623 2525 4 3 33 741 1902 4258
FastDown 435 34 343 58 34 0 0 0 90 46 194
FastUp 125 44 34 47 42 0 0 2 1 16 15
SlowDown 1112 371 442 299 367 1 0 3 70 120 239
SlowUp 1217 318 630 269 314 0 0 4 36 205 372
Accessory Table 9
Novel TL are statistically significantly depleted in intronic sequences. The only exception isthe set FastDown.
set depletion P-Value
Fastdown 8.00% 0.1300
FastUp 82.00% 0.0001
SlowDown 42.00% 0.0010
SlowUp 79.00% 0.0001
unchanged 64.00% 0.0001
References1. Zann, RA. The Zebra Finch: A Synthesis of Field and Laboratory Studies. Oxford Univ, Press;
1996.2. Clayton DF, Balakrishnan CN, London SE. Integrating genomes, brain and behavior in the study of
songbirds. Curr Biol. 2009; 19:R865–R873. [PubMed: 19788884]3. Nottebohm, F. Hope For a New Neurology. Nottebohm, F., editor. New York Academy of Science;
1985.4. Doupe AJ, Kuhl PK. Birdsong and human speech: common themes and mechanisms. Annu Rev
Neurosci. 1999; 22:567–631. [PubMed: 10202549]5. Jarvis ED. Learned birdsong and the neurobiology of human language. Ann NY Acad Sci. 2004;
1016:749–777. [PubMed: 15313804]6. Hillier LW, et al. Sequence and comparative analysis of the chicken genome provide unique
perspectives on vertebrate evolution. Nature. 2004; 432:695–716. [PubMed: 15592404]7. Hackett SJ, et al. A phylogenomic study of birds reveals their evolutionary history. Science. 2008;
320:1763–1768. [PubMed: 18583609]8. Zeigler, HP.; Marler, P. Behavioral Neurobiology of Bird Song. Vol. 1016. New York Academy of
Sciences; 2004.9. Hahnloser RH, Kozhevnikov AA, Fee MS. An ultra-sparse code underlies the generation of neural
sequences in a songbird. Nature. 2002; 419:65–70. [PubMed: 12214232]10. Mooney R. Neural mechanisms for learned birdsong. Learn Mem. 2009; 16:655–669. [PubMed:
19850665]11. Konishi M, Akutagawa E. Neuronal growth, atrophy and death in a sexually dimorphic song
nucleus in the zebra finch brain. Nature. 1985; 315:145–147. [PubMed: 3990816]12. Goldman SA, Nottebohm F. Neuronal production, migration, and differentiation in a vocal control
nucleus of the adult female canary brain. Proc Natl Acad Sci USA. 1983; 80:2390–2394.[PubMed: 6572982]
13. Nottebohm F. The road we travelled: discovery, choreography, and significance of brainreplaceable neurons. Ann NY Acad Sci. 2004; 1016:628–658. [PubMed: 15313798]
Warren et al. Page 22
Nature. Author manuscript; available in PMC 2011 October 5.
NIH
-PA Author Manuscript
NIH
-PA Author Manuscript
NIH
-PA Author Manuscript

14. London SE, Remage-Healey L, Schlinger BA. Neurosteroid production in the songbird brain: A re-evaluation of core principles. Front Neuroendocrinol. 2009; 30:302–314. [PubMed: 19442685]
15. Mello CV, Vicario DS, Clayton DF. Song presentation induces gene expression in the songbirdforebrain. Proc Natl Acad Sci USA. 1992; 89:6818–6822. [PubMed: 1495970]
16. Dong S, Clayton DF. Habituation in songbirds. Neurobiol Learn Mem. 2009; 92:183–188.[PubMed: 18845267]
17. Woolley SC, Doupe AJ. Social context-induced song variation affects female behavior and geneexpression. PLoS Biol. 2008; 6:e62. [PubMed: 18351801]
18. Jarvis ED, Scharff C, Grossman MR, Ramos JA, Nottebohm F. For whom the bird sings: context-dependent gene expression. Neuron. 1998; 21:775–788. [PubMed: 9808464]
19. Clayton DF. The genomic action potential. Neurobiol Learn Mem. 2000; 74:185–216. [PubMed:11031127]
20. Warren WC, et al. Genome analysis of the platypus reveals unique signatures of evolution. Nature.2008; 453:175–183. [PubMed: 18464734]
21. Stapley J, Birkhead TR, Burke T, Slate J. A linkage map of the zebra finch Taeniopygia guttataprovides new insights into avian genome evolution. Genetics. 2008; 179:651–667. [PubMed:18493078]
22. Itoh Y, et al. Dosage compensation is less effective in birds than in mammals. J Biol. 2007; 6:2.[PubMed: 17352797]
23. Ellegren H, et al. Faced with inequality: chicken do not have a general dosage compensation ofsex-linked genes. BMC Biol. 2007; 5:40. [PubMed: 17883843]
24. Teranishi M, et al. Transcripts of the MHM region on the chicken Z chromosome accumulate asnon-coding RNA in the nucleus of female cells adjacent to the DMRT1 locus. Chromosome Res.2001; 9:147–165. [PubMed: 11321370]
25. Arnold AP, Itoh Y, Melamed E. A bird's-eye view of sex chromosome dosage compensation. AnnuRev Genomics Hum Genet. 2008; 9:109–127. [PubMed: 18489256]
26. Lovell PV, Clayton DF, Replogle KL, Mello CV. Birdsong “transcriptomics”: neurochemicalspecializations of the oscine song system. PLoS One. 2008; 3:e3440. [PubMed: 18941504]
27. Dong S, et al. Discrete molecular states in the brain accompany changing responses to a vocalsignal. Proc Natl Acad Sci USA. 2009; 106:11364–11369. [PubMed: 19541599]
28. Makeyev EV, Maniatis T. Multilevel regulation of gene expression by microRNAs. Science. 2008;319:1789–1790. [PubMed: 18369137]
29. Wada K, et al. A molecular neuroethological approach for identifying and characterizing a cascadeof behaviorally regulated genes. Proc Natl Acad Sci USA. 2006; 103:15212–15217. [PubMed:17018643]
30. Wada K, Sakaguchi H, Jarvis ED, Hagiwara M. Differential expression of glutamate receptors inavian neural pathways for learned vocalization. J Comp Neurol. 2004; 476:44–64. [PubMed:15236466]
31. Cooper EC, Jan LY. Ion channel genes and human neurological disease: recent progress, prospects,and challenges. Proc Natl Acad Sci USA. 1999; 96:4759–4766. [PubMed: 10220366]
32. Mattick JS. RNA regulation: a new genetics? Nature Rev Genet. 2004; 5:316–323. [PubMed:15131654]
33. Agate RJ, Scott BB, Haripal B, Lois C, Nottebohm F. Transgenic songbirds offer an opportunity todevelop a genetic model for vocal learning. Proc Natl Acad Sci USA. 2009; 106:17963–17967.[PubMed: 19815496]
34. Replogle K, et al. The Songbird Neurogenomics (SoNG) Initiative: community-based tools andstrategies for study of brain gene function and evolution. BMC Genomics. 2008; 9:131. [PubMed:18366674]
35. Ovcharenko I, Loots GG, Hardison RC, Miller W, Stubbs L. zPicture: dynamic alignment andvisualization tool for analyzing conservation profiles. Genome Res. 2004; 14:472–477. [PubMed:14993211]
Warren et al. Page 23
Nature. Author manuscript; available in PMC 2011 October 5.
NIH
-PA Author Manuscript
NIH
-PA Author Manuscript
NIH
-PA Author Manuscript

Figure 1. Divergent patterns of dosage compensation in birdsa, b, The male to female (M/F) ratio of gene expression, measured by species-specificmicroarrays, is plotted along the Z chromosome of chicken (a) and zebra finch (b). Eachpoint represents the average M/F ratio of a sliding window of 30 genes plotted at the mediangene position and stepping one gene at a time along the chromosome. Note region of lowerM/F ratios in chicken surrounding the locus of the MHM (male hypermethylated) ncRNA.In zebra finch, genes adjacent to the comparable MHM position (asterisk) show no specialcluster of dosage compensation (low M/F ratios), and no MHM sequence appears in thegenome assembly. bp, base pairs.
Warren et al. Page 24
Nature. Author manuscript; available in PMC 2011 October 5.
NIH
-PA Author Manuscript
NIH
-PA Author Manuscript
NIH
-PA Author Manuscript

Figure 2. Enriched expression of a CR1-like element in the zebra finch song systema, Genomic alignment of an RNA containing a CR1-like retrotransposon element (in blue)and adjacent ESTs, with respective GenBank accession numbers. b–d, DV949717 isexpressed in the brain of adult males with enrichment in song nuclei HVC (letter-basedname) and LMAN (lateral magnocellular nucleus of the anterior nidopallium), as revealedby in situ hybridization. The diagram in b indicates areas shown in photomicrographs in cand d. Cb, cerebellum; Hp, hippocampus; Meso, mesopallium; Nido, nidopallium; Shelf,nidopallial shelf region; St, striatum. Scale bars, 0.1 mm.
Warren et al. Page 25
Nature. Author manuscript; available in PMC 2011 October 5.
NIH
-PA Author Manuscript
NIH
-PA Author Manuscript
NIH
-PA Author Manuscript

Figure 3. miR-124 in the auditory forebrain is suppressed by exposure to new songTaqMan assays comparing samples from the auditory lobule of adult male zebra finches insilence (open bars) or 30 min after onset of new song playback (filled bars). a, Comparisonof two sample pools, each containing auditory forebrains of 20 birds. b, Comparisons ofpaired individual subjects, n = 6 pairs (P = 0.03, Wilcoxon paired test). Error bars denotes.e.m. of triplicate TaqMan assays. Parallel TaqMan analyses of the small RNA RNU6Bwere performed with all samples and showed no significant effect of treatment for thiscontrol RNA.
Warren et al. Page 26
Nature. Author manuscript; available in PMC 2011 October 5.
NIH
-PA Author Manuscript
NIH
-PA Author Manuscript
NIH
-PA Author Manuscript

Figure 4. Conserved NR4A3 3′ UTR is a potential region for microRNA integrationa, zPicture alignment of 3′ portion of zebra finch to human gene35 showing UTR region ofhigh similarity beyond the coding exons. Dark red bars, regions with the highest sequenceconservation; black rectangles, position of song-regulated ESTs27 within the conserved UTRbut outside the Ensembl gene model (ENSTGUG00000008853). b, Alignment of zebrafinch and human 3′ UTR sequences showing the per cent sequence identity for eachevolutionarily conserved region. Dots indicate positions of conserved new (‘n-’) orestablished (‘miR-’) microRNA-binding sites in both species within these regions.
Warren et al. Page 27
Nature. Author manuscript; available in PMC 2011 October 5.
NIH
-PA Author Manuscript
NIH
-PA Author Manuscript
NIH
-PA Author Manuscript

Figure 5. Transcriptional control network in area X engaged by singinga, Clustered (1–20) temporal expression profiles of 807 genes (rows) that change with timeand amount of singing; red, increases; blue, decreases; white, no change relative to average0-h control. Grey/coloured bars on left, clusters with enrichment of specific promoter motifs(P < 0.01). b, Enriched transcription-factor-binding motifs (abbreviations) found in thepromoters of late response genes, clusters 9–12 (coloured as in a); bold, binding sites forknown activity-dependent transcription factors (for example, CREBP1) or transcriptionfactor complexes (for example, CREBP1–CJUN); black, sites for post-translationallyactivated transcription factors; brown, sites for transcriptionally activated transcriptionfactors including by singing (for example, in cluster 1). Graph shows time course of averageexpression of all genes in the late response clusters, normalized to average 0 h for thatcluster. Also plotted is the average expression of the C-FOS transcription factor mRNA,which binds to the AP-1 site over-represented in the promoters of cluster 10 genes.
Warren et al. Page 28
Nature. Author manuscript; available in PMC 2011 October 5.
NIH
-PA Author Manuscript
NIH
-PA Author Manuscript
NIH
-PA Author Manuscript

NIH
-PA Author Manuscript
NIH
-PA Author Manuscript
NIH
-PA Author Manuscript
Warren et al. Page 29
Tabl
e 1
Stru
ctur
al fe
atur
es o
f the
song
res
pons
ive
geno
me
All
gene
s ana
lyse
dN
ovel
up
Nov
el d
own
Hab
ituat
e up
Hab
ituat
e do
wn
All
ESTs
17,8
7714
546
11,
531
1,77
4
Map
ped
loci
15,0
0912
543
51,
217
1,11
2
Ense
mbl
gen
es8,
438
136
301
1,13
81,
136
Mob
ile e
lem
ent c
onte
nt*
N
umbe
r with
mob
ile e
lem
ents
688
240
3238
Pe
rcen
tage
mob
ile e
lem
ents
41
92
2
P-
valu
e2
0.18
1.4×
10−
50.
005
0.00
4
Cod
ing
and
non-
codi
ng c
onte
nt†
m
RN
A tr
ansc
ripts
(% (P
-val
ue))
5986
(0.0
5)32
(1 ×
10−
10)
65 (0
.05)
71 (0
.001
)
ES
T lo
ci m
appe
d to
intro
ns (%
(P-v
alue
))6
1 (0
.05)
21 (1
× 1
0−10
)3
(0.0
01)
6
In
terg
enic
loci
(% (P
-val
ue))
3312
(0.0
01)
45 (0
.05)
3121
(0.0
01)
Prot
ein-
codi
ng g
ene
terr
itorie
s‡
M
ean
gene
leng
th (k
b)30
.421
.778
.834
.831
.2
In
terg
enic
leng
th (k
b)57
.442
.310
8.0
64.9
55.3
Te
rrito
ry si
ze (k
b)87
.864
.118
6.8
99.7
86.4
P-
valu
e–
3.9
× 10
−3
1.7
× 10
−28
9.3
× 10
−10
1.4
× 10
−4
A m
icro
arra
y m
ade
from
non
-red
unda
nt b
rain
-der
ived
EST
s34
was
use
d to
def
ine
four
subg
roup
s of R
NA
s tha
t sho
w d
iffer
ent r
espo
nses
in a
udito
ry fo
rebr
ain
to so
ng e
xpos
ures
(nov
el u
p an
d do
wn,
habi
tuat
ed u
p an
d do
wn)
27. T
hese
EST
s wer
e m
appe
d to
gen
ome
posi
tions
as d
escr
ibed
(Sup
plem
enta
ry N
ote
3).
* All
ESTs
wer
e an
alys
ed fo
r mob
ile e
lem
ent c
onte
nt u
sing
Rep
eatM
aske
r (Su
pple
men
tary
Not
e 2)
. P-v
alue
is fo
r the
com
paris
on to
all
gene
s (Fi
sher
's ex
act t
est).
† All
ESTs
that
cou
ld b
e m
appe
d un
ique
ly to
the
geno
me
asse
mbl
y w
ere
asse
ssed
for o
verla
p w
ith E
nsem
bl a
nnot
atio
ns o
f mR
NA
tran
scrip
ts (p
rote
in c
odin
g an
d U
TRs)
, int
roni
c re
gion
s, or
inte
rgen
icre
gion
s. P-
valu
e is
for c
ompa
rison
to a
ll m
appe
d lo
ci (F
ishe
r's e
xact
test
). R
esul
ts a
re th
e pe
rcen
tage
with
P v
alue
s in
pare
nthe
ses w
here
show
n.
‡ The
size
of e
ach
uniq
ue p
rote
in-c
odin
g ge
ne te
rrito
ry w
as d
eter
min
ed b
y co
mbi
ning
the
leng
th o
f the
Ens
embl
gen
e m
odel
with
its i
nter
geni
c sp
acin
g. T
he P
-val
ue is
for t
he c
ompa
rison
to a
ll ge
nes,
usin
g a
two-
taile
d W
ilcox
on ra
nk su
m te
st.
Nature. Author manuscript; available in PMC 2011 October 5.

NIH
-PA Author Manuscript
NIH
-PA Author Manuscript
NIH
-PA Author Manuscript
Warren et al. Page 30
Table 2Song-suppressed ion channel genes under positive selection
Gene Description Branch Δω Sites PS/total
CACNA1B Voltage-dependent N-type calcium channel subunit α-1B 0.016 9/2,484
CACNA1G Voltage-dependent T-type calcium channel subunit α-1G 0.044* 2/2,468
GRIA2 Glutamate receptor 2 precursor (GluR-2, AMPA 2) 0.231* 17/948
GRIA3 Glutamate receptor 3 precursor (GluR-3, AMPA 3) −0.010 4/894
KCNC2 Potassium voltage-gated channel subfamily C member 2 (Kv3.2) 0.315* 32/654
TRPV1 Transient receptor potential cation channel subfamily V member 1 −0.067 3/876
These six genes are suppressed by song exposure (FDR = 0.05)27 and they show evidence of positive selection in the zebra finch relative to
chicken (P < 10−3, Supplementary Note 3). Branch Δω denotes the difference in the non-synonymous to synonymous substitution ratio (dN/dS)between zebra finch and other birds (chicken and the ancestral branch leading to chicken and zebra finch). Positive values indicate that the gene israpidly evolving, whereas negative values indicate genes evolving more slowly. Sites PS/total denotes the number of individual sites with empiricalBayes posterior probability greater than 0.95 of ω > 1 (positive selection) in the finch versus the total number of residues in the protein, frombranch-site model analysis implemented in PAML. Note that genes can show overall slower evolution in the branch model yet show evidence ofsignificant positive selection at specific sites.
*Gene-wide differences that were significant (P < 0.05) by a likelihood ratio test.
Nature. Author manuscript; available in PMC 2011 October 5.


![arXiv:1904.03303v1 [cs.CV] 5 Apr 2019 · Francesco Pittaluga 1Sanjeev J. Koppal Sing Bing Kang2 Sudipta N. Sinha2 1 University of Florida 2 Microsoft Research (a) SfM point cloud](https://img.pdfslide.us/doc/110x75/600beda50e7f4417d263fddb/arxiv190403303v1-cscv-5-apr-2019-francesco-pittaluga-1sanjeev-j-koppal-sing.jpg)


![Morita theory for group corings - Semantic Scholar · The first Morita context was constructed by Chase and Sweedler [9], which was generalized by Doi [12]. Morita contexts similar](https://img.pdfslide.us/doc/110x75/6055620657f9b55ddf7d34b2/morita-theory-for-group-corings-semantic-scholar-the-irst-morita-context-was.jpg)


![The Egyptian Mathematical Society The …wisbauer/Cairo-Lec.pdffields are well-studied in the literature, e.g. in the texts of Sweedler [9], Abe [1], Montgomery [8], and Dˇascˇalescu,](https://img.pdfslide.us/doc/110x75/5f22b0611f4cdd444f62a44a/the-egyptian-mathematical-society-the-wisbauercairo-lecpdf-ields-are-well-studied.jpg)

![arXiv:0811.0074v2 [math.LO] 13 Mar 2009 · arXiv:0811.0074v2 [math.LO] 13 Mar 2009 Logicaltoolsforhandlingchangeinagent-basedsystems DovMGabbay1 King’sCollege,London2 KarlSchlechta3](https://img.pdfslide.us/doc/110x75/5f13d0a39dd7b86cce227f02/arxiv08110074v2-mathlo-13-mar-2009-arxiv08110074v2-mathlo-13-mar-2009.jpg)