Embed Size (px)
Citation preview

Edinburgh Research Explorer
Which is the best phenotypic trait for use in a targeted selectivetreatment strategy for growing lambs in temperate climates?
Citation for published version:Laurenson, YC, Kahn, LP, Bishop, SC & Kyriazakis, I 2016, 'Which is the best phenotypic trait for use in atargeted selective treatment strategy for growing lambs in temperate climates?' Veterinary Parasitology, vol226, pp. 174-188. DOI: 10.1016/j.vetpar.2016.07.010
Digital Object Identifier (DOI):10.1016/j.vetpar.2016.07.010
Link:Link to publication record in Edinburgh Research Explorer
Document Version:Peer reviewed version
Published In:Veterinary Parasitology
General rightsCopyright for the publications made accessible via the Edinburgh Research Explorer is retained by the author(s)and / or other copyright owners and it is a condition of accessing these publications that users recognise andabide by the legal requirements associated with these rights.
Take down policyThe University of Edinburgh has made every reasonable effort to ensure that Edinburgh Research Explorercontent complies with UK legislation. If you believe that the public display of this file breaches copyright pleasecontact [email protected] providing details, and we will remove access to the work immediately andinvestigate your claim.
Download date: 08. Jul. 2018
Accepted Manuscript
Title: Which is the best phenotypic trait for use in a targetedselective treatment strategy for growing lambs in temperateclimates?
Author: Yan C.S.M. Laurenson Lewis P. Kahn Stephen C.Bishop Ilias Kyriazakis
PII: S0304-4017(16)30269-2DOI: http://dx.doi.org/doi:10.1016/j.vetpar.2016.07.010Reference: VETPAR 8083
To appear in: Veterinary Parasitology
Received date: 24-2-2016Revised date: 2-7-2016Accepted date: 8-7-2016
Please cite this article as: Laurenson, Yan C.S.M., Kahn, Lewis P., Bishop, StephenC., Kyriazakis, Ilias, Which is the best phenotypic trait for use in a targeted selectivetreatment strategy for growing lambs in temperate climates?.Veterinary Parasitologyhttp://dx.doi.org/10.1016/j.vetpar.2016.07.010
This is a PDF file of an unedited manuscript that has been accepted for publication.As a service to our customers we are providing this early version of the manuscript.The manuscript will undergo copyediting, typesetting, and review of the resulting proofbefore it is published in its final form. Please note that during the production processerrors may be discovered which could affect the content, and all legal disclaimers thatapply to the journal pertain.

1
Which is the best phenotypic trait for use in a targeted selective treatment strategy for
growing lambs in temperate climates?
Yan C.S.M. Laurensona*, Lewis P. Kahna, Stephen C. Bishopb, Ilias Kyriazakisc
a Animal Science, School of Environmental and Rural Science, University of New England,
Armidale, New South Wales 2351, Australia
b The Roslin Institute and Royal (Dick) School of Veterinary Studies, University of
Edinburgh, Midlothian EH25 9RG, UK
c School of Agriculture, Food and Rural Development, Newcastle University, Newcastle
upon Tyne NE1 7RU, UK
* Corresponding author. Tel.: +61 2 6773 5156; Fax.: +61 2 6773 3922; E-mail:

2
Graphical Abstract

3
Highlights
Simulated evaluation of phenotypic traits determining targeted selective treatment
Investigated the impact of nematode challenge and day of anthelmintic treatment
Best criteria was live weight (productive benefit per increase in drug resistance)
Identified the long-term productive benefit of targeted selective treatment
Abstract
Targeted selective treatment (TST) requires the ability to identify the animals for
which anthelmintic treatment will result in the greatest benefit to the entire flock. Various
phenotypic traits have previously been suggested as determinant criteria for TST; however,
the weight gain benefit and impact on anthelmintic efficacy for each determinant criterion is
expected to be dependent upon the level of nematode challenge and the timing of
anthelmintic treatment. A mathematical model was used to simulate a population of 10,000
parasitologically naïve Scottish Blackface lambs (with heritable variation in host-parasite
interactions) grazing on medium-quality pasture (grazing density = 30 lambs/ha, crude
protein = 140g/kg DM, metabolisable energy = 10MJ/kg DM) with an initial larval
contamination of 1000, 3000 or 5000 Teladorsagia circumcincta L3/kg DM. Anthelmintic
drenches were administered to 0, 50 or 100% of the population on a single occasion. The day
of anthelmintic treatment was independently modelled for every day within the 121 day
simulation. Where TST scenarios were simulated (50% treated), lambs were either chosen by

4
random selection or according to highest faecal egg count (FEC, eggs/g DM faeces), lowest
live weight (LW, kg) or lowest growth rate (kg/day). Average lamb empty body weight (kg)
and the resistance (R) allele frequency amongst the parasite population on pasture were
recorded at slaughter (day 121) for each scenario. Average weight gain benefit and increase
in R allele frequency for each determinant criterion, level of initial larval contamination and
day of anthelmintic treatment were calculated by comparison to a non-treated population.
Determinant criteria were evaluated according to average weight gain benefit divided by
increase in R allele frequency to determine the benefit per R. Whilst positive phenotypic
correlations were predicted between worm burden and FEC; using LW as the determinant
criterion provided the greatest benefit per R for all levels of initial larval contamination and
day of anthelmintic treatment. Hence, LW was identified as the best determinant criterion for
use in a TST regime. This study supports the use of TST strategies as benefit per R
predictions for all determinant criteria were greater than those predicted for the 100%
treatment group, representing an increased long-term productive benefit resulting from the
maintenance of anthelmintic efficacy. Whilst not included in this study, the model could be
extended to consider other parasite species and host breed parameters, variation in climatic
influences on larval availability and grass growth, repeated anthelmintic treatments and
variable proportional flock treatments.
Keywords: Sheep, Nematodes, Teladorsagia circumcincta, Modelling, Anthelmintic
resistance, Targeted selective treatment.

5
1. Introduction
Reduced drug efficacy due to the emergence of anthelmintic resistance (Kaplan, 2004;
Wolstenholme et al., 2004; Jabbar et al., 2006; Papadopoulos et al., 2012) threatens the
sustainability of livestock systems (van Wyk et al., 1997; Waller, 2006a; Besier, 2007;
Papadopoulos, 2008), prompting the proposition of a variety of non-chemotherapeutic control
options (Besier and Love, 2003; Waller, 2003; Sayers and Sweeney, 2005; Jackson and
Miller, 2006; Stear et al., 2007; Torres-Acosta and Hoste, 2008). Unfortunately, these do not
provide sufficiently effective parasite control without chemotherapeutic support (van Wyk et
al., 2006). Thus, anthelmintics remain an indispensable component of nematode control
programs, further supported by their low cost and ease of use (Kenyon and Jackson, 2012).
As such, integrated parasite control programs must deliver efficacious control whilst
minimising negative effects on drug efficacy in a manner that meets the risk profile of sheep
producers.
Anthelmintic treatments are directed towards the infra-population of nematodes
(parasitic stages within the host) thereby leaving the supra-population (pre-parasitic stages on
pasture) in refugia (unexposed to anthelmintics) (van Wyk, 2001; Soulsby, 2007; Besier,
2012), providing a reservoir of more susceptible genotypes which dilute the progeny of
resistant nematodes surviving anthelmintic treatment (van Wyk et al., 2006). Anthelmintic
treatment is known to select for resistance in proportion to the nematode population in
refugia (Martin et al., 1981; Michel, 1985), and consequently practices such as administering
anthelmintics prior to a move to a low worm-risk pasture should be carefully managed
(Martin et al., 1985; Waghorn et al., 2009). Whilst grazing management (Waller, 2006b) and
the host immune response (Laurenson et al., 2012a) affect nematode epidemiology,
environmental conditions experienced by the supra-population are the predominant factor
impacting upon the nematode population in refugia (Stromberg, 1997; O’Connor et al., 2006;

6
van Dijk et al., 2010; Morgan and van Dijk, 2012; Rose et al., 2015). Consequent fluctuations
in the level of pasture contamination have led to the proposal of targeting whole flock
treatments (TT, targeted treatment) at times when the supra-population provides a large
refugia pool (Kenyon et al., 2009; Kenyon and Jackson, 2012), coinciding with periods in
which the hosts will be exposed to a high level of infective larval challenge.
Further, the infra-population is known to be over-dispersed, such that the majority of
the parasitic burden is aggregated within a small percentage of the host population (Barger,
1985; Sréter et al., 1994; Gaba et al., 2005). In practical terms, anthelmintic treatment can
therefore be directed towards the individuals within a flock with the heaviest parasitic burden
(Gallidis et al., 2009; Stafford et al., 2009; Gaba et al., 2010). Targeted selective treatment
(TST) can thereby reduce the number of anthelmintic treatments administered to a flock and
increase the nematode population in refugia by leaving a proportion of the infra-population
untreated (van Wyk et al., 2006; Kenyon et al., 2009). As such, TST strategies require the
ability to identify individuals for anthelmintic treatment. Genetic and genomic approaches
have previously been proposed; however, in the absence of reliable genetic markers across
populations, phenotypic traits were found to be preferable to estimated breeding values as the
larval challenge experienced by an individual may be dis-similar to its family members due to
large environmental effects (Laurenson et al., 2013a). A variety of clinical pathophysiological
indicators have also been proposed and implemented; including various diarrhoea scores
(Larsen et al., 1994; Larsen and Anderson, 2000; Cabaret et al., 2006; Broughan and Wall,
2007; Ouzir et al., 2011; Bentounsi et al., 2012), body condition score (Russel, 1984; Besier
et al., 2010; Cornelius et al., 2014), anaemia score/FAMACHA© (Malan et al., 2001; Vatta et
al., 2001; van Wyk and Bath, 2002; Kaplan et al., 2004; Molento et al., 2009; Ouzir et al.,
2011; Bentounsi et al., 2012), and combinational indexes such as The Five Point Check©
(Bath and van Wyk, 2009). However, these clinical indicators rely on visual assessment and

7
are therefore prone to subjective errors (Greer et al., 2009). Additionally, anaemia is
indicative of haematophagous nematodes (i.e. H. contortus) or liver fluke infections, and thus
not suitable for use as an indicator of the T. circumcincta and Trichostrongylus spp.
infections predominant in temperate climates (van Wyk et al., 2006). Further, it may be
considered preferable to treat animals prior to overt clinical signs becoming apparent.
Subclinical indicators of gastrointestinal parasitism can identify between-animal
variation in host resistance (suppression of nematode challenges via an immune response;
Bishop and Morris, 2007) and resilience (ability to withstand the pathogenic effects of
nematode challenge; Bisset and Morris, 1996). Faecal egg count (FEC) has previously been
used as a measure of host resistance (Woolaston and Baker, 1996; Morris et al., 1997;
Kemper et al., 2010). TST based on treating animals with the highest FEC thereby reduces
egg deposition and consequently the larval challenge experienced by the grazing flock
(Kenyon et al., 2009; Kenyon and Jackson, 2012) and the associated impacts on performance
(Coop et al., 1982, 1985; Holmes, 1987; Fox, 1997; Stear et al., 2003). Hence, FEC has
previously been implemented as a determinant criterion for TST (Cringoli et al., 2009;
Gallidis et al., 2009). In contrast, measures of host resilience provide a more direct welfare
approach as only the least resilient animals are treated (Cabaret et al., 2009; Berrag et al.,
2009; Kenyon et al., 2009; Kenyon and Jackson, 2012). Indicators of host resilience
previously implemented as determinant criteria for TST include live weight (Leathwick et al.,
2006a,b), weight gain (Stafford et al., 2009; Gaba et al., 2010; Bentounsi et al., 2012),
production efficiency/HappyFactorTM (Greer et al., 2009; Busin et al., 2013, 2014; Kenyon et
al., 2013), and milk production (Hoste et al., 2002; Cringoli et al., 2009; Gallidis et al., 2009;
Gaba et al., 2010).
Evaluation of these determinant criteria has predominantly focussed on the productive
impact of implementing TST regimes (e.g. Busin et al., 2014). Few studies have explored the

8
impact upon anthelmintic efficacy (Leathwick et al., 2006b; Kenyon et al., 2013), due to the
difficulty in measuring changes in anthelmintic resistance over short time periods (Gilleard,
2006; Besier, 2012). As such, computer simulation modelling has been suggested as a method
of developing appropriate refugia strategies (Besier, 2012; Kenyon and Jackson, 2012),
thereby reducing the necessity for expensive and time-consuming experimental trials.
The aim of this study was to use a mathematical model to compare the subclinical
phenotypic traits proposed as determinant criteria for TST regimes, and investigate the
impact of initial pasture larval contamination (T. circumcincta L3/kg DM) and day of
anthelmintic treatment on sheep performance and the emergence of anthelmintic resistance.
2. Materials and Methods
2.1 Mathematical model
The mathematical model of Laurenson et al. (2013b) describes the impact of host
nutrition, genotype and T. circumcincta gastro-intestinal parasitism on a population of
growing lambs, and includes the impact of anthelmintic treatment on host performance,
nematode epidemiology and the emergence of anthelmintic resistance.
2.1.1 Individual lamb module
A schematic diagram describing the structure of the individual lamb module is
provided in Figure 1. In brief, each lamb attempted to ingest sufficient nutrients to meet
protein and energy requirements for desired growth and maintenance, as defined by its
genotype (Emmans, 1997; Wellock et al., 2004). However, if the nutritional quality of
available herbage was poor then resource intake may be constrained by the maximum gut
capacity (Lewis et al., 2004). Grazing led to the concurrent ingestion of infective larvae (L3)

9
from pasture, modelled as a function of herbage intake and pasture larval contamination
(Laurenson et al., 2012b). Within the host, ingested larvae matured (following a pre-patent
period; Coop et al., 1982), established, produced eggs and died, as determined by rates for
establishment, density-dependent fecundity and mortality (Bishop and Stear, 1997; Louie et
al., 2005). Parasitic burdens within the host were assumed to result in an endogenous protein
loss (Yakoob et al., 1983), modelled as a function of larval challenge and worm mass
(Vagenas et al., 2007a). To counteract this, the host was assumed to invest in an immune
response causing decreased rates of establishment and fecundity, and an increased rate of
nematode mortality. Thus, the host was capable of decreasing parasitic burden and the protein
losses associated with parasitism. The acquisition of immunity was assumed to follow a
sigmoidal pattern (thereby intrinsically accounting for antigen exposure thresholds; González
et al., 2003) as a function of the cumulative daily larval population resident within the host
(Laurenson et al., 2012b). However, components of the host immune response (e.g.
cytokines, gastrin) are associated with inappetence causing a reduction in herbage intake (Fox
et al., 1989; Greer et al., 2005), commonly known as (parasite-induced) anorexia (Kyriazakis,
2014). Reductions in desired herbage intake were modelled as a function of the rate of
acquisition of immunity (Laurenson et al., 2011). The combination of protein losses
associated with parasitic burden and reductions in herbage intake resulted in insufficient
nutrient resources being available to fulfil requirements for maintenance and optimal growth.
Thus, ingested resources, after losses due to parasitism, were assumed to be first allocated to
meet the maintenance requirements and remaining resources allocated to growth and
immunity proportional to requirements (Kahn et al., 2000; Doeschl-Wilson et al., 2008). If
insufficient resources were available to meet maintenance requirements then the lamb
catabolized its protein and lipid reserves. If the requirements from catabolism were greater
than 20% of the current protein reserve (Sykes, 2000; Houdijk et al., 2001) or if lipid reserves

10
fell below 20% of the current protein reserve (the minimum protein to lipid ratio required for
survival; Vagenas et al., 2007a) then the lamb was assumed to die.
Outputs from the individual lamb module were calculated on a daily basis and
included performance and parasitological traits. Performance traits included live weight (LW,
kg), herbage intake (kg DM) and empty body weight (EBW, kg); where EBW was given as
LW minus gut-fill. Parasitological traits included worm burden (WB), total daily egg output,
and faecal egg count (FEC, eggs/g DM); where FEC was given as the total daily egg output
divided by faecal output (undigested dry matter; AFRC, 1993).
2.1.2 Population module
Between-animal variation was added to a variety of genetically controlled input traits
including lamb growth attributes (optimal growth rate and body composition at maturity),
maintenance requirements, and the ability to mount an immune response (rate of acquisition,
as well as initial and final rates for host-controlled establishment, mortality and fecundity)
(Vagenas et al., 2007b; Laurenson et al., 2012b). Initially all traits were assumed to be
normally distributed, and parameters describing lamb growth attributes and maintenance
requirements were assumed to be uncorrelated (Doeschl-Wilson et al., 2008). In contrast, the
acquisition of immunity was assumed to be a function of overlapping effector mechanisms
for establishment, mortality and fecundity (components of Th2 immune response; Jenkins
and Allen, 2010). Thus, the rate-determining parameters involved in the acquisition of
immunity were assumed to be strongly genetically and phenotypically correlated (r = +0.5).
Further, random environmental variation in daily herbage intake was assumed to reflect the
influence of external factors not explicitly accounted for by the model (Doeschl-Wilson et al.,
2008), and were added to achieve a genetic correlation between herbage intake and growth
rate of approximately 0.8 (Cammack et al., 2005).

11
The simulated lamb population was assumed to arise from a founder population of
unrelated sires and dams with a pre-determined mating structure. Each founder animal had a
breeding value (Ai) for each genetically controlled input trait sampled from a N(0, σA2)
distribution, where the genetic variance (σA2 = h2 ∙ σP
2) was determined by inputs for
heritability (h2) and phenotypic variation (σP2). The trait breeding values for each offspring
were constructed as ASire+ADam
2 plus a Mendelian sampling term drawn from a N(0, 0.5σA
2)
distribution (Falconer and Mackay, 1996). A Cholesky decomposition of the variance-
covariance matrix for correlated traits was used to generate covariances between the breeding
values of the animals, as well as their residual components. The phenotypic value (Pi) for
each of the underlying traits was given by:
Pi = μ + Ai + Ei
where μ is the population mean for the trait, Ai is the additive genetic deviation of the ith
individual, and Ei is the corresponding environmental deviation sampled from a N[0, σP2 ∙ (1-
h2)] distribution.
Outputs of the population module included the mean and coefficient of variation for
each of the individual lamb model outputs. Further, genetic and phenotypic correlations
between traits were calculated alongside trait heritabilities (Laurenson et al., 2012b).
2.1.3 Epidemiological module
In accordance with Laurenson et al. (2012b), the grazing pasture was defined by the
area available for grazing (ha) and the initial herbage mass (kg DM/ha). The herbage
available for grazing (kg DM) was updated on a daily basis to take into account herbage
consumption by the lamb population and herbage growth. An initial pasture contamination of
infective larvae (L3/kg DM) was assumed to arise from the egg deposition of a ewe

12
population removed from pasture at lamb weaning. For simplicity, the initial egg
contamination of the pasture was modelled such that the number of L3 developing on pasture
was equal to the number of larvae consumed by the lamb population for an initial period
defined by the time taken for eggs to develop to L3. Following this, L3 only arose from eggs
excreted onto pasture by the lamb population. A constant proportion of eggs were assumed to
develop to L3 following a constant developmental period. Further, L3 were assumed to have a
constant mortality rate. As such, the total L3 population on pasture was updated on a daily
basis to take into account the L3 ingested by the lamb population, the mortality rate of L3, and
new L3 developing from eggs. Lambs were assumed to graze randomly across the pasture,
leading to an equal expected larval intake linked to herbage intake. The larval intake of any
lamb was determined by its herbage intake, the herbage available for grazing and the total
population of L3 on pasture. As such, the parasitic challenge experienced by the lamb
population could be summarized as the concentration of L3 within the herbage available for
grazing (L3/kg DM), and was provided as an output of the epidemiological model.
2.1.4 Anthelmintic resistance module
Anthelmintic resistance was assumed to be conferred by 2 alleles, resistant (R) and
susceptible (S) (Barnes et al., 1995; Leathwick et al., 1995; Learmount et al., 2006), in
agreement with the monogenic mechanism for benzimidazole resistance (Elard and Humbert,
1999). The resistance genotypes of the initial population of infective larvae on pasture were
calculated assuming Hardy-Weinberg equilibrium and an initial R allele frequency of 0.01
(Barnes et al., 1995). All genotypes were assumed to be equally fit (Barrett et al., 1998; Elard
et al., 1998), such that in the absence of anthelmintic drenching the frequency of R remained
the same throughout the simulated grazing season. The allele conferring anthelmintic
resistance (R) was modelled to be recessive (Elard and Humbert, 1999; Silvestre and Cabaret,
2002). Anthelmintic drenching was assumed to reduce the population of L3 and adult

13
nematodes resident within a host by 99% for heterozygous (RS) and homozygous susceptible
genotypes (SS), and 1% for homozygous resistant genotypes (RR). Further, the oral
administration of anthelmintic was assumed to be effective on the day of administration only,
with no residual effects (Borgsteede, 1993). Thus in the first instance, anthelmintic drenching
caused a 99% reduction in parasitic burden and, with the imposition of density-dependent
effects on parasite fecundity, a 96.9% reduction in FEC, similar to the post-treatment
efficacies reported by Sargison et al. (2007). Outputs of the anthelmintic resistance model
included the frequency of R, and the nematode population in refugia (unexposed to
anthelmintic) calculated on a daily basis according to Laurenson et al. (2013b).
2.2 Model parameterization
Whilst host and parasite descriptions within the model could be parameterized to
represent different hosts (e.g. different sheep breeds) as well as nematode species, in this
instance host growth characteristics were parameterized such that trait means and between-
animal variance matched those of Bishop et al. (1996) and Bishop and Stear (1997) for
Scottish Blackface lambs, and parasitological parameters matched those of Coop et al. (1982,
1985) for lambs infected with T. circumcincta.
A total simulated population of 10,000 parasitologically naïve lambs (arising from
250 sires and 5,000 dams) was chosen to ensure that trait means at each time point would be
estimated with precision, avoiding the need for statistical analyses of the outputs. With this
large population size, the expected standard error of each mean value within the simulation is
σ100⁄ , where σ is the trait standard deviation at that time point. Therefore, even with
extremely variable traits such as FEC, which have a coefficient of variation close to 100%,
the standard error of the mean will only be 1% of the mean value.
Lambs were grazed on a medium-quality pasture (crude protein = 140g/kg DM,

14
metabolisable energy = 10MJ/kg DM; AFRC, 1993), at a stocking density of 30 lambs/ha, for
a duration of 4 months from weaning to 6 months of age (slaughter). The pasture was
parameterized such that the initial herbage mass was 1,500 kg DM/ha (Sibbald et al., 2000),
and daily herbage growth was assumed to be 60 kg DM/ha (Grass Check, 2011). The free-
living stages of the nematode parasite life-cycle were parameterized to represent T.
circumcincta such that the developmental time from eggs to L3 was 7 days (Young et al.,
1980), the proportion of eggs developing to L3was 0.11 (Boag et al., 1975), and the mortality
rate of L3 was 0.035 (Gibson and Everett, 1972). As such, this provided a parameterization
representative of late spring and summer for northern England and southern Scotland.
2.3 Simulation procedure and in silico experimental design
Anthelmintic treatment was administered to 0%, 50% or 100% of the population on a
single occasion. For the 50% (TST) treatment group, lambs were either chosen by random
selection (Gaba et al., 2012) or according to highest FEC (eggs/g DM faeces), lowest LW
(kg) or lowest growth rate (GR, kg/day). Random selection was achieved using a pseudo-
random number generator to identify lamb IDs to be drenched. FEC measurements were
assumed to be taken 5 days prior to treatment to allow time for the samples to be processed
and analyzed, and included a 20% random sampling error (Bishop et al., 1996; Stear et al.,
2009). LW was assumed to be measured the day prior to treatment. GR was calculated
assuming that lambs were weighed at the start of the grazing season and on the day prior to
treatment. Production efficiency was not evaluated due to its inherent similarity to GR. Milk
production was also not evaluated as it is only relevant to a very small percentage of the
global sheep industry and because the mathematical model used in this study simulates
growing lambs rather than lactating ewes.
The pasture was initially contaminated with either 1000, 3000 or 5000 T.

15
circumcincta larvae (L3/kg DM). Lambs initially ingested around 1kg DM/day and thus these
contaminations correspond to the trickle challenge levels chosen by Coop et al. (1982) that
led to subclinical infections. Further, this provides a range of nematode challenges and
refugia which can be considered to mimic variation arising from environmental conditions
without accounting for it explicitly. The day of anthelmintic treatment was modelled
independently for every day within the 121 day simulation (i.e. anthelmintic treatments
occurring on day 1, 2, 3…119, 120, 121). As such, this encompasses the timing of any
targeted treatment (TT) strategy. Importantly, all scenarios were modelled such that each
treatment group grazed independently on separate pastures and thereby incorporated the
epidemiological benefit of anthelmintic treatment strategies (Laurenson et al., 2012a).
2.4 Simulation outputs
2.4.1 Distribution of output traits
Genetically controlled input traits exhibiting between-animal variation (growth
attributes, maintenance requirements and immune response) were assumed to be normally
distributed. However, the distribution of WBs and FECs within the host population are
known to be over-dispersed (Barger, 1985; Sréter et al., 1994; Gaba et al., 2005), and is one
of the key characteristics of nematode epidemiology supporting the use of TST strategies.
This phenomenon of over-dispersion has previously been attributed to genetically determined
differences in the immune responsiveness of hosts to parasitic infections (Wakelin, 1984;
Wassom et al., 1986). As such, as immunity is acquired the distribution of FEC and WB
becomes increasingly over-dispersed (Stear et al., 1995; Bishop et al., 1996). Therefore,
given that between-animal genetic variation in immune responses were included within the
model, changes in the distribution of output traits were assumed to occur as a consequence of
the functions underlying the model rather than as a result of direct input (Barnes and Dobson,

16
1990).
To provide a summary of the distribution of WB and FEC predictions, the mean
average and coefficient of variation were recorded on each day of the simulated grazing
season. Consequently, the distribution skew was quantified as:
skew =n
(n − 1)(n − 2)∑ (
xi − x̅
x ̅ ∙ cv)
3n
i=1
where n = 10,000 lambs, xi = trait value for the ith individual, x̅ = trait mean, cv = coefficient
of variation.
For anthelmintic treatments administered on a single occasion, as simulated in this study, the
mean, coefficient of variation and distribution skew for WB and FEC on the day of
anthelmintic treatment will be equal to those predicted for the non-treated (0%) control group
for each level of initial pasture larval contamination. Consequently, only predictions arising
for lamb populations given no anthelmintic treatments (0% treatment groups) are presented
for initial pasture larval contaminations of 1000, 3000 or 5000 T. circumcincta L3/kg DM.
2.4.2 Phenotypic correlations
The aggregation of parasitic burdens within the host population (Barger, 1985; Sréter
et al., 1994; Gaba et al., 2005) supports the strategy of targeting anthelmintic treatments
towards those individuals with the heaviest parasitic burden (Gallidis et al., 2009; Stafford et
al., 2009; Gaba et al., 2010). However, time dependent effects in between animal variation
for resistance (Bishop and Morris, 2007) and resilience (Bisset and Morris, 1996) may impact
upon the ability of phenotypic determinant criteria to identify those individuals with the
heaviest parasitic burden. In the absence of a prior anthelmintic treatment, phenotypic
correlations indicate the ability of each phenotypic determinant criterion to identify those

17
animals with the highest WBs at any given time-point. Hence, predicted phenotypic
correlations between each determinant criterion (FEC, LW and GR) and WB are only
provided for lamb populations given no anthelmintic treatments (0% treatment groups) and
grazed on pasture with an initial pasture larval contamination of 1000, 3000 or 5000 T.
circumcincta L3/kg DM. Whilst WB can be easily quantified within simulation studies,
experimental studies often use FEC as a proxy for WB due to the difficulty (and requirement
for slaughter) of measuring WB. Consequently, predicted phenotypic correlations between
FEC and LW or GR are also provided to allow for comparison with experimental estimates.
2.4.3 Determinant criteria evaluation
The aim of a TST strategy is to maintain effective nematode control whilst
minimizing negative impacts on anthelmintic efficacy by reducing the total number of
anthelmintic treatments administered to a flock. Consequently, for each scenario (% treated,
determinant criterion, initial pasture larval contamination, and day of anthelmintic treatment)
the average EBW (to remove variation in gut-fill and provide a productive output similar to
carcass weight) and the R allele frequency amongst the parasite population on pasture were
recorded at slaughter (day 121). To quantify the productive implications (as the focus of the
sheep industry) of anthelmintic treatment strategies (full flock treatment vs TST), the average
weight gain benefit (AWGB, kg) arising from anthelmintic treatments administered on day t
was calculated by comparison to a non-treated control group, such that:
AWGBt = EBW121AH − EBW121
C
where EBW121AH is the average EBW at slaughter for a group receiving anthelmintic treatments
on day t, and EBW121C is the average EBW at slaughter for a control group receiving no
anthelmintic treatments.

18
Similarly, to quantify the impact of anthelmintic treatment strategies upon anthelmintic
efficacy, the increase in R allele frequency (IRAF) arising from anthelmintic treatments
administered on day t was calculated as:
IRAFt = RAF121AH − RAF121
C
where RAF121AH is the R allele frequency of day 121 for a group receiving anthelmintic
treatments on day t, and RAF121C is the R allele frequency of day 121 for a control group
receiving no anthelmintic treatments.
As previously stated, integrated parasite control programs (including TST) aim to
deliver efficacious control whilst minimizing negative effects on drug efficacy. Hence, in
order to evaluate the use of differing determinant criteria within TST regimes, a single trait
was required to account for the productive benefit of anthelmintic treatments as well as their
impact upon anthelmintic resistance. Consequently, the first derivative of the relationship
between average EBW and R allele frequency on pasture at slaughter was used to generate a
single trait (giving equal weighting to AWGB and IRAF), such that the benefit per R (BPR)
arising from anthelmintic treatments administered on day t was calculated as:
BPRt =AWGBt
IRAFt
As such, for the 50% (TST) treatment groups, the best determinant criterion for any level of
initial pasture larval contamination or day of anthelmintic treatment will be the phenotypic
trait which is predicted to result in the greatest benefit per R.
3. Results
3.1 Distribution of output traits
19
Figure 2 provides the mean, coefficient of variation and distribution skews for WB
and FEC predictions arising from 10,000 lambs given no anthelmintic treatments and grazed
on medium quality pasture with an initial larval contamination of 0, 1000, 3000 or 5000 T.
circumcincta L3/kg DM herbage. The distribution skew for both WB and FEC were predicted
to be initially positive (right-skewed) followed by a rapid decline towards a normal
distribution and then a gradual linear increase as the simulated grazing season progressed.
The gradual increase in skew represents both traits becoming progressively right-skewed over
time. Notably, the FEC distribution skew (Figure 2f) was predicted to be greater than the WB
distribution skew (Figure 2e).
3.2 Phenotypic correlations
Figure 3 provides the time-dependent phenotypic correlations between WB and LW,
GR or FEC; as well as between FEC and LW or GR; in a lamb population given no
anthelmintic treatment for an initial pasture larval contamination of 1000, 3000 or 5000 T.
circumcincta larvae (L3/kg DM). No phenotypic correlations are presented prior to day 14,
corresponding with the pre-patent period required for ingested L3 to mature and establish as
adult nematodes within the host (Coop et al., 1982).
Phenotypic correlations with WB for LW (Figure 3a) and GR (Figure 3b) became
increasingly positive during the initial period of the grazing season. For the phenotypic
correlation between WB and LW the maximum positive correlation (and day of maximum)
was predicted to be +0.59 (32), +0.55 (21), and +0.51 (20) for initial pasture larval
contaminations of 1000, 3000 and 5000 L3/kg DM, respectively. For the phenotypic
correlation between WB and GR the maximum positive correlation (and day of maximum)
was predicted to be +0.60 (32), +0.45 (23), and +0.36 (23) for initial pasture larval
contaminations of 1000, 3000 and 5000 L3/kg DM, respectively; after which, these

20
phenotypic correlations tended towards zero. The day at which the phenotypic correlation
between WB and LW reached zero was predicted to be day 67, 47, and 42 for initial pasture
larval contaminations of 1000, 3000 and 5000 L3/kg DM, respectively. For the phenotypic
correlation between WB and GR the day at which the correlation reached zero was predicted
to be day 65, 41, and 36 for initial pasture larval contaminations of 1000, 3000 and 5000
L3/kg DM, respectively. Subsequently, the phenotypic correlations with WB for both LW and
GR became increasingly negative before plateauing by the end of the simulated grazing
season. The phenotypic correlation between WB and LW on day 121 was predicted to be -
0.38, -0.49, and -0.54 for initial pasture larval contaminations of 1000, 3000 and 5000 L3/kg
DM, respectively. For the phenotypic correlation between WB and GR the predicted
correlation on day 121 was -0.42, -0.52, and -0.57 for initial pasture larval contaminations of
1000, 3000 and 5000 L3/kg DM, respectively.
The predicted phenotypic correlation between WB and FEC (Figure 3c) was +0.15 on
day 14 and increased gradually over the grazing season to +0.76 on day 121 for all levels of
initial pasture larval contamination. Minor differences were predicted between days 14 and
60, where phenotypic correlations for an initial pasture larval contamination of 1000 L3/kg
DM were lower than those for 3000 and 5000 L3/kg DM.
The predicted phenotypic correlations between FEC and LW (Figure 3d) or GR
(Figure 3e) follow expectations derived from the interaction of predicted phenotypic
correlations between WB and LW, GR or FEC. For the phenotypic correlation between FEC
and LW, the maximum predicted correlation (and day of maximum) was +0.14 (42) for an
initial pasture larval contamination of 1000 L3/kg DM, and the minimum predicted
correlation (and day of minimum) was -0.64 (99) for an initial pasture larval contamination of
5000 L3/kg DM. For the phenotypic correlation between FEC and GR, the maximum
predicted correlation (and day of maximum) was +0.23 (42) for an initial pasture larval

21
contamination of 1000 L3/kg DM, and the minimum predicted correlation (and day of
minimum) was -0.66 (91) for an initial pasture larval contamination of 5000 L3/kg DM.
3.3 Determinant criteria evaluation
Figure 4 provides the average weight gain benefit and increase in R allele frequency
derived from differing determinant criteria and day of anthelmintic treatment for an initial
pasture larval contamination of 1000 (Figure 4a), 3000 (Figure 4c) or 5000 (Figure 4e) L3/kg
DM herbage. For all levels of initial pasture larval contamination and treatment groups
(whole flock treatment and differing determinant criterion), anthelmintic treatments occurring
during the first 3 days of the simulated grazing period resulted in negative average weight
gain benefits. Notably, when FEC was used as the determinant criterion to treat 50% of the
grazing flock, predictions were provided for anthelmintic treatments occurring from day 19
onwards due to the assumed 14 day pre-patent period and 5 day laboratory processing delay.
Following these initial negative average weight gain benefit predictions, anthelmintic
treatments occurring after the third simulated day resulted in positive average weight gain
benefits for all levels of initial pasture larval contamination, determinant criteria and the full
flock treatment group (100% treated).
The maximum predicted average weight gain benefit and the day of anthelmintic
treatment at which the maximum occurred for all levels of initial pasture larval contamination
and determinant criteria are provided in Table 1. The maximum average weight gain benefit
increased, and the day of anthelmintic treatment at which the maximum occurred decreased,
with increasing initial pasture larval contamination for all treatment groups (100% treated,
and 50% treated according to random selection, FEC, LW or GR). Whilst predictions of
average weight gain benefit when using FEC as the determinant criterion to treat 50% of the
lamb population were always greater than those predicted when selecting animals at random,

22
average weight gain benefit predictions when using LW or GR as the determinant criterion
were initially less than those predicted for animals selected at random for all levels of initial
pasture larval contamination (Figure 4). When using LW or GR as the determinant criterion,
the day of anthelmintic treatment at which average weight gain benefit predictions were equal
to those for random selection were day 60, 32 and 29 for initial pasture larval contaminations
of 1000, 3000 and 5000 L3/kg DM, respectively. Following maximum average weight gain
benefit predictions, the average weight gain benefit for all determinant criteria and levels of
initial pasture larval contamination became increasing similar to the 100% treatment group as
the day of anthelmintic treatment increased. As the day of anthelmintic treatment approached
simulation day 121, average weight gain benefit predictions for all treatment groups (100%
treated, and 50% treated according to random selection, FEC, LW or GR) and levels of initial
pasture larval contamination reduced in line with the reduced duration in which the weight
gain benefit of anthelmintic treatment could become apparent before the end of the simulated
grazing season. As such, the average weight gain benefit for anthelmintic treatments
occurring on day 121 were zero for all levels of initial pasture larval contamination and
treatment groups.
In contrast to the average weight gain benefit predictions, increasing the initial pasture
larval contamination had little to no impact upon the increase in R allele frequency
predictions (Figure 4), which is also evident within the maximum increase in R allele
frequency predictions detailed in Table 1. However, increasing the initial pasture larval
contamination was predicted to result in a decreasing day of anthelmintic treatment for which
the maximum increase in R allele frequency occurred for the treatment groups where 50% of
the population was treated according to FEC, LW or GR (Table 1). Notably, whilst average
weight gain benefit predictions for the 50% treatment groups using FEC, LW or GR as the
determinant criteria became increasingly similar to the full flock treatment group (100%

23
treated) as the day of anthelmintic treatment increased, the increase in R allele frequency
remained considerably reduced in comparison with the full flock treatment until the final
days of simulation where differences did not have sufficient time to become apparent.
Figure 5 provides the benefit per R derived from differing determinant criteria and
day of anthelmintic treatment for an initial pasture larval contamination of 1000 (Figure 5a),
3000 (Figure 5b) or 5000 (Figure 5c) L3/kg DM herbage. Increasing the initial pasture larval
contamination resulted in an increasing benefit per R (Figure 5), which is also evident from
the maximum benefit per R predictions detailed in Table 1. For all levels of initial pasture
larval contamination and day of anthelmintic treatment, benefit per R predictions when
treating 100% of the grazing lamb population or 50% according to random selection were
equal. In comparison, all other treatment groups (50% treated according to FEC, LW or GR)
resulted in an increased benefit per R (Figure 5, Table 1). Of the determinant criteria
evaluated in this study, LW was predicted to result in the greatest benefit per R for all levels
of initial pasture larval contamination and day of anthelmintic treatment. For FEC, benefit per
R predictions were initially better than GR until anthelmintic treatments administered on day
54, 29 and 24 for initial pasture larval contaminations of 1000, 3000 and 5000 L3/kg DM,
respectively; after which GR provided a better determinant criterion than FEC. The optimum
day of anthelmintic treatment (day of anthelmintic treatment on which the maximum benefit
per R occurred) decreased with increasing initial pasture larval contamination (Table 1). For
all determinant criteria and level of initial pasture larval contamination, anthelmintic
treatments administered during the first 60 days post weaning were predicted to lead to the
greatest benefit per R (Figure 5, Table 1).
4. Discussion

24
4.1 Distribution of output traits
Initial positive (right-skew) predictions for both WB and FEC resulted from the link
between GR and herbage intake (Cammack et al., 2005). Lambs growing at a faster rate had a
greater nutritional requirement (Emmans, 1997; Wellock et al., 2004) leading to an increased
herbage intake, associated larval intake and consequent WB. Subsequent reductions in
distribution skew arose from the relationship between the acquisition of immunity and
herbage intake (Laurenson et al., 2011). Individuals with an increased larval intake acquired
immunity at a faster rate than the remainder of the lamb population. Consequent reductions in
herbage intake resulted in a reduced larval intake thereby counteracting the initial positive
distribution skew arising from the link between GR and herbage intake. As such, distribution
skews for WB and FEC reduced toward zero (normal distribution). Following this and in
agreement with expectations, WB and FEC predictions became progressively right-skewed
(increasing distribution skew, Figure 2) over time as a consequence of between-animal
variation in immune responses (Wakelin, 1984; Wassom et al., 1986). The relationship
between distribution skew and immune response is evidenced by the increased distribution
skew for FEC in comparison to WB. The WB distribution skew resulted from the impact of
the acquisition of immunity on nematode establishment and mortality, whilst the increased
FEC distribution skew was due to the added impacts of density dependence and the
acquisition of immunity on fecundity and herbage intake. Reductions in herbage intake as a
consequence of the acquisition of immunity caused reductions in faecal output and hence an
increased FEC (eggs/g DM faeces).
4.2 Phenotypic correlations
The time-dependent nature of the phenotypic correlations predicted between WB and
LW or GR (Figure 3) was a consequence of: 1) the link between herbage intake, LW and GR;

25
2) the impact of the acquisition of immunity upon WB, herbage intake, GR and LW; and 3)
the absolute level of acquired immunity. Initially, lambs with the highest LW or desired GR
had a higher herbage intake, and hence a larger larval intake, leading to an increased WB
(and positive correlation). Ingestion of L3 prompted the acquisition of immunity, with
increasing levels of initial pasture larval contamination leading to an increased rate of
acquisition. The acquisition of immunity is associated with reductions in herbage intake
(Greer et al., 2005) and consequent reductions in GR and LW (Dever et al., 2016). As such,
lambs acquiring immunity and thereby reducing WB also have a reduced GR and LW, further
reinforcing the predicted positive correlations. However, as immunity is acquired, the ability
to suppress WB increases. Thus, despite the negative impact of the acquisition of immunity
on GR, the increasing control of parasitic burdens reduced the associated endogenous protein
losses leading to reduced maximum positive phenotypic correlations (and day of maximum)
for increasing levels of initial pasture larval contamination. These negative correlations
reflect the efficacy of acquired immunity in reducing resident WBs, and hence a reduced
impact of parasitism on LW and GR. As such, the longer it takes for immunity to be acquired,
the longer it takes to reduce WBs and their detrimental impact; as evident from the
phenotypic correlations of WB with LW and GR on day 121, where increasing the initial
pasture larval contamination resulted in increasingly negative phenotypic correlations.
Differences between the predicted phenotypic correlations for LW and WB, or GR and WB,
arose because correlations with LW accounted for the impact of current LW and desired GR
on herbage intake and hence larval intake, whilst correlations with GR only account for the
impact of desired GR on herbage intake.
The gradual increase in the predicted phenotypic correlation between WB and FEC
over the course of the simulated grazing season (Figure 3c) was in agreement with the T.
circumcincta trickle challenge experiments conducted by Beraldi et al. (2008), where the

26
phenotypic correlation between WB and FEC increased from +0.17 on day 21 post-infection
to +0.83 on day 91 post-infection. The predicted time-dependent phenotypic correlations
between WB and FEC arose as a consequence of the average WB and FEC predictions
provided in Figure 2. Whilst the impact of immune acquisition on nematode establishment,
mortality and fecundity was assumed to occur at slightly different rates, alterations in each
occurred concurrently. As such, this led to the increasing phenotypic correlations predicted
between WB and FEC. Minor differences in the predicted phenotypic correlations for the
differing levels of initial pasture larval contamination between days 14 and 60 occurred as a
consequence of strong density-dependent effects on nematode fecundity for low WBs
resulting from lower challenge levels. These strong density-dependent effects on nematode
fecundity only resulted in minor differences due to the counteracting impact of the
acquisition of immunity on faecal output as discussed in section 4.1. Despite speculation
about poor phenotypic correlations between WB and FEC, values derived from experimental
studies remain strongly positive across nematode species [r = +0.74 (McKenna, 1981), r =
+0.82 (Douch et al., 1984), r = +0.63 (Stear et al., 1995), r = +0.91 (Bisset et al., 1996), r =
+0.91 (Amarante, 2000) etc.]. Notably, Amarante (2000) investigated the relationship
between WB and FEC in mixed infections and reported a large range of species specific
correlations. This study concluded that poor correlations were the result of laboratory
procedures (group composite) to identify specific nematode species in mixed infections, and
could be resolved by determining nematode species composition on an individual lamb basis
rather than using a group composite. As such, ignoring poor species specific correlations
derived from mixed infection studies, it is safe to say that WB and FEC are strongly
correlated. This conclusion thereby supports the use of the FEC reduction test (Coles et al.,
1992) as a measure of anthelmintic efficacy.
Predicted phenotypic correlations between FEC and LW or GR were broadly similar

27
to those predicted for WB and LW or GR, with differences being attributable to the time-
dependent phenotypic correlation predicted between WB and FEC. A comparison of
predicted genetic correlations between LW and FEC against point estimates derived from
experimental studies can be found in Laurenson et al. (2012b).
4.3 Determinant criteria evaluation
Negative average weight gain benefit predictions occurring for anthelmintic
treatments administered during the first 3 days of the simulated grazing season (Figure 4)
arose as a consequence of reduced antigen exposure during an early stage in immune
acquisition. As such, the delayed acquisition of immunity led to increased losses associated
with parasitism in comparison to a non-treated (0%) lamb population. Positive average
weight gain benefit predictions for anthelmintic treatments occurring after day 3, which
increased with increasing initial pasture larval contamination (Figure 4, Table 1), arose as a
consequence of the increasing impact upon the EBW of the non-treated lamb population (in
agreement with Coop et al., 1982) against which the average weight gain benefit was
calculated. The day of anthelmintic treatment at which the maximum average weight gain
benefit occurred decreased with increasing levels of initial pasture larval contamination
(Table 1) due to the relationship between larval exposure and the acquisition of immunity
(section 2.1.1). As such, as initial pasture larval contamination increased, the rate at which
immunity acquired also increased thereby reducing the day of anthelmintic treatment at
which the maximum average weight gain benefit occurred.
For the group where 50% of the lambs where treated according to random selection,
average weight gain benefit and increase in R allele frequency predictions were roughly half
those predicted for the 100% treatment group with minor deviations arising from errors
associated with the use of a pseudo-random number generator to identify which lambs were

28
to be drenched. In contrast, when using FEC as the determinant criterion, average weight gain
benefit predictions were greater than those predicted when selecting animals at random for all
levels of initial pasture larval contamination and day of anthelmintic treatment. These
predictions are in agreement with expectations arising from the favourable positive
phenotypic correlations predicted between FEC and WB (Figure 3c). Similarly, the
predictions for average weight gain benefit when treating 50% of the grazing population
according to LW or GR follow expectations derived from the phenotypic correlations with
WB (Figure 3a,b). For anthelmintic treatments occurring during the first 30 to 60 days
(dependent upon initial pasture larval contamination; see section 3.3), average weight gain
benefit predictions were less than those predicted using random selection due to unfavourable
positive correlations between WB and LW or GR. As such, treating individuals with the
lowest LW or GR identified those lambs with the lowest WBs leading to reduced average
weight gain benefits. Following this initial period, average weight gain benefit predictions
when using LW or GR as the determinant criteria became better than when using random
selection as a consequence of the time-dependent shift in phenotypic correlations with WB
(from unfavourable positive to favourable negative correlations). For all determinant criteria
(FEC, LW or GR) and level of initial pasture larval contamination, average weight gain
benefit predictions became increasingly similar to the 100% treatment group as the day of
anthelmintic treatment approached day 121 as a consequence of the increasing distribution
skew in FEC and WB predictions (Figure 2) which resulted in anthelmintic treatments being
directed towards an increasing proportion of the parasitic burden within the host population
over time.
Notably, average weight gain benefit and increase in R allele frequency predictions
were not directly proportional. In contrast to average weight gain benefit, increase in R allele
frequency predictions did not increase with increasing initial pasture larval contamination.

29
Whilst increasing initial pasture larval contamination resulted in increasing average weight
gain benefit predictions, it also resulted in an increased nematode supra-population in refugia
on pasture and hence a lack of impact upon increase in R allele frequency predictions. This
prediction is in agreement with the assertion that anthelmintic treatment selects for resistance
in proportion to the nematode population in refugia (Martin et al., 1981; Michel, 1985). The
day of anthelmintic treatment for which the maximum increase in R allele frequency
prediction occurred decreased with increasing initial pasture larval contamination,
corresponding with periods in which there was a low level of pasture larval contamination
and hence a low level of refugia on pasture. This is most evident in the increase in R allele
frequency peaks predicted for anthelmintic treatments occurring around day 21 (Figure 4)
where L3 on pasture reduced via L3 mortality and ingestion prior to L3 contributions arising
from eggs deposited by the lamb population. Further, whilst average weight gain benefit
predictions for each phenotypic determinant criterion (FEC, LW or GR) became increasingly
similar to the full flock (100%) treatment group as the day of anthelmintic treatment
increased, the increase in R allele frequency remained considerably reduced in comparison to
the 100% treatment group. Whilst an increasing day of anthelmintic treatment resulted in
drenches being directed towards an increasing proportion of the parasitic burden within the
host population (via the WB distribution skew; Figure 2), density-dependent effects on
nematode fecundity impacted upon the quantity of eggs deposited on pasture. As such, the
number of eggs produced per female nematode increased for decreasing WBs (Bishop and
Stear, 1997). Consequently, the egg output arising from low WBs in non-treated individuals
provided sufficient refugia to maintain a reduced increase in R allele frequency in
comparison to the 100% treatment group.
For the benefit per R predictions (Figure 5), increasing the initial pasture larval
contamination resulted in an increased benefit per R for all treatment groups and day of

30
anthelmintic treatment because of the impact of initial pasture larval contamination on
average weight gain benefit and the lack of impact of initial pasture larval contamination on
the increase in R allele frequency. Benefit per R predictions when treating 100% of the
grazing population or 50% by random selection were equal as a consequence of the inability
of random selection to identify individuals with the highest WB and therefore exploit the
over-dispersion of WBs within the host population. For all other treatment groups (50%
treated according to FEC, LW or GR), disproportionate impacts upon average weight gain
benefit and increase in R allele frequency predictions resulted in increased benefit per R
predictions in comparison to the 100% and 50% randomly selected treatment groups. Of the
determinant criteria evaluated in this study, LW was predicted to result in the greatest benefit
per R for all levels of initial pasture larval contamination and day of anthelmintic treatment.
As such, LW provides the best phenotypic trait to use as a determinant criterion for TST
strategies, providing the greatest productive benefit across the efficacious life of an
anthelmintic drug. Notably, the calculation of benefit per R in this study gave equal
weighting to average weight gain benefit and increase in R allele frequency predictions;
however, in practice sheep producers may be expected to give average weight gain benefit
greater consideration. Hence, identification of the best determinant criterion may be expected
to change from LW to FEC as the weighting of average weight gain benefit approaches 100%
(e.g. Figure 4). Notably, anthelmintic treatments administered during the first 60 days post
weaning were predicted to lead to the greatest benefit per R, and hence occur before the
required 3 week withdrawal period (prior to slaughter) that is typical of many non-persistent
anthelmintics.
4.4 Implementation of TST strategies
Within the sheep industry, the adoption of integrated parasite control programs is
heavily dependent upon the productive benefit of implementation. The justification for TST

31
regimes is therefore constrained by potential reductions in productivity resulting from
reducing the use of anthelmintics. As such, a number of experimental studies have focussed
on the impact of TST on performance traits. In comparison to a suppressive full flock
treatment regime, the implementation of TST strategies for T. circumcincta infections have
previously been shown to have non-significant impacts upon weight gain (Leathwick et al.,
2006a; Greer et al., 2009; Stafford et al., 2009; Besier et al., 2010; Busin et al., 2013;
Valcárcel et al., 2015). Predicted average weight gain benefits within this simulation study
were very similar to the full flock treatment group for a single anthelmintic drenching
occasion occurring within the later stages of the grazing season. However, for treatments
occurring during the early stages of the simulated grazing season, the predicted average
weight gain benefits for the TST groups were reduced in comparison to the full flock
treatment group (Figure 4). The maximum reduction for predicted average weight gain
benefit in comparison to the full flock treatment group was -4.56kg for an initial pasture
larval contamination of 5000 L3/kg DM and anthelmintic treatments occurring on day 18
when GR was used as the determinant criterion. Differences between these predictions and
observations from experimental studies may arise from differences in drenching frequency
(the number of anthelmintic drenching occasions), and the determination of significance for
experimental studies utilising small group sizes. Further to their potential impact (or lack
thereof) on average weight gain, TST strategies require increased financial, logistical and
labour costs associated with the collection of phenotypic data and determination of which
animals to treat. Using FEC as the determinant criterion requires the collection of individual
faecal samples, laboratory analysis, and then a secondary flock round up to administer the
appropriate anthelmintic treatments; which comes at a considerable financial and diuturnal
cost. When using either LW or GR as determinant criteria, on-farm automated weighing
systems may be utilised, however, these also have a financial cost. Financial investment in an

32
automated weighing system may be considered a one-off expense (plus maintenance costs),
and is therefore more desirable than the ongoing cost of FEC sampling and analysis. In labour
and logistical terms, LW may be considered preferable as a determinant criterion as weighing
would only be required on a single occasion in comparison to the calculation of GR which
requires two weight measurements. However, the determination of appropriate treatment
times would require the continual monitoring of LW, and as such GR could easily be
monitored.
The implementation of TST strategies on farms will depend on the extra profit
realized by producers (Kahn and Woodgate, 2012). In the short-term, a TST strategy may be
considered undesirable to sheep producers as the potential reductions in weight gain
alongside the cost of implementation would result in reduced economic returns in comparison
to full flock treatments. However, the long-term productive benefits of maintaining
anthelmintic efficacy (as illustrated by benefit per R predictions; Figure 5) support the use of
TST strategies and consequently further analysis would be required to determine whether
these off-set the costs of implementation. In this study, LW was predicted to provide the
greatest benefit per R as a consequence of imperfect identification of individuals harbouring
the greatest WB. As previously discussed, LW also provides the determinant criterion for
which the cost of TST implementation is expected to be the least. Thus, TST strategies
utilising LW as the determinant criterion may potentially provide long-term economic
benefits, and hence support the implementation of TST strategies within populations of
growing lambs.
4.4 Unaccounted factors affecting anthelmintic resistance
Predictions reported within this manuscript were for a single drenching occasion
administered to a flock of growing lambs during a simulated grazing season. Drenching

33
frequency is also associated with the emergence of anthelmintic resistance (Jackson and
Coop, 2000; Coles, 2005; van Wyk et al., 2006). A previous simulation study investigated the
short- and long-term impact of drenching frequency upon weight gain and anthelmintic
efficacy (Laurenson et al., 2013b). That study predicted that drenching early in the grazing
season resulted in an early suppression of L3 pasture contamination thereby reducing the need
for subsequent drenches. As such, in the short-term, each consecutive drench was predicted to
have a decreased impact upon average EBW and an increased impact upon R allele
frequency. Consequently, in the long-term, increasing drenching frequency led to decreased
productive benefits as a result of a reduced duration of anthelmintic efficacy. Further, whilst
LW was predicted to be the best determinant criterion in this study where a single drenching
occasion was simulated, anthelmintic treatment may be expected to break the correlation
between LW and WB causing it to tend towards zero (Laurenson et al., 2012b). As such, for
secondary or tertiary drenching occasions, LW may not provide the best determinant criterion
for TST strategies.
Further factors affecting the emergence of anthelmintic resistance include: the
proportion of the host population treated (Laurenson et al., 2013b); the genetic mechanism of
resistance to differing anthelmintic classes (monogenic vs. multigenic and mode of
inheritance; Barnes et al., 1995); potential reversion to susceptibility (Leathwick, 2013); and
the influence of climate on L3 pasture contamination (Rose et al., 2015) and hence refugia.
The proportion of a lamb population treated within a TST strategy has previously been
investigated using a mathematical model (Laurenson et al., 2013b). In the short-term (a single
grazing season), increasing the proportion of lambs treated on any given occasion increased
both the average EBW and the R allele frequency on pasture. In the long-term, the proportion
treated resulted in no major differences in weight gains over the efficacious life of an
anthelmintic. However, reducing the proportion of the lamb population drenched increased

34
the duration of anthelmintic efficacy and reduced the total number of drenches administered
before resistance was reported (i.e. a reduction in the number of unnecessary drenches). For
the genetics of anthelmintic resistance this study simulated a monogenic mechanism and a
recessive mode of inheritance akin to benzimidazole (Elard and Humbert, 1999; Silvestre and
Cabaret, 2002). For multigenic mechanisms of anthelmintic resistance, simulation studies
have previously demonstrated that for an increasing number of genes there is an associated
reduction in the rate at which anthelmintic resistance develops (Barnes et al., 1995). Further,
the mode of inheritance (dominant, recessive or neutral) has also been shown to impact upon
the selection for anthelmintic resistance. Dominant modes of inheritance increase the rate at
which anthelmintic resistance develops, whilst recessive modes of inheritance decrease the
rate of development of anthelmintic resistance (Barnes et al., 1995). Reversion to
susceptibility was not simulated within this study as all nematode genotypes were assumed to
be equally fit (Barrett et al., 1998; Elard et al., 1998). However, previous simulation studies
have included a decreased fitness for resistant genotypes (Leathwick et al., 2013). That study
illustrated that decreasing the fitness of resistant nematode genotypes resulted in a reduced
rate at which anthelmintic resistance develops. Further, the influence of climatic variables on
L3 pasture contamination and hence refugia was not simulated in this study but will be a
focus of future work. As such, whilst this study did not investigate differences in the
proportion of the flock treated, the genetic mechanism of resistance, the mode of inheritance,
nematode genotype fitness, or the influence of climatic variables on L3 pasture
contamination; these factors would be expected to impact upon the average weight gain
benefit and increase in R allele frequency predictions. However, as this study simulated a
single active administered on a single occasion under identical environmental conditions,
these factors would equally impact on the predictions for all the treatment groups simulated.
Hence, whilst the numeric value of predictions may be expected to change, the ranking of

35
determinant criteria would be expected to remain the same with LW still performing as the
best determinant in terms of benefit per R.
In practice, sheep producers may not use anthelmintic drugs independently but rather
sequentially, rotationally or in combination (Barnes et al., 1995; Leathwick, 2012). Further,
treatment would not be expected to be confined to growing lambs but also used to control
parasitism within ewes. Whilst cross-resistance is a potential concern for practices utilizing
multiple anthelmintic actives (Bjørn et al., 1990), the general aim of these strategies is to
maintain efficacy. TST may therefore be considered a complementary strategy as its
implementation would reduce the rate at which anthelmintic resistance develops and thereby
maintain effective control of parasitism. In this study, each determinant criterion was
evaluated by its impact upon weight gain in growing lambs, however, for ewes the primary
focus would be on reproductive traits and as such recommendations for which determinant
criteria to use in a TST regime would be expected to differ.
5. Conclusion
Live weight was predicted to be the best trait to use as a determinant criterion (across
all levels of initial pasture larval contamination and day of anthelmintic treatment) for TST
strategies aimed at growing lambs in a temperate climate. This study supports the use of TST
strategies as implementation was predicted to result in a decreased negative impact upon
anthelmintic resistance in comparison to full flock treatments. As such, the long-term
productive benefits of anthelmintic treatment were predicted to be greater when a TST
regime was utilized due to the maintenance of drug efficacy. However, to convince sheep
producers of the merits of TST strategies, the long-term productive benefits would need to
exceed the financial, logistical and labour costs of implementation.

36
Acknowledgements
Y.C.S.M.L. is the recipient of a University of New England postdoctoral research
fellowship. I.K. and S.C.B. were involved in the initial conception of this study and the
construction of the mathematical model described within this manuscript. L.P.K. advised on
the interpretation of results and the discussion section of the manuscript. Further, I.K. and
L.P.K. provided critical review of the manuscript.
Conflict of interest statement
The authors declare no conflicts of interest.
References
AFRC, 1993. Energy and Protein Requirements of Ruminants. An Advisory Manual prepared
by AFRC Technical Committee on Responses to Nutrients. CAB International, Wallingford,
UK.
Amarante, A.F.T., 2000. Relationship between faecal egg counts and total worm counts in
sheep infected with gastrointestinal nematodes. Brazil J. Vet. Parasitol. 9, 45-50.
Bath, G.F., van Wyk, J.A., 2009. The Five Point Check© for targeted selective treatment of
internal parasites in small ruminants. Small Rumn. Res. 86, 6-13.
Barger, I.A., 1985. The statistical distribution of trichostrongylid nematodes in grazing
lambs. Int. J. Parasitol. 15, 645-649.
37
Barnes, E.H., Dobson, R.J., 1990. Population dynamics of Trichostrongylus colubriformis in
sheep: computer model to simulate grazing systems and the evolution of anthelmintic
resistance. Int. J. Parasitol. 20, 823-831.
Barnes, E.H., Dobson, R.J., Barger, I.A., 1995. Worm control and anthelmintic resistance:
adventures with a model. Parasitol. Today 11, 56-63.
Barrett, M., Jackson, F., Huntley, J.F., 1998. Pathogenicity and immunogenicity of direct
isolates of Teladorsagia circumcincta. Vet. Parasitol. 76, 95-104.
Bentounsi, B., Meraldi, S., Cabaret, J., 2012. Towards finding effective indicators (diarrhoea
and anaemia scores and weight gains) for the implementation of targeted selective treatment
against the gastro-intestinal nematodes in lambs in a steppic environment. Vet. Parasitol. 187,
275-279.
Beraldi, D., Craig, B.H., Bishop, S.C., Hopkins, J., Pemberton, J.M., Pemberton, J.M., 2008.
Phenotypic analysis of host-parasite interactions in lambs infected with Teladorsagia
circumcincta. Int. J. Parasitol. 38, 1567-1577.
Berrag, B., Ouzir, M., Cabaret, J., 2009. A survey on meat sheep farms in two regions of
Morocco on farm structure and the acceptability of targeted selective treatment approach to
worm control. Vet. Parasitol. 164, 30-35.
Besier, R.B., Love, S.C.J., 2003. Anthelmintic resistance in sheep nematodes in Australia: the
need for new approaches. Aust. J. Exp. Agric. 43, 1383-1391.
Besier, R.B., 2007. New anthelmintics for livestock: the time is right. Trends Parasitol. 23,
21-24.
Besier, R.B., Love, R.A., Lyon, J., van Burgel, A.J., 2010. A targeted selective treatment

38
approach for effective and sustainable sheep worm management: investigations in Western
Australia. Anim. Prod. Sci. 50, 1034-1042.
Besier, R.B., 2012. Refugia-based strategies for sustainable worm control: Factors affecting
the acceptability to sheep and goat owners. Vet. Parasitol. 186, 2-9.
Bishop, S.C., Bairden, K., McKellar, Q.A., Park, M., Stear, M.J., 1996. Genetic parameters
for faecal egg count following mixed, natural, predominantly Ostertagia circumcincta
infection and relationships with live weight in young lambs. Anim. Sci. 63, 423-428.
Bishop, S.C., Stear, M.J., 1997. Modelling responses to selection for resistance to
gastrointestinal parasites in sheep. Anim. Sci. 64, 469-478.
Bishop, S.C., Morris, C.A., 2007. Genetics of disease resistance in sheep and goats. Small.
Rumin. Res. 70, 48-59.
Bisset, S.A., Morris, C.A., 1996. Feasibility and implications of breeding sheep for resilience
to nematode challenge. Int. J. Parasitol. 26, 857-868.
Bisset, S.A., Vakssoff, A., Douch, P.G.C., Jonas, W.E., West, C.J., Green, R.S., 1996.
Nematode burdens and immunological responses following natural challenge in Romney
lambs selectively bred for low or high faecal worm egg count. Vet. Parasitol. 61, 249-263.
Bjørn, H., Roepstorff, A., Waller, P.J., Nansen, P., 1990. Resistance to levamisole and cross-
resistance between pyrantel and levamisole in Oesophagostomum quadrispinulatum and
Oesophagostomum dentatum of pigs. Vet. Parasitol. 37, 21-30.
Boag, B., Thomas, R.J., 1975. The population dynamics of nematode parasites of sheep in
northern England. Res. Vet. Sci. 19, 293-295.
Borgsteede, F.H.M., 1993. The efficacy and persistent anthelmintic effect of ivermectin in

39
sheep. Vet. Parasitol. 50, 117-124.
Broughan, J.M., Wall, R., 2007. Faecal soiling and gastrointestinal helminth infection in
lambs. Int. J. Parasitol. 37, 1255-1268.
Busin, V., Kenyon, F., Laing, N., Denwood, M.J., McBean, D., Sargison, N.D., Ellis, K.,
2013. Addressing sustainable sheep farming: Application of a targeted selective treatment
approach for anthelmintic use on a commercial farm. Small Rumin. Res. 110, 100-103.
Busin, V., Kenyon, F., Parkin, T., McBean, D., Laing, N., Sargison, N.D., Ellis, K., 2014.
Production impact of a targeted selective treatment system based on liveweight gain in a
commercial flock. Vet. J. 200, 248-252.
Cabaret, J., Gonnord, V., Cortet, J., Sauvé, C., Ballet, J., Tournadre, H., Benoit, M., 2006.
Indicators for internal parasitic infections in organic flocks: the diarrhoea score (Disco)
proposal for lambs. In: Organic Congress 2006 - Organic Farming and European Rural
Development, Odense DK 30-31 May 2006, pp. 552-553.
Cabaret, J., Benoit, M., Laignel, G., Nicourt, C., 2009. Current management of farms and
internal parasites by conventional and organic meat sheep French farmers and acceptance of
targeted selective treatments. Vet. Parasitol. 164, 21-29.
Cammack, K.M., Leymaster, K.A., Jenkins, T.G., Nielsen, M.K., 2005. Estimates of genetic
parameters for food intake, feeding behaviour, and daily gain in composite ram lambs. J.
Anim. Sci. 83, 777-785.
Coles, G.C., Bauer, C., Borgsteede, F.H.M., Geerts, S., Klei, T.R., Taylor, M.A., Waller, P.J.,
1992. World Association for the Advancement of Veterinary Parasitology (W.A.A.V.P.)
methods for the detection of anthelmintic resistance in nematodes of veterinary importance.
Vet. Parasitol. 44, 35-44.

40
Coles, G.C., 2005. Anthelmintic resistance – looking to the future: a UK perspective. Res.
Vet. Sci. 78, 99-108.
Coop, R.L., Sykes, A.R., Angus, K.W., 1982. The effect of three levels of intake of
Ostertagia circumcincta larvae on growth rate, food intake and body composition of growing
lambs. J. Agric. Sci. 98, 247-255.
Coop, R.L., Graham, R.B., Jackson, F., Wright, S.E., Angus, K.W., 1985. Effect of
experimental Ostertagia circumcincta infection on the performance of grazing lambs. Res.
Vet. Sci. 38, 282-287.
Cornelius, M.P., Jacobson, C., Besier, R.B., 2014. Body condition score as a selection tool
for targeted selective treatment-based nematode control strategies in Merino ewes. Vet.
Parasitol. 206, 173-181.
Cringoli, G., Rinaldi, L., Veneziano, V., Mezzino, L., Vercruysse, J., Jackson, F., 2009.
Evaluation of targeted selective treatments in sheep in Italy: Effects on faecal worm egg
count and milk production in four case studies. Vet. Parasitol. 164, 36-43.
Dever, M.C., Kahn, L.P., Doyle, E.K., Walkden-Brown, S.W., 2016. Immune-mediated
responses account for the majority of production loss for grazing meat-breed lambs during
Trichostrongylus colubriformis infection. Vet. Parasitol. 216: 23-32.
Doeschl-Wilson, A.B., Vagenas, D., Kyriazakis, I., Bishop, S.C., 2008. Challenging the
assumptions underlying genetic variation in host nematode resistance. Genet. Sel. Evol. 40,
241-264.
Douch, P.G.C., Harrison, G.B.L., Buchanan, L.L., Brunsdon, R.V., 1984. Relationship of
histamine in tissues and antiparasitic substances in gastrointestinal mucus to the development
of resistance to trichostrongyle infections in young sheep. Vet. Parasitol. 16, 273-288.
41
Elard, L., Sauvé, C., Humbert, J.F., 1998. Fitness of benzimidazole-resistant and –suceptible
worms of Teladorsagia circumcincta, a nematode parasite of small ruminants. Parasitology
117, 571-578.
Elard, L., Humbert, J.F., 1999. Importance of the mutation of amino acid 200 of the isotype 1
β-tubulin gene in the benzimidazole resistance of small-ruminant parasite Teladorsagia
circumcincta. Parasitol. Res. 85, 452-456.
Emmans, G.C., 1997. A method to predict the food intake of domestic animals from birth to
maturity as a function of time. J. Theor. Biol. 186, 189-199.
Falconer, D.S., Mackay, T.F.C., 1996. Introduction to Quantitative Genetics, 4th ed.
Longman, UK.
Fox, M.T., Gerrelli, D., Pitt, S.R., Jacobs, D.E., Gill, M., Gale, D.L., 1989. Ostertagia
ostertagi infection in the calf: effects of a trickle challenge on appetite, digestibility, rate of
passage of digesta and liveweight gain. Res. Vet. Sci. 47, 294-298.
Fox, M.T., 1997. Pathophysiology of infection with gastrointestinal nematodes in domestic
ruminants: recent developments. Vet. Parasitol. 72, 285-308.
Gaba, S., Ginot, V., Cabaret, J., 2005. Modelling macroparasite aggregation using a
nematode-sheep system: the Weibull distribution as an alternative to the Negative Binomial
distribution? Parasitology 131, 393-401.
Gaba, S., Cabaret, J., Sauvé, C., Cortet, J., Silvestre, A., 2010. Experimental and modelling
approaches to evaluate different aspects of the efficacy of Targeted Selective Treatment of
anthelmintics against sheep parasite nematodes. Vet. Parasitol. 171, 254-262.
Gaba, S., Cabaret, J., Chylinski, C., Sauvé, C., Cortet, J., Silvestre, A., 2012. Can efficient

42
management of sheep gastro-intestinal nematodes be based on random treatment? Vet.
Parasitol. 190, 178-184.
Gallidis, E., Papadopoulos, E., Ptochos, S., Arsenos, G., 2009. The use of targeted selective
treatments against gastrointestinal nematodes in milking sheep and goats in Greece based on
parasitological and performance criteria. Vet. Parasitol. 164, 53-58.
Gibson, T.E., Everett, G., 1972. The ecology of the free-living stages of Ostertagia
circumcincta. Parasitology 64, 451-460.
Gilleard, J.S., 2006. Understanding anthelmintic resistance: the need for genomics and
genetics. Int. J. Parasitol. 36, 1227-1239.
González, J.F., Molina, J.M., Ruiz, A., Conde de Felipe, M.M., Rodríguez-Ponce, E., 2003.
The immune response against gastrointestinal nematodes in ruminants: A review. Res. Rev.
Parasitol. 63, 97-115.
Grass Check, 2011. Grass Growth and Quality. Accessed May 25, 2012.
http://www.dardni.gov.uk/ruralni/grcheck270611.pdf
Greer, A.W., Stankiewicz, M., Jay, N.P., McAnulty, R.W., Sykes, A.R., 2005. The effect of
concurrent corticosteroid induced immune-suppression and infection with the intestinal
parasite Trichostrongylus colubriformis on food intake and utilization in both
immunologically naïve and competent sheep. Anim. Sci. 80, 89-99.
Greer, A.W., Kenyon, F., Bartley, D.J., Jackson, E.B., Gordon, Y., Donnan, A.A., McBean,
D.W., Jackson, F., 2009. Development and field evaluation of a decision support model for
anthelmintic treatments as part of a targeted selective treatment (TST) regime in lambs. Vet.
Parasitol. 164, 12-20.

43
Holmes, P.H., 1987. Pathophysiology of nematode infections. Int. J. Parasitol. 17, 443-451.
Hoste, H., Chartier, C., Lefrileux, Y., Goudeau, C., Broqua, C., Pors, I., Bergeaud, J.P.,
Dorchies, P., 2002. Targeted application of anthelmintics to control trichostrongylosis in
dairy goats: result from a 2-year survey in farms. Vet. Parasitol. 110, 101-108.
Houdijk, J.M., Jessop, N.S., Kyriazakis, I., 2001. Nutrient partitioning between reproductive
and immune functions in animals. Proc. Nutr. Soc. 60, 515-525.
Jabbar, A., Iqbal, Z., Kerboeuf, D., Muhammad, G., Khan, M.N., Afaq, M., 2006.
Anthelmintic resistance: the state of play revisited. Life Sci. 79, 2413-2431.
Jackson, F., Coop, R.L., 2000. The development of anthelmintic resistance in sheep
nematodes. Parasitology 120, S95-S107.
Jackson, F., Miller, J., 2006. Alternative approaches to control – Quo vadit? Vet. Parasitol.
139, 371-384.
Jenkins, S.J., Allen, J.E., 2010. Similarity and diversity in macrophage activation by
nematodes, trematodes, and cestodes. J. Biomed. Biotechnol. 2010, 262609.
Kahn, L.P., Kyriazakis, I., Jackson, F., Coop, R.L., 2000. Temporal effects of protein
nutrition on the growth and immunity of lambs infected with Trichostrongylus colubriformis.
Int. J. Parasitol. 30, 193-205.
Kahn, L.P., Woodgate, R.G., 2012. Integrated parasite management: products for adoption by
the Australian sheep industry. Vet. Parasitol. 186, 58-64.
Kaplan, R.M., 2004. Drug resistance in nematodes of veterinary importance: a status report.
Trends Parasitol. 20, 477-481.
Kaplan, R.M., Burke, J.M., Terill, T.H., Miller, J.E., Getz, W.R., Mobini, S., Valencia, E.,

44
Williams, M.J., Williamson, L.H., Larsen, M., Vatta, A.F., 2004. Validation of the
FAMACHA© eye color chart for detecting clinical anaemia in sheep and goats on farms in
the southern United States. Vet. Parasitol. 123, 105-120.
Kemper, K.E., Palmer, D.G., Liu, S.M., Greef, J.C., Bishop, S.C., Karlsson, L.J.E., 2010.
Reduction of faecal worm egg count, worm numbers and worm fecundity in sheep selected
for worm resistance following artificial infection with Teladorsagia circumcincta and
Trichostrongylus colubriformis. Vet. Parasitol. 171, 238-246.
Kenyon, F., Greer, A.W., Coles, G.C., Cringoli, G., Papadopoulos, E., Cabaret, J., Berrag, B.,
Varady, M., van Wyk, J.A., Thomas, E., Vercruysse, J., Jackson, F., 2009. The role of
targeted selective treatments in the development of refugia-based approaches to the control of
gastrointestinal nematodes of small ruminants. Vet. Parasitol. 164, 3-11.
Kenyon, F., Jackson, F., 2012. Targeted flock/herd and individual ruminant treatment
approaches. Vet. Parasitol. 186, 10-17.
Kenyon, F., McBean, D., Greer, A.W., Burgess, C.G.S., Morrison, A.A., Bartley, D.J.,
Bartley, Y., Devin, L., Nath, M., Jackson, F., 2013. A comparative study of the effects of four
treatment regimes on ivermectin efficacy, body weight and pasture contamination in lambs
naturally infected with gastrointestinal nematodes in Scotland. Int. J. Parasitol. Drugs Drug
Resist. 3, 77-84.
Kyriazakis, I., 2014. Pathogen-induced anorexia: a herbivore strategy or an unavoidable
consequence of infection? Anim. Prod. Sci. 54, 1190-1197.
Larsen, J.W.A., Anderson, N., Vizard, A.L., Anderson, G.A., Hoste, H., 1994. Diarrhoea in
Merino ewes during winter: association with trichostrongylid larvae. Aust. Vet. J. 71, 365-
371.

45
Larsen, J., Anderson, N., 2000. The relationship between the rate of intake of trichostrongylid
larvae and the occurrence of diarrhoea and breech soiling in adult Merino sheep. Aust. Vet. J.
78, 112-116.
Laurenson, Y.C.S.M., Bishop, S.C., Kyriazakis, I., 2011. In silico exploration of the
mechanisms that underlie parasite-induced anorexia in sheep. Br. J. Nutr. 106, 1023-1039.
Laurenson, Y.C.S.M., Kyriazakis, I., Forbes, A.B., Bishop, S.C., 2012a. Exploration of the
epidemiological consequences of resistance to gastro-intestinal parasitism and grazing
management of sheep through a mathematical model. Vet. Parasitol. 189, 238-249.
Laurenson, Y.C.S.M., Kyriazakis, I., Bishop, S.C., 2012b. In silico exploration of the impact
of pasture contamination and anthelmintic treatment on genetic parameter estimates for
parasite resistance in grazing sheep. J. Anim. Sci. 90, 2167-2180.
Laurenson, Y.C.S.M., Kyriazakis, I., Bishop, S.C., 2013a. Can we use genetic and genomic
approaches to identify candidate animals for targeted selective treatment? Vet. Parasitol. 197,
379-383.
Laurenson, Y.C.S.M., Bishop, S.C., Forbes, A.B., Kyriazakis, I., 2013b. Modelling the short-
and long-term impacts of drenching frequency and targeted selective treatment on the
performance of grazing lambs and the emergence of anthelmintic resistance. Parasitology
140, 780-791.
Learmount, J., Taylor, M.A., Smith, G., Morgan, C., 2006. A computer model to simulate
control of parasitic gastroenteritis in sheep on UK farms. Vet. Parasitol. 142, 312-329.
Leathwick, D.M., Vlassoff, A., Barlow, N.D., 1995. A model for nematodiasis in New
Zealand lambs: the effect of drenching regime and grazing management on the development
of anthelmintic resistance. Int. J. Parasitol. 25, 1479-1490.

46
Leathwick, D.M., Waghorn, T.S., Miller, C.M., Atkinson, D.S., Haack, N.A., Oliver, A-M.,
2006a. Selective and on demand drenching of lambs: impact on parasite populations and
performance of lambs. NZ Vet. J. 54, 305-312.
Leathwick, D.M., Miller, C.M., Atkinson, D.S., Haack, N.A., Alexander, R.A., Oliver, A-M.,
Waghorn, T.S., Potter, J.F., Sutherland, I.A., 2006b. Drenching adult ewes: implications of
anthelmintic treatments pre- and post-lambing on the development of anthelmintic resistance.
NZ Vet. J. 54, 297-304.
Leathwick, D.M., 2012. Modelling the benefits of a new class of anthelmintic in
combination. Vet. Parasitol. 186, 93-100.
Leathwick, D.M., 2013. Managing anthelmintic resistance- parasite fitness, drug use strategy
and the potential for reversion towards susceptibility. Vet. Parasitol. 198, 145-153.
Lewis, R.M., Macfarlane, J.M., Simm, G., Emmans, G.C., 2004. Effects of food quality on
growth and carcass composition in lambs of two breeds and their cross. Anim. Sci. 78, 355-
367.
Louie, K., Vlassoff, A., Mackay, A., 2005. Nematode parasites of sheep: extension of a
simple model to include host variability. Parasitology 130, 437-446.
Malan, F.S., van Wyk, J.A., Wessels, C.D., 2001. Clinical evaluation of anaemia in sheep:
early trails. Onderstepoort J. Vet. Res. 61, 165-174.
Martin, P.J., Le Jambre, L.F., Claxton, J.H., 1981. The impact of refugia on the development
of thiabendazole resistance in Haemonchus contortus. Int. J. Parasitol. 11, 35-41.
Martin, P.J., Anderson, N., Jarrett, R.G., 1985. Resistance to benzimidazole anthelmintics in
field strains of Ostertagia and Nematodirus in sheep. Aust. Vet. J. 62, 38-43.
47
McKenna, P.B., 1981. The diagnostic value and interpretation of faecal egg counts in sheep.
NZ Vet. J. 29, 129-132.
Michel, J.F., 1985. Strategies for the use of anthelmintics in livestock and their implications
for the development of drug resistance. Parasitology 90, 621-628.
Molento, M.B., Gavião, A.A., Depner, R.A., Pires, C.C., 2009. Frequency of treatment and
production performance using the FAMACHA method compared with preventative control in
ewes. Vet. Parasitol. 162, 314-319.
Morgan, E.R., van Dijk, J., 2012. Climate and the epidemiology of gastrointestinal nematode
infection of sheep in Europe. Vet. Parasitol. 189, 8-14.
Morris, C.A., Vlassoff, A., Bisset, S.A., Baker, R.L., West, C.J., Hurford, A.P., 1997.
Responses of Romney sheep to selection for resistance or susceptibility to nematode
infection. Anim. Sci. 64, 319-329.
O’Connor, L.J., Walkden-Brown, S.W., Kahn, L.P., 2006. Ecology of the free-living stages
of major trichostrongylid parasites of sheep. Vet. Parasitol. 142, 1-15.
Ouzir, M., Berrag, B., Benjouad, A., Cabaret, J., 2011. Use of pathophysiological indicators
for individual decision of anthelmintic treatment of ewes against gastro-intestinal nematodes
in Morocco. Vet. Parasitol. 180, 372-377.
Papadopoulos, E., 2008. Anthelmintic resistance in sheep nematodes. Small Rumin. Res. 76,
99-103.
Papadopoulos, E., Gallidis, E., Ptochos, S., 2012. Anthelmintic resistance in sheep in Europe:
a selected review. Vet. Parasitol. 189, 85-88.
Rose, H., Wang, T., van Dijk, J., Morgan, E.R., 2015. GLOWORM-FL: A simulation model

48
of the effects of climate and climate change on the free-living stages of gastrointestinal
nematode parasites of ruminants. Ecol. Modell. 297, 232-245.
Russel, A., 1984. Body condition scoring of sheep. Practice 6, 91-93.
Sargison, N.D., Jackson, F., Bartley, D.J., Wilson, D.J., Stenhouse, L.J., Penny, C.D., 2007.
Observations on the emergence of multiple anthelmintic resistance in sheep flocks in the
south-east of Scotland. Vet. Parasitol. 145, 65-76.
Sayers, G., Sweeney, T., 2005. Gastrointestinal nematode infection in sheep – a review of the
alternatives to anthelmintics in parasite control. Anim. Health Res. Rev. 6, 159-171.
Sibbald, A.M., Shellard, L.J.F., Smart, T.S., 2000. Effects of space allowance on the grazing
behaviour and spacing of sheep. Appl. Anim. Behav. Sci. 70, 49-62.
Silvestre, A., Cabaret, J., 2002. Mutation in position 167 of isotype 1 β-tubulin gene of
Trichostrongylid nematodes: role in benzimidazole resistance? Mol. Biochem. Parasitol. 120,
297-300.
Soulsby, L., 2007. New concepts in strongyle control and anthelmintic resistance: the role of
refugia. Vet. J. 174, 6-7.
Sréter, T., Molnár, V., Kassai, T., 1994. The distribution of nematode egg counts and larval
counts in grazing sheep and their implications for parasite control. Int. J. Parasitol. 24, 103-
108.
Stafford, K.A., Morgan, E.R., Coles, G.C., 2009. Weight-based targeted selective treatment
of gastrointestinal nematodes in a commercial sheep flock. Vet. Parasitol. 164, 59-65.
Stear, M.J., Bairden, K., Duncan, J.L., Gettinby, G., McKellar, Q.A., Marray, M., Wallace,
D.S., 1995. The distribution of faecal egg counts in Scottish Blackface lambs following

49
natural, predominantly Ostertagia circumcincta infection. Parasitology 110, 573-581.
Stear, M.J., Bishop, S.C., Henderson, N.G., Scott, I., 2003. A key mechanism of pathogenesis
in sheep infected with the nematode Teladorsagia circumcincta. Anim. Health Res. Rev. 4,
45-52.
Stear, M.J., Doligalska, M., Donskow-Schmelter, K., 2007. Alternatives to anthelmintics for
the control of nematodes in livestock. Parasitology 134, 139-151.
Stear, M.J., Boag, B., Cattadori, I., Murphy, L., 2009. Genetic variation in resistance to
mixed, predominantly Teladorsagia circumcincta nematode infections of sheep: from
heritabilities to gene identification. Parasite Immunol. 31, 274-282.
Stromberg, B.E., 1997. Environmental factors influencing transmission. Vet. Parasitol. 72,
247-264.
Sykes, A.R., 2000. Environmental effects on animal production: the nutritional demands of
nematode parasite exposure in sheep. Asian Austral. J. Anim. 13, 343-350.
Torres-Acosta, J.F.J., Hoste, H., 2008. Alternative or improved methods to limit gastro-
intestinal parasitism in grazing sheep and goats. Small Rumin. Res. 77, 159-173.
Vagenas, D., Bishop, S.C., Kyriazakis, I., 2007a. A model to account for the consequences of
host nutrition on the outcome of gastrointestinal parasitism in sheep: logic and concepts.
Parasitology 134, 1263-1277.
Vagenas, D., Doeschl-Wilson, A., Bishop, S.C., Kyriazakis, I., 2007b. In silico exploration of
the effects of host genotype and nutrition on the genetic parameters of lambs challenged with
gastrointestinal parasites. Int. J. Parasitol. 37, 1617-1630.
Valcárcel, F., Aguilar, A. Sánchez, M., 2015. Field evaluation of targeted selective treatments

50
to control subclinical gastrointestinal nematode infections on small ruminant farms. Vet.
Parasitol. 211, 71-79.
van Dijk, J., Sargison, N.D., Kenyon, F., Skuce, P.J., 2010. Climate change and infectious
disease: helminthological challenges to farmed ruminants in temperate regions. Animal 4,
377-392.
van Wyk, J.A., Malan, F.S., Randles, J.L., 1997. How long before resistance makes it
impossible to control some field strains of Haemonchus contortus in South Africa with any of
the anthelmintics? Vet. Parasitol. 70, 111-122.
van Wyk, J.A., 2001. Refugia – overlooked as perhaps the most important factor concerning
the development of anthelmintic resistance. Onderstepoort J. Vet. Res. 68, 55-67.
van Wyk, J.A., Bath, G.F., 2002. The FAMACHA system for managing haemonchosis in
sheep and goats by clinically identifying individual animals for treatment. Vet. Res. 33, 509-
529.
van Wyk, J.A., Hoste, H., Kaplan, R.M., Besier, R.B., 2006. Targeted selective treatment for
worm management – How do we sell rational programs to farmers? Vet. Parasitol. 139, 336-
346.
Vatta, A.F., Letty, B.A., van der Linde, M.J., van Wijk, E.F., Hansen, J.W., Krecek, R.C.,
2001. Testing for clinical anaemia caused by Haemonchus spp. in goats under resource-poor
conditions in South Africa using an eye colour chart developed for sheep. Vet. Parasitol. 99,
1-14.
Waghorn, T.S., Miller, C.M., Oliver, A-M.B., Leathwick, D.M., 2009. Drench-and-shift is a
high-risk practice in the absence of refugia. NZ Vet. J. 57, 359-363.

51
Wakelin, D., 1984. Evasion of the immune response: survival within low responder
individuals of the host population. Parasitology 88, 639-657.
Waller, P.J., 2003. Global perspectives on nematode parasite control in ruminant livestock:
the need to adopt alternatives to chemotherapy, with emphasis on biological control. Anim.
Health Res. Rev. 4, 35-44.
Waller, P.J., 2006a. From discovery to development: current industry perspectives for the
development of novel methods of helminth control in livestock. Vet. Parasitol. 139, 1-14.
Waller, P.J., 2006b. Sustainable nematode parasite control strategies for ruminant livestock
by grazing management and biological control. Anim. Feed Sci. Tech. 126, 277-289.
Wassom, D.L., Dick, T.A., Arnason, N., Strickland, D., Grundmann, A.W., 1986. Host
genetics: a key factor regulating the distribution of parasites in natural host populations. J.
Parasitol. 72, 334-337.
Wellock, I.J., Emmans, G.C., Kyriazakis, I., 2004. Describing and predicting potential
growth in the pig. Anim. Sci. 78, 379-388.
Wolstenholme, A.J., Fairweather, I., Pritchard, R., von Samson-Himmelstjerna, G., Sangster,
N.C., 2004. Drug resistance in veterinary helminths. Trends Parasitol. 20, 469-476.
Woolaston, R.R., Baker, R.L., 1996. Prospects of breeding small ruminants for resistance to
internal parasites. Int. J. Parasitol. 26, 845-855.
Yakoob, A.Y., Holmes, P.H., Parkins, J.J., Armour, J., 1983. Plasma protein loss associated
with gastrointestinal parasitism in grazing sheep. Res. Vet. Sci. 34, 58-63.
Young, R.R., Anderson, N., Overend, D., Tweedie, R.L., Malafant, K.W.J., Preston, G.A.N.,
1980. The effect of temperature on times to hatching of eggs of the nematode Ostertagia
circumcincta. Parasitology 81, 477-491.

52
Ingested
Larvae
Adult
Worms
Eggs
Fecundity
Mortality
Establishment
Resource Intake
Maintenance Damage & Repair
Wool Growth
Immunity
Intrinsic Growth
Reduction on Food
Intake
Figure 1. A schematic description of the host-parasite interactions in sheep infected with
gastrointestinal nematodes. Rectangular boxes indicate the flow of nutrient resources,
rounded boxes indicate host-parasite interactions and diamond boxes indicate key
quantifiable parasite life-cycle stages.

53
Figure 2. (A) Average worm burden, (B) average faecal egg count (eggs/g DM faeces), (C)
worm burden coefficient of variation, (D) faecal egg count coefficient of variation, (E) worm
burden distribution skew, (F) skew in faecal egg count distribution skew; for 10,000 lambs
given no anthelmintic treatments and grazed on medium quality pasture initially
contaminated with 0 (solid line), 1000 (long dash), 3000 (short dash) or 5000 (dotted)
Teladorsagia circumcincta L3/kg DM herbage.
A B
C D
E F

54
Figure 3. Phenotypic correlation between (A) worm burden and live weight (kg), (B) worm
burden and growth rate (kg/day), (C) worm burden and faecal egg count (eggs/g DM faeces),
(D) faecal egg count (eggs/g DM faeces) and live weight (kg), (E) faecal egg count (eggs/g
DM faeces) and growth rate (kg/day); for 10,000 lambs given no anthelmintic treatments and
grazed on medium quality pasture initially contaminated with 0 (solid line), 1000 (long dash),
3000 (short dash) or 5000 (dotted) Teladorsagia circumcincta L3/kg DM herbage.
A
B
C
D
E

55
Figure 4. Average weight gain benefit (kg) for an initial pasture larval contamination of 1000
(A), 3000 (C) and 5000 (E) L3/kg DM herbage and the increase in resistance allele frequency
for an initial pasture larval contamination of 1000 (B), 3000 (D) and 5000 (E) L3/kg DM
herbage, for 10,000 lambs grazing on a medium quality pasture where anthelmintic treatment
was administered to 100% of the lamb population (solid line), or to 50% of the lamb
population according to faecal egg count (dash dot), random selection (long dash), live
weight (short dash) or growth rate (dotted).
A B
C D
E F
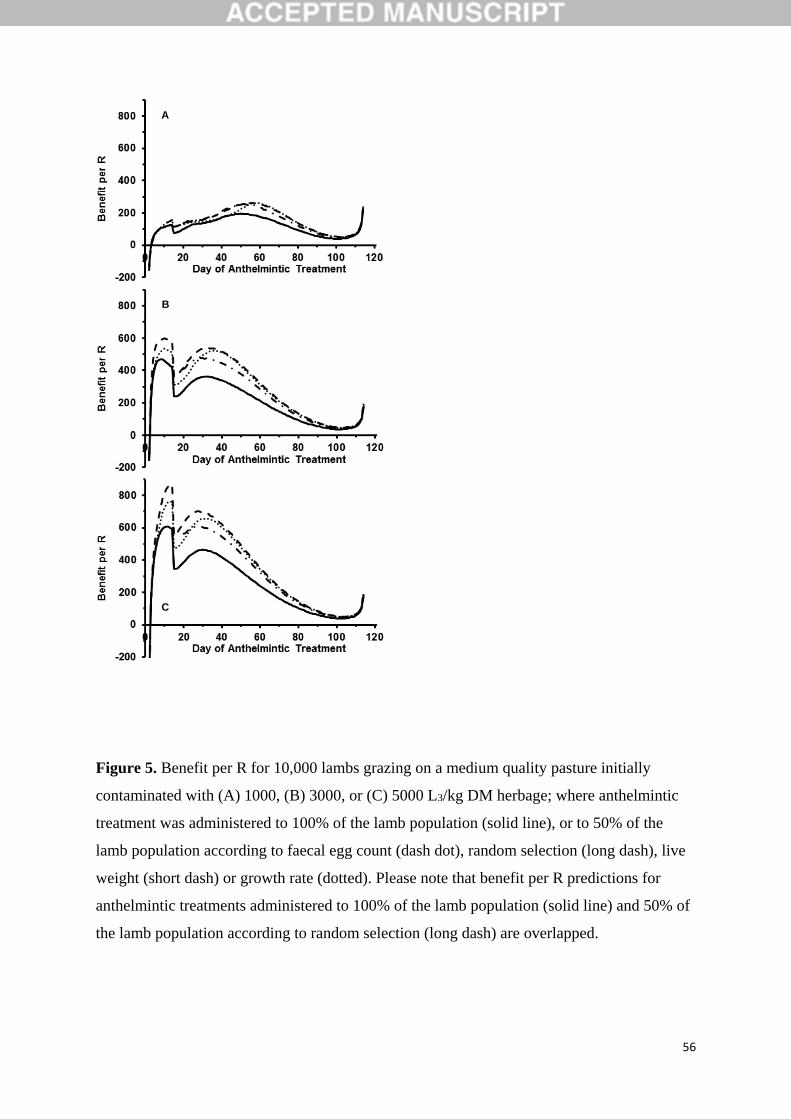
56
Figure 5. Benefit per R for 10,000 lambs grazing on a medium quality pasture initially
contaminated with (A) 1000, (B) 3000, or (C) 5000 L3/kg DM herbage; where anthelmintic
treatment was administered to 100% of the lamb population (solid line), or to 50% of the
lamb population according to faecal egg count (dash dot), random selection (long dash), live
weight (short dash) or growth rate (dotted). Please note that benefit per R predictions for
anthelmintic treatments administered to 100% of the lamb population (solid line) and 50% of
the lamb population according to random selection (long dash) are overlapped.
A
B
C

57
Table 1. Maximum average weight gain benefit (AWGB, kg), maximum increase in R allele
frequency on pasture (IRAF, proportion) and maximum benefit per R (BPR) for 10,000
lambs grazed on medium quality pasture initially contaminated (IL0) with 1000, 3000 or 5000
Teladorsagia circumcincta L3/kg DM herbage; where anthelmintic treatments were
administered to the whole flock (100%), or 50% of the flock according to random selection
(50%RS), faecal egg count (50%FEC), live weight (50%LW) or growth rate (50%GR). The day of
anthelmintic treatment at which maximum predictions occurred are provided in brackets.
IL0 (L3/kg DM) 100% 50%RS 50%FEC 50%LW 50%GR
1000
AWGB 2.12 (51) 1.06 (51) 1.60 (55) 1.02 (63) 1.07 (68)
IRAF 0.021 (16) 0.010 (16) 0.008 (89) 0.006 (92) 0.007 (91)
BPR 194.2 (50) 194.2 (50) 256.8 (51) 263.1 (56) 261.7 (59)
3000
AWGB 4.63 (18) 2.32 (18) 2.63 (28) 2.20 (49) 2.38 (49)
IRAF 0.019 (16) 0.009 (16) 0.008 (76) 0.007 (78) 0.007 (77)
BPR 469.2 (8) 469.2 (8) 475.9 (28) 598.7 (10) 534.4 (10)
5000
AWGB 6.38 (18) 3.19 (18) 3.50 (28) 2.76 (45) 2.93 (45)
IRAF 0.018 (17) 0.009 (17) 0.008 (70) 0.007 (74) 0.007 (68)
BPR 607.9 (11) 607.9 (11) 608.3 (29) 866.4 (14) 760.3 (14)