Embed Size (px)
Citation preview

EARNINGS CALL 10:00
OCTOBER 24, 2019
EDGEWARE
Q3 2019

2 © EDGEWARE 2019
TODAY’S PRESENTERS
KARL THEDÉEN
CEO
ANNIKA NORIN
CFO

3 © EDGEWARE 2019
AGENDA Q3 PRESENTATION
1. Results & highlights Q3
2. Financials in depth
3. Summary

4 © EDGEWARE 2019
• Founded in 2004
• Video processing and delivery solutions
for modern TV services over the Internet
• Scalable, high performance and cost-
efficient solution
• Global presence with HQ in Stockholm.
106 employees in 14 countries
• Blue-chip customer base of mobile and
cable operators, broadcasters as well as
OTT providers
• 200 customers in 70 countries
• Listed on Nasdaq Stockholm
ABOUT EDGEWARE – TV BEYOND BROADCAST
EXAMPLES OF CLIENTSEDGEWARE AT A GLANCE

5 © EDGEWARE 2018
JANUARY – SEPTEMBER 2019, IN KEY FIGURES
NET
SALES, MSEK
CHANGE
NET SALES
GROSS
MARGIN
OPERATING
PROFIT, MSEK
KEY FIGURES
JULY – SEPTEMBER 43,1 -21,0% -3,666,9%
KEY FIGURES
JANUARY – SEPTEMBER 126,9 -17,0% 67,4% -25,6

6 © EDGEWARE 2019
GROWTH OPPORTUNITIES
Two major sports events in
2020 driving CDN investments
and multi-CDN architectures
HIGHLIGHTS DURING Q3
INNOVATIVE
PRODUCTS
EFFICIENT
OPERATIONS
GROWING
MARKET
Following last year’s OPEX
cuts and continued focus on
cost resulted in > 12% OPEX
reduction YoY
Continued streamlining Sales
organization:
• More cost efficient and
• Closer to the head office
MARKET EXPANSION
Order with new customer, larger
US telco for CDN networking
Successful Virtual Channel Creation
demo highlighting encoder savings
for national/regional channels
Successful launch of
StreamPilot at IBC
AmsterdamSTREAMPILOT

7 © EDGEWARE 2019
STREAMING 2018 WINTER OLYMPICS BROKE NEW RECORDS
NBC
• 2.17 billion streamed minutes
• – of which 1.85 live - three
times more than 2014 Winter
OlympicsSource: TVTechnology Source: BBC
BBC
• Streamed 22.2M times across
BBC Sports and BBC iPlayer –
up from 6.2M streams in 2014
8 © EDGEWARE 2019
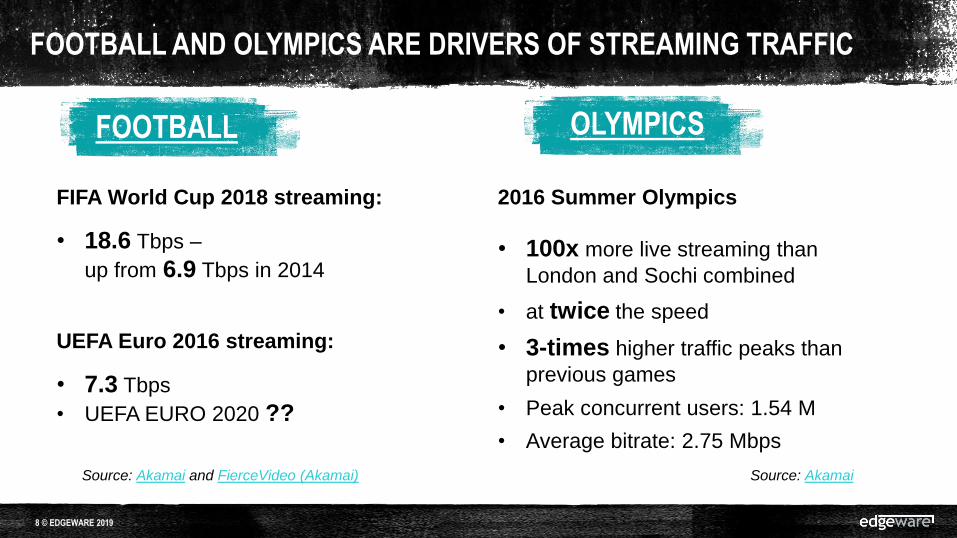
FOOTBALL AND OLYMPICS ARE DRIVERS OF STREAMING TRAFFIC
FIFA World Cup 2018 streaming:
• 18.6 Tbps –
up from 6.9 Tbps in 2014
Source: Akamai and FierceVideo (Akamai)
UEFA Euro 2016 streaming:
• 7.3 Tbps
• UEFA EURO 2020 ??
FOOTBALL OLYMPICS
2016 Summer Olympics
• 100x more live streaming than
London and Sochi combined
• at twice the speed
• 3-times higher traffic peaks than
previous games
• Peak concurrent users: 1.54 M
• Average bitrate: 2.75 Mbps
Source: Akamai

9 © EDGEWARE 2019
IBC, 13 – 17 SEPTEMBER IN AMSTERDAM
• Met >100 companies
• Great interest in and
feedback on StreamPilot
• Presented to some of the
world’s largest
broadcasters/content owners
• StreamPilot
• Virtual Channel Creation
• Good PR coverage

WHY A MULTI-CDN ENVIRONMENT?
CDN A
CDN B
CDN CDATA CONTROL
DATA CONTROL
DATA CONTROL
• To manage peak traffic e.g. live
sports event
• To guarantee service up-time
• To expand service reach
• To guarantee end-user quality

OTT TV DELIVERY CONTROL – INTRODUCING STREAMPILOT
• StreamPilot
controls OTT
TV delivery
from multiple
CDNs
• StreamPilot
measures all
session data to
optimize QoE
CDN A
CDN B
CDN C
STREAMPILOT
ORIGINCLIENT

12 © EDGEWARE 2019
STREAMPILOT – WHAT’S UNIQUE?
• New, cloud-based session control platform with open APIs
• Client, CDN and media format agnostic
• CDN switching per session
• Independent QoE metrics based on all traffic, not subsets

13 © EDGEWARE 2019
VIRTUAL CHANNEL CREATION – SAVING ENCODER CAPACITY
Save encoders and ingest capacity!
Only encode and ingest the local content parts.
TV Repackager:
Channels are
stitched together
TV Content Capture:
Ingest live 24/7 or
time-limited sources
National channel
Local content
Local content
1 2 3 4 5
2 3 4
2 3 4
1 2 3 4 5
2 3 4
2 3 4
1
1
5
5
24/7 encoder
Temporary e.g.
cloud encoders
Full regional channel
Full regional channel
National channel
Save storage in circular buffers!
Store content only once.
• Traditional broadcasters offer regional channels
• OTT broadcasters typically offer only one national channel for all regions due to high encoder/storage
costs
• Edgeware Virtual Channel Creation solution saves encoder/storage cost and enables OTT regional
channels
14 © EDGEWARE 2019
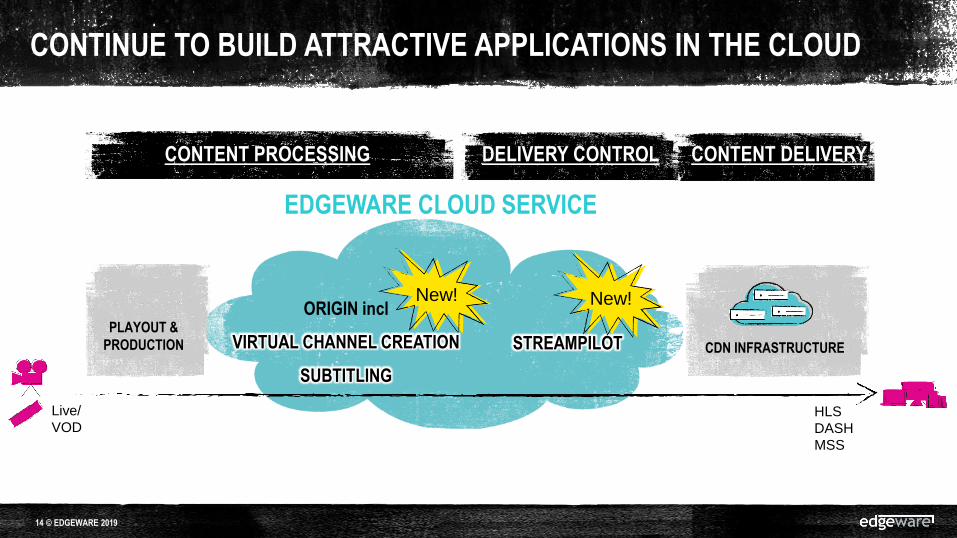
CONTINUE TO BUILD ATTRACTIVE APPLICATIONS IN THE CLOUD
CONTENT PROCESSING
PLAYOUT &
PRODUCTION
DELIVERY CONTROL
CDN INFRASTRUCTURE
CONTENT DELIVERY
HLS
DASH
MSS
Live/
VOD
STREAMPILOT
New! New!
EDGEWARE CLOUD SERVICE
ORIGIN incl
VIRTUAL CHANNEL CREATION
SUBTITLING

STRATEGY

16 © EDGEWARE 2019
THE MARKET PLAYERS
Content Owners
Telcos Cable Operators CDN Service Providers
End-Users
Netw
ork
ow
ner
Conte
nt
Ow
ner
17 © EDGEWARE 2019
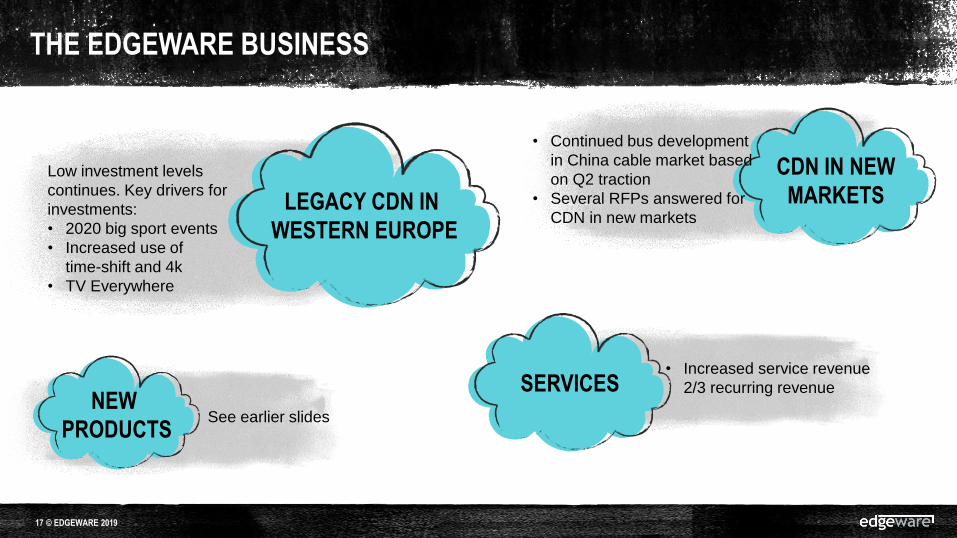
THE EDGEWARE BUSINESS
LEGACY CDN IN
WESTERN EUROPE
CDN IN NEW
MARKETS
SERVICESNEW
PRODUCTS
• Increased service revenue
2/3 recurring revenue
• Continued bus development
in China cable market based
on Q2 traction
• Several RFPs answered for
CDN in new markets
Low investment levels
continues. Key drivers for
investments:
• 2020 big sport events
• Increased use of
time-shift and 4k
• TV Everywhere
See earlier slides
18 © EDGEWARE 2019
AGENDA Q3 PRESENTATION
1. Results & highlights Q3
2. Financials in depth
3. Summary
19 © EDGEWARE 2019
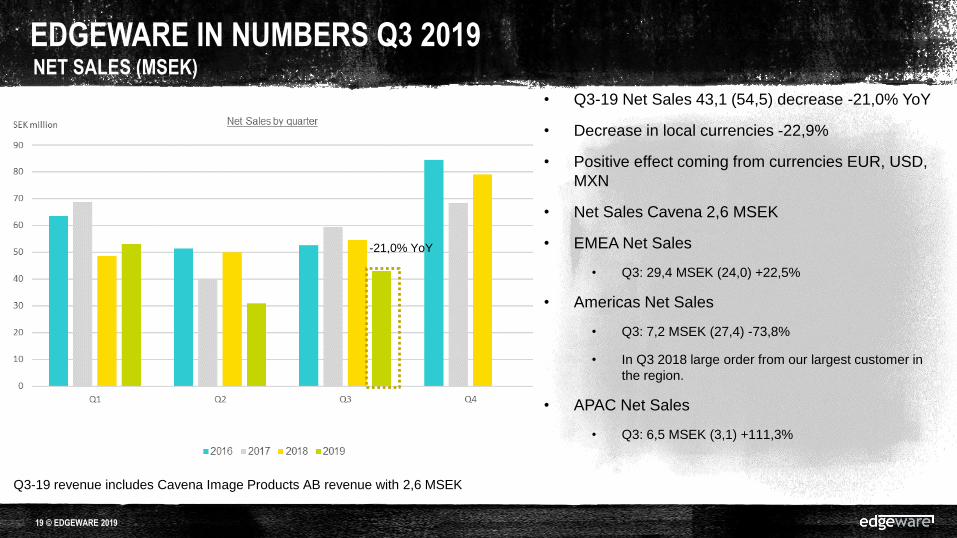
NET SALES (MSEK)
EDGEWARE IN NUMBERS Q3 2019
• Q3-19 Net Sales 43,1 (54,5) decrease -21,0% YoY
• Decrease in local currencies -22,9%
• Positive effect coming from currencies EUR, USD,
MXN
• Net Sales Cavena 2,6 MSEK
• EMEA Net Sales
• Q3: 29,4 MSEK (24,0) +22,5%
• Americas Net Sales
• Q3: 7,2 MSEK (27,4) -73,8%
• In Q3 2018 large order from our largest customer in
the region.
• APAC Net Sales
• Q3: 6,5 MSEK (3,1) +111,3%
Q3-19 revenue includes Cavena Image Products AB revenue with 2,6 MSEK
-21,0% YoY
20 © EDGEWARE 2019
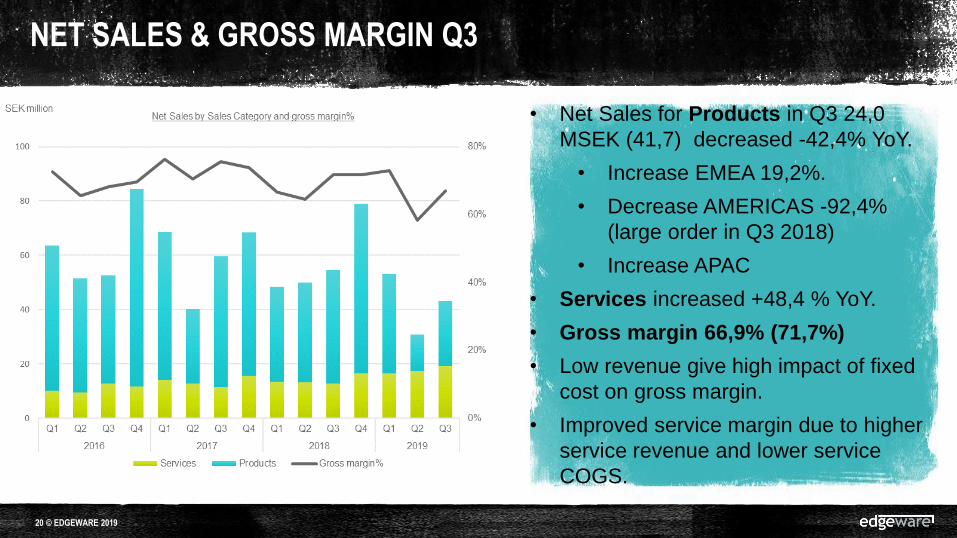
NET SALES & GROSS MARGIN Q3
• Net Sales for Products in Q3 24,0
MSEK (41,7) decreased -42,4% YoY.
• Increase EMEA 19,2%.
• Decrease AMERICAS -92,4%
(large order in Q3 2018)
• Increase APAC
• Services increased +48,4 % YoY.
• Gross margin 66,9% (71,7%)
• Low revenue give high impact of fixed
cost on gross margin.
• Improved service margin due to higher
service revenue and lower service
COGS.

21 © EDGEWARE 2019
EBIT AND EBIT MARGIN Q3*EBIT 2016 HAS BEEN ADJUSTED FOR COSTS RELATED TO THE IPO. NO ADJUSTMENTS DONE 2017-2019.
• EBIT loss of 3,6 MSEK due to low sales in
Q3.
• EBIT margin -8,3%.
• Non-recurring restructuring expenses of
SEK 2.9 million (0) for further efficiency in
the sales organisation.
• Implemented cost reduction show an
OPEX reduction of -3,7 MSEK YoY.
• decrease 13,9% (excl Cavena).
• Total number of employees end of Q3 was
99 of which 7 Cavena employees (101).

22 © EDGEWARE 2019
BALANCE SHEET AND CASH FLOW
• Strong balance sheet, equity ratio 77,2% (74,4% Dec-18).
• Balance sheet increased with 9,5 MSEK right-to-use assets and lease liabilities IFRS 16.
• Capitalized expenditure Q3: 14,4% (38,2%) Q1-Q3: 17,2% (22,3%) of gross R&D.
• Net impact EBIT from R&D capitalization/amortization Q3: -0,7 MSEK (2,7), Q1-Q3: 0,7 MSEK (3,2).
• Cash position/Current investment 150,0 MSEK (168,0 Dec-18).
• No loans or interest-bearing debt.
• Cash flow for the period 2,0 MSEK (7,0)
• Cash flow for first nine months effected by paid out 9 MSEK for acquisition of Cavena in Q1.
EDGEWAREQ3
2019
Q3
2018Q1-Q3 2019 Q1-Q3 2018
Full year
2018
Total Assets 282,3 291,9 282,3 291,9 319,9
Capitalized expenditure R&D 23,4 23,1 23,4 23,1 22,7
Equity 218,0 228,0 218,0 228,0 238,1
Equity Ratio 77,2% 78,1% 77,2% 78,1% 74,4%
Net Cash & Current investment 150,0 151,8 150,0 151,8 168,0
Cash flow from operating activities 5,9 13,0 5,9 -8,8 +11,6
Cash flow for the period 2,0 7,0 -18,6 -21,6 -4,9

23 © EDGEWARE 2019
AGENDA Q3 PRESENTATION
1. Results & highlights Q3
2. Financials in depth
3. Summary

24 © EDGEWARE 2019
Q3 2019 IN SUMMARY
• Continued low investment levels with our large customers in
Western Europe
• Great interest in our new StreamPilot platform launched at IBC in
Amsterdam
• Continued efficiency measures in addition to the OPEX cuts done
over the last 12 months
– Sales closer to HQ and support functions
• Strong growth of services business
• The low business volumes with our largest customers in Western
Europe is expected to continue into fourth quarter 2019 as well.

THANK YOU!Q4 REPORT TO BE PRESENTED JANUARY 24, 2020