Embed Size (px)
Citation preview
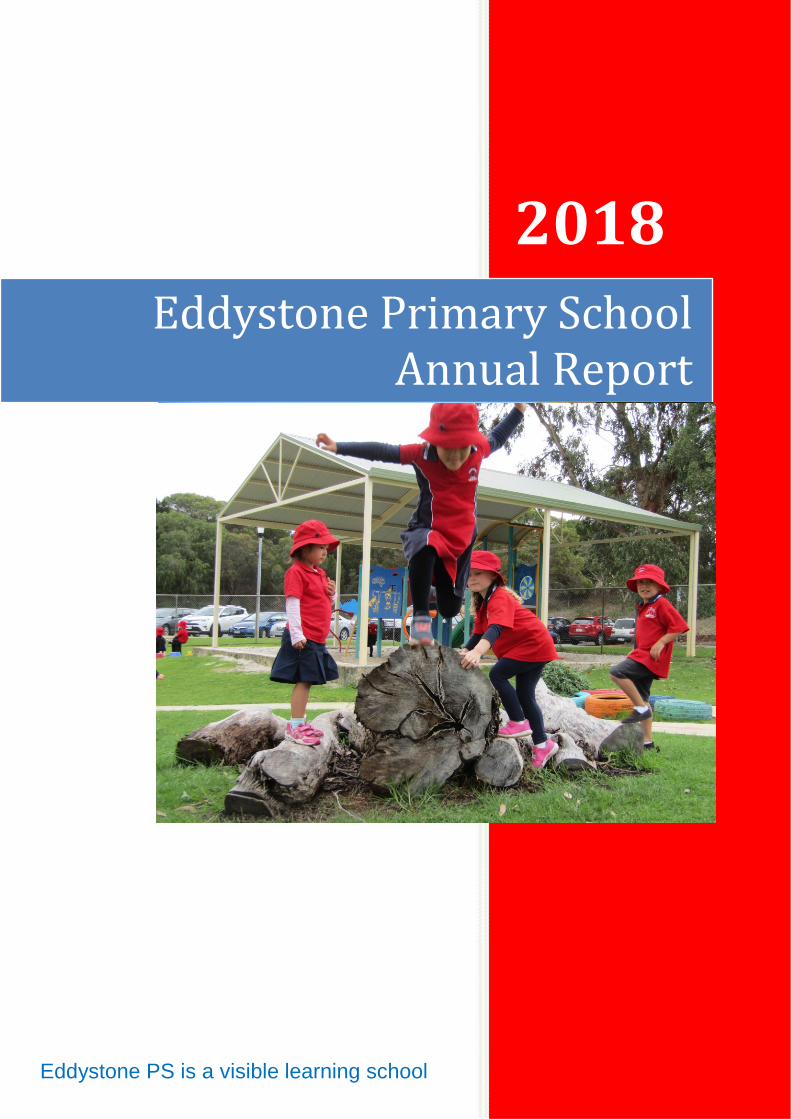
2018
Eddystone Primary School Annual Report
Eddystone PS is a visible learning school
The 2018 Annual Report articulates the dynamic and diverse nature of our school, the success of our students and staff, and our commitment to engage with our community in our pursuit of achievement and progress across all levels. The school has demonstrated a commitment towards self-improvement and self-reflection to have students always at the centre of our planning.
2018 was the last year of a 3-year Strategic Plan which, in developing, utilised the National School Improvement Tool. This document provided an evidence based framework for reflecting on our school processes. Using this tool and the associated 9 domains addressed the elements of a quality school. We embedded these evidence based domains across the levels of school planning; especially with our strategic and operational plans. The strategic plan outlines our focus areas, strategies and quantitative targets. Our operational plans outlines our 12-month commitment to addressing the pedagogy, programs and assessment delivered to students in the classroom. This approach by the school was essential to have students at the centre of our planning, and was a drive for improvement.
We are proud of our rich and diverse student population. Hosting an Intensive English Centre, we are a beacon of excellence in catering for students of English as an Additional Language. Students enrolled in the Intensive English Centre Program come from countries within Africa, Asia, Europe, Middle East and South America. Students may have been born in Australia, or may have come from migrant or refugee backgrounds and bring with them a diverse range of languages and different cultures of the world. The school community values and welcomes students and their families from culturally and linguistically diverse (CALD) backgrounds and endeavours to build positive relationships with families who are new to the school.
Eddystone Primary School has a clear vision and purpose, focused on excellence in teaching and learning. Through our motto, ‘Achieving’, we aim to provide the best possible education for each student, ensuring they develop a broad range of skills to enable them to take responsibility for their own direction and to adapt to a changing world.
Our Vision
To promote a positive school community which encourages students to embrace change and challenges while providing the opportunity for personal, social, emotional well-being and academic excellence.
Our Purpose
We implement evidence-based practice in our teaching and learning
We inspire students to strive for excellence in order to prepare them to be successful in the 21st century.
We provide a learning environment that is safe, positive and supportive.
We provide an inclusive and differentiated curriculum.
We initiate partnerships and provide opportunities to engage meaningfully with the community.
We commit to professional learning and the development of staff to build an expert teaching team.
Highlights 2018
Professional Learning Communities We included collaborative meetings as a critical element in our staff meetings. All meetings had a clear focus on staff improvement strategies to support our agenda of improving student achievement in all learning areas. Staff engaged in analysing student data, planning for improvement and ensuring a whole school approach to teaching and learning and assessment, particularly in English and Mathematics.
Leadership Capacity Building We invested into the building of leadership with opportunities for teachers to participate as a Professional Learning Community leader which gave them the experience to contribute actively as a member of the School Improvement Committee. Opportunities existed for aspirants to fill Deputy and Principal roles for extended periods in 2018.
We also supported teachers to develop leadership in ICT and STEM by supporting professional learning opportunities in these areas. Leadership in literacy and numeracy continued in 2018.
Positive Behaviour Support Program The PBS program continues to be further developed and acknowledged throughout our community for its positive reinforcement of behaviour expectations across the school. Our end of year reward day saw over 80% of students meet the criteria for participation.
IPad Technology We completed the purchasing of tablets and laptops with the support of the DoE one-to-one funding initiative. Each teacher has been provided with an ipad to build their capacity. We now have in excess of 25 devices per block. In 2018 we implemented a bank of laptops – as part of a replacement of desktop computers. This implementation ensures that students have access to a wide variety of technology devices, and will enable them to complete NAPLAN online in 2019. We will continue to provide professional learning to teachers in 2019 as we embed the use of digital technology across the school.
Visible Learning We continued professional learning into the principles of visible learning and assessment capable students based on Professor John Hattie’s research. In 2018 the school focused on goal setting, learning intentions and success criteria. We also addressed the solo taxonomy and giving effective feedback to students. Visible learning will continue in our strategic planning as we further develop assessment capable students. We will continue to embed our 6 learning dispositions that provide students a positive mindset in their learning. Data has given the school direction to continue our journey into visible learning.
Digital Technology and STEM A focus in the area of science and technology continued where teachers provided opportunities to develop coding, robotics and digital technology in a range of challenges to extend inquiry and problem solving skills. Further the SCOPE IT program was introduced to develop digital technology. All classes in the school participated.
To further develop our STEM program a group of teachers visited and observed classes from the Teacher Development School in STEM – using the instructional rounds observation strategy. These teachers reported back to the whole staff providing suggestions on how to further develop STEM in our school – which included an outline of the technology process for STEM and the importance of having a STEM resource room.
Community and Environmental Awareness At Eddystone PS we believe it is important to connect with our community and to be positively aware of environmental issues. We developed sustainable environmental programs in recycling and vegetable growing. We also organised Granny Spiers donations for families in need and developed student voice roles in our student councillors to develop their leadership in a variety of portfolios at school and at the community level.
Sense of Community Project (SOC)
Throughout 2018, a number of events were organised to build a sense of community. These have been coordinated and managed by a committee. Community events were planned at the beginning of the year.
Community events include;
Community BBQ Term 1, week 3 after the parent - teacher meetings. All who attended were given a free sausage sizzle and drink and had the opportunity to participate in games organised in the playground. The attendance rate at this event was higher compared to other years. It started the year positively with the parents.
In Term 2 we hosted a WA Day picnic at school. Parents were able to celebrate WA week with a picnic lunch with their children on the school oval. With our diverse multi- cultural student population, it brought together many families celebrating WA Week in harmony.
Term 3 saw Literacy and Numeracy week and the BFG, the big friendly gathering. Students and parents took part in swapping books and then joined together to have a picnic lunch.
Finally, the community warmed up their voices with the Carols by Twilight evening in Term 4.
Other highlights from 2018 include: Massed Choir Festival
Performance at the Joondalup Council Chambers.
Student Councillors Parliament House Luncheon
ANZAC Day Ceremony
Constable Care Incursion
Literacy/Numeracy Week
Learning Journey
Reporting to Parents Conference
Book Parade
Granny Spiers Bed Time Bundles
Harmony Day
No Way Bullying Day
Facebook Page
Community events were also connected with the school’s sports program administered by our Physical Education Specialist. Parents were invited as spectators, which included the winter carnivals, the faction athletics carnival and the interschool athletics carnivals organised by Eddystone PS. Sporting clubs also participated in our school by providing activities for the children. Some of these clubs were: The Ocean Reef Football Club; the West Perth Falcons (AFL) for girls; the West Coast Eagles (AFL); Golf WA; Rugby League WA; Western Force (Rugby Union); and the Whitfords Hockey Club.
Directions for 2019
Continue building community events and aspiring for more parent attendance.
Work with staff to build calendar of events that allow whole school involvement but limiting impact on time out of the classroom.
Promote, share and celebrate school success and stories through our Facebook page to attract a wider audience and build community
support.
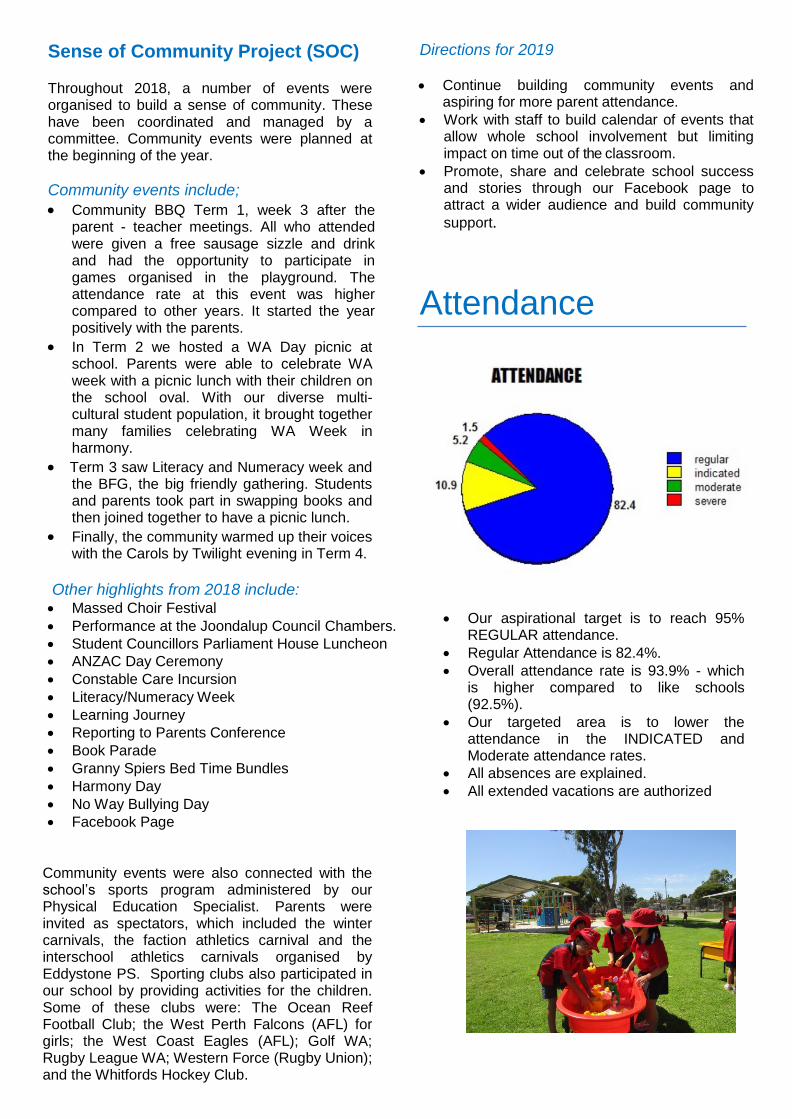
Attendance
Our aspirational target is to reach 95% REGULAR attendance.
Regular Attendance is 82.4%.
Overall attendance rate is 93.9% - which is higher compared to like schools (92.5%).
Our targeted area is to lower the attendance in the INDICATED and Moderate attendance rates.
All absences are explained.
All extended vacations are authorized
NAPLAN
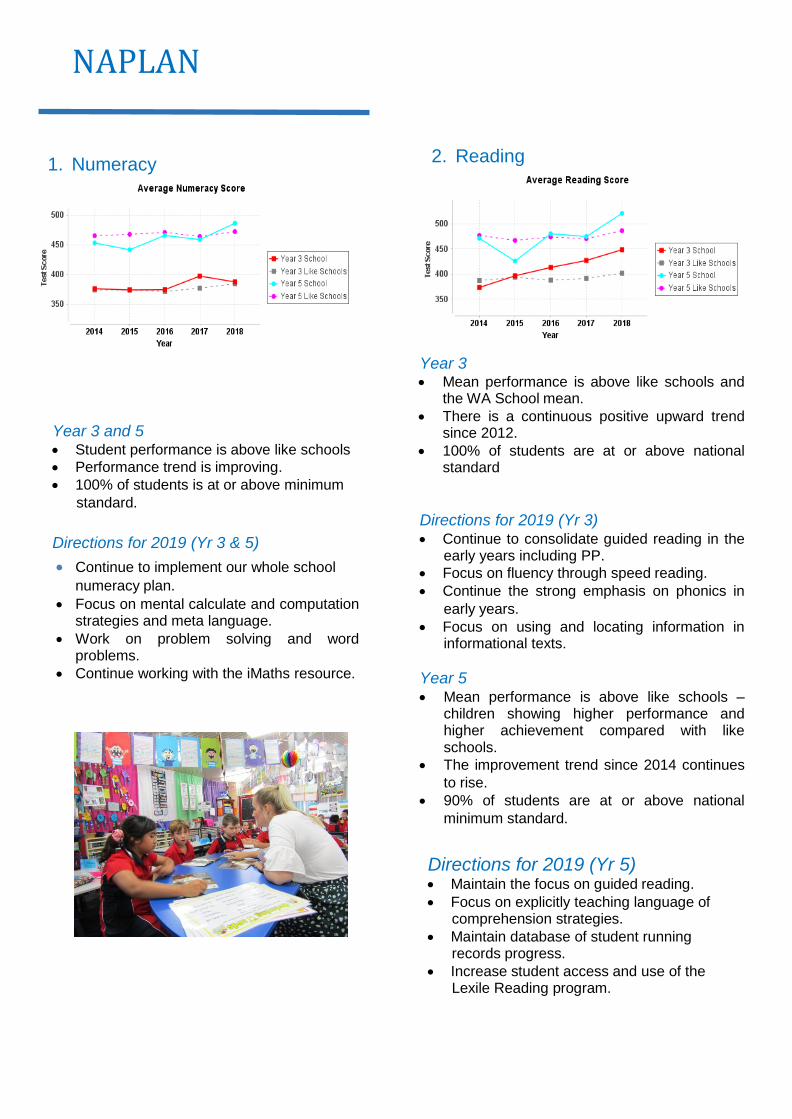
Year 3 and 5 Student performance is above like schools
Performance trend is improving.
100% of students is at or above minimum
standard.
Directions for 2019 (Yr 3 & 5)
Continue to implement our whole school
numeracy plan. Focus on mental calculate and computation
strategies and meta language.
Work on problem solving and word problems.
Continue working with the iMaths resource.
Year 3 Mean performance is above like schools and
the WA School mean.
There is a continuous positive upward trend since 2012.
100% of students are at or above national standard
Directions for 2019 (Yr 3) Continue to consolidate guided reading in the
early years including PP.
Focus on fluency through speed reading.
Continue the strong emphasis on phonics in
early years.
Focus on using and locating information in informational texts.
Year 5 Mean performance is above like schools –
children showing higher performance and higher achievement compared with like schools.
The improvement trend since 2014 continues
to rise.
90% of students are at or above national
minimum standard.
1. Numeracy
2. Reading
Directions for 2019 (Yr 5) Maintain the focus on guided reading.
Focus on explicitly teaching language of comprehension strategies.
Maintain database of student running records progress.
Increase student access and use of the Lexile Reading program.
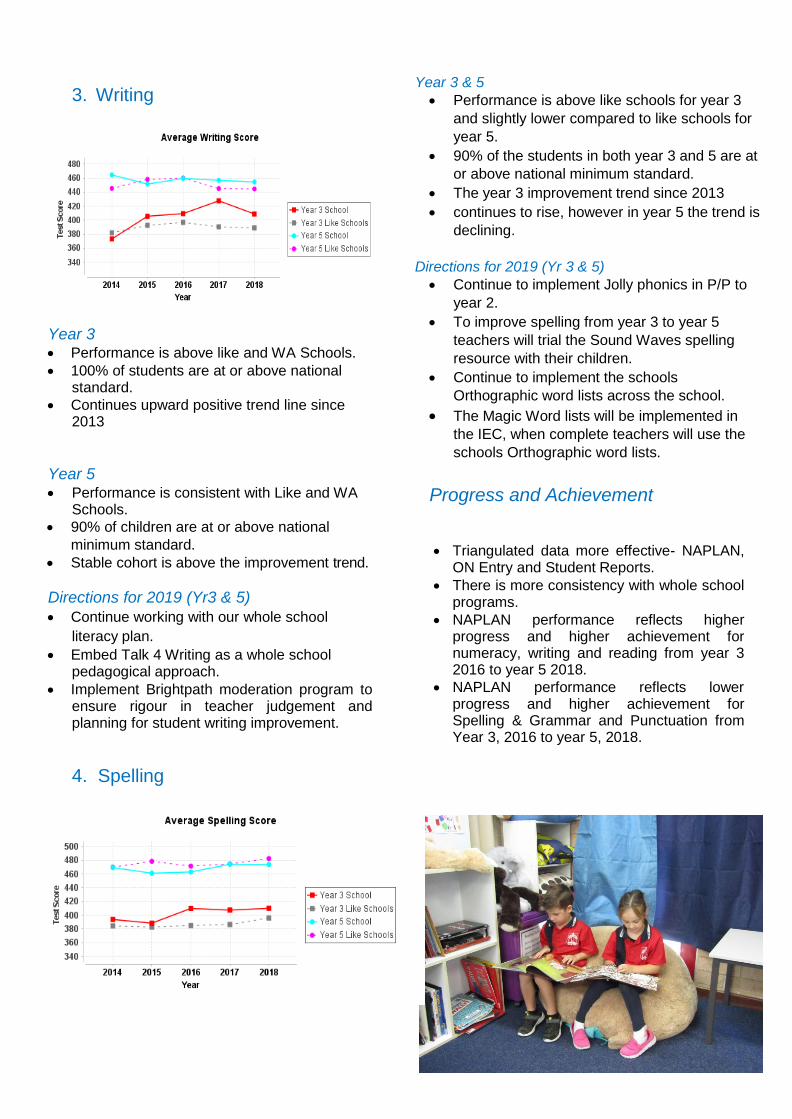
3. Writing
Year 3 Performance is above like and WA Schools.
100% of students are at or above national standard.
Continues upward positive trend line since 2013
Year 5 Performance is consistent with Like and WA
Schools.
90% of children are at or above national
minimum standard.
Stable cohort is above the improvement trend.
Directions for 2019 (Yr3 & 5)
Continue working with our whole school
literacy plan.
Embed Talk 4 Writing as a whole school pedagogical approach.
Implement Brightpath moderation program to ensure rigour in teacher judgement and planning for student writing improvement.
4. Spelling
Year 3 & 5
Performance is above like schools for year 3
and slightly lower compared to like schools for
year 5.
90% of the students in both year 3 and 5 are at
or above national minimum standard.
The year 3 improvement trend since 2013
continues to rise, however in year 5 the trend is
declining.
Directions for 2019 (Yr 3 & 5)
Continue to implement Jolly phonics in P/P to
year 2.
To improve spelling from year 3 to year 5
teachers will trial the Sound Waves spelling
resource with their children.
Continue to implement the schools
Orthographic word lists across the school.
The Magic Word lists will be implemented in
the IEC, when complete teachers will use the
schools Orthographic word lists.
Progress and Achievement
Triangulated data more effective- NAPLAN, ON Entry and Student Reports.
There is more consistency with whole school programs.
NAPLAN performance reflects higher progress and higher achievement for numeracy, writing and reading from year 3 2016 to year 5 2018.
NAPLAN performance reflects lower progress and higher achievement for Spelling & Grammar and Punctuation from Year 3, 2016 to year 5, 2018.
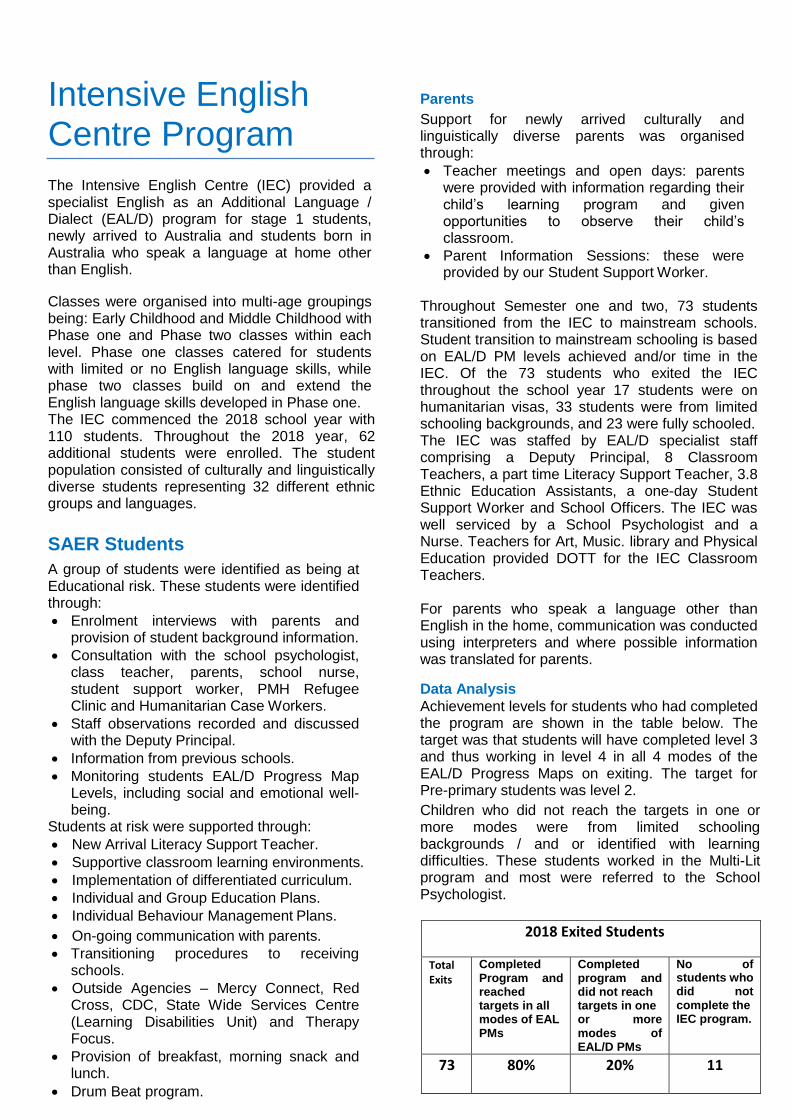
Intensive English Centre Program
The Intensive English Centre (IEC) provided a specialist English as an Additional Language / Dialect (EAL/D) program for stage 1 students, newly arrived to Australia and students born in Australia who speak a language at home other than English.
Classes were organised into multi-age groupings being: Early Childhood and Middle Childhood with Phase one and Phase two classes within each level. Phase one classes catered for students with limited or no English language skills, while phase two classes build on and extend the English language skills developed in Phase one. The IEC commenced the 2018 school year with 110 students. Throughout the 2018 year, 62 additional students were enrolled. The student population consisted of culturally and linguistically diverse students representing 32 different ethnic groups and languages.
SAER Students
A group of students were identified as being at Educational risk. These students were identified through:
Enrolment interviews with parents and provision of student background information.
Consultation with the school psychologist, class teacher, parents, school nurse, student support worker, PMH Refugee Clinic and Humanitarian Case Workers.
Staff observations recorded and discussed with the Deputy Principal.
Information from previous schools.
Monitoring students EAL/D Progress Map Levels, including social and emotional well-being.
Students at risk were supported through:
New Arrival Literacy Support Teacher.
Supportive classroom learning environments.
Implementation of differentiated curriculum.
Individual and Group Education Plans.
Individual Behaviour Management Plans.
On-going communication with parents.
Transitioning procedures to receiving schools.
Outside Agencies – Mercy Connect, Red Cross, CDC, State Wide Services Centre (Learning Disabilities Unit) and Therapy Focus.
Provision of breakfast, morning snack and lunch.
Drum Beat program.
Parents
Support for newly arrived culturally and linguistically diverse parents was organised through:
Teacher meetings and open days: parents were provided with information regarding their child’s learning program and given opportunities to observe their child’s classroom.
Parent Information Sessions: these were provided by our Student Support Worker.
Throughout Semester one and two, 73 students transitioned from the IEC to mainstream schools. Student transition to mainstream schooling is based on EAL/D PM levels achieved and/or time in the IEC. Of the 73 students who exited the IEC throughout the school year 17 students were on humanitarian visas, 33 students were from limited schooling backgrounds, and 23 were fully schooled. The IEC was staffed by EAL/D specialist staff comprising a Deputy Principal, 8 Classroom Teachers, a part time Literacy Support Teacher, 3.8 Ethnic Education Assistants, a one-day Student Support Worker and School Officers. The IEC was well serviced by a School Psychologist and a Nurse. Teachers for Art, Music. library and Physical Education provided DOTT for the IEC Classroom Teachers. For parents who speak a language other than English in the home, communication was conducted using interpreters and where possible information was translated for parents.
Data Analysis
Achievement levels for students who had completed the program are shown in the table below. The target was that students will have completed level 3 and thus working in level 4 in all 4 modes of the EAL/D Progress Maps on exiting. The target for Pre-primary students was level 2.
Children who did not reach the targets in one or more modes were from limited schooling backgrounds / and or identified with learning difficulties. These students worked in the Multi-Lit program and most were referred to the School Psychologist.
2018 Exited Students
Total Exits
Completed Program and reached targets in all modes of EAL PMs
Completed program and did not reach targets in one or more modes of EAL/D PMs
No of students who did not complete the IEC program.
73 80% 20% 11
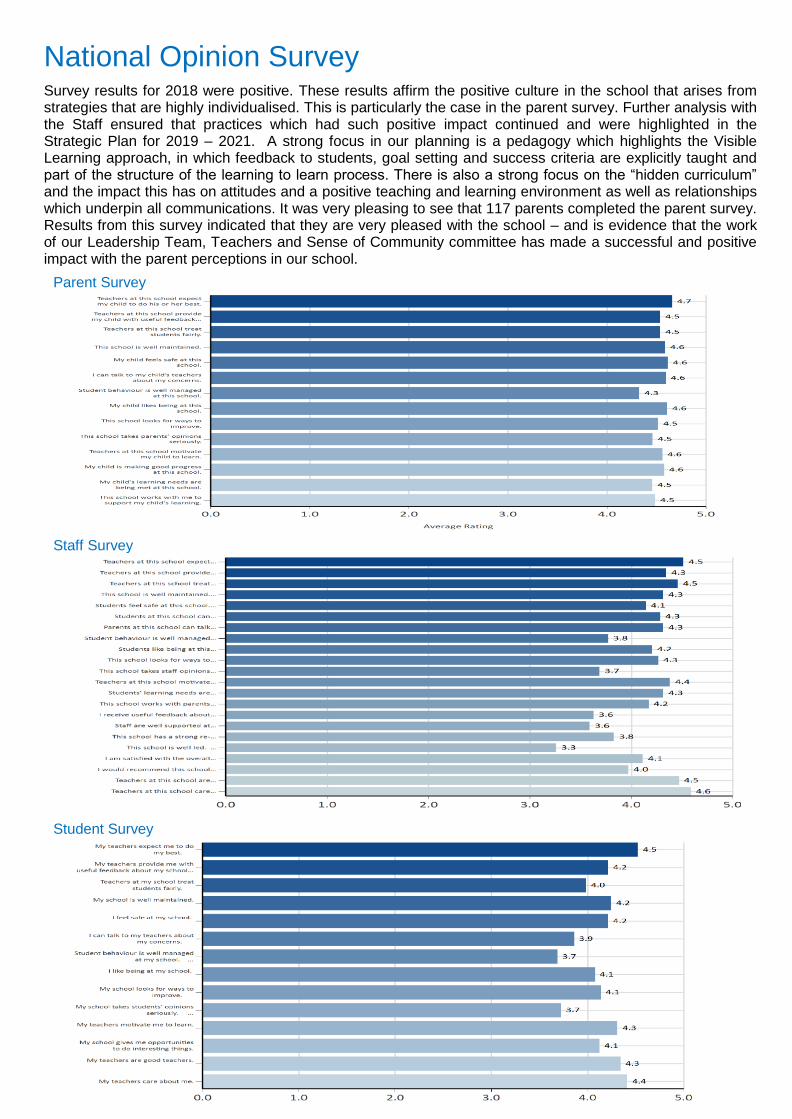
National Opinion Survey
Survey results for 2018 were positive. These results affirm the positive culture in the school that arises from strategies that are highly individualised. This is particularly the case in the parent survey. Further analysis with the Staff ensured that practices which had such positive impact continued and were highlighted in the Strategic Plan for 2019 – 2021. A strong focus in our planning is a pedagogy which highlights the Visible Learning approach, in which feedback to students, goal setting and success criteria are explicitly taught and part of the structure of the learning to learn process. There is also a strong focus on the “hidden curriculum” and the impact this has on attitudes and a positive teaching and learning environment as well as relationships which underpin all communications. It was very pleasing to see that 117 parents completed the parent survey. Results from this survey indicated that they are very pleased with the school – and is evidence that the work of our Leadership Team, Teachers and Sense of Community committee has made a successful and positive impact with the parent perceptions in our school.
Staff Survey
Parent Survey
Student Survey
1 9,137.00$ 9,007.00$
2 55,095.83$ 55,015.83$
3 -$ 203.61$
4 5,541.20$ 6,323.40$
5 1,489.12$ 1,489.12$
6 1,100.00$ 1,100.00$
7 2,556.83$ 1,526.83$
8 34,419.67$ 36,604.51$
9 -$ -$
10 -$ -$
11 Farm Revenue (Ag and Farm Schools only) -$ -$
12 -$ -$
109,339.65$ 111,270.30$
124,971.79$ 124,971.79$
Student Centred Funding 384,283.46$ 384,283.46$
618,594.90$ 620,525.55$
-$ -$
618,594.90$ 620,525.55$
Locally Raised Funds70,549.84$
Student Centred Funding384,283.46$
Other Govt Grants 4,115.95$
Other 36,604.51$
Transfers from Reserves -$
495,553.76$
1 52,351.43$ 27,428.67$
2 -$ -$
3 140,900.00$ 134,500.61$
4 143,531.78$ 114,151.81$
5 143,027.57$ 125,489.26$
6 46,030.00$ 26,618.74$
7 44,685.00$ 44,685.00$
8 11,910.98$ 8,227.36$
9 40.00$ 40.00$
10 -$ -$
11 -$ -$
12 Farm Operations (Ag and Farm Schools only) -$ -$
13 Farm Revenue to CO (Ag and Farm Schools only) -$ -$
14 Camp School Fees to CO (Camp Schools only) -$ -$
582,476.76$ 481,141.45$
-$ -$
582,476.76$ 481,141.45$
36,118.14$
Bank Balance 444,453.83$ Made up of: -$
1 General Fund Balance 139,384.10$ 2 Deductible Gift Funds -$ 3 Trust Funds -$ 4 Asset Replacement Reserves 305,092.82$ 5 Suspense Accounts 2,931.91$ 6 Cash Advances 200.00-$ 7 Tax Position 2,755.00-$
444,453.83$ Total Bank Balance
Cash Position as at:
Residential Boarding Fees to CO (Ag Colleges only)
Cash Budget Variance
Total Forecast Salary Expenditure
Total Expenditure
Total Goods and Services Expenditure
Other Expenditure
Buildings, Property and Equipment
Curriculum and Student Services
Total Salary Allocation
Total Funds Available
ActualBudget
Residential Operations
Total Locally Raised Funds
Fundraising/Donations/Sponsorships
Opening Balance
Total Cash Funds Available
Camp School Fees (Camp Schools only)
Expenditure - Cash and Salary
Payment to CO, Regional Office and Other Schools
Administration
Lease Payments
Utilities, Facilities and Maintenance
Professional Development
Transfer to Reserve
Transfer from Reserve or DGR
Residential Accommodation
Other State Govt/Local Govt Revenues
Revenue from Co, Regional Office and Other Schools
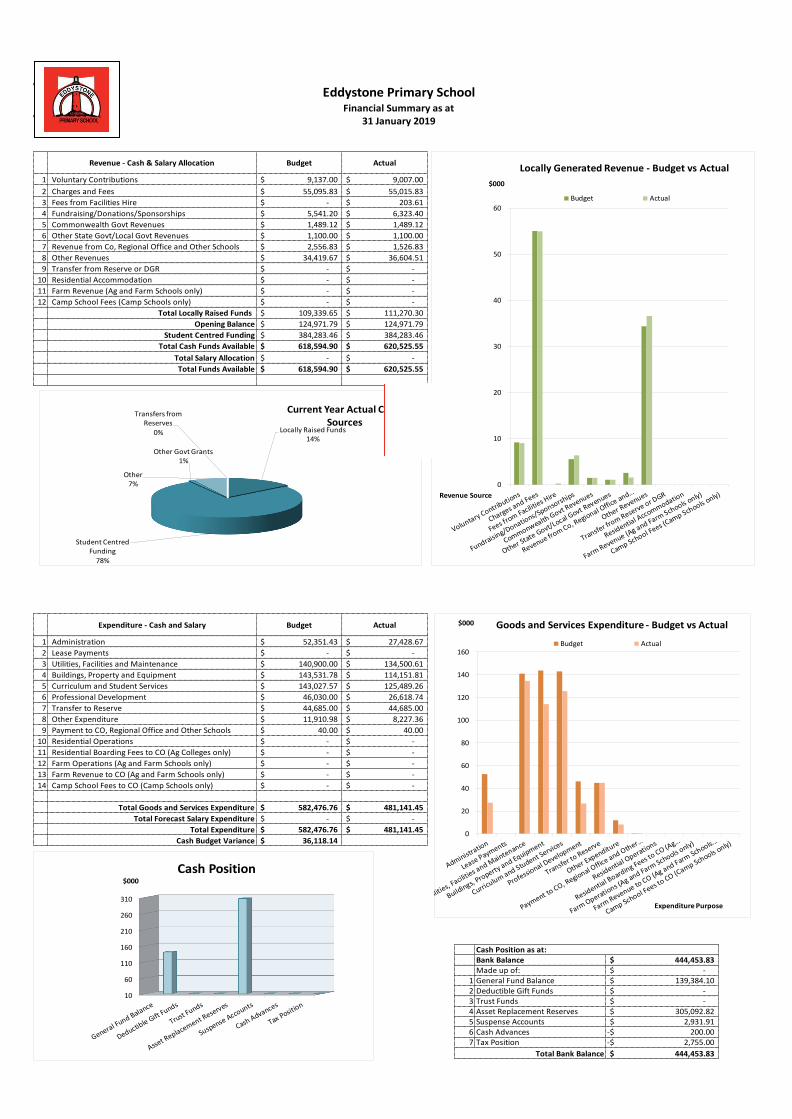
Eddystone Primary SchoolFinancial Summary as at
Actual
31 January 2019
Other Revenues
Commonwealth Govt Revenues
BudgetRevenue - Cash & Salary Allocation
Voluntary Contributions
Charges and Fees
Fees from Facilities Hire
0
10
20
30
40
50
60
$000
Revenue Source
Locally Generated Revenue - Budget vs Actual
Budget Actual
Locally Raised Funds14%
Student Centred Funding
78%
Other Govt Grants1%
Other 7%
Transfers from Reserves
0%
Current Year Actual CashSources
0
20
40
60
80
100
120
140
160
$000
Expenditure Purpose
Goods and Services Expenditure - Budget vs Actual
Budget Actual
10
60
110
160
210
260
310
$000
Cash Position
Insert your School Logo Here or Delete if not
required