Embed Size (px)
Citation preview
DOCUMENT RESUME
ED 330 564 SE 052 074
TITLE The State of Mathematics Achievement in Maryland: TheTrial State Assessment at Grade Eight.
INSTITUTION Educational Testing Service, Princeton, N.J.;Nat.'-onal Assessment of Educational Progress,
Princeton, NJ.
SPONS AGENCY National Center for Education Statistics (ED),Washington, DC.
REPORT NO ETS-21-ST-02; ISBN-0-88685-14-9PUB DATE Jun 91
NOTE 146p.; The entire Report consists of a compositereport, an executive summary, and 40 separate reportsfor 37 states, DC, Guam, and the Virgin Islands,respectively; see SE 052 055-096.
AVAILABLE FROM Individual state reports are available directly fromthe assessment division of the appropriate StateDepartment of Education.
PUB TYPE Statistical Data (110) -- Reports -Research/Technical (143)
EDRS PRICE MF01/PC06 Plus Po"tage.DESCRIPTORS Academic Achievement; Calculators; *Educational
Assessment; Family Environment; *Grade 8; Homework;Junior High Schools; *Mathematics Achievement;Mathematics Instruction; Mathematics Skills;Ma:_hematics Tests; National Programs; ProtlemSolving; Public Schools; *State Programs; StudentAttitudes; Teacher Attitudes; Teacher Qualifications;Television Viewing
IDENTIFIERS *Maryland; National Assessment of EducationalProgress; *Numeracy; State Mathematics Assessments;Trial State Assessment (NAEP)
ABSTRACTIn 1990, the National Assessment of Educational
?rogress (NAEP) included a Trial State Assessment (TSA); for thefirst time in the NAEP's history, voluntary state-by-statassessments (37 states, the District of Columbia, Guam, and theVirgin Islands) were made. The sample was designed to represent the8th grade public school population in a state or territory. The 1990TSA covered five mathematics content areas (numbers and operations;measurement; geometry; data analysis, statistics, and probability;and algebra and functions). In Maryland, 2,794 students in 105 publicschools were assessed. This report describes th mathematicsproficiency of Maryland eighth-graders, compares their overallperformance to students in the Northeast region of the United Statesand the nation (using data from the NAEP national assessments),presents the average proficiency separately for the five contentareas, and summarizes the performance of subpopulations(race/ethnicity, type of community, parents' educational level, andgender). To provide a context for the assessment data, participatingstudents, their mathematics teachers, and principals completedquestionnaires which focused on: instructional content (curriculamcoverage, amount of homework); delivery of mach instruction(availability of resources, type); use of calculators; educationalbackground of teachers; and conditions facilitating math leirning(e.g., hours of television watched, atsenteeism). On the'NAEP mathscale, Maryland students had an average Proficiency of 281-1-tomparedto 261 nationwide. Many fewer students (Maryland-14%; U.S.-12%)'--appear to have acquired reasoning and problem solving skills.(JJK/CRW)
NATIONAL CENTER FOR EDUCATION STATISTICS
The STATE ofMathematicsAWevement
in MARYLANDThe Trial State Assessment at Grade Eight
ron WLAiE
U S DEPARTMENT OF EDUCATION
OP, p 00 E .11001at Reser( r, AN1 I mprovemer01
CA TIONAL RE SOURCE,S INF ORMAT IONCE NTIT4 E RIC)
has Dern reptotlut ed as,ece,e.A I,orys te perscr, of of ganipt.op
or ,gmatng .1
M,rlor hangp% pavp twen PladP 00,P0'00,1.
00,c1,on
P,,,nis ot ,e or 0101NonSSIAlpti MINS LUX u
meni dC0 not rle,,e$saf000( ,eloresew otfir.,a1
Ok. HI pt,I r ve,hry
Prepared by Educational Testing Service under Contract with the National Center for Education StatisticsOffice of Educational Research and Improvement U.S Department of Education

What is The Nation's Report Card?
THE NATION'S REPORT CARD, the National Assessment of Educational Progress (NAEP), is the only nationally representative andcontinuing assessment of what America's students know and can do in various subject areias. Since 1989, assessments have been conducted
periodically in reading, mathematics, science, writing. history/geography. and other fields. By making objective information on studentperformance available to policymakers at the national, state, and local levels. NAEP is an integral pan of our nation's evaluation of thecondition and progress of education. Only information related to academic achievement is collected under this program. NAEP guarantees
the privacy of individual students and their families.
NAEP is a congressionally mandated project of the National Center for Education Statistics, the U.S. Department of Education. TheCommissioner of Education Statistics is responsible. by law. for canying out the NAEP project through competitive awards to qualifiedorganizations NAEP reports directly to the Commissioner, who is also responsible for providing continuing reviews, including validation
studies and solicitation of public comment. on NAEP's conduct and usefulness.
In 1988, Congress created the National Assessment Governing Board (NAGB) to formulate policy guidelines for NAEP. The board is
responsible for selecting the subject areas to be assessed. which may include adding to those specified by Congress; identifying appropriateachievement goals for each age and grade; developing assessment objectives: developing test specifications: designing the assessmentmethodology: developing guidelines and standards for data analysis and for reporting and disseminating results; developing standards and
procedures for interstate, regional, and national comparisons: improving the form and use of the National Assessment; and ensuring that all
items selected for use in the National Assessment are fret from racial, cultural, gender. or regional bias,
The National Assessment Governing Board
Richard A. Boyd, ChairmanExecutive DirectorMartha Holden Jennings FoundationCleveland, Ohio
Phyllis Williamson AldrichCurriculum CoordinatorSaratoga-Warren B4O.C.E.S.Saratoga Springs, New York
Franck AlexanderAssociate SuperintendentCalifornia Department of Educat onSacramento. CalifOrnia
David P. BattiniHigh School History TeaeherCairo- Du,ham High SchoolCairo, New York
Parris C. BattleTeacherHorace Mann Eleraeritary SchoolMiami, Florida
Mary R. BlantonAttorneyCromwell, Porter. Blanton & BlantonSalisbury. North Carolina
Boyd W. BoehijeAttorneyGams, Klyn. & BochljePella, Iowa
Linda R. BryantTeacherGreenway Middle School Teacher CenterPittsburgh, Pennsylvania
Honorabk Mkhael N. CaMleGovernor of DelawareCarve! State Office BuildingWilmington, Delaware
Honorabk Naomi K. CohenState of ConnecticutHouse of RepresentativesLegislative Office BuildingHanford, Connecticut
Chester E. Finn, Jr.Professor of Education and Public PolicyVanderbilt UniversityWashington. D.C.
Mkharl S. GladeWyoming State Board of EducationSaratoga, Wyoming
Christine JohnsonPrincipalAbraham 1.incoln High SchoolDenver. Colorado
John LindleyPrincipalSouth Colby Elementary SchoolPort Orchard Washington
Carl J. MoserDirector of SchoolsThe Lutheran Church Missouri SynodInternational CenterSt. Louis, Missouri
Mark D. MusickPresident
Southern Regional Education BoardAtlanta, Georgia
Honorable Carolyn PollanArkansas House of Representatives
Eon Smith. Arkansas
Matthew W. Prophet, Jr.SuperintendentPortland Oregon School DistrictPortland. Oregon
Honorable William T. RandallCoinmissioner of EducationState Department of EducationDenver, Colorado
Dorothy K. RichPresidentHome and School InstituteSpecial Projects OfficeWashington, D.C.
Honorable Richard W. RileyAttorneyNelson, Mullins. Riley and
ScarboroughColumbia, South Carolina
Thomas TopuzesAttorneyLaw Offices of Frank RogoaienskiCoronado. California
Herbert i. WalbergProfessor of EducationUniversity of IllinoisChicago. Illinois
Assistant Secretary forEducational Research andImprovement (Ex-Officioi
U.S, Department of EducationWashington, D.C.
Roy TrubyExecutive Director, NAGBWashington. D.C,
NATIONAL CENTER FOR EDUCATION STATISTICS
The STATE ofMathematicsAchievement
in MARYLANDThe Trial State Aeseseament at Grade Eight
THE NATION'SREPORT
CARO
Report No 21-ST-02 June 1991
Prepared by Educational Testing Service under Contract with the National Center for Education StatisticsOffice of Educational Research and Improvement U.S. Department of Education
4
US. Department of EducationLamar AlexanderSecretary
Office of Educational Research and ImprovementBruno V. MannaActing Assistant Secretary
National Center for Education StatisticsEmerson J. ElliottActing Commissioner
FOR MORE INFORMATION:
Copies of the 1990 NAEP Trial State Assessment's individual State reports are available directly from the participatingStates. For ordering information, please contact the assessment division of your State Department of Education. Forordering information on the composite report of results for the Nation and all State participants, or for single copiesof the Executive Summary while supplies last, write:
Education Information BranchOffice of Educational Research and ImprovementU.S. Department of Education555 New Jersey Avenue, NWWashington, D.C. 20208-5641
or call 1-800-424-1616 (in the Washington, D.C. metropolitan area call 202-219-1651).
Library of Congress, Catalog Card Number: 91-61478
ISBN: 0-88685-14-9
The work upon which this publication is b.ased was performed for the National Center for Education Statistics,Office of Educational Researth snd Improvement. by Educational Testing Service.
Educational Testing Service is an equal opportunity/affirmative action employer.
Educational Testing Service, ETS, and a are registered trademarks of Educational Testing Service.
Table of Contents
EXECUTIVE SUMMARY
INTRODUCTION 7
Overview of the 1990 Trial State Assessment 8
This Report 9
Guidelines for Analysis 12
Profile of Maryland 14
EiglIth-Grade School and Student Characteristics 14
Schools and Students Assessed 15
PART ONEHow Proficient in Mathematics Are Eighth-Grade Students
in Maryland Public Schools? 17
Chapter I. Students' Mathematics Performance 18
Levels of Mathematics Proficiency. 19
Content Area Performance 19
Chapter 2. Mathematics Performance by Subpopulations
Race;Ethnicity
Type of Community 27
Parents' Education Level 29
Gender ;1
Content Area Performance
THE 1990 NAEP TRIAL STATE ASSFSSMENT 111

PART TWOFinding a Context for UnderstandingStudents' Mathematics Proficiency 37
Chapter 3. What Are Students Taught in Mathematics' 39
Curriculum Coverage 41
Mathematics Homework 42
Instructional Emphasis 45
Summary 48
Chapter 4. How Is Mathematics Instruction Delivered' 49
Availability of Resources 49
Patterns in Classroom Instruction 51
Collaborating in Small Groups 54
Using Mathematical Objects 55
Materials for Mathematics Instruction 56
Summary 59
Chapter S. How Are Calculators Used" 60
'Ile Availability of Calculators 62
The Use of Calculators 63
When To Use a Calculator 64
Summary 66
Chapter 6. Who Is Teaching Eighth-Grade Mathematics' 67
Iducational Background 68
Summar). 71
Chapter 7. The Conditions Beyond School that Fad !Rate Mathematics Learning and Teaching 73
Amount of Reading Materials in the Home 74
Hours of Televsion Watched per Day 75
Student Absenteeism 76
Students Perceptions of Mathematics 78
Summary. 79
PROCEDURAL APPENDIX 81
DATA APPENDIX 97
THE 1990 NAEP TRIAL STATE ASSESSMENT
Maryland
THE NATION'SREPORT
CARD
EXECUTIVE SUMMARY
In 1988, Congress passed new legislation for the National Assessment of Edi:..anonalProgress ( \AFT), which included -- for the firsi time in the project', history -- a provisionauthorizing voluntary state-by-state asssments on a trial basis, in addition to continuingits primary mission, the national ac...,:.,,:rients that NAL P has conducted since its inception.
As a result of the legislation, the 1990 NMI' program included a Trial State AssessmentProgram in eighth-grade mathematics. National assessments in mathematics, reading,
writing, and science were conducted simultaneously in 1990 at grades tour. eight, andtwelve.
For the Trial State Assessment, eighth-gade public-school students were assessed in eachof 37 states, the District of Columbia, and two territories in Februai-y 1990. The samplewas carefully designed to represent the eighth-gade public-school population in a state orterritory. Within each selected school, students were randomly chosen to participate in theprogam. Local school district personnel administered all assessment sessions, and thecontractor's staff monitored 50 percent uf the sessions as part of the quality assuranceprogram desigied to ensure that the sessions were being conducted uniformly. The resultsof the monitoring indicated a high degree of quality and uniformity across sessions.
THE 1990 NAB' TRIAL STATE ASSESSMENT 1
Maryland
In Maryland, 105 public schools participated in the assessment. The weighted school
participation rate was 100 pement, which means that all of the eighth-gade students in this
sample of schools were represertative of 100 percent of the eighth-grade public-school
students in Maryland.
In each school, a random sample of students was selected to participate in the assessment.
As estimated by the sample, 1 percent of the eighth-grade public-school population wasclassified as Limited English Proficient (LEP), while 10 percent had an Individualized
Education Plan (IFP). An IEP is a plan, written for a student who has been determined
to be eligible for special education, that typically sets forth goals and objectives for the
student and describes a program of activities andior related services necessary to achieve the
goals and objectives.
Schools were permitted to exclude certain students from the assessment. To be excluded
from the assessment, a student had to be categorized as limited English Proficient or had
to have an Individualized Education Plan and (in either case) be judged incapable of
panicipating in the assessment. The students who were excluded from the assessmentbecause they were categorized as I.EP or had an IEP represented 1 percent and 4 percent
of the population, respectively. In total, 2,794 eighth-grade Maryland public-school
students were assessed. The weighted student participation rate was 94 percent. This
means that the sample of students who took part in the assessment was representative of
94 percent of the ehgible eighth-grade public-school student population in Maryland.
Students' Mathematics Performance
The average proficiency of eighth-grade public-school students from Maryland on the
NAEP mathematics scale is 260. This proficiency is no different from that of students
across the nation (261).
Average proficiency on the NAEP scale provides a global view of eighth graders'
mathematics achievement; however, it does not reveal specifically what the students know
and can do in the subject. To describe the nature of students' proficiency in geater
NAEP used the results from the 1990 national assessments of fourth-, eighth-, and
twelfth-grade students to define the skills, knowledge, and understandings that characterize
four levels of mathematics performance -- levels 200, 250, 300, and 350 -- on the NAFP
scale.
9
2 "ME 1990 NAEP TRIAL STATE ASSESSMENT
Maryland
In Maryland, 96 percent of t.h eighth graders, compared to 97 percent in the nation,appear to have acquired skills involving simple additive reasoning and problem solving with
whole numbers (level 200): However, many fewer students in Maryland (14 percent) and12 percent in the nation appear to have acquired reasoning and problem-solving skillsinvolving fractions, decimals, percents, elementary geometric properties, and simplealgebraic manipulations (level 300).
The Trial State Assessment included five content areas -- Numbers and Operations;Measurement; Geometry; Data Analysis, Statistics, and Probability; and Algebra and
Functions. Students in Maryland performed comparably to students in the nation in allof these five content areas,
Subpopulation Performance
In addition to the overall results, the 1990 Trial State Assessment permits reporting on theperformance of various subpopulations of the Maryland eighth-grade student population
defined by race/ethnicity, type of community, parents' education level, and gender. InMaryland:
White students had higher average mathematics proficiency than did Blackor Hispanic students but lower mathematics proficiency than did Asianstudents.
Further, a greater percentage of White students than Black or Hispanicstudents but a smaller percentage of White than Asian students attainedlevel 300.
The results by type of community indicate that the average mathematicsperformance of the Maryland students attending schools in advantagedurban areas was higher than that of students attending schools indisadvantaged urban areas, extreme rural areas, or areas classified as"other".
In Maryland, the average mathematics proficiency of eighth-gadepublic-school students having; at least one parent who gaduated fromcollege was approximately 31 points higher than that of students whoseparents did not gaduate from high school.
The results by gender show that there appears to be no difference in theaverage mathematics proficiency of eighth-gxade males and femalesattending public schools in Maryland. In addition, there .was no differencebetween the percentages of males and females in Maryland who attainedlevel 300. Compared to the national results, females in Marylandperformed no differently from females across the country: males inMaryland performed no differently from males across the country.
0
TUE 1990 NAEP TRIAL STATE ASSESSMENT 3
Maryland
A Context for Understanding Students' Mathematics Proficiency
Information on students' mathematics proficiency is valuable in and of itself, but it
becomes more useful for improving instruction and setting policy when supplemented with
contextual information about schools, teachers, and students.
To gather such information, thc students participating in the 1990 Trial State Assessment,their mathematics teachers, and the principals or other administrators in their schools wereasked to complete questionnaires on policies, instruction, and programs. Taken together,the student, teacher, and school data help to describe some of the current practices andemphases in mathematics education, illuminate some of the factors that appear to berelated to eighth-grade public-school students' proficiency in the subject, and provide aneducational context for ,inderstanding information about student achievement.
Some of the salient results for the public-school students in Maryland are as follows:
About three-quarters of the students in Maryland (78 percent) were inschools where mathematics was identified as a special priority. This is agreater percentage than that for the nation (63 percent).
In Maryland, 92 percent of the students could take an algebra course ineighth grade for high-school course placement or credit.
A smaller percentage of students in Maryland were taking eighth-gademAhematics (38 percent) than were taking a course in pre-algebra oralgebra (59 percent). Across the nation. 62 percent were takingeighth-grade mathematics and 34 percent were taking a course inpre-algebra or algebra.
According to their teachers, the greatest percentage of eignth-grade studentsin public schools in Maryland spent either 15 or 30 minutes doingmathematics homework each day; according to the students, most of themspent either 15 or 30 minutes doing mathematics homework each day.Across the nation, teachers reported that the largest percentage of studentsspent either 15 or 30 minutes doing mathematics homework each day,while students reported either 15 or 30 minutes daily.
Students whose teachers placed heavy instructional emphasis on Algebraand Functions had higher proficiency in this content area than studentswhose teachers placed little or no emphasis on Algebra and Functions.Students whose teachers placed heavy instructional emphasis on Numbersand Operations and Measurement had lower proficiency in these contentareas than students whose teachers placed little or no emphasis on the sameareas.
4 THE 1990 NAEP TRIAL sTATE ASSESSMENT
Maryland
In Maryland, 18 percent of the eighth-grade students had mathematicsteachers who reported getting all of the resources they needed, while21 percent of the students were taught by teachers who got only some ornone of the resources they needed. Across the nation, these figures were13 percent and 31 percent, respectively.
In Maryland, 26 percent of the students never used a calculator to workproblems in class, while 47 percent almost always did.
In Maryland, 59 percent of the students were being taught by mathematicsteachers who reported having at least a master's or education specialist'sdegree. This compares to 44 percent for students across the nation.
About three-quarters of the students (79 percent) had teachers who had thehighest level of teaching certification available. This is different from thefigure for the nation, where 66 percent of students were taught by teacherswho were certified at the highest level available in their states.
Students in Maryland who had four types of reading materials (anencyclopedia, newspapers, magazines, and more than 25 books) at homeshowed higher mathematics proficiency than did students with zero to twotypes of these materials. This is similar to the results for the nation, wherestudents who had all four types of materials showed higher mathematicsproficiency than did fAudents who had zero to two types.
Some of the eighthloade public-school students in Maryland (I I percent)watched one hour or less of television each day; 19 percent watched sixhours or more. Average mathematics proficiency was lowest for studentswho spent six hours or more watching television each day.
THE 1990 NAEP TRIAL STATE ASSESSMENT 5

Mwyland
ME NATION'SREPORT
CARD
INTRODUCTION
As a result of legislation enacted in 1988, the 1990 National Asseument of EducationalProgress (NAEP) included a Trial State Assessment Program in eighth-grade mathematics.The Trial State Assessment was conducted in February 1990 with the following
participants:
Alabama Iowa OhioArizona Kentucky OklahomaArkansas Umbrian OregonCalifornia Mary Ind PennwlvaniaColorado Mgan Rhode Island
Connecticut Ilfnmesota TexasDelaware Montana Virginia
District of Columbia Nebraska West VireniaFlorida New Hampshire WisconsinGeorgia New Jersey WyomingHawaii New MexicoIdaho_ New YorkIllinois North Carolina GuamIndiana North Dakota Virgin Islands
t.)
THE 1990 NAEP TRIAL STATE ASSESSMENT 7
Maryland
This repot-. describes the performance of thc eighth-grade public-school students in
Maryland and consists of three sections:
This Introduction provides background information about the Trial StateAssessment and this report. It also provides a profile of the eighth-gradepublic-school students in Maryland.
Part One describes the mathematics performance of the eighth-gradepublic-school students in Maryland, the Northeast region, and the nation.
Part Two relates students' mathematics performance to contextualinformation about the mathematics policies and instruction in schools inMaryland, the Northeast region, and the nation.
Overview of the 1990 Trial State Assessment
In 1988, Congess passed new legislation for the National Assessment of Educational
Progress (NMI)), which included -- for the first time in the project's history -- a provision
authorizing voluntary state-by-state assessments on a trial basis, in addition to continuing
its primary mission, the national assessments that NAEP has conducted since its inception:
The National Assessment shall develop a trial mathematics assessment surveyinstrument for the eighth grade and shall conduct a demonstration of theinstrument in 1990 in States which wish to participate, with the purpose ofdetermining whether such an assessment yields valid, reliable State representative
data. (Section 406 (i)( 2 }(C El) of the General Education Provisions Act, asamended by Pub. L. 100-297 ( 20 (.7.S.C. 1221e-1( i)( 2)(C)(i)))
As a result of the legislation, the 1990 NAEP program included a Trial State Assessment
Program in eighth-gade mathematics. National assessments in mathematics, reading,
writing, and science were conducted simultaneously in 1990 at grades four, eight, and
twelve.
For the Trial State Assessment, eighth-grade public-school students were assessed in each
state or tenitory. The sample was carefully designed to represent the eighth-grade
public-school population in the state or territory. Within each selected school, students
were randomly chosen to participate in the progam. Local district personnel
administered all assessment sessions, and the contractor's staff monitored 50 percent of the
sessions as part of the quality assurance progam designed to ensure that the sessions were
being conducted uniformly. The results of the monitoring indicated a high degree of quality
and uniformity across sessions.
1. 4
8 THE 1990 NAEP TRIAL STATE ASSESSMENT
Maryland
The Trial State Assessment was based on a set of mathematics objectives newly developedfor the program and patterned after the consensus process described in Public Law 98-511,Section 405 (E), which authorized NAEP through June 30, 1988. Anticipating the 1988legislation that autht ized the Trial State Assessment, the federal government arranged forthe National Science Foundation and the U.S. Department of Education to issue a specialgrant to the Council of Chief State School Officers in mid-1987 to develop the objectives.The development process included careful attention to the standards developed by theNational Council of Teachers of Mathematics,' the formal mathematics objectives ofstates and of a sampling of local districts, and the opinions of practitioners at the state andlocal levels as to what content should be assessed.
There was an extensive review by mathematics educators, scholars, states' mathematicssupervisors, the National Center for Education Statistics (NCES), and the AssessmentPolicy Committee (APC), a panel that advised on NAEP policy at that time. Theobjectives were further refined by NAEP's Item Development Panel, reviewed by the TaskForce on State Comparisons, and resubmitted to NCES for peer review. Because theobjectives needed to be coordinated across all the grades for the national program, the finalobjectives provided specifications for the 1990 mathematics assessment at the fourth,eighth, and twelfth grades rather than solely for the Trial State Assessment in gxade eight.An overview of the mathematics objectives is provided in the Procedural Appendix.
This Report
This is a computer-generated report that describes the performance of eighth-gradepublic-school students in Maryland, in the Northeast region, and for the nation. Resultsalso are provided for groups of students defined by shared characteristics -- race/ethnicity,type of community, parents' education level, and gender. Definitions of the subpopulationsreferred to in this report arc presented below. The results for Maryland are based only onthe students included in the Trial State Assessment Program. However, the results for thenation and the region of the country are based on the nationally and regionallyrepresentative samples of public-school students who were assessed in January or Februaryas part of the 1990 national NAEP progxam. Use of the regional and national results fromthe 1990 national NAEP program was necessary because the voluntary nature of the TrialState Assessment Program did not guarantee representative natior-1 or regional results,since not every state participated in the progarn.
National Council of Teachers of Mathematics, Curriculum and Evahiation Standards for School Mathematics(Reston, VA: National Council of Teachers of Mathematics, 1989).
4
THE 1990 NAEP TRIAL STATE ASSESSMENT 9
Maryland
RACE/ETHNICITYResults are presented for students of different racial/ethnic groups based on the students'
self-identification of their race/ethnicity according to the following mutually exclusive
categories: White, Black, Hispanic, Asian (including Parific Islander), and American
Indian (including Alaskan Native). Based on criteria described in the Procedural Appendix,
there must be at least 62 students in a particular subpopulation in order for the results for
that subpopulation to be considered reliable. Thus, results for racial/ethnic groups with
fewer than 62 students are not reported. However, the data for all students, regardless of
whether their racial/ethnic group was reported separately, were included in computing
overall results for Maryland.
TYPE OF COMMUM'INResults are provided for four mutually exclusive community types -- advantaged urban,
disadvantaged urban, extreme rural, and other -- as defined below:
Advantaged Urban: Students in this group live in metropolitan statistical areasand attend schools where a high proportion of the students' parents are inprofessional or managerial positions.
Disadvantaged Urban: Students in this group live in metropolitar. statisticalareas and attend schools where a high proportion of the students' parents areon welfare or are not regularly employed.
Extreme Rural: Students in this group live outside metropolitari statisticalareas, live in areas with a population below 10,000, and Itend schools wheremany of the students' parents are farmers or farm workers.
Other: Students in this category attend schools in areas other than those definedas advantaged urban, disadvantaged urban, or extreme rural.
The reporting of results by each type of community was also subject to a minimum student
sample size of 62.
PARENTS' EDUCATION LEVELStudents were asked to indicate the extent of schooling for each of their parents -- did not
finish high school, gaduated high school, some education after high school, or graduated
college. The response indicating the higher level of education was selected for reporting.
10 THE 1990 NAEP TRIAL STATE ASSESSMENT

Maryland
GENDERResults are reported separately for males and females.
REGIONThe United States has been divided into four regions: Northeast, Southeast, Central, andWest. States included in each region are shown in Figure 1. All 50 states and the Districtof Columbia are listed, with the participants in the Trial State Assessment highlighted inboldface type. Territories were not assigned to a region. Further, the part of Virginia thatis included in the Washington, DC, metropolitan statistical area is included in theNortheast region; the remainder of the state is included in the Southeast region. Becausemost of the students are in the Southeast region, regional comparisons for Virginia will beto the Southeast.
FIGURE 1 I Regions of the Country
NORTHEAST SOUTHEAST CENTRAL WEST
ConnecticutDelaware
District al CokunbiaMaine
MarylandMassachusettsNew Movably.
Now JerseyNew 'York
PennsylvaniaRhode Island
VermontWSW.
AlabamaArkansas
Florida000101KentuckyLoaislana
MississippiWrits CarolinaSouth Carolina
Tennessee
West Virginia
THE 1990 NAEP TRIAL STATE ASSESSMENT
liNneleWiens
IowaKansas
MinassoisMissouriWins&
Notth DakotaOkla
South DakotaWisconsin
:7
AlaskaAdams
CaliforniaColoradoHawaiiWks
MoslissaNevada
Now MexicoMamaOmenTaosUtah
WashingtonWyoming
11

Maryland
Guidelihes for Analysis
This report describes and compares the mathematics proficiency of various subpopulations
of students -- for example, those who have certain demographic characteristics or whoresponded to a specific background question in a particular way. The report examines theresults for individual subpopulations and individual background questions. It does notinclude an analysis of the relationships among combinations of these subpopulations or
background questions.
Because the proportions of students in these subpopulations and their average pzoficiency
are based on samples -- rather than the entire population of eighth graders in public schools
in the state or territory -- the numbers reported are necessarily estimates. As such, they are
subject to a measure of uncertainty, reflected in the standard error of the estimate. Whenthe proportions or average proficiency of certain subpopulations are compared, it is
essential that the standard error be taken into account, rather than relying solely onobserved similarities or differences. Therefore, the comparisons discussed in this report are
based on statistical tests that consider both the magnitude of the difference between the
means or proportions and the standard errors of those statistics.
The statistical tests determine whether the evidence -- based on the data from the groups
in the sample -- is strong enough to conclude that the means or proportions are really
different for those groups in the population. If the evidence is strong (i.e., the difference is
statistically significant), the report describes the group means or proportions as being
different (e.g., one group performed higher than or lower than another group) -- regardless
of whether the sample means or sample proportions appear to be about the same or not.If the evidence is not sufficiently strong (i.e., the difference is not statistically significant),
the means or proportions are described as being about the same -- again, regardless of
whether the sample means or sample proportions appear to be about the same or widely
discrepant.
The reader is cautioned to rely on the results of the statistical tests -- rather than on the
apparent magnitude of the difference between sample means or proportions -- to determine
whether those sample differences are likely to represent actual differences between the
groups in the population. If a statement appears in the report indicating that a particular
group had higher (or lower) average proficiency than a second group, the 95 percent
confidence interval for the difference between groups did not contain the value zero. When
a statement indicates that the average proficiency or proportion of some attribute was about
the same for two groups, the confidence interval included zero, and thus no difference could
be assumed between thc groups. When three or more groups are being compared, a
Bonferroni procedure is also used. The statistical tests and Bonferroni procedure are
discussed in greater detail in the Procedural Appendix.4
12 THE 1990 NAEP TRIAL STATE ASSESSMENT
filmy land
It is also important to note that the confidence intervals pictured in the figures in Part Oneof this report are approximate 95 percent confidence intervals about the mean of aparticular population of interest. Comparing such confidence intervals for two populationsis not equivalent to examining the 95 percent confidence interval for the difference betweenthe means of the populations. If th::, individual confidence intervals for two populationsdo not overlap, it is true that there is a statistically significant difference between thepopulations. However, if the confidence intervals overlap, it is not always true that thereis not a statistically significant difference between the populations.
Finally, in several places in this report, results (mean proficiencies and proportions) arereported in the text for combined groups of students. For example, in the text, thepercentage of students in the combined group taking either algebra or pre-algebra is givenand compared to the percentage of students enrolled in eighth-grade mathematics.However, the tables that accompany that text report percentages and proficienciesseparately for the three groups (algebra, pre-algebra, and eighth-grade mathematics). Thecombined-group percentages reported in the text and used in all statistical tests are basedon unrounded estimates (i.e., estimates calculated to several decimal places) of thepercentages in each group. The percentages sl.own in the tables are rounded to integers.Hence, the percentage for a combined group (reported in the text) may diffe: slightly fromthe sum of the separate percentages (presented in the tables) for each of the groups thatwere combined. Similarly, if statistical tests were to be conducted based on the roundednumbers in the tables, the results might not be consonant with the rcsults of the statisticaltests that are reported in the text (based on unrounded numbers).
THE 1990 NA EP TRIAL STATE ASSESSMENT 13
Maryland
Profile of Maryland
EIGHTH-GRADE SCHOOL AND STUDENT CHARACTERISTICS
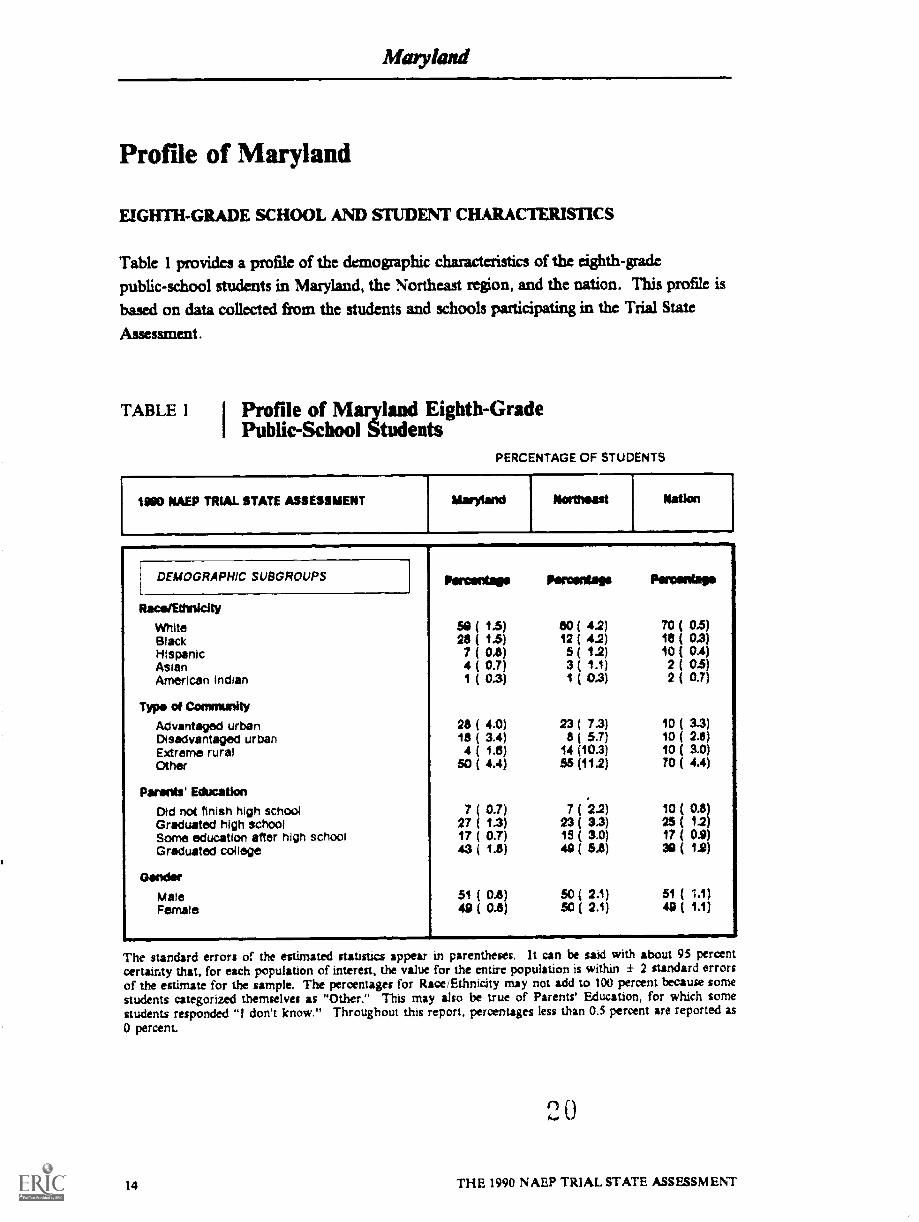
Table 1 provides a profile of the demographic characteristics of the eighth-gradepublic-school students in Maryland, the Northeast region, and the nation. This profile is
based on data collected from the students and schools participating in the Trial State
Assessment.
TABLE 1 I Profile of Maryland Eighth-GradeI Public-School Students
PERCENTAGE OF STUDENTS
NAEP TRIAL STATE ASSESSMENT
DEMOGRAPHIC SUBGROUPS Percentage Parconlif$ Percantigoo
Racs/EdetkItyWhite 50 ( 1.5) 80 ( 4.2) 70 ( 0.5)Black 2$ ( 14) 12 ( 4.2) 18 ( 0.3)Hispanic 7 ( 0.8) 5 ( 1,2) 10 ( OA)Asian 4 ( 0.7) 3 ( 1.1) 2 ( 0.5)American Indian 1 ( 0.3) 1 ( 0.3) 2 ( 0.7)
Type of Comnamity
Advantaged urban 2$ ( 4.0) 23 ( 7.3) 10 ( 3.3)Disadvantaged urban 1$ ( 3.4) 15( 5.7) 10 ( 2.8)Extreme rural 4 ( 1.8) 14 (10.3) 10 ( 3.0)Other 50 ( 4.4) 55 (11.2) 70 ( 4.4)
Parents' Education
Did not finish high school ( 0.7) 7 ( .2.2) 10 ( 0.8)Graduated high school 27 ( 1.3) 23 ( 3.3) 25 ( 1.2)Some education atter high school 17 ( 0.7) 15 ( 3.0) 17 ( 0.9)Graduated college 43 ( 1.8) 49 ( 5.8) 30 ( 1.9)
GondarMale 51 ( 0.8) 50( 2.1) 51( 1.1)Female 49 ( 0.8) 50 ( 2.1) 49 ( 1.1)
The standard errors of the estimated statistics appear in parentheses. It can be said with about 95 percentcertainty that, for each population of interest, the value for the entire population is within ± 2 standard errorsof the estimate for the sample. The percentages for Race/Ethnicity may not add to 100 percent because somestudents c4tegorized themselves as "Other." This may also be true of Parents' Education, for which somestudents responded "I don't know." Throughout this report, percentages less than 0.5 percent are reported as0 percent.
14
2. 0
THE 1990 NAEP TRIAL STATE ASSESSMENT

Maryland
SCHOOLS AND STUDENTS ASSESSED
Table 2 provides a profile summazizing participation data for Maryland schools andstudents sampled for the 1990 Trial State Assessment. In Maryland, 105 public schoolsparticipated in the assessment. The weighted school participation rate was 100 percent,which means that all of the eighth-grade students in this sample of schools wererepresentative of 100 percent of the eighth-grade public-school students in Maryland.
TABLE 2 I Profile of the Population Assessed in Maryland
EIGHTH-GRADE PUBLIC SCHOOLPARTICIPATION
Weighted school participationrate before substitution
Weighted school participationrate after substitution
Number of schools originallysampled
Number of schools not eligible
Number of schools in originalsample participating
Number of substitute schoolsprovided
Number of substitute schoolsparticipating
Total number of participatingschools
100%
100%
107
2
105
106
EIOHTWORADE PUBLIC-SCHOOL STUDENTPARTICIPATION
Weighted student participationrate after make-ups
Number of students selected toparticipate in the assessment
Number of students withdrawnfrom the assessment
Percentage of students who wereof Li teed English Proficiency
Percentage of students excludedfrom the asseSsment due toLimited English Proficiency
Percentage of students who hadan Individualized Education Plan
Percentage of students excludedfrom the assessment due toIndividualized Education Plan status
Number of students to be assessed
Number ot students assessed
94%
233
115
1%
1%
10%
THE 1990 NAEP TRIAL STATE ASSESSMENT 15
Maryland
In each school, a random sample of students was selected to participate in the assessment.
As estimated by the sample, 1 percent of the eighth-grade public-school population wasclassified as Limited English Proficient (LEP), while 10 percent had an Individualized
Education Plan (IEP). An IEP is a plan, written for a student who has been determinedto be eligible for special education, that typically sets forth goals and objectives for the
student and describes a program of activities and/or related services necessary to achieve the
goals and objectives.
Schools were permitted to exclude certain students from the assessment. To be excludedfrom the assessment, a student had to be categorized as limited English Proficient or hadto have an Individualized Education Plan and (in either case) be judged incapable of
participating in the assessment. The students who were excluded from the assessmentbecause they were categorized as LEP or had an IEP represented 1 percent and 4 percent
of the population, respectively.
In total, 2,794 eighth-grade Maryland public-school students were assessed. The weighted
student participation rate was 94 percent. This means that the sample of students whotook part in the assessment was representative of 94 percent of the eligible eighth-grade
public-school student population in Maryland.
lb THE 1990 NAEP TRIAL STATE ASSESSMENT
Maryland
THE NATION'SREPORT
CARD
PART ONE
How Proficient in Mathematics Are Eighth-GradeStudents in Maryland Public Schools?
The 1990 Trial State Assessment covered five mathematics content areas -- Numbers andOperations; Measurement; Geometry; Data Analysis, Statistics, and Probability; andAlgebra and Functions. Students' overall performance in these content areas wassummarized on the NAFP mathematics scale, which ranges from 0 to 500
This part of the report contains two chapters that describe the mathematics proficiency ofeighth-grade public-school students in Maryland. Chapter 1 compares the overallmathematics performance of the students in Maryland to students in the Northeast regionand the nation. It also presents the students' average proficiency separately for the fivemathematics content areas. Chapter 2 summarizes the students' overall mathematicsperformance for subpopulations defined by race/ethnicity, type of community, parents'education level, and gender, as well as their mathematics performance in the five contentareas.
THE 1990 NAEP TRIAL STATE ASSESSMENT 17
CHAPTER 1
Students' Mathematics Performance
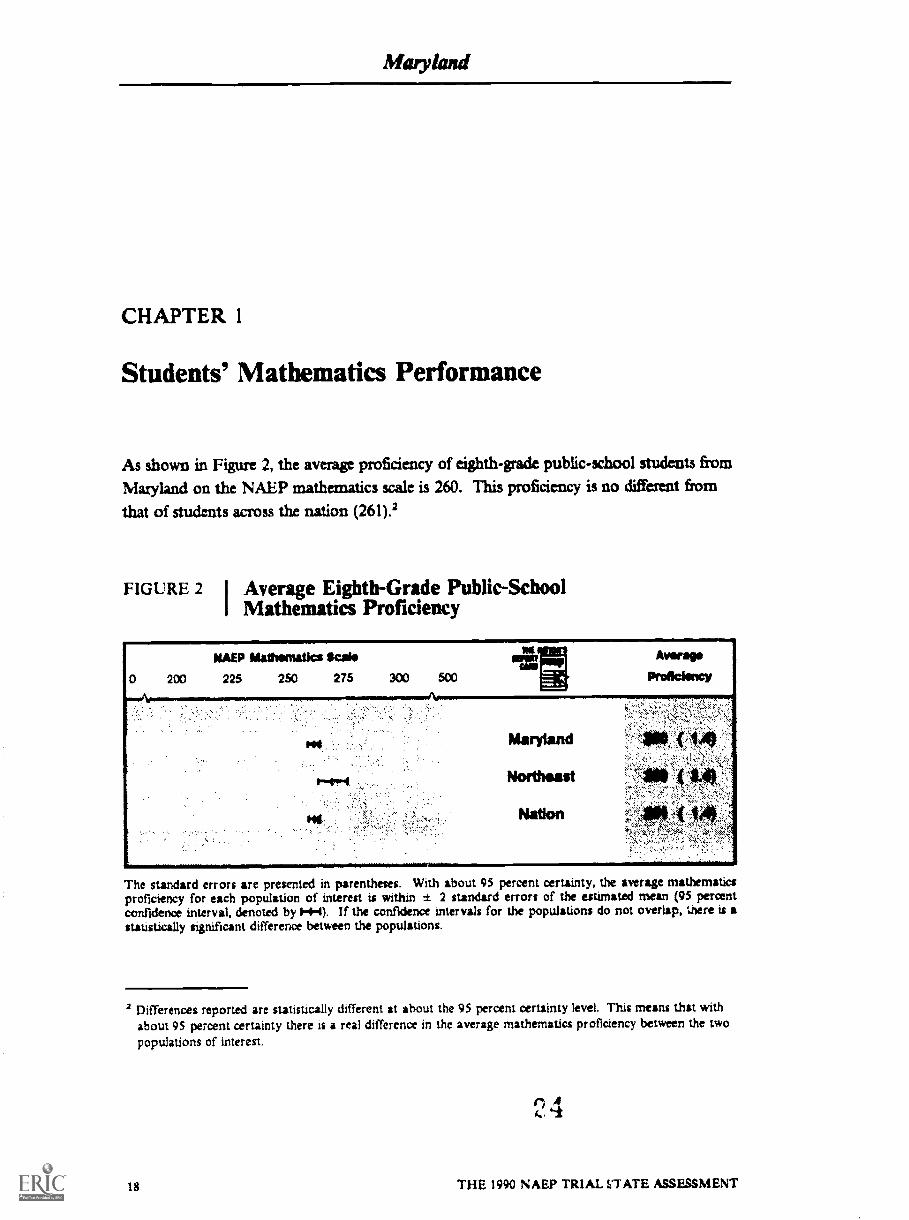
As shown in Figure 2, the average proficiency of eighth-grade public-school students fromMaly land on the NAEP mathematics scale is 260. This proficiency is no different from
that of students across the nation (261).2
FIGURE 2 I Average Eighth-Grade Public-SchoolI Mathematics Proficiency
The standard errors are presented in parentheses. With about 95 percent certainty, the average mathematicsproficiency for each population of interest is within ± 2 standard errors of the estimated mean (95 percentconfidence interval, denoted by 14-1). If the confidence intervals for the populations do not overlap, there is astatistically significant difference between the populations.
2 Differences reported are statistically different it about the 95 percent certainty level. This means that withabout 95 percent certainty there is a real difference in the average mathematics proficiency between the twopopulations of interest.
113 THE 1990 NAEP TRIAL VTATE ASSESSMENT
Maryland
LEVELS OF MATHEMATICS PROFICIENCY
Average proficiency on the NAEP scale provides a global view of eighth graders'
mathematics achievement; however, it does not reveal the specifics of what the studentsknow and can do in the subject. To describe the nature of students' prnficiency in greaterdetail, NAEP used the results from the 1990 national assessments of fourth-, eighth-, andtwelfth-grade students to define the skills, knowledge, and understandings that characterizefour levels of mathematics performance -- levels 200, 250, 300, and 350 -- on the NAEPscale.
To define the skills, knowledge, and understandings that characterize each proficiency level,
mathematics specialists studied the questions that were typically answered correctly bymost students at a particular level but answered incorrectly by a majority of students at thenext lower level. They then summarized the kinds of abilities needed to answer each setof questions. While defining proficiency levels below 200 and above 350 is theoreticallypossible, so few students performed at the extreme ends of the scale that it was impracticalto define meaningful levels of mathematics proficiency beyond the four presented here.
Defmitions of the four levels of mathematics proficiency arc given in Figure 3. It isimportant to note that the definitions of these levels are based solely on studentperformance on the 1990 mathematics assessment. The levels are not judgmental standardsof what ought to be achieved at a particular grade. Figure 4 provides the percentages ofstudents at or above each of these proficiency levels. In Maryland, 96 percent of the eighthgraders, compared to 97 percent in the nation, appear to have acquired skills involvingsimple additive reasoning and problem solving with whole numbers (level 200). However,many fewer students in Maryland (14 percent) and 12 percent in the nation appear to haveacquired reasoning and problem-solving skills involving fractions, decimals, percents,elementary geometric properties, and simple algebraic manipulations (level 300).
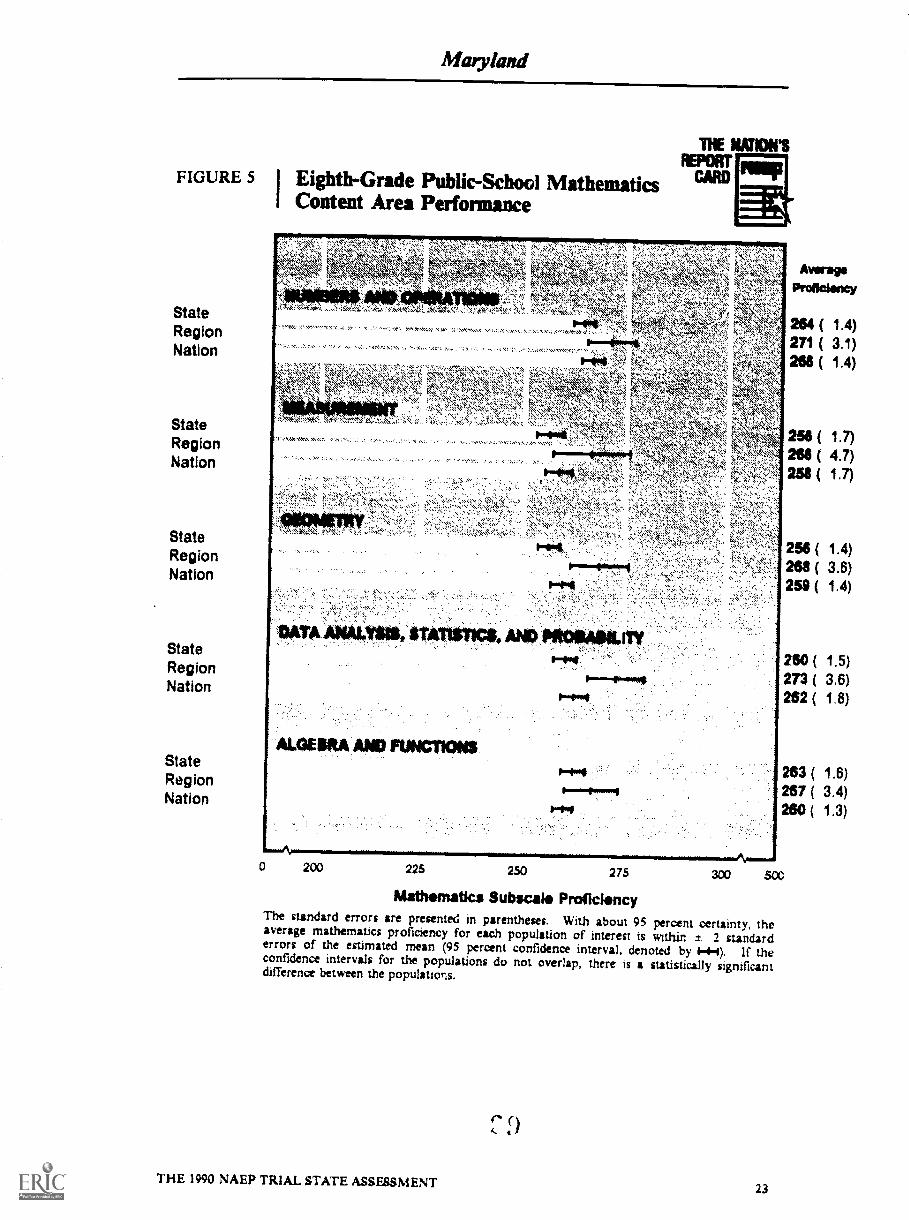
CONTENT AREA PERFORMANCE
As previously indicated, the questions comprising the Trial State Assessment covered fivecontent areas -- Numbers and Operations; Measurement; Geometry; Data Analysis,
Statistics, and Probability; and Algebra and Functions. Figure 5 provides the Maryland,Northeast region, and national results for each content area. Students in Marylandperformed comparably to students in the nation in all of these five content areas.
THE 1990 NAEP TRIAL STATE ASSESSMENT 19
Maryland
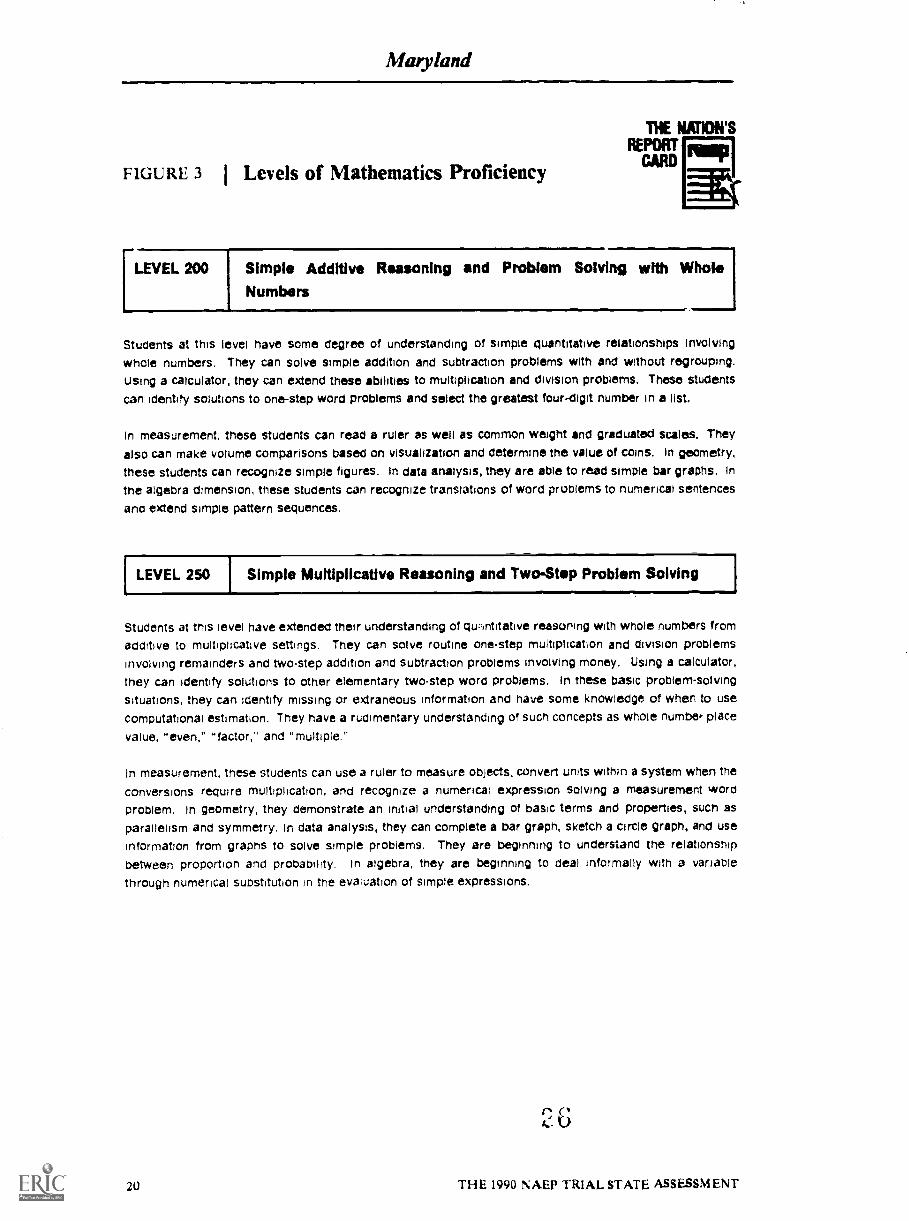
FIGURE 3 I Levels of Mathematics Proficiency
[LEVEL 200
4101=1Simple Additive Reasoning and Problem Solving with WholeNumbers
Students at this level have some degree of understanding of simple quantitative relationships involvingwhole numbers. They can solve simple addition and Subtraction problems with and without regrouping.Using a calculator, they can extend these abilities to multiplication and division problems. These Studentscan identify solutions to one-step word problems and Select the greatest four-digit number in a list.
In measurement, these Students can read a ruler as well as common weight and graduated scales. Theyalso can make volume comparisons based on visualization and determine the value of coins. In geometry,
these students can recognize simple figures. In data analysis, they are able to read simple bar graphs. Inthe algebra dimension, these students can recognize translations Of word problems to numerical sentences
and extend simple pattern sequences.
LEVEL 250 Simple Multiplicative Reasoning and Two4tep Problem Solving
Students at this level have extended their understanding of qurvititative reasoning with whole numbers from
additive to multiplicative settings. They can solve routine one-step multiplication and division problemsinvolving remainders and two-step addition and Subtraction problems involving money. Using a calculator,
they can identify solutions to other elementary two-step word problems. In these basic problem-solving
situations, they can identify missing or extraneous information and have some knowledge of when to usecomputational estimation. They have a rudimentary understanding of such concepts as whole number place
value, "even," "factor," and "multiple."
In measurement, these students can use a ruler to measure objects, convert units within a system when theconversions require multiplication, and recognize a numerical expression solving a measurement wordproblem. In geometry, they demonstrate an initial understanding of basic terms and properties, such asparallelism and symmetry. In data analysis, they can complete a bar graph, sketch a circle graph, and useinformation from graphs to solve simple problems. They are beginning to understand the relationship
between proportion and probability. In algebra, they are beginning to deal informally with a variablethrough numerical substitution in the evaluation of simple expressions.
C"!
20 THE 1990 NAEP TRIAL STATE ASSESSMENT
Maryland
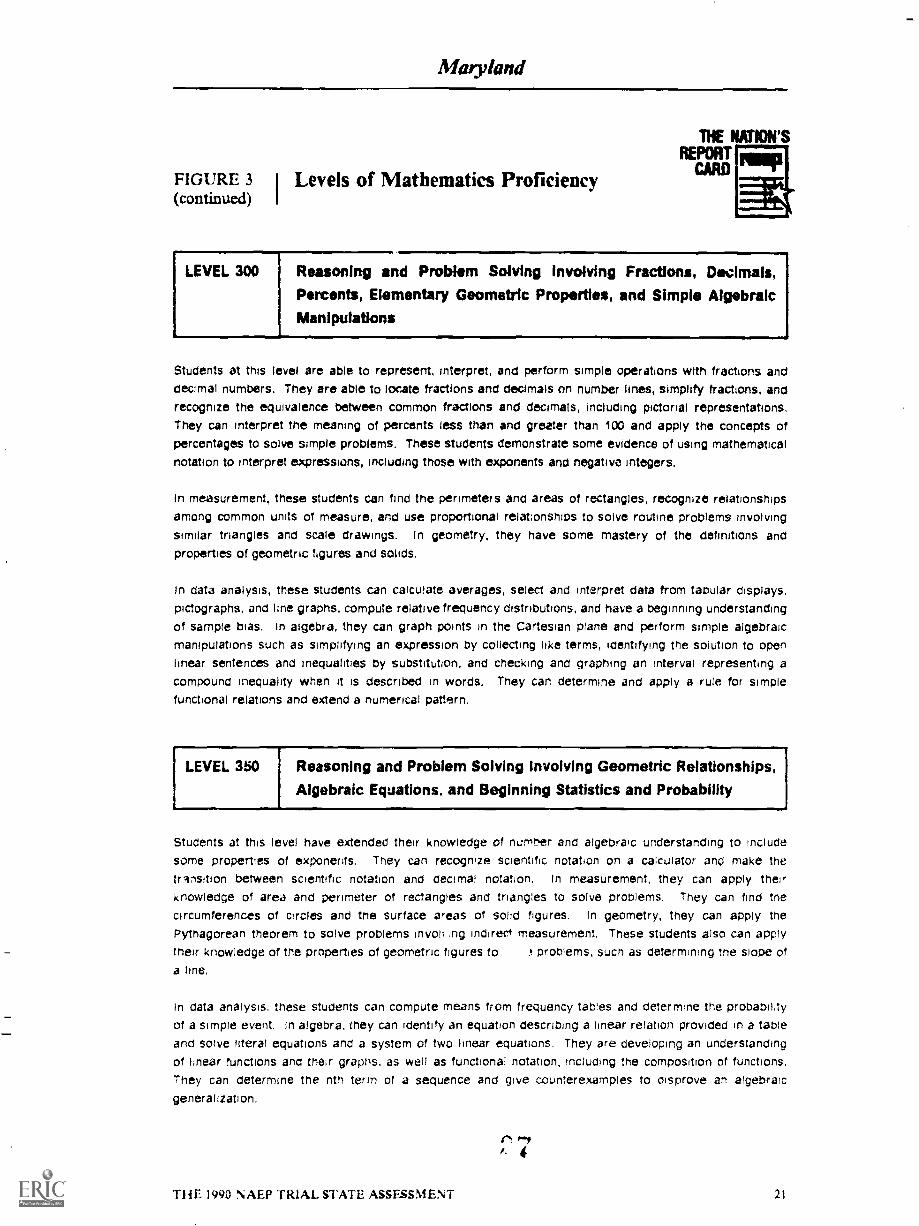
FIGURE 3 I Levels of Mathematics Proficiency(continued) I
LEVEL 300 Reasoning and Problem Solving Involving Fractions, Decimals,Percents, Elementary Geometric Properties, and Simple AlgebraicManipulations
Students at this level are able to represent, interpret, and perform simple operations with fractions anddecimal numbers. They are able to locate fractions and decimals on number lines, simplify fractions, andrecognize the equivalence between common fractions and decimals, including pictorial representations.They can interpret the meaning of percents less than and greater than 100 and apply the concepts ofpercentages to solve simple problems. These students demonstrate some evidence of using mathematicalnotation to interpret expressions, including thoSe with exponents and negative integers.
In measurement, these students can find the perimeters and areas of rectangles, recognize relationshipsamong common units of measure, and use proportional relationships to solve routine problems involvingsimilar triangles and scale drawings. In geometry, they have some mastery of the definitions andproperties of geometric figures and solids.
In data analysis, these students can calculate averages, select and interpret data from tabular displays,pictographs. and line graphs, compute relative frequency distributions, and have a beginning understanding
of sample bias. In algebra, they can graph points in the Cartesian plane and perform simple algebraicmanipulations such as simplifying an expression by collecting like terms, identifying the solution to openlinear sentences and inequalities by substitution, and checking and graphing an interval representing acompound inequality when it is described in words. They can determine and apply a rule for simplefunctional relations and extend a numerical pattern.
LEVEL 350 Reasoning and Problem Solving involving Geometric Relationships,
Algebraic Equations, and Beginning Statistics and Probability
Students at this level have extended their knowledge of numtvr and algebraic understanding to includesome properties of exponents. They can recognize scientific notation on a calculator ancl make thetrinsition between scientific notation and decimal notation. In measurement, they can apply theirknowledge of area and perimeter of rectangles and triangles to solve problems, They can find tnecircumferences of circles and the surface areas of solid figures. In geometry, they can apply thePytnagorean theorem to solve problems involi ,ng indirect measurement, These students also can applytheir knowledge of the properties of geometric figures to .! problems, such as determining the slope ofa line.
In data analysis, these students can compute means from frequency tables and determine the probabilityof a simple event. In algebra, they can identify an equation describing a linear relation provided in a tableand solve literal equations and a system of two linear equations. They are developing an understandingof linear functions and their graphs, as well as functional notation, including the composition of functions.They can determine the nth term of a sequence and give counterexamples to disprove an algebraicgeneralization.
(N. P9x. 4
THE 1990 NAEP TRIAL STATE ASSESSMENT 21

FIGURE 4 I Levels of Eighth-Grade Public-Schooli Mathematics Proficiency
LEVEL 350
StateRegionNation
LEVEL 300
StateRegionNation
LEVEL 250
StateRegionNation
LEVEL 200
StateRegionNation
0 20 40 so so 100
Percentage at or Above Proficiency LevelsThe standard errors are presented in parentheses. With about 95 percent certainty, the valuefor each populauon of interest is within ± 2 standard errors of the estimated percentage (95
percent confidence interval, denoted by I-4-4). If the confidence intervals for the populationsdo rot overlap, there is a statistically significant difference between the populations.
22 THE 1990 NAEP TRIAL STATE ASSESSMENT
O ( 0.1)O ( 0.5)0 ( 0.2)
14 ( 1.2)16 ( 2.7)12 ( 1.2)
61 ( 1.8)72 ( 4.8)64 ( 1.6)
96 ( 0.5)99 ( 0.6)97' ( 0.7)
Maryland
NE WOWSREPORT
FIGURE 5 I Eighth-Grade Public-School Mathematics CARDi Content Area Performance
StateRegionNation
StateRegionNation
StateRegionNation
StateRegionNation
StateRegionNation
,
.AT.
0 200 225 250 275
AverageProficiency
264 ( 1.4)271 ( 3.1)268 ( 1.4)
258 ( 1.7)268 ( 4.7)258 ( 1.7)
258 ( 1.4)268 ( 3.6)259 ( 1.4)
260 ( 1.5)273 ( 3.6)262 ( 1.8)
263 ( 1.6)267 ( 3.4)260 ( 1.3)
300 500
Mathematics Subscale ProficiencyThe standard errors are presented in parentheses. With about 95 percent certainty, theaverage mathematics proficiency for each population of interest is within ± 2 standarderrors of the estimated mean (95 percent confidence interval, denoted by If theconfidence intervals for the populations do not overlap, there is a statistically significantdifference between the populations.
THE 1990 NAEP TRIAL STATE ASSESSMENT23

Maryland
CHAPTER 2
Mathematics Performance by Subpopulations
In addition to the overall state results, the 1990 Trial State Assessment included reporting
on the performance of various subgroups of the student population defined by
race/ethnicity, type of community, parents' education level, and gender.
RACE/ETHNICITY
The Trial State Assessment results can be compared according to the different racial/ethnic
goups when the number of students in a racial/ethnic group is sufficient in size to be
reliably reported (at least 62 students). Average mathematics performance results for
White, Black, Hispanic, and Asian students from Maryland are presented in Figure 6.
As shown in Figure 6, White students demonstrated higher average mathematics
proficiency than did Black or Hispanic students but lower mathematics proficiency than
did Asian students.
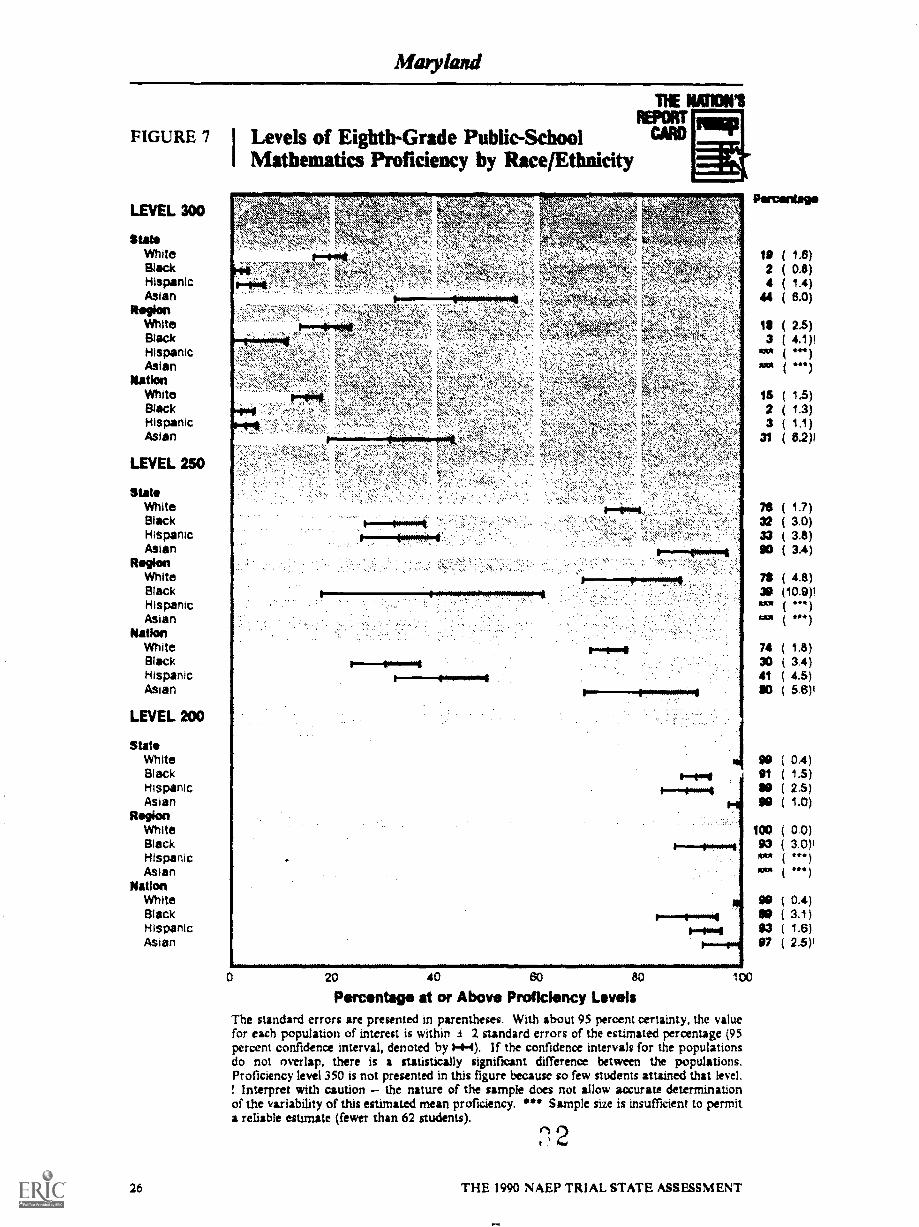
Figure 7 presents mathematics performance by proficiency levels. The figure shows that a
greater percentage of White students than Black or Hispanic students but a smaller
percentage of White than Asian students attained level 300.
24 THE 1990 NAEP TRIAL STATE ASSESSMENT
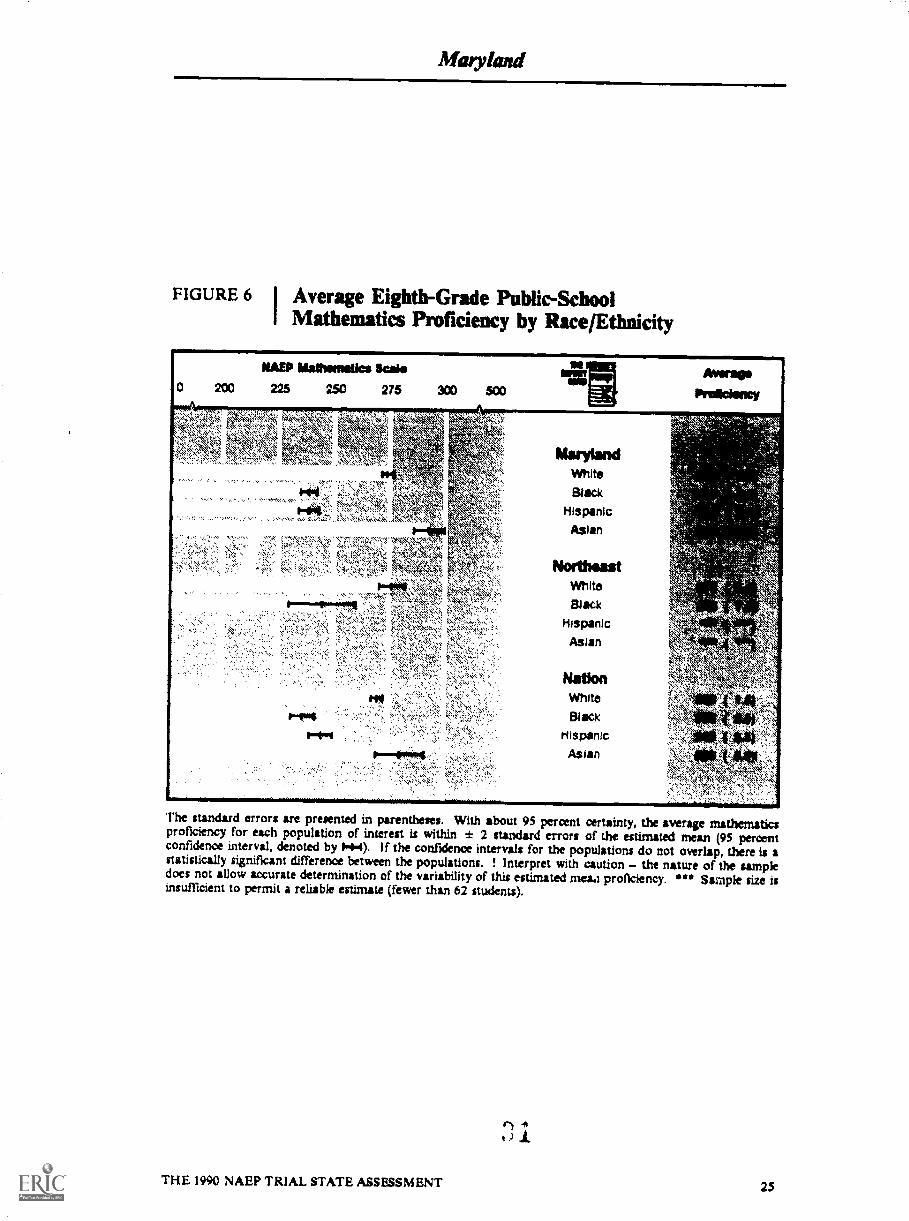
FIGURE 6 I Average Eighth-Grade Public-SchoolI Mathematics Proficiency by Race/Ethnicity
The standard errors are presented in parentheses. With about 95 percent certainty, the average mathematicsproficiency for each population of interest is within ± 2 standard errors of the estimated mean (95 percentconfidence interval, denoted by 1.4-4). If the confidence intervals for the populations do not overlap, there is astatistically significant difference between the populations. ! Interpret with caution the nature of the sampledoes not allow accurate determination of the variability of this estimated meaa proficiency. *** Sample size isinsufficient to permit a reliable estimate (fewer than 62 students).
THE 1990 NAEP TRIAL STATE ASSESSMENT 25
THE WOWSREPORT
FIGURE 7 I Levels of Eighth-Grade Public-School CMO
I Mathematics Proficiency by Race/Ethnicity
LEVEL 300
stateWhiteBlackHispanicAsian
RegionWhiteBlackHispanicAsian
/teflonWhiteBlackHispanicAsian
LEVEL 250
StallWhiteBlackHispanicAsian
RB9kmWhiteBlackHispanicAsian
StationWhiteBlackHispanicAsian
LEVEL 200
stateWhiteBlackHispanicAsian
N.ganWhiteBlackHispanicAsian
NationWhiteBlackHispanicAsian
20 40 60 80
Percentage at or Above Proficiency LevelsThe standard errors are presented in parentheses. With about 95 percent certainty, the valuefor each population of interest is within 3 2 standard errors of the estimated percentage (95percent confidence interval, denoted by 14-4). If the confidence intervals for the populationsdo not overlap, there is a statistically significant difference between the populations.Proficiency level 350 is not presented in this figure because so few students attained that level.1 Interpret with caution the nature of the sample does not allow accurate determinationof the variability of this estimated mean proficiency. *** Sample size is insufficient to permita reliable estimate (fewer than 62 students).
( 1.8)2 ( 0.8)4 ( 1.4)
44 ( 6.0)
19 ( 2.5)3 ( 4.1)1
alot .**)
15 ( 1,5)2 ( 1.3)3 ( 1.1)
31 ( 6.2)1
76 ( 1.7)32 ( 3.0)33 ( 3.8)90 ( 3.4)
79 ( 4.8)39 (10.9)1II *.POI ***
74 ( 1.8)30 ( 3.4)41 ( 4.5)SO ( 5.0)1
SO ( 0.4)91 ( 1.5)Se ( 2.5)SO ( 1.0)
100 ( 0.0)93 ( 3.0)1
( *)99 ( 0.4)
( 3.1)( 1.8)
97 ( 2.5)1
100
26 THE 1990 NAEP TRIAL STATE ASSESSMENT
Maryland
TYPE OF COMMUNITY
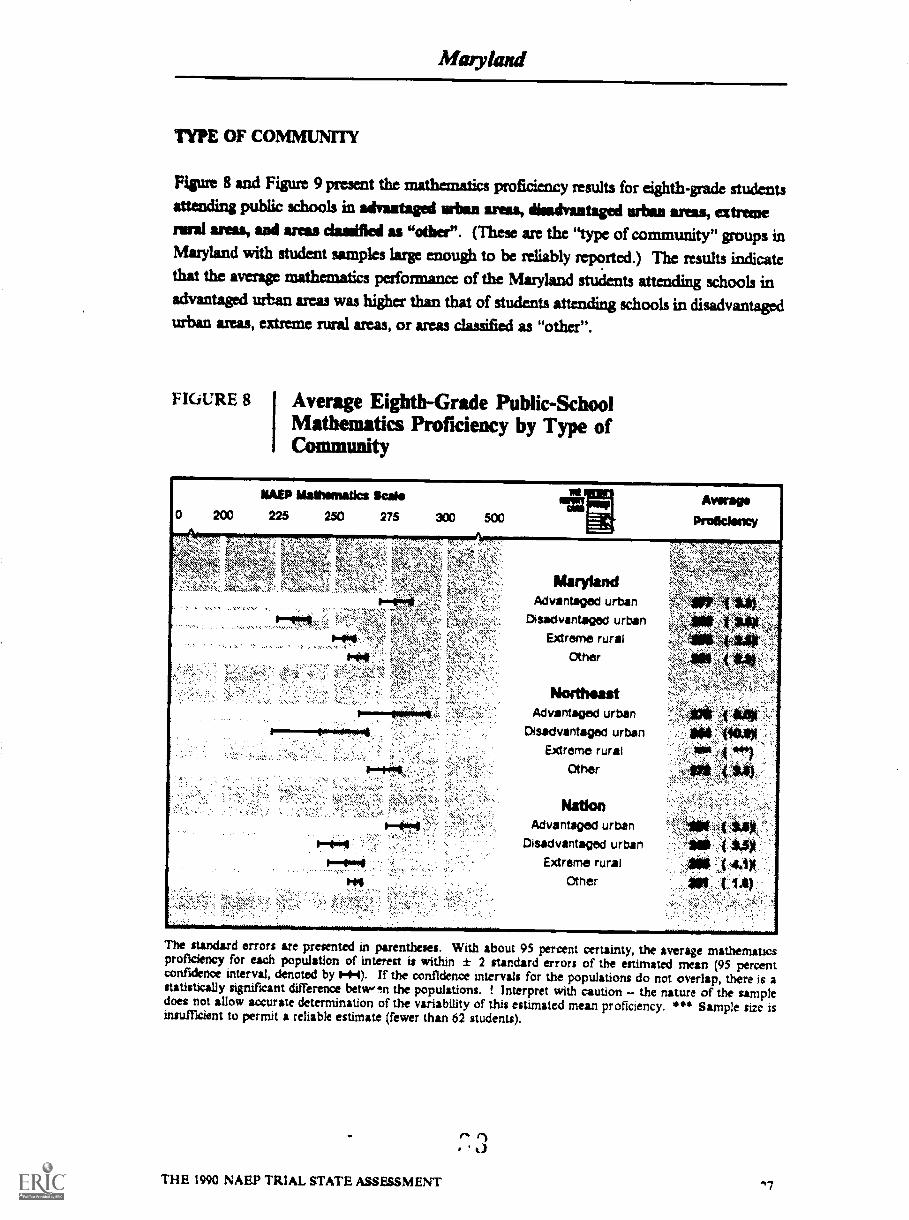
Figure 8 and Figure 9 present the mathematics proficiency results for eighth-grade studentsatteading public schools in advantaged urban areas, disadvaataged urban areas, extremerural areas, and areas dassilied as "other". (These are the "type of community" groups inMaryland with student samples large enough to be reliably reported.) The results indicatethat the avenge mathematics perfonnance of the Maryland students attending schools inadvantaged urban areas was higher than that of students attending schools in disadvantagedurban areas, extreme rural areas, or areas classified as "other".
FIGURE 8 Average Eighth-Grade Public-SchoolMathanatics Proficiency by Type ofCommunity
'Wary landAdvantaged urban
Disadvantaged urbanExtreme rural
Other
NorthoistAdvantaged urban
Disadvantaged urbanExtreme rural
Other
NationAdvantaged urban
Disadvantaged urbanExtreme rural
Other
The standard errors are presented in parentheses. With about 95 percent certainty, the average mathematicsproficiency for each population of interest is within ± 2 standard errors of the estimated mean (95 percentconfidence interval, denoted by 10-4-1). If the confidence interval; for the populations do not overlap, there is astatistically significant difference betw.-mi the populations. ! Interpret with caution the nature of the sampledoes not allow aocurate determination of the variability of this estimated mean proficiency. *** Sample size isinsufficient to permit a reliable estimate (fewer than 62 students).
THE 1990 NAEP TRIAL STATE ASSESSMENT
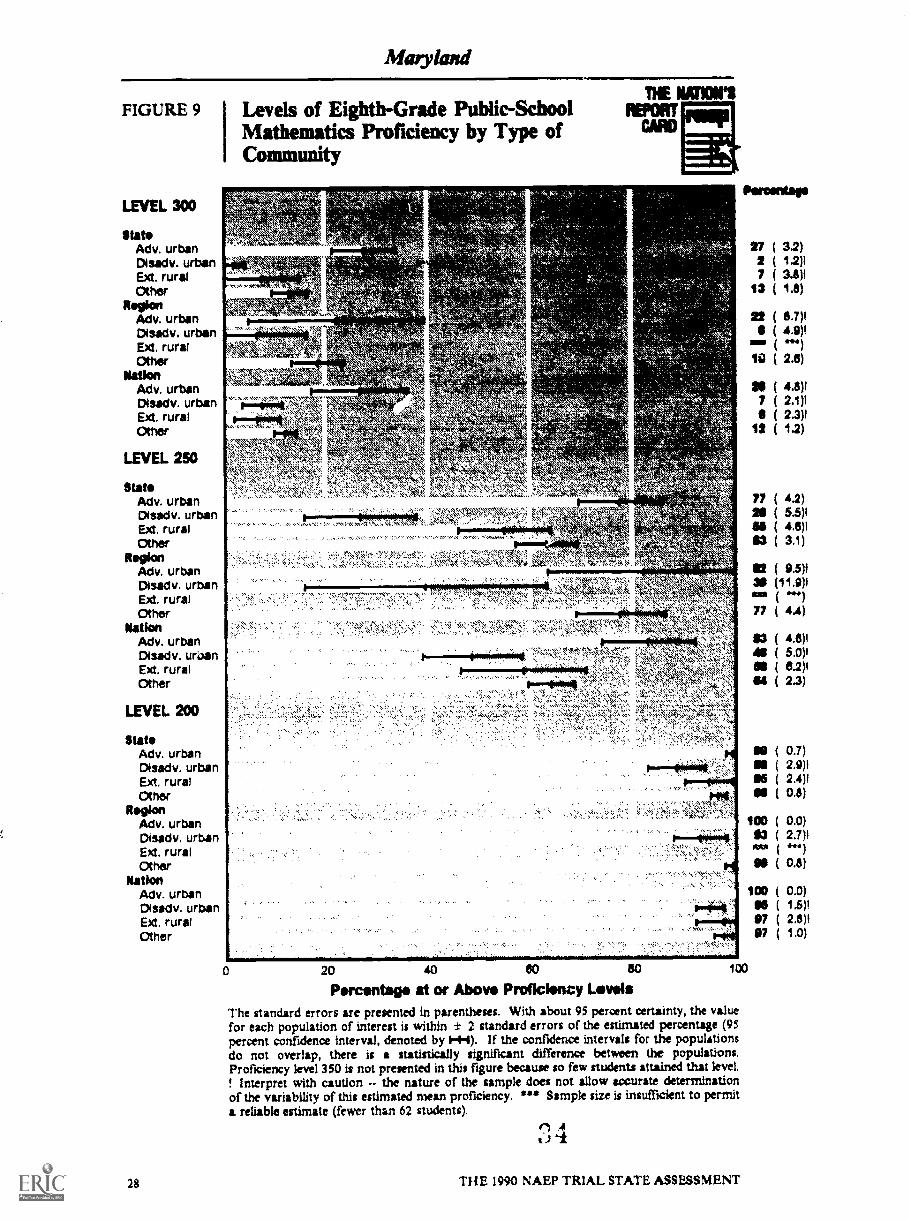
FIGURE 9
LEVEL 300
stateAdv. urbanDisadv. urbanExt. ruralOther
Re OenAdv. urbanDeady. urbanExt. ruralOther
NationAdv. urbanDisadv. urbanExt. ruralOther
LEVEL 250
SlateAdv. urbanDisadv. urbanExt. ruralOther
RaglanAdv. urbanDisadv. urbanExt. ruralOther
NationAdv. urbanDuch/. uroanExt. ruralOther
LEVEL 200
StatAdv. urbanDisadv. urbanExt. ruralOther
R*011Adv. urbanDisadv. urbanExt. ruralOther
NationMy. urbanDisadv. urbanExt. ruralOther
Levels of Eighth-Grade Public-SchoolMathematics Proficiency by Type ofComm
0 20 40 60 BO
Percantag at or Above Proficioncy LewisThe standard errors are presented in parentheses. With about 95 percent certainty, the valuefor each population of interest is within ± 2 standard errors of the estimated percentage (95percent confidence interval, denoted by I-I-4). If the confidence intervals for the populationsdo not overlap, there is a statistically significant difference between the populations.Proficiency level 350 is not presented in this figure because so few students attained that level.! Interpret with caution the nature of the sample does not allow accurate determinationof the variability of this estimated mean proficiency. *1" Sample size is insufficient to permita reliable estimate (fewer than 62 students).
100
.14
28 THE 1990 NAEP TRIAL STATE ASSESSMENT
27 ( 3.2)2 ( 1.2)17 ( 3.6)1
13 ( 1.6)
21 ( 11.7)1
( 4.9)1NEI
( 2.6)
211 ( 4.6)17 ( 2.1)1
( 2.3)112 ( 1.2)
77 ( 4.2)29 ( 5.5)1
( 4.8)163 ( 3.1)
22 ( 9.5)1(11.9)!
sum ( .4177 ( 4.4)
13 ( 4.6)1
419 5.0)1( 6.2)1
66 ( 2.3)
( 0.7)( 2.9)1
96 ( 2.4)1
IPS ( 0.8)
100 ( 0.0)93 ( 2.7)1aaa
99 ( 0.8)
100 ( 0.0)99 ( 1.5)197 ( 2.8)197 ( 1.0)
Maryland
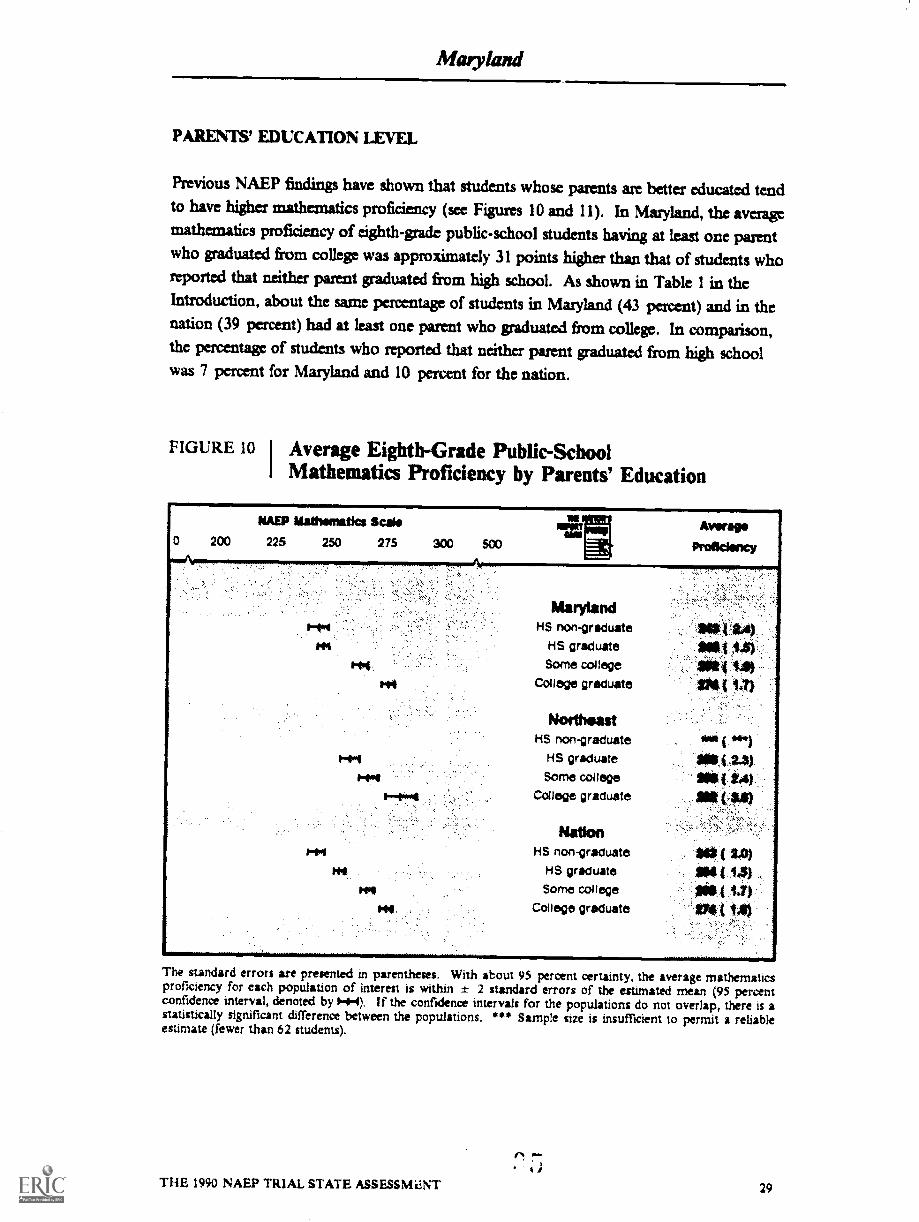
PARENTS' EDUCATION LEVEL
Previous NAEP findings have shown that students whose parents are better educated tendto have higher mathematics proficiency (see Figures 10 and 11). In Maryland, the averagemathematics proficiency of eighth-grade public-school students having at least one parentwho graduated from college was approximately 31 points higher than that of students whoreported that neither parent graduated from high school. As shown in Table 1 in theIntroduction, about the same percentage of students in Maryland (43 percent) and in thenation (39 percent) had at least one parent who graduated from college. In comparison,the peiventage of students who reported that neitherparent graduated from high schoolwas 7 percent for Maryland and 10 percent for the nation.
FIGURE 10 I Average Eighth-Grade Public-SchoolMathematics Proficiency by Parents' Education
NAEP Mathematics Scale
200 225 250 275 300 SOO
Average
Proficiency
FIN4
Maryland115 non-graduate
HS graduate
Some college
College graduate
NortheastNS non-graduate
HS graduateSOMe co4lege
College graduate
NationHS non-graduate
HS graduate
Some college
College graduate
The standard errors art presented in parentheses. With about 95 percent certainty, the average mathematicsproficiency for each population of interest is within ± 2 standard errors of the estimated mean (95 percentconfidence interval, denoted by 1-4-4). If the confidence intervals for the populations do not overlap, there is astatistically significant difference between the populations. *1" Sample size is insufficient to permit a reliableestimate (fewer than 62 students).
THE 1990 NAEP TRIAL STATE ASSESSWNT 29
Maryland
Thr NMIHEW.
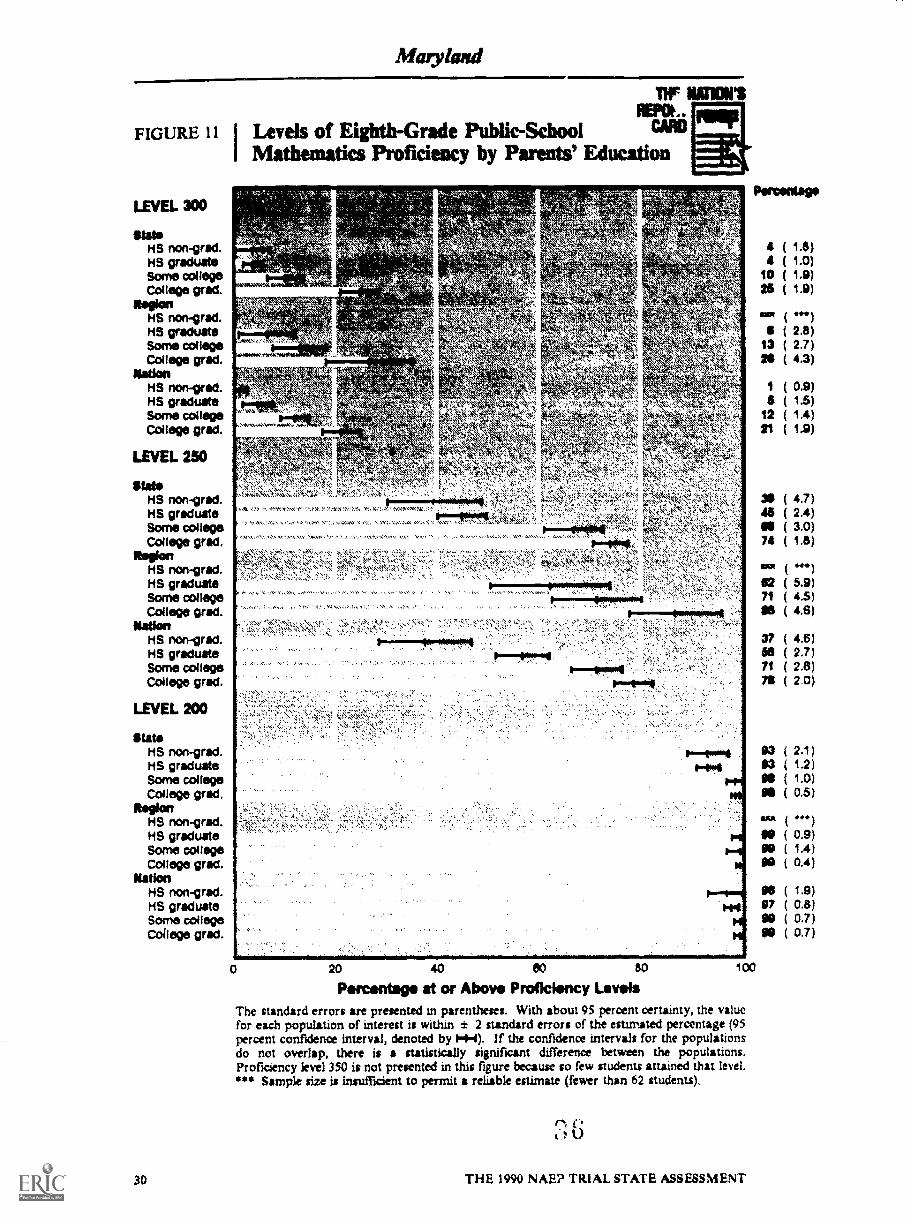
FIGURE 1 1 I Levels of Eighth-Grade Public-School CAM
I Mathematics Proficiency by Parents' Education
LEVEL 300
StateHS non-grad.HS graduateSome conegeCateee grad.
RaglanHS non-grad.HS greduateSome collegeCollege grad.
NationHS non-grad.HS graduateSome collegeCollege grad.
LEVEL 250
SlateHS non-grad.HS graduateSome collegeCollege grid.
RegionHS nort-grad.HS graduateSome collegeCollege grad.
*WonHS non-grad.HS graduateSome collegeCollege grad.
LEVEL 200
StateHS non-grad.HS graduateSome cottageCollege grad.
9.9k1g1115 non-grad.HS graduateSome collegeGonne grad.
NationHS non-grad.HS graduateSome collegeCoflage grad.
: &.,,,V t'. '1 ,;N . '
,,.
0 20 40 60 80
Percentage at or Above Proficiency LevelsThe standard errors are presented in parentheses. With about 95 percent certainty, the valuefor each population of interest is within ± 2 standard errors of the estimated percentage (95percent confidence interval, denoted by O-1-4). If the confidence intervals for the populationsdo not overlap, there is a statistically significant difference between the populations.Proficiency level 350 it not presented in this figure because so few students attained that level.m Sample size is insufficient to permit a reliable estimate (fewer than 62 students).
100
30 THE 1990 NAE? TRIAL STATE ASSESSMENT
4 ( 1.8)4 ( 1.0)
10 ( 1.9)26 ( 1.9)
wit ( ,)( 2.8)
13 ( 2.7)2$ ( 4.3)
( 0.9)( 1.5)
12 ( 1.4)21 ( 1.9)
( 4.7)44 ( 2.4)N ( 3.0)74 ( 1.8)
***)92 ( 5.9)71 ( 4.5)99 ( 4.6)
37 ( 4.8)58 ( 2.7)71 ( 2.6)79 ( 2 0)
93 ( 2.1)63 ( 1.2)99 ( 1.0)99 ( OS)
g ui t( 0.9)
90 ( 1.4)69 ( 0.4)
90 ( 1.9)97 ( 0.8)99 ( 0.7)99 ( 0.7)
Maryland
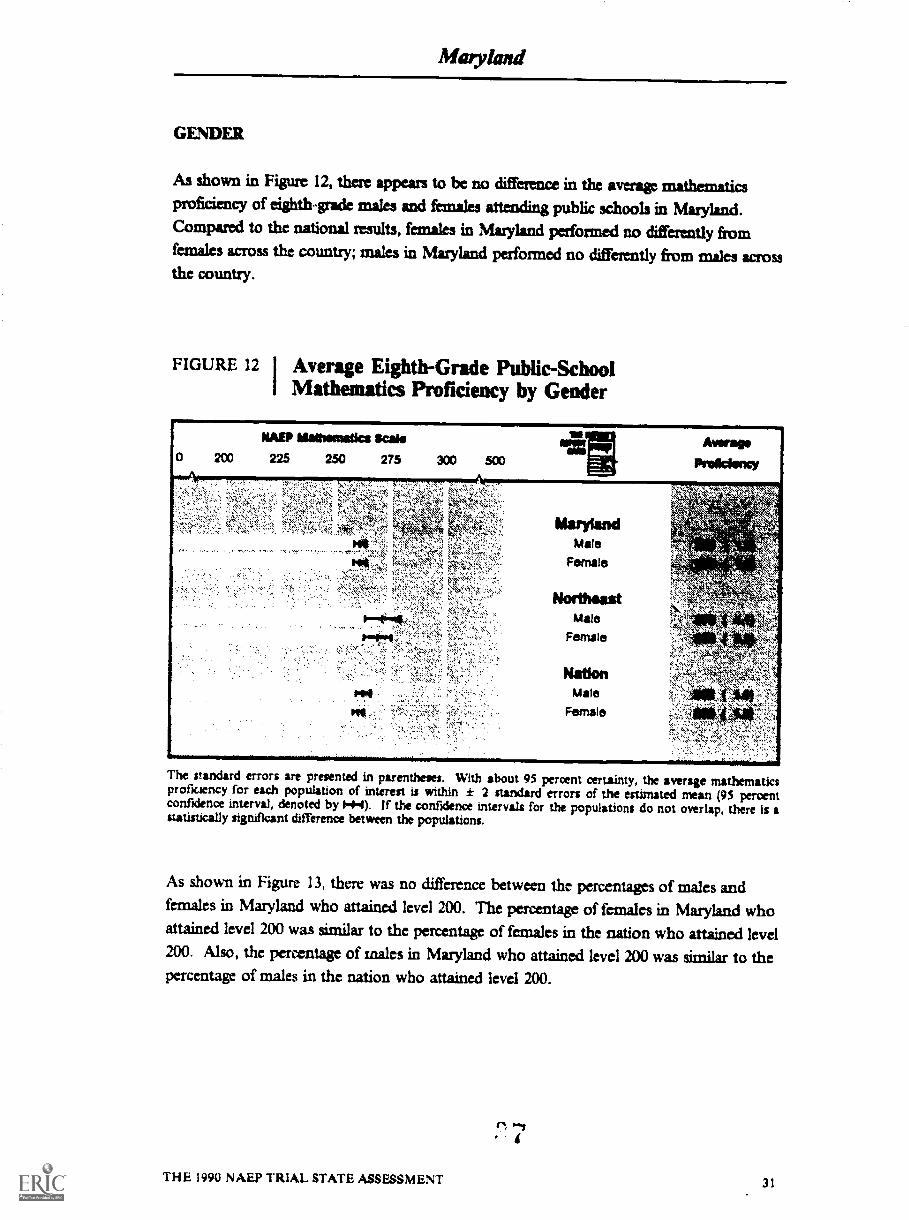
GENDER
As shown in Figure 12, there appears to be no difference in the average mathematicsproficiency of eighth,grade males and females attending public schools in Maryland.Compared to the national results, females in Maryland gemmed no differently fromfemales across the country; males in Maryland performed no differently from males acrossthe country.
FIGURE 12 I Average Eighth-Grade Public-SchoolMathematics Proficiency by Gender
The standard errors art presented in parentheses. With about 95 percent certainty, the average mathematicsproficiency for each population of interest is within 2 standard errors of the estimated mean (95 percentconfidence interval, denoted by 044). If the confidence intervals for the populations do not overlap, there is astatistically significant difference between the populations.
As shown in Figure 13, there was no difference between the percentages of males andfemales in Maryland who attained level 200. The percentage of females in Maryland whoattained level 200 was similar to the percentage of females in the nation who attained level200. Also, the percentage of wales in Maryland who attained level 200 was similar to thepercentage of males in the nation who attained level 200.
THE 1990 NAEP TRIAL STATE ASSESSMENT 31

FIGURE 13 I Levels of Eightb-Grade Public-Schooli Mathematics Proficiency by Gender
LEVEL 300
Stat. Male
Female
Raglan MaleFemale
Nation Mate
Female
LEVEL 250
State Male
Female
Region MaleFemale
Nation Male
Female
LEVEL 200
Stat Male
Female
Region MaleFemale
Nation Male
Female
0 20 40 100
Percentage at or Above Proficiency LevelsThe standard errors are presented in parentheses. With about 95 percent certainty, the valuefor each population of interest is within ± 2 standard errors of the estimated percentage (95
percent confidence interval, denoted by 144). If the confidence intervals for the populationsdo not overlap, there is a statistically significant difference between the populations.Proficiency level 350 is not presented in this figure because so few students attained that level.
32 THE 1990 NAEP TRIAL STATE ASSESSMENT
15 ( 1.3)
14 ( 1.4)
19 ( 3.3)
13 ( 3.8)
14 ( 1.7)
19 ( 1.3)
GO ( 1.8)
111 ( 2.2)
72 ( 5.8)
72 ( 4.5)
54 ( 2.0)
54 ( 1.8)
IS ( 0.6)N ( 0.7)
( 0.7)
99 ( 0.7)97 ( 0.9)
97 ( 0.6)

Maryland
In addition, there was no difference between the percentages of males and females inMaryland who attained level 300. The percentage of females in Maryland who attainedlevel 300 was similar to the peicentage of females in the nation who attained level 300.Also, the percentage of males in Maryland who attained level 300 was similar to the
percentage of males in the nation who attained level 300.
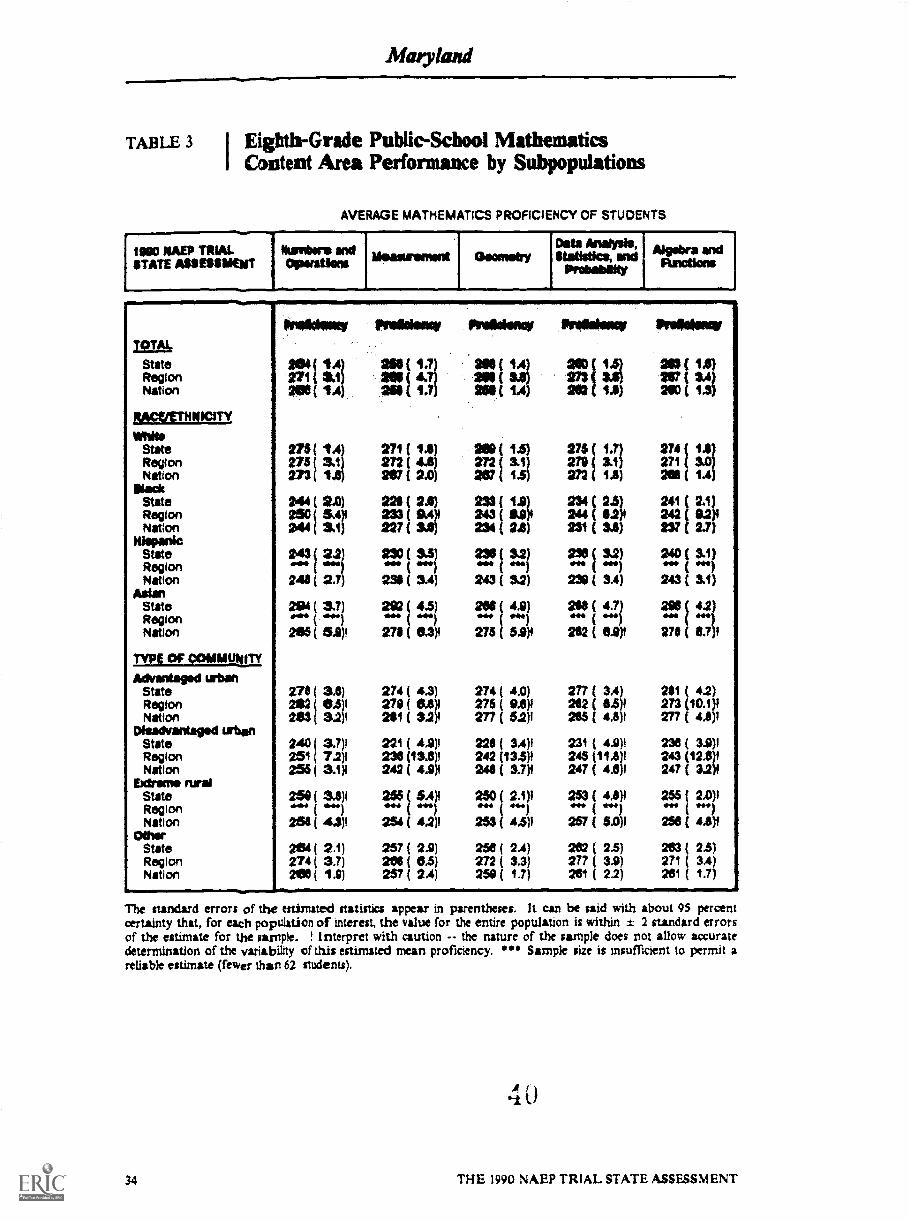
CONTENT AREA PERFORMANCE
Table 3 provides a summary of content area performance by race/ethnicity, type ofcommunity, parents' education level, and gender.
THE 1990 NAEP TRIAL STATE AssEssmENT 33
Matyland
TABLE 3 I Eighth-Grade Public-School MathematicsI Content Area Performance by Subpopulations
AVERAGE MATHEMATICS PROFICIENCY OF STUDENTS
1690 IMP TRIALSTATE ASSESSMENT
Ntrabore andOP6/11119119
GeometryData Analysis,Statistics, and
Probability
andFunctions
TOTA1,
StateRegionNation
RACFATHNICITY
MiteStateRegionNation
RadeStateRegionNation
HispanicStateRegionNation
AsianStateRegionNation
TYPE OF COVIlititiftl
Advantaged urbanStateRegionNation
Disadvantaged urbanStateRegionNation
Extreme ruralStateRegionNation
OtherStateRegionNation
Irnalldowy Pollak/ow Powasionai Preislioci PrOldsegi
211v tv 21411 ,16.31 :::(( 2A1
awl 1.4i 2011 1.771 20( 174 202 ( 14)
213 ( 122:70
775( 1.4) 271 ( 13) ase( 1 271 ( 1.7) 274 ( 1.1273 ( 3.1) 272 ( 4.6) 272 ( 279 ( 3.1) 271 ( 3.01273 ( 14) 267 ( 2.0) 267 ( i 212 ( 1.11) 21311 ( 14
244 ( 2.0 225 ( 2.e) 233( 14) 234 ( 23) 21 2.11.260 ( 5.4)4 233 ( 94)1 243 ( We 244 ( 111.2)4 242 9.2p244 ( 3.1) 227 ( 3..t 236 ( 23) 231 ( U) 237 2.7)
t) 1 .3:1?
243 ( 3.1)
296 ( 4.2)440 ( gin279 ( 11.7)4
24'.1 i iii 222 1 LI 222 1 Ul 236 / le21
244 ( 2.7) 239 ( 3.4) 243 ( 3.2) 238 ( 14)
294 ( 3.7) 222 ( 43) 2641 ( 4.9) 266 ( 4.7)0411,* ( ed ) 006 ( 0411 ( ***) Re* ( *In20 ( 51)1 271 ( 13.3); 275 i 54)4 292 ( 8.9)4
2311 36) 274 ( 4.3) 274 ( 4.0) 277 ( 34)262 ( 63)1 279 f 83)4 275 ( coy 292 ( 64)4263 ( 3,2)1 231 ( 3.2)4 277 ( 5.2)1 29$ ( 44)1
240 ( 3.7)1 221 ( 41)1 221 ( 231 ( 41)4251 ( 7.2p 236 (13.6)1 242 (13.5)4 245 (11 A)!2155( 3.1)1 242 ( 4.9)4 246 ( 3.7)4 247 ( 43)1
254 ( 33)14.4 ( 255 ((
54)4 250 ( 2.1)4 253 ( 4ip(
256 ( 43)1 254 ( 4,2)1 25$ ( 46)1 257 ( 5.0)1
264 2.1) 257 ( 2.9) 250 ( 2.4) 262 ( 2.5)274 ( 3.7) 265 ( 6.5) 272 ( 3.3) 277 ( 3.9)200 ( 1.9) 247 ( 24) 250 ( 1.7) 261 ( 2.2)
( 4.2)273 (10.1)4277 ( 44)4
230 (243 (12.6247 ( 3.2
255 (2,0)1444 .41256 ( 4.8)4
263 ( 2.5)271 ( 3.4)231 ( 1.7)
The standard errors of the estimated statistics appear in parentheses. It can be said with about 95 percentcertainty that, for each population of interest, the value for the entire population is within ± 2 standard errorsof the estimate for the sample. Interpret with caution -- the nature of the sample does not allow accuratedetermination of the variability of this estimated mean proficiency. *** Semple size is insufficient to permit areliable estimate (fewer than 62 students).
ft
34 THE 1990 NAEP TRIAL STATE ASSESSMENT
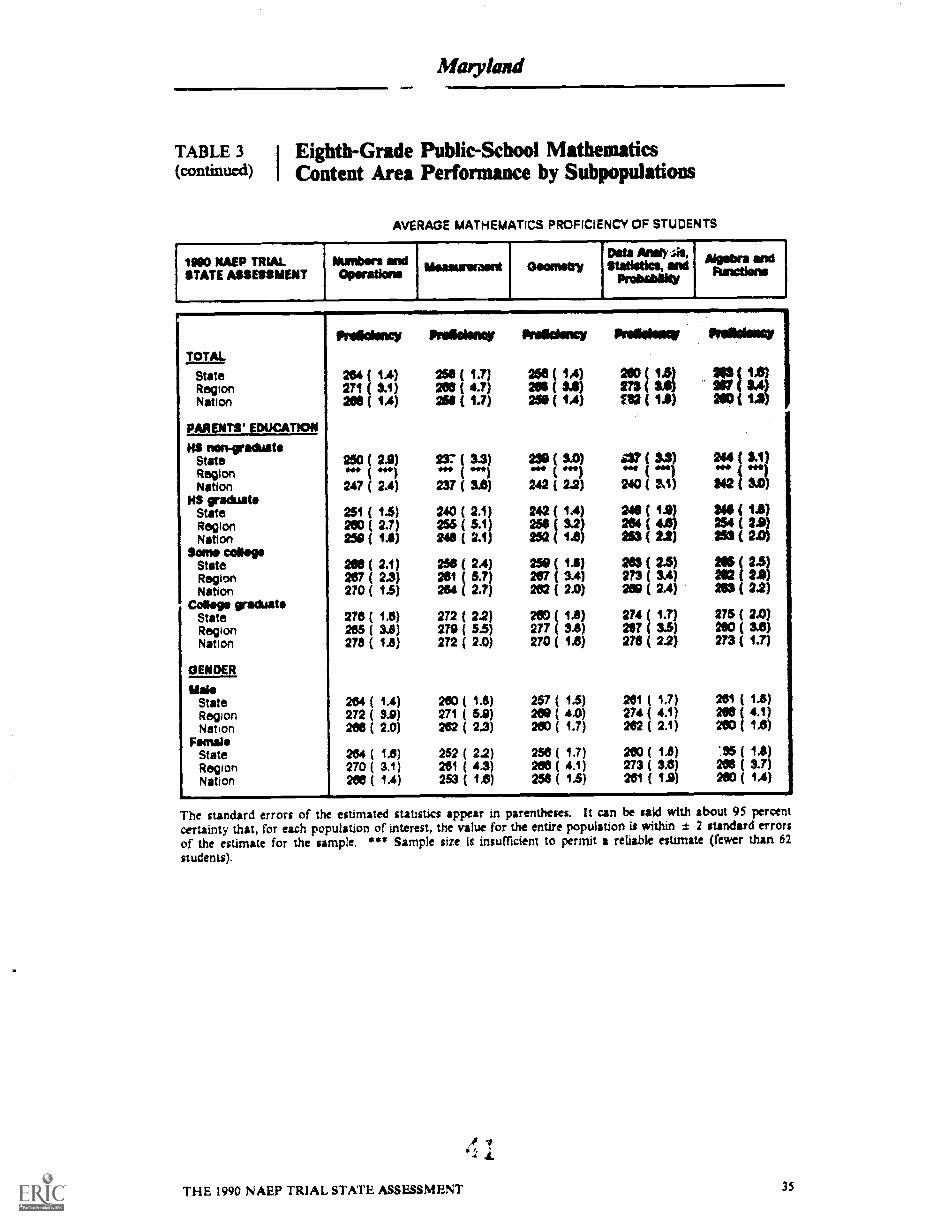
TABLE 3 I Eighth-Grade Public-School Mathematics(continued) Content Area Performance by Subpopulations
AVERAGE MATHEMATICS PROFICIENCY OF STUDENTS
1000 NAEP TRIALSTATE ASSESSMENT
Numbers andOperations aleaterereent Geometry
_Data Ansty.sis
'Statletka, andPivbabai ly
Algebra andRowans
yOTAL,
StateRegionNation
frolidency
264 ( 1.4)271 ( 11)239 ( 14)
Prifielenay
250 ( 1.7)200 ( 43)251 ( 1.7)
Prtilkaancy
256 ( 14)200 ( 34)200 ( 1.4)
Preisis095
24:
( 1.0)
PAREN73S EDUCATION
NS non-graduateStateRegion
250 ( 2.9)4441
237( 3.3)*No ***)
234I (SA) 37(13).4.Nation 247 ( 2.4) 237 ( 35) 242 ( 240 (
HS graduateState 251 ( 14) 240 ( 2.1) 242 ( 1.4) 240 ( 1.0)Region 200 ( 2.7) 256 ( 5.1) 254 ( 3.2) 264 ( 4.6)Nation 250 ( 11) 248 ( 2.1) 252 ( 15) 263 ( 2.2)
Saw collegeState MO ( 2.1) 256 ( 2.4) 259 ( 1.8) 243 ( 3.5)Region 267 ( 2.3) 261 ( 5.7) 267 ( 3.4) 273 ( 3A)Nahon 270 ( 14) 264 ( 2.7) 262 ( 2.0) 209 ( 2.4)
Coleco* graduatState 278 ( 1.6) 272 ( 2.2) 260(14) 274 (Region 205 ( 31) 279 ( 5.5) 277 ( 3,8) 297 ( 31)Nation 27$ ( 1.8) 272 2.0) 270 ( 15) 271 ( 22)
GENDER
MaioState 264 ( 1,4) 200 ( 14) 251 ( 14) 201 ( 1,7)Region 272 ( 3M 271 ( 5.9) 209 ( AA) 274 ( 4.1)Nation 206 ( 2.0) 262 ( 2.3) 200 ( 1.7) 202 ( 2.1)
Foetal.State 264 ( 1.6) 252 ( 2.2) 258 ( 1.7) 200 ( 14)Region 270 ( 31) 261 ( 4.3) 203 ( 4.1) 273 ( 3.8)Nation 268 ( 1.4) 253 ( 14) 258 ( 1.5) 281 ( 1.9)
11F98499999
2171:1
1.31
244 ( 11)
242 I 3424$ (254 ( 2.0263 ( 2
115 ( 24)292 ( 25)253 ( 2.2)
275 ( 2.0)280 ( 35)273 ( 1.7)
261 ( 1.8)286 ( 4.1)200 (14)
( 14)266 ( 3.7)200 ( 1,4)
The standard errors of the estimated statistics appear m parentheses. It can be said with about 95 percentcertainty that, for each population of interest, the value for the entire population is within ± 2 standard errorsof the estimate for the sample. *** Sample size is insufficient to permit a reliable estimate (fewer than 62students).
THE 1990 NAEP TRIAL STATE ASSESSMENT 3$
Maryland
ME NATION'SREPORT
CARD
PART TWO
Finding a Context for Understanding Students'
Mathematics Proficiency
Information on students' mathematics proficiency is valuable in and of itself, but itbecomes more useful for improving instruction and setting policy when supplemented withcontextual information about schools, teachers, an,' 'Indents.
To gather such information, the students participating in the 1990 Trial State Assessment,their mathematics teachers, and the principals or other administrators in their schools wereasked to complete questionnaires on policies, instruction, and programs. Taken together,the student, teacher, and school data help to describe some of the current practices andemphases in mathematics education, illuminate some of the factors that appear to berelated to eighth-grade public-school students' proficiency in the subject, and provide aneducational context for understanding information on student achievement. It is importantto note that the NAEP data cannot establish cause-and-effect links between various
contextual factors and students' mathematics proficiency. However, the results do provideinformation about important relationships between the contextual factors and proficiency.
The contextual information provided in Part l'wo of this report focuses on four majorareas: instructional content, instructional practices, teacher qualifications, and conditionsbeyond school that facilitate learning and instruction -- fundamental aspects of theeducational process in the country.
I .2
THE 1990 NAEP TRIAL STATE ASSESSMENT 37

Maryland
Through the questionnaires wiministered to students, teachers, and principals, NAEP isable to provide a broad picture of educational practices prevalent in American schools andclassrooms. In many instances, however, these findings contradict our perceptions of whatschool is like or educational researchers' su estions about what strategies work best to helpstudents learn.
For example, research has indicated new and more successful ways of teaching and learning,
incorporating more hands-on activities and student-centered learning techniques; however,
as described in Chapter 4, NAEP data indicate that classroom work is still dominated bytextbooks or worksheets. Also, it is widely recognized that home environment has anenomious impact on future academic achievement. Yet, as shown in Chapters 3 and 7,Irge proportions of students report having spent much more time each day watching
television than doing mathematics homework.
Part Two consists of five chapters. Chapter 3 discusses instructional content and itsrelationship to students' mathematics proficiency. Chapter 4 focuses on instructionalpractices -- how instruction is delivered. Chapter 5 is devoted to calculator use. Chapter6 provides information about teachers, and Chapter 7 examines students' home support forlearning.
38 THE 1990 NAEP TRIAL STATE ASSESSMENT
Maryland
CHAPTER 3
What Are Students Taught in Mathematics?
In response to the continuing swell of information about the poor mathematicsachievement of American students, educators and policymakers have recommendedwidespread reforms that are changing the direction of mathematics education. Recentreports have called for fundamental revisions in curriculum, a reexamination of trackingpractices, improved textbooks, better assessment, and an increase in the proportions of
students in high-school mathematics programs.' This chapter focuses on curricular and
instructional content issues in Maryland public schools and their relationship to students'
proficiency.
Table 4 provides a profile of the eighth-grade public scho,.)ls' policies and staffing. Some
of the salient results are as follows:
About three-quarters of the eighth-grade students in Maryland (78 percent)were in public schools where mathematics was identified as a specialpriority. This compares to 63 percent for the nation.
3 Curtls McKnight, et al., The Underachieving Curriculum Assessing U.S. School Mathematics from anInternational Perspective, A National Report on the Second International Mathematics Study (Champaign,
Stipes Publishmg Company,
Lynn Steen, Ed. Everybody Counts A Report to the Nation on the Future of Mathematics Education(Washington, DC: National Academy Press, 1989).
4
THE 1990 NAEP TRIAL STATE ASSESSMENT 39

Maryland
In Maryland, 92 percent of the students could take an algebra course ineighth grade for high school course placement or credit.
All of the students in Maryland (100 percent) were taught mathematics byteachers who teach only one subject.
Almost all (93 percent) of the students in Maryland were typically taughtmathematics in a class that was grouped by mathematics ability. Abilitygrouping was less prevalent across the nation (63 percent).
TABLE 4 I Mathematics Policies and Practices inMaryland Eighth-Grade Public Schools
PERCENTAGE OF STUDENTS
1990 NAEP TRIAL STATE ASSESSMENT Maryland Northeast Nation
Percentage of eighth-grade students in publicschools that identified mathematics asremising spacial emphasis in school-widegoals and objectives, instruction, in-servicetraining, etc.
Percentage of eighth-grade public-school studentswho are offerod a course in algebra forhigh school course placement or credit
Percentage of eighth-grade students in publicschools who are tought by tam:tsars votto teachonly mathematics
Percentage of eighth-grade students in publicschools who are assigned to a nuthamatIcsclass by their ability in mathematics
Percentage of eighth-grade students in publicschools who receive four or more hours ofmathematics kutwction par weak
flehal
78 (
22 (
4.4)
2.1)
Pirowdage
45 (18.5)
90 ( 7.3)
Povedivis
03 ( 5.9)
78 ( 4.6)
100 ( 0.0) 100 ( 0.0) gi ( 3.3)
93 ( 1.1) 71 (10.1) 53 ( 4.0)
39 ( 3.0) 14 ( 5.5) 30 ( 4.4)
The standard errors of the estimated statistics appear in parentheses. It can be said with about 95 percentcertainty that, for each population of interest, the value for the entire population is within ± 2 standard errorsof the estimate for the sample.
40 THE 1990 NAEP TRIAL STATE ASSESSMENT

Malyland
CURRICULUM COVERAGE
To place students' mathematics proficiency in a cuniculum-related context, it is necessaryto examine the extent to which eighth graden in Maryland are taking mathematics courses.Based on their responses, shown in Tabk 5:
A smaller percentage of students in Maryland were taking eighth-grademathematics (38 percent) than were taking a course in pre-algebra oralgebra (59 percent). Across the nation, 62 percent were takingeierth-grade mathematics and 34 percent were taking a course inpre-algebra or algebra.
Students in Maryland who were enrolled in preAlpbra or algebra coursesexhibited higher average mathematics proficiency than did those who WC=in eighth-grade mathematics courses. This result is not unexpected sinceit is assumed that students enrolled in pre-algebra and algebra courses maybe the more abk students who have already mastered the generaleighth-grade mathematics curriculum.
TABLE 5 I Students' Reports on the Mathematics OassI They Are Taking
PERCENTAGE OF STUDENTS ANDAVERAGE MATHEMATICS PROFICIENCY
IMO NAVY TN1A1. STATE ASSESSMENT Alar*and Northeast Nation
What kind of mathematics class are youPeneetlie Permeda. 041r011111.1
taking this year?WWI
Preielancy
31 ( 2.0)237 ( 1.4)
10111
Pralkiistav
13 ( SA)230 ( 2.0)
snitPreadsol0
e2 ( 2.1)25114)(
Bgh St-grads maSionsatics
Pm-algebra ( 1.4) 111 ( SI) 10 ( 1.9)291 ( 1.8) 271 ( 0.7)1 272 ( 2.4)
ANNIbra 27 ( 1.5) 11 ( SS) 15 ( 1.2)291 ( 4,7) 297 ( VI) 290 ( 2.4)
The standard errors of the estimated statistics appear in parentheses. It can be said with about 95 percentcertainty that, for eath population of interest, the value for the entire population is within ± 2 standard errorsof the estimate for the sample. The percentages may not total 100 percent because a small number of studentsreported taking other mathematics courses. ! Interpret with caution the nature of the sample does not allowaccurate determination of the variability of this estimated mean proficiency.
THE 1990 NAEP TRIAL STATE ASSESSMENT 41

Maryland
Further, from Table A5 in the Data Appendix:4
About the same pereeniage of females (61 percent) and males (56 percent)in Maryland were enrolled in pre-algebra or algebra courses.
In Maryland, 62 percent of White students, 54 percent of Black students,42 percent of Hispanic students, and 81 percent of Asian students wereenrolled in pre-algebra or algebra courses.
Similarly, 72 percent of students attending schools in advantaged urbanareas, 46 percent in schools in disadvantaged urban areas, 52 percent inschools in extreme rural areas, and 59 percent in schools in areas classifiedas "other" were enrolled in pre-algebra or algebra courses.
MATHEMATICS HOMEWORK
To illuminate the relationship between homework and proficiency in mathematics, theassessed students and their teachers were asked to report the amount of time the studentsspent on mathematics homework each day. Tables 6 and 7 report the teachers' and
students' responses, respectively.
According to their teachers, the greatest percentage of eighth-grade students in publicschools in Maryland spent either 15 or 30 minutes doing mathematics homework each day;
according to the students, the greatest percentage spent either 15 or 30 minutes doingmathematics homework each day. Across the nation, according to their teachers, thelargest percentage of students spent either 15 or 30 minutes doing mathematics homework
each day, while students reported spending either 15 or 30 minutes daily.
Further, as reported by their teachers (Table 6 and Table A6 in the Data Appendix):
In Maryland, 3 percent of the students spent no time each day onmathematics homework, compared to 1 percent for the nation. Moreover,4 percent of the students in Maryland and 4 percent of the students in thenation spent an hour or more on mathematics homework each day.
For every table in the body of the report that Includes estimates of average proficiency. the Data Appendixprovides a corresponding table presenting the results for the four subpopulations -- race ethnicity, type ofcommunity, parents' education level, and gender.
42 THE 1990 NAEP TRIAL STATE ASSESSMENT

Matyland
The results by race/ethnicity show that 4 percent of White students,5 percent of Black students, 3 percent of thymic students, and 9 percentof Asian students spent m hour or more on mathematics homework eachday. In comparison, 2 percent of White students, 6 percent of Blackstudents, 3 percent of Ifspanic students, and I percent of Asian studentsspent no time doing mathematics homework.
In addition, 4 percent of students Antall:11g schools in advantaged urbanareas, 6 percent in schools in disadvantaged urban OWLS, 0 percent inschools in extreme rural areas, and 6 percent in schools in areas classifiedas "other" spent an how or more on mathematics homework daily. Incomparison, 0 percent of students attending schools in advantaged urbanareas, $ percent in schools in disadvantaged urban anas, 0 percent inschools in extreme rural arras, and 3 percent in schools in areas classifiedas "other" spent no time doing mathematics homework.
TABLE 6 Teuhers' Reports on the Amount of ThneStudents Spent on Mathematics HomeworkEach Day
PERCENTAGE OF STUDENTS ANDAVERAGE MATHEMATICS PROFICIENCY
MCI MEP TRIAL STATE ASSESSMENT
About how much time do studentS spendon mathematics homework each day?
Nene
16 minutes
30 minutes
45 minutes
An how or more
114roomiass Pomade. Pireoulagssad awl
Prollaioncy Prolatiour Prelleleasy
3 ( 1.1)237 ( My
0 i 0.014.1 f Eli
se ( 2.8) 54 (13.2) 4$ ( 42)252 ( 2.1) 284 ( 4.1)1 258 ( 23)
48 ( 2.5) 35 (12.5) 4$ ( 43)205 ( 2.2) 270 ( 4.1)1 2011 ( 113)
1 ( 1.2)*MI 4Mbill
9( 2.7) 10 ( 13)289 ( 5.1) 272 ( 5.7)4
273 ( 5.8)4 «3 (( g 2711 ( SMI4 ( 0.9)4 ( 1.3)
The standard errors of the estimated statistics appear in arentheles. It can be said with about 95 percentwrtainty that, for each population of interest, the value for the entire population is within ± 2 standard errorsof the estimate for the sample. t Interpret with caution the nature of the sample does not allow accuratedetermination of the variability of this estimated mean proficiency. *** Sample size is insufficient to permit areliable estimate (fewer than 62 students).
THE 1990 NAEP TRIAL STATE ASSESSMENT 43
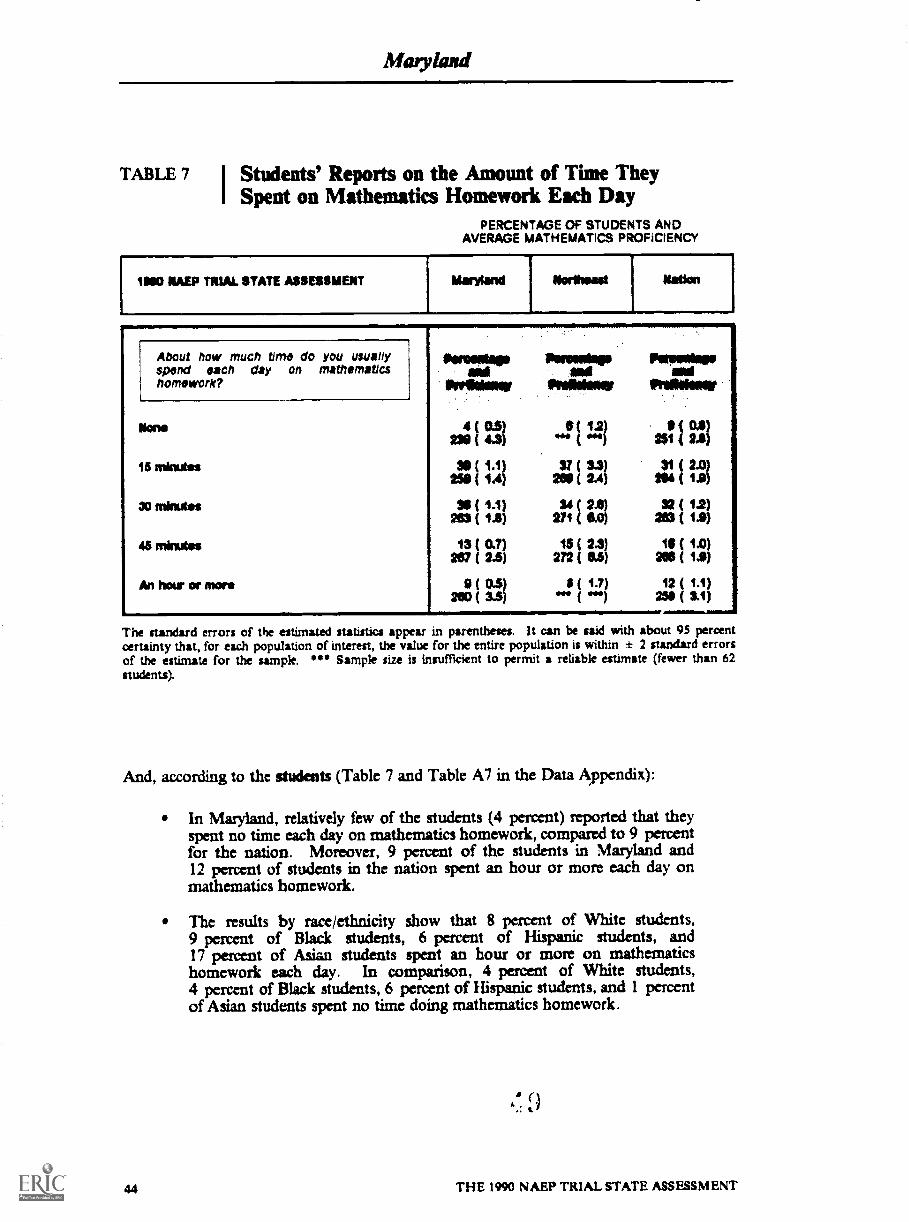
Maly laird
TABLE 7 I Students' Reports on the Amount of Time TheyI Spent on Mathematics Homework Each Day
PERCENTAGE OF STUDENTS ANDAVERAGE MATHEMATICS PROFiCIENCY
1110 NAEP TRIAL STATE ASSESSMENT Mara land Norihead Nation
About how much time do you usuallyspend each day on mathematicshomework?
None
15 minutes
30 minutes
46 minutes
An how or mere
lisessetimp Perm Imp Pima hopSid
ihrillOmer 11101.4,
2 ( 4.3)4 ( 0.11) *** ( Me
1 ( 11 1 ( 0.1)111) 251 4 2.4)
30 ( 1.1) 57 ( 3.3) 31 ( 2.0)250 ( 14) 2N ( 2.4) SO ( 1.11)
38 ( 11) 20.14 32 ( 12)263 ( 1.8)
2g i20 ( 1.0)
13 ( OS) 45 ( 2.3) 11 ( 1.0)267 ( 2.5) 272 ( SA) WS ( 1.9)
9 1 0.1 II ( 1.?) 12 ( 1.1)*we ( o) 251I ( 3.1)
The standard errors of the estimated statistics appear in parentheses. It can be said with about 95 percentcertainty that, for each population of interest, the value for the entire population is within ± 2 standard errorsof the estimate for the sample. "1* Sample size is insufficient to permit a reliable estimate (fewer than 62students).
And, according to the students (Table 7 and Table A7 in the Data Appendix):
In Maryland, relatively few of the students (4 percent) reported that theyspent no time each day on mathematics homework, compared to 9 percentfor the nation. Moreover, 9 percent of the students in Maryland and12 percent of students in the nation spent an hour or more each day onmathematics homework.
The results by race/ethnicity show that 8 percent of White students,9 percent of Black students, 6 parent of Hispanic students, and17 percent of Asiisin. students spent an hour or more on mathematicshomework each day. In comparison, 4 percent of White students,4 percent of Black students, 6 percent of Hispanic students, and 1 percentof Asian students spent no time doing mathematics homework.
44 THE 1990 NAEP TRIAL STATE ASSESSMENT

Maryland
In addition, 8 percent of students attending schools in advantaged urbanareas, 12 percent in whools in disadvantaged urban areas, 10 percent inschools in extreme rural areas, and 8 percent in schools in areas classifiedas "other" spent an hour or molt on mathematics homework daily. Incomparison, 2 percent of students attending schools in advantaged urbanareas, 5 percent in schools in disadvantaged urban areas, 8 percent inschools in extreme rural areas, and 4 percent in schools in areas classifiedas "other" spent no time doing mathematics homework.
INSTRUCTIONAL EMPHASIS
According to the approach of the National Council of Teachers of Mathematics (NCTM),students should be taught a broad range of mathematics topics, including number concepts,computation, estimation, functions, algebra, statistics, probability, geometry, andmeasurement.' Because the Trial State Assessment questions were designed to measurestudents' knowledge, skills, and understandings in these various content areas -- regardlessof the type of mathematics class in which they were enrolled -- the teachers of the assessedstudents were asked a series of questions about the emphasis they planned to give specificmathematics topics during the school year. Their responses provide an indication of thestudents' opportunity to learn the various topics covered in the assessment.
For each of 10 topics, the teachers were asked whether they planned to place "heavy,""moderate," or "little or no" emphasis on the topic. Each of the topics corresponded toskills that were measured in one of the five mathematics content areas included in the TrialState Assessment:
Numbers and Operations. Teachers were asked about emphasis placed onfive topics: whole number operations, common fractions, decimalfractions, ratio or proportion, and percent.
Measurement. Teachers were asked about emphasis placed on one topic:measurement.
Geometry. Teachers were asked about emphasis placed on one topic:geometry.
Data Analysis, Statistics, and Probability. Teachers were asked aboutemphasis placed on two topics: tables and graphs, and probability andstatistics.
Algebra and Functions. Teachers were asked about emphasis placed onone topic: algebra and functions.
5 National Council of Teachers of Mathemaucs, Curriculum and Evaluation Standards for School lvfathematks(Reston, VA: National Council of Teachers of Mathematics, 1989).
5 0THE 1990 NAEP TRIAL STAT.6 ASSESSMENT 45
Maryland
The responses of the assessed students' teachers to the topic emphasis questions for eachcontent area were combined to create a new variable. For each question in a particularcontent area, a value of 3 was given to "heavy emphasis" responses, 2 to "moderateemphasis" responses, and 1 to "little or no emphasis" responses. Each teacher's responseswere then averaged over all questions related to the particular content area.
Table 8 provides the results for the extreme categories -- "heavy emphasis" and "little orno emphasis" -- and the average student proficiency in each content area. For the emphasis
questions about numbers and operations, for example, the proficiency reported is theaverage student performance in the Numbers and Operations content area.
Students whose teachers placed heavy instructional emphasis on Algebra and Functionshad higher proficiency in this content area than students whose teachers placed little or noemphasis on Algebra and Functions. Students whose teachers placed heavy instructionalemphasis on Numbers and Operations and Measurement had lower proficiency in thesecontent areas than students whose teachers placed little or no emphasis on the same areas.
5
46 THE 199O NAEP TRIAL STATE ASSESSMENT

Maly land
TABLE 8 I Teachers' Reports on the Emphasis Given toI Specific Mathematics Content Areas
PERCENTAGE OF STUDENTS ANDAVERAGE MATHEMATICS PROFICIENCY
11180 MAE? TRIAL STATE ASSESSMENT Mandand Northeast Nadon
41/
Teacher "emphasis" categories byParaeaalas
salPareaalseil
aidIleramaa.
content areas Prallaimay
*nears and OperationsHeavy emphasis 35 ( 2.6) 41 (6.9) 41 (
( 1.0) 20I ( 2A) 240 ( 13)Little or no emphasis 24 ( 2.1) 21 ( 6.5) 15 ( 2.1)
298 ( 2.3) «a* ( 287 ( 3.4)
ManumittingHeavy emphasis 21 ( 2.8) 32 (113) 17 ( 3.0)
237 ( 3.9) 257 (111)1 250 ( SA)Little Of no emphasis 37 ( 22) 34 ( 11.3) 33 ( 4.0)
278 ( 3.1) 292 ( 4.5), 272 ( 4.0)
Oaontatry
Heavy emphasis 22 ( 23) 44 (11.9) 28 ( 3.8)254 ( 3.1) 264 ( 13.1)I 260 ( 3.2)
Little Of ITO emphasis 30 ( 22) 9 ( 1.9) 21 ( 3.3)264 ( 2.7) ( 264 ( 5.4)
Data Analysis, Statistics, and Probability
Heavy emphasis 14 ( 2.0) 12 ( 6.1) 14 ( 2.2)257 ( 4.5) *41 269 ( 4.3)
Little Of r10 emphasis 57 ( 23) 48 (10.1) 53 ( 4.4)265 ( 2.1) 279 ( 5.4)1 261 ( 2.9)
Algebra and Functions
Heavy emphasis 51 ( 2.4) 52 (11.5) 443 ( 3.6)283 ( 2.3) 273 ( 0.6)1 275 ( 2.5)
Little or no emphasis 22 ( 2.0) 14 ( 6.6) 20 ( 3.0)232 ( 2.8) 4.44. 243 ( 3.0)
The standard errors of the esumated statistics appear in parentheses. It can be said with about 95 percentcertainty that, for each population of interest, the value for the entire population is within ± 2 standard errorsof the estimate for the sample. The percentages may not total 100 percent because the "Moderate emphasis"category is itot included. ! interpret with caution - the nature of the sample does not allow accuratedetermination of the variability of this estimated mean proficiency. *** Sample size is insufficient to permitareliable estimate (fewer than 62 students).
5 2
THE 1990 NAEP TRIAL STATE ASSESSMENT 47

Maryland
SUMMARY
Although many types of mathematics learning can take place outside of the schoolenvironment, there are some topic areas that students are unlikely to study unless they arecovered in school. Thus, what students are taught in school becomes an important
determinant of their achievement.
The information on curriculum coverage, mathematics homework, and instructionalemphasis has revealed the following:
About three-quarters of the eighth-grade students in Maryland (78 percent)were in public schools where mathematics was identified as a specialpriority. This compares to 63 percent for the nation.
In Maryland, 92 percent of the students could take an algebra course ineighth grade for high-school course placement or credit.
A smaller percentage of students in Maryland were taking eighth-grademathematics (38 percent) than were taking a course in pre-algebra oralgebra (59 percent). Across the nation, 62 percent were takingeighth-grade mathematics and 34 percent were taking a course inpre-algebra or algebra.
According to their teachers, the greatest percentage of eighth-grade studentsin public schools in Maryland spent either 15 or 30 minutes doingmathematics homework each day; according to the students, most of themspent either 15 or 30 minutes doing mathematics homework each day.Across the nation, teachers reported that the largest percentage of studentsspent either 15 or 30 minutes doing mathematics homework each day,while students reported either 15 or 30 minutes daily.
In Maryland, relatively few of the students (4 percent) reported that theyspent no time each day on mathematics homework, compared to 9 percentfor the nation. Moreover, 9 percent of the students in Maryland and12 percent of students in the nation spent an hour or more each day onmathematics homework.
Students whose teachers placed heavy instructional emphasis on Algebraand Functions had higher proficiency in this content area than studentswhose teachers placed little or no emphasis on Algebra and Functions.Students whose teachers placed heavy instructional emphasis on Numbersand Operations and Measurement had lower proficiency in these contentareas than students whose teachers placed little or no emphasis on the sameareas.
48 THE 1990 NAEP TRIAL STATE ASSESSMENT
Maryland
CHAPTER 4
yazx
1118.111111111111111111111 WRNSSU 111111111.11 is11111111M114/11111MOIIII11111111111111111111111111111111111. MU AIMURMA-4neuall asta
urawipmpeas m.smesism sumo411111111111111111111111111
How Is Mathematics Instruction Delivered?
Teachers facilitate learning through a variety of instructional practices. Because a particularteaching method may not be equally effective with all types of students, selecting andtailoring methods for students with different styles of learning or for those who come fromdifferent cultural backgrounds is an important aspect of teaching.'
An inspection of the availability and use of resources for mathematics education canprovide insight into how and what students arc learning in mathematics. To provideinformation about how instruction is delivered, students and teachers participating in theTrial State Assessment were asked to report on the use of various teaching and learningactivities in their mathematics classrooms.
AVAILABILITY OF RESOURCES
Teachers' use of resources is obviously constrained by the availability of those resources.Thus, the assessed students' teachers were asked to what extent they were able to obtainall of the instructional materials and other resources they needed.
° National Council of Teachers of Mathematics, Professional Standarcis for the' Teaching of Mathematics(Reston, VA: National Council of Teachers of Mathematics, 1991).
THE 1990 NAEP TRIAL STATE ASSESSMENT 49
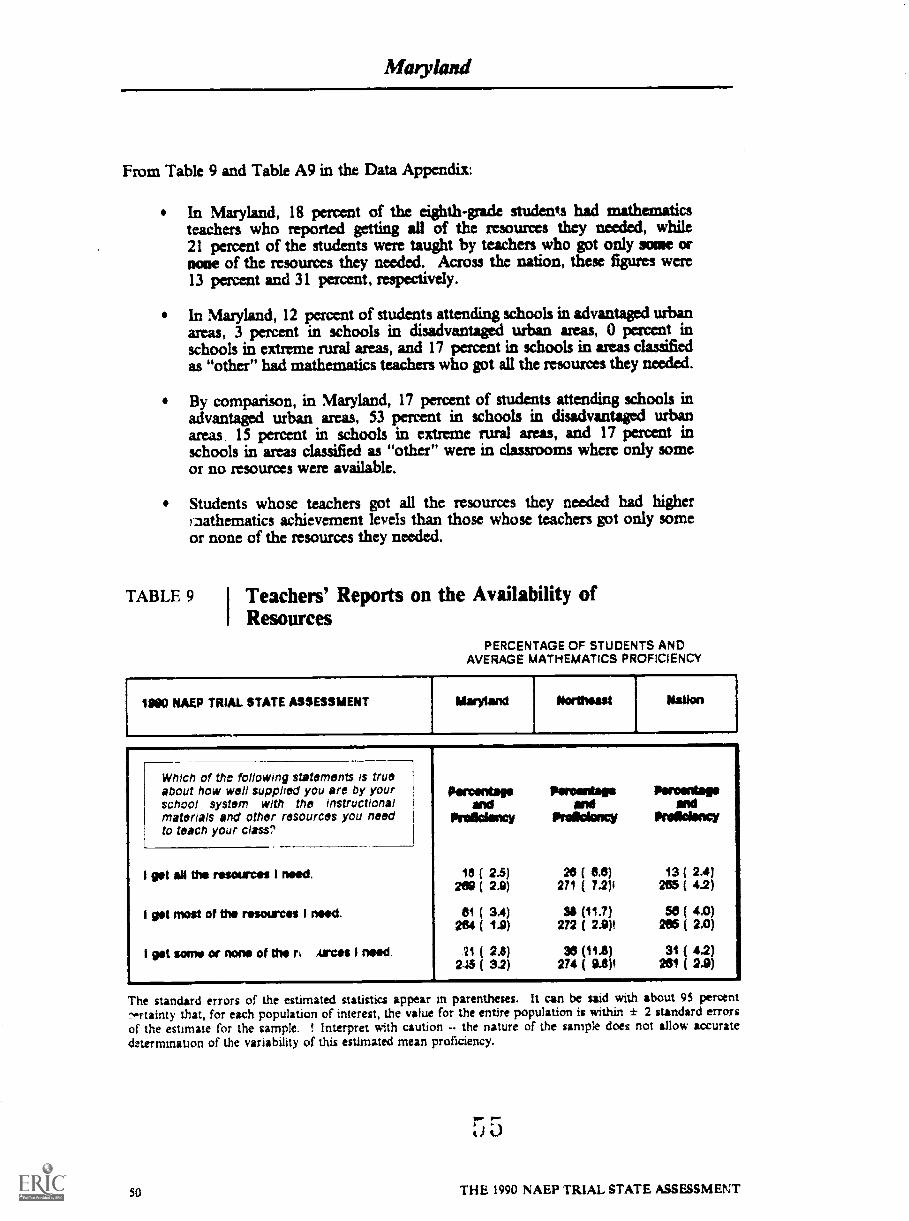
Maryland
From Table 9 and Table A9 in the Data Appendix:
In Maryland, 18 percent of the eighth-grade students had mathematicsteachers who reported getting all of the resources they needed, while21 percent of the students were taught by teachers who got only some ornem of the resources they needed. Across the nation, these figures were13 percent and 31 percent, respectively.
In Maryland, 12 percent of students attending schools in advantaged urbanareas, 3 percent in schools in disadvantaged urban areas, 0 percent inschools in extreme rural areas, and 17 percent in schools in areas classifiedas "other" had mathematics teachers who got all the resources they needed.
By comparison, in Maryland, 17 percent of students attending schools inadvantaged urban areas, 53 percent in schools in disadvantaged urbanareas 15 percent in schools in extreme rural areas, and 17 percent inschools in areas classified as "other" were in classrooms where only someor no resources were available.
Students whose teachers got all the resources they needed had higherizathematics achievement levels than those whose teachers got only someor none of the resources they needed.
TABLE 9 I Teachers' Reports on the Availability ofI Resources
PERCENTAGE OF STUDENTS ANDAVERAGE MATHEMATICS PROFICIENCY
NAEP TRIAL STATE ASSESSMENT
Which of the following statements is trueabout how well supplied you are by yourschool system with the instructionalmaterials and other resources you needto teach your class',
I get ad the resources I need.
get most of the resources I need.
I gat some or none of the ri Ayres I need.
Percentage Percentage Percentageand and and
Pre/Wein Proficiency Prilideacy
18 ( 2.5) 28 ( 6.6) 13 ( 2.4)269 ( 2,8) 271 ( 7.2)1 263 ( 42)
61 ( 3.4) 38 (11.7) 56 ( 4,0)264 ( I.9) 272 ( 2.9)1 2e5 ( 2.0)
21 ( 2.8) 36 (11.8) 31 ( 4.2)243 ( 3.2) 274 ( 9.8)1 261 ( 2.2)
The standard errors of the estimated statistics appear in parentheses. It ean be said with about 95 percent,...rtitinty that, for each population of interest, the value for the entire population is within 2 standard errorsof the estimate for the sample. ! Interpret with caution the nature of the sample does not allow accuratedeterminauon of the variability of this estimated mean proficiency.
50 THE 1990 NAEP TRIAL STATE ASSESSMENT
Maryland
P ATTERNS IN CLASSROOM INSTRUCTION
Research in education and cggnitive psychology has yielded many insights into the typesof instructional activities that facilitate students' mathematics learning. Increasing the use
of "hands-on" examples with concrete materials and placing problems in real-worldcontexts to help children construct useful meanings for mathematical concepts are amongthe recommended approaches.' Students' responses to a series of questions on theirmathematics instruction provide an indication of the extent to which teachers are makinguse of the types of student-centered activities suggested by researchers. Table 10 presents
data on patterns of classroom practice and Table 11 provides information on materials usedfor classroom instruction by the mathematics teachers of the assessed students.
According to their teachers:
More than half of the students in Maryland (56 percent) workedmathematics problems in small groups at least once a week; relatively fewnever worked mathematics problems in small groups (8 percent).
The largest percentage of the students (67 percent) used objects like rulers,counting blocks, or geometric shapes less than once a week; some neverused such objects (1 I percent).
In Maryland, 57 percent of the students were assigned problems from amathematics textbook almost every day; 10 percent worked textbookproblems about once a week or less.
About half of the students (47 percent) did problems from worksheets atleast several times a week; about one-quarter did worksheet problems lessthan weekly (23 percent).
' Thomas Romberg, "A Common Curriculum for Mathematics," Individual Difierences and the CommonCurriculum Eighty.second Yearbook of the National Society for the Study of Education (Chicago, IL:University of Chicago Press, 1983).
r ot)c.)
THE 1990 NAEP TRIAL STATE ASSESSMENT 51
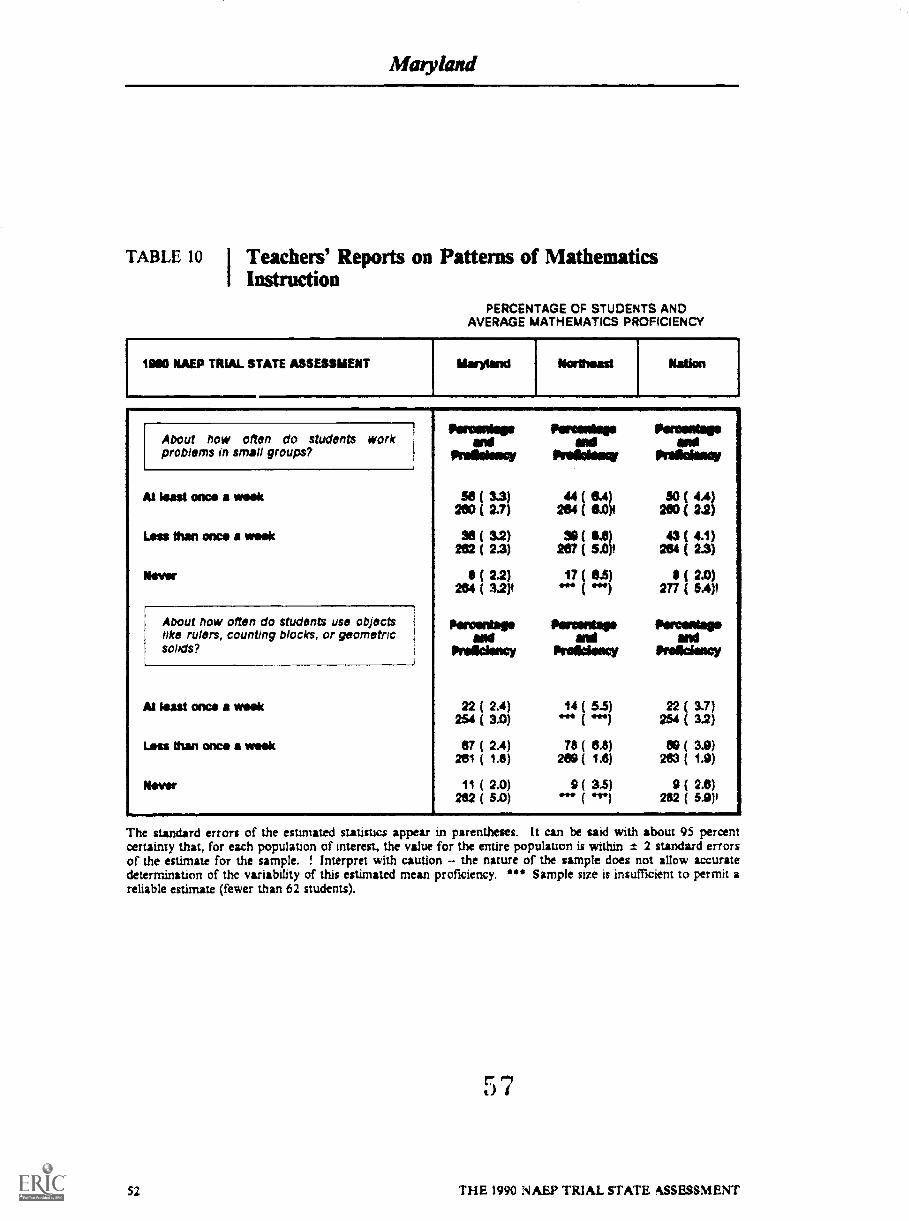
Maryland
TABLE 10 I Teachers' Reports on Patterns of MathematicsI Instruction
PERCENTAGE OF STUDENTS ANDAVERAGE MATHEMATICS PROFICIENCY
1990 NAEP TRIAL STATE ASSESSMENT
About how often do students workproblems in small groups?
AI least once a week
Less thin once a week
Never
About how often do students use objectslike rulers, counting blocks, or geometricsolids?
Al least once a week
Less than once a week
Now
fronamemp Pairsolop Olortomiageand Ind and
Pralidency NW PrOkihma,
36 ( 3.3) 30 ( 44)260 ( 2.7) at 1 88:3 260 ( 2.2)
36 ( 52) 43 ( 4.1)262 ( 2.3) 2:11 1.01, 264 ( 23)
6 ( 2.2)264 ( 3.2)4
17 ( IS)" ( 1 II ( 2.0)
277 ( 54)4
Percentage Percentap Perceatageand and end
Prolickstcy Preficioncy Proadincy
22 (254 (
2.4)3.0)
14 (ivit
5.5)***)
22 (254 (
3.7)32)
67 ( 2.4) 78 ( 6.8) es ( 3.9)261 ( 1.6) 269 ( 1.6) 263 ( 1.9)
11 ( 2.0) 9 ( 3.5) 9 ( 2.6)262 ( 5.0) 252 ( 5.9)i
The standard errors of the estimated statistics appear in parentheses. It can be said with about 95 percentcertainty that, for each population of interest, the value for the entire population is within ± 2 standard errorsof the estimate for the sample. ! Interpret with caution the nature of the sample does not allow accuratedetermination of the variability of this estimated mean proficiency. *** Sample size is insufficient to permit areliable estimate (fewer than 62 students).
5 7
52 THE 1990 NAEF TRIAL STATE ASSESSMENT

Maryland
TABLE 11 I Teachers' Reports on Materials forI Mathematics instruction
PERCENTAGE OF STUDENTS ANDAVERAGE MATHEMATICS PROFICIENCY
NAEP TRIAL STATE ASSESSMENT Maryland Northeast Madan
About how often do students do problems Paraudaga Parasaingelad
floorseidapfrom textbooks? iketifiesig
67 ( 33)267 ( 2.0)
2511 1
WA***
67(270
2r1
63)( 4.4)
andarlikkadd
( 3.4)207 ( 16)
31 ( 3.1)254 ( 2.11)
Almost every day
Several tines a wash
Aland once a *web or less 10 ( 11 131 2.11) ( 1.8)247 ( 4.1) 0.21 200 ( 5.1)4
About how often do students do problemson worksheets? Penmentage Parawdag.
andParasahe
andPraidatcy Proddefflay Madam
Al least several limes a week 47 ( 2.5) 53 (11.3) 34 ( 3.0)257 ( 2.5) 262 ( 4.5)! 250 ( 2.3)
About owe a week 29 ( 3.1) se ( 8.2) 33 ( 3.4)( 3.2) 270 ( 3.4)4 260 ( 2.3)
Less than weekly 23 2.8) 15 ( 4.6) 32 ( 3.6)262 ( 3.4) ) 274 ( 2.7)
The standard errors of the estimated statistics appear in parentheses. It can be said with about 95 percentcertainty that, for each population of interest, the value for the entire population it within ± 2 standard errorsof the estimate for the sample. I Interpret with caution -- the nature of the sample does not allow accuratedetermination of the variability of this estimated mean proficiency. *** Sample size is insufficient to permit areliable estimate (fewer than 62 students).
The next section presents the students' responses to a corresponding set of questions, aswell as the relationship of their responses to their mathematics proficiency. It alsocompares the responses of the students t3 those of their teachers.
THE 1990 NAEP TRIAL STATE ASSESSMENT 53
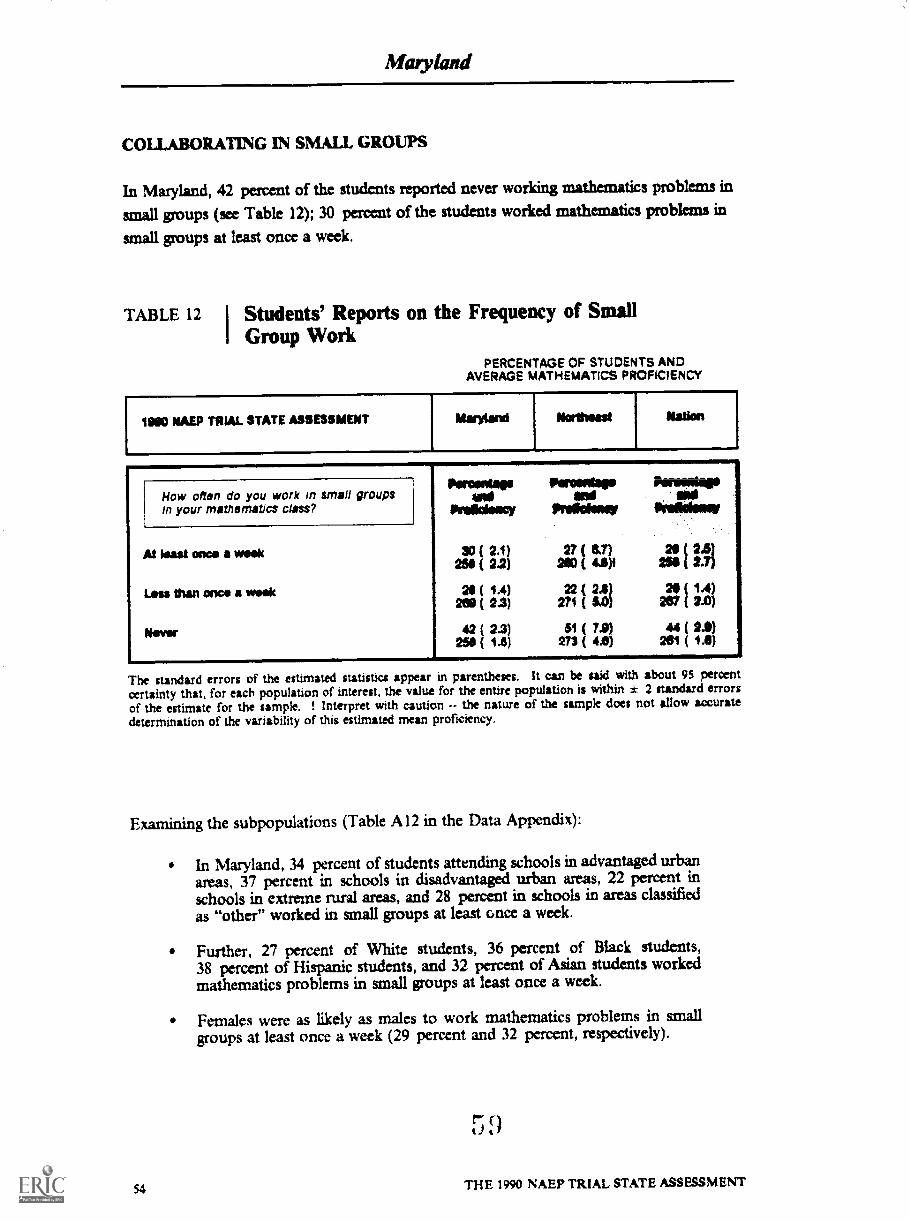
Maayland
COLLABORATING IN SMALL GROUPS
In Maryland, 42 percent of the students reported neves workingmathematics problems in
small groups (sec Table 12); 30 percent of the students workedmathematics problems in
small groups at least once a week.
TABLE 12 1 Students' Reports on the Frequency of SmallGroup Work
PERCENTAGE OF STUDENTS ANDAVERAGE MATHEMATICS PROFICIENCY
ISSO NAEP TRIAL STATE ASSESSMENT Maryland Northeast Nation
How often do you work in small groupsin your mathematics class?
At WM moo a week
Lass than once a weak
Now
Parma.Pidolimpay
Poisods.
PrAliciessy
30 ( 2.1) 27 ( 8.7)25 ( 2.2) 210 ( 4.1)I
21 ( 1.4) 22 ( 2.1)( 2.9) 271 ( 5.0)
42 ( 2.3) 51 ( 7.8)2$8 ( 1.8) 273 ( 4.8)
Peramitapp
tJLsir
2$256 1 2111
20 ( 1.4)2457 ( 2.0)
44 ( 24)281 ( CO)
The standard errors of the estimated statistics appear in parentheses. It can be said with about 95 percentcertainty that, for each population of interest, the value for the entire population is within ± 2 standard errorsof the estimate for the sample. I Interpret with caution the nature of the sample does not allow accuratedetermination of the variability of this estimated mean proficiency.
Examining the subpopulations (Table Al2 in the Data Appendix):
In Maryland, 34 percent of students attending schools in advantaged urbanareas, 37 percent in schools in disadvantaged urban areas, 22 percent inschools in extreme rural areas, and 28 percent in schools in areas classifiedas "other" worked in small groups at least once a week.
Further, 27 percent of White students, 36 percent of Black students,38 percent of Hispanic students, and 32 percent of Asian students workedmathematics problems in small groups at least once a week.
Females were as likely as males to work mathematics problems in smallgroups at least once a week (29 percent and 32 percent, respectively).
5 9
54 THE. 1990 NAEF TRIAL STATE ASSESSMENT
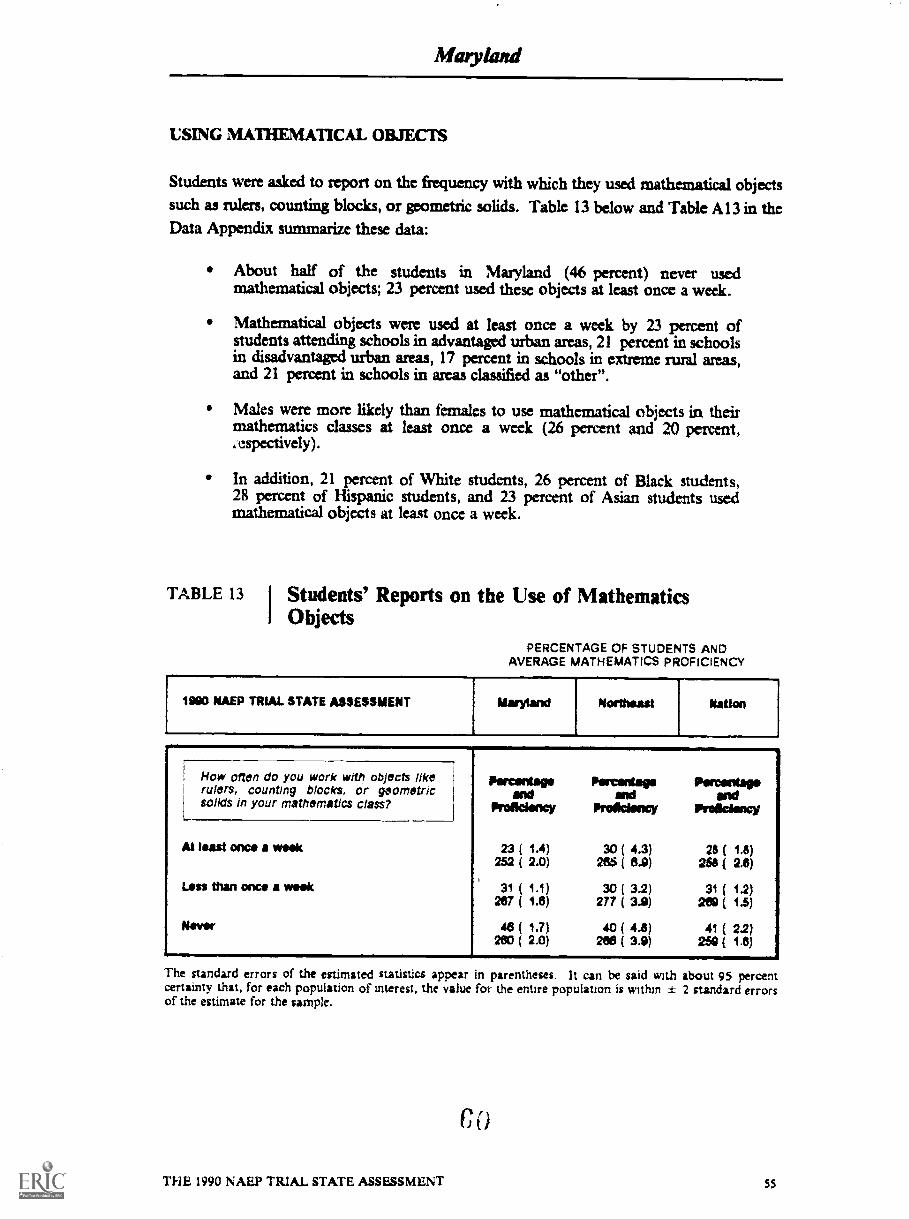
Maryland
USING MATHEMATICAL OBJECTS
Students were asked to report on the frequency with which they used mathematical objects
such as rulers, counting blocks, or geometric solids. Table 13 below and Table A 13 in theData Appendix summarize these data:
About half of the students in Maryland (46 percent) never usedmathematical objects; 23 percent used these objects at least once a week.
Mathematical objects were used at least once a week by 23 percent ofstudents attending schools in advantaged urban areas, 21 percent in schoolsin disadvantaged urban areas, 17 percent in schools in extreme rural areas,and 21 percent in schools in areas classified as "other".
Males were more likely than females to use mathematical objects in theirmathematics classes at least once a week (26 percent and 20 percent,.espectively).
In addition, 21 percent of White students, 26 percent of Black students,28 percent of Hispanic students, and 23 percent of Asian students usedmathematical objects at least once a week.
TABLE 13 I Students' Reports on the Use of MathematicsObjects
PERCENTAGE OF STUDENTS ANDAVERAGE MATHEMATICS PROFICIENCY
11100 NAEP TRIAL STATE ASSESSMENT Maryland Northeast Nation
How often do you work with objects likerulers, counting blocks, or geometricsolids in your mathematics class?
Percentageand
Proadency
Partentagaend
ProOdency
Percentageand
Pralkiency
At least one* a Week 23 ( 1.4) 30 ( 4.3) 28 ( 1.8)252 ( 2.0) 265 ( 6.2) 256 ( 2.6)
Less than once a week 31 ( 1.1) 30 ( 3.2) 31 ( 1.2)267 ( 1.6) 277 ( 3.9) 2651( 1.5)
Never 46 ( 1.7) 40 ( 4.8) 41 ( 2.2)260 ( 2.0) 266 ( 3A) 256 ( 1.6)
The standard errors of the estimated statistiCS appear in parentheses. It can be said with about 95 percentcertainty that, for each population of interest, the value foi. the entire population is within ± 2 standard errorsof the estimate for the sample.
C
THE, 1990 NAEP TRIAL STATE ASSESSMENT 55

May d
MATERIAIS FOR MATHEMATICS INSTRUCTION
The percentages of eighth-grade public-school students in Maryland who frequentlyworked mathematics problems from textbooks (Table 14) or worksheets (Table 15)indicate that these materials play a major role in mathematics teaching and learning.Regarding the frequency of textbook usage (Table 14 and Table A 14 in the Data
Appendix):
More than half of the students in Maryland (62 percent) workedmathematics problems from textbooks almost every day, compared to74 percent of the students in the nation.
Textbooks were used almost every day by 59 percent of students attendingschools in advantaged urban areas, 59 percent in schools in disadvantagedurban areas, 83 percent in schools in extreme rural areas, and 64 percentin schools in areas classified as "other".
TABLE 14 I Students' Reports on the Frequency ofMathemafics Textbook Use
L11100 NAEP TRIAL STATE ASSESSWNT
PERCENTAGE OF STUDENTS ANDAVERAGE MATHEMATICS PROFICIENCY
How often do you do mathematicsproblems from textbooks in yourmathematics class?
Perants.and
Proficiency
Pertents.estO
Proficiency
Ihrosnlapoera
Proficiency
Mosul every day 62 ( 2.2) 72 ( 5.3) 74 ( 1.9)266(1.8) 275 ( 3.7) 247 ( 1.2)
Several times a week 22 ( 1.1) 14 ( 1.8) 14 ( 0.8)256 ( ) 281 ( 4.5) 252 ( 1.7)
Mad once a week or less 18 ( 1.7) 14 ( 4.3) 12 ( 1.8)247 ( 2.2) 249 ( 7.4)1 242 ( 4.5)
The standard errors of the estimated statistics appear in parentheses. It can be said with about 95 percentcertainty that, for each population of interest., the value for the entire population is within 2 standard errorsof the estimate for the sample. ! Interpret with caution the nature of the sample does not allow accuratedetermination of the variability of this estimated mean proficiency.
EU
56 ThE l99 e, NAEP TRIAL STATE ASSESSMENT
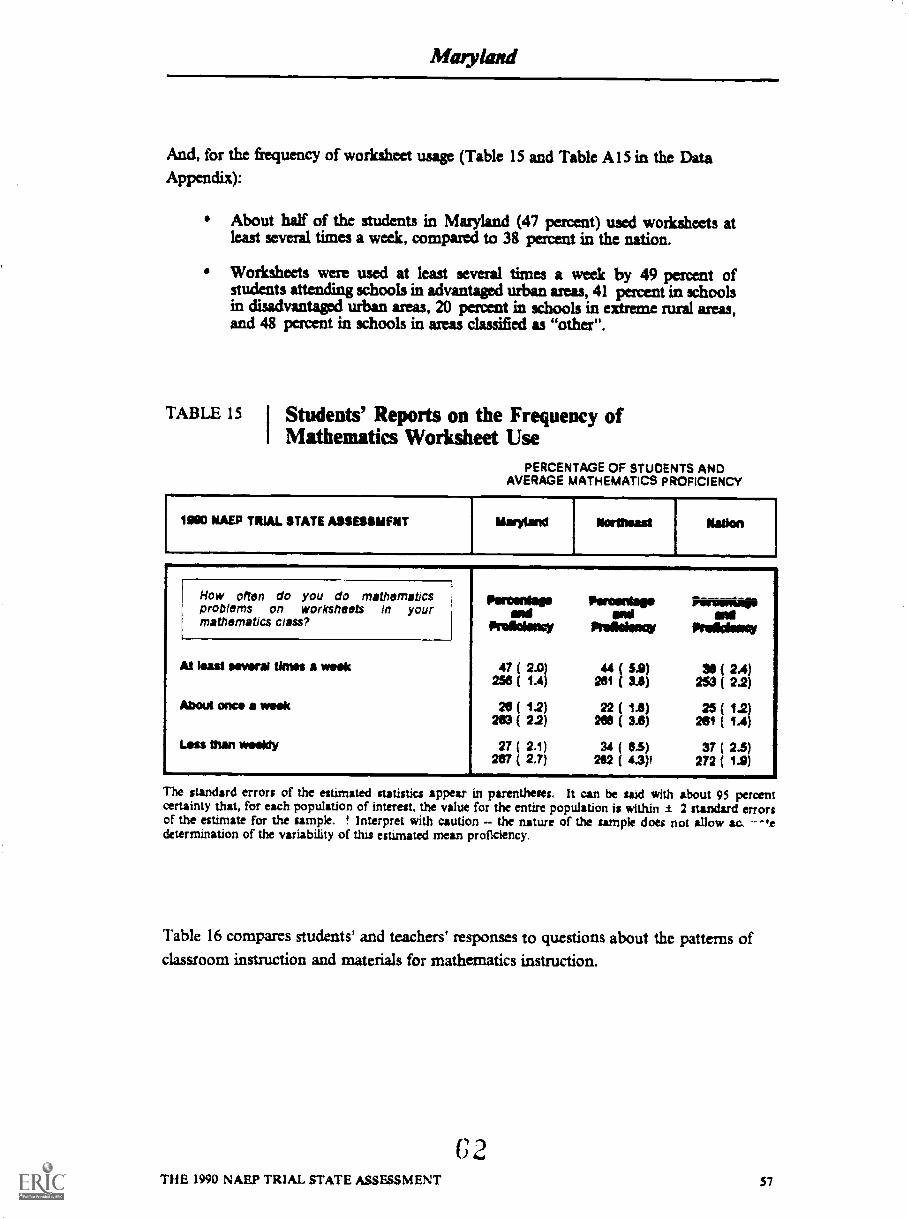
loyhved
And, for the frequency of worksheet usage (Table 15 and Table A 15 in the DataAppendix):
About half of the students in Maryland (47 percent) used worksheets atleast several times a week, compared to 38 percent in the nation.
Worksheets were used at least several times a week by 49 percent ofstudents attending schools in advantaged urban areas, 41 percent in schoolsin disadvantaged urban areas, 20 percent in schools in extreme rural areas,and 48 percent in schools in areas classified as "othtr".
TABLE 15 I Students' Reports on the Frequency ofI Mathematics Worksheet Use
PERCENTAGE OF STUDENTS ANDAVERAGE MATHEMATICS PROFICIENCY
1900 RAEP TRIAL STATE ASSESIMAENT Maryland Northeast Nation
How often do you do mathematicsproblems on worksheets in yourmathematics class?
Peramisisand
finolkienay
parawitagesag
Prollekssay
At least several tknes a week 47 ( 2.0) 44 ( 5.9)258 ( 1.4) 281 ( 3.5)
About once a week 2. ( 12) 22 ( 1.6)283 ( 22) 2135 ( 39)
Less than weedy 27 ( 2.1) 34 ( 8.5)287 ( 2.7) 252 ( 4.3)1
Perimifigoant
linelldsmay
38(24)233 ( 22)
25 ( 12)231 ( 1.4)
37 ( 2.5)272 ( 14)
The standard errors of the estimated statistics appear in parentheses. It can be said with about 95 percentcertainty that, for each population of interest, the value for the entire population is within ± 2 standard errorsof the estimate for the sample. ! Interpret with caution -- the nature of the sample does not allow ac,determination of the variability of this estimated mean proficiency.
Table 16 compares students' and teachers' responses to questions about the patterns ofclassroom instruction and materials for mathematics instruction.
2THE 1990 NAEP TRIAL STATE ASSESSMENT 57

TABLE 16 Comparison of Students' and Teachers' Reportson Patterns of and Materials for MathematicsInstruction
PERCENTAGE OF STUDENTS
1900 NAEP TINAL STATEASSESSMENT
Patterns of classroomInstruction
Nom 11990eivissits TiltadlerS
PeressfagaTeachers
Pereents.1188818914 Tudors
Percentage of students whowort ina0tematics problems Insmall groups
At least once a week 30 ( 2.1) 58 ( 3.3) 27 ( 6.7) 44 ( 6.4) 28 ( 2.5) 50 ( 4.4)Less than once a week 28 ( 1.4) 36 ( 3.2) 22 ( 2.8) 30 ( 8.6) 28 ( 1.4) 43 ( 4.1)Never 42 ( 2.3) ( 2.2) 51 ( 7.9) 17 ( 6.5) 44 ( 2.9) 8 ( 2.0)
Percentage of students vohouse objects like ruff's, countingMocks, or geometric solids
At least once a week 23 ( 1.4) 22 ( 2.4) 30 ( 4.3) 14 ( 53) 28 ( 1.8) 22 ( 3.7)Less than once a week 31 ( 1.1) 67 ( 2.4) 30 ( 3.2) 78 ( 6.8) 31 ( 1.2) 89 ( 3.9)Never 48 ( 1.7) 11 ( 2.0) 40 ( 4.6) 9 ( 3.5) 41 ( 2.2) 9 ( 2.6)
Materials for mathematicsinstruction
PercentageMON' Towbars
PercentageStudants Teachers
PamentagaSiudints Ur:awn
Percentage of students Mx,use a mathematics textbook
Almost every day 62 ( 2.2) 57 ( 3.2) 72 ( 5.3) 57 ( 9.3) 74 ( 1.9) 62 ( 3.4)Several times a week 22 ( 1.1) 33 ( 3.0) 14 ( 1.6) 31 ( 6.3) 14 ( 0-6) 31 ( 3.1)About once a weak or less 16 ( 1.7) 10 ( 1.7) 14 ( 43) 13 ( 2.8) 12 ( 1.8) 7 ( 1.8)
Percentage of studants whouse a mathematics wodesheet
At least several times a week 47 ( 2.0) 47 ( 2.5) 44 ( 5.9) 53 (11.3) 38 ( 2.4) 34 ( 3.8)About once a week 26 ( 1.2) 29 ( 3.1) 22 ( 1.8) 32 ( 8.2) 25 ( 1.2) 33 ( 3.4)Less than weekly 27 ( 2.1) 23 ( 2.6) 34 ( 6.5) 15 ( 4.0) 37 ( 2.5) 32 ( 3.6)
The standard errors of the estimated statistics appear in parentheses. It can be said with about 95 percentcertainty that, for each population of interest, the value for the entire population is within i 2 standard errorsof the estimate for the sample.
3
58 THE 1990 NAEP TRIAL STATE ASSESSMENT

Maryland
SUMMARY
Because classroom instructional time is typically limited, teachers need to make the bestpossible use of what is known about effective instructional delivery practices and resources.It appears that mathematics textbooks and worksheets continue to play a major role inmathematics teaching. Although there is some evidence that other instructional resourcesand practices are emerging, they are not yet commonplace.
According to the students' mathematics teachers:
More than half of the students in Maryland (56 percent) workedmathematics problems in small groups at least once a week; relatively fewnever worked in small groups (8 percent).
The largest percentage of the students (67 percent) used objects like rulers,counting blocks, or geometric shapes less than once a week, and somenever used such objects (11 percent).
In Maryland, 57 percent of the students were assigned problems from amathematics textbook almost every day; 10 percent worked textbookproblems about once a week or less.
A hout half of the students (47 percent) did problems from worksheets atleast several times a week; about one-quarter did worksheet problems lessthan weekly (23 percent).
And, according to the students:
In Maryland. 42 percent of the students never worked mathematicsproblems in small groups; 30 percent of the students worked mathematicsproblems in small groups at least once a week.
About half of the students in Maryland (46 percent) never usedmathematical objects; 23 percent used these objects at least once a week.
More than half of the students in Maryland (62 percent) workedmathematics problems from textbooks almost every day, compared to74 percent of students in the nation.
About half of the students in Maryland (47 percent) used worksheets atleast several times a week, compared to 38 percent in the nation.
4
THE 1990 NAEP TRIAL STATE ASSESSMENT 59

Mao, land
CHAPTER 5
How Are Calculators Used?
Although computation skills are vital, calculators -- and, to a lesser extent, computers --have drastically changed the methods that can be used to perform calculations. Calculatorsare important tools for mathematics and students need to be able to use them wisely. The
National Council of Teachers of Mathematics and many other educators believe thatmathematics teachers should help students become proficient in the use of calculators tofree them from time-consuming computations and to permit them to focus on more
challenging tasks.' The increasing availability of affordable calculators should make it
more likely and attractive for students and schools to acquire and use these devices.
Given the prevalence and potential importance of calculators, part of the Trial StateAssessment focused on attitudes toward and uses of calculators. Teachers were asked toreport the extent to which they encouraged or permitted calculator use for various activitiesin mathematics class and students were asked about the availability and use of calculators.
3 National Assessment of Educational Progress, Mathematics Objectives 1990 Assessment (Princvton, NJ:Educational Testing Service, 1988).
National Council of Teachers of Mathematics, Currkulum and Evaluation Standards for School Mathematics(Reston, VA: National Council of Teachers of Mathematics, 1989).
60 TILE 1990 NAEP TRIAL STATE ASSESSMENT

Table 17 pmvides a profile of Maryland eighth-grade public schools' policies with regardto calculator use:
In comparison to 33 percent across the nation, 30 percent of the studentsin Maryland had teachers who allowed calculators to be used for tests.
About .the same percentage of students in Maryland and in the nation hadteachers who permitted unrestricted use of calculators (19 percent and18 percent, respectively).
TABLE 17 I Teachers' Reports of Maryland Policies onCalculator Use
PERCENTAGE OF STUDENTS
NAEP TRIAL STATE ASSESSMENT Maryland Northeast Nation
Percentage of eighthlrade students in public3ch001s whose teachers permit the unrestricteduee of calculators
Percentage of elghth-grade students in publicschools whose teachers permit the use ofcalculators for tests
Percentage of eighth-grade students in publicschools whose teachers report that studentshave motto to calctdators owned by the school
Ponaudaps Parcentage Pavaa logs
19 ( 21) 20 (11.8) 11 ( 34)
30 ( 33) 14 ( fa) 33 ( 4.5)
77 ( 2.5) 20 ( 1.2) 56 ( 4.0)
The standard errors of the estimated statistics appear in parentheses. It can be said with about 95 percentcertainty that, for each population of interest, the value for the entire population is within ± 2 standard errorsof the estimate for the sample.
THE 1990 NAEP TRIAL STATE ASSESSMENT61

Maryland
THE AVAILABILITY OF CALCULATORS
In Maryland, most students or their families (98 percent) owned calculators (Table 18);
however, fewer students (51 percent) had teachers who explained the use of calculators to
them. From Table A 18 in the Data Appendix
In Maryland, 52 percent of White students, 49 percent of Black students,59 percent of Hispanic students, and 45 percent of Asian students hadteachers who explained how to use them.
Females were as likely as males to have the use of calculators explained tothem (49 percent and 53 percent, respectively).
TABLE 18 Students' Reports on Whether They Own aCalculator and Whether Their Teacher ExplainsHow To Use One
PERCENTAGE OF STUDENTS ANDAVERAGE MATHEMATICS PROFICIENCY
1990 MAP TRIAL STATE ASSESSMENT Mar Oahe Northeast Nation
Do you or your family own a calculator?
Does your mathematics teacher explainhow to use a calculator for mathematicsproblems?
The
Perim lionmigs. Amp lawam *ad and
Pro Now aillehmay Pre Odom
08 ( 0.3) OS ( 0.1)251 ( 1.5) 200 ( 3.3)
2 ( 0.3) 2 ( 0.7))(
203 ( 1.3)
3 ( 0.4)234 (Si)
Parcenta. Parasols. PareamOMIPand
Preicishoy Preldlow Prelistaict
61 ( 13)4
49 ( 2.3)250 ( 1.5) 21°8 41 258 ( 1.7)
40 ( 19) TO ( 4.0) 51 ( 2.3)264 2.0) 274 ( 3.0) 201 ( 13 )
The standard errors of the estimated statistics appear in parentheses. It can be aid with about 95 percentcertainty that, for each population of interest, the value for the entire population is within ± 2 standard errorsof the esUrnate for the sample. 6** Sample size is insufficient to permit a reliable estimate (fewer than 62students).
62
13 7
THE 1990 NAEP TRIAL STATE ASSESSMENT
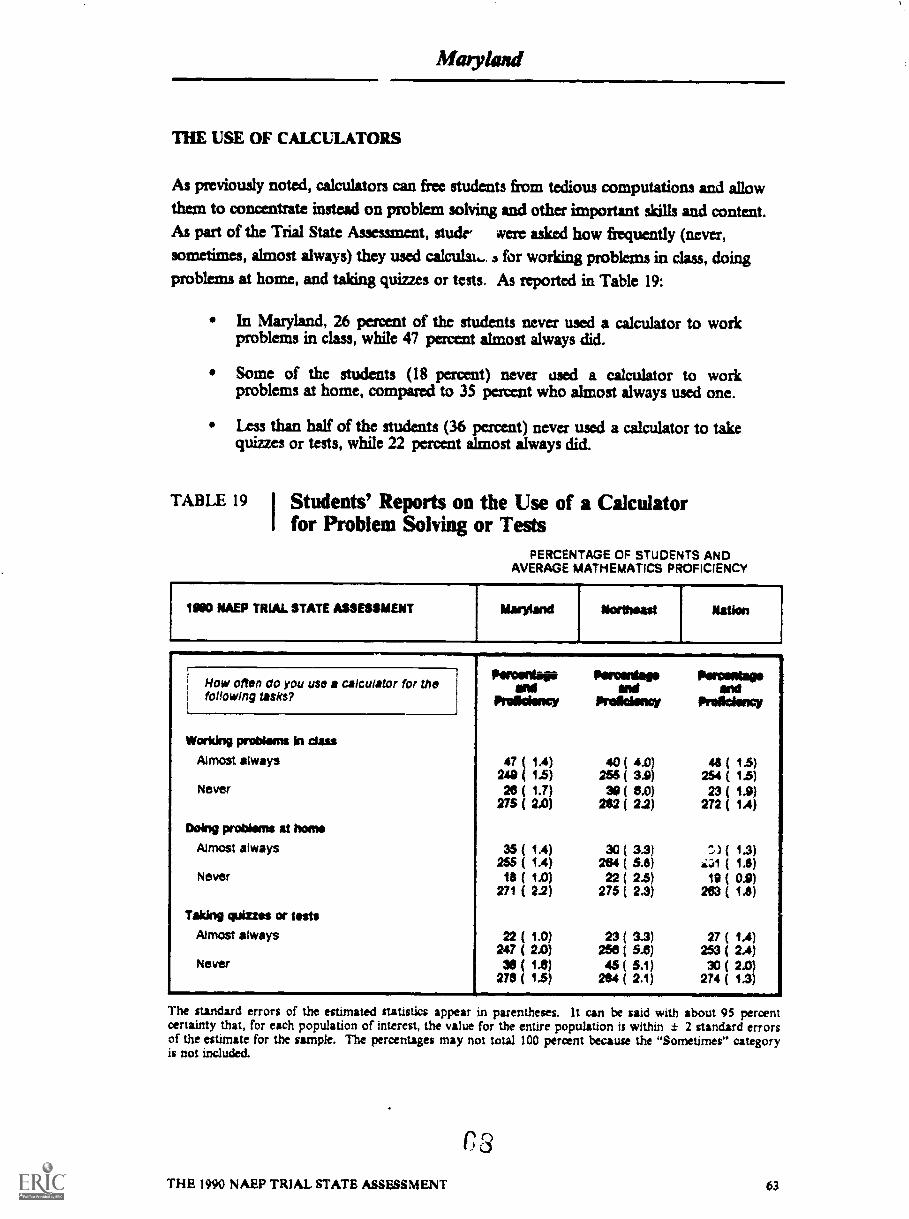
Aft ilyland
THE USE OF CALCULATORS
As previously noted, calculators can free students from tedious computations and allowthem to concentrate instead on problem solving and other important slcills and content.As part of the Trial State A33CSSMent, studr were asked how frequently (never,sometimes, almost always) they used calculak... 3 for working problems in class, doingproblems at home, and tstking quizzes or tests. As reported in Table 19:
In Maryland, 26 percent of the students never used a calculator to workproblems in class, while 47 pacent almost always did.
Some of the students (18 parent) never used a calculator to workproblems at home, compared to 35 percent who almost always used one.
Less than half of the students (36 percent) never used a calculator to takequizzes or tests, while 22 percent almost always did.
TABLE 19 I Students' Reports on the Use of a CalculatorI for Problem Solving or Tests
PERCENTAGE OF STUDENTS ANDAVERAGE MATHEMATICS PROFICIENCY
1950 NAEP TRIAL STATE ASSESSMENT MarOand Northeast Nation
How often do you use a calculator for thePorconlese
aidPartalatta. Porceolage
end endfollowing tasks? Proficiency Prolicioney Proficiency
Working problems in class
Almost always 47 ( 1.4) 40 ( 4.0) 48 ( 1.5)248 ( t5) 255 ( 3.9) 254 ( 1.6)
Never 28 ( 1.7) 39 ( 8.0) 23 ( 1.9)275 ( 2.0) 282 ( 2.2) 212 ( 1.4)
Doing problems at home
Almost always 3S ( 1.4) 30 ( 3.3) ( 1.3)( 1A) 284 ( 5.8) ;.01 ( 1.8)
Never 18 ( 1.0) 22 ( 2.5) 19 ( 0.9)271 ( 2.2) 275 ( 2.3) 263 ( 1.6)
Taking quizzes or tests
Almost always 22 ( 1.0) 23 ( 3.3) 27 ( 1.4)247 ( 2.0) 258 ( 5.8) 253 ( 2.4)
Never $8 ( 1.8) 45 ( 5.1) 30 ( 2.0)275 ( 1.5) 284 ( 2.1) 274 ( 1.3)
dr
The standard errors of the estimated statistics appear in parentheses. It can be said with about 95 percentcertainty that, for each population of interest, the value for the entire population is within ± 2 standard errorsof the estimate for the sample. The percentages may not total 100 percent because the "Sometimes" categoryis not included.
r3THE 1990 NAEP TRIAL STATE ASSESSMENT 63
Maryland
WHEN TO USE A CALCULATOR
Part of the Trial State Assessment was designed to investigate whether students know when
the use of a calculator is helpful and when it is not. There were seven sections ofmathematics questions in the assessment; however, each student took only three of those
sections. For two of the seven sections, students were given calculators to use. The testadministrator provided the students with instructions and practice on how to use acalculator prior to the assessment. During the assessment, students were allowed to choosewhether or not to use a calculator for each item in the calculator sections, and they wereasked to indicate in their test booklets whether they did or did not use a calculator for each
item.
Certain items in the calculator sections were defined as "calculator-active" items -- that is,items that required the student to use the calculator to determine the correct response.Certain other items were defined as "calculator-inactive" items -- items whose solutionneither required nor suggested the use of a calculator. The remainder of the items were"calculator-neutral" items, for which the solution to the question did not require the use
of a calculator.
In total, there were eight calculator-active items, 13 calculator-neutral items, and 17calculator-inactive items across the two sections. However, because of the samplingmethodology used as part of the Trial Stat- Assessment, not every student took bothsections. Some took both sections, some took only one section, and some took neither.
To examine the characteristics of students who generally knew when the use of thecalculator was helpful and those who did not, the students who responded to one or both
of the calculator sections were categorized into two gyoups:,
High -- students who used the calculator appropriately (i.e., used it for thecalculator-active items and did not use it for the calculator-inactive items)at least 85 percent of the time and indicated that they had used thecalculator for at least half of the calculator-active items they were presented.
Other -- students who did not use the calculator appropriately at least 85percent of the time or indicated that they had used the calculator for lessthan half of the calculator-active items they were presented.
64 THE 1990 NAEP TRIAL STATE ASSESSMENT
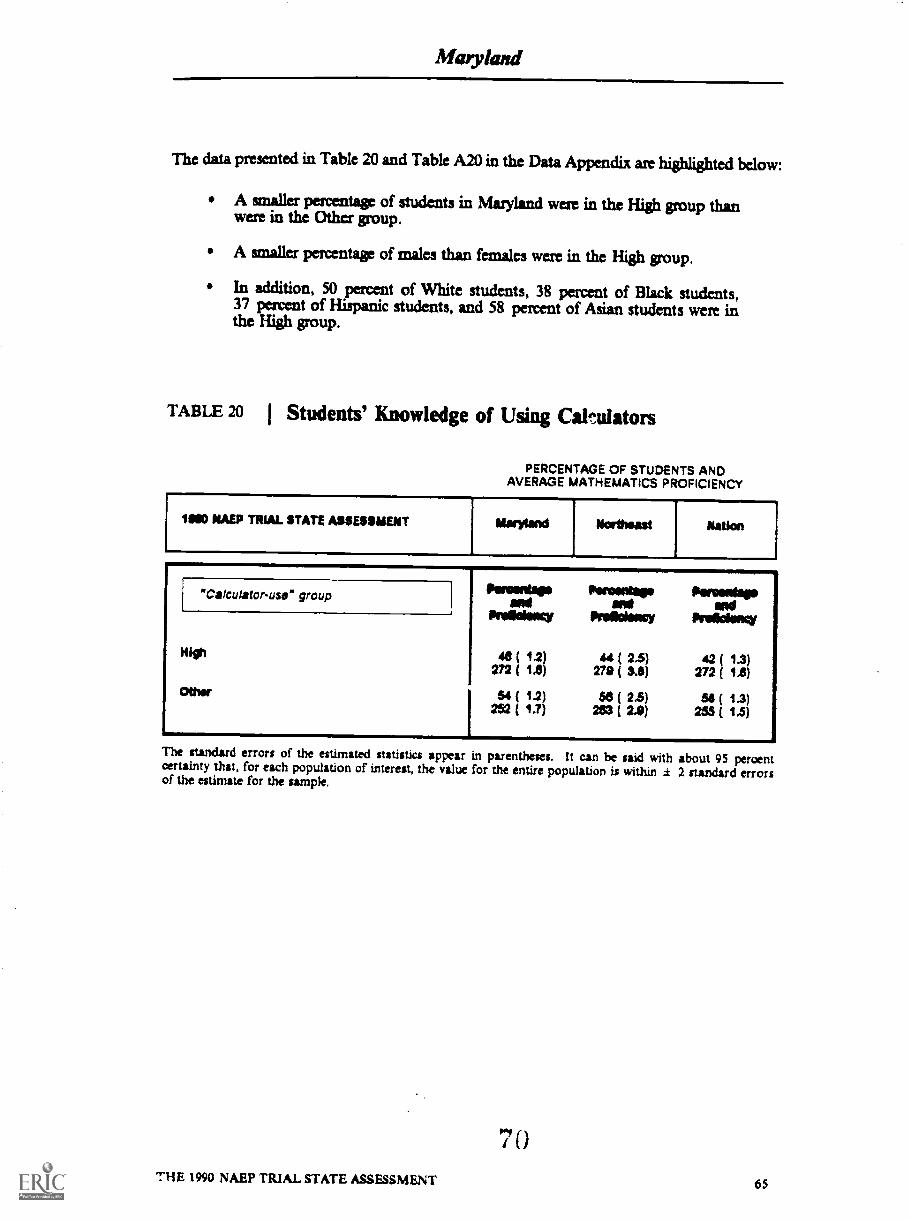
The data presented in Table 20 and Table A20 in the Data Appendix are highlighted below:
A smaller percentage of students in Maryland were in the High group thanwere in the Other group.
A smallex percentage of males than females were in the High group.
In addition, 50 percent of White students, 38 percent of Black students,37 percent of Hispanic students, and 58 percent of Asian students were inthe High group.
TABLE 20 Students' Knowledge of Using Cal.mlators
PERCENTAGE OF STUDENTS ANDAVERAGE MATHEMATICS PROFICIENCY
_
10110 NAEP TRIAL STATE ASSESSMENT Maryland Northeast I- Nation
"Calculator-use group
Nigh
Pertentapp Pwaintap Parana.and owl and
PEW 'okay Meek lacy Preadiency
48 ( 1.2)272 ( Le)
54 ( 1.2)252 ( 4.7)
44 ( 2.5)279 ( SA)
58 ( 2.5)283 ( 2.0)
42 ( 1.3)272 ( 1.8)
54 ( 1.3)255 ( 1.5)
The standard errors of the estimated statistics appear in parentheses. It can be said with about 95 percentcertainty that, for each population of interest, the value for the entire population is within ± 2 standard errorsof the estimate for the sampk.
70THE 1990 NAEP TRIAL STATE ASSESSMENT 65
MaPyland
SUMMAR Y
Given the prevalence of inexpensive calculators, it may no longer be necessary or useful to
devote large portions of instructional time to teaching students how to perform routinecalculations by hand. Using calculators to replace this time-consuming process would
create more instructional time for other mathematical skill topics, such as problem solving,
to be emphasized.
The data related to calculators and their use show that:
In comparison to 33 percent across the nation, 30 percent of the studentsin Maryland had teachers who allowed calculators to be used for tests.
About the same percentage of students in Maryland and in the nation hadteachers who permitted unrestricted use of calculators (19 percent and18 percent, respectively).
In Maryland, most students or their families (98 percent) ownedcalculators; however, fewer students (51 percent) had teachers whoexplained the use of calculators to them.
In Maryland, 26 percent of the students never used a calculator to workproblems in class, while 47 percent almost always did.
Some of the students (18 percent) never used a calculator to workproblems at home, compared to 35 percent who almost always used one.
Less than half of the students (36 percent) never used a calculator to takequizzes or tests, while 22 percent almost always did.
71
66 THE 1990 NAEP TRIAL Sl'ATE ASSESSMENT
Maryland
CHAPTER 6
Who Is Teaching Eighth-Grade Mathematics?
In recent years, accountability for educational outcomes has become an issue of increasingimportance to federal, state, and local governments. As part of their effort to improve theeducational process, poficymakers have reexamined existing methods of educating andcertifying teachers.9 Many states have begun to raise teacher certification standards andstrengthen teacher training programs. As shown in Table 21:
In Maryland, 59 percent of the students were being taught by mathematicsteachers who reported having at kast a master's or education specialist'sdegree. This compares to 44 percent for students acioss the nation.
About three-quarters of the students (79 percent) had mathematicsteachers who had the highest level of teaching certification available. Thisis different from the figure for the nation, where 66 percent of the studentswere taught by mathematics teachers who were certified at the highest levelavailable in their states.
Many of the students (87 percent) had mathematics teachers who had amathematics (middle school or secondary) teaching certificate. Thiscompares to 84 percent for the nation.
9 National Council of Teachers of Mathematics, Professional Standards for the Teaching of Mathematics(Reston, VA: National Council of Teachers of Mathematics, 1991).
7
THE 1990 NAEP TRIAL STATE ASSESSMENT 67

TABLE 21 I Profile of Eighth-Grade Public-SchoolMathematics Teachers
PERCENTAGE OF STUDENTS
11190 NAEP TRIAL STATE ASSESSMENT Manotand Northeast Mien
Percentage cif students when mathematics teachersreported having the Mowing degrees
Bachelor's degreeMaster's or specialist's degreeDoctorate or professional degree
Percentage at students when methemadce teachers havethe kerning twee at teaching certiOcatee lhat arsrecognized by Maryland
No regular certificationRegular certification but less than the highest availableHighest certification available (permanent or long-term)
Percentage of students whose mithanuttics teachers havethe followIng byes of teaching certificates lhat arerecognized by Mandand
Mathematics (middle school or secondary)Education (elementary or middle school)Other
pineal. *mew
415: 14I Eli a (
flonolaile
Al
3 (17 (79 (
17 (10 (3 (
1.2
S.01
2.11.91
10 11.5111 11
3Sf 3.11
4 3.7
4 (211(33 (
114
42 (4
1.2434.3
( 2.2)2.3)
( 1.3)
The standard errors of the estimated statistics appear in parentheses. It can be said with about 9$ percentcertainty that, for each population of interest, the value for the entire population is within ± 2 standard errorsof the estimate for the sample,.
EDUCATIONAL BACKGROUND
Although mathematics teachers are held responsible for providing high-quality instructionto their students, there is a concern that many teachers have had limited exposure tocontent and concepts in the subject area. Accordingly, the Trial State Assessment gathereddetails on the teachers' educational backgrounds -- more specifically, their undergraduate
and graduate majors and their in-service training.
3
68 THE 1990 NAEP TRIAL STATE ASSESSMENT

Maryland
Teachers' responses to questions concemaing thek undergraduate and graduate fields ofstudy (Table 22) show that:
In Maryland, 47 percent of the eighth-grade public-school students werebeing taught mathematics by teachers who had an undergraduate major inmathematics. In comparison, 43 percent of the students across the nationhad mathematics teachers with the same major.
Some of the eighth-grade public-school students in Maryland (19 percent)were taught mathematics by teachzrs who had a graduate major inmathematics. Across the nation, 22 percent of the students were taughtby teachers who majored in mathematics in graduate school.
TABLE 22 I Teachers' Reports on Their Undergraduate andI Graduate Fields of Study
PERCENTAGE OF STUDENTS
1990 NAEP TRIAL STATE ASSESSMENT Maryland Northeast Nation
Whet was your undergraduate major?
MattwmatIcsEducationOther
What was your graduate major?
MathematicsEdwationOther or no graduate Wel study
Perdeita. Percintige Pereentage
47 ( 3.4)( 3.4)
14 ( 1.9)
44 ( 9.2)34 ( 8.0)22 ( 8.1)
43 ( 34)35 ( 3.8)22 ( 3.3)
Percentage Parcentage Percentage
19 ( 24)52 ( 3.3)29 ( 2.15)
22 ( 9.7)42 ( 8.2)31 ( 44)
22 ( 34)38 ( 3..5)40 ( 3A)
The standard errors of the estimated statistics appear in parentheses. It can be said with about 95 percentcertainty that, for each population of interest, the value for the entire population is within ± 2 standard errorsof the estimate for the sample.
THE 1990 NAEP TRIAL STATE ASSESSMENT 69
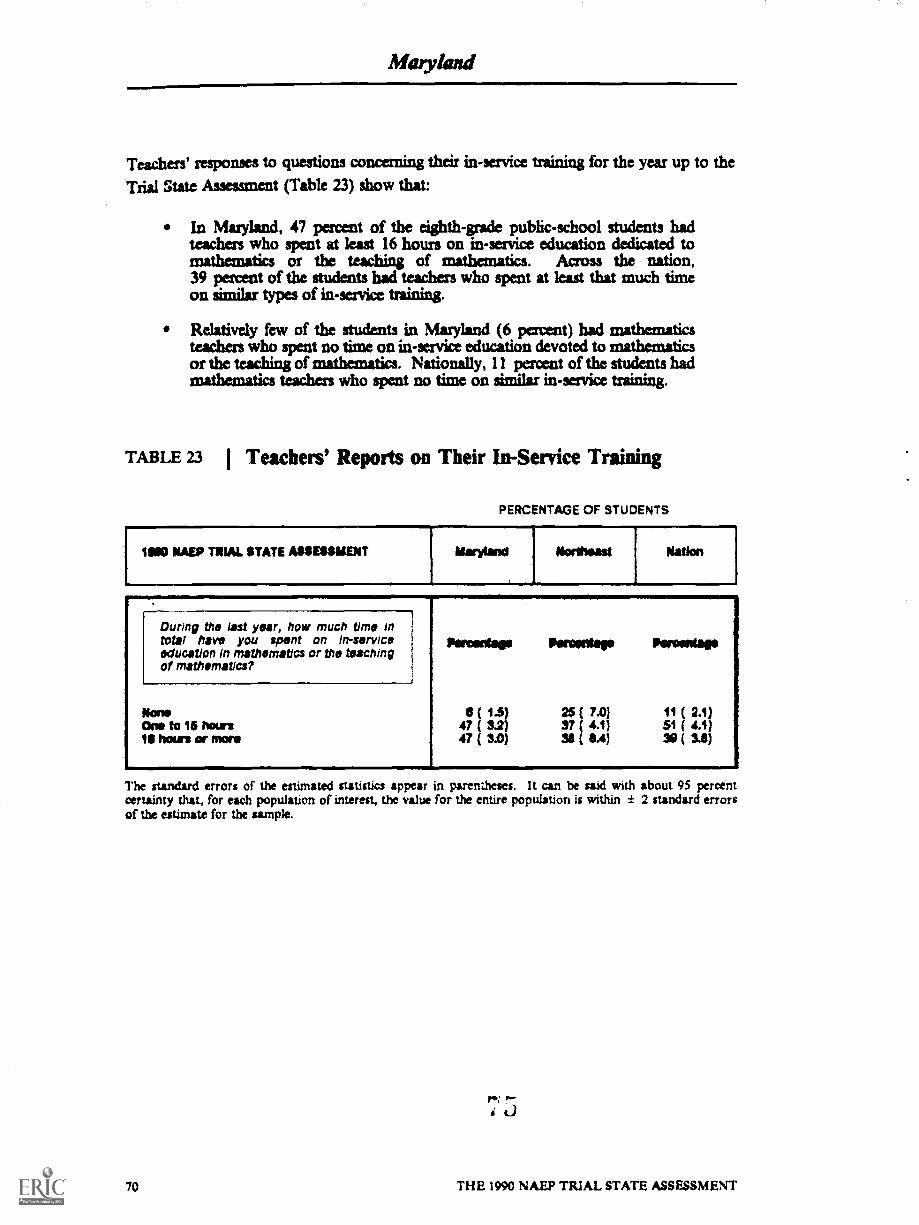
Moyiand
Teachers' responses to questions concerning their in-service training for the year up to the
Trial State Assessment (Table 23) show that
In Maryland, 47 percent of the eighth-grade public-school students hadteachers who spent at least 16 hours on in-service education dedicated tomathematics or the teaching of mathematics. Across the nation,39 percent of the students had teachers who spent at least that much timeon similar types of in-service training.
Relatively few of the students in Maryland (6 percent) had mathematicsteachers who spent no time on in-service education devoted to mathematicsor the teaching of mathematics. Nationally, 11 percent of the students hadmathematics teachers who spent no time on similar in-service training.
TABLE 23 I Teachers' Reports on Their In-Service Training
PERCENTAGE OF STUDENTS
NAEP TRIAL STATE ASSESSMENT Maryland
I.
Northeast Nation
During the last year, how much time intotal have you spent on in-serviceeducation in mathematics or the teachingof mathematics?
NoneOne to 15 Nal1$ hotrs or more
Percentage ParsOntage Pim:entails
25 7.0) 11 ( 2.1)47 ( 3.2) 37 4.1) 51 ( 4.1)47 ( 3.0) 31I IA) ( 3.8)
The standard errors of the estimated StatistieS appear in parentheses. It can be said with about 95 percentcertainty that, for each population of interest, the value for the entire population is within ± 2 standard errorsof the estimate for the sample.
70 THE 1990 NAEP TRIAL STATE ASSESSMENT
Maryland
SUMMARY
Recent results from international studies have shown that students from the United Statesdo not compare favorably with students from other nations in mathematics and scienceachievement." Further, results from NAEP assessments have indicated that students'achievement in mathematics and science is much lower than educators and the publicwould like it to be." In curriculum areas requiring special attention and improvement,such as mathematics, it is particularly important to have well-qualified teachers. When
performance differences across states and territories are described, variations in teacher
qualifications and practices may point to areas worth further exploration. There is noguarantee that individuals with a specific set of credentials will be effective teachers;
however, it is likely that relevant training and experience do contribute to better teaching.
The information about teachers' educational backgrounds and experience reveals that:
In Maryland, 59 percent of the assessed students were being taught bymathematics teachers who reported having at least a master's or educationspecialist's degree. This compares to 44 percent for students across thenation.
About three-quarters of the students (79 percent) had mathematicsteachers who had the highest level of teaching certification available. Thisis different from the figure for the nation, where 66 percent of studentswere taught by mathematics teachers who were certified at the highest levelavailable in their states.
In Maryland, 47 percent of the eighth-grade public-school students werebeing taught mathematics by teachers who had an undergxaduate major inmathematics. In comparison, 43 percent of the students across the nationhad mathematics teachers with the same major.
Some of the eighth-grade public-school students in Maryland (19 percent)were taught mathematics by teachers who had a graduate major inmathematics. Across the nation, 22 percent of the students were taughtby teachers who majored in mathematics in graduate school.
I° Archie E. Lapointe, Nancy A. Mead, and Gary W. Phillips, A World of Dilferences An InternationalAssessment of Mathematics and Science (Princeton. NJ: Center for the Assessment of Educational Progress,Educational Testing Service, 1988).
1' Ina VS. Mullis, John A. Dossey, Eugene H. Owen, and Gary W. Phillips, The State of MathematicsAchievement NA EP's 1990 Assessment of the Nation and the Thal Assessment of the States (Princeton, NJ:National Assessment of Educational Progress, Educational Testing Service, 1991).
THE 1990 NAEP TRIAL STATE ASSESSMENT 71
Maryland
In Maryland, 47 percent of the eighth-grade public-school students hadteachers who spent at least 16 hours on in-service education dedicated tomathematics or the teaching of mathematics. Across the nation,39 percent of the students h A teachers who spent at least that much timeon similar types of in-service training
Relatively few of the students in Maryland (6 percent) had mathematicsteachers who spent no time on in-service education devoted to mathematicsor the teaching of mathematics. Nationally, 11 percent of the students hadmathematics teachers who spent no time on similar in-service training.
72 THE 1990 NAEP TRIAL STATE ASSESSMENT
Maryland
CHAPTER 7
The Conditions Beyond School that Facilitate
Mathematics Learning and Teaching
Because students spend much more time out of school each day than they do in school, itis reasonable to expect that out-of-school factors greatly influence students' attitudes andbehaviors in school. Parents and guardians can therefore play an important role in theeducation of their children. Family expectations, encouragement, and participation instudent learning experiences are powerful influences. Together, teachers and parents can
help build students' motivation to learn and can broaden their interest in mathematics andother subjects.
To examine the relationship between home environment and mathematics proficiency,
students participating in the Trial State Assessment were asked a series of questions aboutthemselves, their parents or guardians, and home factors related to education.
e 0
THE 1990 NAEP TRIAL STATE ASSESSMENT 73
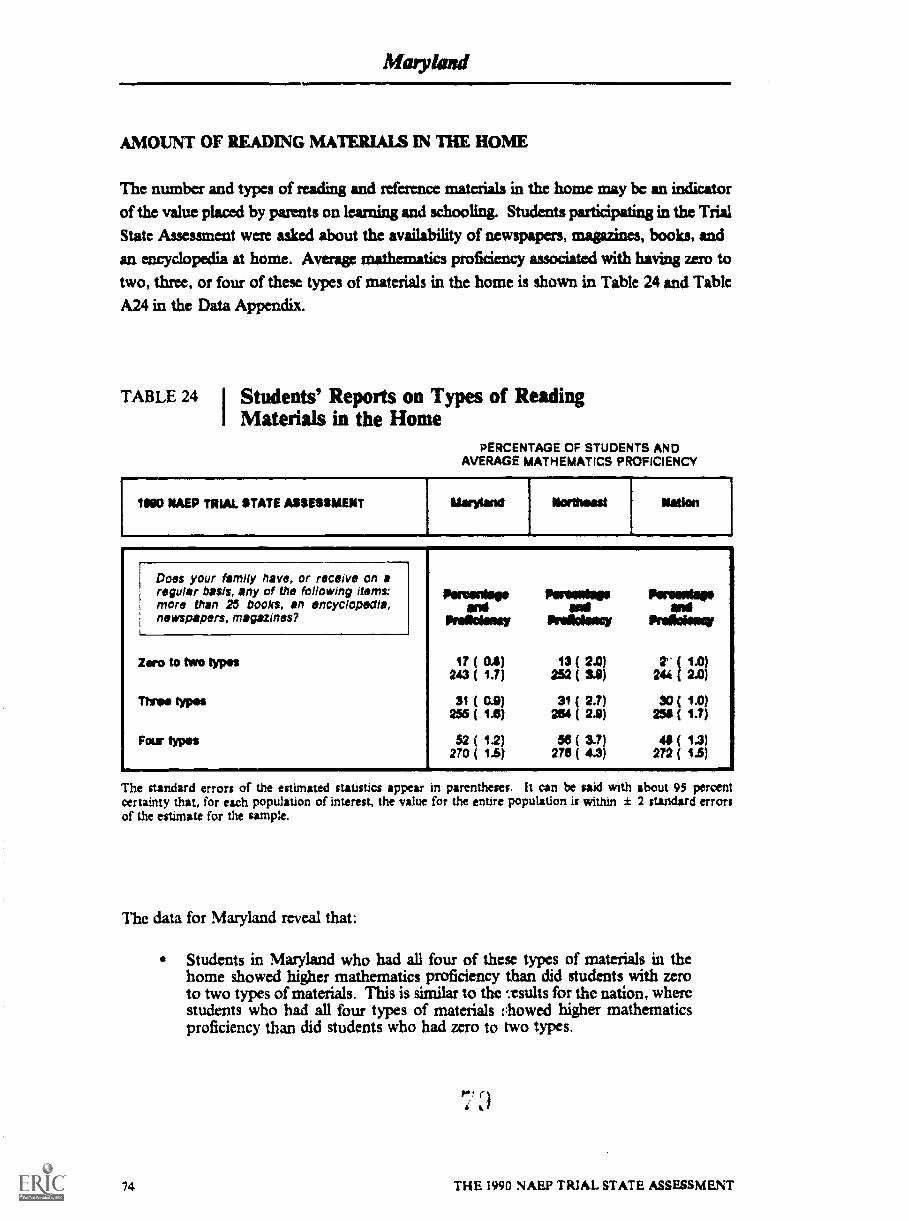
Matykind
AMOUNT OF READING MATERIALS IN THE HOME
The number and types of reading and reference materials in the home may be an indicatorof the value placed by parents on learning and schooling. Students participating in the TrialState Assessment were asked about the availability of newspapers, magazines, books, and
an encyclopedia at home. Average mathematics proficiency associated with having zero totwo, three, or four of these types of materials in the home is shown in Table 24 and TableA24 in the Data Appendix.
TABLE 24 I Students' Reports on Types of ReadingMaterials in the Home
PERCENTAGE OF STUDENTS ANDAVERAGE MATHEMATICS PROFICIENCY
1NO NAEP TRIAL STATE ASSESSMENT Marb4and Northeast
Does your family have, or receive on aregular basis, any of the following items:more than 25 books, an encyclopedia,newspapers, magazines?
Zwo to two typos
Throe typos
Fotr typos
Parasols. Panddlego Parsurtageand and and
Praildeney Prailicimoy Priaddow
17 ( 0.41) 13 ( 2.0) t' ( 1.0)243 ( 1.1) 252 ( Si) 244 ( 2.0)
31 ( 0.9) 31 ( 2.7) 30 ( 1.0)255 ( 13) 20 ( 23) 256 ( 1.7)
52 ( 12) 50 ( S.?) 41 ( 1.3)270 ( 1.5) 275 ( 4.3) 272 ( 1.5)
The standard errors of the estimated statistics appear in parentheses. It can be said with about 95 percentcertainty that, for each population of interest, the value for the entire population is within ± 2 standard errorsof the estimate for the sample.
The data for Maryland reveal that:
Students in Maryland who had all four of these types of materials in thehome showed higher mathematics proficiency than did students with zeroto two types of materials. This is similar to the '.esults for the nation, wherestudents who had all four types of materials vhowed higher mathematicsproficiency than did students who had zero to two types.
74 THE 1990 NAEP TRIAL STATE ASSESSMENT
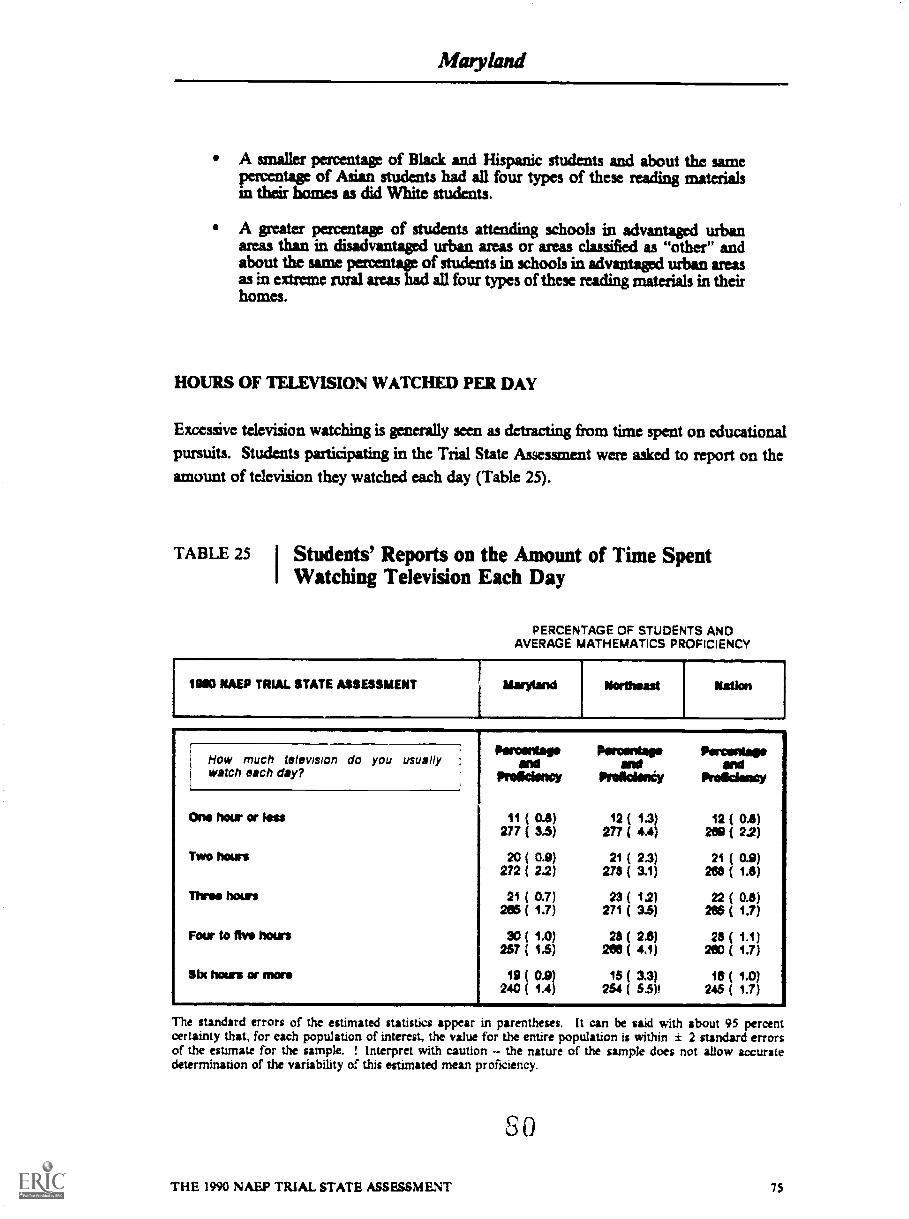
A smaller percentage of Black and Hispanic students and about the samepercentage of Asian students had all four types of these reading materialsin their homes as did White students.
A greater percentage of students attending schools in advantaged urbanareas than in disadvantaged urban areas or areas classified as "other" andabout the same percentage of students in schools in advantaged urbanaimas in extreme rural areas had all four types of these reading materials in theirhomes.
HOURS OF TELEVISION WATCHED PER DAY
Excessive television watching is generally seen as detracting from time spent on educationalpursuits. Students participating in the Trial State Assessment were asked to report on theamount of television they watched each day (Table 25).
TABLE 25 I Students' Reports on the Amount of Time SpentI Watching Television Each Day
PERCENTAGE OF STUDENTS ANDAVERAGE MATHEMATICS PROFICIENCY
NAEP TRIAL STATE ASSESSMENT
Percents.and
Proficiency
Permits.end
Prelicieney
Percents.end
ProficiencyHow much television do you usuallywatch each day?
Otis hour or less 11 ( 04) 12 ( 1.3) 12 ( 04)277 ( 3.5) 277 ( 4.4) NG ( 22)
Two hours 20 ( 0.9) 21 ( 2.3) 21 ( 0.9)272 ( 2.2) 27$ ( 3.1) HS ( 1.8)
Three hours 21 ( 0.7) 23 ( 11) 22 ( 0.3)205 ( 1.7) 271 ( 3.5) 205 ( 1.7)
Four to See hours 30 ( 1.0) 23 ( 2.8) 23 ( 1.1)257 ( 1.5) 2011( 4.1) 280 ( 1.7)
Slx hours or more 19 ( 0.9) 18 ( 3.3) 18 ( 1.0)240 ( 1.4) 254 ( 5.5)1 245 ( 1.7)
The standard errors of the estimated statistics appear in parentheses. It can be said with about 95 percentcertainty that, for each population of interest, the value for the entire population is within 2 standard errorsof the estimate for the sample. Interpret with caution the nature of the sample does not allow accuratedetermination of the variability of this estimated mean proficiency.
80
THE 1990 NAEP TRIAL STATE ASSESSMENT 75

Maryland
From Table 25 and Table A25 in the Data Appendix:
In Maryland, average mathematics proficiency was lowest for students whospent six hours or more watching television each day.
Some of the eighth-grade public-school students in Maryland (11 percent)watched one hour or less of television each day; 19 percent watched sixhours or more.
About the same percentage of males and females tended to watch six ormore hours of television daily. However, a smaller percentage of malesthan females watched one hour or less per day.
In addition, 12 percent of White students, 34 percent of Black students,22 percent of Hispanic students, and 8 percent of Asian students watchedsix hours or more of television each day. In comparison, 13 percent ofWhite students, 5 percent of Black students, 8 percent of Hispanicstudents, and 23 percent of Asian students tended to watch only an houror less.
STUDENT ABSENTEEISM
Excessive absenteeism may also be an obstacle to students' success in school. To examinethe relationship of student absenteeism to mathematics proficiency, the studentsparticipating in the Trial State Assessment were asked to report on the number of days ofschool they missed during the one-month period preceding the assessment.
From Table 26 and Table A26 in the Data Appendix:
In Maryland, average mathematics proficiency was lowest for students whomissed three or more days of school.
Less than half of the students in Maryland (37 percent) did not miss anyschool days in the month prior to the assessment, while 27 percent rnissedthree days or mow.
In addition, 26 percent of White students, 30 percent of Black students,30 percent of Hispanic students, and 13 percent of Asian students missedthree or more days of school.
76 THE 1990 NAEP TRiAL STATE ASSESSMENT
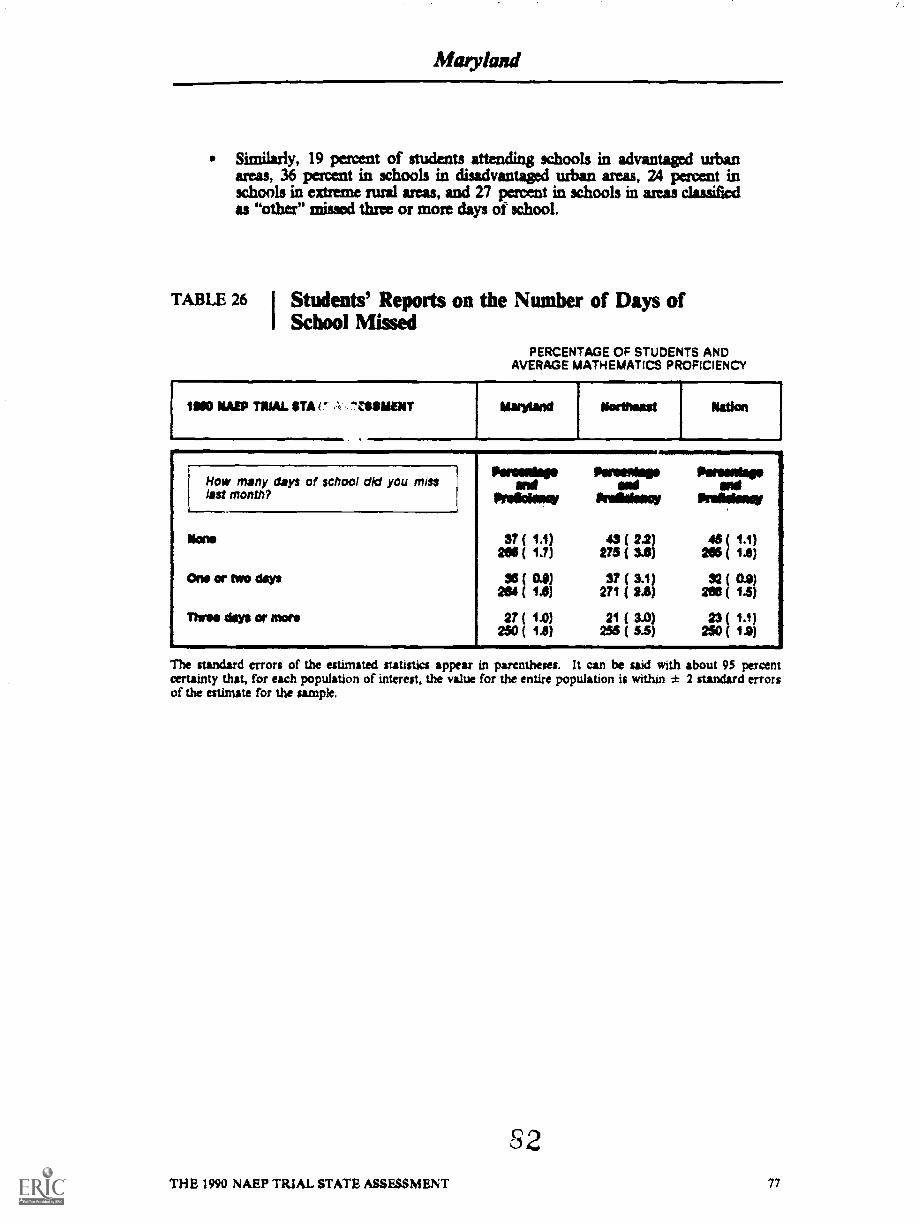
Maryland
Similarly, 19 pacent of students attending schools in advantaged urbanareas, 36 percent in schools in disadvantaged urban areas, 24 percent inschools in extreme rural areas, and 27 percent in schools in areas classifiedas "otha" missed three or more days of school.
TABLE 26 I Students' Reports on the Number of Days ofi School Missed
PERCENTAGE OF STUDENTS ANDAVERAGE MATHEMATICS PROFICIENCY
1SSO MEP TRIAL STA i ,r, ,1= .. , CSSUENT
anolmik.
How many days of school did you misslast month?
Parawilipan*
Prolkisew
37 ( 1.1)205 ( 1.7)
Poromerseend
Prifkimoi
43 ( 22)273 ( 3.6)
Parma.Prallfagy
411( 1.1)205 ( 12)
Nona
Ono or two days 36 f 04) 37(3.1 ) 32 ( 0.9)264 ( 1.5) 271 ( 22) 2115 ( 12)
Throe days Of Mr. 27 ( 1.0) 21 ( 3.0) 23 ( 1.1)250 ( 1.5) 255 ( 5.5) 250 ( 12)
The standard errors of the estimated statistics appear in parentheses. It can be said with about 95 percentcertainty that, for each population of interest, the value for the entire population is within ± 2 standard errorsof the estimate for the sample.
62THE 1990 NAEP TRIAL STATE ASSESSMENT 77
Maryland
DENTS' PERCEPTIONS OF MATHEMATICS
According to the National Council of Teachers of Mathematics, learning mathematicsshould require students not only to master essential skills and concepts but also to developconfidence in their mathematical abilities and to value mathematics as a discipline."Students were askeo if they ?greed or disagreed with five statements designed to elicit their
perceptions of mathematics. These included statements about:
Personal experience with mathematics, including students' enjoyment ofmathematics and level of confidence in their mathematics abilities: I likemathematics; I am good in mathematics.
Value of mathematics, including students' perceptions of its present utilityand its exper:ted relevance to future work and life requirements: Almost allpeople use mathematics in their lobs; mathematics is not more for boys thanfor girls.
The nature of mathematics, including students' ability to identify the salientfeatures of the discipline: Mathematics is useful for solving everydayproblems.
A student "7erception index" was developed to examine students' perceptions of andattitudes toward mathematics. For each of the five statements, students who responded"strongly agee" were given a value of I (indicating very positive attitudes about thesubject), those who responded "agree' were given a value of 2, and those who responded"undecided," "disagree," or "strongly disagree" were given a lalue of 3. Each student'sresponses were averaged over the five statements. The students were then assipped aperception index according to whether they tended to strongly agne with the statements(an index of 1), tended to agyee with the statements (an index of 2), or tended to beundecided, to disagree, or to strongly disagree with the statements (an index of 3).
Table 27 provides 'he data for the students' attitudes toward mathematics as defined bytheir perception inde%. The following results were observed for Maryland:
Average mathematics proficiency was lowest for students who were in the"undecided, disagme, strongly disagree" category.
A..,ut onequarter of the students (30 percent) were in the "stronglyagree" category (perception index of I) This compares to 27 percentacross the nation.
Some of the students in Maryland (20 percent), compared to 24 percentacross the nation, were in the "undecided, disagree, or strongly disagyee"category (perception index of 3).
1 2 National Council of Teachers of Mathematics. Curriculum and Evaluation Standards for School Mathematics(Reston, VA: National Council of Teachers of Mathematics, 1989).
E378 THE 1990 NAEP TRIAL STATE ASSESSMENT

')
Maryland
TABLE 27 I Students' Perceptions of Mathematics
PERCENTAGE OF STUDENTS ANDAVERAGE MATHEMATICS PROFICIENCY
The standard errors of the estimated statistics appear in parentheses. It can be said with about 95 percentcertainty that, for each population of interest, the value for the entire population is within ± 2 standard errorsof the estimate for the sample. I Interpret with caution the nature of the sample does not allow accuratedetermination of the variability of this estimated mean proficiemy.
SUMMARY
Some out-of-school factors cannot be changed, but others can be altered in a positive wayto influence a student's learning and motivation. Partnerships among students, parents,teachers, and the larger community can affect the educational environment in the home,resulting in more out-of-school reading and an incremed value placed on educationalachievement, among other desirable outcomes.
The data related to out-of-school factors show that:
Students in Maryland who had four types of :eading materials (anencyclopedia, newspapers, magazines, and more thaa 25 books) at homeshowed higher mathematics proficiency than did studtmts with zero to twotypes of materials. This is similar to the resalts for tli. nation, wherestudents who had all four types of materials showed higher mathematicsproficiency than did students who had zero to two types.
64THE 1990 NAEP TRIAL STATE ASSESSMENT 79

Maryland
Some of the eighth-grade public-school students in Maryland (11 percent)watched one hour or less of television each day; 19 percent watched sixhours or more. Average mathematics proficiency was lowest for studentswho spent six hours or more watching television each day.
Less than half of the students in Maryland (37 percent) did not miss anyschool days in the month prior to the assessment, while 27 percent missedthree days or more. Average mathematics proficiency was lowest forstudents who missed three or more days of school.
About one-quarter of the students (30 percent) were in the "stronglyagree" category relating to students' perceptions of mathematics. Averagemathematics proficiency was lowest for students who were in the"undecided, disabree, strongly disagree" category.
rLJU
80 THE 1990 NAEP TRIAL STATE SSESSMENT

Mwy land
THE NATION'SREPORT
CARD
PROCEDURAL APPENDIX
This appendix provides an overview of the technical details of the 1990 Trial StateAssessment Program. It includes a discussion of the assessment design, the mathematicsframework and objectives upon which the assessment was based, and the procedures usedto analyze the results.
The objectives for the assessment were developed through a consensus process managedby the Council of Chief State School Officers, and the items were developed through asimilar process managed by Educaii'mal Testing Service. The development of the TrialState Assessment Program benefitted from the involvement of hundreds of representativesfrom State Education Agencies who attended numerous NETWORK meetings, served oncommittees, reviewed the framework, objectives, and questions, and, in general, providedimportant suggestions on all aspects of the program.
Assessment Design
The 1990 Trial State Assessment was based on a focused balanced incorwlete block (BIB)spiral matrix design -- a design that enables broad coverage of mathematics content whileminimizing the burden for any one student.
In total, 137 cognitive mathematics items were developed for the assessment, including 35open-ended items. The first step in implementing the BIB design required dividing theentire set of mathematics items into seven units called blocks. Each block was designed tobe completed in 15 minutes.
86
THE 1990 NAEP TRIAL STATE ASSESSMENT 81
Maryland
The blocks were then assembled into assessment booklets so that each booklet containedtwo background questionnaires -- the first consisting of general background questions andthe second consisting of mathematics background questions -- and three blocks of cognitivemathematics items. Students were given five minutes to complete eacn of the backgroundquestionnaires and 45 minutes to complete the three 15-minute blocks of mathematicsitems. Thus, the entire assessment required approximately 55 minutes of student time.
In accordance with the BIB design, the blocks were assigned to the assessment booklets sothat each block appeared in exactly three booklets and each block appeared with everyother block in one booklet. Seven assessment booklets were used in the Trial StateAssessment Program. The booklets were spiraled or interleaved in a systematic sequenceso that each booklet appeared an appropriate number of times in the sample. The studentswithin an assessment session were assigned booklets in the order in which the booklets werespiraled. Thus, students in any given session received a variety of different booklets andonly a small number of students in the session received the same booklet.
Assessment Content
The framework and objectives for the Trial State Assessment Program were developedusing a broad-based consety as process, as described in the introduction to this report.'The assessment framework consisted of two dimensions: mathematical content areas andabilities. The five content areas assessed were Numbers and Operations; Measurement;Geometry; Data Analysis, Statistics, and Probability; and Algebra and Functions (seeFigure A I). The three mathematical ability areas assessed were Conceptual Understanding,Procedural Knowledge, and Problem Solving (see Figure A2).
Data Analysis and Scales
Once the assessments had been conducted and information from the assessment bookletshad been compiled in a database, the assessment data were weighted to match knownpopulation proportions and adjusted for nonresponse. Analyses were then conducted todetermine the percentages of students who gave various responses to each cognitive andbackground question.
Item response theory (1RT) was used to estimate average mathematics proficiency for eachjurisdiction and for various subpopulations, based on students' performance on the set ofmathematics items they received. 1RT provides a common scale on which performancecan be reported for the nation, each jurisdiction, and subpopulations, even when allstudents do not answer the same set of questions. This common scale makes it possibleto report on relationships between students' characteristics (based on their responses to thebackground questions) and their overall performance in the assessment.
N anon& Assessment of Educational Progress, Minhematics ()Neal s 1990 Assessment (Princeton, NJ:Educational Testmg Service. 1988).
tr7
82 THE 1990 NAEP TRIAL STATE ASSESSMENT
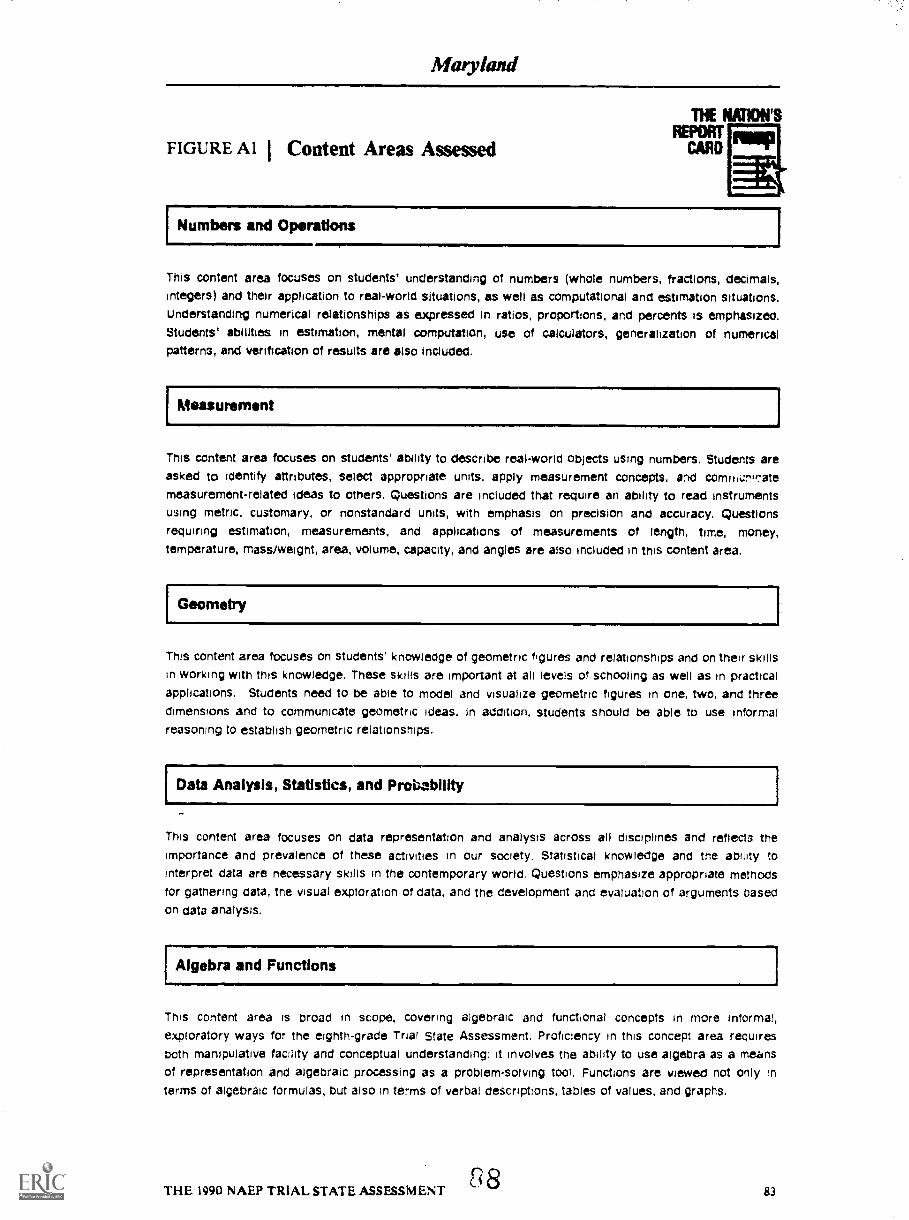
Maryland
This cOntent area focuses on students' understanding of numberS (whole numbers, fractions, decimals,integers) and their application to real-world situations, as well as computational and estimation situations.Understanding numerical relationships as expressed in ratios, proportions, and percents is emphasized.Students' abilities in estimation, mental computation, uSe of calculators, generalization Of numericalpatterns, and verification of results are alSo included.
Measurement
This content area focuses on students' ability to describe real-world objects using numbers. Students areasked to identify attributeS, Select appropriate units, apply measurement concepts, and comri1d^ir7atemeasurement-related ideas to others. Questions are included that require an ability to read instrumentsusing metric, customary, or nonstandard units, with emphasis on precision and accuracy. Questionsrequiring estimation, measurements, and applications of measurements of length, time, money,
temperature, mass/weight, area, volume, capacity, and angles are also included in thIS content area.
Geometry
This content area focuses on students' knowledge of geometric figures and relationships and on their skillsin working with this knowledge. These skills are important at all levels of schooling as well as in practicalapplications. Students need to be abfe to model and visualize geometric figures in one, two, and threedimensions and to communicate geometric ideas. In addition, students should be able to use informalreasoning to establish geometric relationships.
Data Analysis, Statistics, and Probability
This content area focuses on data representation and analysts across all disciplines and reflects theimportance and prevalence of these activities in our society. Statistical knowledge and the ability tointerpret data are necessary skills in the contemporary world. Questions emphasize appropriate methodstor gathering data, the visual exploration ot data, and the development and evaluation of arguments basedon data analysis.
Algebra and Functions
ThIS content area is broad in scope, covering algebraic and functional concepts in more informal,exploratory ways for the eighth-grade Trial State Assessment, Proficiency in this concept area requiresboth manipulative facility and conceptual understanding: it involves the ability to use algebra as a meansof representation and algebraic processing as a problem-solving tool. Functions are viewed not only interms of algebraic formulas, but also in terms of verbal descriptions, tables of values, and graphs.
88THE I49O NAEP TRIAL STATE ASSESSMENT 83
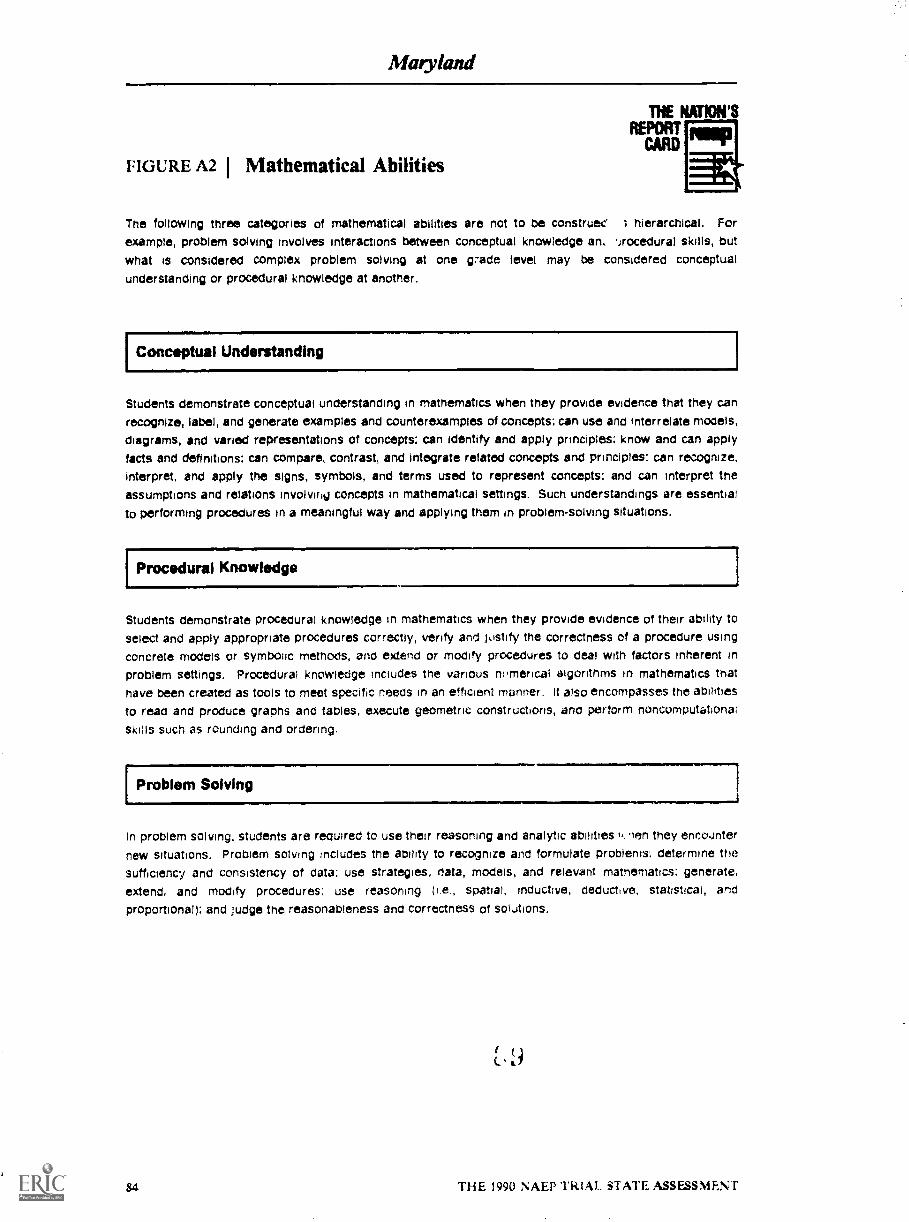
Maryland
FIGURE A2 I Mathematical Abilities
The following three categories of mathematical abilities are not to be COnstruec' 3 hierarchical. For
example, problem solving involves interactions between conceptual knowledge an. iirocedural skills, butwhat is considered complex problem solving at one grade level may be considered conceptualunderstanding or procedural knOwledge at another.
Conceptual Understanding
Students demonstrate conceptual understanding in mathematics when they provide evidence that they canrecognize, label, and generate examples and counterexamples of concepts: can use and Interrelate models,diagrams, and varied representations of conCepts: Can Identify and apply principles; know and can applyfacts and definitions: can compare, contrast, and integrate related concepts and principleS: can recognize,interpret, and apply the signs, symbols, and terms used to represent concepts: and can interpret theassumptions and relations involvirig concepts in mathematical settings. Such understandings are essentialto performing procedureS in a Meaningful way and applying them in problem-solving situations.
Procedural Knowledge
Students demonstrate procedural knowledge in mathematics when they provide evidence of their ability toselect and apply appropriate procedures correctly, verify and justify the correctness of a procedure usingconcrete models or Symbolic methods, and extend or modify procedures to deal with factors inherent inproblem settings. Procedural knowledge includes the various ntimerical algorithms in mathematics thathave been created as tools to meet specific needs in an efficient manner. It also encompasses the abilities
to read and produce graphs and tables, execute geometric constructions, arid perform noncomputationalSkills such as rounding and ordering.
[problem Solving .1In problem solving, students are required to use their reasoning and analytic abilities len they encounter
new situations. Problem solving includes the ability to recognize and formulate problems: determine thesufficiency and consistency of data: use strategies, rlata, models, and relevant mathematics; generate,extend, and modify procedures; use reasoning e., spatial, inductive, deductive, statistical, andproportional); and judge the reasonableness and correctness of solutions.
t,14
84 THE 1990 NAEP TRIAL STATE ASSESSMENT
Maryland
A scale ranging from 0 to 500 was created to report performance for each content arca.Each content-area scak was based on the distribution of student performance across allthree grades assessed in the 1990 national assessment (grades 4, 8, and 12) and had a meanof 250 and a standard deviation of 50.
A composite scale was created as an overall measure of students' mathematics proficiency.The composite scale was a weighted average of the five content area scales, where theweight for each content area was proportional to the relative importance assigned to thecontent area in the specifications developed by the Mathematics Objectives Panel.
Scale Anchoring
Scale anchoring is a method for defining performance along a scale. Traditionally,performance on educational scales has been defined by norm-referencing -- that is, bycomparing students at a particular scale level to other students. In contrast, the NAEPscale anchoring is accomplished by describing what students at selected levels know andcan do.
The scale anchoring process for the 1990 Trial State Assessment began with the selectionLi four levels -- 200, 250, 300, and 350 -- on the 0-to-500 scale. Although proficiency levelsbelow 200 and above 350 could theoretically have been defined, they were not because sofew students performed at the extreme ends of the scale. Any attempts to define levels atthe extremes would therefore have been highly speculative.
To define performance at each of the four levels on the scale, NAEP analyzed sets ofmathematics items .fr im the 1990 assessment that discriminated well between adjacentlevels. The criteria fo selecting these "benchmark" items were as follows:
To define performance at level 200, items were chosen that were answeredcorrectly by at least 65 percent of the students whose proficiency was at ornear 200 on the scale.
To define performance at each of the higher levels on the scale, items werechosen that were: a) answered correctly by at least 65 percent of studentswhose proficiency was at or near that level; and b) answered incorrectly bya majority (at least 50 percent) of the students performing at or near thenext lower level.
The percentage of students at a level who answered the item correctly hadto be at least 30 points higher than the percentage of students at the nextlower level who answered it correctly.
fl 0
THE 199U NAEP TRIAL STATE ASSESSMENT 85
Maryland
Once these empirically selected sets of questions had been identified, mathematics educatorsanalyzed the questions and used their expert judgment to characterize the knowledge, skills,and understandings of students performing at each level. Each of the four proficiency levelswas defined by describing the types of mathematics questions that most students attainingthat proficiency level would be able to perform successfully. Figure 3 in Chapter 1 providesa summary of the levels and their characteristic skills. Example questions for each level areprovided in Figure A3, together with data on the estimated proportion of students at orabove each of the four proficiency levels who correctly answered each question.'
Questionnaires for Teachers and Schools
As part of the Trial State Assessment, questionnaires were given to the mathematicsteachers of assessed students and to the principal or other administrator in eachparticipating school.
A Policy Analysis and Use Panel drafted a set of policy issues and guidelines and maderecommendations concerning the design of these questionnaires. For the 1990 assessment,the teacher and school questionnaires focused on six educaional areas: curriculum,instructional practices, teacher qualifications, educational standards and reform, schoolconditions, and conditions outside of the school that facilitate learning and instruction.Similar to the development of the materials given to students, the policy guidelines and theteacher and school questionnaires were prepared through an iterative process that involvedextensive development, field testing, and review by external advisory groups.
MATHEMATICS TEACHER QUESTIONNAIRE
The questionnaire for eighth-grade mathematics teachers consisted of two parts. The firstrequested information about the teacher, such as race/ethnicity and gender, as well asacademic degrees held, teaching certification, training in mathematics, and ability to getinstructional resources. In the second part, teachers were asked to provide information oneach class they taught that included one or more students who participated in the TrialState Assessment Program. The information included, among other things, the amountof time spent on mathematics instruction and homework, the extent to which textbooksor worksheets were used, the instructional emphasis placed on different mathematicaltopics, and the use of various instructional approaches. Because of the nature of thesampling for the Trial State Assessment, the responses to the mathematics teacherquestionnaire do not necessarily represent all eighth-grade mathematics teachers in a stateor territory. Rather, they represent the teachers of the particular students being assessed.
2 Since there were insufficient numbers of eighth-grade questions at levels 200 and 350, one of the questionsexemplifying level 200 is from the fourth-grade national assessment and one exemplifying level 350 is from thetwelfth-grade national assessment.
(11
86 THE 1990 NAEP TRIAL STATE ASSESSMENT

FIGURE A3 I Example Items for Mathematics Proficiency Levels
Level 200: Simple Additive Reasoning and Problem Solving with WholeNumbers
EXAMPLE 1
A-7Coif
0Tomb GeV
0liatrWrlab
7. lathe ltai Wee Who those all the are dm eel thew &Hawn loads etbath ao shoos there. If the I& Nth bas with dee hued of bath thaw&whoa Iwo wt0 bath the fewest belle la Of
410 The boo we* the lanais bah
41 The boa mg the getit belle
71te bee iosir the nab& bath
41D Yam co' t fah.
EXAMPLE 2
DOM OF MU PIO=AT FARAWAY MAMS
nois Wossi
Caps dile Wink
Oft,*Loom
Otepheit
O. How arty bathe a *awe were picked ow Tbscadayi
tro 51
CD 60
40 70
CD 10
CD 90
410 1 datit know,
Grade 4Overall Percentage Correct: 73%Percentage Correct for Anchor Levels:
2§11 222 3§265 91 100
Grade 4Overall PercentagePercentage Correct21:2 zfa75 Ql
fl2
GradeOverall PercentagePercentage CorrectZO2 ZCIQ76 87
Correv-,for Anct;,,
RQ100
Correct: 89%for Anchor Levels:
22296 100

Mwyland
FIGURE A3 I Example Items for Mathematics Proficiency Levels(continued)
ILevel 250: Simple Multiplicative Reasoning and Two-Step Problem Solving
EXAMPLE 1
7. What is the value of a + 5 when a ai 3 t
Answer.
EXAMPLE 2
KAM CUM SLIWZYMU=
Grad. 8Overall Percentage Cermet 75%Percentage Correct for Anchor Levels:222 224 MI 22428 59 95 se
Geo el 1Kat
hasseis'
Grade $NOW Percentage Correct 73%Percentage Correct for Ancbor Levels:
11
SO
Tags
222 attil 242 2314
Tee uWe gm shows the Mob We =icy ei kW coke. Ca sit rank 21 as 92 92lebew, loge a rink srsok so Women she deem io the sablt. Label eachpen el dee cede ipeph wish she Nam be* Wm.
Ded you use she cliculeset ea this geese kat
0 Wm ON.
EXAMPLE 3
6. Kackkeo u peckete baocbstis law boxes. Each box holds basebelh. Sbshes 24 balk WIluclo istimbrz uncatee will help ha Ifni oxe how nucyholm she will sued;
cp 24 6 -
oh 24 + 6
41, 24 + 6 0
co 24 Id 6 0
CD clon"; know.
Grade 5Overall Percentage Correct 77%Percentage Coned for Anchor Levels:
222 224 22R37 71 95 100
88 TIM 1990 NAM' TRIAL &TAM ASSESSMENT

Masyland
FIGURE A3 I Example Items for Mathematics Proficiency Levels(continued)
Level 300: Reasoning and Problem Solving involving Fractions, Decimals,Percents, Elementary Geometric Properties, and SimpleAlgebraic Manipulations
EXAMPLE 1
Which el the Wow* shows the wok fiiinme4 tie above muses evershe hrher
a)
EXAMPLE 2
le she RAJ owe that e dem is *NW. a of !I kes leaf Se wyeesewsedby s eceie sesisl 3 1.neku hen. U the ewe seek is wok bone IS tealigh %void be rtewtoesued hi model hew way bass Med
CSaa
4
IP 7e V
ress wee she setchtbsist est Ws we/0W
CI Yee Cs No
THE 1990 NA131$ TRIAL RATE AssEssiENT
Grade 8Overall Percentage Correct 80%Percentage Correct for Anchor Levels:221 Zig RI Mg33 49 n 90
Grade 12Overall Percentage Correct 75%Percentage Correct tor Anchor Levels:
ZOQ48 79 05
Grade 8Overall Percentage Correct 59%Percentage Correct tor Anchor Levels:222 222 ZIQ af217 48 88 99
BEST COPY AVAILABLE
89

Maryland
FIGURE A3 I Example Items for Mathematics Proficiency Levels(continued)
Level 350: Reasoning and Problem Solving involving GeometricRelationships, Algebraic Equations, and Beginning Statistics andProbability
EXAMPLE 'I
110, (141 asthma 16-17 mkt us the isi1iaws4 patios at ase.hautss
0
2
16. III doh rori of gloaturcs is studious& bow sass am k Ike
EXAMPLE 2
17. 1.1p1ala low you found vuut ialwa theitiOa /6,
Manx
Grade 8Overall Percentage Correct 34%Percentage Correct for Anchor Levels:
224 214 222 2:2013 19 53 88
Grade 12Overall Percentage Correct: 49%Percentage Correct for Anchor Levels:
222 214 222 21222 48 90
Grade 8Overall Percentage Correct: 15%Percentage Correct for Anchor Levels:224 2/2 222 212
1 4 28 74
Grade 12Overall Parcentage Correct 27%Percontag Correct for Anchor Levels:22/ 2§2 MQ
3 22 74
5
90 THE 1990 NAEP TRIAL STATE ASSESSMENT
Maryland
SCHOOL CHARAC1ERIS11CS AND POLICIES QUESTIONNAIRE
An extensive school questionnaire was completed by principals or other administrators inthe schools participating in the Trial State Assessment. In addition to questions about theindividuals who completed the questionnaires, there were questions about school policies,course offerings, and special priority areas, among other topics.
It is important to note that in this report, as in all NAEP reports, the student is always theunit of analysis, even when information from the teacher or school questionnaire is beingreported. Having the student as the unit of analysis makes it possible to describe theinstruction reLvived by representative samples of eighth-grade students in public schools.Although this approach may provide a different perspective from that which would beobtained by simply collecting information from a sample of eighth-grade mathematicsteachers or from a sample of schools, it is consistent with NAEP's goal of providinginformation about the educational context and performance of students.
Estimating Variability
The statistics reported by NAEP (average proficiencies, percentages of students at or aboveparticular scale-score levels, and percentages of students responding in certain ways tobackground questions) are estimates of the corresponding information for the populationof eighth-grade students in public schools in a state. These estimates are based on theperformance of a carefully selected, representative sample of eighth-grade public-schoolstudents from the state or territory.
If a different representative sample of students were selected and the assessment repeated,it is likely that the estimates might vary somewhat, and both of these sample estimatesmight differ somewhat from the value of the mean or percentage that would be obtainedif every eighth-grade public-school student in the state or territory were assessed. Virtuallyall statistics that are based on samples (including those in NAEP) arc subject to a certaindegree of uncertainty. The uncertainty attributable to using samples of students is referredto as sampling error.
Like almost all estimates based on assessment measures, N AEP's total group and subgroupproficiency estimates are subject to a second source of uno-n-tainty, in addition to samplingerror. As previously noted, each student who participated in the Trial State Assessmentwas administered a subset of questions from the total set of questions. If each student hadbeen administered a different, but equally appropriate, set of the assessment questions --or the entire set of questions -- somewhat different estimates of total gr-oup and subgroupproficiency might have been obtained. 11us, a second source of uncertainty arises becauseeach student was administered a subset of the total pool of questions.
fl9THE 1990 NAEP TRIAL STATE ASSESSMENT 91
Mapy land
ln addition to reporting estimates of average proficiencies, proportions of students at orabove particular scale-score levels, and proportions of students giving various responses tobackground questions, this report also provides estimates of the magnitude of theuncertainty associated with these statistics. These measures of the uncertainty are calledstandard errors and are given in parentheses in each of the tables in the report. Thestandard errors of the ef 'mates of mathematics proficiency statistics reflect both sourcesof uncertainty discussed above. The standard errors of the other statistics (such as theproportion of students answering a background question in a certain way or the proportionof students in certain racial/ethnic groups) reflect only sampling error. NAEP uses amethodology called the jackknife procedure to estimate these standard errors,
Drawing Inferences from the Results
One of the goals of the Trial State Assessment Program is to make inferences about theoverall population of eighth-grade students in public schools in each participating state andterritory based on the particular sample of students assessed. One uses the results from thesample -- taking into account the uncertainty associated with all samples -- to makeinferences about the population.
The use of confidence Litervals, based on the standard errors, provides a way to makeinferences about the populati,.m means and proportions in a manner that reflects theuncertainty associated with th, sample estimates. An estimated sample mean proficiency± 2 standard errors represents a 95 percent confidence interval for the correspondingpopulation qua.ntny. This means that with approximately 95 percent certainty, the averageperformance of the entire population of interest (e.g., all eighth-grade students in publicschools in a state or territory) is within ± 2 standard errors of the samph; mean.
As an example, suppose that the average mathematics proficiency of the students in aparticular state's sample were 256 with a standard error of 1.2. A 95 percent confidenceMterval for the population quantity would he as follows:
Mean ± 2 standard errors = 256 ± 2 (1.2) = 256 ± 2.4 =
256 - 2.4 and 256 + 2.4 = 253.6, 258.4
Thus, one can conclude with 95 percent certainty that the average proficiency for the entirepopulation of eighth-grade students in public schools in that state is between 253.6 and258.4.
Similar confidence intervals can he constructed for percentages, provided that thepercentages are not extremely large (greater than 90 percent) or extremely small (less than10 lercent). For extreme percentages, confidence mtervals constructed in the abovemanner may not be appropriate and procedures for obtaining accurate confidence intervalsarc quite complicated.
I
92 THE 1990 NAEP TRIAL. STATE ASSESSMENT

Mao land
Analyzing Subgroup Differences in Proficiencies and Proportions
In addition to the overall results, this report presents outcomes separately for a variety ofimportant subgroups. Many of these subgroups are defined by shared characteristics ofstudents, such as their gender, race/ethnicity, and the type of community in which theirschool is located. Other subgroups are defined by students' responses to backgroundquestions such as About how much time do you usually spend each day on mathematicshomework? Still other subgroups are defined by the responses of the assessed students'mathematics teachers to questions in the mathematic3 teacher questionnaire.
As an example, one might be interested in answering the question: Do students whoreported spending 45 minutes or more doing mathematics homework each day exhibit higheraverage mathematics ptoficiency than students who reported spending IS minutes or less?
To answer the question posed above, one begins by comparing the average mathematicsproficiency for the two groups being analyzed. If the mean for the group who reportedspending 45 minutes or more on mathematics homewoik is higher, one may be temptedto conclude that that group does have higher achievement than the group who reportedspending 15 minutes or less on homework. However, even though the means differ, theremay be no real difference in performance between the two groups in the population becauseof the uncertainty associated with the estimated average proficiency of the groups in thesample. Remember that the intent is to make a statemelit about the tntire population, notabout the particular sample that was assessed. The data from the sample are used to makeinferences about the population as a whole.
As discussed in the previous section, each estimated sample mean proficiency (orproportion) has a degree of uncertainty associated with it. It is therefore possible that ifall students in the population had been assessed, rather than a sample of students, or if theassessment had been repeated with a different sample of students or a different, butequivalent, set of questions, the performances of various groups would have been different.Thus, to determine whether there is a real difference between the mean proficiency (orproportion of a certain attribute) for two groups in the population, one must obtain anestimate of the degree of uncertainty associated with the difference between the proficiencymeans or proportions of those gioups for the sample. This estimate of the degree ofuncertainty called the standard error of the difference between the groups -- is obtainedby taking the square of each group's standard error, summing these squared standard errors,and then taking the square root of this sum.
Similar to the manner in which the standard error for an individual gmup mean orproportion is used, the standard error of the difference can he used to help :-.4eterminewhether differences between groups in the population are real. The difference between themean proficiency or proportion of the two groups ± 2 standard errors of the differencerepresents an approximate 95 percent confidence interval. If the resulting interval includeszero, one should conclude that there is insufficient evidence to claim a real differencebetween groups in the population. If the interval does not contain zero, the differencebetween groups is statistically significant (different) at the .05 level.
ci
THE 1990 NAEP TRIAL STATE ASSESSMENT 93

Maryland
As an example, suppose that one were interested in determining whether the averagemathematics proficiency of eighth-grade females is higher than that of eighth-grade malesin a particular state's public sibools. Suppose that the sample estimates of the meanproficiencies and standard errors for females and males were as follows:
GroupAverage
ProficiencyStandard
Error
Female_-
2594
2.0
Male 255 2.1
The difference betweeil the estimates of the mean proficiencies of females and males is fourpoints (259 - 255). The standard error of this difference is
N12.02 + 2.12 = 2.9
Thus, an approximate 95 percent confidence interval for this difference is
Mean difference ± 2 standard errors of the difference =
4 ± 2 (2.9) = 4 ± 5.8 = 4 - 5.8 and 4 + 5.8 = -1.8, 9.8
The value zero is within this confidence interval, which extends from -1.8 to 9.8 (i.e., zerois between -1.8 and 9.8). Thus, one should conclude that there is insufficient evidence toclaim a difference in average mathematics proficiency between the population ofeighth-grade females and males in public schools in the state.'
Throughout this report, when the mean proficiency or proportions for two groups werecompared, procedures like the one described above were used to draw the conclusions thatare presented. If a statement appears in the repon indicating that a particular group hadhigher (or lower) average proficiency than a second group, the 95 percent confidenceinterval for the difference between groups did not contain zero. When a statement indicatesthat the average proficiency or proportion of some attribute was about the same for twogroups, the confidence interval included zero, and thus no difference could be assumedbetween the groups. The reader is cautioned to avoid drawing conclusions solely on thebasis of the magnitude of the differences. A difference between two groups in the samplethat appears to be slight may represent a statistically significant difference in the populationbecause of the magnitude of the standard errors. Conversely, a difference that appears tobe large may not be statistically significant.
3 The procedure described above (especially the estimation of the standard error of the difference) is, in a strictsense, only appropriate when the statistics being compared come from independent samples. For certaincomparisons in the report, the groups were not independent. In those cases, a different (and moreappropriate) estimate of the standard error c)f thi, difference was used.
94 THE 1990 NAEP TRIAL STATE ASSESSM:AT
Maryland
The procedures described in this section, and the certainty ascribed to intervals (e.g., a 95percent confidence interval), are based on statistical theory that assumes that only oneconfidence interval or test of statistical significance is being performed. However, in eachchapter of this report, many different groups are being compared (i.e., multiple sets ofconfidence intervals are being analyzed). When one considers sets of confidence intervals,statistical theory indicates that the certainty associated with the entire set of intervals is lessthan that attributable to each individual comparison from the set. If one wants to hold thecertainty level for the set of comparisons at a particular level (e.g., .95), adjustments (calledmultiple comparison procedures) must be made to the methods described in the previoussection. One such procedure -- the Bonferroni method -- was used in the analyses describedin this report to form confidence intervals for the differences between groups whenever setsof comparisons were considered. Thus, the confidence intervals in the text that are basedon sets of comparisons are more conservative than those described on the previous pages.A more detailed description of the use of the Bonferroni procedure appears in the TrialState Assessment technical report.
Statistics with Poorly Determined Standard Errors
The standard errors for means and proportions reported by NAEP are statistics andtherefore are subject to a certain degree of uncertainty. In certain cases, typically when thestandard enor is based on a small number of students, or when the group of students isenrolled in a small number of schools, the amount of uncertainty associated with thestandard errors may be quite large. Throughout this report, estimates of standard errorssubject to a large degree of uncertainty are followed by the symbol "!". In such cases, thestandard errors -- and any confidence intervals or significance tests involving these standarderrors -- should be interpreted cautiously. Further details concerning procedures foridentifying such standard errors are discussed in the Trial State Assessment technical report.
Minimum Subgroup Sample Sizes
Results for mathematics proficiency and background variables were tabulated and reportedfor goups defined by race/ethnicity and type of school community, as well as by genderand parents' education level. NAEP collects data for five racial/ethnic subgroups (White,Black, Hispanic, Asian/Pacific Islander, and American Indian/Alaskan Native) and fourtypes of communities (Advantaged Urban, Disadvantaged Urban, Extreme Rural, andOther Communities). However, in many states or territories, and for some regions of thecountry, the number of students in some of these groups was not sufficienly high to permitaccurate estimation of proficiency and/or background variable results. As a result, data arenot provided for the subgroups with very small sample sizes. For results to be reported forany subgroup, a minimum sample size of 62 students was required. This number wasdetermined by computing the sample size required to detect an effect size of .2 with aprobability of .8 or greater.
1.00
TfiE 1990 NAEP TRIAL STATE ASSESSM ENT 95

Maryland
The effect size of .2 pertains to the true difference between the average proficiency of thesubgroup in question and the average proficiency for the total eighth-grade public-schoolpopulation in the state or tenitory, divided by the standard deviation of the proficiency inthe total population. If the true difference between subgroup and totai group mean is .2total-group standard deviation units, then a sample size of at least 62 is required to cletxtsuch a difference with a probability of .8. Further details about the prxedure fordetermining minimum sample size appear in the Trial State Assessment technical report.
Desci ling the Size of Percentages
Some of the percentages reported in the text of the report are given quantitativedescriptions. For example, the number of students being taught by teachers with master'sdegrees in mathematics might be described as "relatively few" or "almost all," dependingon the size of the percentage in questio, . Any convention for choosing descriptive termsfor the magnitude of percentages is to some degree arbitrary. The descriptive phrases usedin the report and the rules used to select them are shown below.
Percntage Description of Text in ReportI
p = 0 None0 < p ... 10 Relatively few10 < p .s. 20 Some20 < p .s. 30 About one-quarter30 < p .5_ 44 Less than half44 < p 5.: 55 About half55 < p 5, 69 More than half69 < p 79 About three-quarters79 < p ....s. 89 Many89 < p < 100 Almost all
p = 100 All
in
96 THE 1990 NAEP TRIAL STATE ASSESSMENT
c*,;
Maryland
THE NATION'SREPORT
CARO
DATA APPENDIX
For each of the tables in the main body of the report that presents mathematics proficiencyresults, this appendix contains corresponding data for each level of the four reportingsubpopulations race/ethnicity, type of community, parents' education level, and gender.
1n2THE 1990 NAEP TRIAL STATE ASSESSMENT 97
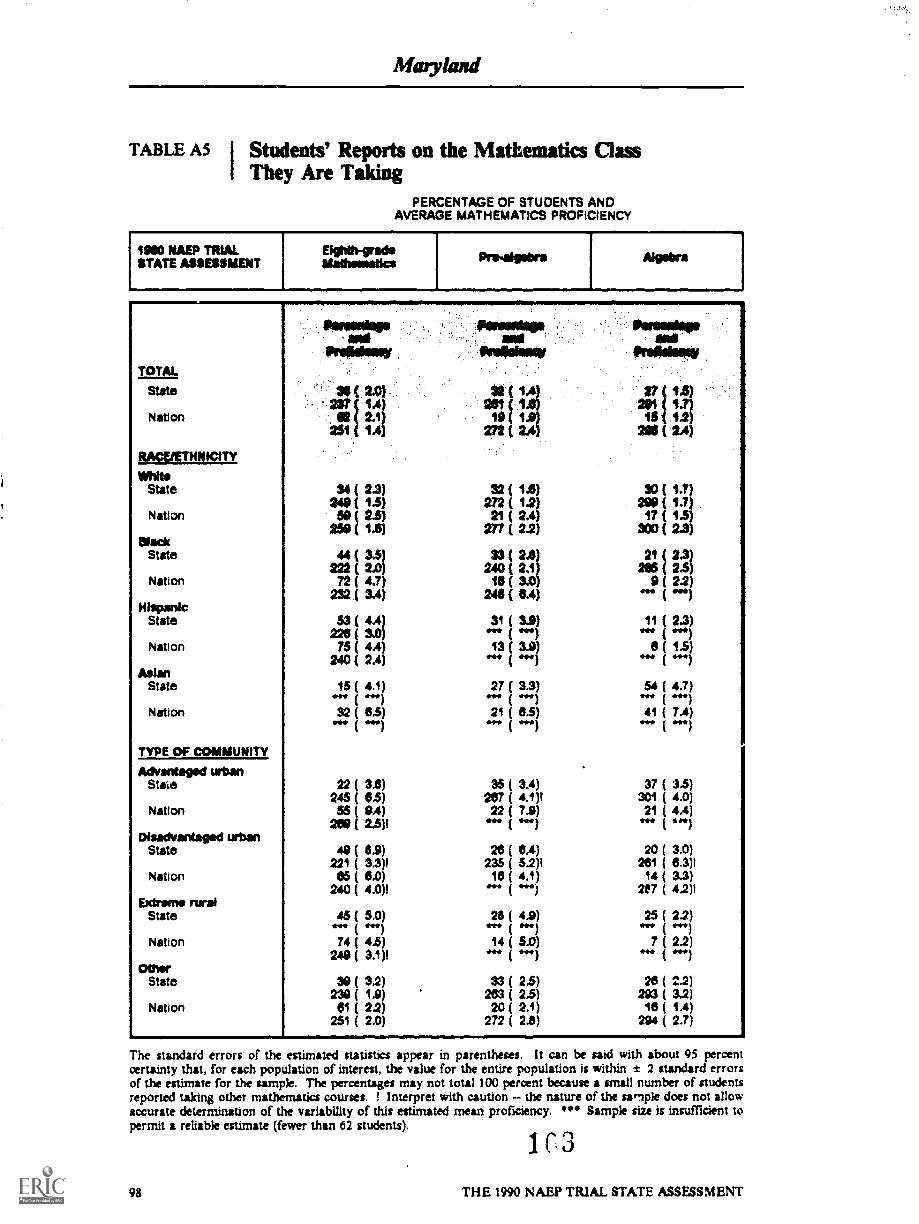
Maryland
TABLE A5 I Students' Reports on the Mathematics Class1 They Are Taking
PERCENTAGE OF STUDENTS ANDAVERAGE MATHEMATICS PROFICIENCY
19110 NAEP 'TRIAL Eighih-gradeSTATE ASSESSMENT blaihmatics Pre-algebra
, ..
TOTA1.
and'ffelhollaney
lidfriagiargt
State ti 24 22 (23t 2$1 ( 291
Nation 92 2.1 10 ( I 15 .1.2
lescramem291 1.4 ( 2.4 200 ( 2.4)
WM.State 34 3.3) 32 ( 1.6) 30 ( 1.7)
240 ( 13) 272 ( 1.2) 290 ( 1.7)Nation 50 ( 2.5) 24) 17 ( 13)
25a ( 1.8) 271 (2.2) 300 ( 23)Slack
State 44 ( 3.5) 33 ( 21 ( 23)222 ( 2.0) 240 ( 2.1 205 ( 2.5)
Nation 72 ( 4.7) ( 3.0 9 ( 2.2)232 ( 3.4) 241 ( 8.4) *If (
HispanicState
2211531 1041
31 ( 3.9)t ) 11 (IN*
23)010111
Nation TS ( 4.4) 13 3.9) 6 ( 1 3)240 ( 2.4) 1114. 441.1 44* ( 4+1
AsianState 27 ( 33)
( *In 54 ((
4.7).41Nation 32 ( OS)
( *en21 ( 6.5)( .11
41 ((
7.4).41
TYPE OF COMMUNITY
Advantaged urbanStaie 22 ( 33) 35 ( 3.4) 37 ( 3.5)
245 6.5) 267 ( 4.1)1 301 ( 4.0)Nation 56
269( 04)( 2.5)1
22 ( 7.9)04*
21 (I. ( 4.4)4.)Disadvantaged urban
State 49 6.9) 20 ( 11.4) 20 ( 3.0)221 3.3)1 235 ( 5.2)1 261 ( 6.3)1
Nation 65 ( 6.0) 14 ( 3.3)240 ( 4.0)1 ( INN) 267 ( 4.2)1
Extreme ruralState 45 ( 5.0)a.** ( .) 26 ( 4.9)
( *0125 ( 2.2)
Nation 74 ( 4.5) 14 ( 5.0) ( 2.2)249 ( 3.1)1 (
OtherState 30 ( 3.2) 33 ( 2.5) 26 ( 2.2)
23a ( ts) 263 ( 2.5) 293 ( 3.2)Nation ( 2.2) 20 ( 2.1) ( 1.4)
251 ( 2.0) 272 ( 2.6) 294 ( 2.7)
The standard errors of the estimated statistics appear in parentheses. It can be said with about 95 percentcertainty that, for each population of interest, the value for the entire population is within 2 standard errorsof the estimate fbr the sample. The percentages may not total 100 percent because a small number of studentsreported taking other mathematics courses. ! Interpret with caution - the nature of the sariple does not allowaccurate determination of the variability of this estimated mean proficiency. *** Sample size is insufficient topermit a reliable estimate (fewer than 62 students).
1 C 3
98 THE 1990 NAEP TRIAL STATE ASSESSMENT
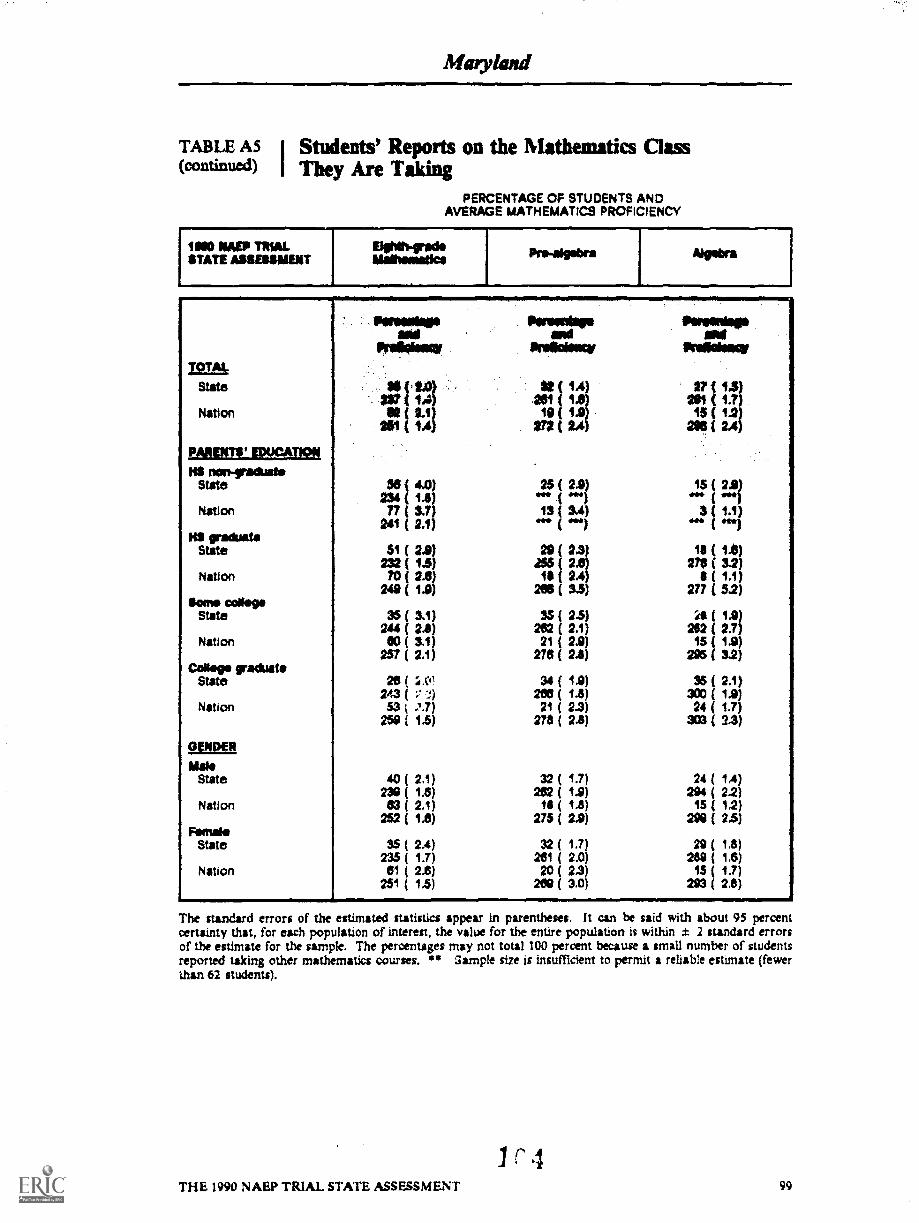
TABLE AS I Students' Reports on the Mathematics Class(continued) i They Are Taking
PERCENTAGE OF STUDENTS ANDAVERAGE MATHEMATICS PROFICIENCY
IIMO NAEP TRIALSTATE AMMO=
IP9Sb1 Algebra
/2/isState
Nation
fmacimmensatNS non-radiate
State
Nation
KS graduateState
Nation
Some colknoState
Nation
CoNsge "'JAW.State
Nation
M.State
Nation
FondaState
Nation
fria000141
OS (234 ( 41.41177( 3.7
241 ( 2.1)
51 ( 2.9)232 ( 1.5)
70( 2.6)249 ( 1.9)
35 ( 3.1)244 ( 2.8)00 ( 3.1)
257 ( 2.1)
26 ( IX"243 (
53259 ( 1.5)
40 ( 2.1)239 ( 1.6)63 ( 2.1)
252 ( 1.6)
35 ( 24)235 ( 1.7)61 ( 2.6)
251 ( 1.5)
am.Inelkimmicv
( 14)221 ( 13)19 ( 1.9)
272 24)
CMPallokief
27 ( 13)201 ( 1.7)15 ( 1.2)
229 ( 2.4)
2$ ( 2.9) 15 2.9)
".. "434131*a* ***)
3 } 1.1;
29 ( 2.3) IS ( 1.6)255 ( 2.6) 211 ( 32)it ( 3.4) ( 1.1)
263 ( 3.5) 277 5.2)
35 ( 2.5) ( IA)262 ( 2.1) 282 ( 2.7)21 ( 2.9) 15 ( 1.9)
270 ( 2.8) 295 ( 3.2)
34 ( 1.9) 96 ( 2.1)200 ( 1.8) 300 ( 1.9)21 ( 2.3) 24 ( 1.7)
278 ( 2.1) 303 ( 2.3)
32 ( 1.7) 24 ( 1.4)262 ( 1.9) 294 ( 2.2)
18 ( 1.8) 16 ( 12)275 ( 2.9) 299 ( 2.5)
32 ( 1.7) 29 ( 1.8)261 ( 2.0) 28a ( 1.6)
20 ( 2.3) 15 ( 1.7)200 ( 3.0) 293 ( 2.8)
The standard errors of the estimated statistics appear in parentheses. It can be said with about 95 percentcertainty that, for each population of interest, the value for the entire population is within ± 2 standard errorsof the estimate for the sample. The percentages may not total 100 percent because a small number of studentsreported taking other mathematics courses. ** Gample size is insufficient to permit a reliable estimate (fewerthan 62 students).
THE 1990 NAEP TRIAL STATE ASSESSMENT 99

Maryland
TABLE A6 Teachers' Reports on the Amount of TimeStudents Spent on Mathematics HomeworkEach Day
PERCENTAGE OF STUDENTS ANDAVERAGE MATHEMATICS PROFICIENCY
MO NAEP TRIALSTATE ASSESSMENT Moe 15 Minutes 30 Minutes 46 Minu tes An HOW or
Men
TOTAL
State
Nation
Pareselays pipra~ fartonlaia ivanioNNIs illemagoand SPA IIM MI IN
Povadimay PfeadMilif PNIMOIMCV Ikalleanat firf*iersi
3 ( 1.1) NO ( 23) 4 2$) 4 tt 4 1237 ( 7.13, 232( 2.1) 220 &I V3
1 10.3) 43 ( 4.2) 43 HI 10 1 41 0.2v..
1 25$ ( 23) Me 272 VS 5.1RAMETHNICITY
Mtn.State 2 ( 0.7) 42 2.1) 44 2.0) 1.3) is? (( ') 261 1.6) 279 23) 302 4.2)Nation I ( 0.3) 30 4.5) 43 s.v, 11 2.4) 41 0.11s
"4 ( 444) 293 22) 270 ( 5.7) 277 73)4 279 33Mack
State I ( 2.4) 32 ( 4.0) 30 ( 3.8) 7 ( 2.0)229 ( 23) 241 ( 54) 444)
Nation 1 ( 0.7) 55 ( 7.6) 40 ( 07) 3 ( 1.2) 2 ( 0.4)444 ( 4") 232 ( 3.1) 2411 ( 53) ) (
HispanicState 3 ( 1.5) 41 ( 52) 4$ ( 4.7) 5 ( 1.7) 3 ( 14)
235 ( 4.9) 242 ( 3.8) *** V") ( 441Nation 14.1 48 ( 7.8) 34 ( 5.6) 13 ( 2.9) 2.1)
( *4) 245 ( 3.0)1 251 ( 4.2)1 ( (Asian
State 1 ( 1.3) 27 ( 8.8) 47 ( 7.1) 15( 4.0) 9 ( 3.5)( 444)
Nation 0 ( 0.0) 29 ( 7.8) 37 ( 6.6) 10 ( 34) 24 (10.2)4" ( 44.4) ( 444) 444 ( 44.0 ) 444 ( 444) (
TYPE OF COMMUNITY
Advantaged urbanState
Nation
Disadvantaged trbanState
NatiOn
Extreme nralState
Nation
OtherState
Nation
4" (1 ( 0.9)
.44 .4)
5 ( 2.5)444 ( .4)
0 ( 0.0)444 ( "4)
0 ( 0.0)"4 ( 4")
0 ( 0.0)44 .4)
3 ( 2.5)4" ( 444)
( 0.4)4.)
34 ( 5.8)282 ( 8.9)101 (11.3)
273 ( 3,1)1
24 ( 5.3)219 ( 3.7)141 (12.8)
238 ( 2.1)1
83 (20.4)444 .44)
08 (14.9)253 ( 5.4)1
42 ( 5.7)253 ( 3.1)37 ( 4.3)
256 ( 3.1)
52 ( 8.2)265 ( 44)132 (OA).4)
50 ( 0.0)235 ( 44)138 ( 9.4)
253 ( 9.0)1
*!: 129414
14 (10.9)0*4(44*)
42 ( 4.0)205 ( 2.8)49 ( 5.1)
285 ( 25)
10 ( 2.6)296 (11.4)1
5 ( 3.4)0411* 441)
6 ( 3.1)
4 ( 1.8)444 (
0 ( 0.0)444)
a ( 2.1)*44(44.4)12 I 5-9)
044 ( .4)
0 0.0)844 .4)
( 5.0)( .4)
( 1.111)
295 ( 64)110 ( 2.4)
278 ( 5.0)1
10 ( 8.2).44 ( 444)
0 ( 0.0)( 4")
10 ( 7.3)*44(4*. )
( 3.0)
4 ( 1.1)282 (11.8)4
The standard errors of the estimated statistics appear in pa:entheses. It can be said with about 95 percentcertainty that, for each population of interest, the value for the entire population is within ± 2 standard errorsof the estimate for the sample. ! Interpret with caution -- the nature of the sample does not allow accuratedetermination of the variability of this estimated mean proficiency. *** Sample ti2e is insufficient to permit areliable estimate (fewer than 62 students).
1r5100 THE 1990 NAEP TRIAL STATE ASSESSMENT
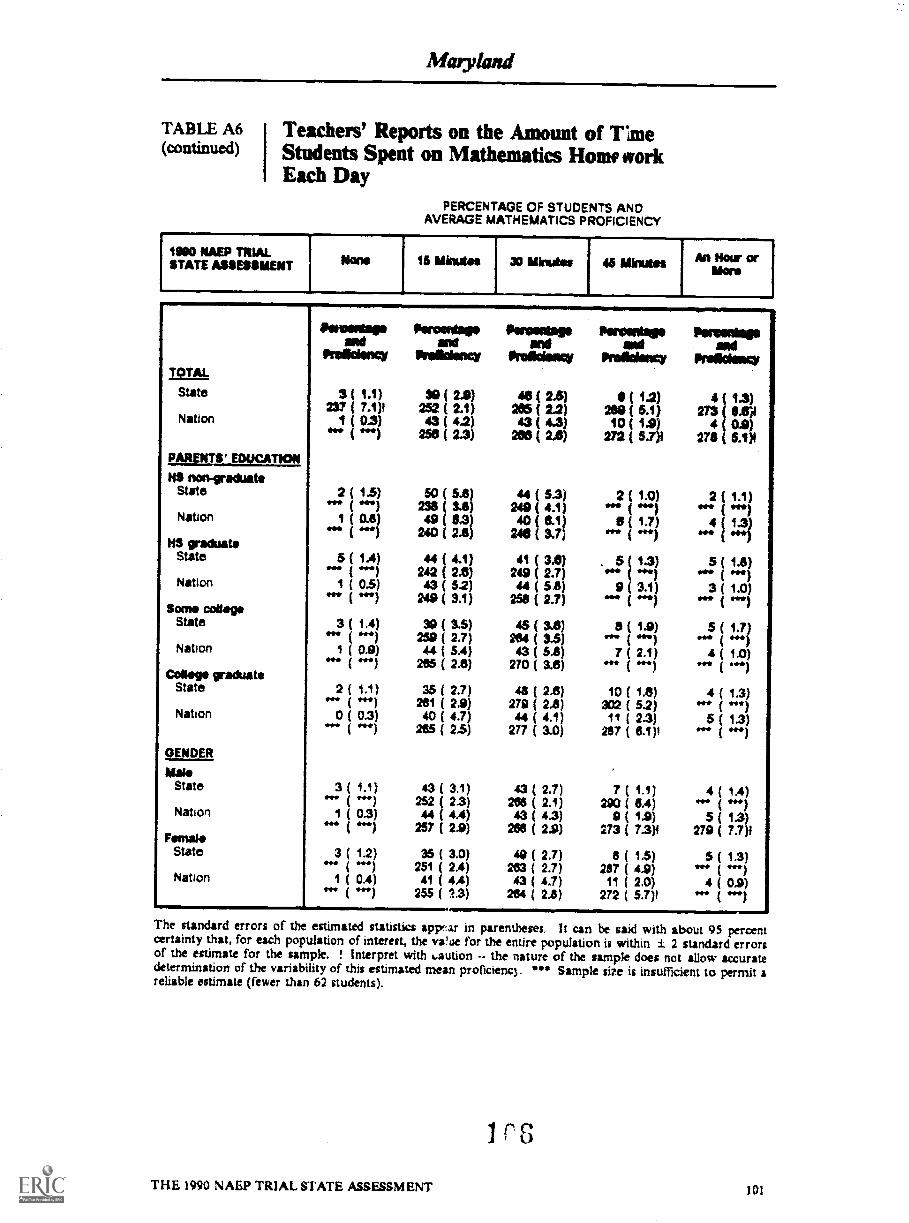
TABLE A6(continued)
Teachers' Reports on the Amount of TimeStudents Spent on Mathematics How workEach Day
PERCENTAGE OF STUDENTS ANDAVERAGE MATHEMATICS PROFICIENCY
1990 NAEP TRIALSTATE ASSESSMENT
I None 15 Minutes 30 Mimeos 45 Minutes An How orMore
TOTAL
itavoodanaand
firalidanny
3 ( 1.1)227 ( 7.1)4
1 ( 0.3)
illowoodagsand
Pftliolancy
30 ( 2.3)252 ( 2.1)43 ( 4.2)
256 ( 2.3)
Ilevantegaand
*Odom
46(2.5)265 ( 2-2)43 ( 4.3)
200 ( 2.5)
State
Nation
EDUCATION../MTS'RS non-graduate
State 2 ( 1.5) 50 ( 5.8) 44 ( 5.3)grerilt imrs) 231 3.8) 4.1)
Nation ( 0.8) 49240
8.3)( 2.8)
40245
8.1)3.7)
NS graduateState 5 ( 1.4) 44 ( 4.1) 41 ( 3.41)
( *En 242 ( 2.6) 249 ( 2.7)Nation (. 0.5) 43 ( 5.2)
249 ( 3.1)44 (
258 (58)2.7)
Some collegeState 3 ( 1.4) 39 ( 3.5) 45 ( 3.6)
( ***) 259 ( 2.7) 264 ( 34)Nation ( 0.9) 44 ( 5.4) 43 ( 5.6)
coøgi cirlduats
4060 hHI. ) 265 ( 2.6) 270 ( 3.6)
State 2 ( 1.1) 35 ( 2.7) 48 ( 2.6)( 211 ( 2.9) 270 ( 2.8)
Nation 0 ( 0.3) 40 ( 4.7) 44 ( 4.1)( "41 265 ( 25) 277 ( 3.0)
GENDER
M.State 3 ( 1.1) 43 ( 3.1) 43 ( 2.7)
( ***) 252 ( 23) 268 ( 2.1)Nation ( 0.3) 44 ( 4.4) 43 ( 4.3)
( "41 257 ( 2.9) 268 ( 2.9)Female
State 3 ( 1.2) 35 3.0) 49 ( 2.7)( 251 ( 2.4) 263 ( 2.7)
Nation 1 ( 0.4) 41 ( 4,4) 43 ( 4.7)255 ( 23) 264 ( 2.8)
Peroordaip Paranalagaand and
Prodolancy PralidaacY
2 ( 1.0)( *en1 .7)***)
5 ( 1.3)11+1Ir )
9 ( 3.1)MI* ( 441
3 ( 1.9)( *toil
( 2.1)
10 (302 (
(287 (
7 (290 (
9 (273 (
8 (267 (t1 (
272 (
4 1.3)273 .10
4 0.9)271 5.1)1
2 ( 1.1)(
4 (1.3)
5 ( 1.8)ORM (
3 ( 1.0)( vow)
5 ( 1.7)
4 ( 1.0)
1.3)***)
1.3)
*ft (
16)52)
4 (4.0,"
2.3) 5 (6.1)1
1.1) 4 (8.4) *44.
1.9) 5 (7.3)1 279 (
1.5) 5 (4.9) ipe (2.0) 4 (5.7)1 (
111EMIIMM=0MIMI11110The standard errors of the estimated statistics appr:ar in parentheses. It can be said with about 95 percentcertainty that, for etch population of interest, the vii'Lie for the entire population is within t 2 standard errorsof the estimate for the sample. ! Interpret with Laution the nature of the sample does not allow accuratedetermination of the variability of this estimated mean proficienq. *** Sample size is insufficient to permit areliable estimate (fewer than 62 students).
1r6THE 1990 NAEP TRIAL STATE ASSESSMENT 101
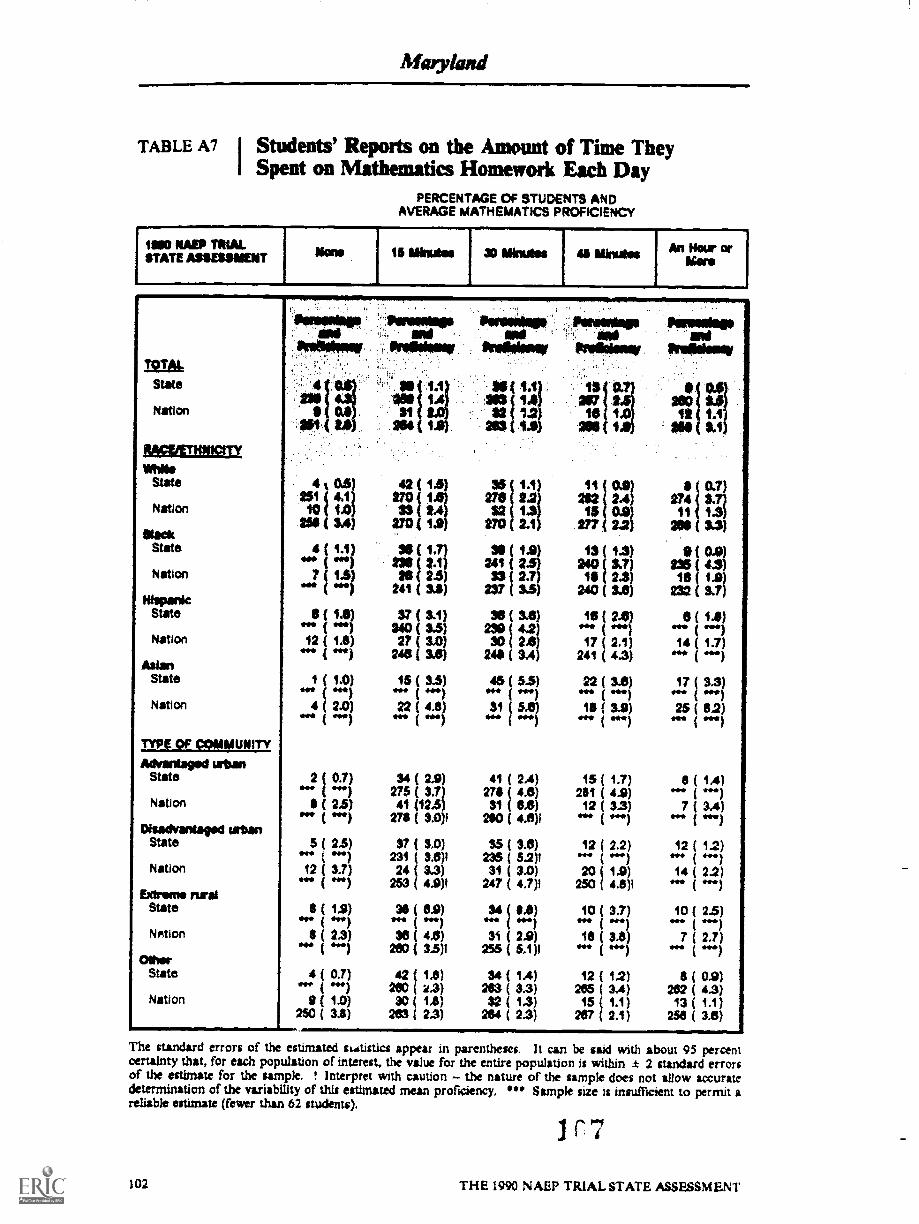
TABLE A7 I Students' Reports ou the Amount of Time TheySpent on Mathematics Homework Each Day
PERCENTAGE OF STUDENTS ANDAVERAGE MATHEMATICS PROFICIENCY
1160 NW TRIALSTATE ASSESSINENT Nano 15 UMW* XI Minutes U thuds* An Hour ar
Sono
TOTAL
State
Nation
MgraMMIM
State
Nation
StackState
Nation
HispanicState
Nation
AsianState
Nation
mg OF COMMUNITvAdvsataged urban
State
Nation
DisadvantagedState
Nation
Extreme ruralState
Nxtion
OtherState
Nation
0.11
4 it251 ( 4.1
( 14251 ( 3A)
4 1.11
7 1.51
( 1.8)
12 ( 1.8)vs* I .441
1 1.0).fro.
4 2.0)oh* ( ran
2 ( 01)
$ ( 2.5)
5 ( 25)
12 ( 3.7)to* ( ein
$ ( 1.9).90.)
( 2.3)( .")
4 ( 0.7)4 441( 1.0)
250 ( 3.11)
1.1 :3: 1.21
16i 0..4
12 1611.0263 1.6 e ( I
42 (270 ( 133( 24
370 (1.8)
31(4J)ne (2.1)NI 2.5)
241 3.0)
97 ( 3.1)240 ( 3.5)27 ( 3.0)
245 ( 25)
15 ( 33)404 ( 44122 ( 4.8)
*4* ( 444)
35270 2.222 1
270 2.1
241 2ID 23
237 2330 ( 26)
290 ( 42)30 ( 2.6)
248 ( 3.4)
45 ( 5.5)*** 444)
31 ( 5.0)444 441
11 (222
15277
13 (240 (1$ (
240 (
17241 (
22 (*44 (
18 (444
20012; sal
0.92.40.9122
1.3)
(274 (
112/1 (
(21) t3523) 163.0) 232
2.01 6 (IMO (
2.1) 14 (4.3)
26)444)
17
3.9)441
25*4.4
34 ( 2.9) 41 ( 2.4) 15 ( 1.7)275 ( 3.7) 278 ( 4.6) 201 ( 4.9)41 (124) 31 ( OA) 12 ( 3$)
278 ( 3.0)1 200 ( 45)1 "" ( )
37 ( 3.0) 35 ( 3.0) 12 ( 2.2)231 ( 3.6)1 235 ( 5.2)1 ( ".)24 ( $.3) 31 ( 3.0) 20 ( 1.9)
253 ( 4.9)1 247 ( 4.7)1 250 ( 4.8)1
3$ ( OA) 34 ( IA) 10 ( 3.7).44 ( .....) ) e.b ( )36 ( 4.6) 3i ( 2.9) 16 ( 3.8)
200 ( 3.5)1 255 ( 5.1)1 I** ( "e)
42 ( 1.8) 34 ( 1.4) 12 ( 12)200 ( 2.3) 213 ( 3.3) 205 ( 3.4)30 ( 14) $2 ( 1.3) 15( 1.1)
263 ( 2.3) 264 ( 2.3) 267 ( 2.1)
1.13.1
( 1.4)
7 3.4)
12 1.2)44* 44114 2.2)
*a*
10 ( 25)
( 2.7)«F. (
6 ( 0.9)202 ( 42)13 ( 1.1)
258 ( 3.5).m
The standard errors of the estimated si4istics appear in parentheses. It can be said with about 95 percentcertainty that, for each population of interest, the value for the entire population is within * 2 standard errorsof the estimate for the sample. 1 Interpret with caution - the nature of the sample does not allow accuratedetermination of the variability of this estimated mean proficiency, *** Sample size is insufficient to permit areliable estimate (fewer than 62 students).
1r7102 THE 1990 NAEP TRIAL STATE ASSESSMENT
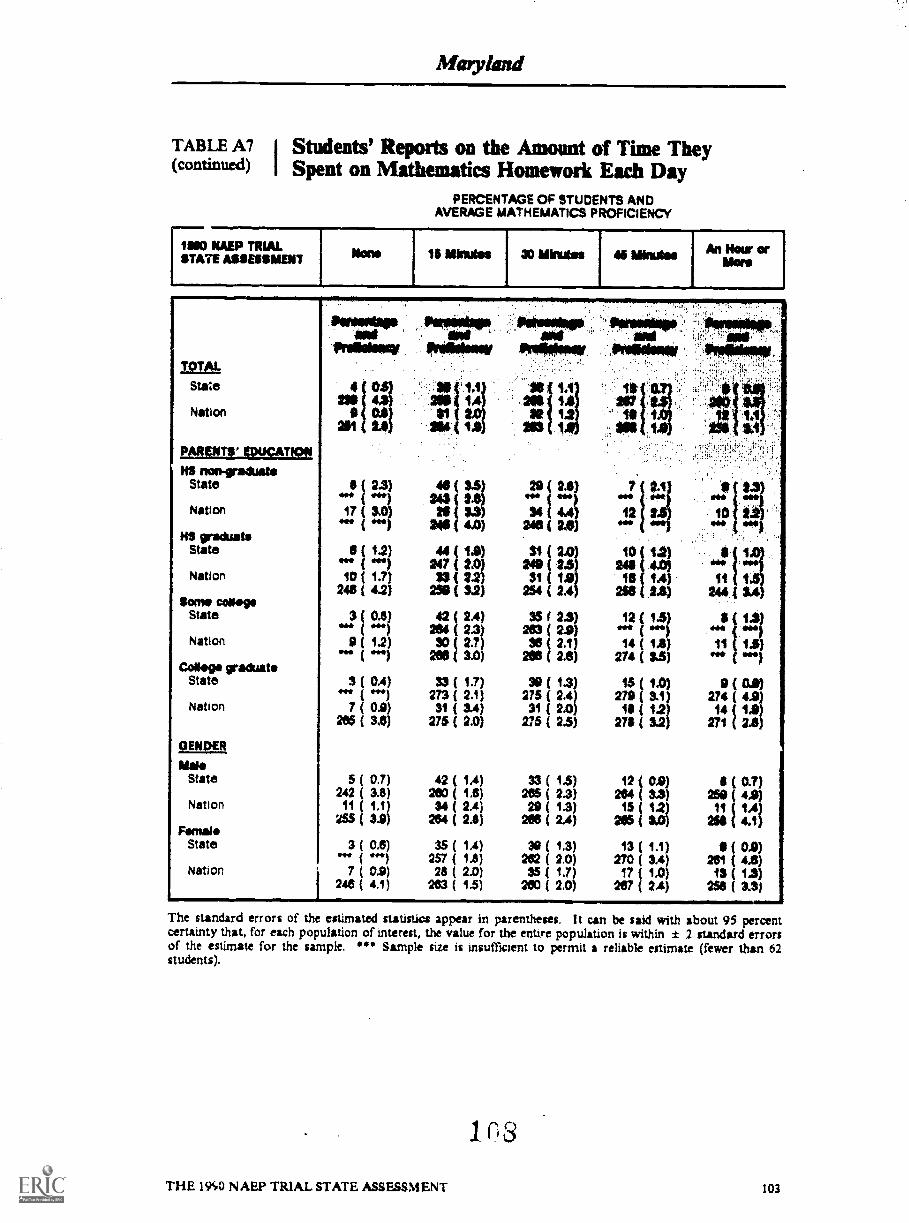
Matyland
TABLE A7 I Students' Reports on the Amount of Time They(c(Intinued) I Spent on Mathematics Homework Each Day
PERCENTAGE OF STUDENTS ANDAVERAGE MATHEMATICS PROFICIENCY
11=1.
11110 NAEP TRIALSTATE ASSESSMENT Nene 16 Minutes 30 Minutes 46 Minutes Art Hour or
taro
TOTAL
State
Nation
PARrinvjEstsigatNS nen-gratkiata
State
Nation
HI graduateState
Nation
Sanwa cottageState
Nation
CeSege graduateState
Nation
GENDER
M.State
Nation
FemaleState
Nation
$4661112910 0340.111110,iiid lidWiUIuii liV01011MSV
0
2.3)
17 (gm.)
0 I 1.21
10 ( 1.7)246 ( 4.2)
ea* 413 011)
9 ( 1.2)
3 ( 0.4)4144. 4141
7 ( 0.9)265 ( 3.6)
5 ( 02)242 ( 3,8)11 ( 1.1)
3 ( 0.6)
( 0.9)246 ( 4.1)
24.1 2354/4240 ( 4.0)
44 ( 1.9)247 ( 2.0)3$ 2.2)
259 ( 32)
42 ( 24)264 ( 2.3)30 ( 2.7)
200 ( 3.0)
33 ( 1.7)273 ( 2.1)31 ( 34)
275 ( 2.0)
42 ( 14)26) ( 16)
34 ( 2.4)264 ( 2.4)
35 ( 1.4)257 ( 1.8)28 ( 2.0)
263 ( 1.5)
29 ( 2.6)
$4 44( 2.6)
31 ( 2.0)20 ( 2.5)31 ( 1.9)
254 ( 2.4)
35 f 2.5)213 ( 2.9)33 ( 2.1)
220 ( 2.6)
39 ( 1.3)275 ( 2.4)31 ( 2.0)
275 ( 2.5)
33 ( 1,5)205 ( 23)29 ( 1.3)
266 ( 2.4)
39 ( 1.3)262 ( 2.0)35 ( 1.7)
260 ( 2.0)
.1 I :141)12 2.2)
***)
15 1.4)24 4.)10 1.0
220 2.9)
12 ( 13)Ho)
14 ( 1,8)274 ( 15)
15 ( 1.0)279 ( 3.1)
10 ( 12)271 3.2)
12 ( 0.9)264 ( 3$)
1$ ( 1.2)205 ( 3.0)
13 ( 1.1)270 ( 3.4)17 ( 1.0)
267 ( 2.4)
( 0.7)259 ( 4.9)11 ( 14)
2211 ( 4.1)
261 (4.8)13 1.3)
$ 0.9)
258 ( 3.3)
The standard errors of the estimated statistics appear in parentheses. It can be said with about 95 percentcertainty that, for each population of interest, the value for the entire population is within ± 2 standard errorsof the estimate for the sample. *" Sample size is insufficient to permit a reliable estimate (fewer than 62students).
113
THE 1940 NAEP TRIAL STATE ASSESSMENT 103

TABLE AS I Teachers' Reports on the Emphasis Given Toi Specific Mathematics Content Areas
PERCENTAGE OF STUDENTS ANDAVERAGE MATHEMATICS PROFICIENCY
and11188 NAEP TRIAL
Operations ifeastreassnt Geometry
STATE ASSESSMENT HeavyEmphasis
Utile or NoEmphasis
HeavyEmphasis
Little or NoEmphasis
HeavyEmphasis
Little or NoEmphasis
TOTAL
State
Nation
ANEMIC-la
State
Nation
Sad(State
Nation
HbpanieState
Nation
AslanState
Natio('
TYPE OF COMMUNITY
Advantaged urbanState
Nation
DisadvantagedState
Nation
Extreme ruralState
Nation
OttwState
Nation
Possidepo Favinitne Pare400.4 Pircomik. 046111$0.00end one an0
Proisiony riveciersay Pra 041401v restakaxw Miaow
294:1
230 ( 15 267 3.449 3.3 15 2.1
2.3
32 ( 25)261 ( 1.5)48 ( 3.7)
287 ( 22)
43 ( 4.11)233 ( 2.11)54 ( 7.9)
243 ( 43)
42 ( 4.9)230 ( 3.1)47 ( el)
246 ( 4.6)
17 ( 4.0)
32 ( 93)Is. ( 441
21 ( 2.8)258 ( 3.1)
28 (13.0).4* ( ***)
51 ( 9.8)228 ( 3.0)348 (12.1)
255 ( 3.3)4
41 0.7)444,
53 (12.4)257 ( 7.1y
97 ( 4.0)252 ( 3.1)52 ( 4.1)
260 ( 2.3)
Off 3.017 3.0
250 (
19 ( 2.5)257 ( 33)14 ( SA)
259 ( 6.9)1
27214 4.625 7.4
223 ( asp
27 $4)*11 141
23 ( 4.1)(
V2711
2721
40 (
2111103
27/ ;
31 (248 (23 (
233
23 (41* (
34 (235 (
3.14.0
2.2)
416.7i
4.3;
4.2)4.7)5.7)4.1)1
4.3)
53)44)4
254 2.126 3.8
203 3.2)
24 ( SA)
244 4421216 13
19 ( 3.2)232 ( 4.2)33 ( 7.9)
242 ( 5.6$
21 4.1).$4 orte)
27 ( 6.3).11(m)
45 (vfro.
27 (
42 (301 (
16 ((
15
9 (**
18 (VIka
6 (* (20
290 (16 (
266 (
0.7)
5.2)
4.2)4.6)i4.2)*41
34)*MI )
4.0)«Hi)
4.1)1+1
3.8)*41
2.4)3-3)2.7)3.6)
10***
23***
12246
9K.
40
2311238
41
44.6
20251
16253
( 3.4)*in( 5.8)( *a)
( 2.7)( 5.3p( 7.0)
.44)
(11.3)
11a4( imp
(11.5)*NI
40)
( 3.4)( e.cv( 3.9)( 7.1$
SS
44IN*
5328940
.0*
22 (245 (21 (
(
23 (*14(0*132 (11.7)
2455 (
34 (2110 (34 (
270 (
( 6.4)
( 3.9)(
4.9)3.7)8.5)
( *fr.)
8.2)8.3)46.5)444)
ftly
44)4.4)5.3)4.6)
12
34
17403
38267
22224
33244
39
9***
20200
26283
( 3.6)
( 9.2)( 441
( 4.1)( 5.4$( 9.4)( toy
( 7.3)( 5.1$(11.6)( 3.2p
(10.5)*44)
( 0.1)
( 4.3)( 4.3)4( 4.6)( 31)
1111~06114
Praktimay
IP 2.71
284 &4)21 3.3
310 ( 2.2
26 ( 2.6)2411 2.8)
273 (5.8)22 34)
34 ( 3.3)235 ( 3.1)24 ( 7.3)
239 ( 4.7$
26 ( 4.8)elm, *el16 ( 5.5)
14 ( 6.5)*gm)
41 ( 5.3)260 ( 5.0y13 ( 3.2)
4,44, ***)
26 ( 5.4)234 1 6.1)1
27 (10.2)*44 (
16 ( 7.9)
( 5.7)
263( 5.1)
05
*on
27 ( 3.4)
24 ( 4.3)2
The standard errors of the estimated statistics appear in parentheses. It can be said with about 95 percen'certainty that, for each population of interest, the value for the entire population is within ± 2 standard errorsof the estimate for the sample. The percentages may not total 100 percent because the "Moderate emphasis"category is not included. ! Interpret with caution - the nature of the sample does not allow accuratedetermination of the variability of this estimated mean proficiency. *** Sample size is insufficient to permit areliable estimate (fewer than 62 students).
104
11 9
THE 1990 NAEP TRIAL STATE ASSESSMENT
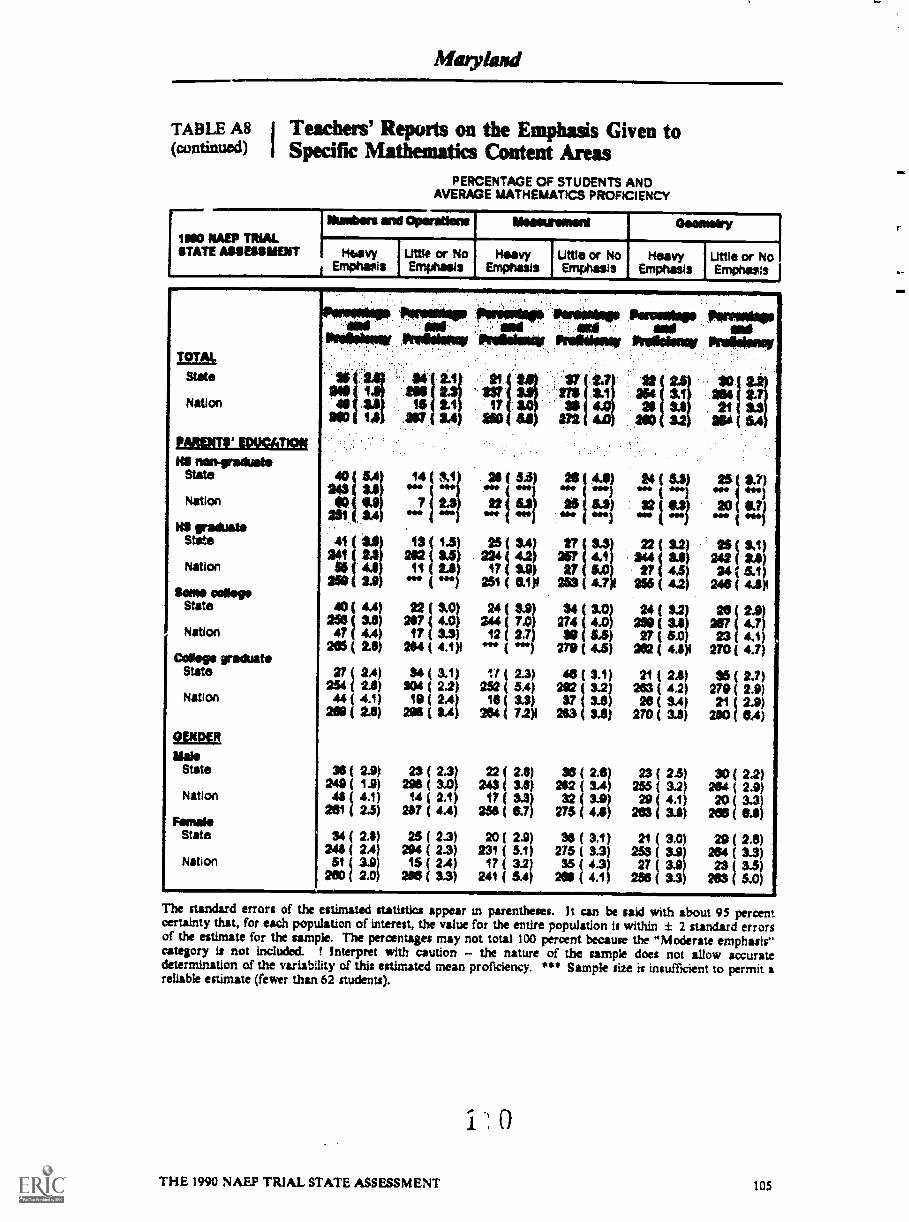
Metyland
TABLE A8 I Teachers' Reports on the Emphasis Given to(continued) I Specific Mathematics Content Areas
PERCENTAGE OF STUDENTS ANDAVERAGE MATHEMATICS PROFICIENCY
1980 NAN TRIALSTATE ASSESSMENT
Numbers and Operations Messoroment Geometry
HoosivyEmphasis
I Uttie or NoEmphasis
Heavy IEmphasis
Me or NoEmphasis
HeavyEmphasis
Little or NoEmphasis
State
Nation
maitnimfinimIM nen-graduate
State
Nation
1M graduateState
Nation
Same *MegaState
Nation
college graduateState
Nation
2CLERlisle
State
Nation
FemaleState
Nation
l*/**101r Prneetim .reZsuiv
4.210
40$02
PeumWelle Pir2010202ail and11Wielmoy MirelManov
04 2.1 *1 sr 2.7 12292 227 2711 2.1 wi
3.2 4.1 17 39 26 31 21 3.314 297 344 910 272 210 32 IMP 5.4
40 81/44 14 ( 3.1 24 ( 33) 29 4.2) 24 ( 5.3) 2.7)
22 ". , ,... , 4., ...., ( ...) ... ...)
7 1 2.11 .11 .634 2 v./ .r. 1 v./ 2, tii231 SA
41 25 27 1 23) )241 LI 25( 3.1)241 2.3 202 $.5 2241 4,2 242 ( 3.2)
IRS 4.1 11 2.$ 17 $S 3211 ti 2? i 4.5) 34 ( 5.1)250 2.9 "'a ( ***) 251 ( 2.1 25S 4.7 225 ( 4.2) 246 ( 4314
40 ( 22 ( 3.0) 24 34 ( 3.0) 24 ( 2.233 247 ( 4.0) 2441 1,0
1? ( SS)274 ( 4.0) 252 ( U
II
2/771 II47 4.4 12 2.7 119 ( 54) 27 1 5.0 23 4.1)
205 23) 294 ( 4.9 ". ( "e) 279 ( 4.5) 222 ( 4.8 270 4.7)
27 ( 24) 34 ( 3.1) It ( 2.3) 46 ( 3.1) 21 ( 2.0) 16 ( 2.7)254 ( 23) 204 ( 22) 252 ( 54) 292 ( 3.2) 263 ( 4.2) 279 ( 23)44 ( 4.1) 19 ( 2.4) 18 ( 33) 37 ( IA) 28 ( 3.4) 21 ( 2.9)
289 ( 25) 296 ( 3.4) 164 ( 7.2)1 283 ( 3.8) 270 ( 35) 290 ( OA)
38 ( 2.9) 23 ( 2.3) 22 ( 2.8) 36 ( 2.6) 23 ( 24) 30 ( 2.2)249 ( 1.9) 293 ( 3.0) 243 ( 282 3.4) 3.2) 284 (A ( 4.1) 14 ( 2.1) 17 ( 3.3 32 3.9) 29 4.1) 20 ( 3.3
261 ( 2.5) 257 ( 4.4) 258 ( 0.7 275 4.8) 263 3.1) 266 ( 66
34 ( 2.5) 25 ( 2.3) 20 ( 23) 38 ( 3.1) 21 ( 3.0) 29 ( 2.6)2045 1 4.4) 294 ( 2.3) 231 ( 5.1) 275 ( 3.3) 253 264 ( 3.3)51 ( 3.9) 15 ( 2.4) 17 ( 3.2) 35 ( 4.3) 27 3.9 23 ( 3.5)
MO ( 2.0) 286 ( 3.3) 241 ( 6,4) 20 ( 4.1) 256 3.3 203 ( 5.0)
The standard errors of the estimated statistics appear in parentheses. It can be said with about 95 percentcertainty that, for each population of interest, the value for the entire population is within ± 2 standard errorsof the estimate for the sample. The percentages may not total 100 percent because the "Moderate emphasis"category is not included. ! Interpret with caution - the nature of the sample does not allow accuratedetermination of the variability of this estimated mean proficiency. *** Sample size is insufficient to permit areliable estimate (fewer than 62 students).
1 0
THE 1990 NAEP TRIAL STATE ASSESSMENT 105

Maryland
TABLE AS I Teachers' Reports on the Emphasis Given To(030tinued) I Specific Mathematics Content Areas
PERCENTAGE Of STUDENTS ANDAVERAGE MATHEMATICS PROFICIENCY
180 NAEP TRIALSTATE ASSESSMENT
Dmta Malys* SUMO* andProbability Algebra and Rinctione
Heavy E ,priasis Lift le or NoEmphasis vy Emphasis URI* or No
Emphasis
TOTA11
State
Nation
fialaMILKL.1 TY
SNOState
Nation
SlackState
Nation
HispanicState
Nation
AldanState
Nation
TYPE OF COMMUNITY
Advantaged urbanState
Nation
Disadvantaged urbanState
Nation
Extrema ruralState
Nation
OtherState
Nation
f72 ( 3.613 (
14 ( 2.4270 ( 4.1)
233 ( 7.015 (
444)14 3.4
14 3.5)
15 ( 4.1).01
14 ( 3.3)
34 ( OLT)( *di
( 2.0)(
11 i 0.5)
17 ( 8.5)*4.,)
19 ( 0.4)1111. 4I-111
5 ( 3.5)*" "1
5 ( 5.4)
10 ( 3.4)205 ( 40)115 ( 22)
267 ( 4.7)
vs 43)59 2.9)
53 5.0)2/1 ( $A)
$3 NI
225 44)53 $.2)
50 ( 4.8)
248 ( 4.4
240 ( 4.4
5115 ( 03
50 ( 5.6).as(.as)
25750
264
5423594 (114)
230 ( 82)t
75 (15.7)253 ( 6.7)105 (16.0)
254 (
54 ( 3.5)264 ( 3.2)53 ( 52)
200 ( 34)
21140 42
(
21$ SA44
311 7.1
48 ( SS)257 ( 40)1
301 ( 3.174 (
81
32) 843.9) 290
10.4) 41( 74)1 290
( 0.4) 45( 5.0)1 250
(
( 4.1)(
( 7.0(
( SA)( 6.3)4
53(112)254 ( 03)1
361{ n4.0)*i
93 0.1)& MI ( **41)
52 ( 4.0)265 ( 3.0)
47 4.3)275 ( 2.5)
$44.4s
21!..1i23.1
21111 eel
221 2.2),27 Oa
21: 1
xi 1( 3.1)
dkel
( Oa*(
15 ( 2.250
*** .01VI 5,3
21 ( 0.2)21$ ( 4.4)120 ( 9.4)
241 5,0)442 111.0i
44
227 3.3)23 3.5)
17 3.3)245 ( 4.4)1
The standard errors of the estimated statistics appear in parentheses. It can be said with about 95 percentcertainty that, for each population of interest, the value for the entire population is within ± 2 standard errorsof the estimate for the sample. The percentages may not total 100 percent because the "Moderate emphasis"category is not included. I Interpret with caution - the nature of the sample does not allow accuratedetermination of the variability of this estimated mean proficiency. *** Sample size is insufficient to permit areliable estimate (fewer than 62 students).
106
i.1THE 1990 NAEP TRIAL STATE ASSESSMENT
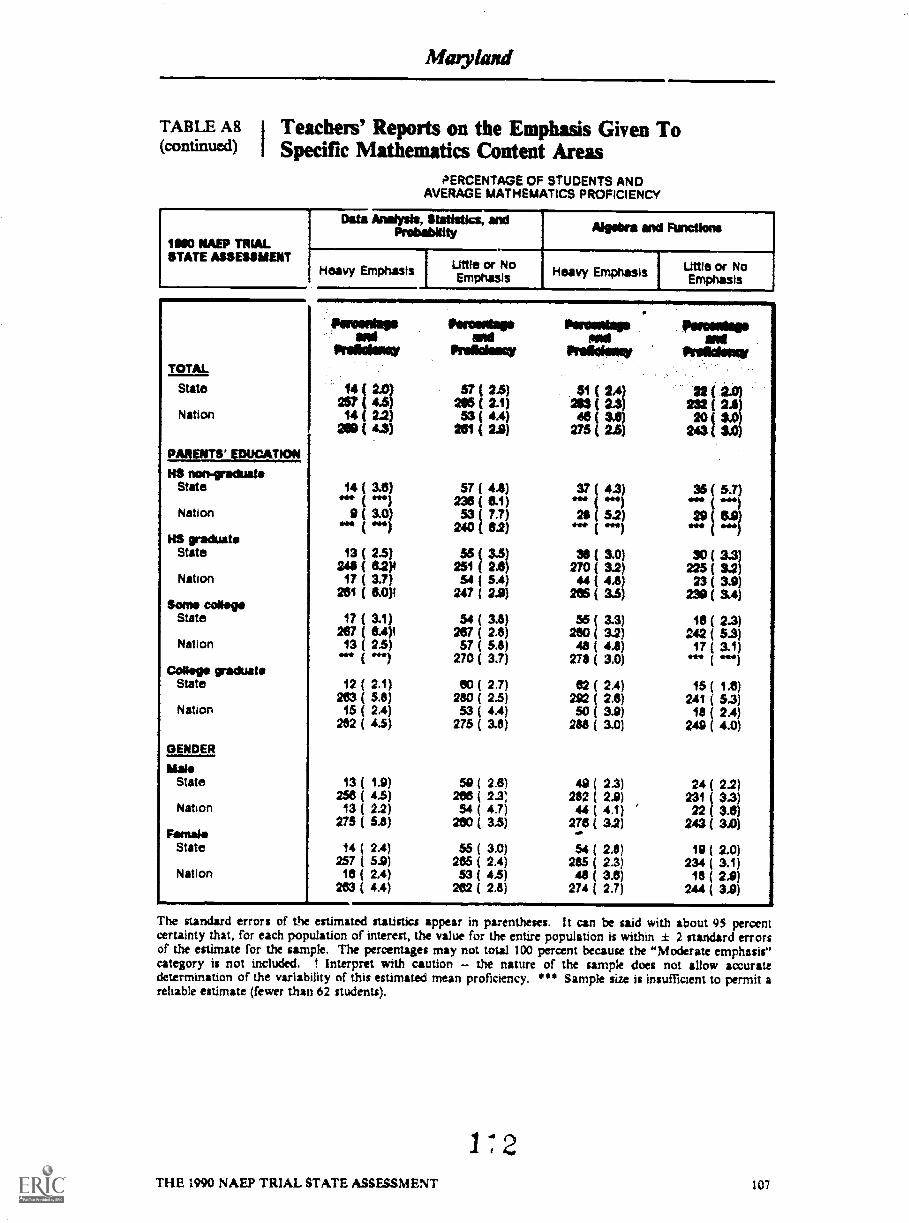
Malyland
TABLE A8 I Teachers' Reports on the Emphasis Given To(wntinued) I Specific Mathematics Content Areas
PERCENTAGE OF STUDENTS ANDAVERAGE MATHEMATICS PROFICIENCY
18410 NAEP TRIALSTATE ASSESSMENT
Theta Me lysio, Statiatke, andProbability Algebra and Arnotiona
Heavy Emphasis Little or NoEmphasis Heavy Emphasis Little or No
Emphasis
TOTAL
State
Nation
PARENTS' EDUCATION
HS non-graduateState 14 ( 3.8) 57 ( 4.8) 37 ( 4.3)
Nation 9 ( 3.0)236 ( 6.1)53 ( 7.7)
i 44129 ( 5.2)
240 ( 8.2) 441. ( dillHS graduate
Nation 17 ( 3.7) S4 ( SA) 44 ( 4.8)281 ( (LOY 247 ( 2.11) 205 ( 15)
Soma collage
Nation 13 ( 2.5) 57 ( 5.8) 411 ( 4.8)
11 Wends.
Prolido02
14 ( 2.0)257 ( 4.6)14 ( 22)
2118 ( 4.3)
.011016111010 Pirgeleatamut
Prelidtray Prefolsoy Prilkilsocy
37 ( 2.5)205 ( 2.1)53 ( 4.4)
281 ( 2.8)
51 ( 2.4)233 ( 2.3)
22 241
2441 2120 ( 2.0i
243 ( $.0)
COMM! glildUatsState 12 ( 2.1) 60 ( 2.7) $2 ( 2.4)
263 ( 51) 2W ( 2.5) 292 ( 2.8)Nation 15 ( 2.4) 53 ( 4.4) 50 ( 3.9)
282 ( 4.5) 275 ( 3.8) 238 ( 3.0)
GENDER
MaleState 13 ( 1.9) 50 ( 2.6) 49 ( 2.3) 24 ( 2.2)
258 ( 4.5) 268 ( 2.3 282 ( 2.0) 231 ( 3.3)Nation 13 ( 2.2) 54 ( 4.7) 44 ( 4.1) 22 ( 31)
275 ( 51) 260 ( 3.5) 276 ( 3.2) 243 ( 3.0)Female ....
State 14 ( 2.4) 55 ( 3.0) 54 ( 2.8) 19 ( 2.0)257 ( 5.9) 265 ( 2.4) 285 ( 2.3) 234 ( 3.1)
Nation 18 ( 2.4) 53 ( 4.5) 48 ( 3.8) 18 ( 2.9)263 ( 4.4) 262 ( 21) 274 ( 2.7) 244 ( 3.9)
36 ( 5.7)4001,
29(BJ
30 ( 3.3)225 ( 3.2)23 ( 3.9)
239 ( 3.4)
18 ( 2.3)242 ( 5.3)
17 ( 3.1)«Hi
16 ( 1.6)241 ( 5.3)
18 ( 2.4)249 ( 4.0)
The standard errors of the estimated statistics appear in parentheses. It can be said with about 95 percentcertainty that, for each population of interest, the value for the entire population is within ± 2 standard errorsof the estimate for the sample. The percentages may not total 100 percent because the "Moderate emphasis"category is not included. ! Interpret with caution - the nature of the sample does not allow accuratedetermination of the variability of this estimated mean proficiency. *** Sample size is insufficient to permit areliable estimate (fewer than 62 students).
THE 1990 NAEP TRIAL STATE ASSESSMENT 107
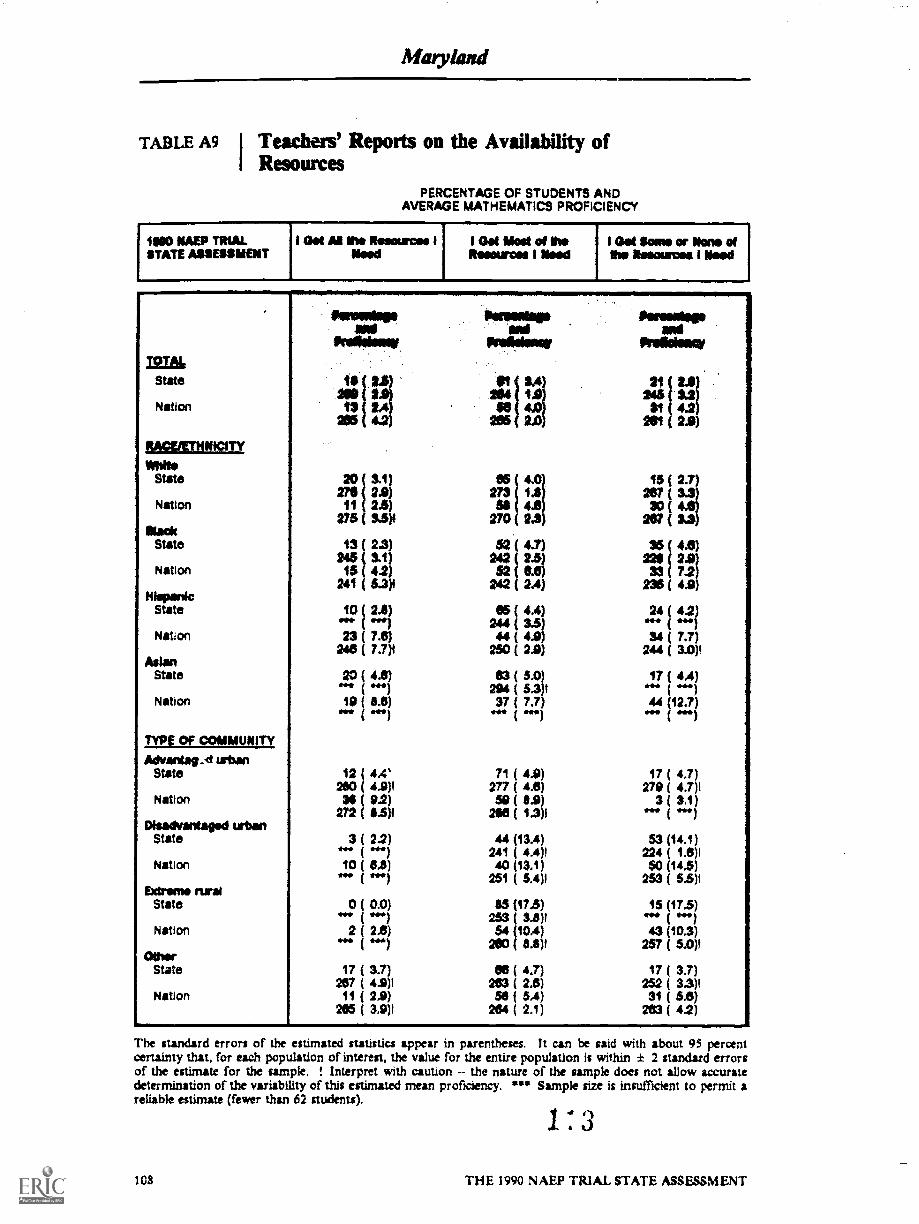
Maryland
TABLE A9 I Teachers' Reports on the Availability ofResources
PERCENTAGE OF STUDENTS ANDAVERAGE MATHEMATICS PROFICIENCY
1100 MEP TRIAL I OM NI Me NOSOUreel I 1 0111 Most of Ito I Oat Same or Nene ofSTATE ASSESSMENT Need Resources I Need the Itesources I Need
fl121eicState
Nation
WhiteState
Nation
MackState
Nation
Newer*State
Naton
AldanState
Nation
TYPE OF COMMUNITY
AdvantagA titanState
Nation
Ofeadvataged 'sewState
Nation
Extreme nraIState
Nation
OtherState
Nation
3.1)278 2.9)
11 2.5)275 35)4
13 ( 2.3)245 (3.1)
18 4.2)241 (5.3)4
10OM Me
23 ( 7.15)240 ( 7.1)1
( *Al1 0 5.0)
12 4.41200 ( 4A)I31 ( 0.2)
272 ( 8.5)4
3 ( 2.2)
10 ( 0.0)*SO ( el
440 (
2 ( 2.6)*el
17 ( 3.7)281 ( 4.9)111 ( 2.3)
265 ( 3.9)1
Peopembpam8
licalidowe
88 (273 ( 1.$SO ( 4.8
270 ( 2.3)
82 ( 4.7)942 ( 2.8)52 ( 8.8)
242 ( 2.4)
85 ( 4.4)244 ( 3.5)44 ( 4.9)
250 ( 2.9)
03 ( 5.0)294 ( 5.3)I37 ( 7.7)
( )
71 ( 4.0)277 ( 4.0)50 ( 3.9)
203 ( 1.3)1
44 (13.4)241 ( 4.4)140 (13.1)
251 ( 5.4)1
85 (17.5)253 3.8)154 114)
280 8.8)1
ea ( 4.7)253 ( 29)53 ( 5.4)
284 ( 2.1)
933331040
9193ismy
224 32
$i 4.2201 (2.9)
15 ( 2.7)287 (30 (
28? (
35 ( 4.8)
33 ( 7.2)258 ( 4.9)
2.4 1121
34 7.7)244 ( 3.0)1
17 ( 4.4)114* G111
44 (12.7)
17 ( 4.7)213 ( 4.7)1
53 (14.1)224 ( 1.6)150 (143)
253 ( 5.5)1
15 (174)
43 (10.3)257 ( 5.0)1
17 ( 3.7)25.2 ( 33)t31 1 5.8)
283 ( 4.2)S.
The standard errors of the estimated statistics appear in parentheses. It can be said with about 95 percentcertainty that, for each population of interest, the value for the entire population is within ± 2 standard errorsof the estimate for the sample. 1 Interpret with caution -- the nature of the sample does not allow accuratedetermination of the variability of this estimated mean proft6ency. *** Sample size it insufficient to permit areliable estimate (fewer than 62 students).
1 3
108 THE 1990 NAEP TRIAL STATE ASSESSMENT
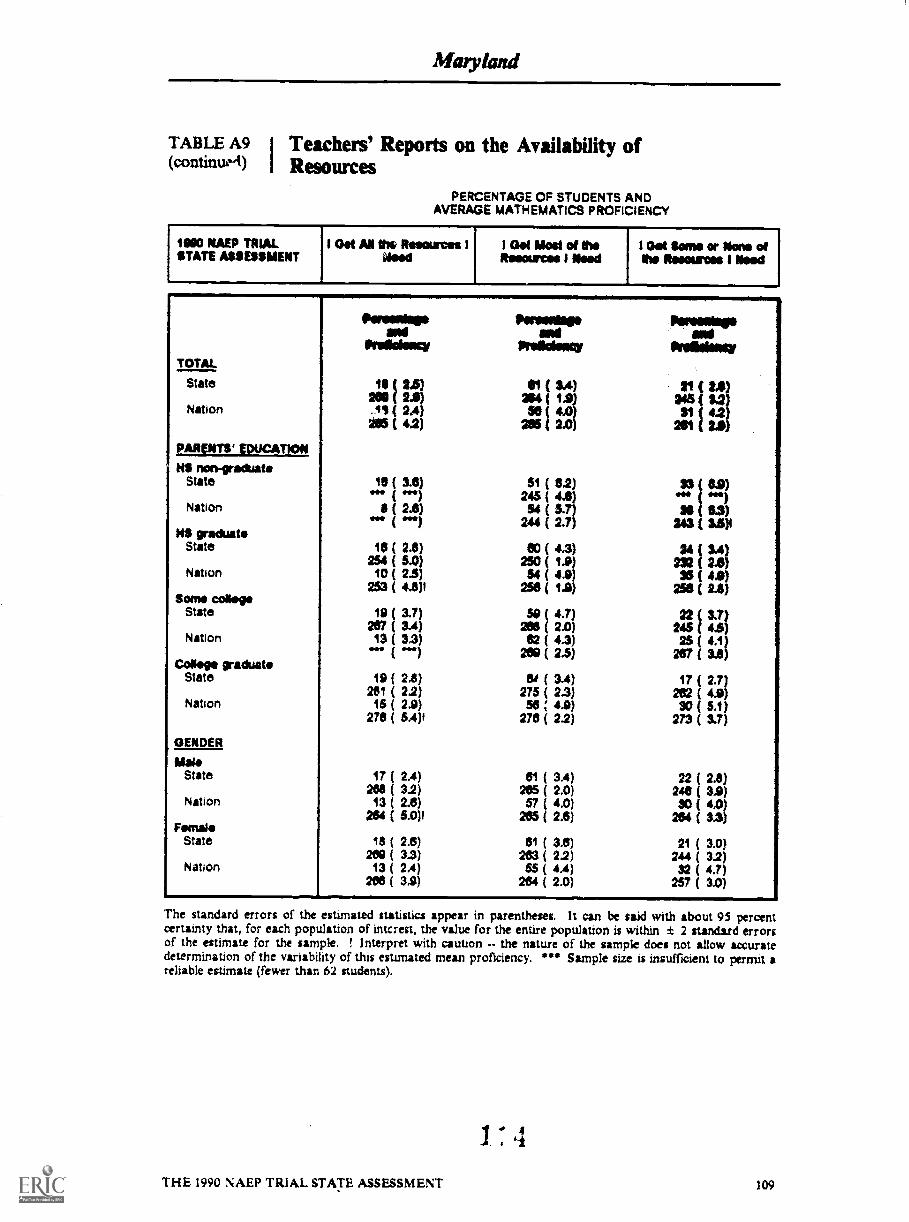
Maryland
TABLE A9 I Teachers' Reports on the Availability of(vantinwd) I Resources
PERCENTAGE OF STUDENTS ANDAVERAGE MATHEMATICS PROFICIENCY
MO 'MEP TRIAL I Oet All the Reeources I I Get Most of the I Oat Sem or None ofSTATE ASSESSMENT Need Reeewces I Need the Reseurose I Need
TOTAL
aN2Prifisleacv
12 21
aMPrelloNNICY
61(3.4)State394 (
Nation . .111 24.1i295 ( 2.0
MINTS' EDUCATIONNS non-graduate
State 18 ( 3.6) 51 ( 8.2)Va. ( Nen 245 ( 4.6)Nation
ode2.6).41 54
244( 5.7)( 2.7)
NS graduateState 18 ( 2.3) 80 ( 4.3)
254 ( 5.0) 250 ( 19)Nation 10 ( 23) 54 ( 43)
253 ( 4.8)I 258 ( 13)Some college
State 19 ( 3.7) 50 4.7)267 ( 34) 268 2.0)
Nation 13 ( 3.3)0.4,)
62 (200
4.3)( 2.5)
College graduateState 19 ( 2.8) 81(2.4)
261 ( 2.2) 275 ( 2.3)Nation 15 ( 2.9) 5$ 4.9)
278 ( 5.4)1 276 ( 2.2)
GENDER
M.State 17 ( 24) 61 ( 3,4)
208 ( 3.2) 285 ( 2.0)Nation 13 ( 2.6) 57 ( 4.0)
264 ( 5.0)1 265 ( 2.6)Female
State 18 ( 2.6) 61 ( 3.6)209 ( 3.3) 263 ( 2.2)
Nation 13 ( 2.4) 55 ( 4,4)200 ( 3.9) 264 ( 2.0)
Panmodop
itea1600662
33 0.2)
$6 83)243 ( 3.5)I
24 (232 (SS ( 4.0
256 ( 2.6
22 3.7)245 4.5)25 4.1)
287 ( 3.6)
17 ( 2.7)202 ( 4.11)30 ( 5.1)
273 ( 3.7)
22 ( 2.3)240 ( 33)30 ( 4.0)
264 ( $3)
21 ( 3.0)244 ( 3.2)32 ( 4.7)
257 ( 3.0)
The standard errors of the estimated statistics appear in parentheses. It can be said with about 95 percentcertainty that, for each population of interest, the value for the entire population is within ± 2 standard errorsof the estimate for the sample. ! Interpret with caution the nature of the sample does not allow accuratedetermination of the variability of this estimated mean proficiency. *** Sample size is insufficient to permit, areliable estimate (fewer than 62 students).
THE 1990 NAEP TRIAL STATE ASSESSMENT 309
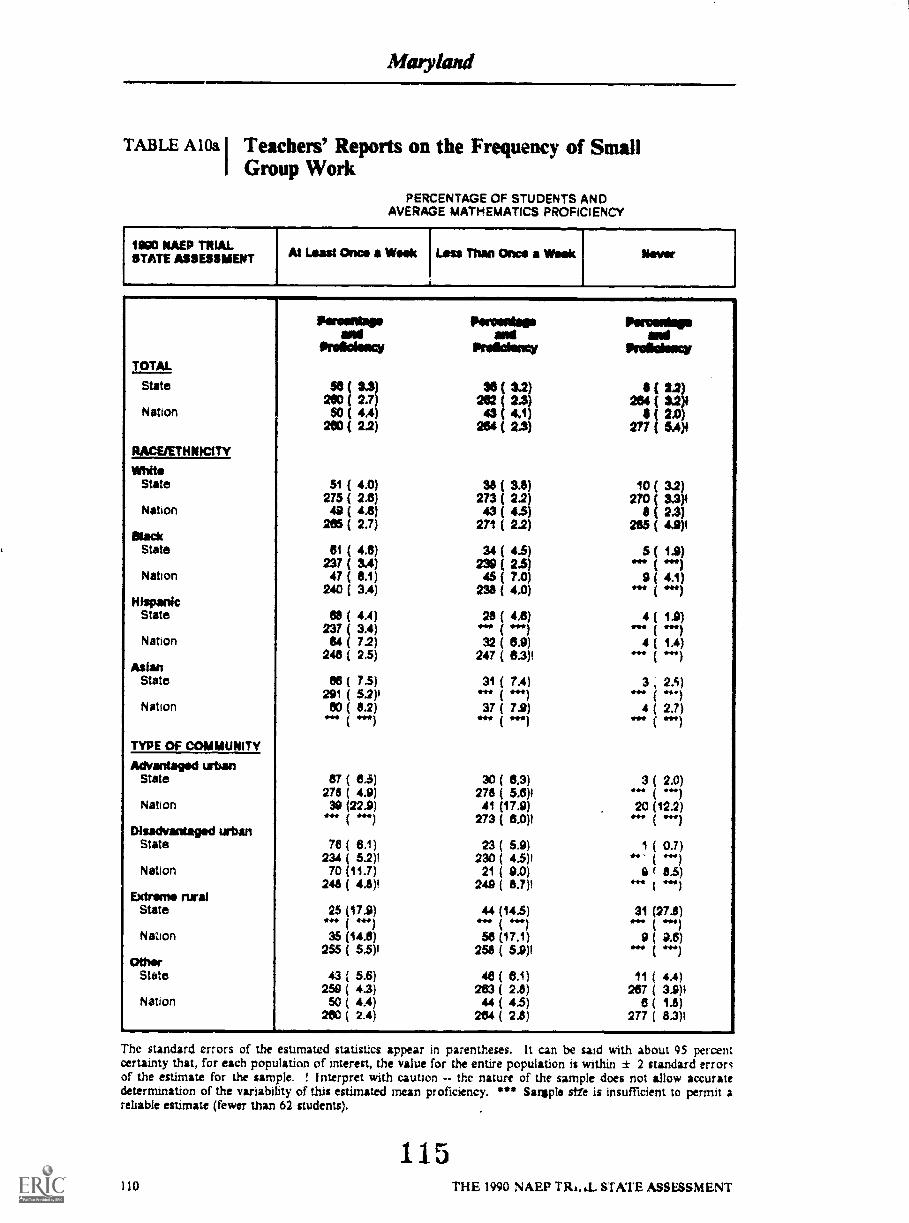
Maryland
TABLE Ala I Teachers' Reports on the Frequency of Smalli Group Work
PERCENTAGE OF STUDENTS ANDAVERAGE MATHEMATICS PROFICIENCY
_
1800 NAER TRULLSTATE ASSESSMENT Al Least Once a Week Less Than Once a Week Never
TOTAL.
Illiraweaseand
Proloisecy
Pereentaerand
Prolkieney
Penmaulogeand
11Prvildony
State 58 (290 ( 2.7
30 (262 2.3
(284 ( 3.2
Nation $0 ( 4.4 43 4.1 ( 2.0240 ( 2.2) 284 2.3 277 ( 5.4)4
EEMnp_il4 TYWhite
State 51 ( 4.0) 9$ ( 3.6) 10 ( 3.2)275 ( 2.6) 273 ( 270 ( 3.3)4
Nation 49 ( 4.6) 43 ( 4.5 ( 2.3)285 ( 2.7) 271 ( 2.2 285 ( 4.9)1
BlackState 61 ( 4.8)
237 ( 3.4)34 ( 4.5)
239 ( 2.5)5 ( 1.9)
Nation 47 ( 8.1) 4$ ( 7.0) 9 ( 4.1)240 ( 3.4) 235 ( 4.0) ( * )
HispanicState 68 ( 4.4) 28 ( 4.6)
237 ( 3.4) 04.0)(
Nation 64 ( 7.2) 32 ( 6.9) 4 ( 1.4)248 ( 2.5) 247 ( 6.3)1 ( "*)
AstonState 88 ( 7.5) 3 , 2.4)
291 ( 52)1Nation 80 ( 8.2)
***)37 ( 7.9)
04* ( 0.4114 ( 2.7)
**)
TYPE Of COMMUNITY
Advantaged urbanState 67 ( 8-5) 30 ( 8.3) 3 ( 2.0)
278 ( 4.9) 278 ( 5.6)4Nation 39 (22.9) 41 (17.9) 20 (12.2)
273 ( 6.0)4 *iv ettDisadvantaged urban
State 78 ( 6.1) 23 ( 5.9) I ( 0.7)234 ( 5.2)1 230 ( 4.5)4
Nation 70 (11.7)248 ( 4.8)!
21 ( 9.0)249 ( 3.7)1
6 ( 8.5)4-4. .44)
Extrame ruralState 25 (17,9)
*44)44 (14.5)
G.11131 (27.8)
*eV ( *41Nation 35 (14.8) 56 (17.1) 9 ( 0.6)
255 ( 5$)1 258 ( 5.9)1Other
State 43 ( 5.6) 48 ( 6.1) 11 ( 4.4)259 ( 4.3) 263 ( 2.8) 267 ( 3.9)1
Nation 50 ( 4.4) 44 ( 4.5) ( 1.8)260 ( 2.4) 264 ( 2.8) 277 ( 8.3)1
The standard errors of the estimated natistics appear in parentheses. It can be said with about 95 percentcertainty that, for each population of interest, the value for the entire population is within ± 2 standard errorsof the estimate for the sample. ! Interpret with caution -- the nature of the sample does not allow accuratedetermination of the variability of this estimated mean proficiency. * * Sample stie is insufficient to permit areliable estimate (fewer than 62 students).
115110 THE 1990 NAEP TR. .L STATE ASSESSMENT

Marykurd
TABLE Al Oa 1 Teachers' Reports on the Frequency of Small
(coniinued) I Group WorkPERCENTAGE OF STUDENTS AND
AVERAGE MATHEMATICS PROFICIENCY
MO MEP TRIALSTATE ASSESSAIENT
At Least Once a Week Lees Trian Once a Weak Never
12161State
Nation
fammiumeansaiiss nonipsdusts
State
Nation
118 graduateState
Nation
Peamallesaid
Prelkisioy
( $.3)SOO f10 ( 4.4
2.0 ( 2.2
53 (236 ( 3.700 ( 0.4
244 ( 32)
56 ( 4.1)24301
262 ( 2.8)Sonia coNege
State 53 ( 4.2)202 (
Nation 51 ( 5.2200 ( 3.1
College graduateState 58 ( 3.9)
275 ( 3.0)Nation 40 ( 52)
271 ( 2.6)
OENDIR
M.State 54 ( 34)
261 ( 2.7)Nation 50 ( 44)
261 ( 3.0)Female
State 56 ( 3.5)259 ( 3.0)
Nation 50 ( 4.7)2$9 21)
.4ENENImmowww,.
fleystagswd
firdawnst
as 3.2202 2.3143 4.1
204( 2.3)
36 ( 8.0)
30 ( ts)244 ( 3.2)4
36 ( 3.7)250 (45 ( 5.1)
257 ( 2.7)
30 ( 4.0)204 ( 3.0)42 ( 5.1)
288 ( 3.2)
30 ( 3.6)273 ( 2.8)43 ( 4.4)
270 ( 3.0)
36 ( 3.3)261 ( 2.7)42 ( 4.0)
2t 3.1)35 ( 3.2)
254 ( 2.5)43 ( 4.7)
263 ( 2.1)
Pennidagawid
Preidency
1 2.2)204 1.2)4
$ 2.0)217 6/4)1
11 i4.1).44)
1 ( 1.4)(
9 ( 3.1)250 ( 4.1)1
$ ( 2.5)400004)
9 ( 2.6)*do .4,4)
7 ( 2.3)4.40. 444)
( 2.0)260 ( 4.8)1
11 ( 2.7)285 ( 4.9)1
( 2.4)267 ( 3.5)1
( 2.1)274 ( 5.3)1
( 2.2)260 ( 39)1
( 2.1)275 8.0)1
The standard errors of the estimated statistics appear in parentheses. It can be said with about 95 percent
certainty that, for each population of interest, the value for the entire population is within * 2 standard errors
of the estimate for the sample, ! Interpret with caution - the nature of the sample does not allow accurate
determination of the variability of this estimated mean proficiency. '0" Sample size is insufficient to permit a
reliable estimate (fewer than 62 students).
14,8THE 1990 NAEP TRIAL STATE ASSESSMENT
111

Maryland
TABLE AlOb I Teachers' Reports on the Use of MathematicalObjects
PERCENTAGE OF STUDENTS ANDAWRAGE MATHEMATICS PROFICIENCY
MO NAEP TRIALSTATE ASSESSMENT AI Least Ow* a Week Lau Than Once a WaML New
TOTAL.
Pommia.
kolitismy
22 ( 2.43.0254 (
22 3.7(254 (
10 ( 2.7)267 ( 13)17 ( 4.0)
261 ( 18)1
25 13)23$ 2.5)22 5.9)
233 5.9)t
31 ( SI)44 0,4)
30 ( 74)247 ( 3.8)
18 ( 4.7)
Pois02011awl
PnOkilearv
2:71-1 1!6i41)
69 2.0)272 ( 1.9)12(4.2)
285(2.1)
05 3.8)230 2.9)70 6.3)
241 ( 2.9)
62 ( 5.3)242 ( 3.0)55 ( 7.3)
245 ( 34)1
58 ( LS)
State
Nation
NACVETNNICITY
Wt.State
Nation
BlackState
Nation
hispanicState
Nation
AsianState
294 ( 4.3)4Nation 42 ( 8.5)
***)52 5.7)*al
TYPE OF COMMUNITY
Advantaged LathanState 17 ( 5.3) 55 ( 5.7)
271 ( 62)1 277 ( 4.4)Nation 23 (14.4) 83 (114)
( INN) 27$ ( 54)1Disaclvalgagad urban
State 17 ( 4.4) 71 ( 5.4)( Me) 232 ( 4.5)1
Nation 39 (11.4) 59 (12.1)247 ( 7.5)1 253 ( 7.0)4
Extreme ruralState 11 ( 1.8) 7$ (10.1)
24$ ( 2.3)1N. ,en 27 (14.9) 55 (146)
262 ( 2.8)1Other
State 22 ( 4.1) 09 ( 4.0)247 ( 3.6)1 264 ( 2.4)
Nation 19 ( 4.3) 72 ( 5.0)253 ( 34)1 263 ( 2.2)
ParOmeisse
112112
212
220 4,5)12 2.3)
10 2.7)25$ ( 5.2)4
244 ( 5.10 (
$ ( 19*an
7 ( 2.3).04,41
7 2.5)*by ( 041
15 ( 3.8)
***4.21
1$ ( 5.0)293 ( 7.4)115 ( 9.3)
( dim.)
11 5.1)***
2 1.8)
( ON)
( 2.4)281 ( 9.4)1
( 3.3)281 7.1)1
The standard errors of the estimated statistics appear in parentheses. It can be said with about 95 percentcertainty that, for each population of interest, the value for the entire population is within ± 2 standard errorsof the estimate for the sample. ! Interpret with caution - the nature of the sample does not allow accuratedetermination of the variability of this estimated mean pronciency. *** Sample size is insufficient to permit areliable estimate (fewer than 62 students).
112
I
THE 1990 NAEP TRIAL STATE ASSESSMENT
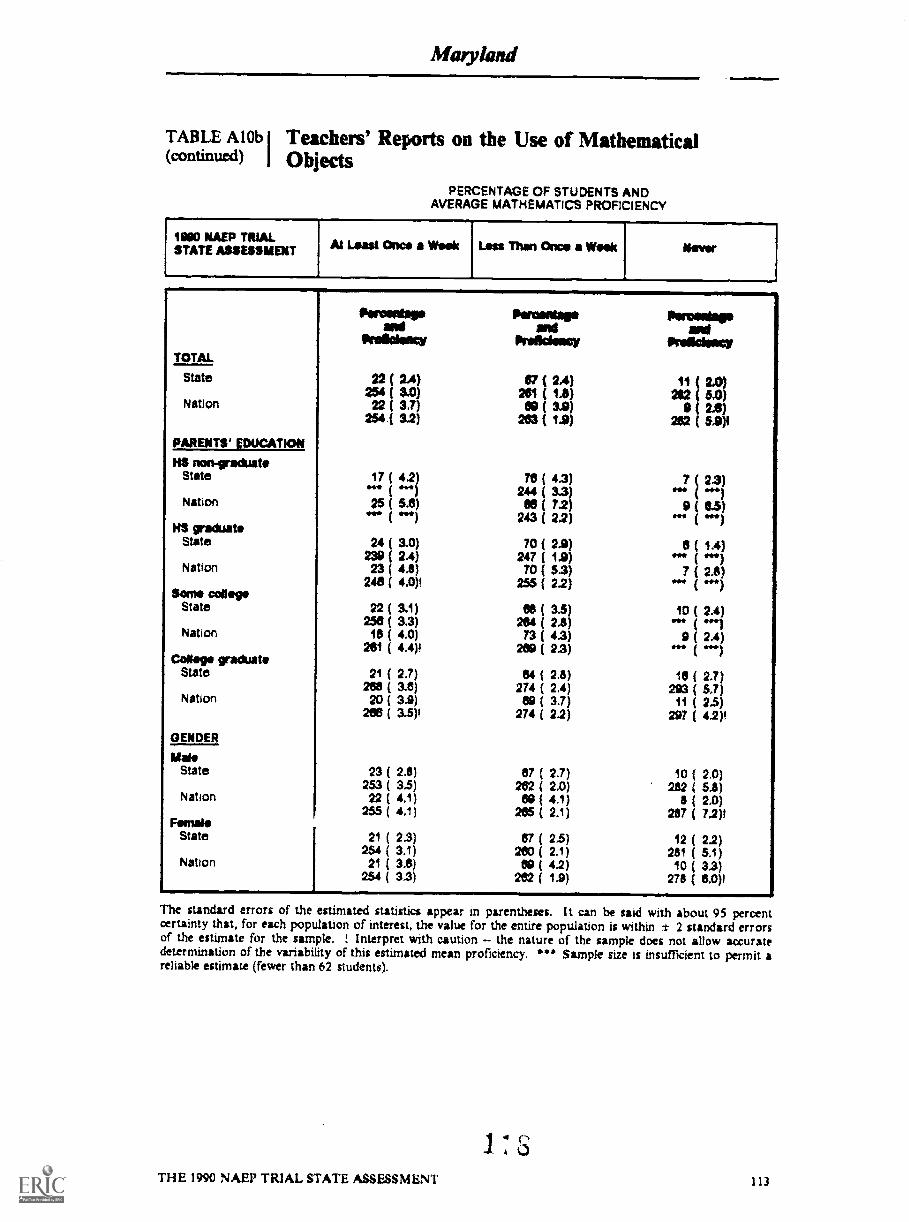
TABLE AlOb Teachers' Reports on the Use of Mathematical(cCIntinlied) Objects
PERCENTAGE OF STUDENTS ANDAVERAGE MATHEMATICS PROFICIENCY
MO NAEP TRIALSTATE ASSESSMENT At 411/111 Once a Week
_
Loss Than Once a Week New
TOTAL
Poramtertani
Volishingt
Pandata.ad
Prelideacy
Parvadaiswd
Prididady
State 22 ( 24) 97 ( 24) 11 ( 2.0)234 ( 3.0) 291 ( 1.8) 2$2 ( 90)
Nation 22 ( 3.7) $9 ( 3.9) 9 ( 2.6)254 ( 3.2) 213 ( 1.9) 2$2 ( 5.9)1
PARENTS' EVOCATION
ttS non-gracluateState 4. 70 (
244 (4.3)3.3)
7 ( 23)
Nation 25 ( 5.6) 93 (243 (
7.2)2.2) ( ".)HS graduate
State 24 ( 9.0) 70 ( 2.9) ( 1.4)239 ( 2.4) 247 ( 1.9)
Nation 23 (248 C
4.8)4.0)1
70 (255 (
5.3)2.2)
7 ( 2.8)
Some calveState 22 ( 3.1) 89 ( 3.5) 10 ( 2.41
256 ( 9.3) 264 ( 2.8)Nation 18 (
261 (4.0)4.4)4
73 (269 (
43)2.3)
9 (4* ( 2.4)4 )College graduate
State 21 ( 2.7) 04 ( 2.8) 16 ( 2.?)268(3.6) 274 ( 2.4) 293 ( 5.?)
Nation 20 ( 3.9) 69 ( 3.7) 11 ( 2.5)266 ( asp 274 ( 22) 297 ( 4.2)1
GENDER
M.State 23 ( 2.8) 67 ( 2.7) 10 ( 20)
253 ( 3.5) 202 ( 2.0) 282 ( 58)Nation 22 ( 4.1) 69 ( 4.1) ( 2,0)
255 ( 4.1) 285 ( 2.1) 287 ( 7,2)1Fan*,State 21 ( 23) 67 ( 2.5) 12 ( 2.2)
254 ( 3.1) 200 ( 2.1) 261 ( 5;9Nation 21 ( 3.5) 09 ( 42) 10 ( 3.3)
254 ( 3.3) 262 ( 1.9) 278 ( 6.0)1
The standard errors of the estimated statistics appear in parentheses. It can be said with about 95 percentcertainty that, for each population of interest, the value for the entire population is within ± 2 standard errorsof the estimate for the sample. Interpret with caution -- the nature of the sample does not allow accuratedetermination of the variability of this estimated mean proficiency. *" Sample size is insufficient to permit areliable estimate (fewer than 62 students).
THE 1990 NAEP TRIAL STATE ASSESSMENT 113
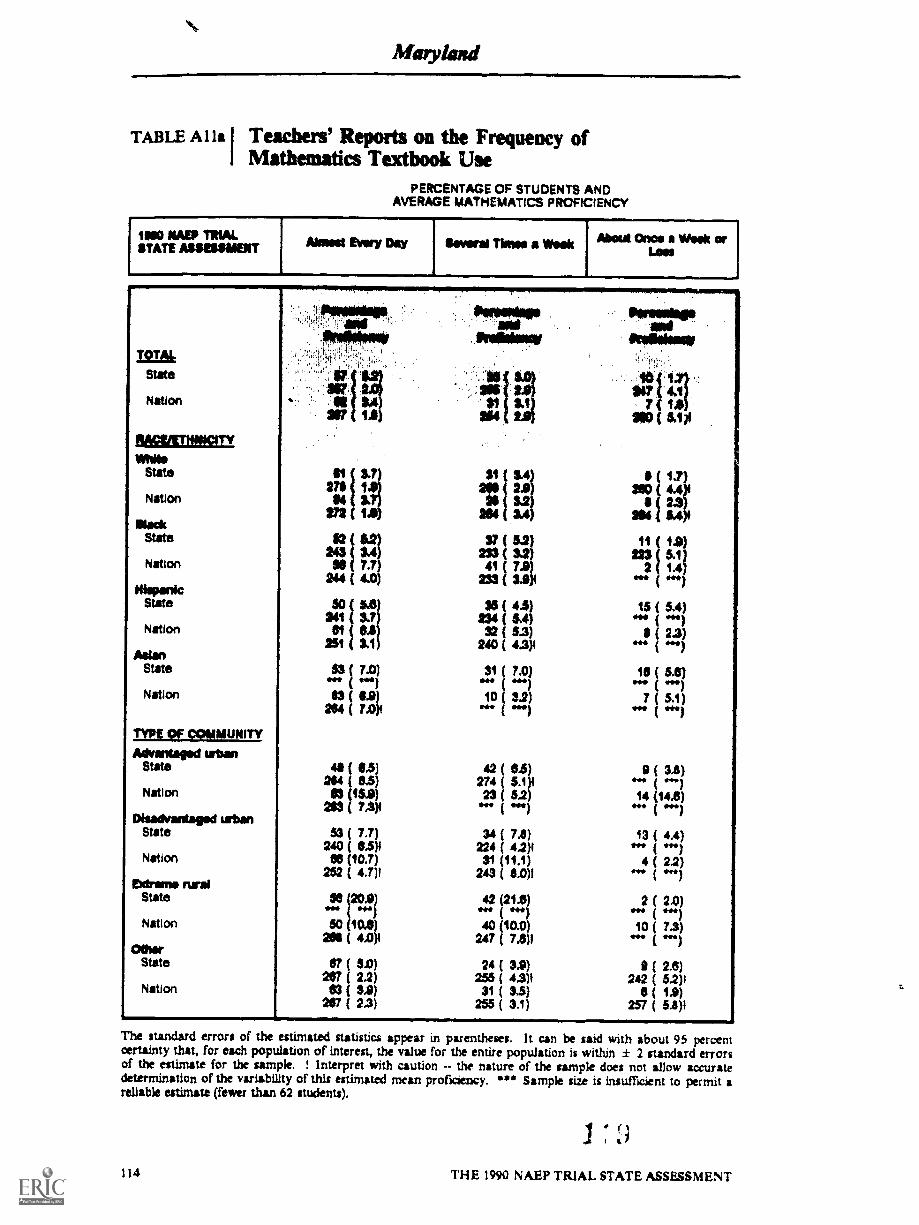
Marylead
TABLE Alla I Teachers' Reports on the Frequency ofMathematics Textbook Use
PERCENTAGE OF STUDENTS ANDAVERAGE MATHEMATICS PROFICIENCY
110 MAEP TRIALTATE ASSEISMENT Muni Ever)/ MY Swami Times a Week AIS" an" /1444/44".Las
TOTAL
State
Nation
amil4100114isami
affigniagnWhite
State
Nation
MediState
Nation
Moat*State
Nation
,AelanState
Nation
TYPE Qf (IMMUNITYAdvantaged urban
State
Nation
Disadvantaged urbanState
Nation
edriNTIO nratState
Nation
OtherState
Nation
a?
271 i01
04 S.
22 I 97.7
02 (
251 3.1
36°41 I 3,781
1
0.1
$3 ( 7.0)sot
83 ( 0.0)204 ( 7.0$
41 ( 1.5)244 (0,5)03 15.0)
211$ ( 7,3)4
33 ( 7.7)240 ( 5.5)1
08 (10.7)252 ( 4.7)4
I** **11)30
50 10.41)201I ( 4.0)1
241 2.2)53 (Si)
3.0)
207 ( 2.3)
$41
IN$
$47 41
117 is
204 IM 5.1g
11.1 2.0)3.4)
20 32)34)
37 ( 5.2)233 ( 3.2)41 ( 7.2)
223 ( 3.0)4
25234 5.4)
4.5)
32 5.3)240 ( 4.3)4
31 ( 7.0)(
10 ( 3.2)( ***)
42 ( 0.5)274 ( 5.1)123 ( 52)
*** Ion)
34 ( 7.8)224 ( 4.2)431 (11.1)
243 ( 8.0)1
42 (214)***40 (10.0)
247 ( 74)1
24 ( 3,9)255 ( 4.3)131 ( 3.5)
255 ( 3.1)
& ( 1.7)
24: ( 411204 $.4
14 ( 1.9)223 ( 5.1)
2 ( 1.4)so* ( *41
15 ( 5.4)041
( 2.3)".)
10 Le)le 441
( 5.1)( 441
9 ( 3.8)(
14 (144)
13 ( 4.4)
4 ( 2.2)ye.)
2 ( 2.0)( "e)
10 7.3)WM fel
( 2.8)242 ( 5.2)1
8 ( 1.9)257 ( 5.8)1
The standard errors of the estimated statistics appear in parentheses. It can be said with about 95 percentcertainty that, for each population of interest, the value for the entire population is within ± 2 standard errorsof the estimate for the sample. Interpret with caution - the nature of the sample does not allow accuratedetermination of the variability of this estimated mean proficiency. "is Sample size is insufficient to permit areliable estimate (fewer than 62 students).
114
1 (I
THE 1990 NAEP TRIAL STATE ASSESSMENT

TABLE Alla I Teachers' Reports on the Frequency of(continued) I Mathematics Textbook Use
PERCENTAGE OF STUDENTS ANDAVERAGE MATHEMATICS PROFICIENCY
1880 MAEP TRIALSTATE ASSESSMENT
,
Most Every Day Sweral Times a Week
A
Mout Mee a Week erLem
BM!,State
Nation
IlisEinuardmiNS non-graduate
State
Nation
HS graduateState
Nation
Sane °MopState
Nation
College graduateState
Nation
GENDER
M.State
Nation
FemaleState
Nation
NS I 4; .4.27
55 31
011*
11(42)252 ( 23
151 ( 4.4257 ( 2.$1
10 ( 4.1)207 ( 3.1)OS ( 4.2)
272 ( 2.7)
57 ( 3.4)262 ( 2.3)91 ( 4.0)
291 ( 2.2)
57 ( 32)267 ( 2.1)90 ( 9.7)
2212 ( 2.1)
57 ( 3.8)288 ( 2.3)85 ( 3.5)
206 ( 14)
33 SA)24124 22
250 ( 2.61
30 3.4)211020 SI
254 ( 52
35 ( 3.5)24$ ( 4.1)$1 ( 3.0)
205 ( 3.1)
33 ( 2.6)257 (33 ( 34)
216 ( LS)
34 ( 3.5)254 ( 34)26 ( 3.3)
253 ( 24)
10 ( 1.7)250 ( 43)
( 14)211 ( 5.7)1
9 ( 1.6)243 ( 5.04
7 C 22)*an
The standard errors of the estimated statistics appear in parentheses. It can be said with &built 95 percentcertainty that, for each population of interest, the value for the entire population is within ± 2 standard errorsof the estimate for the sample. I Interpret with caution - the nature of the sample does not allow accuratedetermination of the variability of this estimated mean proficiency. *** Sample size is insufficient to permit areliable estimate (fewer than 62 students).
.1 f." 0
THE 1990 NAE.P TRIAL STATE ASSESSMENT 115
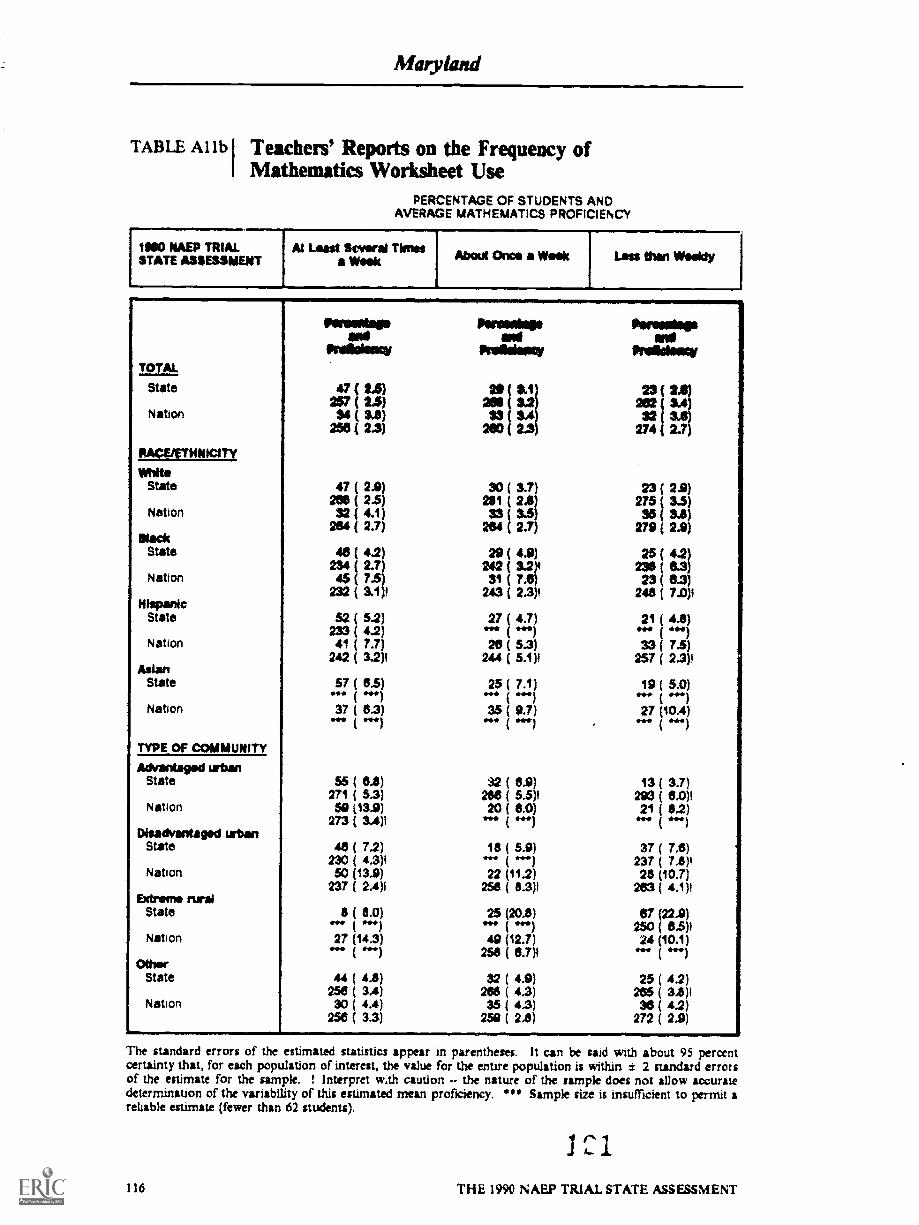
Mary/old
TABLE Al lb I Teachers' Reports on the Frequency ofMathematics Worksheet Use
PERCENTAGE OF STUDENTS ANDAVERAGE MATHEMATICS PROFICIENCY
1160 NAEP TRIAL At Least Several TimmSTATE ASSESSMENT a Week About Once a Weak Lass then Weekly
rirosidademl
Poillickary
47(22)257 ( 2.5)54 ( $.8)
256 ( 2.3)
Peron's.and
Prof/dam
211213123
200
Permeellsend
Praiisacd
(( 3.2 I $42:
23 (
( 34f 23 274 2.7
state
Nation
RACE/ETNNICITY
MiteState 47 2.9) 30 ( 3.1) 23 ( 2.9)
266 ( 2.5) 261 ( 2.6) 275 ( 33)Nation 32 ( 4.1) 33 ( 3.5) 35 ( 3.6)
264 ( 2.7) 264 ( 2.7) 279 ( 2.9)Madc
State 46 ( 42) 29 ( 4.9 25 ( 4.2)234 ( 2.7) 242 ( 3.2 238 ( 62)
Nation 45 ( 7.5) 31 ( 7.6 23 ( 63)232 ( 3.1)4 243 ( 2.3144 243 ( 7.0)1
HispanicState 52 ( 5-2) 27 ( 4.7 21 4.6)
233 ( 4.2) VI* 4111
Nation 41 ( 7.7) 26 ( 5.3 33 ( 7.5)242 ( 3.2)1 244 ( 5.1)I 257 ( 2.3)1
AsianState
.44 ( 25 ( 7.1044 ( 41Nlit
19 ( 5.0)(
Nation 37 ( 6.3)44 ( 041 27
.44(10.4)
TYPE OF COMMUNITY
Advantaged urbanState 55 ( OA) 32 ( 6.9) 13 ( 3.7)
271 ( 5.3) 266 ( 5.5)4 293 ( 6.0)1Nation 59 113.9)
273 ( 3.4)120 ( 6.0)
(214 ( 8.2)( 4
Disadvantaged urbanState 4$ ( 7.2) 37 ( 7.6)
230 ( 4.3)1 237 ( 7.8)1Nation 50 (13.9) 22 (112) 28 (10.7)
237 ( 24)1 25$ ( 8.3)1 263 ( 4.1)1Wren* rural
State 25 (20.8) 87 (22.9)94-IP 250 ( 65)I
Nation 27 (14.3)( .41 49 (12.7)258 ( 6.7)4
24 (10.1)( *On
OtherState 44 ( 4.8) 32 ( 4.9) 25 ( 42)
256 ( 3.4) 266 ( 4.3) 265 ( 38)1Nation 30 ( 4.4) 35 ( 4.3) 38 ( 4.2)
256 ( 3.3) 259 ( 2.11) 272 ( 2.9)
The standard errors of the estimated statistics appear in parentheses. It can be said with about 95 percentcertainty that, for each population of interest, the value for the entire population is within ± 2 standard errorsof the estimate for the sample. ! Interpret w..th caution -- the nature of the sample does not allow aCcUratedetermination of the variability of this estimated mean proficiency. *** Sample size is insufficient to permit areliable estimate (fewer than 62 students).
1
116 THE 1990 NAEP TRIAL STATE ASSESSMENT
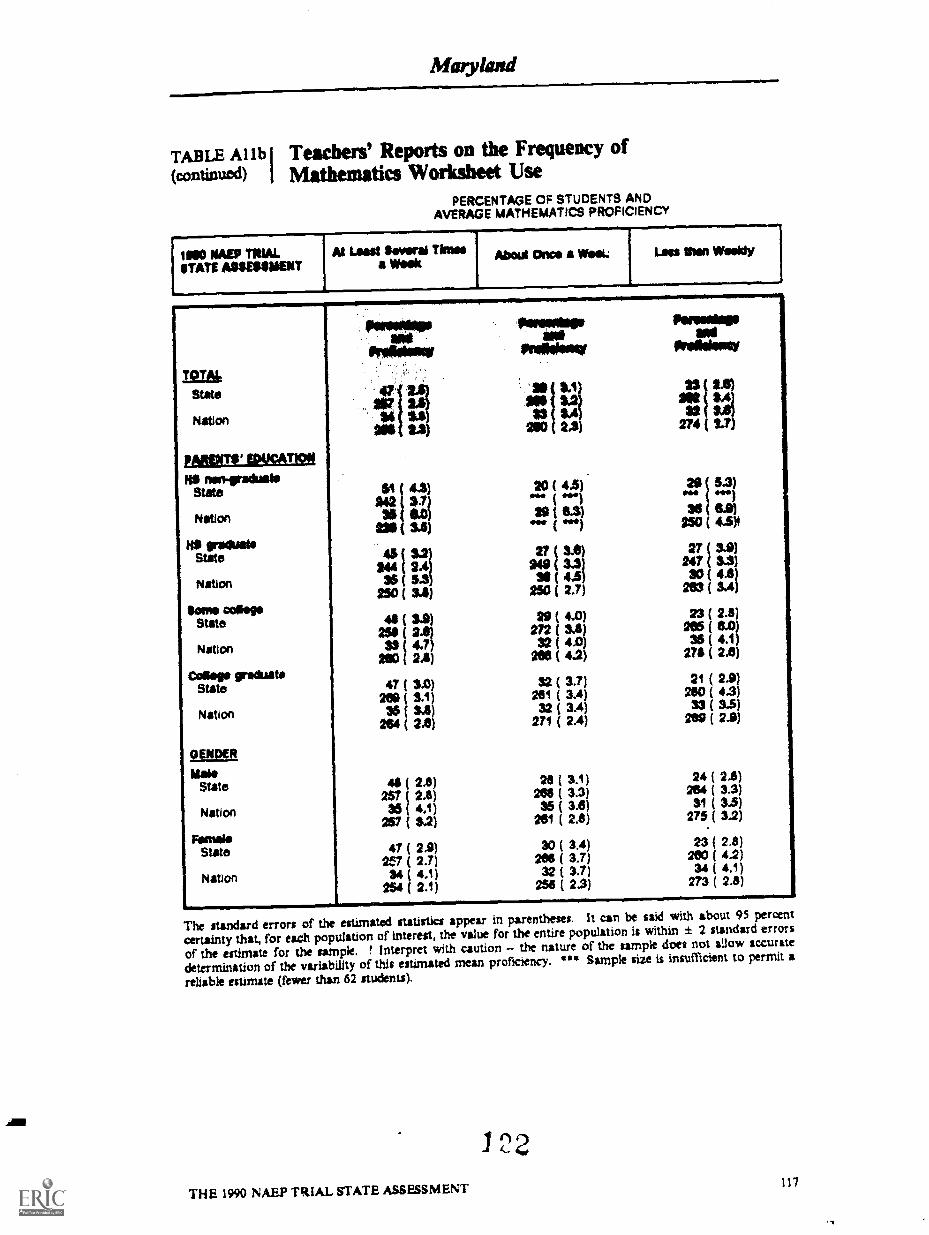
Maryland
TABLE Al lb I Teachers' Reports on the Frequency of(continued) I Mathematics Worksheet Use
PERCENTAGE OF STUDENTS ANDAVERAGE MATHEMATICS PROFICIENCY
IMO NAEP TRIALSTATE ASSESSMENT
At Least Savant Tinaa Weitt
About Once WomeL Lass than Weeidy
f-
lEfiltState
Nation
MinalLgeircaneNNS neniraduato
State
Nathan
NS graduateState
Nation
time cellegeState
Nation
colloge graduateState
Natim
OENDER
MaktState
Nation
FemaleState
Nation
PrellOmor
20 ( 4.5)i
19 (8.3)(
3.21M4 2.4136 5.3
Aso( 3A)
27 (949 (36 (
2$0 (
3.03)3.3)4.5)2.7)
41 ( 3A)2.0)
33 4.7)210 2A)
47 ( 3.0)203( 1,1)
36 ( 3.11)264 ( 2A)
( 2,8)25? ( 2.8)35 ( 4,1)
257 ( 3.2)
41 2.9)27 ( 2.7)34 ( 4.1)
254 ( 2.1)
IS ( 4.0)272 ( 5.1)32(4.0)
206 ( 4.2)
32 ( 3.7)211 ( 3.4)32 ( 3.4)
271 ( 2.4)
28 ( 3.1)( 3.3)
35 ( 3.6)261 ( 2.1)
30 ( 3.4)285 ( 3.7)32 ( 3.7)
258 ( 2.3)
Perisaispand
Oviagiony
33274 2.7
29( 5.3)014 441341( SA)
250 ( 4.5$
27 3.9)247 3.3)30 4.1)
203 3.4)
23 ( 2.3205 ( to)3$ ( 4.1)
278 ( 2.8)
21 ( 2.9)260 ( 4.3)33 ( 3.5)
269 ( 2.9)
24 ( 2.8)204 ( 3.3)31 ( 3.5)
275 ( 3,2)
23 ( 2.8)260 ( 4.2)34 ( 4.1)
273 ( 2.8)
The standard errors of the estimated statistics appear in parentheses. It can be said with about 95 percent
certainty that, for each population of interest, the value for the entire population is within ± 2 standard errors
of the estimate for the ample. ! Interpret with caution - the nature of the ample does not allow accurate
determination of the variability of this estimated mean proficiency. *** Sample size is insufficient to permit a
reliable estimate (fewer than 62 students).
1 22
THE 1990 NAEP TRIAL STATE ASSESSMENT117
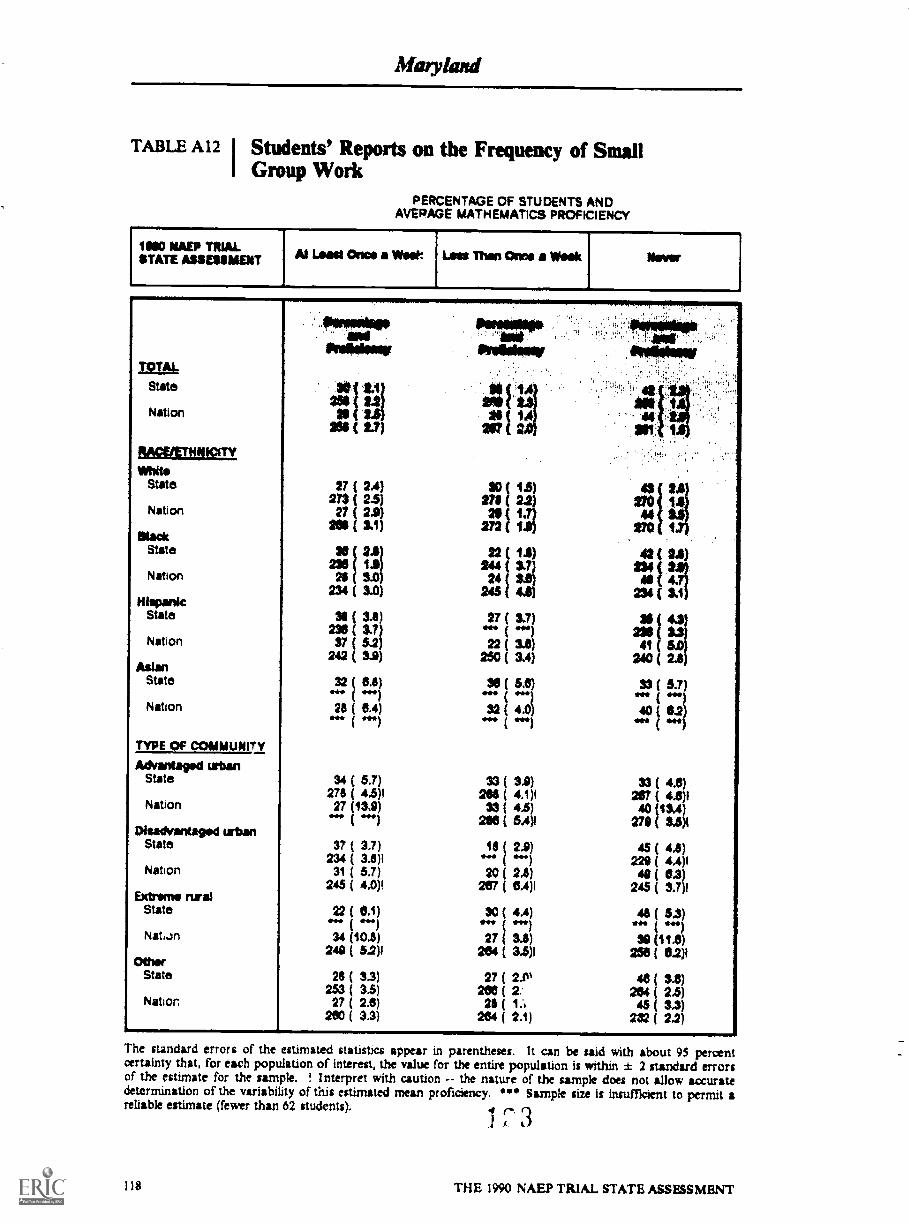
Maryland
TABLE A 12 I Students' Reports on the Frequency of SmallGroup Work
PERCENTAGE OF STUDENTS ANDAVERAGE MATHEMATICS PROFICIENCY
IMO NAEP TRIALSTATE ASSEUMENT AI Liss* Oesso a Week Lass Than One a Wink Now
_
12/ftState
Nation
1100111111120White
"1":1111111.411110d1041
au Lsto
sa( Li)
State 37 ( 2.4)273 ( 2.5)
Nation 27 ( 2.9)2N ( 3.1)
MaackState 30 3.14)
230 1.9)Nation 24 3.0)
234 ( 3.0)Hispanic
State 36(31)230 (3.1)
Nation 37 ( 5.2)242 ( 3.9)
AsianState 32 8.6)
OM *44)
Nation 26 ( 8,4)
TYPE OF COMMUNITY
Advantaged urbanState 34 ( 5.7)
276 ( 4$)1Nation 27 (131)
114411
DisadVantaged urbanState 37 ( 3.7)
234 ( 3.6)!Nation 31 ( 5.7)
245 ( 4.0)1Extreme nrral
State1111he 11114
Natism 34 (101)249 ( 5.2)1
OtherState 2$ ( 3.3)
253 ( 3.5)Nation 27 ( 2.8)
200 ( 3.3)
30 1.5)27122 1.
272 ( 1
22 ( 13)244 ( 3.7)
24 ( 35)245 ( 4.2)
27 ( 3.7)*IMP ft4M1
22 ( 3.8)250 ( 3.4)
20 ( 59)
32 4.1)**11
33 ( 3.9)2411 ( 4.1)I
33 ( 4.5)203 548
1$ ( 2.9)444)
20 ( 25)267 ( 6.4)1
30 ( 4.4)*en
27 ( 3.111)264 ( 3,5)1
27 (208 ( 2.
26 (284 ( 2.1)
00 1.90
3.4
4427
23444 i4.234 ( V
42 (
SS 43)231
240 2.841 5.0
33 ( 5.7)
1 ( 12/***)
33 ( 41)( 4.6)1
40 (134)279 ( 3,5)1
45 ( 4.8)229 ( 4.4)149 ( 0.3)
245 ( 3.7)1
4 ( 5,3).44)
30 (11.8)250 ( 0.2)1
44 ( 3.6)204 C 24)
45 ( $4)232 ( 2.2)
The standard errors of the estimated statistics appear in parentheses. It can be said with about 95 percentcertainty that, for each population of interest, the value for the entire population is within ± 2 standard errorsof the estimate for the sample. ! Interpret with caution - the nature of the sample does not allow accuratedetermination of the variability of this estimated mean proficiency. "*" Sample size is insufficient to permit areliable estimate (fewer than 62 students).
118 THE 1990 NAEP TRIAL STATE ASSESSMENT

Maryland
TABLE Al2 I Students' Reports on the Frequency of Small(continued) Group Work
PERCENTAGE OF STUDENTS ANDAVERAGE MATHEMATICS PROFICIENCY
_
1800 NMP TRIALSTATE ASSESSMENT At Least Once a VIM Lm Than Once a Meek Never
TOTAL
Proventaipeand
Pnilidency
Pagoda.and
Prellakticy
eirroside.and
Prilkilescy
State ( 2.1) 28 ( 1.4) 42 ( 2.2)256 ( 2.2) 269 ( 2.3) 256 (
Nation 20 ( 2.5) 28 ( 1A) 44 ( 2.9)256 ( 2.7) 207 ( 2.0) 241 ( 13)
PARENTS EDUCATION
RS non-graduateState 27 ( 4.3) 24 ( 3.3) 4$ ( 4.9)
044 242 ( 3.5)Nation 29 ( 4,5) 29 ( 3.0) 42 ( 4.5)
242 ( 3.4) 244 ( 3.0) 242 ( 2.7)HS graduate
State 30 ( 2.8) 26 ( 1.6) 43 ( 3.0)240 ( 2.5) 250 ( 2.5) 249 ( 2.3)
Nation 26 ( 3.0) 28 ( 1.6) 43 ( 3.4)251 ( 3.7) 261 ( 2.6) 252 ( 1.7)
Soma magaState 30 ( 23) 20 ( 2.3) 45 ( 3.1)
258 ( 2.3) 268 ( 3.4; 263 ( 3.3)Nation 27 ( 3.9) 27 ( 2.4) 48 ( 3.8)
265 ( 3.6) 268 ( 3.3) 206 ( 2.1)Colags graduatt
State 31 ( 2.7) 30 ( to) 39 ( 2.8)274 ( 2.8) 254 ( 2.7) 26. j 2.3)
Nation 28 ( 3.0) 23 ( 1.9) 44 ( 3.6)270 ( 2.7) 273 ( 2.8) 275 ( 2.2)
GENDER
MatoState 32 ( 2.0) 28 ( 1.5) 40 ( 2.2)
257 ( 2.2) 271 ( 2.7) 258 ( 1.9)Nation 31 ( 24) 28 ( 1.7) 41 ( 2.9)
250 ( 3.3) 208 ( 2.8) 282 ( IA)Female
State 22 ( 2,5) 27 ( 1.8) 44 ( 2 7)250 ( 2.6) 267 ( 24) 257 ( 2.4)
Nation 26 ( 2.4) 27 ( 1,8) 47 ( 3.2)257 ( 24) 206 ( 1.7) 200 ( 1.8)
The standard errors of the estimated statistics appear in parentheses. It can be said with about 95 percentcertainty that, for each population of interest, the value for the entire populahon is within ± 2 standard errorsof the estimate for the sample. *IPS Sample size is insufficient to permit a reliable estimate (fewer than 62students).
24THE 1990 NAEP TRIAL STATE ASSESSMENT 119

Masykad
TABLE A 13 I Students Reports on the Use of MathematicsObjects
PERCENTAGE OF STUDENTS ANDAVERAGE MATHEMATICS PROFICIENCY
MO NAV TRIALSTATE ASSESSMENT At Least Om a Weak Lass Than Once a We*
-
Saver
14at
mid**111101141411
110101101111.NMI
.1401161011,
State art 1.1)
Nation le I 1.42$7
$1 1.2 2204141 2.2SS$ ( 2111 1.5 aft ( tej
BfigaiMISMMike
State 21 ( 1.6) 34 1.5) 4e. 2I))201 ( 23) 277 1.7) 273
Nation 27 ( 1.3) 33 14) 40 2.5( 2.8) 275 ( 1.6) 28$ ( 1.$
"NeckState 22 ( 2.4) 27 ( 1.5) 4$ ( 2.5)
232 ( 2.3) 242 ( 2.5) 237 ( 21)Nation 27 ( 3.3) 27 ( 3.2) 40 ( 4.5)
234 ( 3.7) 244 ( 4.3) 232 ( 2.6)Hispanic
State 21 ( 4.3),) 211 ( 3-3)( *el 442319
( 4.3)( 3.0)
Nation 34 i 4.2) 23 ( 2.0) 40 ( 4.0)241 ( 4.6) 253 ( 4,3) 240 ( 1.2)
AsianState 23 ( 44)
ow.)26 ( 4.4)
wow* ( «on50 ( 6.0)
Nation 32 ( 3.7) 30 ( 3,2)0,14. ( (
TYPE QF COMMUNITY
Advantaged urbanState 23 ( 34) 34 ( 3.2) 43 ( 4.0)
271 ( 5,4)1 221 ( 3.5) 277 ( 4.9)Nation 30 (10.3) 33 ( 4.8) ...2 (11.1)
378 ( 6.1)? 214 ( 3.2)1 261 ( 5,141Disadvantaged urban
State 21 ( 3.3) 23 ( 24) 56 ( 4.8)224 ( 4.1)1 242 ( 5.7)1 232 ( 4.1)1
Nation 35 ( 6.6) 12 ( 2.1) 48 ( 6.4)249 ( 5.3)1 256 ( 5.7)1 242 ( 4.8)!
Edreme ruraiState 17 ( 9.1)( *ill 31 (
*4,4, (6.2)441
52***
13.1)..)Nation 21 ( 3.1) 37 ( 4.7) 43 ( 5.0)( ....) 252 ( 4.7)4 251 ( 5.2)1
OtherState 21 ( 1.9) 32 ( 1.7) 47 ( 24)
251 ( 3.3) 265 ( 2.2) 264 ( 2.9)Nation 27 ( 2.0) 31 ( 1.4) 41 ( 2.4)
250 ( 2.0) 270 ( 14) 200 ( 2.2)-,....The standard errors of the estimated statistiC4 appear in parentheses. It can be said with about 95 percentcertainty that, for each population of interest, the value for the entire population is within ± 2 standard errorsof the estimate for the simple. ! Interpret with caution -- the nature of the sample does not allow accuratedetermination of the variability of this estimated mean proficiency. *** Sample size is insufficient to permit areliable estimate (fewer than 62 students).
1 ti
120 THE 1990 NAEP TRIAL STATE ASSESSMENT
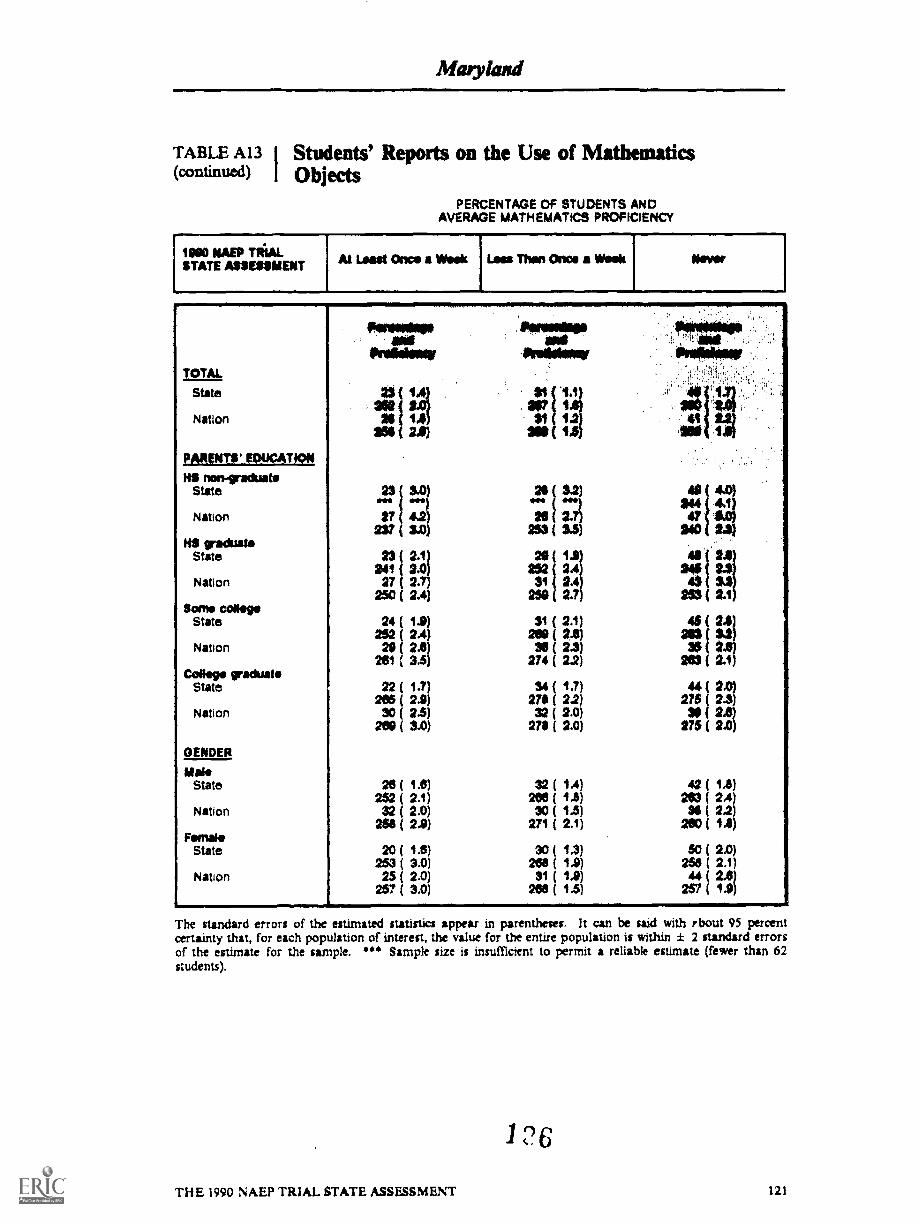
Matyland
TABLE A13 1 Students' Reports on the Use of Mathematics(c(mtinued) I Objects
PERCENTAGE OF STUDENTS ANDAVERAGE MATHEMATICS PROFICIENCY
19110 NAEP TAALSTATE ASSESSMENT
At Least Once a Week Lau Than Once a Week New
TOTAL
State
Nation
POWNT1' EDUCATION
non-raduateState
Nation
NS graduateState
Nation
Some coNegsState
Nation
College GpiaduateState
Nation
GENDER
MakiState
Nation
RenateState
Nation
aOnt001011116
3.0)
27 4.21237 3.0
23 ( 2.1)241 ( 2.0)27 ( 2.7)
250 ( 2.4)
24 ( 1.9)252 ( 2,4)
29 ( 29)201 ( 3.5)
22 ( 11)205 ( 2.9)
30 ( 2.5)262 ( 3.0)
26 ( 1.6)252 ( 2.1)
32 ( 2.0)254 ( 2.9)
20 ( 1.6)253 ( 3.0)
25 ( 2.0)257 ( 3.0)
26 ( 3,2) 49
20 ( 2.7j*44
47253( 3.5) 240
25$ ( 2.7)3
SO 2.31 ( 2.4) 45 3.3
253 3.1
29 ( 19)252 .4( 2)
31 ( 2.1) 46( 2.6)no ( 2.6) 2434274 ( 2.2)
.3) * 24)3
36 ( 2)
203 2.1)
34 ( 1.?) 44 ( 24)
276 ( 2.0)32 ( 2.0) IS
275 2.3)2.6)
2711 ( 2.2)
27$ 2.0)
4
32 ( 14)200 ( 1i)30 ( 1.5)
271 ( 2.1)
30 ( 1.3)206 ( 1.9)31 ( 14)
206 ( 1.5)
42 ( 19)203 ( 2.4)30 ( 2,2)
2001 19)
50 ( 2.0)256 ( 2.1)25744 2.6191
The standard errors of the estimated statistics appear in parentheses. It can be said with rbout 95 percentcertainty that, for each population of interest, the value for the entire population is within ± 2 standard errorsof the estimate for the sample. *** Sample size is insufficient to permit a reliable estimate (fewer than 62students).
THE 1990 NAEP TRIAL STATE ASSESSMENT 121

Maryland
TABLE A 14 I Students' Reports on the Frequency ofMathematics Textbook Use
PERCENTAGE OF STUDENTS ANDAVERAGE MATHEMATICS PROFICIENCY
MO NAEP TRIALSTATE ASSESSMENT Almost Every Day IleverM noes a Weak About Ones a Weak or
Use
TOTAL
andProllicium
PoismIsmsanti
permeallemut
Prellekswey
State 621 2.2) 22 ( 16 ( 1.7)200 tit) 2$6 ( 1.7 247 ( 2.2)
Nation 74 I 1.93 14 ( 0.6 12 ( 1.6)267 ( 1.2) 262 ( 1.7) 242 ( 4.5)
RACE/ETHNIC1TY
MiteState 66 ( 2.7) 20 ( 1.4) 15 ( 2.1)
278 ( 1.7) 267 ( 2.1) 2110 ( 2.4)Nation TO ( 2.5) 13 ( 0.8) 11 ( 2.2)
274 ( 1.3) 258 ( 2.2) 252 ( 5..tyBlack
State 61 ( 3.0) 23 ( 1.6) its( 2.0)240 ( 2.6) 237 ( 2.8) 227 ( 3.0)
Nation 71 ( 2.8) 15 ( 1.7) 14 ( 3.2)240 ( 2.9) 232 ( 3.1) 223 ( OA)4
HispanicState 48 ( 5.2) 23 ( 3.3) 24 ( 4.0)
242 ( 3.6) O.* ( 41.* 41N114 )
Nation 61 ( 3.7) 21 ( 2.9) 17 ( 2.7)249 ( 2.3) 242 ( 5.1) 224 ( 3,4)
AslanState 63 ( 6.2)
299 ( 3.6)126 ( 5.4) 11 ( 3.8)
Nation 79 ( 4.9)289 ( 5.0)1
13 ( 3.4)( 441 -** fel
TWE OF COMMUNITY
Advantaged urbanState 59 ( 4.4) 24 ( 25) 17 ( 3.7)
282 ( 4.6) 271 ( 4.7) 207 ( 32)1Nation 73(11.1) 13 ( 1.7) 14 (10.4)
266 ( 4.6)1 (
Disadvantaged urbanState 59 ( 5.3) 23 ( 3.3) 18 ( 4.5)
235 ( 4.7)1 235 ( 4.2)1 220 3.6)1Nation 69 ( 2.8) 15 ( 2.5) 15 ( 21)
253 ( 3.7)1 243 ( 4.4)1 235 ( 6.5)1Wiwi. rural
State 83 ( 6.8) 14 ( 4.1) 3 ( 2.8)257 ( 1.7)1
Nation 66 (11.3) 17 ( 8.2)263 ( 4.P)l *IP/
OtherState 64 ( 4.1) 20 ( 2.0) 1 6 ( 2.4)
267 ( 24) 255 ( 3.0) 246 ( 34)1Nation 75 ( 22) 14 ( 1.0) 10 ( 1.9)
267 ( 1.6) 252 ( 2.6) 239 ( 42)1
The standard errors of the estimated statistics appecr in parentheses. It can be said with about 95 percentcertainty that, for each population of interest, the value for the entire population is within ± 2 standard errorsof the estimate for the sample. I Interpret with caution -- the nature of the sample does not allow accuratedetermination of the variability of this estimated mean proficiency. *** Sample size is insufficient to permit areliable estimate (fewer than 62 students).
122 THE 1990 NAEP TRIAL STATE ASSESSMENT

Maryland
TABLE A14 I Students' Reports on the Frequency of("mtillued) I Mathematics Textbook Use
PERCENTAGE OF STUDENTS ANDAVERAGE MATHEMATICS PROFICIENCY
_
MO NAEP TRIAL About Once a Week orSTATE ASSESSMENT Nowt Every Day Several Them a Week
Less
MakState
Nation
featatuesansmNI nen-graduate
Slate
Nation
HI racketsState
Nation
Some callerState
Nation
College graduateState
Nation
OEMM.
State
Nation
FemaleState
Nation
01 S,A)SO. 2.3)
50 ( 2.1)251 ( 2.1)71 ( 3.9)
955 ( 1.6)
66 ( 3.0)299 ( 24)
270 ( 1.2)
64 ( 2.4)279 ( 2.1)17 ( 2.7)
279 ( 1.6)
( 2.3)216 ( 1,9)72 ( 24)
261 (1.5)
64 ( 24)295 ( 2.0)76(1.5)
225 ( 1,3)
22 ( 3.51
12 *l21 ( 1.2)
245 ( 2.6)19 ( 1.1)
249 ( 3.2)
19 2.0)220 SA
11 1.2)*4,1
23 ( 1.5)266 ( 2.4)
13 ( 0.9)260 ( 2.6)
23 ( 1.5)258 ( 2.1)
16 ( 1.2)252 ( 2.5)
20 ( 12)257 ( 2.3)13 ( 1,0)
250 ( 2,5)
"919999.191/969
fhWilkolf
20 ( 2.5)
12 ( 3.11.14,1
20 2.1)235 2.9)
13 2.6)229 ( 3.4)4
1$ ( 2.3)2St ( 4.0)
9 ( 1.7)
13 ( 1.8)258 ( 2.7)10 ( 2.3)
257 ( 8.4)1
16 ( 1.8)24$ ( 2.6)12 ( 2.1)
242 ( 6.1)
16 ( 1.9)246 ( 2.8)
11 ( 1.8)242 ( 3.8)
The standard errors of the estimated statistics appear in parentheses. It can be said with about 95 percentcertainty that, for each population of interest, the value for the entire population is within ± 2 standard errorsof the estimate for the sample. ! Interpret with caution - the nature of the sample does not allow accuratedetermination of the variability of this estimated mean proficiency. *** Sample si2e is insufficient to permit areliable estimate (fewer than 62 students).
THE 1990 NAEP TRIAL STATE ASSESSMENT 123
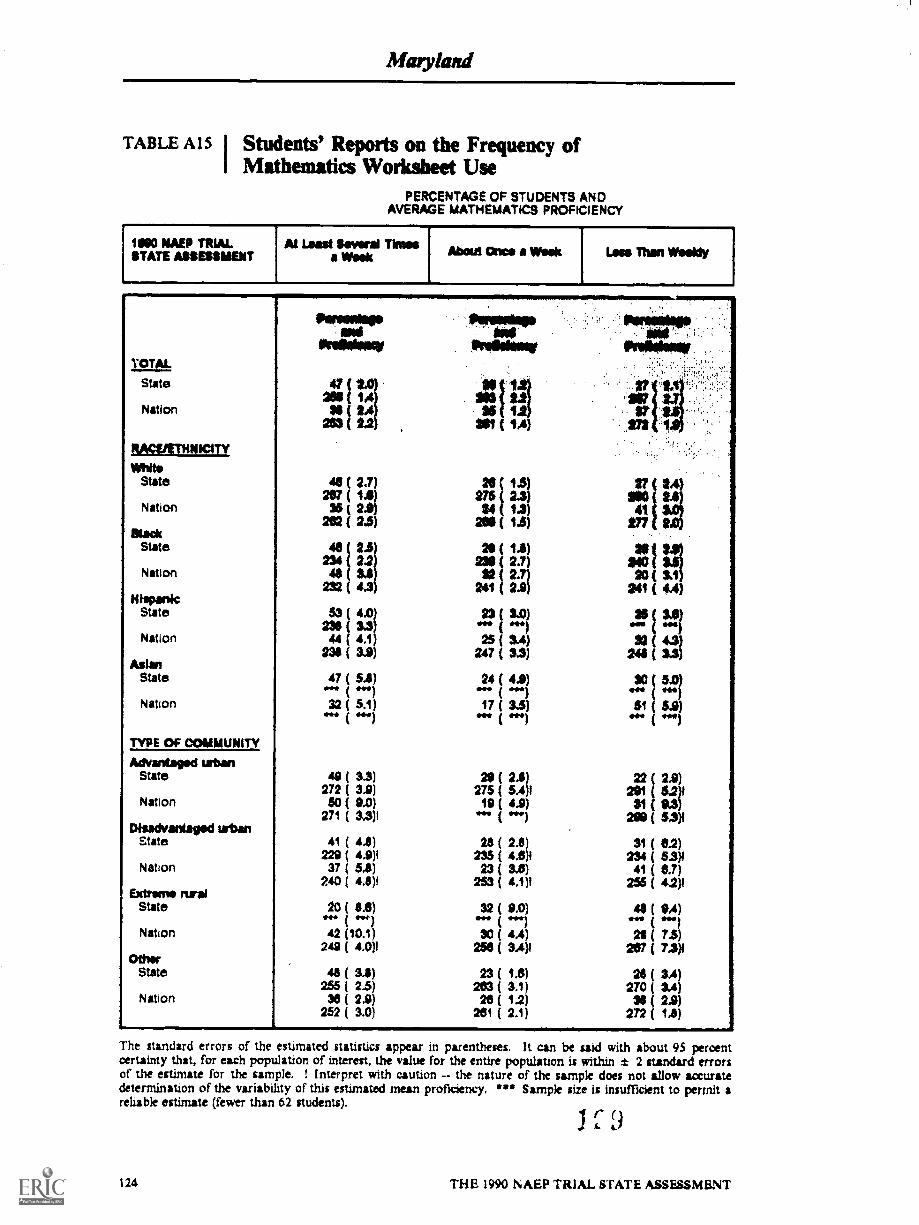
Matyktid
TABLE MS Students' Reports on the Frequency ofI Mathematics Worksheet Use
PERCENTAGE OF STUDENTS ANDAVERAGE MATHEMATICS PROFICIENCY
,
1090 MAEP TRIAL At Least Swami TbnasSTATE ASSESSMEKT a Weak Maui Ome a Weak Lisa run Vaaalety
TOTAL
State
Nation
MULEINAM
State
Nation
MackState
Nation
HispanicState
Nation
AsianState
Nation
TYPE Of C94111UNITY
Advantaged urbanState
Nation
Disadvantaged urbanstate
Nation
Extreme nralState
Nation
OtherState
Nation
Paresidapan$Maim
21$ (
25$ ( 2231(2447 (
42 ( 2.7)207 ( 14)
35 1 2.2)222 ( 2.5)
42 ( 2.5)234 2.2)
4$ 3.1232 4.3)
)
53 ( 4.0)232 ( 3.3)44 ( 4.1)
23$ ( 3.9)
47 ( 5.1)41,
32 ( 5.1)or** (
49 ( 3.3)272 ( 3.9)50 ( 6.0)
271 ( 3.3)1
41 ( 4.1)229 ( 4.9)437 ( 5.5)
240 ( 4.5)4
20 ( 1.0)
42 (10.1)249 ( 4.0)1
48 ( 33)255 ( 2.5)30 ( 2.9)
252 ( 3.0)
Proislaw
275 2.3
222 1.524 1.3
SO
In 241
li 24)
23$ ( 2.720 (
22 ( 2. 20 I iii
III M
241 ( 2.9 221 ( 4.4)
.«3 1 .3125 ( 3,4
eta i 11132
247 ( 3.3 241 ( 3.3)
24 ( 4.0) 20 (1144. ( OM) 004 ( ?I'hil
17 ( 3.5) 51 ( 5.9).. ( ....) 40, ( .*)
29(2.1)275 ( 5.4)419 ( 4.9)
(
28 ( 2.8)235 ( 4.6)123 ( 30)
253 ( 4.1)1
32 ( 9.0)*el30 ( 4.4)
250 ( 34)4
23 ( 10)223 ( 3.1)22 ( 1.2)
2131 ( 2.1)
22201 5.2
$1 943209 ( 53)1
31 ( 22)234 ( 5.3)141 ( 0.7)
255 ( 4.2)1
4 ( 9.4)44.)
23 I 7.5)207 ( 7.3)1
24 34272 13)SI 20)
The standard errors of the estimated statistics appear in parentheses. It can be said with about 95 percentcertainty that, for each population of interest, the value for the entire population is within ± 2 standard errorsof the estimate for the sample. ! Interpret with caution -- the nature of the sample does not allow accuratedetermination of the variability of this estimated mean proficiency. *" Sample size is insufficient to permit areliable estimate (fewer than 62 students).
124
JA.
THE 1990 NAEP TRIAL STATE ASSESSMENT

Maryland
TABLE A15 I Students' Reports on the Frequency of(continued) I Mathematics Worksheet Use
PERCENTAGE OF STUDENTS ANDAVERAGE MATHEMATICS PROFICIENCY
1010 NAEP TRIALSTATE ASSESSMENT
At Least Sew* Times 1-a *sok Meta Once a Week Loss Than Weeidy
_
TOTAL
Peratalagaand
ProildancY
47 ( 2.0)255 ( 14)36(24)
253 (
P4410110.
Prelledanay
26(12)253 ( 2.2)25 ( 1.2)
261 ( 1.4)
Pantionagoaid
Pralklesay
207 2.7)37 15)
272 ( 1.9)
State
Nation
PARENTS' EDUCAT10141
145 non-waduateState 49 (
240 (5.1)2.8)
2004*
2.6)«in 31 ( 5.3)qmpe)
Nation 41 ( 4.5) 30 ( 2.7) 29 ( 4.0)23S ( 3.1) 243 ( 2.7) 253 ( 2.8)
NS graduateState 48 ( 2.7) 25 (2.0) 26 ( 2.9)
245 ( 1.9) 246 ( 2.1) 241 ( 8.8)Nation 40 ( 3.2) 29 22) 32 ( 3.6)
247 ( 2.7) 256 ( 2.5) 262 ( 22)Sam collage
State 48 ( 2.8) 27 ( 1.0) 26 ( 3.1)257 ( 2.3) 208 ( 2.8) 209 ( 4.4)
Notion 34 ( 3.4) 26 ( 2.2) 40 ( 3.6)259 ( 2.3) 289 ( 2.8) 271 ( 2.8)
College graduateState 45 ( 22) 2e ( 1.7) 29 ( 2.0)
267 ( 2.0) 276 ( 32) 263 ( 2.0)Nation 38 ( 2.8) 22 ( 1.8) 41 ( 2.6)
264 ( 2.6) 273 ( 2.3) 285 ( 2.3)
GENDER
MatoState 51 ( 2.0) 25 ( 12) 25 ( 1.9)
258 ( 1.5) 261 ( 2.5) 270 ( 3.0)Nation 39 ( 2.7) 25 ( 1.6) 35 ( 2.7)
253 ( 2.7) 2e3 ( 23) 274 ( 2.4)Fong*
State 43 ( 22) 27 ( 1.5) 30 ( 2.5)255 ( 1,8) 264 ( 2.7) 264 ( 3.1)
Nation 37 ( 2.5) 25 ( 1.5) 38 ( 2.6)253 ( 21) 25S ( 1.8) 269 ( 2.2)
The standard errors of the estimated statistics appear in parentheses. It can be said with about 95 percentcertainty that, for each population of interest, the value for the entire population is within ± 2 standard errorsof the estimate for the sample. *** Sample size it insufficient to permit a reliable estimate (fewer than 62students).
1 0
THE 1990 NAEP TRIAL STATE ASSESSMENT 125

Maryland
TABLE A18 Students' Reports on Whether They Own aCalculator and Whether Their Teacher ExplainsHow to Use One
PERCENTAGE OF STUDENTS ANDAVERAGE MATHEMATICS PROFICIENCY
MO NAEP TRIALSTATE ASSESSIIENT
Om a Calotdator Teacher Explains Calculator Use
Yes
4
_
No..
YesI
No,
State
Nation
MIZMISILU*Me
State
Nation
State
Nation
HispanicState
Nation
AsianState
Nation
TYPE OF C9MMUNITY
Advantaged urbanState
Nation
Disadvantaged urbanState
Nation
Extreme neatState
Nation
OtherState
Nation
persome.
reakikeer
firt I Jitf97 0.4 3 ( 0.41
0.3 13) 234 (
as (0.2)273
MI 0.3270 ( 1.5
93 ( 0.7)231 ( 2.1)93 ( 1.5)
231 t 2.3)
94 1.7)230 2.4)
92 1.2)245 2.7)
90 ( 1.1S)
292 ( 3-7)99 ( 0.8)
282 ( 5.3)1
ite ( 0.5)277 3.7)
tO)281 ( 2,8)1
08 ( 1.4)233 ( 3.9)194 ( 1.2)
250 ( 3.5)1
( 1.6)258 ( 24)190 ( 1.3)
257 ( 3.2)1
ae ( OA)282 ( 2.3)97 ( 0.5)
263 ( 1.7)
1 (.44
2 03
4 ( 0.7).44 ( 441
( 1.5).40 ( .44)
( 1.7)
11 ( 1.2).44 (
( ".)( ***)
(IrtrIt (
( .044* ( *el
4 ( 1.4)4.4
6 ( 1.2).44 ( 41
4 ( 1.8).44)
4 ( 1.3)4 ( .41
2 ( 0.4)(
3 ( 0.5)233 ( 54)
Praiskisql
Illsresalse
INWINkm,/
a 111as 1.1 ass 1.5)
52 ( 21)270 ( 1.7)48 ( 21)
2e. ( 1.$)
49 ( 3.1)238 ( 1.7)53 ( 44)
228 ( 3.8)
59 ( 4.1)238 ( 3.1)63 ( 4.3)
243 ( 3.4)
45 ( 5.9).041
52 ( 4.8)( 441
50 ( 4.3)274 ( 3.7)45 (12.2)
276 ( 2.5)1
42 ( 41)232 ( 3.7)153 ( 75)
247 ( 4.1)t
09 ( 0.5)281 ( 3.8)142 ( 8.7)
251 ( 41)1
4$ ( 3.2)258 ( 2.4)50 ( 2.7)
258 ( 2.1)
4$ ( 2.1)279 ( 11)54 ( 21)
273 ( 1.1)
( 3.1)23411 ( 3-4)47 ( 4.0)
230 ( 2.7)
41 ( 4.1)243 ( 3.6)37 ( 4.3)
245 ( 24)
55 ( 5.9)...)43 ( 4.8)
414 ( *AO )
201 4.8)55 12.2)
50 4.3)
265 ( 6.4)4
58 ( 49)234 ( 4.6)47 ( 7 .5)
231 ( 3.6)1
31 ( 9.5)
58 ( 8.7)261 ( 44)1
52 ( 32)225 ( 2 7)50 ( 2.7)
288 ( 2.0)
The standard errors of the ettimated statistics appear in parentheses. It can be said with about 95 percentcertainty that, for each population of interest, the value for the entire population is within ± 2 standard errorsof the estimate for the sample. I Interpret with caution - the nature of the sample does not allow accuratedetermination of the variability of this estimated mean proficiency. ** Sample size is insufficient to permit areliable estimate (fewer than 62 students).
126131
THE 1990 NAEP TRIAL STATE ASSESSMENT
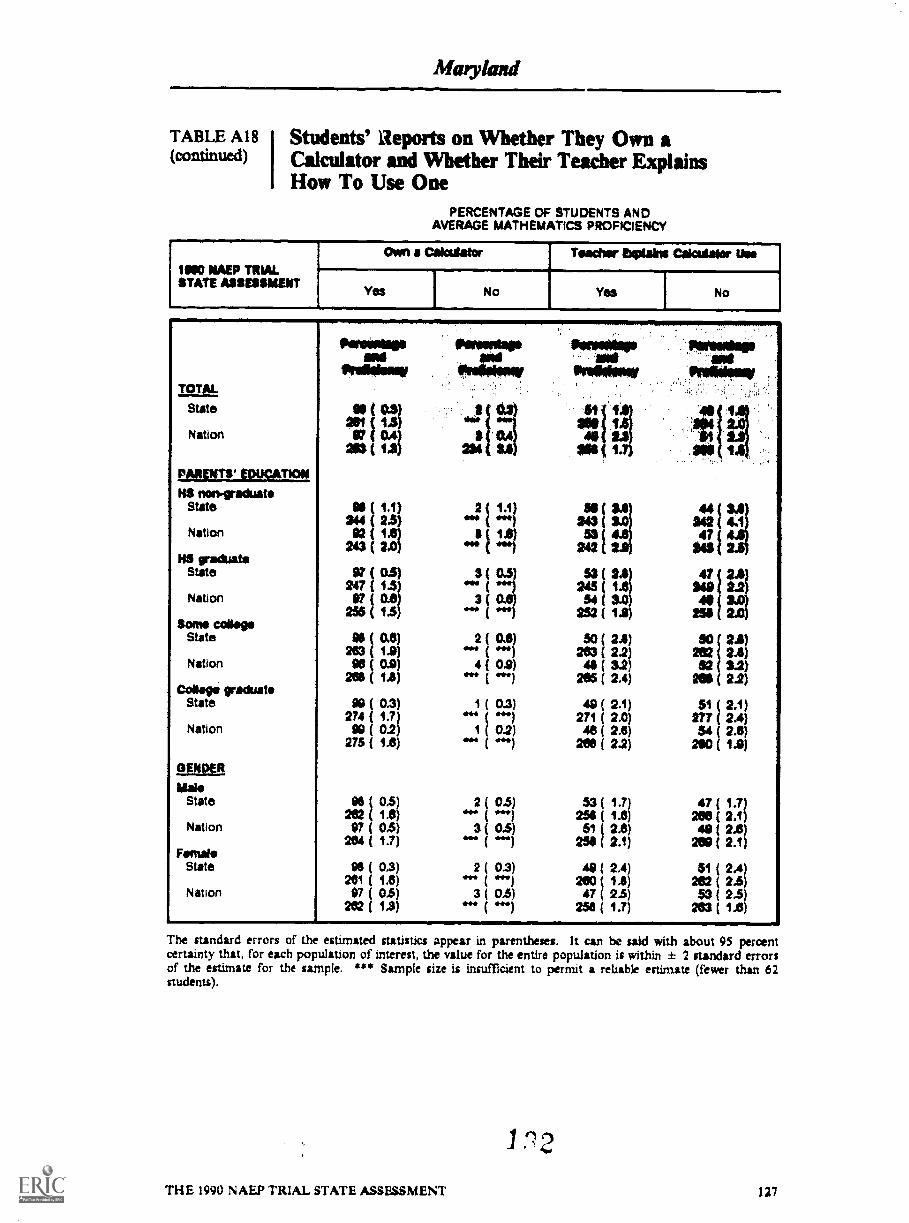
" 17TABLE A18 entSS.' ..eports on Whether They Own a(cmtinued) Calculator and Whether Their Teacher Explains
How To Use OnePERCENTAGE Of STUDENTS AND
AVERAGE MATHEMATICS PROFICIENCY
1990 NAEP TRIALSTATE All$EUMENT
Om a Oakidator,
Teacher DOAN Ca Mutat" Use
Yes, 1_No Yes No
illamiessesase
igiakstate
Nation
EammingmIN nemgraduate
State
Nation
NS graduateState
Nation
Some collegeState
Nation
Coliege graduateState
Nation
9E1414R
MaleState
Nation
femaleState
Nation
65(0.3)201(tS)07 ( CA) AO
2113 (IA) 234
244OS 1.1)
02 1.6j 1 21
....)2 1 1.1)
243 ( 3.05$ (
53 (243 ( 2.0 242 (
266 ( 1 .5
247 (rt ( 0.0
OWN ( INN
..? f ...)
3 (
253 ( 14
245 ( 154 ( 3.0
53 (9? ( 03)
95 ( 02) 2 ( 0.6)263 ( 12) ... ( 44.)
95 ( 0.9) 4 ( 0.9)265 ( 14) *** ( "*)
09 ( 0.3) 1 ( 11.3)274 ( 1.7) .44 ( ...)
99 ( 02) 1 ( 0.2)275 ( 12) .... ( .4.1
91262
( 0.5)( 1.6)
2 ((
0.5).4197 (
2040.5)
( 1,7)(0.. ( 04)
95261 (
0.3)1.6)
2 (.44
0.3)...)07 ( 0$) 3 ( 0.5)
212 ( 12) (
50 ( 2.11)203 ( 2.2)
45 ( 3.2)205 ( 2.4)
49 ( 2.1)271 ( 2.0)46 ( 2.6)
201 ( 2.2)
53 ( 1.7)251 ( 14)51 ( 2.6)
251 ( 2.1)
49 2.4)200 ( 14)47 ( 2.5)
251 ( 1.7)
2444411 43$43
2U 2.0249 2.24$ 3047
262 2.6)
260 2.2)
50 2.11)
$2 3.2)
51 ( 2.1277 2.454 ( 2.61
(
200 ( 1.9)
47 ( 1.7)266 ( 2.1)49 ( 2.6)
209 ( 2.1)
51 ( 2.4262 ( 2.553 ( 2.5
2.3 ( 1.6
The standard errors of the estimated statistics appear in parentheses. It can be said with about 95 percentcertainty that, for each population of interest, the value for the entire population is within ± 2 standard errorsof the estimate for the sample. *** Sample size is insufficient to permit a reliable estimate (fewer than 62students).
THE 1990 NAEP TRIAL STATE ASSESSMENT 127

TABLE A19 I Students' Reports on the Use of a Calculatorfor Problem Solving or Tests
PERCENTAGE OF STUDENTS ANDAVERAGE MATHEMATICS PROfICIENCY
1900 NAEP TRIALSTATE ASSESSMERT
Working Problems inClass Doing Pro(lems al Homo Taking QuIzzas or Tests
AlmostAlways ',ever Almost
Always Never AlmostAlways Never
TOTAL
State
Nation
RACEIETHNICITY
WhiteState
Nation
MackState
Nation
HispanicState
Nation
As lanState
Nation
TYPE Of COMMUNITY
Advantaged uhanState
Nation
Disattvantagad urbanState
Nation
Extrema rtralState
Nation
OtherState
Nation
Parventie pannatage Parma es Parambo Mereentage Paramte.mod aid and and and
Praia Way Pro lidew Pracksicy Pesioknoy linsidsmay Pralkiamy
47 1.4) 26 1.7) 35 ( 1.4) 18 ( I249 275 2.0) 255 ( 1.4) 271 2.248 1.5 23 1.9) 30 ( 1.3) 19
254 ( 15 272 1.4) 281 ( 1.8) 283 1.11
42 ( 1.13) 20 ( 2.2) 34 ( 1.5) 20 ( 1.2)282 ( 11) 234 ( 1.9) 238 ( 1.8) 279 ( 2.2)48 ( 1.7) 24 ( 2.2) 31 ( 1.5) 18 ( 1.2)
202 ( 1.7) 278 ( 1.3) 270 ( 1.7) 289 ( 2.3)
54 ( 2-3) 23 ( 2.3) 39 ( 1.9) 18 ( 1.6)230 ( 1.9) 253 ( 3.4) 232 ( 2.2) 250 ( 3.9)57 ( 3.2) 20 ( 3.9) 31 ( 2.9) 18 ( 1.9)
232 ( 24) 249 ( 4.0) 233 ( 3.3) 248 ( 5.5)
56 ( 17) 14 ( 2.7) 35 ( 4.0) 10 ( 2.2)236 ( 3.2) ( 238 ( 4.5) "" ( ***)51 ( 2.9) 18 ( 33) 28 ( 3.2) 21 ( 2.1)
239 ( 2.8) 252 ( 3.3)1 238 ( 4.8) 244 ( 3.1 )
40 ( 4.5) 33 ( 5.1) 34 ( 4.3) 21 ( 4.7)It «NI *** ( *41
35 ( 8.3) 29 ( 5.8) 30 ( 8.3) 23 ( 4.4)0,04) *44 ( HMI ) Re. ( MN')
43 ( 3$)283 ( 4.3)51 ( 5.4)
270 ( 4.7$
49 ( 2.8)223 ( 2.8)4
52 ( 3.1)241 ( 3.8)4
443 ( 7.4).41
40 ( 7.4)248 ( 4.3)4
47 ( 2.2)248 ( 2.3)
48 ( 1.9)254 ( 2.1)
28 ( 4.3)288 ( 5.3)423 (10.7)
(
28 ( 3.2)252 ( 54)22 ( 43)
259 ( 5.4)4
22 ( 6.8)
29 ( 6.5)288 ( 8.1y
30 ( 2.9)278 ( 2.8)22 ( 2.0)
272 ( 1.8)
36 (271 (32 (
274 (
37 (227 (
30 (24$ (
38 (
20 (4411 (
33 (254 (
32 (263 (
22247
27253
1.02.01.424
3627030
274
1.81.52.01.3
18 ( 1.2) 41 ( 2.0)203 ( 2.3) 283 ( 1.7)25 ( 1.6) 32 ( 2.3)
283 ( 2.8) 279 ( 1.2)
31 ( 1,8) 29 ( 2.5)231 ( 2..) 253 ( 25)
38 ( 3.3) 24 ( 3.1)230 ( 3.6) 251 ( 41)
21 ( 3.3) 22 ( 3.2)( "4) "4"` ( ***)
213 ( 2.7) 22 ( 3.1)237 ( 3.2) 256 ( 4.2)
11 ( 3.4) 44 (*RR
5.7)se..)
23 ( 5.8) 443 ( 41A)*** ( 444 ROM ( *if* )
34)3.7)6.1)4.9)1
2.7)3.7)13.3)52)4
7.5).44)
2.5)***)
2.3)2.4)1.7)2.3)
18 ( 2.1)287 ( 4.5)415 ( 2.4)( .41
18 ( 1.8)*am. (
24 ( 2.3)254 ( 4.ey
(
23 ( 3.9)263 ( 44)4
19 ( 1.8)271 ( 3.2)
115 ( 1.1)283 ( 2.8)
21 (267 (
31 (281 (
30 (223(
27 (240 (
20 (
24 (cum,
20 (245 (
27 (253 (
2.8)5.2)43,8)7.6);
2.2)3.1)42.9)4.9)1
4.8)
8.8)
1.5)2.9)1.8)2.7)
39 (290 (
211 (285 (
32 (253 (27 (
283 (
36 (
37 (270 (
40 (277 (29 (
275 (
4.7)3.5)9.8)4,2)1
3.4)3.8)4.3)5.0)4
3.4)
8.3)4.0)1
2.5)2.3)2.1)1.9)
The standard errors of the estimated statistics appear in parentheses. It can be said with about 95 percentcertainty that, for each population of interest, the value for the entire population is within ± 2 standard errorsof the estimate for the sample. The percentages may not total 100 percent because the "Sometimes" categoryis not included. Interpret with caution -- the nature of the sample does not allow accurate determination ofthe variability of this estimated mean proficiency. *" Sample size is insufficient to permit a reliable estimate(fewer than 62 students).
123
3THE 1990 NAEP TRIAL STATE ASSESSMENT

Maryland
TABLE A19 I Students' Reports on the Use of a Calculator(continugd) 1 for Problem Solving or Tests
PERCENTAGE Of STUDENTS ANDAVERAGE MATHEMATICS PROFICIENCY
MO MEP TRIALSTATE A3521311111T
workingClanProblones in
Doing Probisms AO Homo Toldng QuIzzos or Toes
AlmostAlways Never Almost
Atways Never AlmostAlways Never
TOT
State
Nation
2811211 jaMENNS noniraduste
State
Nation
NS graduateState
Nation
Setae collegeState
Nation
College IndianaState
Nation
WPMMae
State
Nation
FemaleState
Nation
krao PiromMose Peretallisi PqrsonbleANI em ad awl es 201
242,2102v. 7104122141, P740,002.14f PaillMenar P4020m2g 14141244122
A 144 ar. 11 36 IA 16 1 22 1.0 22 1.2), SO 1.4 271 2.2 347 2,0 270 1.542 14 -...a to 12 19 0.9 27 1.4 30 2.01SU i 272 14 MN Li 20 1.4 222 2.4 274 14
57 ( 33 191 titt 21 SI) 19 ( 31) lee I E!) 20 3.0)237 ( 2.0 241 42) *". ( ") .... *Di54 ( 3.5 191 WI) 33 3.1) 22 ( 22) 32 i 11.51 24 3.2)240 ( 2.31 ( ) 244 ( 3.2) 244 ( 4.2) 237 ( 2.3 251 4.5)
$0( 2.0) 22 ( 12 114 2.1) 16 ( 1.7 24 ( 2.0) 34 (2.0) 210 ( 2.2 242 2.2) 257 ( 3-0 224 ( 2.0) 261 ( 1.082 2.5) 20 ( 2.4 29 12) 16 ( 1.5 28 ( 12) 27 ( 2.220 14) 205 ( 2.7 350 2.4) 255 ( 2.4 248 ( 2.5) 205 ( 2.0)
4 ( 2.4) 28 ( 3.1) St ( 3.0) 19 ( 2.0) 22 ( 1.9) 35 ( 3.0)254 ( 2.4) 274 ( 257 ( 2.5) 274 ( 3.0) 254 ( 32) 273 ( 2.0)4 ( 2.5) 20 ( 2.41 Vi ( 2.0) 20 ( 1.9) 26 ( 2.4) 95 ( 2.5)255 ( 2.1) 272 ( 2.5 26? ( 3.0) 206 ( 3.2) 255 ( 3.5) 275 ( 2.0)
40 ( 11) 30 1 2.5) 35 ( 11) 10 ( 14) 20 ( 1.5) 40 ( 2.8)259 ( 2.0) 255 ( 22) NO ( 1.0) 252 ( 21) 250 ( 3.1) 245 ( 1.7)45 ( 1.9) 25 ( 2.4) 33 ( 2.0) 18 ( 1.4) 2$ ( 1.5) 33 ( 2.7)
285 ( 1.7) 254 ( 1.5) 274 ( 22) 276 ( 2.5) 246 ( 2.6) 285 ( 2.0)
51 ( 1 0 23 ( 12 35 ( 1.5) 17 1.1) 21 ( 1.1) 32 ( 1.7)250 ( 11 278 2.7 258 ( 1.8) 273 21) 248 ( 2.3) 279 ( 1.9)50 ( 1.7 20 2.0 29 ( 1.8) 19 1.3) 27 ( 1.5) 2$ ( 2.1)
256 ( 4.9 275 2.2 264 ( 2.5) 265 ( 2.5) 258 ( 2.0) 277 ( 1.9)
42 ( 30 ( 1.8) 33 ( 1.7) 20 ( 1.3) 23 ( 1.5) 41 ( 1.9)247 ( 2.0 273 ( 2.1) 253 ( 1.9) 299 ( 2.7) 247 ( 21) 273 ( 1.7)48 ( 2.0 28 ( 2.1) 32 ( 1.8) 1$ ( 1.2) 27 ( 1.8) 33 ( 2.1)VA I 1.7) 2$9 ( 1.8) 259 ( 1/) 283 ( 2.1) 251 ( 2.4) 271 ( 1.5)
The standard errors of the estimated ttstistics appear in parentheses. It can be said with about 95 percentcertainty that, for each population of interest, the value for the entire population is within ± 2 standard errorsof the estimate for the sample. The percentages may not total 100 percent because the "Sornettnies" categoryis not included. *** Sample size is insufficient to permit a reliable estimate (fewer than 62 students).
V? 4
THE 1990 NAEP TRIAL STATE ASSESSMENT 129

TABLE A20 I Students' Knowledge of Using CalculatorsPERCENTAGE OF STUDENTS AND
AVERAGE MATHEMATICS PROFICIENCY
MO *UP TMALSTATE ASSESSMENT
-
High "Cakulater-Use" Onto
-Other "Caiodater-Uete Snap
TOTA1.
State
Nation
mamma%Mite
State
Nation
SlackState
Nation
HispanicState
Nation
AsianState
Nation
TYPE OF COMMUNITY
Advantaged whenState
Nation
Disadvantaged urbanState
Nation
Extreme ruraiState
Nation
OtherState
Nation
Oralhisi
afti
*3 1.3272 1
50 ( 1261 (44 ( 1.4
277 ( 1.
33 ( 2.3)246( 24)37 ( 3.4)
2411 ( 3.2)
37 ( 33)
36 42)25,4 ( 44)
SS ( 42)
SO 1Se 14SP V)22
231 (
232 2.463 111.4
63 ( 3.7231 ( 4.164 ( 4.2
XS ( 3.0
42 ( 4.2).. t .4,4150 ( 4.8) 30 i 4.04
SO ( 2.1) 50 ( 2,1)267 ( 3.3) 270 ( 4,1)50 ( 3.8) 50 ( 3.8)
2$$ ( 4,9)1 275 ( 4.04)1
30 (2445 (
4.1)4.5)I
(zra
4.1)44)4
38 ( 4.2) 02 ( 4.2)262 ( 5.6)1 244 ( 3.2)1
$3 (*44 (
2.5)0141
67 ( 2.5),)39 ( 5.8) 81 ( 54)
282 ( 4,4)1 248 ( 4$)1
48 ( 11) 54 ( 1.7)272 ( 2.7) 264 ( 2.e)42 ( 1.4) 51 ( 1.4)
271 ( 1.2) 256 ( 2.0)
The standard errors of the estimated statistics appear in parentheses. It can be said with about 95 percentcertainty that, for each population of interest, the value for the entire population is within * 2 standard errorsof the estimate for the sample. ! Interpret with caution the nature of the sample does not allow accuratedetermination of the variability of this estimated mean proficiency. *1" Sample size is insufficient to permit areliable estimate (fewer than 62 students).
130 THE 1990 NAEP TRIAL STATE ASSESSMENT
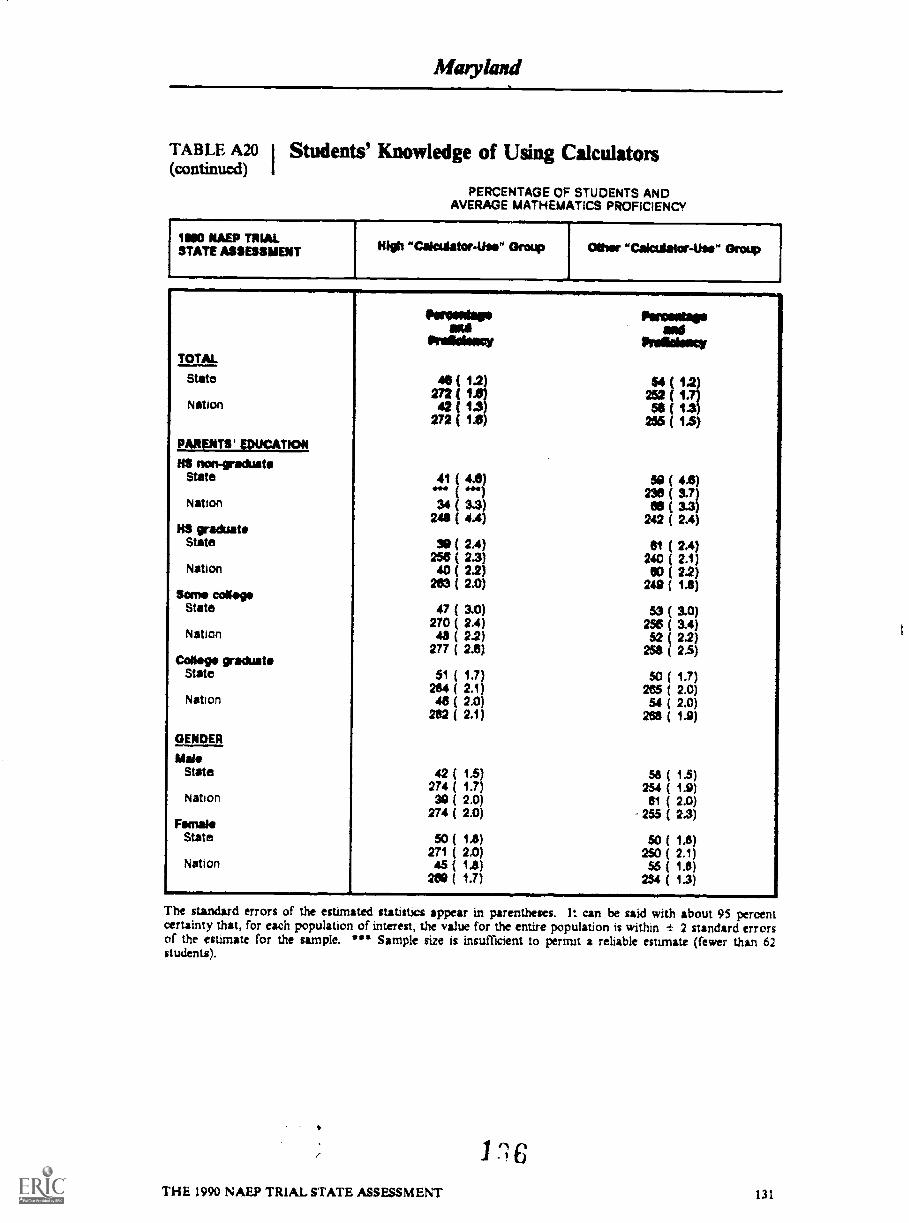
Maryland
TABLE A20 I Students' Knowledge of Using Calculatois(continued) I
PERCENTAGE OF STUDENTS ANDAVERAGE MATHEMATICS PROFICIENCY
IMO MAO TRIALSTATE ASSESSMENT M. "Cacti lator-Uee" Group "Calculator-the" Group
:TOTAL
ferassease
irraaelmoy
Peramiseand
Preaciesscy
State 46( 12) 14(1.2)272 ( 252 1.
Nation 42 ( 12) 51 ( 13272 ( 1.6) 255 ( 1$)
IsiiRENTS' EDUcATION
HI non-graduatState 41 ( 4,6) 50 ( 4.6)...., ( ) 296 ( 3.7)Nation 34 ( 3.3) 66 ( 3-3)
2411 ( 4.4) 242 ( 2.4)NS graduat
State 90 ( 2.4) 61 ( 2.4)256 ( 2.3) 240 ( 2.1)
Nation 40 ( 22) 00 ( 2.2)263 ( 2.0) 249 ( 1.8)
Some collegeState 47 ( 3.0) 53 ( 3.0)
270 ( 2.4) 256 ( 3.4)Nation 46 ( 22) 52 ( 22)
277 ( 2.6) 258 ( 2$)College graduate
State 51 ( 1.7) 50 ( 1.7)264 ( 2.1) 265 ( 2.0)
Nation 48 ( 2.0) 54 ( 2.0)282 ( 2.1) 268 ( 1.9)
GENDER
Mai*State 42 ( 1.5) 58 ( 1.5)
274 ( 1.7) 254 ( 1.9)Nation 39 ( 2.0) 61 ( 2.0)
274 ( 2.0) 255 ( 2.3)Female
State 50 ( 1.8) 50 ( 1.8)271 ( 2.0) 250 ( 2.1)
Nation 45 ( 1.8) 55 ( 1.8)NO ( 1.7) 254 ( 1.3)
The standard errors of the estimated statistics appear in parentheses. I: can be said with about 95 percentcertainty that, for each population of interest, the value for the entire population is within ± 2 standard errorsof the esthnate for the sample. **8 Sample size is insufficient to permit a reliable estimate (fewer than 62students).
THE 1990 NAEP TRIAL STATE. ASSESSMENT 131
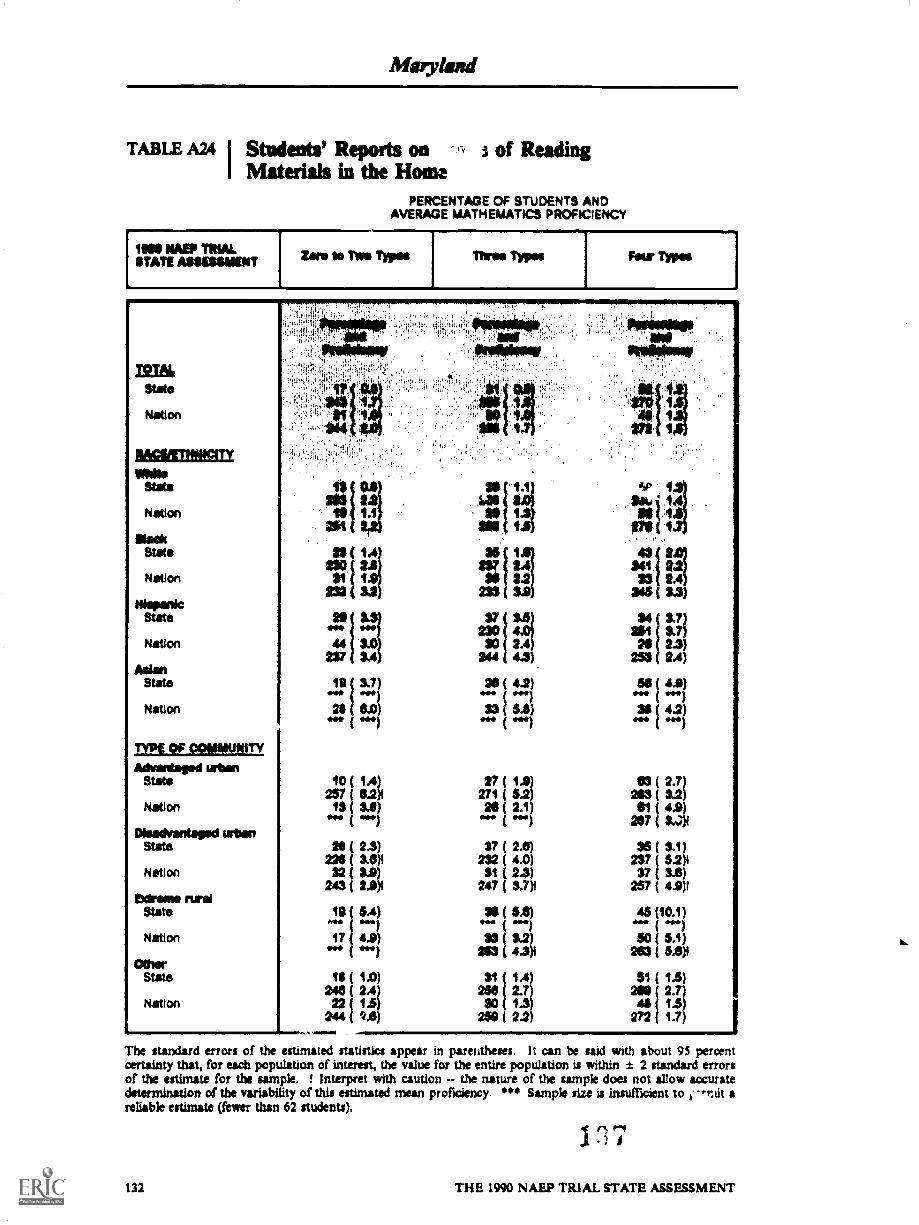
TABLE A24 I Students' Reports on --Y s of ReadingI Materials in the Home
PERCENTAGE OF STUDENTS ANDAVERAGE MATHEMATICS PROFICIENCY
11441 NAD TRIAL*TATE A9444INAINT Zero le rive Typos lTw Tss Fear Twos
TOT
State
Nation
legliMINEMVMS,
State
Nation
MakState
Nation
HispanicState
Nation
AsianState
Maks)
1236-V-021MIMAtt41 Inialed tem
State
Nation
INsadvastaged urbanState
Nation
Wrong rindState
Nation
OthorState
Nation
1001...
r)
31.0111321233 43
4:
237 SA
2 1 31
19
4424 5.0
44
10 ( 1.4)257 ( 52)414 ( Si)
lopts (
243 2
224 340$24 2.3)
32 32).9)1
*al14 SA)
17 4.9)IN*
14 ( 1.0)244 ( 2.4)22 ( 1.5)
244 ( 2.4)
SS I215
35
1% 111223
41
244 43)30 i.;1
24 ( 4.2)
33 ( del
271 (27 (
20 ( 2.1
97 ( 2.0)232 ( 4.0)31 ( 2.3)
247 ( 3.7)4
ow.5.4)
243" tit250 ( 2.731 (
30 ( 1.3259 ( 2.2)
341 I'l33
lO 3.3)
43
IAS
al 347)
233 2A)
34 3.7)
30 23)
.4154 (4.1)
34 (4.2)*el
243 ( 3.241 ( 4.9
03 (
237 ( SQI
SE ( ti)247 52p
257 4.9)137 &I)
43 (10.1)*b. «41
50 5.1)243 ( 5.4)1
$1 ( 1.5)210 2.7)
272 1.7)44 1.5)
The standard wort of the estimated statistics appear in parentheses. It can be said with about 95 percentcertainty that, for each population of interest, the value for the entire population is within ± 2 standard errorsor the estimate for the sample, ! Interpret with caution - the nature of the sample does not allow accuratedetermination of the variability of this estimated mean proficiency. *** Sampli size is insufficient to -rn tit areliable estimate (fewer than 62 students).
132
I 7THE 1990 NAEP TRIAL STATE ASSESSMENT
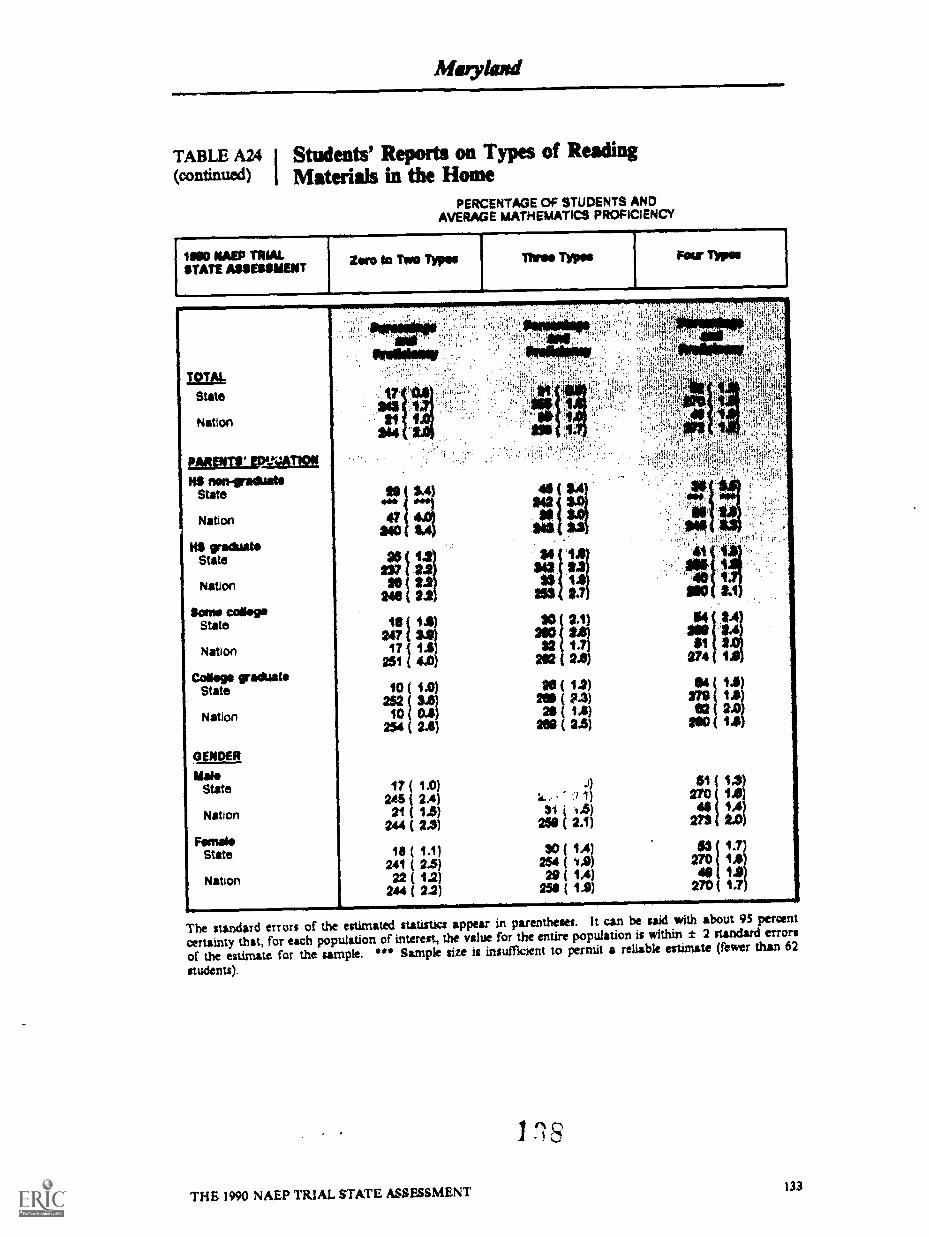
Merykutd
TABLE A24 I Students' Reports on Types of Reading
(cmtinued) I Materials in the HomePERCENTAGE OF STUDENTS AND
AVERAGE MATHEMATICS PROFICIENCY
MOO MAEP TRIAL.STME ASSESSMENT
Zero to Two Typos Theo Typos Four TVpos
12161State
Nation
IMEittiniangi14S non-graesito
State
Nation
KS grackiatoState
Nation
Sem collageState
Nation
College graduateState
Nation
GENDER
M.State
Nation
RotateState
Nation
34047"I 20
243
244:
20 1 1240 ( 2130 2.2
1143 ill34 '1
253 fla33 14
3110 1,1
11
347 (
251 ( 4.017 I 111.141
NO
202 232 1
30 3.1)
274 1$1 St
11 ( 12)
10 ( 1.0) 20 ( 12) $4 ( 14)252 ( SS) 202 ( P.3)
10 ( 0.4) 21I ( 1.4)279 (02 ( 2.0
254 ( 2A) 209 ( 3.5) MOO ( 1.41
17 ( 1.0) .1 51 (245 ( 2.4) k.... , .'.' 1)
S1 ( 44)270 i*
21 ( 115) 44 14244 ( 23) 250 ( 2.1) 273 2.0
2.5) 254 ( t.930 ( 53 1.7)
41 ( 2til ( 1.1)
22 ( 1.2) 29 ( IA270 1
49 14244 ( 2.2) 254 ( 14) 270 1.7
The standard errors of the estimated statistics appear in parentheses. It can be said with about 95 percent
certainty that, far each population of interest, the value for the entire population is within ± 2 standard errors
of the estimate for the tam*. *** Sample size is insufficient to permit a reliable estimate (fewer than 62
students).
THE 1990 NAEP TRIAL STATE ASSESSMENT 133

Maryland
TABLE A25 I Students' Reports on the Amount of Time SpentWatching Television Each Day
PERCENTAGE Of STUDENTS ANDAVERAGE MATHEMATICS PROFICIENCY
1690 NAEP TRIALSTATE ASSEILIMENT
Ono Hoar arLaos 1Wo Hours
-Three 'lours Fair to Flve
Hours
_
II Ix Hours orMors
TOTAL
state
Nation
SACEXTHNOTYniteState
Nation
MackState
Nation
HispanicState
Nation
AsianState
Nation
TYPE OF COMMUNITY
Advantaged urbanState
Nation
04eadvas Asgard urbanState
Nation
Extreme ruralState
Nation
OtherState
Nation
OM Wispsod
Pragadwg, freillobeav Sollidsporsit
Pnitiessi SkrollidsowS
277 SS)11 OA)
2/2°1 °Q1 1110f 16
208 12) 2es 1.4 SOS ( 13 20D ( 1.7 243 (12 0.6) 21 22 QS 26( 1.1
24018 1
13263
13276
5
9
( 24 (( 2.6 290 (( 1.0 23 (( 2.5) 275 (
( 1.0) 10 (( ") 244 (( 0.6) 13 (
1.3)2.2)1.2)2.2)
1.3)9.1)1.1)
*** ( --I no ( 7.0)
8 ( 1.7) 211 ( 3.1)*Ilir I tel i 114 ( 2.4)
...
20 i 2.5)( "*) 245 ( 3.2)
23 ( 3.8) 23 ( 4.7).44 (
16 ( 5.0) 24 ( 4.2)
16 ( 1.6)294 ( 5.9)
18 ( 1.4)***)
( 1 A)
*4-.)
10 ( 3.6)vii.)14 ( 3.3)
10 ( 1.3)273 ( 5.1)12 ( 1.0)
266 ( 2.6)
24 ( 2.5)286 ( 2.7)425 ( 4.3)
***)
14 ( 2.0).44 (17 ( 3.1)
250 ( 4.0)1
20 ( 2.3)41. van19 ( 2.6)
18 ( 1.4)271 ( 4.0)21 ( 1.0)
2es ( 2.3)
24 ( 1.1) 27 ( 1.3)273 ( 1.9) 270 ( 1.6124 ( 1.1) 27 ( 1.4)
272 ( 1.9) 297 ( 1.7)
15 ( 1.2) 38 1.1)240 ( 3.1) 239 2.5)17 ( 2.1) 32 1.6)
236 ( 5,17.1) 239 ( 4.0)
20 ( 3.4)( o) 30.4 *
( 4.0)«A(
)19 ( 2.1) 31 ( 3.1)
242 ( 5.6) 247 ( 3.5)
15 ( 3.2) 28 ( 4.5)(
22 ( 3.1) 23 ( 4.1)4141 444 'en
22 ( 1.2) 26 ( 273)277 ( 3.1) 270 ( 4.5)21 ( 1.0) 30
44*( 4.3)
.4..)
15 ( 1.6) 33 ( 2.1)233 ( 6.0)4
19 ( 2.1) 34 ( 2.4)255 ( 5.0)4 251 ( 4.7)1
20 ( 4.1) 2$ ( SA)( *dr* ***)
2$ ( 2.0)( *el as ( 2.7)256 ( so)4
21 ( 1.4) 32 ( 1.6)265 ( 2.7) 290 ( 2.1)23 ( 1.2) 27 ( 1.2)
255 ( 2.1) 259 ( 2.2)
12 ( 1.0)253 ( 2.4
12 ( 1.2253 ( 2.11)
34 ( 2.0)23232 2.2
233 2.5
22 ( 2.9)( )***
17 ( 1.7)236 ( 3.8)
( 2.2)yr** (
13 ( 4.0)***
11 ( 2.1)244 ( 4.4)4
6( 2.0)
31 ( 2.6)ns ( 2.6)120 ( 3.2)
236 ( 4.5)1
21 ( 3.1)( *on10 ( 3.6)
oimi)
20 ( 1.3)244 ( 2.4)17 ( 1.4)
248 ( 2.5)
The standard errors of the estimated statistics appear in parentheses. It can be said with about 95 percentcertainty that, for each population of interest, the value for the entire population is within ± 2 standard errorsof the estimate for the sample. ! Interpret with caution - the nature of the sample does not allow accuratedetermination of the variability of this estimated mean proficiency. *** Sample size is insufficient to permit areliable estimate (fewer than 62 students).
134 THE 1990 NAEP TRIAL STATE ASSESSMENT
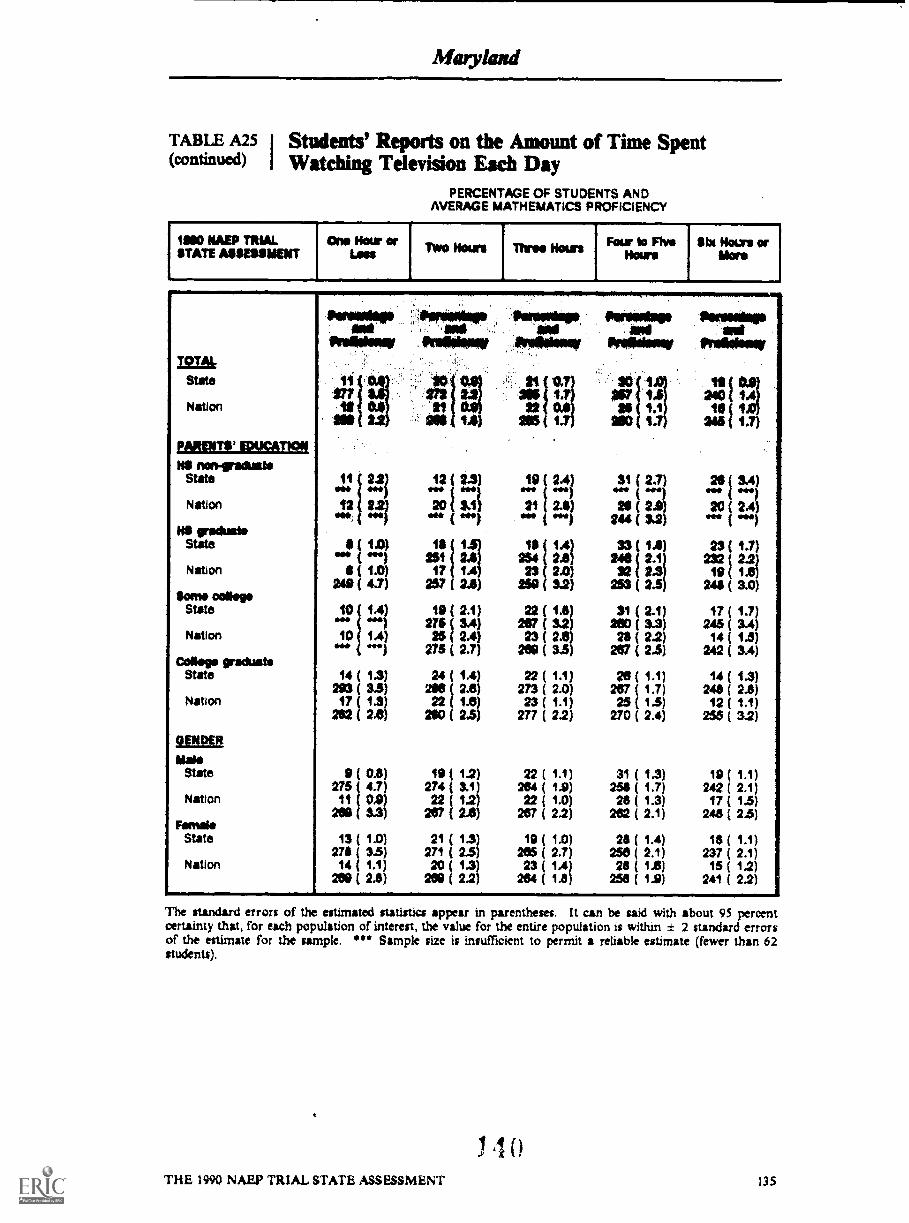
Marylaid
TABLE A25 I Students' Reports on the Amount of Time Spent(wntinued) i Watching Television Each Day
PERCENTAGE OF STUDENTS ANDAVERAGE MATHEMATICS PROFICIENCY
1NO NAEP TRIALSTATE ASSEUVENT
.
One Hour orLees 1Wo Howe
_
Three Nam For to FlveSours
litx Nous orMore
TOTAL
State
Nation
finisamsmseNS non-graduate
State
Nation
NS graduateState
Nation
Soma collegeState
Nation
Wisp graduateState
Nation
WEEMale
State
Nation
FemaleState
Nation
ONO 1.0)
20 ( Si)( *el
Veropollp, iimpro'Med
It 1.0) 12 14) 1$ ( 1.4)SIS(IsS) 2s1 2.6) 234 2.4)( 1.0) 17 14) 23 2.0)
249 ( 4.7) 257 ( 2.4) 2119 3.2)
10 ( 14).01 19 ( 2.1)276 ( 3.4)
22 (297
1.6)3.2)
10 1.4) 24 ( 2.4) 23 ( 2.4)*41 275 ( 2.7) 204 (
14 ( 1.3) 24 ( 1.4) 22 ( 1.1)293 ( 3,5) 244 2.6) 273 ( 2.0)17 ( 1.3) 22 1.4) 23 ( 1.1)
292 ( 2.4) 240 (2.5) 277 ( 2.2)
( 0.8) 19 ( 12) 22 ( 1.1)275 ( 4.7) 274 3.1) 264 ( 1.9)11 ( 0.8) 22 1.2) 22 ( 1.0)
208 ( 3.3) 207 2.6) 267 ( 22)
13 ( 1-0) 21 ( 1.3) 19 ( 1.0)278 ( 3.5) 271 ( 2.5) 265 ( 2.7)14 ( 1.1) 20 ( 1.3) 23 ( 1.4)
208 ( 2.8) 208 ( 2.2) 264 ( 1.8)
14104110111/ trellokier
$17 1410
3. 0241
2.01.1 10
24611.7)
31 ( 2,T) 24(' SA)( *In20 (
244 ( 3.2) ** 0111
1.6 23 ( 1.7)246 232 ( 2.2)32 2.3 19 ( 1.6)
253 ( 2.5 248 ( 3,0)
( 2.1) 17 1.7)200 3.3 245 3.4)2$ ( 2.2 14 ( 1.5)
207 ( 2.5 242 ( 3.4)
20 ( 1.1 14 ( 1.3287 ( 1.7 248 ( 2.825 ( 1.5 12 ( 1.1)
270 ( 2.4 255 ( 3.2)
31 (1.3) 19 ( 1.1)258 ( 1.7) 242 ( 2.1)26 ( 1.3) 17 ( 1.5)
262 ( 2.1) 246 ( 2.5)
28 ( 1.4) 1$ ( 1.1)250 ( 2.1) 237 ( 2.1)28 ( 1.0) 15 ( 1.2)
258 ( 1.9) 24/ ( 2.2)
The standard errors of the estimated statistics appear in parentheses. It can be said with about 95 percentcertainty that, for each population of interest, the value for the entire population is within ± 2 standard errorsof the estimate for the sample. *** Sample size is insufficient to permit a reliable estimate (fewer than 62students).
1 0THE 1990 NAEP TRIAL STATE ASSESSMENT 135
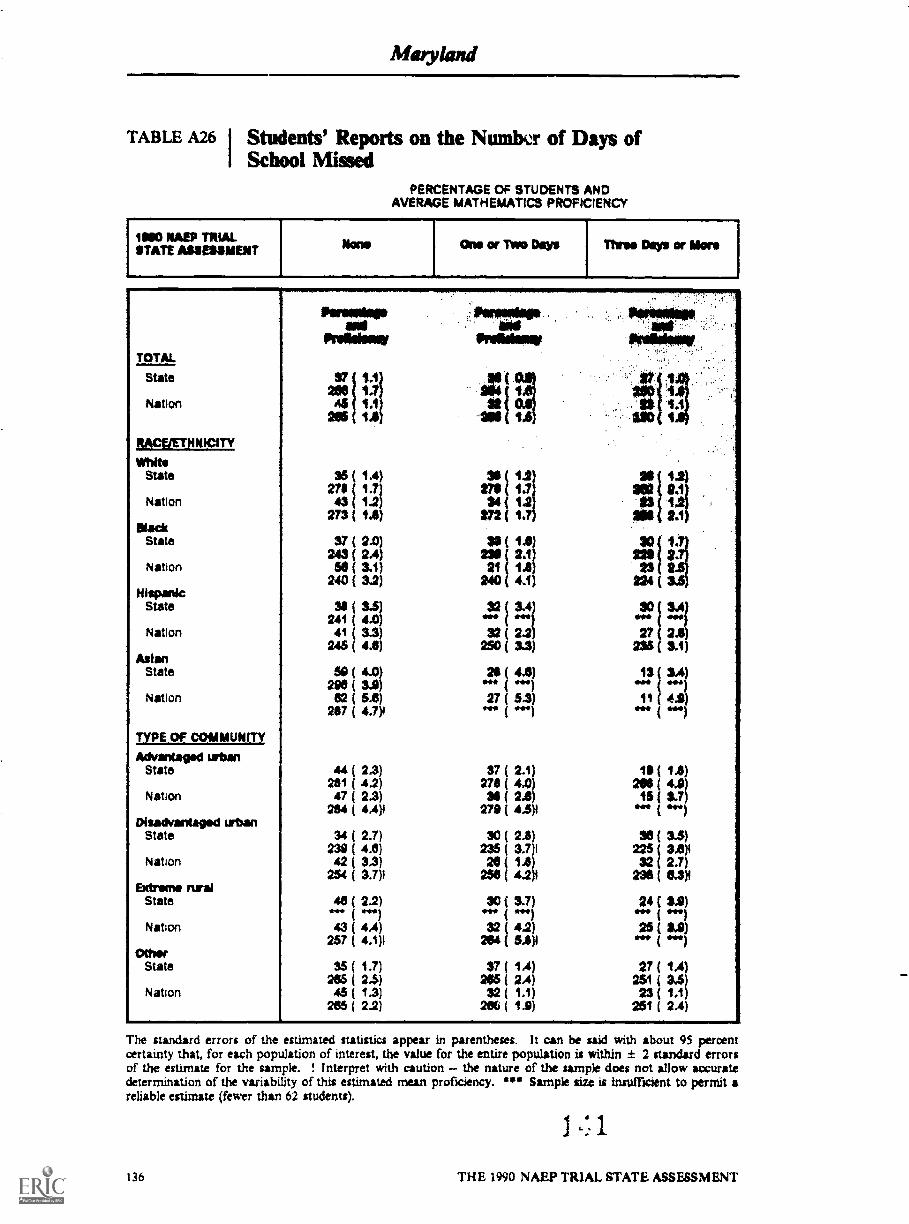
Maryland
TABLE A26 I Students' Reports on the Numbu of Days of1 School Missed
PERCENTAGE Of STUDENTS ANDAVERAGE MATHEMATICS PROFICIENCY
13110 NAEP TRIAL!TAT Meal/MUTE
,
Nano
-Ono or Ivo Days
-
Throe Days or Mors
TOTAL
flowligtaid
Proidomer
State208 1.1
Nation 45 1.11.$
BeEEIHNICI TYWhite
State 35 ( 1.4)273 ( 1.7)
Nation ( 1.2)273 ( 1.41)
SlackState 37 ( 2.0)
343 ( 2.4)Nation 56 ( 3.1)
240 ( 3.2)Hispanic
State 31 3.5241 ( 4.0
Nation 41 ( 3.3245 ( 4.8
AsianState 50 ( 4.0)
29$ 3-9)Nation 82 SA)
257 ( 4.7)1
TYPE OF COMMUNITY
Advantapd urbanState 44 ( 2.3)
281 ( 4.2)Nation 47 ( 2.3)
2e4 ( 4.4)4Disadvantaged urban
State 34 ( 2.7)2341 ( 4.2)
Nation 42 ( 3.3)254 ( 3.7)1
Extreme ruralState 40 (
*-0,.. (2.2).H.,.)
Nation 43 ( 4.4)257 ( 4.1)4
OtherState 35 ( 1.7)
265 ( 24)Nation 45 ( 1.3)
265 ( 2.2)
272 ( 1.
(SO ( 22
St ( 1.2 23 lagSO $4}
1.2)
M
2.121 1.2
33 ( 13
23 2340 4.1 224 (
2 324 *+4 232 ( 2.2)
2 3127{ ~2.6)
250 ( 3.3) 235 ( 3.1)
*44 ( .41 tl?211 ( 4.6)
27es*11 (
( 2.6
37 (
31
le ( 18)271( 4.0 211 ( *A)
15 ( 3.7)279 ( 4.5)1 owe ( ....)
30 ( 23) Se ( 34)
25$ ( 4.2)1 )4
2.7)3.6$
21( 1.3)232 6.332
235 ( 3.1$
30( 3.7) 24 ( 3.9)( ***) 114* ( ihIn
32 ( 4.2) 25 ( OM204 ( 5.2p ..... ( ...k.)
37 ( 1.4) 27 ( 1.4)265 ( 2.4) 251 ( 3.5)
32 ( 1.1) 23( 1.1)26( ( 1.9) 251 2,4)
The standard errors of the estimated statistics appear in parentheses. It can be said with about 95 percentcertainty that, for each population of interest, the value for the entire population is within 2 standard errorsof the estimate for the sample. ! Interpret with caution - the nature of the sample does not allow accuratedetermination of the variability of this estimated mean proficiency. 8" Sample size is insuffident to permit areliable estimate (fewer than 62 students).
136 THE 1990 NAEP TRIAL STATE ASSESSMENT
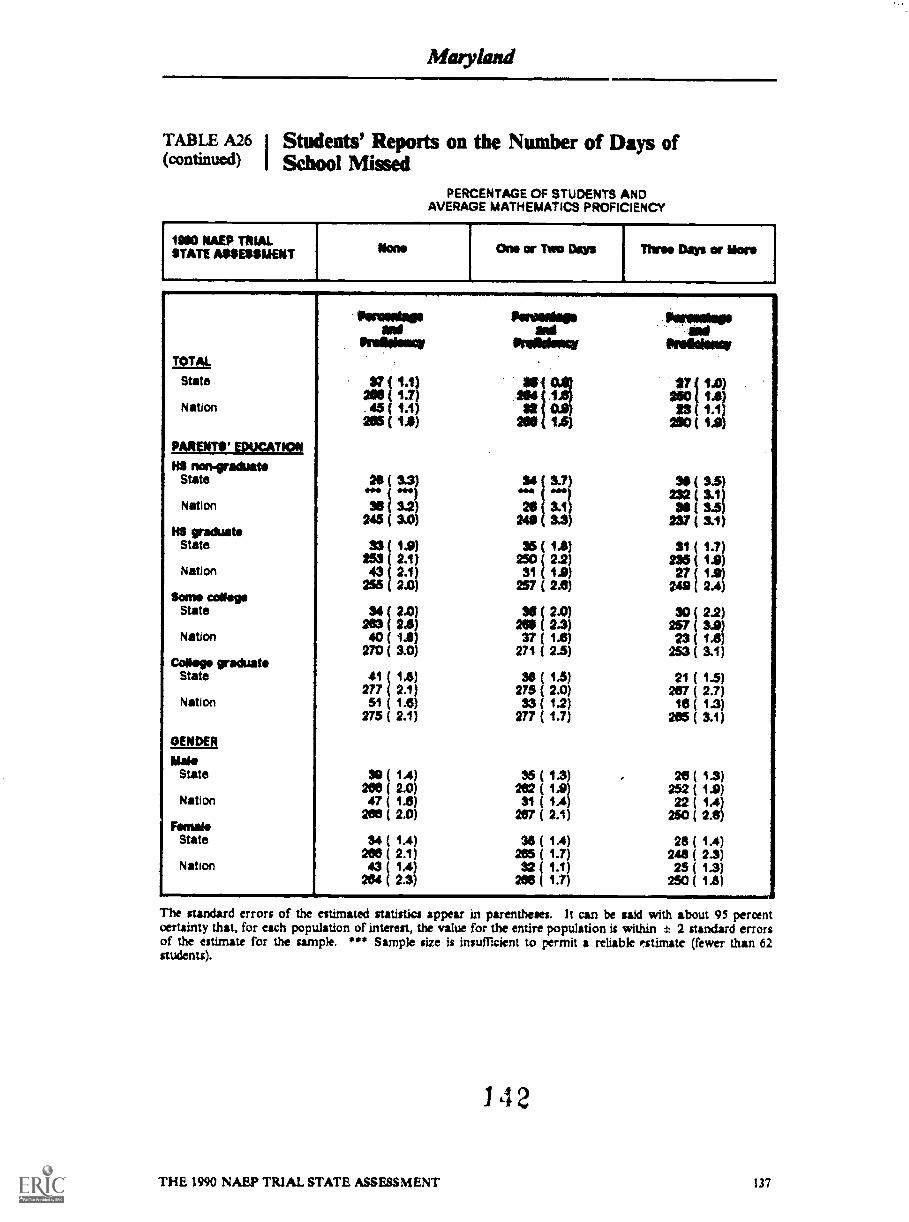
TABLE A26 I Students' Reports on the Number of Days of(continued) I school missed
PERCENTAGE Of STUDENTS ANDAVERAGE MATHEMATICS PROFICIENCY
1900 NAEP TRIALSTATE ASSESSMENT None One or Two Days Uwe* Days or Mors
TOTAL
Pore Wagsaid
Peratatios
Pilatimar 03490110,
State $7 ( 1.1)214 ( 1.7) 250 1.41
Nation 45 ( 1.1) 32 tai 33 1.1
ffifinn:lareinall205 ( 14) SO 14) 250( 1.0
NS non-graduateState 281 31 34 (31) 33 ( 3.5)
144 *Mb 232 (Nation 30 ( 3.2) 20 ( 35 ( 3.5
245 ( 3.0) 249 ( 3.31 237 ( 3.1KS graduate
State 1.9) 35 ( 14 31 ( 1.1)253 2.1) 250 ( 2.2 235 ( 14)
Nation 43 2.1) 31 ( 1.91 27(13 )235 2.0) 257 ( 24) 249 ( 2.4)
Some collegeState 34 2.0) 30 ( 2.0) 30 ( 22)
263 2.8) 281(2.3) 257 ( 3.9)Nation 40 1.3) 37 ( 115) 23 ( 1.0)
270 ( 3.0) 271 ( 2.5) 253 ( 3.1)Collor graduat
State 41 ( 14) 38 1.5) 21 ( 1.5)277 ( 2.1) 275 2.0) 207 ( 2.7)
Nation 51 ( 1.6) 33 12) 16 ( 1.3)275 ( 2.1) 277 1.7) 206 ( 3.1)
GENDER
M.State $0 ( 1.4) 35 ( 1.3) 26 1.3)
206 ( 2.0) 262 ( La) 252 ( 14)Nation 47 ( 1.6) 31 ( 1.4) 22 1.4)
206 ( 2.0) 207 ( 2.1) 250 ( 2.8)
Fen"Stet: 34 ( 1.4) 38 ( 14) 26 1.4)206 ( 2.1) 265( 1.7) 248 2.3)
Nation 43 ( 1.4) 32 ( 1.1) 25 ( 1.3)204 ( 23) 286( 250 ( 1.6)
The standard errors of the estimated statistics appear in parentheses. It can be said with about 95 percentcertainty that, for each population of interest, the value for the entire population is within ± 2 standard errorsof the estimate for the sample. *** Sample size is insufficient to permit a reliable fltirnate (fewer than 62students).
142
THE 1990 NAEP TRIAL STATE ASSESSMENT 137
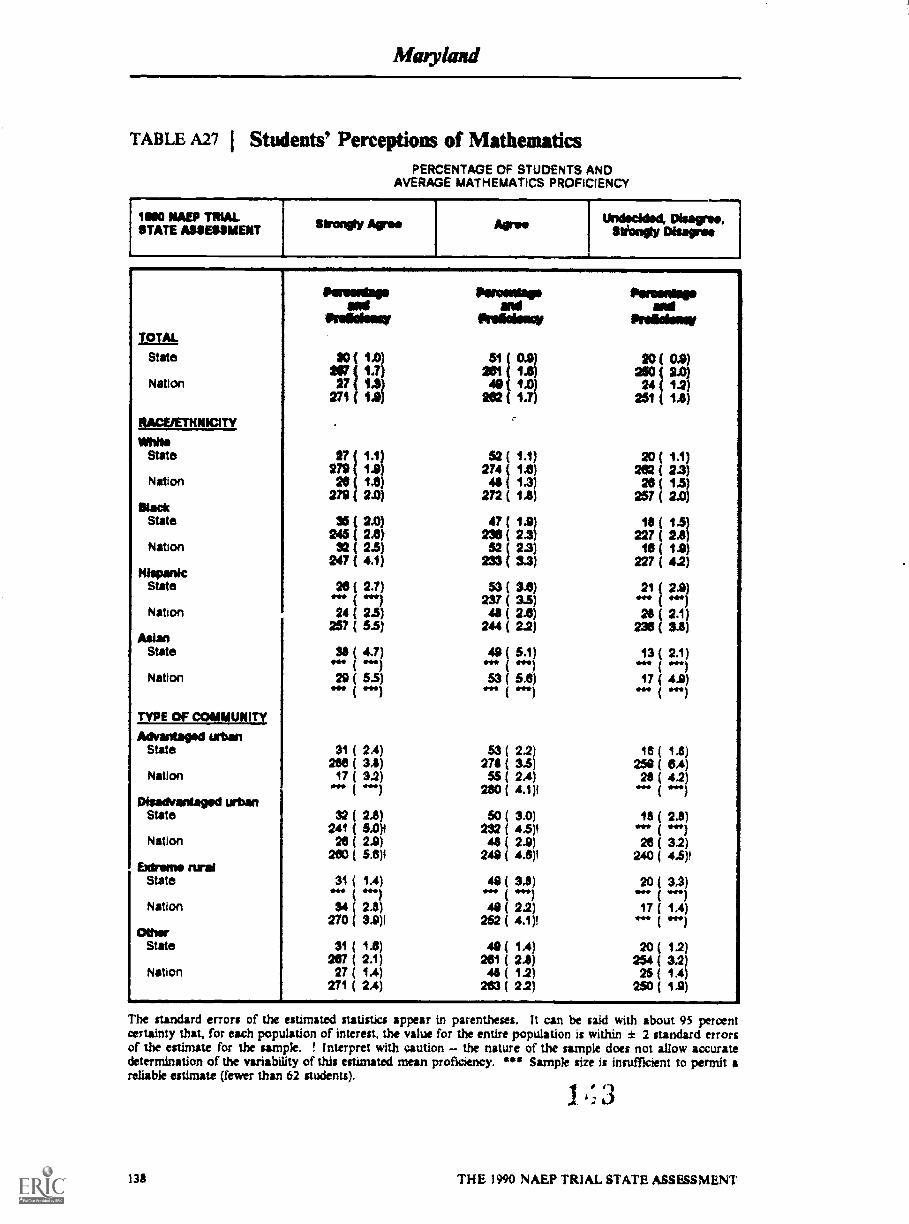
Maryland
TABLE A27 I Students' Perceptions of MathematicsPERCENTAGE OF STUDENTS AND
AVERAGE MATHEMATICS PROFICIENCY
1100 MEP TRIALSTATE ASSESSMENT Sir= Mt/ Al Imo AI Pim
Undecided, Disagree,Strongly Disagree
TOTAL
State
Nation
RACE/ETHNICITY
State
Nation
SlackState
Nation
HispankState
Nation
liallState
Nation
TYPE OF COMMUNITY
Advantaged intanState
Nation
Disadvantaged urbanState
Nation
Extreme ruraIState
Nation
OtherState
Nation
Poniumbeand
27 ( 1.1)27$ ( 1.9)
28 ( 1.8)279 ( 2.0)
35 2.0)245 2.4)
32 2$)247 4.1)
28 ( 2.7)ea*
24 ( 2.5)257 ( 5.5)
S$ ( 47)( .61
29 ( 5$)( sin
31 ( 2.4)2645 ( 3.4)
17 ( 3.2)
32 ( 2.8)241 ( 5.0)424 ( 2.9)
260 ( 5.6)4
31 ( 1.4)
34 ( 2.8)270 ( 3.9)1
31 ( 1.6)267 ( 2.1)
27 ( 1.4)271 ( 2,4)
lisramdapand
IlivasINEW
62 ( 1.1)274 ( 1.6)4$( 1.3)
272 ( 1.8)
47 ( 1.9)238 ( 2.3)52 ( 2.3)
233 ( 3.3)
$3 ( SA)237 ( 3.5)41 ( 2.0)
244 ( 22)
49 ( 5.1)
53 ( 5.8)( ire')
53 ( 2.2)274 ( 3.5)55 ( 2.4)
280 ( 4.1)1
50 ( 3.0)232 ( 4.5)14$ ( 2.9)
244 ( 4.6)1
41 ( 3.4).)411 ( 2.2)
252 ( 4.1)1
491241 ( 2.8
48 ( 1.2263 ( 22)
floremispowl
20 (250 2.0
24 1.2251 16)
20 ( 1.1)202 ( 2.3)26 ( 1.5
257 ( 2.0
16 ( 1.5)227 ( 26)
16 ( 16)227 ( 4.2)
21 ( 2.9)*4* ( Nal20 ( 2.1)
236 ( 3.4)
13 ( 2.1)gomit
17 ( 4.9)
16 ( 1.8)250 ( 6.4)28 ( 4.2)
18 ( 2.4)MI* ( *In26 ( 32)
240 ( 44)1
*4117 ( 1,4)
(
20 ( 1.2)254 ( 3.2)25 ( 1.4)
250 ( 1.9)
The standard errors of the estimated statistics appear in parentheses. It can be said with about 95 percentcertainty that, for each population of interest, the value for the entire population is within * 2 standard errorsof the estimate for the sample. Interpret with caution - the nature of the sample does not allow accuratedetermination of the variability of this estimated mean proficiency. *** Sample size is insufficient to permit areliable estimate (fewer than 62 students).
143
131 THE 1990 NAEP TRIAL STATE ASSESSMENT
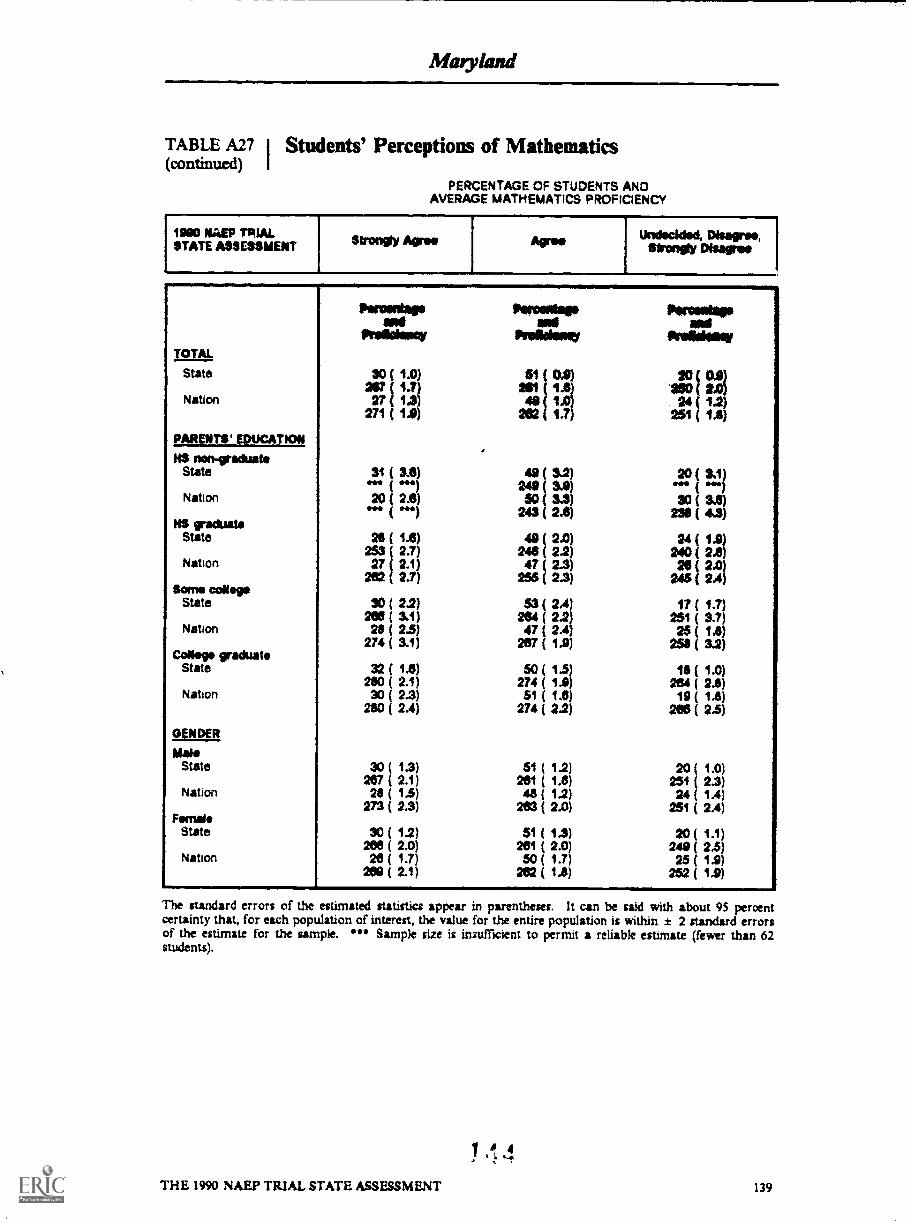
Maryland
TABLE A27 I Students' Perceptions of Mathematics(continued) I
PERCENTAGE OF STUDENTS ANDAVERAGE MATHEMATICS PROFICIENCY
1990 NAEP TRIALSTATE ASSESSMENT
...
611'0R9V Agree
_
Arse
,
Undecided, Disagree,"ma* Memo
TOTAL
Perientige
Mildew
20727 1.3
271 12
31 ( 3.1( .44
20 ( 2.0).44)
26 ( 1.6)253 C 2.7)27 2.1)
262 21)
30 22)
State
Nation
PARENTS' !VOCATION
NS non-graduateState
Nation
NS gradualsState
Nation
Soma colterState
260 ( 3.1)Nation 20 ( 2.5)
274 ( 3.1)College graduate
State 32 ( 1.6)260 ( 2.1)
Nation 30 ( 2.3)2$0 ( 2.4)
GENDER
M.State 30 ( 1.3)
267 ( 2.1)Nation 2$ ( 1.5)
273 ( 2.3)Amato
State 30 ( 1.2)208 ( 2.0)
Nation 26 ( 1.7)209 ( 2.1)
Pamstallawl
Ihreadesmw
100,0***911and
foralisiow
3111 11 1502° $(.149 1 24 ( 1.2
202 1.7 251 ( 1.$
49 3.2)246 3.9)50 3.3)
243 ( 2.9)
49 ( 2.0)24$ ( 2.2)47 ( 2.1)
255 ( 23)
53 ( 2.4)264 ( 2.2)47 ( 2.4)
267 ( 1.9)
50 ( 13)274 ( 1.9)51 ( 1.0)
274 ( 2.2)
51 ( 1.2)281 ( 1.0)48 ( 1.2)
263 ( 2.0)
51 ( 1.3)261 ( 2.0)50 ( 1.7)
262 ( 12)
20 ( 3.1?**a
30 ( 3.11)231 ( 4.3)
24 ( 1.9)240 ( 2.6)24 ( 2.0)
245 2.4)
17 ( 1.7)251 ( 3.7)25 ( 1.6)
251 ( 32)
1$ ( 1.0)264 2.8)19 1.8)
206 ( 2.5)
20 ( 1.0)251 ( 2.3)24 ( 1.4)
251 ( 2,4)
20 ( 1.1)249 ( 2$)25 ( 1.9)
252 ( 1.9)
The standard errors of the estimated statistics appear in parentheses. It can be said with about 9$ perctentcxrtainty that, for each population of interest, the value for the entire population is within ± 2 standard errorsof the estimate for the sample. *** Sample size is ituufficient to permit a reliable estimate (fewer than 62students).
THE 1990 NAEP TRIAL STATE ASSESSMENT 139

Acknowledgments
The design, development, analysis, and reporting of the first Trial State Assessment was truly acollaborative effort among staff from State Education Agencies, the National Center for Education Statistics(NCES), Educational Testing Service (ETS), Westat, and National Computer Systems (NCS). The pmgrambenefitted from the contautions of hundreds of individuals at the state and local levels Governors, ChiefState School Officers, State and District Test Directors, State Coordinators, and district administrators whotirelessly provided their wisdom, experience, and hard work. Finally, and most importantly, NAEP is gratefulto the students and school staff who participated in the Trial State Assessment.
Special recognition is due the Council of Chief State School Officers (CCSSO) far its considerablecontributions to the program, especially its management of the National Assessment Planning Project. Thatproject resulted in the mathematics framework and objectives for the assessment and recommendationsabout reporting the results of the program. In particular, we note the significant contributions of RamsaySe !den, Director of the State Education Assessment Center for the CCSSO and the members of the Steering.Mathematics Objectives, and Analysis and Reports Committees of the National Assessment Planning Project.
The Trial State Assessment was funded through NCES, in the Office of Educational Research andImprovement of the U.S. Department of Education. Emerson Elliott, NCES Acting Commissioner, providedconsistent support and guidance. The staff particularly Gary Phillips, Eugene Owen, Stephen Gornian,Maureen Treacy, and Raul Garza -- worked closely and collegially with ETS, Westat, and NCS staff andplayed a crucial role in all aspects of the program.
The members of the National Assessment Governing Board (NAGB) and NAGB staff also deservecredit for their advice and guidance.
We owe a great deal to the Mathematics Item Development and Mathematics Scale AnchoringPanels. These people -- from school districts, colleges and universities, and State Education Agenciesworkcd tirelessly to help ETS staff develop the assessment and a framework for interpreting the results.
Under the NAEP contract to ETS, Archie Lapointe served as the project director and Ina Mullis asthe deputy director. Statistical and psychometric activities were led by John Mazzeo, with consultation fromEugene Johnson and Donald Rock. John Barone managed the data analysis activities; Jules Goodison, theoperational aspectg Walter MacDonald and Chancey Jones, test development; David Hobson, the fiscalaspects; and Stephen Koffier, state services. Sampling and data collection activities were carried out byWestat under the supervision of Renee Slobasky, Keith Rust, Nancy Caldwell, and the late Morris Hansen.The printing, distribution, and procescing of the materials were the responsibility of NCS, under the directionof John O'Neill and Lynn Zaback.
The large number of states and territories participating in the first Trial State Assessment introducedmany unique challenges, including the need to develop 40 different reports, customized for each jurisdictionbased on its characteristics and the results of its assessed students. To meet this challenge, a computerizedreport generation system was built, combining the speed and accuracy of computer-generated data with highresolution text and graphics normally found only in typesetting environments. Jennifer Nelson created thesystem and led the computer-based development of the report. John Mazzeo oversaw the analyses for thisreport. John Ferris, David Freund, Bruce Kaplan, Edward Kulick, and Phillip Leung collaborated to generatethe data and perform analyses. They were assisted by Drew Bowker, Laura McCamley, and Craig Pizzuti.Debra Kline coordinated the efforts of the data analysis staff. Stephen Koffier wrote the text for the report.Kent Ashworth was responale for coordinating the cover design and final printing of this report.
Special thanks are also due to many individuals for their invaluable assistance in reviewing thereports, especially the editors who improved the text and the analysts who checked the data.
1
U.S. GM:CRAB:NT PRINTING orrics : 1991 0 - 293-275 QL MK. 19/

![DOCUMENT RESUME ED 074 039 SP 006 217 [Teacher Prepara ... · DOCUMENT RESUME. ED 074 039 SP 006 217. TITLE [Teacher Prepara INSTITUTION Immaculate Heart PUB DATE [71] NOTE. 58p](https://img.pdfslide.us/doc/110x75/5ebcba64b7f5a359d73befaa/document-resume-ed-074-039-sp-006-217-teacher-prepara-document-resume-ed-074.jpg)