Embed Size (px)
Citation preview
2003 Everglades Consolidated Report Chapter 3: Agricultural BMPs
3-1
Chapter 3: Performance andOptimization of Agricultural Best
Management Practices
Pamela Sievers, Douglas Pescatore, Samira Daroub1,J.D. Stuck1, Jose Vega, Paul McGinnes and Stuart Van Horn
SUMMARY
Nutrient-rich discharges from the Everglades Agricultural Area (EAA) have been identifiedas contributors to Everglades enrichment and are the primary focus of the Everglades RegulatoryProgram and the Everglades Construction Project (ECP). Substantial efforts in Best ManagementPractices (BMP) implementation, research, and education have been directed at reducingphosphorus (P) loading from the EAA basin as part of the Everglades Program. These combinedefforts are responsible for a reduction trend in the loads and concentrations of total phosphorus(TP) attributable to the EAA basin and conveyed to the Everglades Protection Area (EPA).
The objective of this chapter is to provide an update on the effectiveness of BMPs, asdemonstrated by the implementation of the Everglades Regulatory Program and research in theEAA basin. Information includes the current year’s data as well as recommendations andconclusions, which are similar to those presented in previous years.
The overall effectiveness of BMPs is best demonstrated by the measured P load reduction inthe EAA basin since BMPs were implemented, compared to a 10-year, pre-BMP base period. TheBMP Regulatory Program in the EAA basin, mandated by State of Florida legislation, is oneaspect of the South Florida Water Management District’s (SFWMD’s or District’s) EvergladesRestoration Program. The goal of the BMP regulatory program is to achieve a 25-percentreduction in P load from the EAA basin. This reduction is determined by comparing measured Pdischarges from District structures for each water year (May 1 through April 30) to the pre-BMPbase period of October 1, 1978 through September 30, 1988. To factor out variability caused byrainfall, the base period P discharges are adjusted for the differences in the amount anddistribution of rainfall for the current period. The rule requires the District to evaluate the datacollected to assess the general trend in P load reduction, determine whether the EAA basin is incompliance with the P load reduction requirement, and publish the results annually. The EAAbasin has been in compliance since the first full year of BMP implementation (Water Year 1996[WY96]).
1 University of Florida Institute of Food and Agricultural Sciences, Everglades Research and EducationCenter, Belle Glade

Chapter 3: Agricultural BMPs 2003 Everglades Consolidated Report
3-2
The phosphorus load discharged from the EAA basin for WY02 is as follows:
� WY02 (measured with BMPs in place) 101 tons
� Base period (predicted with WY02 adjusted rainfall) 227 tons
The relative difference between the WY02 measured tonnage and the predicted base periodtonnage (adjusted for rainfall) indicates a 55-percent reduction in TP load. In analyzing datatrends, the three-year trend ending with WY02 equates to a 59-percent reduction of thephosphorus load from the EAA basin, with a three-year, flow-weighted mean concentration of 92parts per billion (ppb). The latest load reduction continues the trend of consistently exceeding the25-percent load reduction requirement. In evaluating these data it is important to note that only aportion of the load from the EAA goes directly to the EPA. The remaining load is apportioned toother receiving bodies, including Lake Okeechobee, the Stormwater Treatment Areas (STAs), theRotenberger and Holey land Wildlife Management areas and the C-51 canal. Additionally, thisload reduction is specific to the EAA and does not account for all phosphorus loads entering theEverglades from other sources, including Lake Okeechobee releases (environmental, urban watersupply and regulatory), 298 diversions, C-139, C-11 West, L-28, the feeder canal basin, ACMEbasin B, the North Springs Improvement District, the North New River Canal basin, C-111, andthe STAs. These other sources and their relative contributions are discussed further in Chapter 1,Chapter 8A and Chapter 8B of the 2003 Everglades Consolidated Report (2003 ECR).
This chapter discusses the methodology for the EAA basin calculations and includes asummary of the permit-level data from individual permittee-operated discharge structures withinthe EAA basin. These permit-level data (provided in Appendix 3-1) will only be used for Chapter40E-63, Florida Administrative Code (F.A.C.), compliance determination if the EAA basin doesnot meet the 25-percent P load reduction requirement. A direct statistical relationship between thepermit level loads and the EAA basin level loads has been difficult to establish because of therecycling effect caused by EAA basin canal water and individual farm discharges being drawnback into the farms for irrigation or freeze protection. It should be noted that the primaryirrigation source for the EAA is Lake Okeechobee, for which TP concentrations have typicallybeen higher than EAA basin discharges since the implementation of BMPs when compared on awater year-by-water year basis. Additionally, several factors affect P load at the farm level,making it difficult to make comparisons or draw conclusions on differences in the level ofperformance between farms. However, these data are used to optimize BMPs by making relativecomparisons between water years for the same farm. These data are also used to determine creditstoward the Everglades Agricultural Privilege Tax mandated by the Everglades Forever Act(EFA). As of WY02 the EAA basin has earned enough credits to allow reduction of theEverglades Agricultural Privilege Tax to the minimum annual rate of $24.89 per acre throughWY12. A summary of the Everglades Agricultural Privilege Tax data is provided in Appendix3-1.
In addition to the Everglades Regulatory Program, the EFA and Chapter 40E-63, F.A.C.require EAA landowners, through an organization called the EAA Everglades Protection District(EAA-EPD), to sponsor a program of BMP research, testing and implementation to monitor theefficacy of established BMPs. This has been accomplished through the University of FloridaInstitute of Food and Agricultural Sciences (IFAS) EAA BMP farm-scale study sponsored by theEAA-EPD and the Florida Department of Environmental Protection (FDEP). In addition tocollecting data to assess the effectiveness of BMPs, the IFAS research in the EAA includesidentification of short- and long-term affects of BMPs on soils and crops; evaluation of specific

2003 Everglades Consolidated Report Chapter 3: Agricultural BMPs
3-3
conductance and total dissolved P in farm discharges; and evaluation of particulate matter in farmand EAA drainage canals.
IFAS results continue to confirm that BMPs are highly effective in reducing P loadsdischarged from participating farms. IFAS concludes that additional reductions in P loading canonly be achieved by continuing to analyze the mechanisms that contribute to BMP efficacy andoptimization. From the study of particulate P transport, a major component of the IFAS research,it has been concluded that the primary source of particulate P exported in the EAA is fromfloating aquatic plants and related biological growth (settled plankton, filamentous algae andmacrophyte detritus) in the main farm canal system. Another IFAS research component includesa lysimeter study (results to be released in spring 2003) conducted to demonstrate short- andlong-term effects of BMPs on soils and crops. There is also ongoing analysis of specificconductance levels in the EAA; however, at this time there are insufficient data available to drawconclusions concerning the original hypothesis that agricultural practices, changes in hydrology,and connate seawater are factors contributing to elevated levels of specific conductance. Thelatter part of this chapter provides an update on the various components of IFAS research in theEAA since publication of the 2002 Everglades Consolidated Report.
The combined efforts from the Everglades Regulatory Program in the EAA and thecooperative program of research, implementation and testing of BMPs over the past several yearscoincide with appreciable reductions in TP concentrations and loads attributable to the EAA basinthat are ultimately conveyed to the Everglades. The regulatory program and IFAS research datahave consistently confirmed that existing BMPs are reducing P loading from the EAA basin. Thisis evident in the fact that the EAA basin has consistently exceeded the 25 percent load reductionrequirement since BMPs were implemented; however, it is still unclear whether further P loadreductions at the farm level will result in additional significant reductions of the overall EAAbasin P load. It is recommended that research, monitoring and education efforts continue throughaggressive outreach programs to expand the BMP message and in an effort to gain a betterunderstanding of optimization techniques for BMPs and apply “lessons learned” to individualpermittees, as well as to other regions that discharge to the Everglades.
INTRODUCTION
A significant component of the EFA establishes both interim and long-term water qualitygoals to ultimately achieve Everglades restoration and protection. As mandated by the EFA, theState of Florida Environmental Regulation Commission (ERC) will set the long-term Pconcentration, based on available research, or it will default to 10 parts per billion (ppb). Thelong-term goal is to combine point source, basin-level, and regional solutions in a system-wideapproach to ensure that all waters discharged to the Everglades are achieving water quality goals.The interim design goal encompasses current activities, the Everglades Regulatory Program andthe Everglades Construction Project (ECP) to achieve an annual average P dischargeconcentration of 50 ppb for the final discharge from the ECP (STA outflow). Surface watertributary sources to the ECP (STA inflows) include the discharges from the EAA basin, Chapter298 water control district diversions, the C-139 basin, and Lake Okeechobee normal releases(environmental, water supply, and regulatory). See the Chapter 1, Figure 1-1 location map formore information.
Agriculture is the predominant land use in both the EAA and the C-139 basins. Nutrient-richwater from both areas contributes to Everglades enrichment and is the primary focus of theEverglades Regulatory Program and the ECP. The Everglades Regulatory Program provides for
Chapter 3: Agricultural BMPs 2003 Everglades Consolidated Report
3-4
the implementation of BMPs as point source treatment upstream of the STAs. The STA designsare based on the premise that the EAA basin discharges should have a 25-percent reduction andthe C-139 basin should not exceed the historic P load when compared to the pre-BMP base periodof October 1, 1978 through September 30, 1988 (when adjusted proportionately for rainfall).
The EAA basin is approximately 500,000 acres located south of Lake Okeechobee withineastern Hendry and western Palm Beach counties. The EAA encompasses an area ofapproximately 1,122 square miles of highly productive agricultural land comprised of richorganic peat or muck soils (Figure 3-1). The area is considered one of Florida’s most importantagricultural regions; approximately 77 percent of the EAA is devoted to agricultural production.The major crops in the EAA basin include sugar cane, vegetables, and sod, with secondary cropsin rice and citrus. The EAA basin ultimately discharges to the Everglades through STA-1W,STA-2 and STA-6, and will eventually discharge through STA-1E and STA-3/4 whenconstruction is complete. The BMP Regulatory Program was initiated in the EAA in 1992.Coincident with BMP implementation by EAA basin landowners, the annual P load from theEAA basin has consistently been reduced by levels greater than those required by rule.
The C-139 basin is approximately 170,000 acres located southwest of Lake Okeechobeewithin eastern Hendry County adjacent to the EAA basin (Figure 3-1). The C-139 basinultimately discharges to the Everglades through STA-5. Amendments to Chapter 40E-63, F.A.C.,effective January 24, 2002, require implementation of a BMP regulatory program in the C-139basin in accordance with the EFA. The rule establishes a compliance methodology similar to thatof the EAA basin (disregarding the 25 percent load reduction criteria) to determine the annualaverage P load limitation for the C-139 basin and a plan for BMP implementation to minimize Pin offsite discharges. The amendments require basin landowners to obtain permits for BMP plansand report annually to the District on the status of BMP implementation. WY03 will be the firstyear for compliance determination in the C-139 basin. These efforts are intended to ensure thatdischarges from the C-139 basin meet established P load limits and ultimately reduce the nutrientloading contribution to the northern Everglades. Until BMPs are fully implemented in the C-139basin, this chapter will focus on the EAA basin.
The implementation of BMPs is the cornerstone of P source control in the EAA. BMPs havebeen implemented in the EAA basin for seven complete compliance years and have provensuccessful. Additionally, ongoing BMP research initiated as early as 1992 in the EAA basincontinues to confirm varying degrees of effectiveness in TP reduction through the implementationof combinations of water management practices, fertilizer application control practices, andparticulate matter control practices. This chapter presents a summary of the EvergladesRegulatory Program, describes the BMPs implemented, explains the compliance methodology,updates data summaries with WY02 EAA basin-level and permit-level monitoring results, andsummarizes the findings of the ongoing IFAS research on BMPs in the EAA. It is hoped thatsimilar water quality improvements through implementation of BMPs will also be realized inurban areas that are tributary to the EPA. See Chapter 8B for a discussion on how implementingBMPs is one of several strategies being administered in the urban and tributary basins within theEverglades Stormwater Program.
UPDATE ON EVERGLADES REGULATORY PROGRAM
The Everglades Regulatory Program, Chapter 40E-63, F.A.C. (“Rule 40E-63”) states thatlands in the EAA that release water that ultimately makes use of, connects to, releases to or

2003 Everglades Consolidated Report Chapter 3: Agricultural BMPs
3-5
discharges to the Works of the District (WOD) within the Everglades require a permit. Rule40E-63 permits approve a BMP plan and a water quality monitoring plan for each sub-basin.
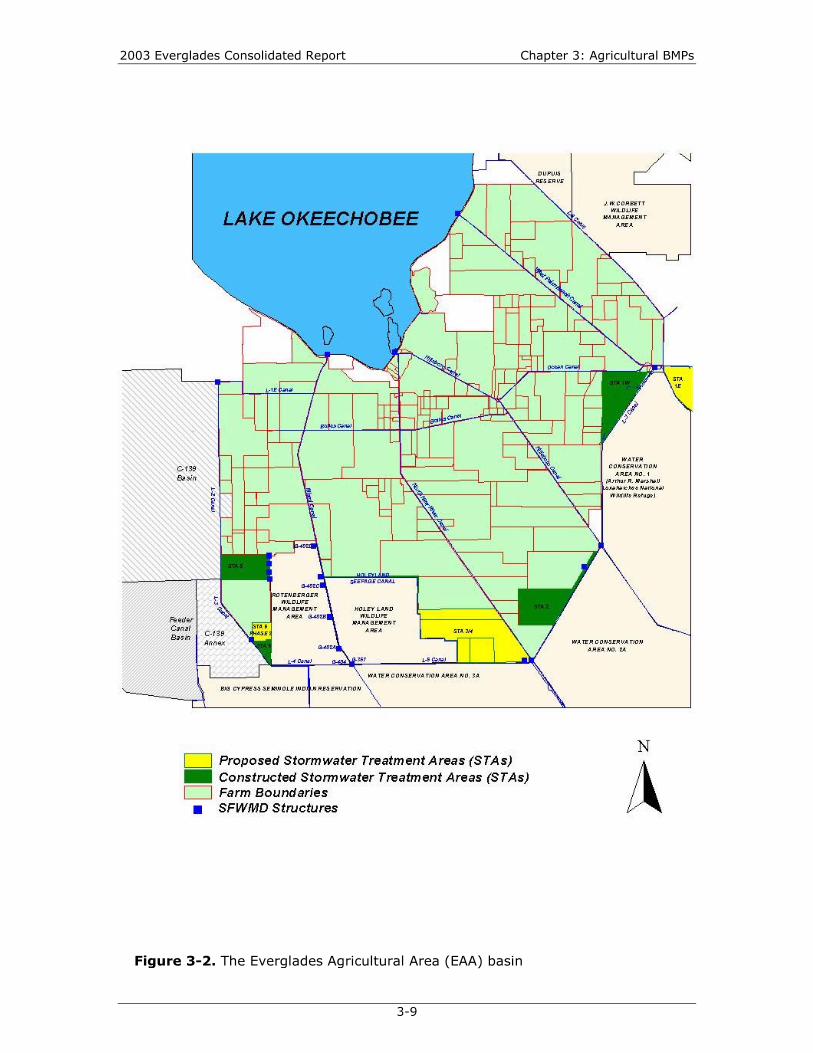
Currently, there are 33 EAA basin Everglades WOD permits, including approximately 210sub-basins and 300 privately owned water control structures discharging into the District canalsin the EAA and encompassing an area of approximately 500,000 acres (Figure 3-2). Theregulated area is described by rule and thus remains static. The area represented by a singlepermit varies substantially between 120 and 92,000 acres. There are annual differences in thetotal permitted acreage, typically the result of acreage being removed from permits as areas areconverted from agricultural production to Stormwater Treatment Areas.
The minimum target for BMP plan development in the EAA basin was established as 25BMP equivalents, or points (Table 3-1). By using the BMP-equivalents approach, each permitteehas the flexibility to develop a BMP plan that is best suited for site-specific soil types, hydrologyand crop conditions. For each proposed BMP, the permittee must consider how the BMP will beimplemented, how staff responsible for BMP implementation will be trained, and how BMPimplementation will be documented.
BEST MANAGEMENT PRACTICE PLANS
Each EAA WOD permit approves an onsite implementation plan for BMPs (BMP plan). TheBMP plan includes operational programs or physical enhancements designed to reduce P levels indischarges to the WOD. The District is responsible for ensuring that a base level of BMPs isestablished for each permit area and that BMP plans between different permittees are consistentand comparable. To accomplish this, a system of BMP “equivalents” was developed by assigningpoints to BMPs within three basic categories: water management practices, nutrient managementpractices and control of particulate matter. BMP research has been conducted within the EAAregion, with positive results on the relative effectiveness of BMPs. IFAS data indicate, however,that there can be a wide range of P reduction levels for any one BMP depending onsite-specific conditions. For example, IFAS data indicate nutrient control practices maypotentially reduce P load from 0 to 40 percent, while water management BMPs may yield from 0-to 90-percent P reductions for individual farms. The equivalent points assigned to each BMP,shown in Table 3-1, do not directly correlate to individual BMP effectiveness. Points wereoriginally based on the review of numerous reports and publications produced by UF/IFAS andon best professional judgment and cooperative workshops conducted among affected landowners,consultants, District staff and the general public. The BMP points system has proven successful inensuring a consistent base level of BMPs between permitted areas.
Post-permit compliance activities include verification of the implementation of the approvedBMP plans by two methods: (1) annual submittal of BMP implementation reports by thepermittee, and (2) in-field visual observations and review of documentation. The goal is toconduct onsite verifications annually, but this can vary depending on circumstances. Onsiteverifications allow District staff to discuss BMP strategies and optimization of current BMPpractices with permittees. The BMP site verifications conducted to date indicate that permitteeshave implemented their respective BMP plans and are taking a proactive approach to reviewingand voluntarily improving their plans, where possible.

Chapter 3: Agricultural BMPs 2003 Everglades Consolidated Report
3-6
Figure 3-1. The Everglades Agricultural Area (EAA)

2003 Everglades Consolidated Report Chapter 3: Agricultural BMPs
3-7
BMP PTS DESCRIPTION
WATER MANAGEMENTPRACTICES MINIMIZES THE VOLUME OF OFF-SITE DISCHARGES
½ Inch Water Detention1 Inch Water Detention
510
Delay pumping based on rain gage measurements. Detention (in farmcanals and soil profile) measured on a per event basis – rainfall vs. runoff
Improved Infrastructure 5Water table management plan; controlling levels in canals and fieldditches using internal water control structures, fallow fields, aquatic covercrop fields, prolonged crop flood; effective irrigation and discharge plans
Other tbde.g. Properly constructed and maintained storage system; greaterdetention with water management plan having target water table levelsand structure operating procedures; monitored water table
NUTRIENTCONTROL PRACTICES
MINIMIZES THE MOVEMENT OF NUTRIENTS OFFSITE* Limited Applicability
Nutrient ApplicationControl 2 ½
Uniform and controlled boundary nutrient application (e.g. banding at theroot zone; pneumatic controlled-edge application such as AIRMAX);calibrated application equipment; setbacks from canals
Nutrient Spill Prevention 2 ½ Formal spill prevention protocols (handling, transfer, education)Soil Testing 5 Avoid excess application by determining P requirements of soil.Plant Tissue Analysis 2 ½ Avoid excess application by determining P requirements of plant
Split P Application* 5 Applying P proportionately at various times during the growing seasonTotal application not exceeding recommendation
Slow Release P Fertilizer* 5 Applying specially treated fertilizer that breaks down slowly thus releasingP to the plant over time
PARTICULATE MATTERAND SEDIMENT CONTROLS
MINIMIZES THE MOVEMENT OF PARTICULATE MATTER ANDSEDIMENTS OFF-SITE(Each consistently implemented across the entire basin acreage.)
Any 2
Any 4
Any 6
2 ½
5
10
� leveling fields � cover crops� ditch bank berm � raised culvert bottoms� sediment sumps in canals � stabilized ditch banks� sediment sumps in field ditches � aquatic plant management� canal/ditch cleaning program � debris barriers at outfall� slow drainage velocity near pumps� sediment sump upstream of drainage structure
PASTURE MANAGEMENT PLAN FOR ON-FARM OPERATION AND MANAGEMENT PRACTICES
Pasture Management 5
� reduce cattle waste nutrients in discharges by "hot spot" management,i.e. plans for placement of drinking water, feed and supplements,cowpens and shade� low cattle density
OTHER BMPS OTHER PRACTICES PROPOSED
Urban Xeriscape 5 Use of plants that require less water and fertilizerDetent. Pond Littoral Zone 5 Vegetative filtering area for on-site stormwater runoffOther BMP Proposed tbd BMP proposed by permittee and accepted by SFWMD
Table 3-1. Best Management Practices summary and “BMP equivalent” points
Chapter 3: Agricultural BMPs 2003 Everglades Consolidated Report
3-8
COMPLIANCE DETERMINATION
Within the EAA basin, monitoring is performed at two levels:
1. EAA basin-level monitoring by the District
2. Individual sub-basin or farm-level monitoring by the owner/operator of private water controlstructures discharging within the EAA basin
The primary means for determining the success of the Rule 40E-63 program is throughDistrict data collection at the EAA basin level. Data from District structures are used to calculatethe measured TP load discharged from the EAA basin. TP load, as opposed to concentration, is amore representative measure of compliance for the EAA basin because it accounts for bothconcentrations and volume. Discharge P concentrations and quantity are recorded at all inflowand outflow points, including the following: S-2/351 complex, S-3/354 complex, S-352, S-5Acomplex, S-6, S-7, S-150, S-8, G-136, G-200, G-328, G-344A, G-344B, G-344C, G-344D, G-349B, G-350B, G-600, G-410, G-402A, G-402B, G-402C, G-402D, G-404, G-357, EBPS3 andESPS2 (Figure 3-2). The TP loads measured at these structures collectively determine primarycompliance for all EAA WOD permits. For primary compliance the EAA basin must demonstratea 25-percent reduction in load annually compared to the pre-BMP base period.
A secondary method of program compliance measurement is through individual sub-basin(“permit level” or “farm level”) water quality monitoring conducted by the permittee.Permit-level monitoring will only be used for compliance determinations if the EAA basin doesnot meet the 25-percent load reduction requirement. Permit-level data are also used to determinecredits toward the Everglades Agricultural Privilege Tax mandated by the EFA (Section373.4592(6), Florida Statutes). See Appendix 3-1, Table 2 for a summary table of the tax credits.Permittee water quality monitoring results are not used to calculate the TP reduction at the EAAbasin level.
EAA BASIN-LEVEL MONITORING RESULTS
Since the implementation of BMPs required by the Everglades Regulatory Program, P loadsfrom the surface water runoff attributable to the lands within the EAA basin have shown a trendof reductions. To interpret P measurements taken at inflow and outflow water control structuresdischarging from the EAA basin (Figure 3-2), it is important to recognize that water leaving theEAA basin through these structures is a combination of EAA farm- and urban-generated runoff,and water passing through the EAA basin canals from external basins. This “pass through” waterincludes discharges from Lake Okeechobee and from Chapter 298 water control district diversionareas (see Chapter 4A for a description of the diversion construction projects). These othersources influence the water quality within the EAA. For example, Lake Okeechobee discharges tothe EAA have typically had higher TP concentrations than EAA basin discharges since theimplementation of BMPs when compared on a WY-by-WY basis. Therefore, separate accountingof P loads from various sources is required to develop accurate conclusions about P loadsoriginating from the EAA basin. See Chapter 8A for further discussion.
2003 Everglades Consolidated Report Chapter 3: Agricultural BMPs
3-9
Figure 3-2. The Everglades Agricultural Area (EAA) basin
Chapter 3: Agricultural BMPs 2003 Everglades Consolidated Report
3-10
The reported P loads attributed to the farms, cities and industries within the EAA basin should notbe confused with the total P load being delivered to the Everglades. In fact, much of the flowleaving the EAA basin currently discharges to an STA for further treatment. With the completionof STA 3/4, all flow leaving the EAA basin will discharge to an STA prior to entering theEverglades. The accounting of tributary sources and flow configurations to the Everglades iscomplex. A comprehensive discussion of other sources and P loads discharged to the Evergladesfor WY02 can be found in chapters 8A and 8B of the 2003 Everglades Consolidated Report.
The EFA specifically mandates a method to measure and calculate the annual EAA basinexport of P in surface water runoff from EAA lands (farms, cities and industry). Thesecalculations are adjusted for the hydrologic variability associated with rainfall and surface waterdischarges over time. These adjusted equations attempt to predict what the average annual total Pload would have been for the EAA basin during the base period if the current water year’s rainfallamount and monthly distribution had occurred during the base period. The calculations for theannual “percent reduction in phosphorus” are then determined simply as the relative differencebetween the measured annual loads and the corresponding predicted average annual base periodloads.
EAA Basin Annual Phosphorus Measurements and Calculations
The first year of the 25-percent reduction compliance measurement mandated by statuteoccurred during WY96 (May 1995 through April 1996). Phosphorus load reductionmeasurements are conducted and reported annually. The EAA basin P loads and concentrationsare determined in accordance with procedures specified in the Everglades Regulatory Program(Rule 40E-63) and the EFA. The data for all calculated years are summarized in Tables 3-2 and3-3. The observed and predicted (base period rainfall adjusted) data for the EAA phosphoruscalculations and annual rainfall and flow measurements are presented in Table 3-3. The P valuespresented are attributable only to the EAA basin (farms, cities and industry) and do not representthe cumulative P being discharged to the Everglades from all sources. The data for WY02 aresummarized below.

2003 Everglades Consolidated Report Chapter 3: Agricultural BMPs
3-11
WY02 EAA Total Phosphorus Load
Estimated P load from the EAA during the base period years adjustedfor WY02 rainfall amount and distribution (1979 to 1988)
227 tons
Actual WY02 P load from the EAA with BMPs implemented 101 tons
WY02 P load reduction (relative difference) 55%
Three-year average P load reduction 59%
WY02 EAA Phosphorus Concentration (ppb)
Actual annual average EAA P concentration prior to BMPimplementation (1979 to 1991)
173 ppb
Actual WY02 P concentration from the EAA with BMPs implemented 77 ppb
Three-year flow-weighted mean P concentration 92 ppb
Table 3-2. Summary of EAA basin P calculations

Chapter 3: Agricultural BMPs 2003 Everglades Consolidated Report
3-12
TIME WY80�
WY91Pre-
BMPs
WY92�
WY93 WY94 WY95 WY96 WY97 WY98 WY99 WY00 WY01 WY02
Three-YearAveragePhosphorusLoad%Reduction
n/a n/a 39% 36% 47% 51% 55% 44% 48% 57% 59%
PhosphorusConcentration(ppb)
17312-yearaverage
1662-year
average
121 130 109 106 100 107 114 107 92
% AcresImplementedwith BMPs perthe EvergladesBMP Program
0 0 * 15 63 100 100 100 100 100 100 100
WY AnnualPhosphorusConcentration(ppb)
17312-yearaverage
1662-year
average
112 116 98 100 102 124 119 64 77
WY AnnualCalculatedPhosphorusLoad %Reduction
n/a n/a 17% 31% 68% 49% 34% 49% 55% 73% 55%
80%ConfidenceInterval in %**
n/a n/a -26to46 -4to54 54to78 32to62 6to54 29to64 38to68 62to82 43to68
*Lake Okeechobee SWIM BMP Program, 1992-1993, gave BMP credit for:
�� Initiation of deep-well injection of domestic wastewater from Belle Glade, South Bay and Pahokee
�� Pump BMPs in S-2 and S-3 basins
**Load is calculated using measured flow and concentrations. When comparing loads between the wateryear and the base period, there is a confidence interval for the percent reduction value associated withthe adjustment for rainfall variability. This confidence interval represents the uncertainty relative to theprediction model.
Full BMP Implementation
3-year flow-weighted mean
Partial BMP Implementation*
2003 Everglades Consolidated Report Chapter 3: Agricultural BMPs
3-13
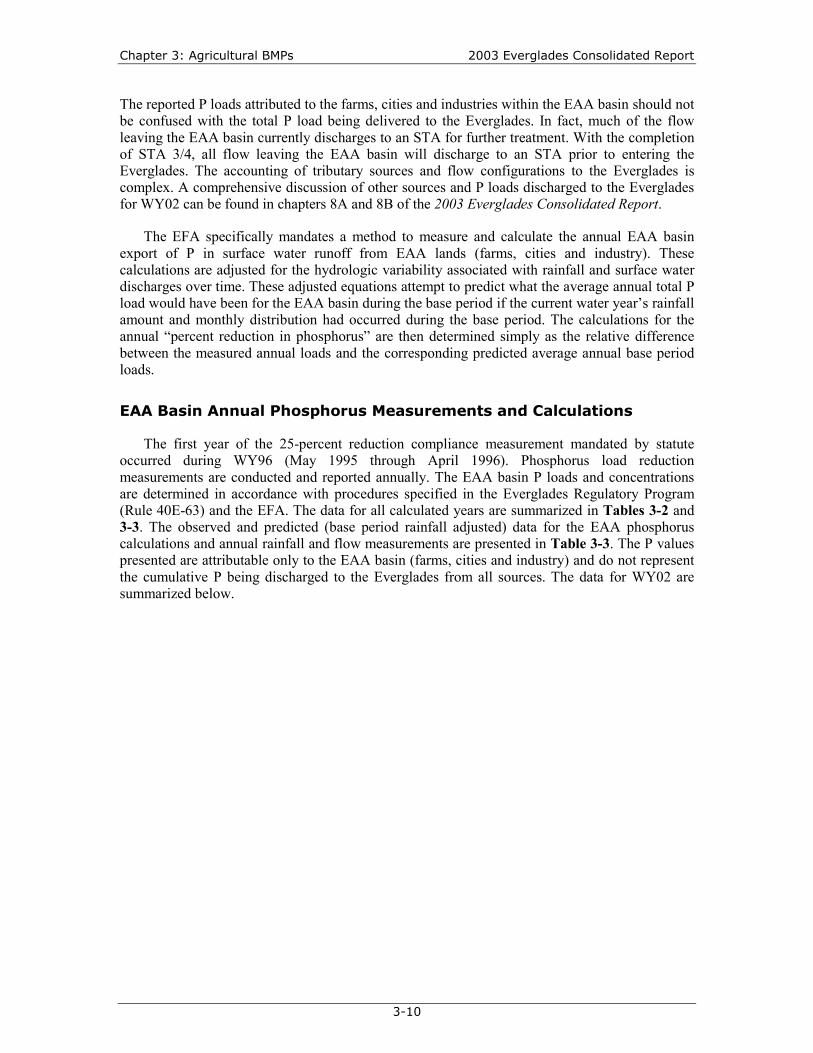
Table 3-3. WY80 through WY02 EAA basin total P measurements and calculations
WaterYear
ObservedTP
(m. tons)
Predicted*TP
(m. tons)
%**TP
Reduct.
AnnualRain(in)
AnnualFlow
(Kac-ft)Base
PeriodPre-BMP
Period
LOKSWIMBMPs
EvrgldsRule
BMPs
80 167 154 -9% 53.50 116281 85 98 13% 35.05 550
82 234 255 8% 46.65 781
83 473 462 -2% 64.35 1965
84 188 212 11% 49.83 980
85 229 180 -27% 39.70 824
86 197 240 18% 51.15 105987 291 261 -12% 51.97 1286
88 140 128 -9% 43.43 701
89 183 274 33% 39.68 750
90 121 120 -1% 40.14 552
91 180 219 17% 50.37 707
92 106 179 41% 47.61 908
93 318 572 44% 61.69 1639
94 132 160 17% 50.54 952
95 268 388 31% 67.01 1878
96 162 503 68% 56.86 1336 First Compliance Year97 122 240 49% 52.02 996
98 161 244 34% 56.12 1276
99 128 249 49% 43.42 83300 193 425 55% 57.51 131101 52 195 73% 37.28 667
02 101 227 55% 49.14 1071Note: The dashed vertical line indicates the period for which BMPs were not fully implemented (WY92-95)* “Predicted TP” represents the base period load, adjusted for rainfall variability.** “%TP Reduction” values for WY80-89 represent the model calibration period.
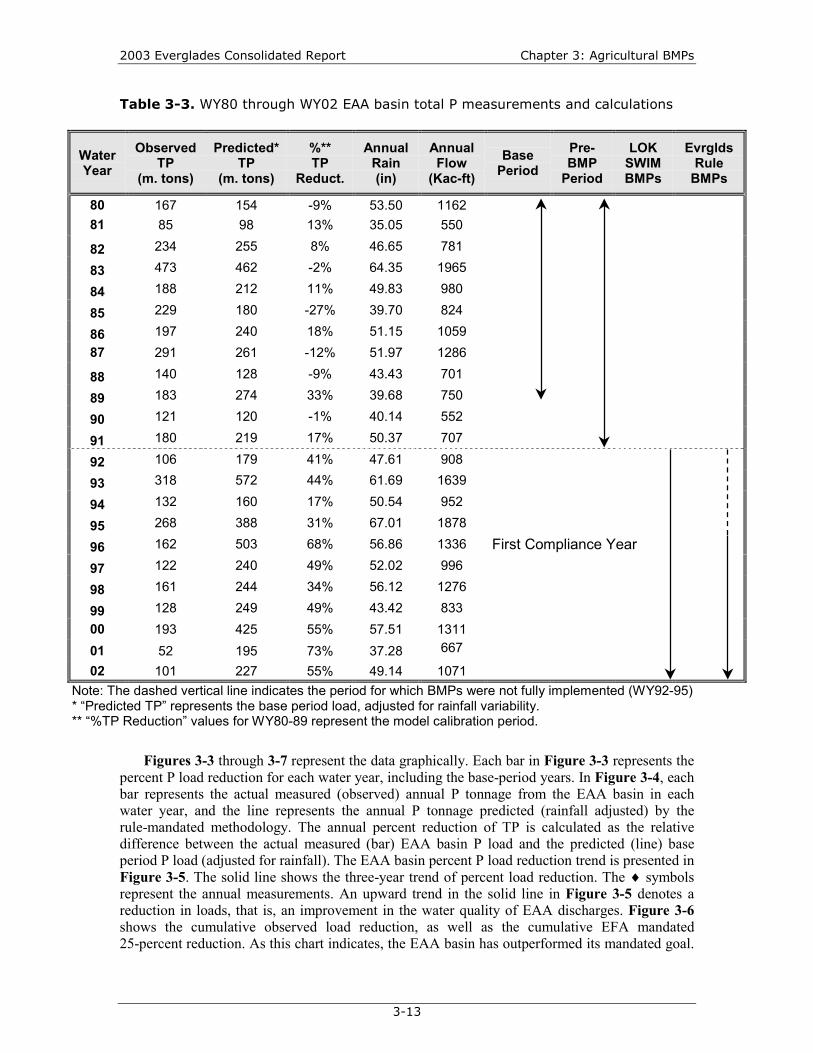
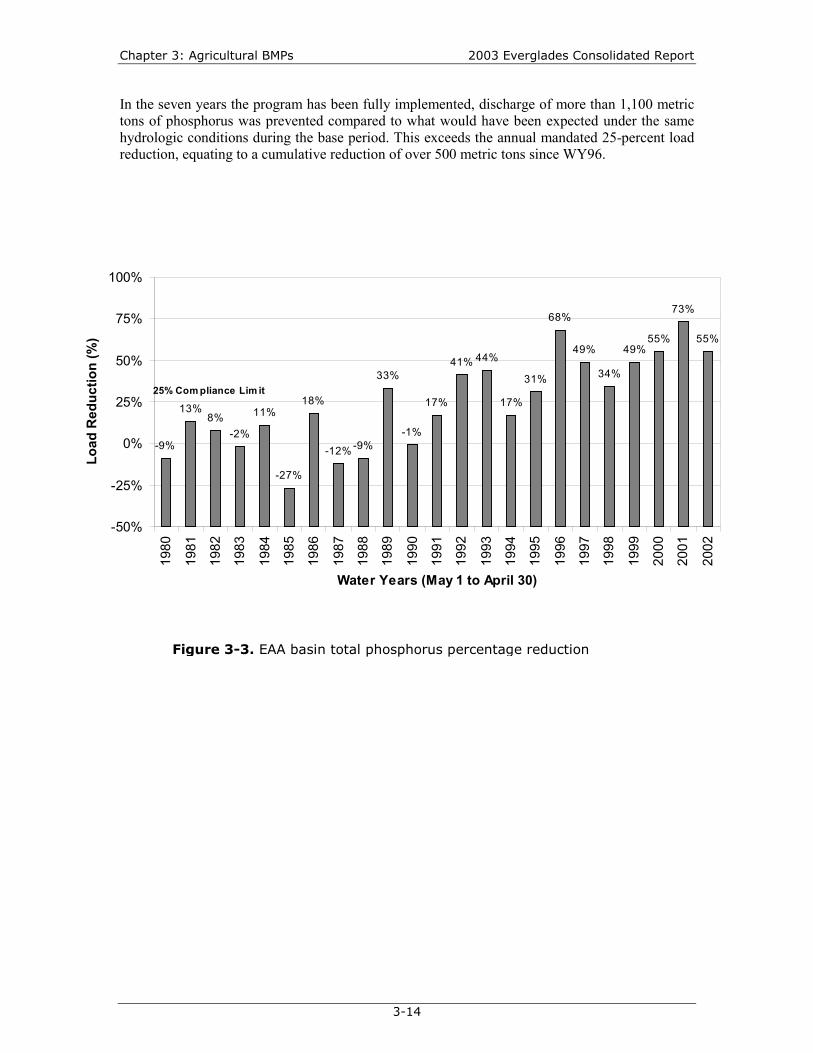
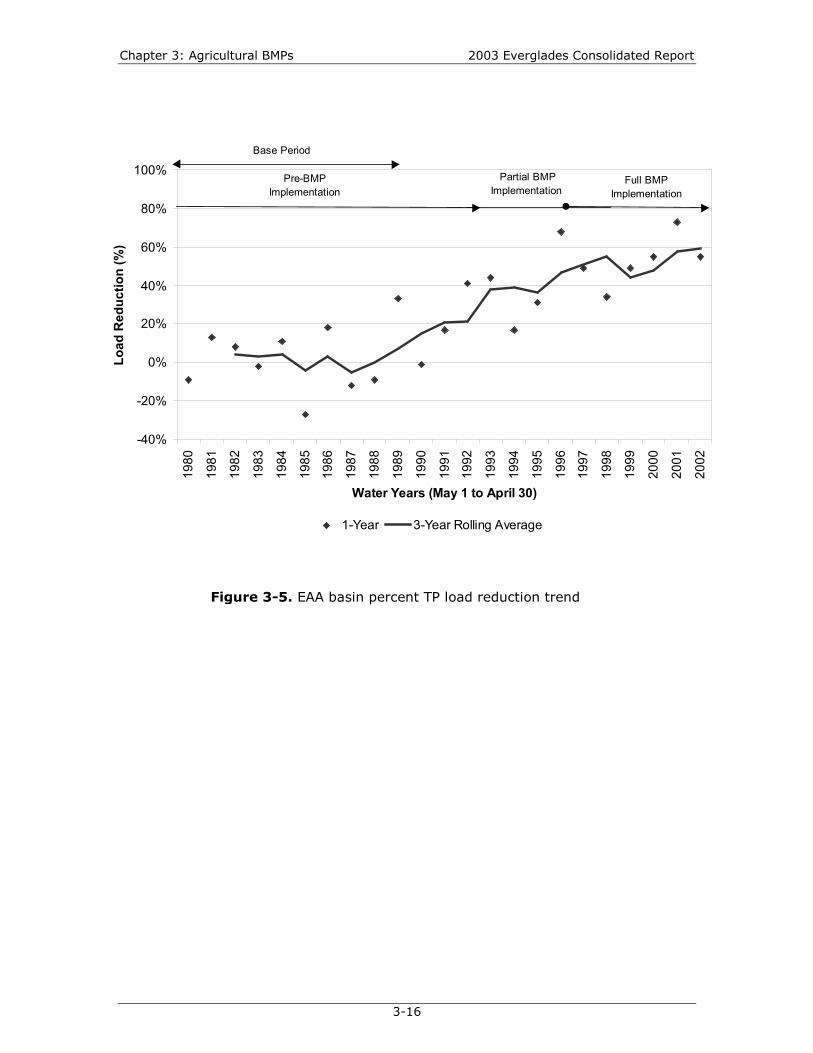
Figures 3-3 through 3-7 represent the data graphically. Each bar in Figure 3-3 represents thepercent P load reduction for each water year, including the base-period years. In Figure 3-4, eachbar represents the actual measured (observed) annual P tonnage from the EAA basin in eachwater year, and the line represents the annual P tonnage predicted (rainfall adjusted) by therule-mandated methodology. The annual percent reduction of TP is calculated as the relativedifference between the actual measured (bar) EAA basin P load and the predicted (line) baseperiod P load (adjusted for rainfall). The EAA basin percent P load reduction trend is presented inFigure 3-5. The solid line shows the three-year trend of percent load reduction. The � symbolsrepresent the annual measurements. An upward trend in the solid line in Figure 3-5 denotes areduction in loads, that is, an improvement in the water quality of EAA discharges. Figure 3-6shows the cumulative observed load reduction, as well as the cumulative EFA mandated25-percent reduction. As this chart indicates, the EAA basin has outperformed its mandated goal.
Chapter 3: Agricultural BMPs 2003 Everglades Consolidated Report
3-14
In the seven years the program has been fully implemented, discharge of more than 1,100 metrictons of phosphorus was prevented compared to what would have been expected under the samehydrologic conditions during the base period. This exceeds the annual mandated 25-percent loadreduction, equating to a cumulative reduction of over 500 metric tons since WY96.
Figure 3-3. EAA basin total phosphorus percentage reduction
-9%
13%8%
-2%
11%
-27%
18%
-12% -9%
33%
-1%
17%
41% 44%
17%
31%
68%
49%
34%
49%55%
73%
55%
-50%
-25%
0%
25%
50%
75%
100%
1980
1981
1982
1983
1984
1985
1986
1987
1988
1989
1990
1991
1992
1993
1994
1995
1996
1997
1998
1999
2000
2001
2002
Water Years (May 1 to April 30)
Load
Red
uctio
n (%
)
25% Com pliance Lim it
2003 Everglades Consolidated Report Chapter 3: Agricultural BMPs
3-15
0
100
200
300
400
500
600
700
80019
8019
8119
8219
8319
8419
8519
8619
8719
8819
8919
9019
9119
9219
9319
9419
9519
9619
9719
9819
9920
0020
0120
02
Water Years (May 1 to April 30)
Tota
l Pho
spho
rus
Load
(met
ric to
ns)
Observed Predicted
Partial BMP Implementation
Pre-BMPImplementation
Full BMP Implementation
Base Period
Figure 3-4. EAA basin TP load calculated
Chapter 3: Agricultural BMPs 2003 Everglades Consolidated Report
3-16
Figure 3-5. EAA basin percent TP load reduction trend
-40%
-20%
0%
20%
40%
60%
80%
100%19
80
1981
1982
1983
1984
1985
1986
1987
1988
1989
1990
1991
1992
1993
1994
1995
1996
1997
1998
1999
2000
2001
2002
Water Years (May 1 to April 30)
Load
Red
uctio
n (%
)
1-Year 3-Year Rolling Average
Partial BMP Implementation
Pre-BMPImplementation
Full BMP Implementation
Base Period

2003 Everglades Consolidated Report Chapter 3: Agricultural BMPs
3-17
Figure 3-6. EAA basin cumulative percent P load reductions
0
200
400
600
800
1000
1200
1400
1996 1997 1998 1999 2000 2001 2002
W ater Year
Red
uctio
n (m
tons
)
C um ula tive 25% reduc tion C um ulat ive O bserved R educt ion

Chapter 3: Agricultural BMPs 2003 Everglades Consolidated Report
3-18
0
50
100
150
200
250
300
1980
1981
1982
1983
1984
1985
1986
1987
1988
1989
1990
1991
1992
1993
1994
1995
1996
1997
1998
1999
2000
2001
2002
Water Year (May 1 - April 30)
Run
off C
once
ntra
tion
(ppb
)
1-Year 3-Year
Pre-BMPImplementation
Partial BMP Implementation
Full BMP Implementation
Base Period
Figure 3-7. EAA basin flow weighted phosphorus concentration trends

2003 Everglades Consolidated Report Chapter 3: Agricultural BMPs
3-19
Phosphorus concentrations are calculated in addition to P load. Concentration levels, however,are not evaluated to determine EAA basin compliance, but flow-weighted concentrations allowfor relative comparisons between years. Annual concentrations and three-year trends presented inthe 2003 Everglades Consolidated Report are true “annual flow-weighted” values calculated bydividing the total annual cumulative P load by the total annual cumulative flow. Figure 3-7shows the P concentration trends for the EAA discharges.
EAA PERMIT-LEVEL MONITORING RESULTS
In addition to the BMP Plan, each Rule 40E-63 EAA permit is required to propose a WaterQuality Monitoring Plan for individual drainage basins within the permitted area. Thepermit-level monitoring plans consist of flow measurements, collection and compositing ofdischarge water samples, and analysis for total P. Discharges are generally quantified usingsite-specific calibration equations. Water quality samples are generally collected daily duringdischarge by automatic flow-weighted samplers and are composited for a sampling period of upto 21 days prior to being transported to a laboratory for analysis. Daily total P load is calculatedby multiplying the TP concentration for the sampling period by each daily flow. Rule 40E-63requires data to be submitted in an electronic format. Water quality samples are collected under aComprehensive Quality Assurance Manual in accordance with FDEP requirements. In addition,any laboratory that analyzes TP for the Rule 40E-63 permit monitoring program is required to becertified by the Florida Department of Health for the analysis of TP in surface water.
Annual average flow-weighted TP concentrations (ppb) and load discharges (lb/ac) have beencalculated from permittees’ daily water quality monitoring data reported during WY02. Figures 3-8and 3-9 present frequency distributions of WY02 permittees’ drainage basin P loads andconcentrations, respectively. Appendix 3-1 presents WY02 data in tabular form and as spatialdistributions of P loads and concentrations discharged by permit drainage basins. The EAAbasin-level data verify that the individual farms have collectively reduced phosphorus loadscoincident with BMP implementation. However, the data collected so far do not establish a directstatistical relationship between the water quality and flow data from an individual EAA farm orsubset of farms and the EAA basin as a whole. In fact, the permittee-level water quality monitoringcannot be used to determine the measure of phosphorus discharged to the Everglades. Thisconclusion is based on the fact that the average annual cumulative total volume of water dischargedfrom the 300+ permittee or farm-level pump stations is greater than the volume released from theDistrict water control structures surrounding the EAA. Additionally, EAA basin canal water(including rainfall and Lake Okeechobee discharges) and the surface water discharged from any oneof the given 200+ defined permittee drainage sub-basins (farms) may be drawn back into the farmfor irrigation or freeze protection by another farm. Each year, a tremendous amount of water isrecycled in this manner within the EAA prior to discharge to the Everglades.

Chapter 3: Agricultural BMPs 2003 Everglades Consolidated Report
3-20
Figure 3-8. Permit-level TP load frequency distribution
0%
10%
20%
30%
40%
50%
60%
70%
1 2 3 4 5 10 15 >15
TP Load (lbs/acre)
Perc
ent o
f Far
ms

2003 Everglades Consolidated Report Chapter 3: Agricultural BMPs
3-21
Figure 3-9. Permit-level TP concentration frequency distribution
0%
5%
10%
15%
20%
25%
30%
50 100 150 200 250 300 600 1000 >1000
Concentration (ppb)
Perc
ent o
f Far
ms
Chapter 3: Agricultural BMPs 2003 Everglades Consolidated Report
3-22
There are also several factors affecting phosphorus load at the farm level, making it difficult tomake comparisons and draw conclusions on differences in the level of performance between farms.UF/IFAS studies, discussed later in this chapter, make the point that each farm has a characteristic“lowest achievable discharge P concentration” that cannot be realized without an extensiveimplementation period and substantial financial impact. Consideration must also be given to theminimum P required to support the agricultural production of specific crops. These factors aresometimes beyond the control of the permittee and also create differences in BMP effectivenessbetween sites, preventing an “apples-to-apples” comparison. They include variations related tohistoric and existing land use, fertilizer practices, soil characteristics, hydrology, land area andgeographic location. Examples of variables affecting individual farms include the following:
1. Weather Patterns. Timing and distribution of rainfall can affect an individual farm load.The model used to calculate the rainfall-adjusted unit area load for an individualpermittee farm is dependent on District rainfall data collected for each WOD sub-basin(e.g., S-5A, S-6, S-7 and S-8) within the EAA. Adjacent farms can be located in differentWOD sub-basins and therefore have a significantly different rainfall adjustment.
2. Cropping Patterns. The history of cropping patterns on a farm can affect loads bycreating a phosphorus “sink,” or accumulation. The implementation of nutrientapplication control BMPs should correct this situation over time.
3. Hydrology. The hydrology of a farm affects loads in many ways. Examples include thesize of the farm relative to the discharge pump capacity or the effects of seepage from anadjacent Stormwater Treatment Area. Gradually, older pumps are being rebuilt orreplaced to improve the capacity relationship between the farm area and the pumpcapacity.
4. Soil Characteristics. Soil depth and composition can also have a significant impact on afarm’s performance. A farm may have high levels of calcium carbonate present in its soil,resulting in a high soil pH and precipitation of phosphorus. An adjacent farm may havemuch lower levels of calcium carbonate present in its soil and a lower soil pH.
These are just a few examples to illustrate how each farm can be unique, with BMP selectionand effectiveness dependent upon many factors. Permittees recognize unique effects on their farmsand voluntarily adjust their operations and monitor the effects of these adjustments on water quality.Many of these adjustments require capital improvements that are phased in over time. For example,installation of culverts to improve internal drainage, thereby minimizing discharges, on a20,000-acre farm could be an eight-year-long project.
Permit-level data are useful for making relative comparisons between farms or between wateryears for the same farm only when they are used in conjunction with in-depth knowledge of uniquefarm characteristics. The District currently uses such relative comparisons when discussingindividual farm performance and BMP optimization with permittees.
In accordance with Rule 40E-63, this on-farm, or permittee-level, water quality monitoringwill only be used for compliance determination if the EAA basin does not meet the 25 percentphosphorus load reduction requirement. The permittee water quality monitoring results are notused to calculate the phosphorus reduction at the EAA basin level. The District currentlyconducts EAA basin-level monitoring at all inflow and outflow structures for this purpose.
2003 Everglades Consolidated Report Chapter 3: Agricultural BMPs
3-23
UPDATE ON EVERGLADES BMP RESEARCH
BMP effectiveness has been demonstrated at different scales, in the EAA basin as a wholeand through individual sub-basin or farm-level research projects in the EAA basin. In addition toBMP implementation, the EFA mandates landowners to sponsor a program of BMP research,testing and implementation. Research projects to quantify BMP effectiveness are necessary toimprove the understanding and predictability of TP relative to BMPs. To encourage BMPoptimization as data become available, research results are provided to the industry throughoutreach programs sponsored by UF/IFAS, EAA-EPD, FDEP and the District. The following isan update on active BMP research projects in the EAA.
UNIVERSITY OF FLORIDA/INSTITUTE OF FOOD ANDAGRICULTURAL SCIENCE (UF/IFAS) ON-FARM RESEARCH
The research conducted by UF/IFAS represents the most comprehensive ongoing researchprogram regarding BMP effectiveness in the EAA basin. Initiated in 1992, the project was fundedprimarily by the EAA-EPD, with supplemental monetary contributions from the FDEP and theDistrict. Ten farms ranging in size from approximately 320 acres to 4,600 acres have been studiedin an attempt to develop and verify the effectiveness of BMPs for reducing P loading in the EAAbasin. These farms are representative of the EAA basin with respect to soils, crops, water,fertilizer management practices and geographic locations. Land use on the selected farms variesfrom monocultures of sugarcane and vegetables to multicultures of vegetables, rice, sod andsugarcane. The latest project evaluation and data summary can be found in the UF/IFAS Phase 10Annual Report on Implementation and Verification of BMPs for Reducing P Loading in the EAAand EAA BMPs for Reducing Particulate P Transport (WM754).
In earlier phases the objectives of the research were to implement and assess the effectivenessof BMPs in the EAA through a monitoring program and maintain a continuous database ondrainage flows, cropping patterns and water quality for sites representative of typical EAA farms.Other EAA BMP-related efforts have since been incorporated into the project and are as follows:identification of short-term and long-term effects of BMPs on soils and crops; evaluation ofspecific conductance and total dissolved P in farm discharges; and evaluation of particulatematter in farm and EAA drainage canals.
With regard to BMP efficacy, research has shown that both water management and croprotation BMPs have the greatest potential impact on P loads and concentrations of farmdischarges. One water management practice that proved particularly effective was that of makinginternal drainage improvements to a farm to allow more uniform drainage. For example, a farmcould be hydraulically subdivided into different blocks with internal water control structures. Thispractice makes it less likely that the farm will be over-drained and allows higher P water fromareas within the farm to be recirculated internally. This practice works particularly well for farmsthat employ crop rotation practices. The study indicated that water table response and levels, i.e.,drainage on the farm, are more heavily influenced by prevailing water table elevations, ratherthan open channel gradients from pump operation. Therefore, a combination of improveddrainage uniformity over the farm area and a reduction in drainage from a farm through internalredistribution could significantly reduce P concentrations and loads for all crops.
Demonstration of short- and long-term effects of BMPs on soils and crops is being evaluatedthrough a lysimeter study. A sugarcane lysimeter study was designed to demonstrate the effects

Chapter 3: Agricultural BMPs 2003 Everglades Consolidated Report
3-24
of higher water table elevations on three sugar cane cultivars commonly used in the EAA, as wellas the affects of redistributing nutrient-rich drainage waters to sugarcane fields. A vegetable/ricelysimeter study was designed to demonstrate trends in soil fertility and crop nutrient uptake fordifferent crop rotations, e.g. vegetables, rice and flooded fallow. Final data analyses are currentlybeing conducted. The results will allow determination of water use trends for all croppingsystems. A final report is expected to be completed in 2003.
The evaluation of both specific conductance and total dissolved P is underway for monitoredfarm discharges. The purpose of the study was to identify causes for fluctuations in specificconductance and quantify the components of the total dissolved P. So far, there is insufficientdata on specific conductance to draw conclusions. Further study of specific ions and how theyrelate to farming practices in the EAA will be necessary. The hypothesis states that agriculturalpractices, changes in hydrology occurring throughout the EAA, and connate seawater contributeto the elevated levels of specific conductance. However, the majority of the data collected on theresearch farms have fallen within Class III water quality standards, that is, less than 50 percentabove background or less than 1,275 �mhos/cm, whichever is less. There are insufficient data todetermine whether any of the implemented BMPs independently affect specific conductance;however, it is probable that P load reduction BMPs are helping to mitigate specific conductanceissues that may relate to agricultural practices. Additional data and analyses are necessary tosupport these suggestions.
Another monitoring aspect of the research project involved particulate P transport studies.The primary goals were to identify the sources and the mobility characteristics of particulate P onEAA farms, and included sampling farm discharges for total P and total dissolved P. Particulate Pwas then calculated. Results indicate that approximately 50 percent of the total P in the farmdischarge is attributable to particulate P. Furthermore, the P content of the particulate found in thefarm discharge samples was significantly higher than the P content of the EAA soils. The studyconclusion was that the primary source of exported particulate P in farm discharge is frombiological growth in the main farm canal system.
The particulate P system is actually described in the study as a tri-modal population. The firstparticulate P population is very light and mobile and is readily resuspended and transported undermildly to moderately turbulent conditions. The second population included denser particulatemore strongly associated with the underlying base sediment or the overlying aquatic weeds. Thisdenser population requires a continued application of shear stress to erode it from the canalbottom or dislodge it from the overlying plants. High velocity flow can cause particulate P to bemobilized in large amounts. These two populations are the majority of the particulate P load androughly correspond to the particulate exported during first flush and after continued highvelocities. The third fraction of the tri-modal population of particulate P is randomly generatedfrom localized concentrations of biomass or atypical hydraulic conditions, e.g., unusual rainfallevents, canal level, or pump operating circumstances.
BMPs recommended by the study to control particulate P in discharges included practicesthat reduced the first flush and minimized the occurrence of continued high velocities. The futurefocus of this area of research will be to investigate other practices to reduce P loads associatedwith particulate P, including aquatic weed uptake of P and the hydraulic redistribution of theplants and settled detritus.
These research projects confirm the effectiveness of existing BMPs and provide direction onareas of future focus with continued data collection. A key component to the IFAS research goalsis to promote the continued, uniform and conscientious implementation and management of
2003 Everglades Consolidated Report Chapter 3: Agricultural BMPs
3-25
BMPs. This is accomplished through the IFAS extension program and consists of numerousseminars, workshops and publications offered to the EAA community.
FINDINGS AND FUTURE DIRECTIONS
The overall effectiveness of BMPs is best demonstrated by the measured P load reduction inthe EAA basin since BMPs were implemented, compared to a 10-year, pre-BMP base period.BMP effectiveness is further supported by ongoing BMP research in the EAA basin. The goal ofthe EAA’s Everglades Regulatory Program is a 25 percent annual TP reduction from the EAAbasin compared to the base period. WY02 represents the seventh year that the EAA basin hasbeen in compliance with the required P load reduction requirement. The base-period load adjustedfor WY02 rainfall, assuming that BMPs were not implemented, was predicted as 227 tons. Themeasured total P load was 101 tons—a 55-percent reduction. The overall trend over several yearshas shown a significant reduction in P load since the implementation of BMPs. The annual TPconcentration shows a similar reduction trend with the recent three-year, flow-weighted mean of92 ppb compared to 173 ppb during the pre-BMP period.
The basin-level reductions are generally supported by the UF/IFAS on-farm research.However, variations between farms and years are significant, as indicated by the results of boththe farm-level monitoring conducted by permittees and the UF/IFAS on-farm research.
Recent data continue to support the ongoing pursuit of past recommendations. That is,through continued research, monitoring and education efforts, water quality improvements can bemade by applying new information to existing situations and applying lessons learned to otherregions that discharge to the Everglades. Future BMP work should continue to be directed towardthe following:
1. Identifying other potential BMPs and their applicability to specific areas and waterquality parameters
2. Optimizing the effectiveness of established BMPs based on UF/IFAS research results
3. Promoting the BMP “message” through an aggressive education and outreachprogram.

Chapter 3: Agricultural BMPs 2003 Everglades Consolidated Report
3-26
LITERATURE CITED
Anderson, D.L., A. Ceric and Hutcheon Engineers. 1992. Reduction of PhosphorusConcentrations in Agricultural Drainage of the EAA by Precipitation, Coagulation andSedimentation. Update report to the Florida Sugar Cane League (Report 92-11). University ofFlorida Institute of Food and Agricultural Sciences (UF/IFAS). Belle Glade, FL.
Andreis, H.J. 1992. Best Management Practices for On-Farm Phosphorus Reductions ThroughSediment Control. United States Sugar Corporation. Clewiston, FL.
Andreis, H.J. 1996. Phosphorus Reduction BMP Report. United States Sugar Corporation.Clewiston, FL.
Bion Technologies. 1994. Bion Technologies Nutrient Management System. Summary reportsubmitted to the Sugar Cane Growers Cooperative of Florida. Bion Technologies, Inc.Amherst, NY.
Bion Technologies. 1995. Schlechter 591 Bion Nutrient Management System. Report submitted tothe Sugar Cane Growers Cooperative of Florida. Bion Technologies, Inc. Amherst, NY.
Bion Technologies. 1996. Schlechter 591 Bion Nutrient Management System. Report submitted tothe Sugar Cane Growers Cooperative of Florida. Bion Technologies, Inc. Amherst, NY.
Boman, C., C. Wilson and J. Hebb. 2000. Water quality/quantity BMPs for Indian River AreaCitrus Groves. Fort Pierce, FL.
Bottcher, A.B. and F.T. Izuno. 1993. Procedural Guide for the Development of Farm-Level BestManagement Practice Plans for Phosphorus Control in the EAA. UF/IFAS publication. BelleGlade, FL.
Bottcher, A.B., F.T. Izuno and E.A. Hanlon. 1995. Procedural Guide for the Development ofFarm-Level Best Management Practice Plans for Phosphorus Control in the EAA - Version1.1. UF/IFAS Circular 1177. Belle Glade, FL.
Bottcher, A.B., N.B. Pickering and A.B. Cooper. 1998. EAAMOD-FIELD: A flow andphosphorus model for high water tables. Paper prepared for the 7th International DrainageSymposium. Orlando, FL. March 8 through 11.
Brown and Caldwell Consultants. 1993. Evaluation of on-farm best management practices.Submitted to South Florida Water Management District, West Palm Beach, FL.
Daroub, Samira, J. Stuck, R. Rice, T. Lang and O. Diaz. 2002. Implementation and Verificationof BMPs for Reducing P Loading in the EAA and EAA BMPs for Reducing Particulate PTransport (WM754). Phase 10: Annual Report submitted to the EAA EPD and FDEP.UF/IFAS. Belle Glade, FL.
Environmental Services and Permitting. 1991. Best Management Practices (BMP) Study forWetherald I and Mott No. 1 Plantations. Report prepared for United States SugarCorporation. Environmental Services and Permitting, Inc. Gainesville, FL.
2003 Everglades Consolidated Report Chapter 3: Agricultural BMPs
3-27
Florida Department of Environmental Protection. 1997. EAA Sediments and Effectiveness of SoilSediment Trapping in Rock Pit Diversions. Revised scope of services in Florida Departmentof Environmental Protection Contract No. WM572. Tallahassee, FL.
Florida Department of Environmental Protection, Surface Water Improvement and Management,Rule 17-43, Florida Administrative Code Rule. 1990.
Glaz, B. Written communication. 1998. Informal synopsis of work plan related to long-termresearch being jointly conducted by the U.S. Department of Agriculture-AgriculturalResearch Service and United States Sugar Corporation aimed at improving the watertolerance of sugarcane.
Glaz, B., C.W. Deren and G.H. Snyder. 1997. Variability of Leaf Phosphorus Among SugarcaneGenotypes Grown on Everglades Histosols. J. of Environmental Quality, 26: 1707-1711.
Hutcheon Engineers. 1992. Phosphorus Reduction Strategies, Evaluation of Proposed ModifiedPumping Practices. Report prepared for the Florida Sugar Cane League. Hutcheon Engineers.West Palm Beach, FL.
Hutcheon Engineers. 1993. BMP Workbook, Supplement to the BMP Plan. Workbook for BMPtraining provided to Sugar Cane Growers Cooperative of Florida. Hutcheon Engineers. WestPalm Beach, FL.
Hutcheon Engineers. 1994. Pump BMP Report. Prepared for EAA Environmental ProtectionDistrict. Hutcheon Engineers. West Palm Beach, FL.
Hutcheon Engineers. 1995. Sediment Control Demonstration Project Summary Report. Contractreport prepared for EAA Environmental Protection District. Hutcheon Engineers. West PalmBeach, FL.
Izuno, F.T., A.B. Bottcher, F.J. Coale, C.A. Sanchez and D.B. Jones. 1990. Agricultural BestManagement Practices for Phosphorus Loading Reduction in the EAA. UF/IFAS. BelleGlade, FL.
Izuno, F.T. and A.B. Bottcher. 1991. The Effects of On-Farm Agricultural Practices in theOrganic Soils of the EAA on Nitrogen and Phosphorus Transport. Final report submitted toSouth Florida Water Management District. UF/IFAS. Belle Glade, FL.
Izuno, F.T. and A.B. Bottcher. 1992. Implementation and Verification of BMPs for Reducing PLoading in the EAA. Phase I final report submitted to the EAA Environmental ProtectionDistrict and the Florida Department of Environmental Protection (FDEP). UF/IFAS. BelleGlade, FL.
Izuno, F.T. and A.B. Bottcher. 1993. Implementation and Verification of BMPs for Reducing PLoading in the EAA. Phase II final report submitted to the EAA Environmental ProtectionDistrict and DEP. UF/IFAS. Belle Glade, FL.
Izuno, F.T. 1995. Implementation and Verification of BMPs for Reducing P Loading in the EAA.Phase III final report submitted to the EAA Environmental Protection District and the FDEP.UF/IFAS. Belle Glade, FL.
Izuno, F.T. 1997. Proposed Scope of Work addressing BMP Research, Testing andImplementation to Address Water Quality Standards relative to Chapter 40E-63, Florida

Chapter 3: Agricultural BMPs 2003 Everglades Consolidated Report
3-28
Administrative Code, Part III. Revision 2 draft submitted to the South Florida WaterManagement District. UF/IFAS. Belle Glade, FL.
Izuno, F.T. and R.W. Rice. 1997. Implementation and Verification of BMPs for Reducing PLoading in the EAA. Phase V annual report submitted to the EAA Environmental ProtectionDistrict and FDEP. UF/IFAS. Belle Glade, FL.
Izuno, F.T. and R.W. Rice. 1998. Implementation and Verification of BMPs for Reducing PLoading in the EAA. Phase VI final report submitted to the EAA Environmental ProtectionDistrict and FDEP. UF/IFAS. Belle Glade, FL.
Izuno, F.T. and R.W. Rice. 1998. EAA Sediments and Effectiveness of Soil Sediment Trapping inRock Pit Diversions. Final report submitted to Florida Department of EnvironmentalProtection Contract No. WM572. Tallahassee, FL.
Izuno, F.T. and R.W. Rice. 1999. Implementation and Verification of BMPs for Reducing PLoading in the EAA. Phase VII final report submitted to the EAA Environmental ProtectionDistrict . UF/IFAS. Belle Glade, FL.
Izuno, F.T. and R.W. Rice. 2000. Implementation and Verification of BMPs for Reducing PLoading in the EAA. Phase VIII Final Report submitted to the EAA Environmental ProtectionDistrict. UF/IFAS. Belle Glade, FL.
Palm Beach Soil and Water Conservation District. 1997. Program of assistance for small growersin complying with the Everglades BMP program. West Palm Beach, FL.
Rice, R.W. and F.T. Izuno. 1996. Implementation and Verification of BMPs for Reducing PLoading in the EAA. Phase IV final report submitted to the EAA Environmental ProtectionDistrict and FDEP. UF/IFAS. Belle Glade, FL.
Rice, R.W. 1999. Calibrated Soil Test Fertilization Best Management Practices: Investigation ofSoil Phosphorus Extraction Procedures and Correlation to EAA Sugarcane Yields. FinalWork Plan submitted to the South Florida Water Management District and Sugar CaneGrowers Cooperative under Agreement C- 7641-A5. UF/IFAS. Belle Glade, FL.
South Florida Water Management District. 1992. Surface Water Improvement and ManagementPlan for the Everglades. South Florida Water Management District, Everglades RegulationDepartment, West Palm Beach, FL.
South Florida Water Management District. 1996. Everglades Best Management PracticeProgram, 1st Annual Report for Water Year 1995. South Florida Water Management District,Everglades Regulation Division, West Palm Beach, FL.
South Florida Water Management District. 1997a. Everglades Best Management PracticeProgram, 2nd and 3rd Annual Reports for Water Years 1996 and 1997. South Florida WaterManagement District, Everglades Regulation Division, West Palm Beach, FL.
South Florida Water Management District. 1997b. Chapter 40E-61 Florida Administrative Code.Works of the District Basins, Part I (Lake Okeechobee Drainage Basin). South Florida WaterManagement District, West Palm Beach, FL.
South Florida Water Management District. 1997c. Chapter 40E-63 Florida Administrative Code.Everglades Program, Parts I (Everglades Regulatory Program: EAA), II (Everglades WaterSupply and Hydroperiod Improvement and Restoration) and III (BMP Research, Testing and
2003 Everglades Consolidated Report Chapter 3: Agricultural BMPs
3-29
Implementation to Address Water Quality Standards). South Florida Water ManagementDistrict, West Palm Beach, FL.
South Florida Water Management District. 1998. Everglades Best Management PracticeProgram. Fourth Annual Report for Water Year 1998. South Florida Water ManagementDistrict, Everglades Regulation Division. West Palm Beach, FL.
South Florida Water Management District. 1999. Revised Wind Erosion Equation. BMPEvaluation Tool for the EAA under Cooperative Agreement C-8511 with the U.S. Departmentof Agriculture, Natural Resource and Conservation Service. South Florida WaterManagement District, Everglades Regulation Division. West Palm Beach, FL.
South Florida Water Management District. 2000. Everglades Best Management PracticeProgram. Fifth Annual Report for Water Year 1999. South Florida Water ManagementDistrict, Everglades Regulation Division. West Palm Beach, FL.
South Florida Water Management District. 2001. Everglades Best Management PracticeProgram, Sixth Annual Report for Water Year 2000. South Florida Water ManagementDistrict, Everglades Regulation Division. West Palm Beach, FL.
South Florida Water Management District. 1997. Everglades Nutrient Removal Project,Year Two Symposium.
South Florida Water Management District and Florida Department of Environmental Protection.1997. Everglades Program Implementation, Program Management Plan, Revision 3.
State of Florida. 1994. Everglades Forever Act, Section 373.4592, Florida Statutes.
Stuck, J.D. 1996. Particulate Phosphorus Transport in the Water Conveyance Systems of theEAA. Doctoral dissertation. University of Florida, Gainesville.
Stuck, J.D., F.T. Izuno, K.L. Campbell, A.B. Bottcher and R.W. Rice. 2001a. Farm-level studiesof particulate phosphorus transport in the EAA. Trans. of ASAE, 44(5):1105-1106.
Stuck, J.D., F.T. Izuno, N. Pickering, K.L. Campbell and A.B. Bottcher. 2001b. MathematicalModeling of Suspended Solids and Particulate phosphorus transport in farm conveyancesystems of the EAA. Trans. of ASAE, 44(5):1117-1126.
Wan, Y., M. Voich and S.T. Trost. 2001. Effectiveness of Best Management Practices. In 2001Everglades Consolidated Report. South Florida Water Management District, West PalmBeach, FL.
Whalen, B., P. Whalen and T. Kosier. 2000. Effectiveness of Best Management Practices. In2000 Everglades Consolidated Report. South Florida Water Management District, West PalmBeach, FL.