Embed Size (px)
Citation preview
Environmental Project No. 531 2000Miljøprojekt
Ecotoxicological Assessment of An-tifouling Biocides and NonbiocidalAntifouling Paints
Torben Madsen, Lise Samsøe-Petersen, Kim Gustavson and DorteRasmussen
DHI Water & Environment

2
The Danish Environmental ProtectionAgency will, when opportunity offers,publish reports and contributions relating toenvironmental research and developmentprojects financed via the Danish EPA.
Please note that publication does not signifythat the contents of the reports necessarilyreflect the views of the Danish EPA.
The reports are, however, published becausethe Danish EPA finds that the studies repre-sent a valuable contribution to the debate onenvironmental policy in Denmark.

3
Table of contentsPreface ...................................................................................................... 5
Summary .................................................................................................. 7
1 Introduction ........................................................................................ 11
2 Copper ................................................................................................. 13
2.1 Copper concentrations measured in the vicinity of pleasure craft har-bours............................................................................................ 13
2.2 Transformation and bioavailability of copper in water and sediment142.3 Release and sequestration of copper in sediments ............................ 172.4 Bioaccumulation and aquatic toxicity............................................... 182.4.1 Bioaccumulation ............................................................................ 182.4.2 Toxicity to aquatic organisms ........................................................ 182.5 Assessment of copper........................................................................ 213 Sea-Nine............................................................................................... 23
3.1 Physico-chemical properties ............................................................. 233.2 Biodegradation of DCOI in the aquatic environment ....................... 233.2.1 Primary degradation in seawater .................................................... 233.2.2 Mineralization and metabolites in aerobic sediment...................... 243.2.3 Mineralization and metabolites in anoxic sediment....................... 273.2.4 Transformation and fate of DCOI in a harbour.............................. 303.3 Bioaccumulation and aquatic toxicity............................................... 313.3.1 Bioaccumulation ............................................................................ 313.3.2 Toxicity towards aquatic organisms............................................... 313.4 Risk assessment of DCOI.................................................................. 364 Zinc pyrithione ................................................................................... 40
4.1 Physico-chemical properties ............................................................. 404.2 Abiotic degradation ........................................................................... 404.3 Biodegradation of zinc pyrithione in the aquatic environment ......... 414.3.1 Mineralization and metabolites in aerobic sediment...................... 414.3.2 Mineralization and metabolites in anoxic sediment....................... 454.4 Toxicity to aquatic organisms ........................................................... 484.5 Assessment of zinc pyrithione and metabolites ................................ 514.6 Risk assessment of zinc pyrithione ................................................... 525 Non-biocidal paints............................................................................. 58
5.1 Investigations of non-biocidal paints ................................................ 585.2 Leaching and ecotoxicological tests.................................................. 595.3 Assessment of non-biocidal paints.................................................... 646 Conclusion........................................................................................... 66
7 References ........................................................................................... 68
Appendix 1: Model for calculation of exposure concentrations(PEC)......................................................................... 77
Appendix 2: Examination of the mineralizatin of DCOI andzinc pyrithione in marine sediments ...................... 99
Appendix 3: Examination of the effect of degradation andsorption on the aquatic toxicity of DCOI andzinc pyrithione........................................................ 105

4
Appendix 4: Ecotoxicological data on DCOI ............................ 107
Appendix 5: Ecotoxicological data on zinc pyrithione ............. 109
5
Preface
This report was prepared in continuation of the project “Preliminary as-sessment of mechanical cleaning as an alternative to biocide-containingmarine bottom paints and assessment of biocide-containing antifoulantswith presumed reduced environmental impact”. The project was fundedby the Council for recycling and cleaner technology and was carried outas a collaboration between the Danish Sailing Association, Hempel’sMarine Paints A/S (hereinafter called Hempel) and VKI. Eva Bie Kjær,Hempel, was the project manager.
The present report was prepared by VKI. The objective of this part of theproject was to make:
• Ecotoxicological assessments of the biocides, copper, Sea-Nine andzinc pyrithione on the basis of existing data and new laboratory testsand
• Ecotoxicological assessments of leachates from panels applied with
the non-biocidal paints used in the project.
The project was followed by a steering committee, which held eightmeetings during the project period. The steering committee was com-posed of the following members:
Frank Jensen (chairman) Danish EPAEva Bie Kjær (secretary) Hempel's Marine Paints A/STorben Madsen VKISteen Wintlev-Jensen Danish Sailing AssociationCarl Gerstrøm Danish Sailing AssociationAnders Stubkjær National Association of Local
Authorities in DenmarkChristian A. Jensen Association of County Councils in
DenmarkJens A. Jacobsen National Environmental Research
Institute (NERI)Jan B. Nielsen Agency for Environmental
Protection (AEP)G. Høpner Petersen The Zoological Museum, University
of CopenhagenPeter Györkös Danish EPAAlf Aagaard Danish EPATim Blangsted Hempel's Marine Paints A/SMartin Christoffersen Hempel's Marine Paints A/SJane Dormon Hempel's Marine Paints A/SChris Dam Hempel's Marine Paints A/STorsten Rasmussen Hempel's Marine Paints A/SJohs. Egede Olsen Hempel's Marine Paints A/SSusanne Holm Faarbæk Hempel's Marine Paints A/S
6
Furthermore, Pia Ølgaard Nielsen, Danish EPA, participated in the fi-nalization phase of the project.
We thank the members of the steering committee for a constructive co-operation during the project.
In connection with the preparation of this report, Nordox (copper), Rohmand Haas (Sea-Nine) and Arch Chemicals (zinc pyrithione) were con-tacted. We would like to thank these companies for their co-operationand a constructive dialogue.
The English translation was made by Tove Krogsbøll Holt, VKI.
Hørsholm, 1 November, 1999,Torben Madsen, VKI

7
Summary
The objective of this investigation was to assess the environmental haz-ards of the active substances, copper, 4,5-dichloro-2-n-octyl-4-iso-thiazolin-3-on (DCOI) and zinc pyrithione and of substances leachingfrom non-biocidal antifouling paints.
The bioavailability of copper is the key parameter for the assessment ofthe toxicity of the metal in the aquatic environment. Sequestration ofcopper to organic substances normally reduces their bioavailability, how-ever, this sequestration is apparently dependent on the composition of theorganic matter. The bioavailability of copper in aquatic sediments de-pends on the speciation of the metal, on the sediment and on the physiol-ogy and food selection of the exposed organisms. It has been demon-strated that metals sequestrated to easily digested food are absorbed moreeasily by aquatic organisms than metals sequestrated to indigestible food.Bioavailable copper is very toxic to aquatic organisms. A permanentimmobilization of copper may occur only by sequestration to undis-turbed, anoxic sediments. Harbour sediments are usually anoxic and havea high content of sulfides that sequestrate to copper. Therefore, the bio-availability of copper in harbour sediments is expected to be low. Coppermay be released by disposal of sediment and, on the Danish dumpingsites, the sediment is usually scattered by water current and waves. As anelement, copper is not degradable. The potential toxic effect of copper onthe aquatic environment is reduced by sequestration to organic com-pounds and sediments, which means that the actual bioavailability ofcopper is low. Disturbances of the sediment, and the consequent changesin the oxygen conditions, may remobilize sequestrated copper, and suchchanges may cause effects on sensitive organisms in the vicinity of har-bour areas and dumping sites.
DCOI is rapidly transformed into metabolites in seawater, where half-lives of 11 and 14 hours were found. The transformation of DCOI is verymuch quicker in aquatic sediment as half-lives of less than 1 hour havebeen found. The biodegradation of DCOI was examined in two Danishmarine sediments with different textures. The mineralization into CO2 ina clayey and sandy sediment represented 13% and 24%, respectively, ofthe added 14C during an aerobic incubation of 42 days at a temperature of15°C. The mineralization under anaerobic, sulfate-reducing conditionswas examined in the clayey sediment and represented 14% of the added14C after an incubation of 56 days at a temperature of 15°C. DCOI is verytoxic to aquatic organisms as the lowest effect concentrations (EC/LC50)are lower than 10 µg/L. The aquatic toxicity of the stable metabolite, N-(n-octyl) malonamic acid, is several orders of magnitude lower as thelowest effect concentrations (LC50) are estimated to be between 90 and160 mg/L. Laboratory tests performed with seawater and sediment con-taining DCOI showed that degradation and sorption eliminated the acuteaquatic toxicity of water samples in less than one day. On the basis ofavailable data regarding effects on aquatic organisms, Predicted No-Effect Concentrations (PNEC) were estimated at 0.06 µg/L for DCOI and90 µg/L for N-(n-octyl) malonamic acid. PNEC for N-(octyl) malonamic

8
acid is considered to be representative of the other metabolites from thetransformation of DCOI. In order to calculate exposure concentrations(Predicted Environmental Concentration, PEC), a model was set up onthe basis of principles recommended by the EU "Technical GuidanceDocument" for risk assessment. The model used was not validated asregards concentrations in harbours and navigation routes. The basis ofthe calculation of PEC was defined by way of realistic worst-case sce-narios, which means that, in practice, the calculated PEC values are sel-dom exceeded. The highest calculated exposure concentrations for DCOIwere PEC (water), which was 0.52 µg/L in a pleasure craft harbour and0.006 µg/L in a busy navigation route outside the harbour. As for themetabolites, PEC (water) was 2.2 µg/L in the pleasure craft harbour and0.047 µg/L in the navigation route outside the harbour. On the basis ofthe values for PNEC and PEC, the risk quotients (PEC/PNEC) for DCOIwere calculated at 8.7 for the pleasure craft harbour and at 0.1 for thenavigation route outside the harbour. The calculated risk quotients of thetotal amount of metabolites from the transformation of DCOI were 0.02in the pleasure craft harbour and 0.0005 in the navigation route outsidethe harbour. Because of the short half-life in water and sediment, DCOIwill most likely be rapidly eliminated as soon as the pleasure craft aretaken out of the water at the end of the sailing season.
By photolysis and biodegradation, zinc pyrithione is transformed veryrapidly. Analyses of the degradation of zinc pyrithione in two Danishsediments showed that mineralization into CO2 in a clayey and a sandysediment represented 2.8 and 5%, respectively, of the added 14C underaerobic conditions. The mineralization under anaerobic, sulfate-reducingconditions represented 3.5% of the added 14C in the clayey sediment.Like DCOI, zinc pyrithione is very toxic to aquatic organisms as the low-est effect concentrations (EC/LC50) are less than 10 µg/L. The toxicityof the stable metabolites, omadine sulfonic acid and pyridine sulfonicacid, is several orders of magnitude lower as the lowest effect concentra-tions (LC50) of these compounds are 36 and 29 mg/L, respectively.Laboratory tests performed with seawater and sediment containing zincpyrithione showed that degradation and sorption eliminated the acuteaquatic toxicity of water samples in less than one day. The available dataregarding effects on aquatic organisms form the basis of an estimation ofPNEC values at 0.1 µg/L for zinc pyrithione and 30 µg/L for stable me-tabolites represented by pyridine sulfonic acid. By using the same realis-tic worst-case scenarios as for DCOI, the highest exposure concentrations(PEC, water) of zinc pyrithione were calculated to be between 0.56 and1.7 µg/L for the pleasure craft harbour and between 0.0053 and 0.022µg/L for the navigation route outside the harbour. For the total amount ofmetabolites, PEC (sediment, pore water) was between 1.6 and 2.7 µg/Lin the pleasure craft harbour and between 0.037 and 0.042 µg/L in thenavigation route. On the basis of the values for PNEC and PEC, the riskquotients (PEC/PNEC) for zinc pyrithione were calculated to be between5.6 and 17 for the pleasure craft harbour and between 0.05 and 0.22 forthe navigation route. The risk quotients for the total amount of metabo-lites from the transformation of zinc pyrithione were 0.05-0.09 for thepleasure craft harbour and 0.0012-0.0014 for the navigation route. Thelowest risk quotients are based on PEC values, for which transformationof zinc pyrithione by photolysis is included in the calculations. The high-

9
est risk quotients are, however, based on PEC values in which transfor-mation by photolysis is not taken into account. Like DCOI, zinc pyri-thione will most likely be rapidly eliminated as soon as the pleasure craftare taken out of the water at the end of the sailing season, in consequenceof the short half-life in water and sediment.
Effects on aquatic organisms of water samples from leaching tests withnon-biocidal paints, the epoxy-based High Protect 35651 and the ex-perimental silicone-containing 86330 paint, were tested on the marinegreen alga, Skeletonema costatum, and on the marine crustacean, Acartiatonsa. A similar test was performed with an organotin-based antifoulingpaint, Hempel's Antifouling Nautic 76800. Water samples from theleaching test with High Protect 35651 caused no inhibition of growth ofS. costatum, and chronic effects on A. tonsa were observed only in undi-luted leachate (No-Effect Concentration, NOEC = 100 mL/L). Watersamples from the leaching test with the experimental 86330 paint showedtoxicity to S. costatum and in acute and chronic tests with A. tonsa(NOEC, acute <100 mL/L; NOEC, chronic <10 mL/L). However, somefactors seem to indicate that variations in production and in applicationmay have an effect on the leaching of substances from this type of paint.These indications should be investigated further before a final assessmentof the environmental properties of the paint is made. The leachates ofboth non-biocidal paints showed a significantly lower effect than watersamples from similar tests with the organotin-based paint, Hempel's An-tifouling Nautic 76800. Leachates from the paints, High Protect 35651and the experimental 86330, caused chronic NOEC values for A. tonsa,which were at least 1,000 and 100 times higher, respectively, than thecorresponding NOEC values for leachates from the organotin-basedpaint.

10
11
1 Introduction
The present study includes ecotoxicological properties and risk assess-ment with relation to active substances in antifouling paints and tochemical compounds leaching from non-biocidal paints. Recently, theproperties of a number of active substances in marine bottom paints forpleasure craft and larger vessels with regard to health and the environ-ment were assessed in the report “Survey and assessment of antifoulingproducts for pleasure craft in Denmark” (Madsen et al. 1998) preparedby CETOX (Centre for Integrated Environment and Toxicology) and theNational Environmental Research Institute (NERI). These assessments(Madsen et al. 1998) were completed in three months, which did not al-low a more detailed examination of the available information on the ac-tive substances. On the basis of the recommendations in the “Survey andassessment of antifouling products for pleasure craft in Denmark”, theactive substances, copper, 4,5-dichloro-2-n-octyl-4-isothiazolin-3-on(DCOI) and zinc pyrithione were selected for a more careful assessmentof their environmental hazard.
The assessment of copper is based on a study of available literature fo-cusing the relations between the speciation, bioavailability and ecotoxic-ity of copper.
The very scanty literature published on DCOI and zinc pyrithione hasnecessitated the inclusion of investigations carried out by the manufac-turers, Rohm and Haas and Arch Chemicals. This material was supple-mented with new investigations of the biodegradability of the two sub-stances in Danish coastal sediments under aerobic and anaerobic condi-tions. Furthermore, the effect of degradation and sorption to sediment onthe aquatic toxicity of the two biocides was illustrated in laboratory testswith the marine crustacean Acartia tonsa. The information on the degra-dation, distribution and toxicity of the biocides in the marine environ-ment was used for a risk assessment based on the following two scenar-ios: a Danish pleasure craft harbour and a busy navigation route. The twoscenarios are defined in such a way that the estimated exposure concen-trations (Predicted Environmental Concentration, PEC) are expected tobe realistically conservative resulting in the estimated PEC values onlyseldom being exceeded in practice (see Appendix 1 for a more detaileddescription of the calculation of PEC).
The ecotoxicological properties of an epoxy-based and a silicone-basedpaint without biocides were examined in studies of the toxicity of watersamples from leaching tests. In these tests, the ratio of painted area toliquid volume was 13-14 times higher than this ratio is expected to be ina harbour with a large amount of pleasure craft. The ecotoxicologicalstudies included tests with the marine green alga Skeletonema costatumand tests for acute and chronic toxicity to A. tonsa.

12

13
2 Copper
2.1 Copper concentrations measured in the vicinity of pleas-ure craft harbours
DenmarkIn the Egå Marina at Århus Bay, the copper content in the harbour sedi-ment was 150-600 mg/kg dry weight at a distance of 5-10 m from dis-charge from consolidated areas, decreasing to 53-120 mg/kg dry weightat 30 m from discharge (Jensen and Heslop 1997a). By way of compari-son, the copper content in sediment in Århus Bay was 25-50 mg/kg drymatter. Finally, in the same investigation, water concentrations of copperof 2.4 µg/L were measured in Studstrup and of 13 µg/L in the pleasurecraft harbour of Marselisborg but these analyses are stated to be some-what doubtful.
The copper content in harbour sediments from other localities in the areahas also been analysed. The highest concentrations were found at theslipways in Bønnerup harbour (7,000-8,000 mg/kg dry weight), which isa combination of a pleasure craft and fishing harbour, and in Århus fish-ing port (1,600-2,400 mg/kg dry weight). The copper concentrations inthe basins were 15-70 mg/kg dry weight in Bønnerup harbour and 100-400 mg/kg dry weight in Århus fishing port. In the sediment from Ebel-toft, Grenå and Hov Bedding, the concentrations were 280, 490 and1,200 mg/kg dry weight, respectively (Jensen and Heslop 1997b).
The county of Funen has measured copper contents in sediment from 5 to110 mg/kg dry weight in harbours (The County of Funen 1999). From theLittle Belt, dated sediment cores have been analysed so that the temporaldevelopment of the copper content might be assessed. The measurementsin the sediment cores showed a significantly increasing content of copperin the vicinity of Als, an upward trend at four stations and con-stant/varying concentrations at four other stations. The copper content inthe cores varied from 19 to 46 mg/kg dry weight.
SwedenIn 1990 and 1993, the copper concentrations in water, sediment andaquatic plants were measured in the skerries of Stockholm (Greger andKautsky 1990 and 1993, cf. Bard 1997). The measurements showed asignificantly higher content of copper in the sediments in the vicinity ofpleasure craft harbours and areas with heavy pleasure craft traffic. Cop-per concentrations of up to 1,3000 mg/kg dry weight were measured insediments. Compared to less contaminated areas, increased copper con-centrations were also found in aquatic plants. Similar measurements wereperformed in the vicinity of the Bullandö Marina, which is also situatedin the skerries of Stockholm (Öhrn 1995, cf. Bard 1997). In April, 1993,before the start of the sailing season, the copper content in the water was0.8-1.0 µg/L while, in June, it was 3.0-3.8 µg/L. The copper content inthe sediment at the Bullandö Marina was only slightly increased whencompared to the reference stations, at which the copper content was 30mg/kg dry weight.
14
FranceMeasurements performed by the French authorities in the Arcachon Bayat the Atlantic coast from 1979-1991 showed an increase in the coppercontent in oysters (Claisse and Alzieu 1993). The increase was signifi-cant at two of four stations from 1982 to 1991. The increase in the coppercontent in oysters coincides with an increased consumption of copper-based antifouling products when the use of organotin TBT was regulatedin 1982. The increase in the copper content was highest and significant inthe oysters from the two stations in the inner bay. The increase was lessand not significant at the stations in the outer bay, which may be ex-plained by the fact that the rate of water renewal at these stations ishigher than in the inner bay. The French measurements are unique be-cause of the long time series and the extensive measuring programmecarried out. Several conditions may influence the accumulation of copperin organisms and the direct relation between an increased copper contentin water and an increased content of copper in oysters is not stated in theFrench studies.
BackgroundconcentrationsCompared to the above stated concentrations, the background concentra-tion of copper is given as 25-35 mg/kg dry weight in Danish sedimentsand as 0.5-1.5 µg/L in seawater (Madsen et al. 1998). Swedish studiesgive a copper content of 0.3-0.8 µg/L in water from the Baltic Sea and of0.2 µg/L in water from the Kattegat. The Swedish background values forsediment are given as 10-40 mg/kg dry weight in the Baltic Sea (Debourget al. 1993).
In harbours and neighbouring waters, concentrations above normal ofcopper have thus been found in both sediments and water samples, i.e. inpleasure craft harbours up to a factor of 30 times the background con-centration in sediments and up to a factor of 10-15 times the backgroundconcentration in water.
2.2 Transformation and bioavailability of copper in waterand sediment
BioavailabilityContrary to organic compounds used in antifouling products, metals arenot degradable. In water, copper will occur dissolved in the water as wellas sequestrated to particles. Copper may, however, occur in differentforms (species) depending on e.g. the salinity, pH, content of organicmatter, etc. of the water. The speciation of the copper decides whetherlive organisms can take it up (whether it is bioavailable) and therebywhether copper is toxic to the organisms.
It is often accepted that primarily the free copper ions (Cu2+) may passcell membranes and thus constitute the bioavailable and toxic part ofcopper (Campbell 1995). It has, however, been demonstrated that other

15
copper ions and lipid-bound copper may also pass cell membranes andmay thus also be bioavailable (Allen 1993).
SequestrationIn seawater and fresh water, it is a well-known fact that sequestration ofcopper to organic substances is predominant (Bruland et al. 1991), whichtypically reduces the bioavailability of copper (Lewis 1995). It is, how-ever, not that simple as there are differences in the sequestering proper-ties of organic substances in relation to copper. E.g., Garvey et al. (1991)have demonstrated that humic acid reduces the toxicity of copper whilefulvic acid does not have a similar effect. In all probability, the seques-tration of copper to organic substances is very specific (Wells et al.1998). It has been demonstrated that planktonic algae can excrete organicsubstances binding copper (Brand et al. 1986, cf. Wells et al. 1998).Planktonic algae that are exposed to increased copper concentrationsmay excrete such copper-binding substances (ligands) thereby reducingthe bioavailability and potential toxic effect of copper (Wangersky 1986,cf. Paulson et al. 1994). The formation of colloids and subsequent aggre-gation, which eliminates copper from the water phase and transports it tothe sediment, is considered another effect of the organic ligands (Wells etal. 1998).
Sedimentation, speciation and bioavailabilityThe transportation of copper to sediments will typically proceed viasedimentation of copper built into or adsorbed to particles (micro algae,clay particles, etc.). In open waters, the sedimentation of copper willprimarily be controlled by the sedimentation of planktonic algae (Wang-ersky 1986, cf. Paulson et al. 1994), to which copper is sorbed and/orbuilt in. In the sediment, a large number of chemical and biologicaltransformations of importance to the speciation of copper will take place,including oxidation/reduction, dissolution/leaching and sequestration.The transformations will be controlled by sediment type (i.a. grain sizeand content of organic matter), digging and filtering activity of sediment-living invertebrates (bioturbation) and the oxygen conditions in the waterand in the sediment.
Speciation of copper in sediments is controlled by dynamic and reversi-ble processes (Calmano et al. 1990). E.g., copper sequestrated to reducedcompounds (organic matter and sulfides) may be released from the sedi-ment to the above water due to oxidation as a result of resuspension orbioturbation (Petersen et al. 1997; Ciceri et al. 1992; Westerlund et al.1986), or a redistribution may take place sequestrating copper in oxidizedcompounds instead (e.g., ferric or manganese oxides and hydroxides).These compounds are considered unstable while sulfides and organicsubstances are characterized as more stable (Förstner et al. 1990; Cal-mano et al. 1990).
In anoxic sediments, e.g., in fine-grained sediments with high content oforganic matter, copper will typically sorb to sulfides and organic matterwhile, at good oxygen conditions, copper will typically be sequestrated tocompounds like ferric oxides, manganese oxides and hydroxides. Metalsulfides are recalcitrant but relatively easily and rapidly oxidized at goodoxygen conditions (Förstner 1985).

16
The bioavailability of copper in sediments is an extremely complex phe-nomenon that does not depend only on the speciation and the sedimentbut also on the physiology and food choice of the exposed organisms(Slotton and Reuter 1995). It has been demonstrated that the bioavail-ability may be specific for individual species and that variations occurwithin the same species related to age, sex and size of the organism(Lewis 1995). Furthermore, it has been shown that the organisms take upmore easily metals sorbed to easily digested food than metals sorbed tofood hard to digest (Wang and Fisher 1996). Digestive enzymes in theintestine ensure a high utilization of the food (Forbes et al. 1998), whichmay also result in an increased uptake of copper from sediment.
Assessment ofbioavailabilityIncreased concentrations of metals in aquatic sediments are widespreadand the authorities must often consider whether the increased concentra-tions imply a risk of adverse effects on the ecosystem. Unfortunately, thisproblem is versatile as the bioavailability of metals varies a great deal indifferent sediments (Luoma 1989).
In attempts to predict the bioavailability of metals in sediments on thebasis of chemical analyses, various extraction and fractionation guide-lines have been developed for analyses of copper sequestrated to carbon-ates, manganese oxides, ferric oxides and organic substances (e.g.,Förstner 1985). The problem in these extraction and fractionation guide-lines is, however, to interpret which species are bioavailable. On the ba-sis of investigations showing a correlation between the cadmium con-centration in pore water in sediment and the acute toxicity of cadmium-added sediment to an amphipod (crustacean living in holes in the sedi-ment), the assumption that the content in the pore water represented thebioavailable part of cadmium was proposed (Ankley et al. 1994).
In similar investigations of the effects of cadmium on other amphipods,Di Toro et al. (1990 cf. Ankley 1996) have demonstrated that the acutetoxicity of cadmium may be predicted on the basis of the content of acidvolatile sulfide (AVS). AVS is the fraction of sulfide in the sediment thatis extractable with cold hydrochloric acid and is a measurement for thecapacity of the sediment to sequestrate metals. If the sequestering capac-ity is exceeded, the concentration of cadmium in the sediment is in-creased and the amphipods die. Attempts have been made to use AVS fordetermining the bioavailability to amphipods of copper in sediments(Ankley et al. 1993, cf. Ankley 1996). AVS significantly overestimatedthe bioavailability of copper, which was explained by the presence ofanother sequestration phase than AVS.
The concept is based on the assumption that only the content in the porewater is available combined with a steady state consideration. This as-sumption cannot be expected to apply to sediment reworkers that swal-low whole sediment particles and have digestive enzymes in the intestinefor degradation of organic substances. Furthermore, the AVS method islimited in as much as it was developed to determine only the actualbioavailable fraction of metals and thus does not give a measurement for

17
the potentially bioavailable fraction that may eventually becomebioavailable, e.g., in relation to a change in oxygen conditions.
No simple method based on chemical analysis has thus yet been foundwith which you can assess how large a part of the copper - especially insediments - that is bioavailable and it is questionable under which condi-tions (sediment type, oxygen conditions) and for which organisms, theAVS method is valid.
2.3 Release and sequestration of copper in sediments
Dredging and dumpingIn connection with resuspension of sediments, it was demonstrated that aconsiderable part of the sorbed copper may be released from the sedi-ment. In laboratory experiments under natural conditions, it was foundthat up to 2% of the particle-sequestrated copper may be released to thewater at resuspension (Petersen et al. 1997). An investigation of sedi-ments at dumping sites at Cleveland Bay before and after a dredging anddumping concludes that copper in the sediment is sequestrated in labilefractions, which are potentially bioavailable and which are easily spreadat resuspension (Reichelt and Jones 1994).
Measured releaseIt has been demonstrated that metals (especially copper) may be releasedfrom sediments to the water above sediments with oxidized surface(Luoma 1989). Release of copper from sediments was observed at theNorth American coast (Boyle et al. 1981 cf. Luoma 1989), in the NorthSea (Kremling 1983, cf. Luoma 1989) and in several places in coastalareas (Windom et al. 1983, cf. Luoma 1989). Fencing experiments haveshown that the copper release is larger from copper-contaminated sedi-ments than from uncontaminated sediments (Hunt and Smith 1983).
BioturbationBioturbation in sediments may be of great importance to remobilizationof metals in the sediment. Sediment-living animals are characterized inrelation to their search for food. Sediment reworkers swallow sand, mudand water without previous separation. The organic content in sedimentis low compared to other types of food. In order to compensate for this,the sediment reworkers have to consume large amounts of sediment,some ingest 8-10 times their body weight a day. Sediment reworkerstypically rummage about a lot in the sediment, which may mobilize bur-ied metals. Suspension feeders feed on particles, which they filter from acurrent that they create between the water above the sediment and thesediment itself thereby increasing the exchange of substances above thesediment-water surface. All in all, the animals increase the contact be-tween the sediment and the above water. Considering that the net depo-sition in marine sediments is only a few millimetres a year, the animalsmay contribute to bringing up old sediment to the surface and new sedi-ment down to underlying layers. Peterson et al. (1996) found that biotur-bation could significantly increase the bioavailability of metals in sedi-ments through oxidation of sulfide compounds. They found that
18
metal/sulfide complexes were relatively unstable towards the oxidationtaking place in connection with bioturbation.
The replacement of sulfide-containing water by oxygen-containing waterwill also remobilize sulfide-sequestrated metals (Emerson et al. 1984, cf.Förstner et al. 1990) as the oxygen content of the water above the sedi-ment is of great importance to the sequestration and release of metalsfrom sediments. Measurements showed that, during summer periods withpoor oxygen conditions in the harbour at Corpou Christi Bay, cadmiumwas sequestrated to sulfides while measurements showed a release duringwinter months with good oxygen conditions (Holms et al. 1974, cf.Förstner et al. 1990). There is thus no immediate reason to suppose thatcopper sequestrated in sulfides may not become bioavailable on a longview.
2.4 Bioaccumulation and aquatic toxicity
2.4.1 BioaccumulationCopper is a micro-nutrient that live organisms need in small doses.Higher animals like fish can regulate the content of copper in their or-ganism and, to some extent, they can accumulate copper in the lever butnot in the muscles. If copper exists in the surroundings or in the food invery low concentrations, an accumulation may be the result of the or-ganism utilizing copper as a nutrient. The interpretation of bioconcentra-tion factors (BCF values) for an essential micro-nutrient like copper isthus difficult and no information is available in the investigations quotedon concentrations of copper and the requirements for copper of the or-ganisms used. In short-term studies with algae (½-2 days), BCF valueswere measured at 1-40. In long-term studies with insects and mussels, theBCF values were considerably higher: In a 28-day study with mosquitolarvae - in all probability in sediment - a BCF value of 5,830 was found;furthermore, BCF values of 5,000-10,000 were found in mussels during aperiod of 2-3 years (AQUIRE 1999). BCF values between 400 and90,000 have been found in plankton and some lower organisms (Debourget al. 1993).
2.4.2 Toxicity to aquatic organismsAquatic organismsTable 2.1 gives an overview of the toxicity of copper to various groups ofaquatic organisms measured in single-species laboratory tests. Table 2.1illustrates that copper is very toxic with effect concentrations from only afew micrograms of copper per litre.

19
Table 2.1Ecotoxicological data on effects of copper on aquatic organisms A.
Taxonomic group End point Exposure time Results[mg/L]
Algae LC50/EC50growth
1h-5d 0.01-0.55
Algae NOEC* 2-3d 0.009-0.049
Algae NOEC 19-20d 0.01
Crustaceans LC50 2-4d 0.0075-0.32
Crustaceans LC50(dissolved Cu)
2d 0.019-0.084
Crustaceans EC50(reproduction)
7d 0.01-0.02
Crustaceans NOEC(reproduction)
7-10d 0.04-0.22
Fish LC50 4d 0.024-21
Fish LC50(dissolved Cu)
4d 0.098-0.60
Fish EC50(anormalities +
hatching)
12d 0.075-0.19
Fish NOEC(survival + hatching)
12-42d 0.01-0.12
Insects LC50 1-10d 23.6-0.20
Molluscs (snails, mus-sels)
LC50 1-4d 0.03-9.3
Molluscs (mussels) EC50(closing)
1-6d 0.04-<0.02
Echinoderm NOEC(reproduction +development)
½-1h 0.0031-0.066
Rotifers LC50 1d 0.063
Rotifers NOEC(movement)
3h 0.006
Worms LC50 28d 0.044A: AQUIRE 1999. Data of high quality have been selected among several hundred
results from the AQUIRE database. The results are given as nominal, total con-centrations of copper, and in general, the speciation is not given.
* The highest concentration at which no effects were observed (NOEC, No Ob-served Effect Concentration).
In Denmark, quality criteria have been specified for copper in fresh waterand seawater of 12 µg/L and 2.9 µg/L, respectively (The Danish Ministryof Environment and Energy, 1996). It is, however, stated that the criteriaare based on data that have not finally been quality assessed. On the basisof 65 single-species laboratory tests with marine organisms, a PNECvalue for copper has been calculated at 5.6 µg/L (Hall and Anderson1998). The calculation method used is based on the distribution of thesensitivity of the organisms tested, and the calculated PNEC value theo-
20
retically protects 95% of the species with 95% confidence. This is, how-ever, twice the lowest NOEC value in Table 2.1 (0.0031 mg/L = 3.1µg/L).
Ecosystem studiesEffects on natural planktonic algae have been measured at only a fewmicrograms of copper per litre. Chronic effects of copper on planktonicalgae in marine ecosystem modelling were demonstrated from 1 µg/L(Gustavson et al. 1999). Comprehensive and well-documented experi-ments with micro algae and copper (Brand et al. 1986) show that, even atvery low concentrations, copper may inhibit the reproduction of algae. Inthese studies, the effect of copper on 38 different clones of marineplanktonic algae was examined in water, in which the metal-chelatingproperties were known. In this scientific article, the toxic effect of copperon the reproduction is related to the activity of free copper ions and it isconcluded that copper may inhibit the reproduction of sensitive algalspecies even in uncontaminated waters where the copper concentration islow (0.1-0.2 µg/L). These studies distinguish themselves i.a. by relatingthe effect of copper to the activity of the free copper ions in the water andnot only to the total copper concentration as so many other studies do.
Swedish investigations have shown copper concentrations of up to 3µg/L in the vicinity of pleasure craft harbours in areas in which the back-ground concentration of copper was 0.8-0.5 µg/L. At the actual copperconcentrations, no effects on planktonic algae were found (Wängberg etal. 1995).
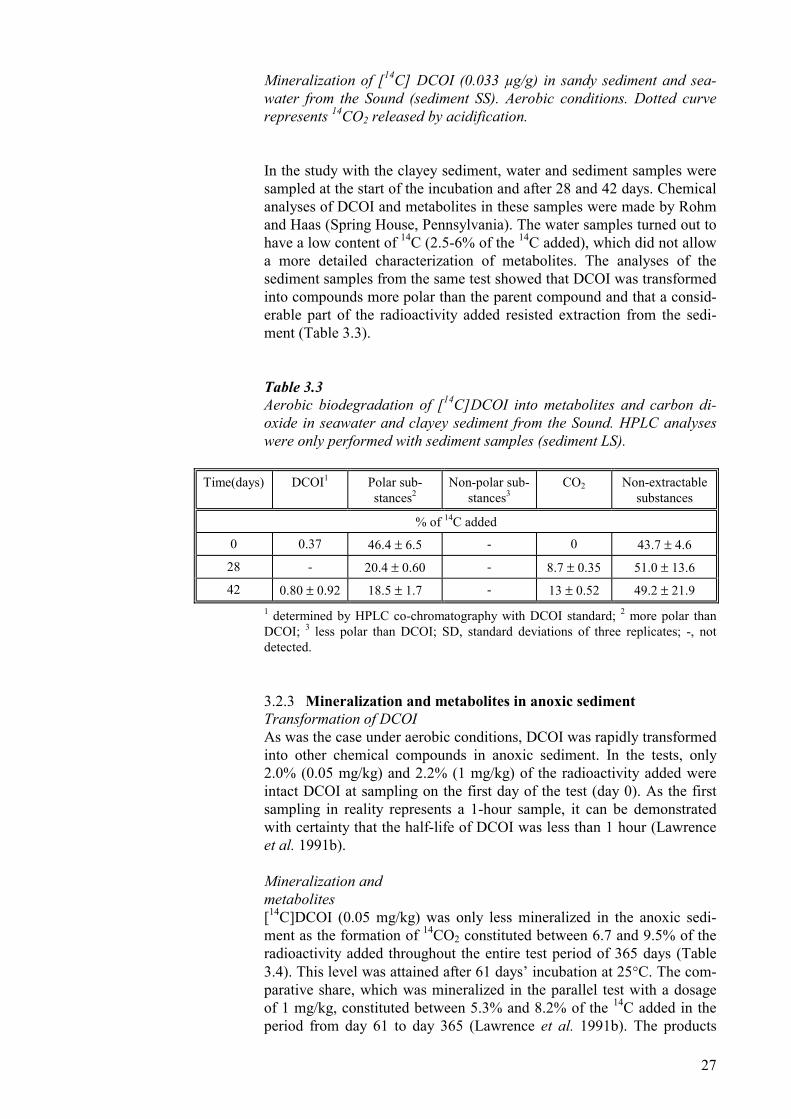
Bottom-living organismsThe results from the tests with organisms living in the sediment and atthe bottom are presented in Table 2.2.
Table 2.2Ecotoxicological data on effects of copper on bottom-living organisms.
Taxonomic group End point Exposure time Results
InsectsA LC50 10d 0.20 mg/L
Insects2 LC50 10d 1,026 mg/kg DM3
CrustaceansA LC50 10d 0.028 mg/L
Crustaceans2 LC50 14d 247 mg/kg DM3
WormsA LC50 28d 0.044 mg/L
Crustaceans1 LC25 28d 998 mg/kg DM3
Crustaceans1 EC25 (growth) 28d 330 mg/kg DM3
Crustaceans2 LC50 10d 185 mg Cu2O/kg DM ≈
164 mg Cu/kg DM3
A AQUIRE 1999; 1 Borgmann and Norwood 1997; 2 Bard 1997; 3 DM = dry matter.
The three studies, in which the concentration is given in mg/L, may havebeen conducted in water without sediment. The other studies indicatethat copper in sediment may cause effects on sediment-living animals at

21
concentrations exceeding 100 mg/kg (Table 2.2). This is well over twiceas much as the highest of the background concentrations stated but muchlower than the concentrations measured in harbour sediments.
2.5 Assessment of copper
Copper is an element and is thus not degradable. Copper can be “re-moved” from the aquatic environment by sorbing to and being buried insediments outside the reach of organisms. Seen in a geological time per-spective, large amounts of heavy metals have been discharged into thesea without causing serious ecotoxic effects as the sequestration of met-als to the sediment has prevented this.
In the aquatic environment, copper will sorb to inorganic and organicsubstances and particles. These sequestering conditions contribute to theoccurrence of various species of copper. It is uncertain which species arebioavailable, and no reliable measuring methods for assessment of thesize of the bioavailable fraction are available. Furthermore, the bioavail-ability of copper is not constant and must be view in different time per-spectives. A differentiation must thus be made between the actual and thepotential bioavailability. The actual bioavailability will typically be con-siderably less than the potential bioavailability. Furthermore, bioavail-ability is species specific and may also depend on physiology, nutrition,age, size and sex of the organisms in question.
A permanent immobilization of copper can only occur at sequestration toparticles and subsequent sedimentation on sediments with poor oxygenconditions with a permanent presence of sulfides. In reality, such condi-tions only exist in areas without resuspension, i.e., without bioturbation(macro fauna) and fishery with bottom trawl. The extension of thesesediment types in Denmark is limited to a few holes in i.a. the archipel-ago south of Funen. Copper sorbed to particles that settle on sedimentsrich in oxygen with bioturbation will probably stay in the biological sys-tems for many year. In deep waters, nutrients and trace metals, includingcopper, stay in the water phase as the particles attain to transformation inthe water column before they reach the surface of the sediment.
Harbour sediments are typically anoxic and have a high content of sul-fides which will bind copper. Therefore, copper is expected to be rela-tively strongly sequestrated in harbour sediments. A release from thesediment at resuspension induced by e.g. the propellers of ships can,however, not be excluded. At regular intervals, the sediments in the har-bours are dredged and the material is dumped at selected localities. Cop-per may be released at dumping and, typically for dumping sites in Den-mark, the sediment will subsequently be spread by current and wave ac-tion. Stable dumping sites are difficult to find in Denmark and copper inthe harbour sediments must be expected to be spread over large areas inconnection with dumping.
The toxicity of copper is dependent on the speciation and the bioavail-ability of copper in the water. The fact that copper is a micro-nutrientcombined with the fact that the content of metal chelating substances

22
may greatly vary in time and space and that the sensitivity of differentspecies varies much, make it very difficult to compare different investi-gations. The concentrations, in which effects are measured in laboratorytests, are generally higher than the background concentrations stated forcopper in the environment but concentrations measured in and in the vi-cinity of harbours are at the same level as or higher than concentrationsin which effects have been measured. The organisms that are most sensi-tive to copper are algae and crustaceans and, in ecosystem tests of thesensitivity of algae, effects were measured at copper concentrations onthe same level as background concentrations.

23
3 Sea-Nine
This chapter contains an ecotoxicological assessment of 4,5-dichloro-2-n-octyl-4-isothiazolin-3-on (DCOI), which is the active substance in Sea-Nine 211.
3.1 Physico-chemical properties
Table 3.1 summarizes the physico-chemical properties of DCOI.
Table 3.1Physico-chemical properties of DCOI.
CAS No. 64359-81-5
Synonyms 4,5-dichloro-2-n-octyl-4-isothiazolin-3-on4,5-dichloro-2-n-octyl-3(2H)-isothiazoloneRH-5287
Classification -
Molecular formula C11
H17Cl2NOS
Molar weight 282.23
Water solubility (20°C) 6.5 mg/L1
Vapour pressure (25°C) 7.4 · 10-6 mm Hg1
Octanol-water partition coefficient (log Kow) 2.8 (measured)2
Organic carbon-water partition coefficient(log Koc)
3.2 (measured)3
1 Shade et al. 1993; 2 Jacobson 1993; 3 Howard 1991.
3.2 Biodegradation of DCOI in the aquatic environment
3.2.1 Primary degradation in seawaterSeveral studies have been made of the degradation of DCOI in theaquatic environment. It is stated that abiotic processes progress with half-lives of 9-12.5 days for hydrolysis and 13.4 days for photolysis. Biologi-cal processes are, however, of greater importance to the transformation ofDCOI. Studies described by Shade et al. (1993) have shown that DCOI(10 µg/L) is transformed with a half-life of 11 hours in seawater with 7 ⋅104 bacteria/mL (total number of bacteria determined by counting in amicroscope). Parallel tests with seawater samples with a lower number ofbacteria (<1,000 bacteria/mL) resulted in longer half-lives for DCOI(Shade et al. 1993). These tests are not considered relevant as thebiological activity of the seawater was unrealistically low. In a recentstudy, the transformation rate of DCOI (10 µg/L) was determined inseawater from the pleasure craft harbour of Jyllinge. The study dem-onstrated that 7.1% of the DCOI added remained after 72 hours at a

24
temperature of 12°C (Jacobson and Kramer 1999). On the basis of themeasured concentrations of DCOI (Jacobson and Kramer 1999), thebiological half-life may be estimated at 14 hours at 12°C (Appendix 1,Section 2.4.1).
3.2.2 Mineralization and metabolites in aerobic sedimentTransformation of DCOIThe aerobic half-life of DCOI is very short in marine systems with sedi-ment and seawater. Analyses of samples from laboratory tests with sedi-ment and seawater showed that DCOI was rapidly transformed into otherchemical compounds. In bottles with a dosage of 0.05 mg/kg, less than6% of the radioactivity added was intact DCOI at sampling on the firstday of the test (day 0). At a dosage of 1 mg/kg, approx. 3.5% of the 14Cadded was intact DCOI at sampling on day 1. In reality, the insignificantpart of the parent compound recovered on day 0 represented a samplingafter one hour as the preparation of the samples for analysis took approx.one hour. The very rapid transformation of DCOI makes it impossible tocalculate an exact half-life, which is, however, for certain less than onehour (Lawrence et al. 1991a).Mineralization andmetabolites
During the 30-day test period, [14C]DCOI was partially mineralized as22% (0.05 mg/kg) and 8.7% (1 mg/kg) of the radioactivity added wastransformed into 14CO2 at 25°C. DCOI is primarily transformed into po-lar metabolites and into compounds that are not extracted from the sedi-ment (Table 3.2). A comparison with HPLC chromatograms of 15 poten-tial metabolites did not result in an unambiguous identification of themetabolites observed in the sediment tests. The most polar metabolitehad the same analytical retention time as n-octyl malonamic acid(C8H17NHC(=O) CH2CO2H) and at least two other metabolites were lin-ear structures in which the isothiazolone ring was broken (Lawrence etal. 1991a). Assessed on the basis of analyses of 15 known standards,more cyclic structures were formed at the initial primary degradation ofDCOI. It is considered likely that the metabolites present in the tests after30 days were linear compounds. The two metabolites found at the analy-sis of the sediment samples after 30 days were both more polar than theisothiazolone standards used. The rapid primary degradation of DCOI(more than 94% transformation after 1 hour) indicates a rapid reactioninvolving a chemically unstable bond, e.g. the N-S bond in the isothi-azolone ring (Lawrence et al. 1991a).
A positive identification of three metabolites was achieved in a laterstudy in which a microbial enrichment culture proved suitable forachieving higher concentrations of metabolites (Mazza 1993). The cul-ture was enriched after dosing aquatic sediment with DCOI (5 mg/kg). Acomparison between HPLC chromatograms of metabolites formed in theenrichment culture and in sediment showed that the products were almostidentical. By use of the enrichment culture and more analytical methods(i.a. HPLC and GC/MS), two essential metabolites were identified as N-(n-octyl) malonamic acid and N-(n-octyl) acetamide. Furthermore, athird quantitatively less important product N-(n-octyl) β hydroxy-

25
propionamide, which is probably formed at anaerobic degradation, wasidentified.
Table 3.2Aerobic biodegradation of [14C]DCOI (0.05 mg/kg), polarity and distri-bution of metabolites in sediment and seawater. Data from Lawrence etal. 1991a.
% of 14C added
Time (days) DCOI Polarsubstances*
Non-polarsubstances**
CO2 Non-extractablesubstances
0 5.1 41.1 1.2 0.0 62.0
1 - 44.7 0.65 0.55 62.2
2 - 27.6 1.3 3.3 55.3
5 - 27.0 0.3 8.1 66.8
9 - 23.9 0.7 8.2 59.0
15 - 22.3 - 8.4 56.5
20 - 24.8 - 9.1 78.0
26 - 20.3 - 14.2 67.0
30 - 13.1 - 21.9 63.5
-, not detected; * more polar than DCOI; ** less polar than DCOI.
The sediment from the aerobic biodegradation tests (Lawrence et al.1991a) was further characterized as regards bound metabolites. Sedimentsamples sampled at the start of the tests and after 30 days were charac-terized by extraction with methylene chloride/methanol followed by ex-tractions with HCl and NaOH (Kesterson and Atkins 1992a). Relativelywater-soluble metabolites that are extracted with HCl, constituted <0.1%of the radioactivity added. Metabolites in the NaOH extract were furtherdivided into fulvic acid and humic acid fractions containing 1.2% and5.1%, respectively, of the 14C added after 30 days. The metabolites thatwere not extracted by these procedures were probably bound to humin orclay and constituted 45% of the 14C added after 30 days (Kesterson andAtkins 1992a). The results showed that the stable metabolites from DCOIwere mainly bound to humic acid, humin and clay minerals in the sedi-ment.
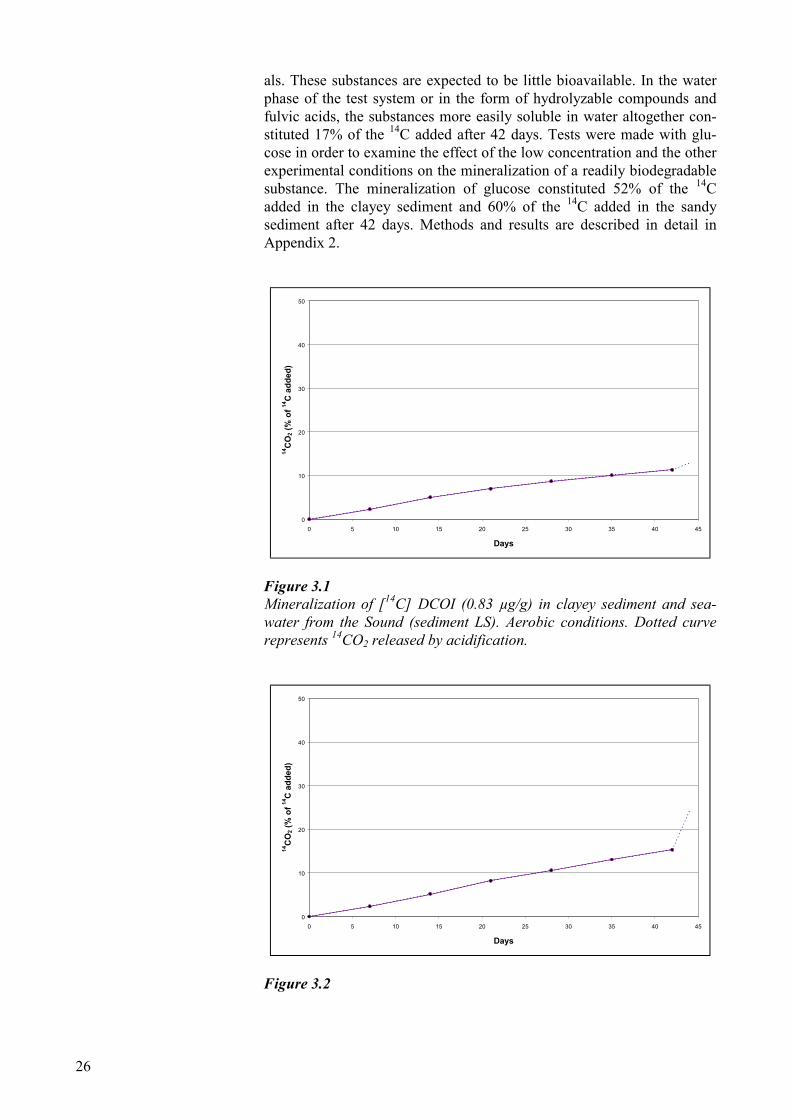
Studies with DanishsedimentsThe aerobic biodegradability of DCOI was examined by use of a clayeysediment (0.83 µg DCOI/g) and a sandy sediment (0.033 µg DCOI/g),which had both been incubated with their respective seawater (Appendix2). Both sediments and their respective seawater had been collected attwo localities in the Sound. The mineralization of [2,3-14C]DCOI into14CO2 constituted 13% of the 14C added in the clayey sediment and 24%of the 14C added in the sandy sediment after 42 days’ incubation at 15°C(Figures 3.1 and 3.2). The examination of the distribution of 14C in theclayey sediment at the termination of the test after 42 days showed that48% of the 14C added was bound to humic acids, humin and clay miner-
26
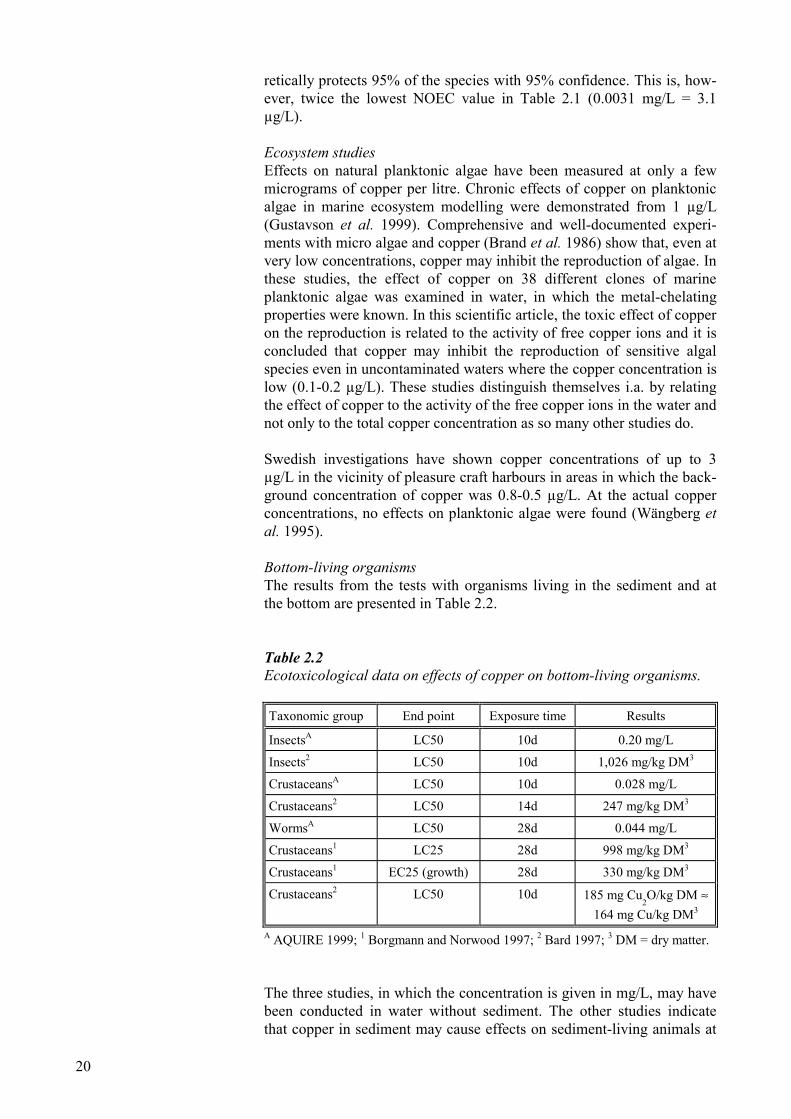
als. These substances are expected to be little bioavailable. In the waterphase of the test system or in the form of hydrolyzable compounds andfulvic acids, the substances more easily soluble in water altogether con-stituted 17% of the 14C added after 42 days. Tests were made with glu-cose in order to examine the effect of the low concentration and the otherexperimental conditions on the mineralization of a readily biodegradablesubstance. The mineralization of glucose constituted 52% of the 14Cadded in the clayey sediment and 60% of the 14C added in the sandysediment after 42 days. Methods and results are described in detail inAppendix 2.
0
10
20
30
40
50
0 5 10 15 20 25 30 35 40 45
Days
14C
O2 (
% o
f 14C
add
ed)
Figure 3.1Mineralization of [14C] DCOI (0.83 µg/g) in clayey sediment and sea-water from the Sound (sediment LS). Aerobic conditions. Dotted curverepresents 14CO2 released by acidification.
0
10
20
30
40
50
0 5 10 15 20 25 30 35 40 45
Days
14C
O2 (
% o
f 14C
add
ed)
Figure 3.2
27
Mineralization of [14C] DCOI (0.033 µg/g) in sandy sediment and sea-water from the Sound (sediment SS). Aerobic conditions. Dotted curverepresents 14CO2 released by acidification.
In the study with the clayey sediment, water and sediment samples weresampled at the start of the incubation and after 28 and 42 days. Chemicalanalyses of DCOI and metabolites in these samples were made by Rohmand Haas (Spring House, Pennsylvania). The water samples turned out tohave a low content of 14C (2.5-6% of the 14C added), which did not allowa more detailed characterization of metabolites. The analyses of thesediment samples from the same test showed that DCOI was transformedinto compounds more polar than the parent compound and that a consid-erable part of the radioactivity added resisted extraction from the sedi-ment (Table 3.3).
Table 3.3Aerobic biodegradation of [14C]DCOI into metabolites and carbon di-oxide in seawater and clayey sediment from the Sound. HPLC analyseswere only performed with sediment samples (sediment LS).
Time(days) DCOI1 Polar sub-stances2
Non-polar sub-stances3
CO2 Non-extractablesubstances
% of 14C added
0 0.37 46.4 ± 6.5 - 0 43.7 ± 4.6
28 - 20.4 ± 0.60 - 8.7 ± 0.35 51.0 ± 13.6
42 0.80 ± 0.92 18.5 ± 1.7 - 13 ± 0.52 49.2 ± 21.91 determined by HPLC co-chromatography with DCOI standard; 2 more polar thanDCOI; 3 less polar than DCOI; SD, standard deviations of three replicates; -, notdetected.
3.2.3 Mineralization and metabolites in anoxic sedimentTransformation of DCOIAs was the case under aerobic conditions, DCOI was rapidly transformedinto other chemical compounds in anoxic sediment. In the tests, only2.0% (0.05 mg/kg) and 2.2% (1 mg/kg) of the radioactivity added wereintact DCOI at sampling on the first day of the test (day 0). As the firstsampling in reality represents a 1-hour sample, it can be demonstratedwith certainty that the half-life of DCOI was less than 1 hour (Lawrenceet al. 1991b).
Mineralization andmetabolites[14C]DCOI (0.05 mg/kg) was only less mineralized in the anoxic sedi-ment as the formation of 14CO2 constituted between 6.7 and 9.5% of theradioactivity added throughout the entire test period of 365 days (Table3.4). This level was attained after 61 days’ incubation at 25°C. The com-parative share, which was mineralized in the parallel test with a dosageof 1 mg/kg, constituted between 5.3% and 8.2% of the 14C added in theperiod from day 61 to day 365 (Lawrence et al. 1991b). The products
28
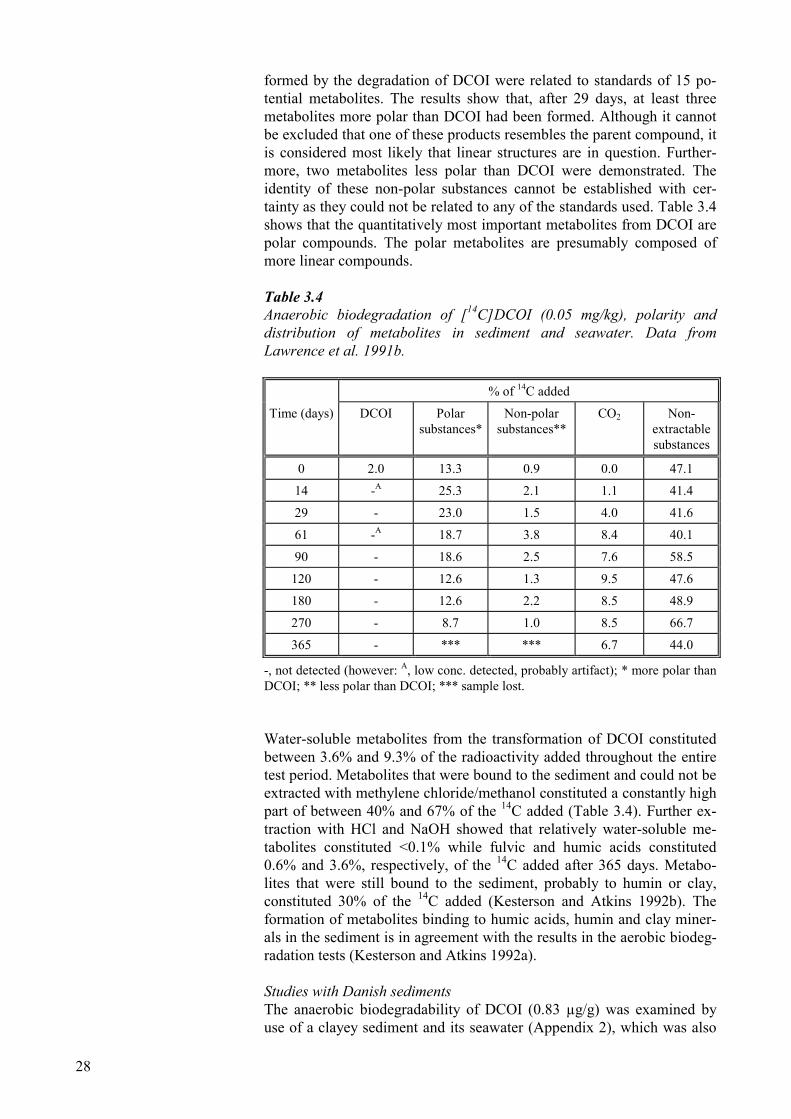
formed by the degradation of DCOI were related to standards of 15 po-tential metabolites. The results show that, after 29 days, at least threemetabolites more polar than DCOI had been formed. Although it cannotbe excluded that one of these products resembles the parent compound, itis considered most likely that linear structures are in question. Further-more, two metabolites less polar than DCOI were demonstrated. Theidentity of these non-polar substances cannot be established with cer-tainty as they could not be related to any of the standards used. Table 3.4shows that the quantitatively most important metabolites from DCOI arepolar compounds. The polar metabolites are presumably composed ofmore linear compounds.
Table 3.4Anaerobic biodegradation of [14C]DCOI (0.05 mg/kg), polarity anddistribution of metabolites in sediment and seawater. Data fromLawrence et al. 1991b.
% of 14C added
Time (days) DCOI Polarsubstances*
Non-polarsubstances**
CO2 Non-extractablesubstances
0 2.0 13.3 0.9 0.0 47.1
14 -A 25.3 2.1 1.1 41.4
29 - 23.0 1.5 4.0 41.6
61 -A 18.7 3.8 8.4 40.1
90 - 18.6 2.5 7.6 58.5
120 - 12.6 1.3 9.5 47.6
180 - 12.6 2.2 8.5 48.9
270 - 8.7 1.0 8.5 66.7
365 - *** *** 6.7 44.0
-, not detected (however: A, low conc. detected, probably artifact); * more polar thanDCOI; ** less polar than DCOI; *** sample lost.
Water-soluble metabolites from the transformation of DCOI constitutedbetween 3.6% and 9.3% of the radioactivity added throughout the entiretest period. Metabolites that were bound to the sediment and could not beextracted with methylene chloride/methanol constituted a constantly highpart of between 40% and 67% of the 14C added (Table 3.4). Further ex-traction with HCl and NaOH showed that relatively water-soluble me-tabolites constituted <0.1% while fulvic and humic acids constituted0.6% and 3.6%, respectively, of the 14C added after 365 days. Metabo-lites that were still bound to the sediment, probably to humin or clay,constituted 30% of the 14C added (Kesterson and Atkins 1992b). Theformation of metabolites binding to humic acids, humin and clay miner-als in the sediment is in agreement with the results in the aerobic biodeg-radation tests (Kesterson and Atkins 1992a).
Studies with Danish sedimentsThe anaerobic biodegradability of DCOI (0.83 µg/g) was examined byuse of a clayey sediment and its seawater (Appendix 2), which was also
29
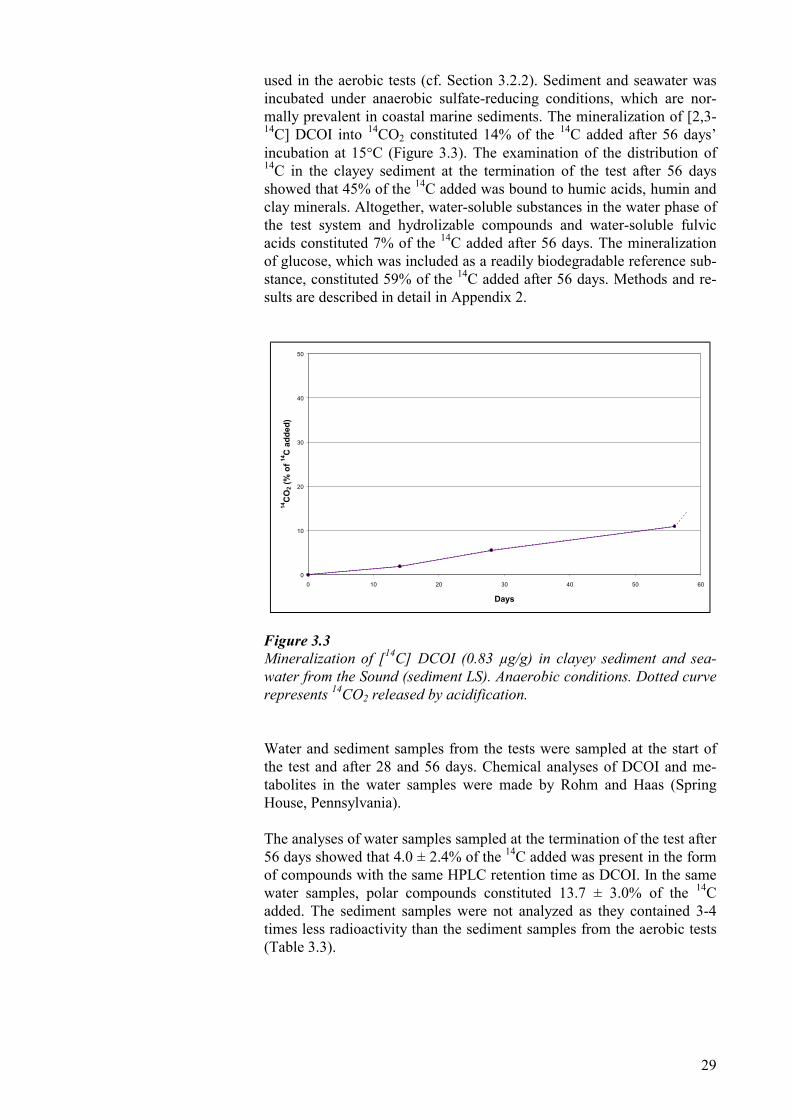
used in the aerobic tests (cf. Section 3.2.2). Sediment and seawater wasincubated under anaerobic sulfate-reducing conditions, which are nor-mally prevalent in coastal marine sediments. The mineralization of [2,3-14C] DCOI into 14CO2 constituted 14% of the 14C added after 56 days’incubation at 15°C (Figure 3.3). The examination of the distribution of14C in the clayey sediment at the termination of the test after 56 daysshowed that 45% of the 14C added was bound to humic acids, humin andclay minerals. Altogether, water-soluble substances in the water phase ofthe test system and hydrolizable compounds and water-soluble fulvicacids constituted 7% of the 14C added after 56 days. The mineralizationof glucose, which was included as a readily biodegradable reference sub-stance, constituted 59% of the 14C added after 56 days. Methods and re-sults are described in detail in Appendix 2.
0
10
20
30
40
50
0 10 20 30 40 50 60
Days
14C
O2 (
% o
f 14C
add
ed)
Figure 3.3Mineralization of [14C] DCOI (0.83 µg/g) in clayey sediment and sea-water from the Sound (sediment LS). Anaerobic conditions. Dotted curverepresents 14CO2 released by acidification.
Water and sediment samples from the tests were sampled at the start ofthe test and after 28 and 56 days. Chemical analyses of DCOI and me-tabolites in the water samples were made by Rohm and Haas (SpringHouse, Pennsylvania).
The analyses of water samples sampled at the termination of the test after56 days showed that 4.0 ± 2.4% of the 14C added was present in the formof compounds with the same HPLC retention time as DCOI. In the samewater samples, polar compounds constituted 13.7 ± 3.0% of the 14Cadded. The sediment samples were not analyzed as they contained 3-4times less radioactivity than the sediment samples from the aerobic tests(Table 3.3).
30
3.2.4 Transformation and fate of DCOI in a harbourAn investigation of the spread and removal of DCOI was carried out inthe vicinity of a freshly painted ship and of another ship that had beenpainted a couple of months earlier. Both ships were lying in Korsør Har-bour where the investigations were made on 26 and 27 October 1998.Those days, the temperature of the water was approx. 10°C and variedvery little according the depth of the water (Steen et al. 1999). The windwas southwesterly (between approx. 240 and 255° on 26 October andapprox. 200° on 27 October). The wind velocity was approx. 8-10 m/secwith wind blasts of up to 15 m/sec on 26 October and a little more on 27October (Danish Meteorological Institute 1999). The entrance of KorsørHarbour points in a north-easterly direction why the water must be ex-pected to have been pressed out of the harbour.
The concentration of DCOI in the water phase was measured along twotransects: one perpendicular to the direction of the ships and the other innorth-easterly direction, i.e. in the wind direction. Most of the sampleswere taken on 26 October. The samples were taken over a relatively shortperiod of time (approx. 5 hours) and the measured concentrations canthus only be considered valid for the day in question. The highest con-centrations measured of DCOI were <300 ng/L close to the ship’s side(≤1 m) and decreased to <50 ng/L at a distance of approx. 30 metres fromthe ship. The concentration of DCOI in a distance of 2 metres from theships (along the transect and perpendicular to the ships) varied very littleaccording to the water depth why the vertical mixing was considered tobe total.
Steen et al. (1999) have made model calculations in which Korsør Har-bour was modelled as a one-dimensional box, in which the flow in andout of the harbour was neglected and in which the dispersion coefficientwas varied between approx. 0.004-0.03 m2/s. This interval is stated to bethe end points of the expected variation interval of the dispersion coeffi-cient of the harbour. Apart from the spread, a first order disappearancekinetics is assumed for DCOI. The simulations were made with threedifferent rate constants for this first order process: 0 day-1, 1 day-1, and 1hour-1. As a result of the winds on 26 and 27 October, the dispersionmust presumably have been high in the basin. By way of comparison itmay be mentioned that the horizontal dispersion coefficient in Danishcoastal waters typically varies between 0.04 and 5 m2/s (Harremoës andMalmgren-Hansen 1989). As regards the two transects, the best correla-tion between the measured and the calculated DCOI concentrations wasachieved by use of a rate constant of disappearance of between 1 hour-1
and 1 day-1.
With the rate constant, 1 hour-1, a good correlation was achieved betweenmeasured and calculated values close to the ships for one transect whilethe concentrations of the other transect was underestimated at distancesof more than approx. 8 m. For both transects, the calculated concentra-tions are lower than the measured concentrations at larger distances fromthe ships (approx. 30 m). When assuming a rate constant of disappear-ance of 1 day-1, the calculated concentrations are higher than the meas-ured concentrations close to the ships for both transects but lower thanthe measured concentrations farther away (approx. 60 m). There are thus
31
indications that the rate constant of the disappearance of DCOI close tothe ships is higher than the corresponding constant farther away from theships. On this basis, the rate constant of disappearance of the whole basinis considered to be between 1 hour-1 and 1 day-1, which corresponds to ahalf-life of between approx. 0.69 and 16.6 hours. This half-life includesbiological and abiotic transformation as well as processes like sorption tosuspended matter, sedimentation, potential vertical mixing and potentialimperfection in the calculation of the dilution in the harbour.
3.3 Bioaccumulation and aquatic toxicity
3.3.1 BioaccumulationStudies on the bioaccumulation of DCOI in fish are available but not inother types of organisms (e.g. mussels). The ability of DCOI to bioaccu-mulate in fish has been examined in laboratory tests over 28 days by useof [14C]DCOI. Two studies including chemical analyses of water andtissue samples have been made (Forbis et al. 1985; Derbyshire et al.1991). In all tests, [14C]DCOI was continuously added to a flow-throughsystem. Chemical analyses showed that, at the final part of the tests, theconcentration of DCOI was considerably lower than the nominal con-centration (e.g. 4.5% and 0.55% of the 14C added after 21 and 28 days,respectively (Leak 1986)) while DCOI was hardly measurable in the sec-ond test (Derbyshire et al. 1991). Presumably, the principal part of theremaining 14C activity in the water represented one or more polar me-tabolites.
The BCF values found (measured as radioactivity) were more or lessidentical in the two studies. The BCF values were 130-200 for muscletissue, 700-1,100 for internal organs and 600 for the whole fish (Forbis etal. 1985; Derbyshire et al. 1991). The chemical analyses demonstratedthat only 1% of the radioactivity in the fish was intact DCOI (Leak1986). In connection with the study by Derbyshire et al. (1991), HPLC aswell as TLC was used for identifying 14C labelled substances accumu-lated in the tissue of the fish. These studies indicate that it was mostlikely a question of substances without an isothiazolone ring structureand that the substances were built into the protein of the fish. The resultsindicate that DCOI was transformed in the water, after which it wasmainly polar and probably linear compounds that were taken up in thefish. This assumption is confirmed by the biodegradation of DCOI (cf.Section 3.2.2; Lawrence et al. 1991a). It is thus considered likely that themeasured BCF values should rather be related to metabolites of DCOIbut as only a few of these metabolites are identified, the importance ofthe recorded bioaccumulation of labelled 14C cannot be assessed.
3.3.2 Toxicity towards aquatic organismsAquatic organismsThe toxicity of DCOI has been examined in standard laboratory testswith a number of aquatic organisms living in fresh water and in seawater:
Fresh water:• Selenastrum capricornutum, green algae (Forbis 1990)

32
• Daphnia magna, crustacean (Burgess 1990; Ward and Boeri 1990)• Oncorhynchus mykiss, rainbow trout (Shade et al. 1993)• Lepomis macrochirus, bluegill sunfish (Shade et al. 1993) Seawater:• Skeletonema costatum, green algae (Debourg et al. 1993)• Mysidopsis bahia, mysid, crustacean (Boeri and Ward 1990)• Penaeus aztecus, brown shrimp, crustacean (Heitmuller 1977)• Cyprinodon variegatus, sheepshead minnow, fish (Shade et al. 1993)• Paralichthys olivaceus, Japanese flatfish, fish (Kawashima 1997a)• Pagrus major, red sea bream, fish (Kawashima 1997b)• Crassostrea virginica, oysters (Roberts et al. 1990)
Furthermore, tests with one mussel and protozoans are quoted by Shadeet al. (1993) and Debourg et al. (1993), respectively. In some of the tests,problems with maintaining a constant exposure concentration have beenreported and not all results have been calculated on the basis of measuredconcentrations (see below). The result of these irregularities is an over-estimation of the effect concentrations - resulting in an underestimationof the toxicity of the substance.
The results, which are compiled in Appendix 4, show that there was nobig difference in the sensitivity of freshwater and marine organisms. Ta-ble 3.5 summarizes the effects on the different groups of organisms.
Table 3.5Ecotoxicological data on effects of DCOI on aquatic organisms (see Ap-pendix 4 for detailed data).
Taxonomic group End point Exposure time[days]
Results[mg/L]
Algae EC50 4-5 0.0139-0.036
Crustaceans EC/LC50 2-4 0.0047-1.312
Crustaceans NOEC* (repro-duction)
21 0.00063
Fish LC50 4 0.0027-0.030
Fish NOEC (early lifestage, ELS)
35 0.006
Molluscs (snails, mus-sels)
EC/LC50 2-4 0.0019-0.850
Protozoans 100% effect ? 5
* The highest concentration at which no effects were observed (NOEC, No Ob-served Effect Concentration).
The results from the algal tests performed (Forbis 1990) are calculated onthe basis of the nominal concentration. The report on one of the testsshows that the concentration of DCOI decreased during the whole testperiod. Only 48% of the nominal concentration was left after 48 hoursand, at the end of the test after 72 hours, it was only possible to measure

33
the substance in the test vessels containing the highest concentration(Forbis 1990). The EC50 values stated are thus too high.
A 21-day reproduction test with daphnids (Ward and Boeri 1990) wasconducted in such a way that is difficult to draw certain conclusions. Thisis due to the use of various concentrations of a solvent in relation to theaddition of DCOI and to large variation in the data. The NOEC valuestated represents the lowest concentration tested but the way in which thetest has been conducted does not exclude that effects of DCOI may haveoccurred at this concentration as the effect may be dimmed as an unin-tentional result of the solvent. As the result of this test is the lowestNOEC value found in the tests, this value forms the basis of the calcula-tion of PNEC for DCOI.
N-(n-octyl) malonamicacidThe acute aquatic toxicity of N-(n-octyl) malomanic acid, which is animportant metabolite from the transformation of DCOI (cf. Section3.2.2), has been investigated in tests with fish and daphnia. The toxicityof N-(n-octyl) malomanic acid was tested in static tests and the calcula-tions are based on measured mean concentrations of the substance. Theeffect concentrations for N-(n-octyl) malomanic acid are given for daph-nia (48 h): EC50 = 260 mg/L, NOEC = 16 mg/L (Sword and Muckerman1994b) and for rainbow trout (96 h): LC50 = 250 mg/L, NOEC = 160mg/L (Sword and Muckerman 1994a). In the daphnia test, there is largevariation in data and the basis of the calculation of the result is notclearly defined. Daphnids lying on the bottom of the test vessels do notseem to have been included as “immobile”, which they should accordingto the method description used. The actual EC50 is estimated to be in theinterval of 90-160 mg/L rather than 260 mg/L as stated in the report(Sword and Muckerman 1994b).
Even with the above reservations, it must, however, be concluded that N-(n-octyl) malomanic acid is several orders of magnitude less toxic thanDCOI.
In connection with the investigations of N-(n-octyl) malomanic acid,QSAR calculations have been made of the toxicity of this metabolite andsome substances with similar structure, which are important metabolitesfrom the microbial transformation of DCOI. The results are given in Ta-ble 3.6.

34
Table 3.6QSAR calculations of the toxicity and the potential bioaccumulation offour probable metabolites from the transformation of DCOI.
Substance Calculated EC50(48 h), daphnids
[mg/L] *
Calculated EC50(48 h), trout
[mg/L] **
Calculatedoctanol-water
coefficient[log Kow] **
N-(n-octyl) malonamic acid 172 199 1.9
N-(n-octyl) acetamide 102 115 2.0
N-(n-octyl) oxamic acid 140 160 1.9
N-(n-octyl)-β-hydroxypropionamide 261 Not determined Not determined
* From Sword and Muckerman 1994b.** Personal comm., Andrew Jacobson, Rohm and Haas Company.
The results in Table 3.6 indicate that the probable metabolites from thetransformation of DCOI are neither particularly toxic nor bioaccumula-tive in aquatic organisms.
Sediment-livingorganismsResults of a 10-day test with the marine sediment-living crustacean, theamphipod Ampelisca abdita are available: LC50 = 320 mg/kg and NOEC= 6.9 mg/kg dry weight (Putt 1994). The test was made with 14C-labelledDCOI and the concentrations were measured as radioactivity. At the endof the test, approx. 90% of the 14C activity was attached to the sedimentwhile the remaining part was distributed in the ratio of approx. 8:2 ofpore water to the water above the sediment. No chemical analyses weremade and the authors draw attention to the fact that the measured radio-activity is probably owing to metabolites and not to DCOI.
Algal communitiesAcute and chronic effects of DCOI have been examined on communitiesof natural phytoplankton (planktonic algae) and epipsammon (micro al-gae living on grains of sand). Acute and chronic effects of DCOI oncommunities of phytoplankton have been found at a concentration ofDCOI of 0.0003 mg/L (the lowest concentration in which effects wereobserved, Lowest Observed Effect Concentration, LOEC) (Arrhenius1997). The acute effect of DCOI was a stimulation of the activity of thealgae while the chronic effect was an adaptation to DCOI in a few days.Inhibition of the photosynthesis occurred at higher concentrations (EC50:0.05-0.1 mg/L (95% confidence interval)). The study concludes that theeffect of DCOI was still significant at the end of the test after 7 days.Communities of epipsammon were extremely tolerant to DCOI and theeffect concentrations were several orders of magnitude higher than thosefor phytoplankton.
Effects of degradation ofDCOI on aquatic toxicityLaboratory tests have been made in which the effects of degradation onthe toxicity towards aquatic organisms were tested for a number of anti-
35
foulants including DCOI, Irgarol 1051 and Diuron (Callow and Finlay1995; Callow and Willingham 1996). In these tests, the substances wereincubated in seawater, seawater enriched with of marine bacteria and insterilized seawater. Changes in the toxicity as the result of degradation ofthe active substances were tested towards marine bacteria (counting ofcolonial bacteria), diatoms (Amphora coffeaeformis) and crustaceans(Artemia salina). The degradation tests were started at concentrations ofthe substances causing 80% effect on the algae (EC80 = 0.5 mg/L forDCOI) so that a potential decrease of the toxicity of the solutions couldbe traced. The results showed that the toxicity practically did not de-crease in sterilized seawater, and that the transformation of the activesubstance into metabolites with low toxicity progressed most rapidly inthe bacteria-enriched seawater. The diatom test showed that e.g. the tox-icity of DCOI had been considerably reduced (from approx. 80% to ap-prox. 20% inhibition) after two weeks in natural and in bacteria-enrichedseawater and that tests incubated for 4, 6 and 8 weeks in these two typesof seawater caused 10% or no significant inhibition (Callow and Finlay1995). The half-life of the toxicity of DCOI was calculated at 8.5 days innatural seawater and 3 days in bacteria-enriched seawater (Callow andFinlay 1995).
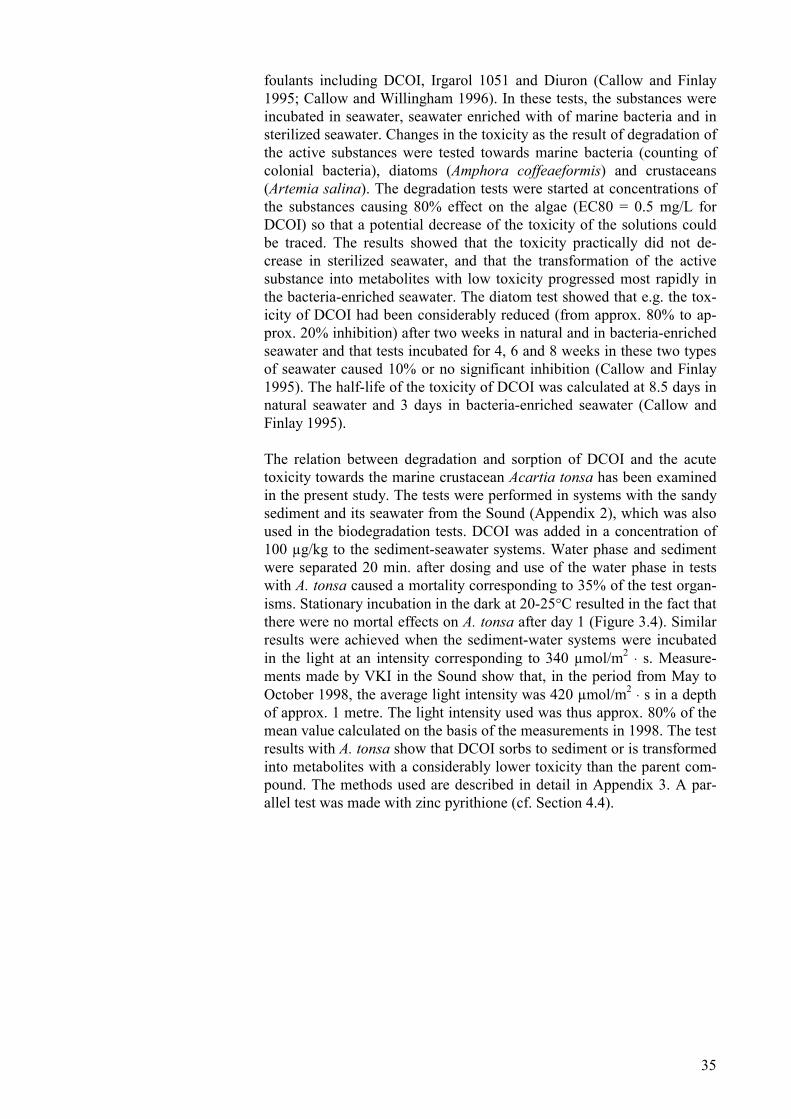
The relation between degradation and sorption of DCOI and the acutetoxicity towards the marine crustacean Acartia tonsa has been examinedin the present study. The tests were performed in systems with the sandysediment and its seawater from the Sound (Appendix 2), which was alsoused in the biodegradation tests. DCOI was added in a concentration of100 µg/kg to the sediment-seawater systems. Water phase and sedimentwere separated 20 min. after dosing and use of the water phase in testswith A. tonsa caused a mortality corresponding to 35% of the test organ-isms. Stationary incubation in the dark at 20-25°C resulted in the fact thatthere were no mortal effects on A. tonsa after day 1 (Figure 3.4). Similarresults were achieved when the sediment-water systems were incubatedin the light at an intensity corresponding to 340 µmol/m2 ⋅ s. Measure-ments made by VKI in the Sound show that, in the period from May toOctober 1998, the average light intensity was 420 µmol/m2 ⋅ s in a depthof approx. 1 metre. The light intensity used was thus approx. 80% of themean value calculated on the basis of the measurements in 1998. The testresults with A. tonsa show that DCOI sorbs to sediment or is transformedinto metabolites with a considerably lower toxicity than the parent com-pound. The methods used are described in detail in Appendix 3. A par-allel test was made with zinc pyrithione (cf. Section 4.4).

36
0
10
20
30
40
50
60
70
80
90
100
0 2 4 6 8 10 12 14 16Days
% le
thal
ity
Figure 3.4Effects of degradation of DCOI (100 µg/kg) dosed to sediment and sea-water on the acute toxicity to Acartia tonsa (test performed in the dark).
3.4 Risk assessment of DCOI
Calculation of exposureconcentrations (PEC)In order to calculate the exposure concentrations (PEC, Predicted Envi-ronmental Concentration), a model was established, based on principlesnormally used for exposure assessments (EC 1996). The exposure as-sessments were made for two scenarios:
• A pleasure craft harbour (on the basis of the conditions in the pleasurecraft harbour of Jyllinge)
• A busy navigation route (on the basis of the conditions at the Kron-prins Frederiks Bro, Frederikssund)
The model and the two scenarios are described in detail in Appendix 1.For the parent compound and the most essential metabolites, the follow-ing exposure concentrations were calculated for each of the two scenar-ios: • PEC (water column)• PEC (sediment)• PEC (sediment-pore water) The three exposure concentrations were defined as the steady-state con-centration of the sub-environment in question. I.e., the concentrationwhich the calculated concentrations eventually approach when a con-tinuous leaching of the parent compound to the water environment issimulated. The calculations of PEC have been made by use of realisticworst-case scenarios, which means that the parameters used in the modelare based on realistically conservative assumptions, which results in thefact that, in practice, the calculated PEC values are seldom exceeded.The model used is not validated towards measured concentrations in har-
37
bour environments or navigation routes. More of the assumptions thatform part of the simulation are of vital importance to the result of thecalculations: • The background concentrations for both the parent compound and the
metabolites were assumed to be zero. • 70% of the pleasure craft was assumed to have been painted with
paint containing DCOI. • The leaching rate of DCOI from bottom paints was calculated at 13
mg/m2/day in harbours and 25 mg/m2/day when sailing (Appendix 1). • The primary biological transformation of DCOI into the expected
metabolite N-(n-octyl) malonamic acid was assumed to proceed witha half-life of 14 hours in surface water at a temperature of 12°C.
The biological half-life of DCOI of 14 hours, which was assumed in thesimulation, is established on the basis of an experimentally determinedhalf-life in seawater at 12°C (Jakobson and Kramer 1999). The half-lifeof DCOI in seawater and not in seawater and sediment was chosen as theresult of the simulation is exposure concentrations at a continuousleaching of DCOI to seawater after steady state was achieved. When thepleasure craft are taken out of the water at the end of the sailing season,DCOI will probably be rapidly eliminated as DCOI is either transformedin the water phase or sorbs to the sediment, in which it is transformedwith a very short half-life (cf. Sections 3.2.2 and 3.2.3).
The exposure concentrations calculated for DCOI and its metabolites areapprox. 50 times higher in the pleasure craft harbour than in the busynavigation route outside the harbour (Table 3.7).
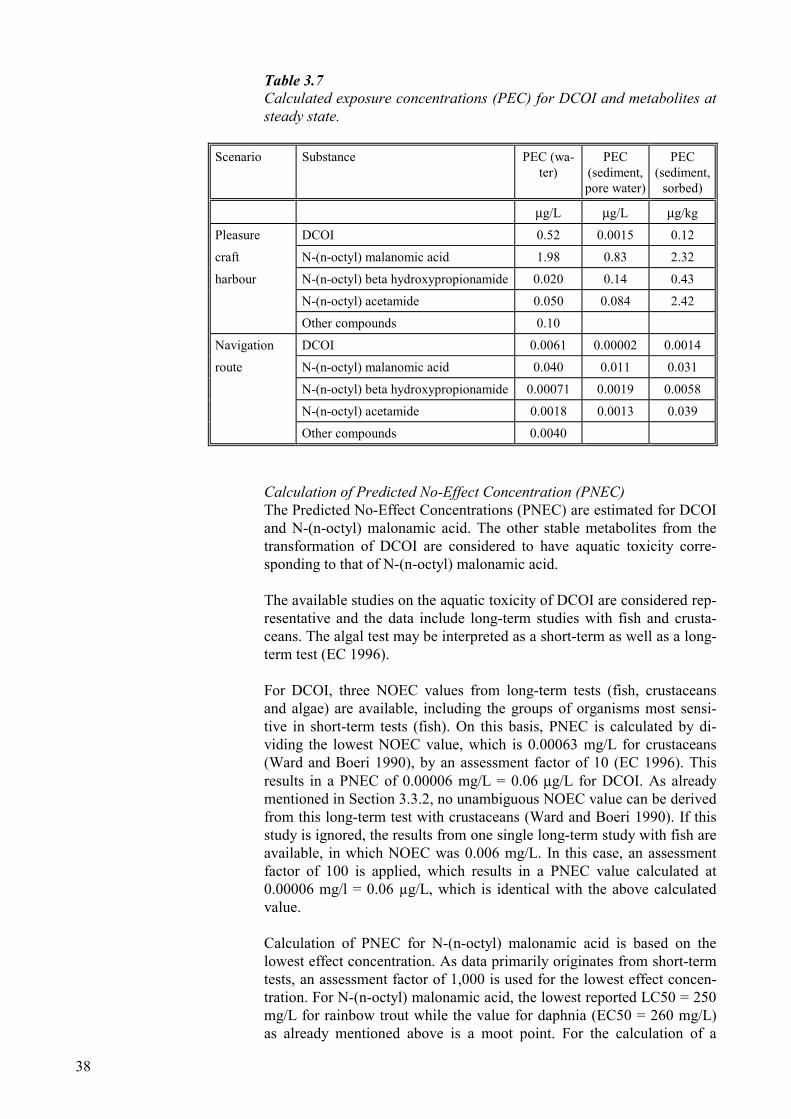
38
Table 3.7Calculated exposure concentrations (PEC) for DCOI and metabolites atsteady state.
Scenario Substance PEC (wa-ter)
PEC(sediment,pore water)
PEC(sediment,
sorbed)
µg/L µg/L µg/kg
Pleasure DCOI 0.52 0.0015 0.12
craft N-(n-octyl) malanomic acid 1.98 0.83 2.32
harbour N-(n-octyl) beta hydroxypropionamide 0.020 0.14 0.43
N-(n-octyl) acetamide 0.050 0.084 2.42
Other compounds 0.10
Navigation DCOI 0.0061 0.00002 0.0014
route N-(n-octyl) malanomic acid 0.040 0.011 0.031
N-(n-octyl) beta hydroxypropionamide 0.00071 0.0019 0.0058
N-(n-octyl) acetamide 0.0018 0.0013 0.039
Other compounds 0.0040
Calculation of Predicted No-Effect Concentration (PNEC)The Predicted No-Effect Concentrations (PNEC) are estimated for DCOIand N-(n-octyl) malonamic acid. The other stable metabolites from thetransformation of DCOI are considered to have aquatic toxicity corre-sponding to that of N-(n-octyl) malonamic acid.
The available studies on the aquatic toxicity of DCOI are considered rep-resentative and the data include long-term studies with fish and crusta-ceans. The algal test may be interpreted as a short-term as well as a long-term test (EC 1996).
For DCOI, three NOEC values from long-term tests (fish, crustaceansand algae) are available, including the groups of organisms most sensi-tive in short-term tests (fish). On this basis, PNEC is calculated by di-viding the lowest NOEC value, which is 0.00063 mg/L for crustaceans(Ward and Boeri 1990), by an assessment factor of 10 (EC 1996). Thisresults in a PNEC of 0.00006 mg/L = 0.06 µg/L for DCOI. As alreadymentioned in Section 3.3.2, no unambiguous NOEC value can be derivedfrom this long-term test with crustaceans (Ward and Boeri 1990). If thisstudy is ignored, the results from one single long-term study with fish areavailable, in which NOEC was 0.006 mg/L. In this case, an assessmentfactor of 100 is applied, which results in a PNEC value calculated at0.00006 mg/l = 0.06 µg/L, which is identical with the above calculatedvalue.
Calculation of PNEC for N-(n-octyl) malonamic acid is based on thelowest effect concentration. As data primarily originates from short-termtests, an assessment factor of 1,000 is used for the lowest effect concen-tration. For N-(n-octyl) malonamic acid, the lowest reported LC50 = 250mg/L for rainbow trout while the value for daphnia (EC50 = 260 mg/L)as already mentioned above is a moot point. For the calculation of a

39
PNEC for N-(n-octyl) malonamic acid, an LC50 value of 90 mg/L (to-wards daphnids) is used as this value is considered the actual effect con-centration in the tests performed (cf. Section 3.3.2). This results in aPNEC value of 0.09 mg/L = 90 µg/L. The calculated PNEC for N-(n-octyl) malonamic acid is assumed to be representative of the other me-tabolites from the transformation of DCOI. The two calculations ofPNEC are shown in Table 3.8.
Table 3.8Calculation of PNEC for DCOI and N-(n-octyl) malonamic acid.
Substance Lowest effect concentration Value[µg/L]
Assessmentfactor
PNEC[µg/L]
DCOI Long-term testNOEC crustaceans
0.63 10 0.06
N-(n-octyl) malonamic acid Short-term testEC50 crustaceans
90,000 1,000 90
Risk quotientOn the basis of the above calculated PEC (water) values for DCOI and itsmetabolites given in Table 3.7 and PNEC values for DCOI and N-(n-octyl) malonamic acid, the risk quotients Rq = (PEC/PNEC) can be cal-culated as shown in Table 3.9.
Table 3.9Calculation of risk quotients (Rq) for DCOI and its metabolites.
Substance PNEC Pleasure craft harbour Navigation route
[µg/L]PEC
[µg/L]Rq PEC
[µg/L]Rq
DCOI 0.06 0.52 8.7 0.0061 0.10
Metabolites 90* 2.2 0.02 0.047 0.0005
* N-(n-octyl) malonamic acid
The stated risk quotients are calculated on the basis of realistic worst-case scenarios (Appendix 1), which are i.a. based on the assumption that70% of the pleasure craft are painted with a bottom paint containingDCOI. On the basis of the assumptions made in the simulation and of thecalculated PEC values, it is considered likely that a risk of chronic eco-toxic effects within the pleasure craft harbour may exist as, presumably,DCOI will constantly be applied by leaching from bottom paints. Therisk quotient for DCOI out of the harbour is less than 1 and here, the riskof ecotoxic effects is considered to be low.
Within as well as out of the pleasure craft harbour, a very small risk ofecotoxic effects of metabolites from the transformation of DCOI is con-sidered to exist.
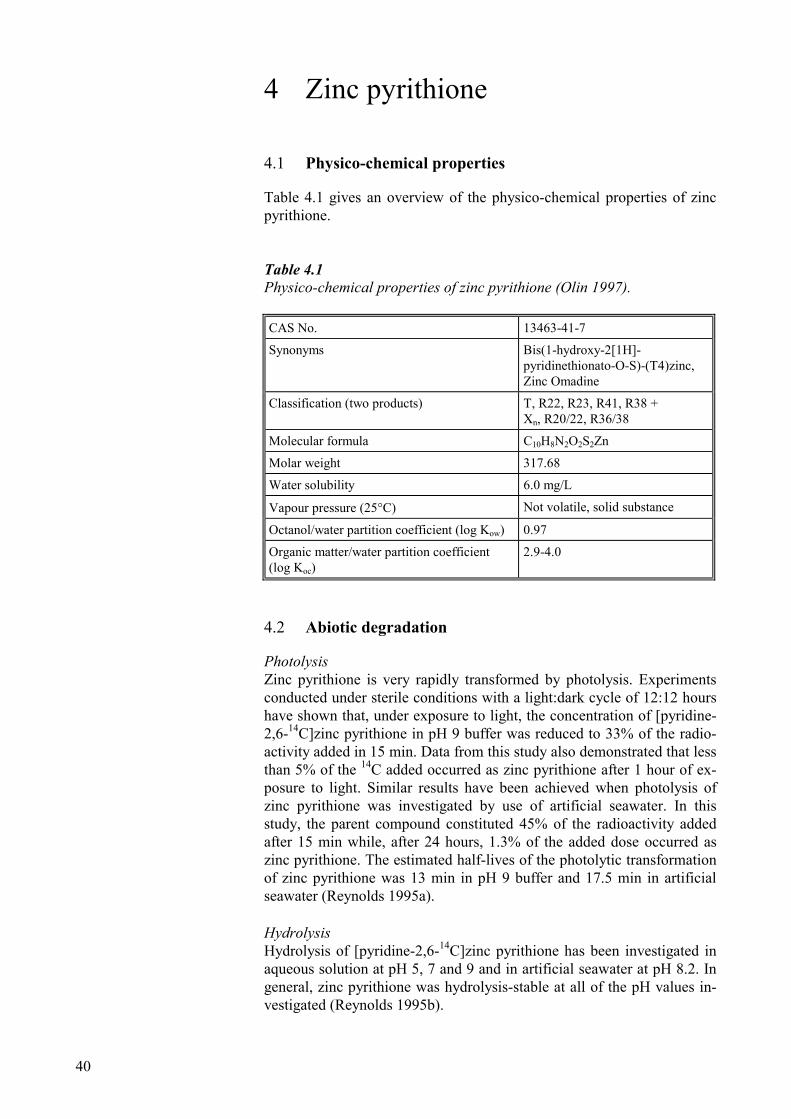
40
4 Zinc pyrithione
4.1 Physico-chemical properties
Table 4.1 gives an overview of the physico-chemical properties of zincpyrithione.
Table 4.1Physico-chemical properties of zinc pyrithione (Olin 1997).
CAS No. 13463-41-7
Synonyms Bis(1-hydroxy-2[1H]-pyridinethionato-O-S)-(T4)zinc,Zinc Omadine
Classification (two products) T, R22, R23, R41, R38 +Xn, R20/22, R36/38
Molecular formula C10H8N2O2S2Zn
Molar weight 317.68
Water solubility 6.0 mg/L
Vapour pressure (25°C) Not volatile, solid substance
Octanol/water partition coefficient (log Kow) 0.97
Organic matter/water partition coefficient(log Koc)
2.9-4.0
4.2 Abiotic degradation
PhotolysisZinc pyrithione is very rapidly transformed by photolysis. Experimentsconducted under sterile conditions with a light:dark cycle of 12:12 hourshave shown that, under exposure to light, the concentration of [pyridine-2,6-14C]zinc pyrithione in pH 9 buffer was reduced to 33% of the radio-activity added in 15 min. Data from this study also demonstrated that lessthan 5% of the 14C added occurred as zinc pyrithione after 1 hour of ex-posure to light. Similar results have been achieved when photolysis ofzinc pyrithione was investigated by use of artificial seawater. In thisstudy, the parent compound constituted 45% of the radioactivity addedafter 15 min while, after 24 hours, 1.3% of the added dose occurred aszinc pyrithione. The estimated half-lives of the photolytic transformationof zinc pyrithione was 13 min in pH 9 buffer and 17.5 min in artificialseawater (Reynolds 1995a).
HydrolysisHydrolysis of [pyridine-2,6-14C]zinc pyrithione has been investigated inaqueous solution at pH 5, 7 and 9 and in artificial seawater at pH 8.2. Ingeneral, zinc pyrithione was hydrolysis-stable at all of the pH values in-vestigated (Reynolds 1995b).

41
4.3 Biodegradation of zinc pyrithione in the aquatic envi-ronment
Transformation ofzinc pyrithioneExperiments with freshwater and marine sediments have shown that thetransformation of zinc pyrithione in aquatic systems proceeds with aninitial rapid rate followed by a slower rate. This is the result of the distri-bution between the water phase and the sediment, in which the degrada-tion proceeds with different rates in the two sub-environments. The re-sulting two-phased transformation is observed in fresh water as well as inseawater and under both aerobic and anaerobic conditions (Ritter 1996,1999a-e). The half-lives of removal of zinc pyrithione from the waterphase via degradation and sorption to the sediment were between 0.5 and0.6 hours. For the aerobic as well as the anaerobic systems, this removalresulted in <5% of the added dose remaining in the water phase after 6hours. In the following second phase, the removal of sorbed pyrithioneproceeded with a half-life of 4 days under aerobic conditions and 19hours under anaerobic conditions, respectively (Ritter 1999a-e).
Zinc pyrithione reacts by transchelation in the presence of metals trans-forming zinc pyrithione into copper(II) pyrithione and other more stablemetal-pyrithione complexes. The slower secondary transformation rate instudies performed at a low concentration of zinc pyrithione (0.05 µg/g) isprobably due to the sorption of the metal-pyrithione complexes to thesediment (Ritter 1999a-e). In previous studies, in which a higher con-centration of zinc pyrithione (3 µg/g) was used, the secondary transfor-mation rate may be the result of the lower water solubility of cop-per(II)pyrithione being limiting to the transformation rate (Ritter 1996;Smalley and Reynolds 1996).
Zinc pyrithione is transformed to heterocyclic metabolites with one ringlike omadine sulfonic acid and pyridine sulfonic acid. More other me-tabolites identified by Arch Chemicals are known to VKI but are given asNP1-NP5 in this project.
4.3.1 Mineralization and metabolites in aerobic sedimentThe aerobic biodegradability of zinc pyrithione (3 µg/g) was investigatedby use of water and sediments collected in freshwater and marine har-bours in which maintenance of boats is carried out (Ritter 1996). Laterinvestigations with seawater and sediment were made with both zinc py-rithione and copper pyrithione, which were added at a lower concentra-tion of 0.05 µg/g (Ritter 1999a, b, d). In these studies, the degradationproceeded at the same rate and resulted in the same metabolites whetherthe pyrithione was added as the zinc or the copper complex. The greatestimportance is attached to the results of the most recent experiments asthe lower concentration of the parent compound results in more realisticmechanisms of sorption and degradation.
Mineralization andmetabolites

42
After 84 days of incubation at 25°C, the mineralization of [pyridine-2,6-14C]zinc pyrithione (0.05 µg/g) to 14CO2 in seawater and sediment con-stituted 0.44% of the 14C added (Ritter 1999a, b, d). A correspondinglylow mineralization was observed in the previous studies, in which zincpyrithione was added at a concentration of 3 µg/g (Ritter 1996). In thefresh water and sediment, the mineralization of zinc pyrithione washigher as 12% of the 14C added was transformed to 14CO2 after 30 days at25°C (Ritter 1996).
The first stage of the aerobic degradation of zinc pyrithione is the forma-tion of its disulfide, which is identified as omadine disulfide. In studiesperformed with zinc pyrithione at the concentration of 3 µg/g (Ritter1996), omadine disulfide was formed as one of the most important me-tabolites. Omadine disulfide has almost the same chemical structure aszinc pyrithione and has been shown to be very toxic to aquatic organisms(Table 4.7). The presence of omadine disulfide was only transient as thefurther transformation of this metabolite caused omadine disulfide toconstitute 2.8% of the radioactivity added after 30 days in the experimentwith seawater and sediment (in the experiment with fresh water andsediment, the concentration of omadine disulfide was below the detectionlimit of 0.3 ng/g after 30 days). The demonstration of omadine disulfidein the studies, in which zinc pyrithione was added in 3 µg/g, is probablydue to the kinetics of desorption and degradation at the concentrationused, which is considered environmentally unrealistic. In the more recentexperiments, in which the level of concentration was 0.05 µg/g (Ritter1999a, b, d), omadine disulfide was not detected and omadine disulfidemust thus be considered a transient metabolite in the biological transfor-mation of zinc pyrithione into heterocyclic compounds with one ring. Onthe basis of the experiments made at a concentration of 0.05 µg/g, themost important metabolites from the aerobic degradation of zinc pyri-thione are considered to be omadine sulfonic acid and pyridine sulfonicacid and two other metabolites called NP1 and NP2 (Table 4.2). NP2 wasonly demonstrated by extraction of the sediment with alkali. It is, how-ever, not clear yet whether this metabolite was formed in the sedimentbefore extraction or by a chemical reaction in the alkaline extract. Datafrom investigations of the transformation of copper pyrithione in anaero-bic aquatic systems suggest that, most likely, NP2 was present in thesediment before the extraction (Ritter 1999a-e).
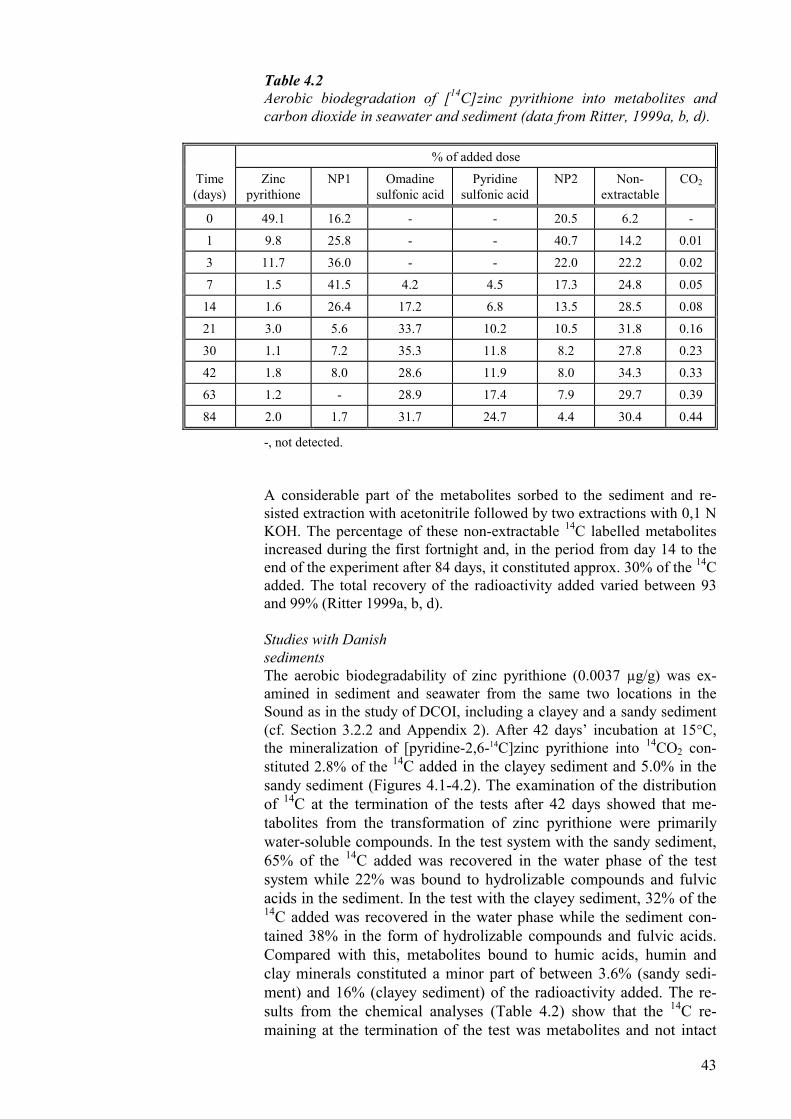
43
Table 4.2Aerobic biodegradation of [14C]zinc pyrithione into metabolites andcarbon dioxide in seawater and sediment (data from Ritter, 1999a, b, d).
% of added dose
Time(days)
Zincpyrithione
NP1 Omadinesulfonic acid
Pyridinesulfonic acid
NP2 Non-extractable
CO2
0 49.1 16.2 - - 20.5 6.2 -
1 9.8 25.8 - - 40.7 14.2 0.01
3 11.7 36.0 - - 22.0 22.2 0.02
7 1.5 41.5 4.2 4.5 17.3 24.8 0.05
14 1.6 26.4 17.2 6.8 13.5 28.5 0.08
21 3.0 5.6 33.7 10.2 10.5 31.8 0.16
30 1.1 7.2 35.3 11.8 8.2 27.8 0.23
42 1.8 8.0 28.6 11.9 8.0 34.3 0.33
63 1.2 - 28.9 17.4 7.9 29.7 0.39
84 2.0 1.7 31.7 24.7 4.4 30.4 0.44
-, not detected.
A considerable part of the metabolites sorbed to the sediment and re-sisted extraction with acetonitrile followed by two extractions with 0,1 NKOH. The percentage of these non-extractable 14C labelled metabolitesincreased during the first fortnight and, in the period from day 14 to theend of the experiment after 84 days, it constituted approx. 30% of the 14Cadded. The total recovery of the radioactivity added varied between 93and 99% (Ritter 1999a, b, d).
Studies with DanishsedimentsThe aerobic biodegradability of zinc pyrithione (0.0037 µg/g) was ex-amined in sediment and seawater from the same two locations in theSound as in the study of DCOI, including a clayey and a sandy sediment(cf. Section 3.2.2 and Appendix 2). After 42 days’ incubation at 15°C,the mineralization of [pyridine-2,6-14C]zinc pyrithione into 14CO2 con-stituted 2.8% of the 14C added in the clayey sediment and 5.0% in thesandy sediment (Figures 4.1-4.2). The examination of the distributionof 14C at the termination of the tests after 42 days showed that me-tabolites from the transformation of zinc pyrithione were primarilywater-soluble compounds. In the test system with the sandy sediment,65% of the 14C added was recovered in the water phase of the testsystem while 22% was bound to hydrolizable compounds and fulvicacids in the sediment. In the test with the clayey sediment, 32% of the14C added was recovered in the water phase while the sediment con-tained 38% in the form of hydrolizable compounds and fulvic acids.Compared with this, metabolites bound to humic acids, humin andclay minerals constituted a minor part of between 3.6% (sandy sedi-ment) and 16% (clayey sediment) of the radioactivity added. The re-sults from the chemical analyses (Table 4.2) show that the 14C re-maining at the termination of the test was metabolites and not intact
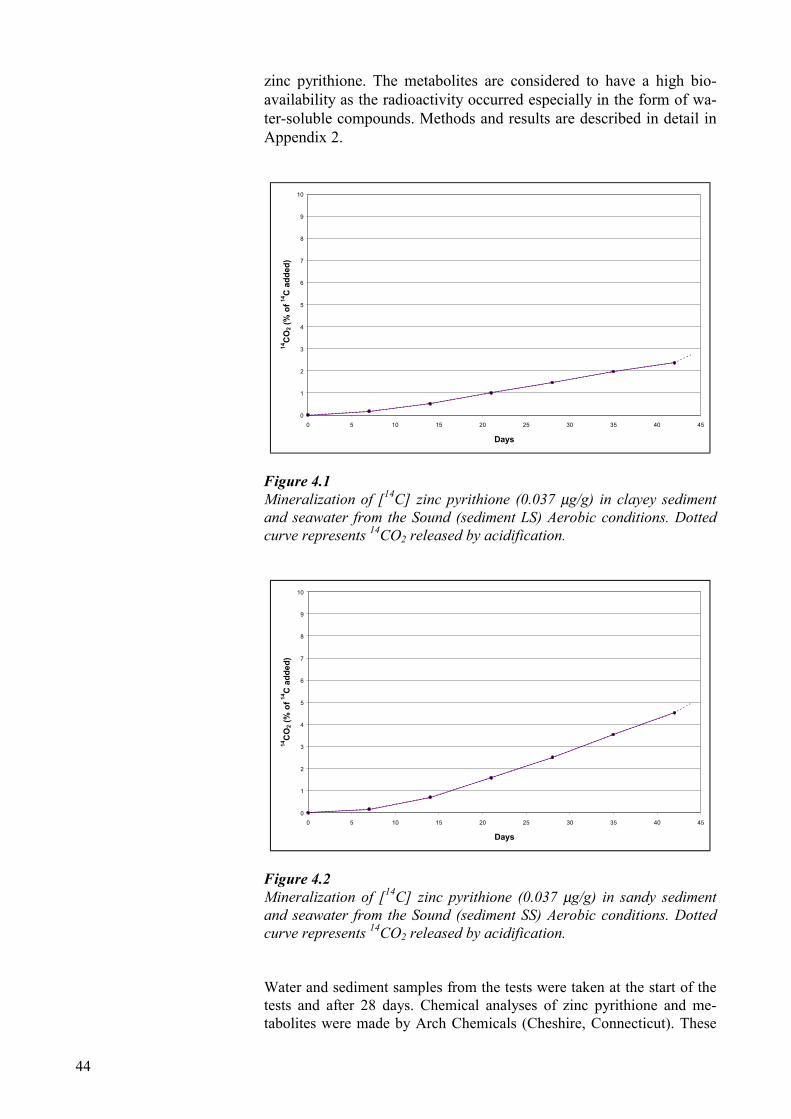
44
zinc pyrithione. The metabolites are considered to have a high bio-availability as the radioactivity occurred especially in the form of wa-ter-soluble compounds. Methods and results are described in detail inAppendix 2.
0
1
2
3
4
5
6
7
8
9
10
0 5 10 15 20 25 30 35 40 45
Days
14C
O2 (
% o
f 14C
add
ed)
Figure 4.1Mineralization of [14C] zinc pyrithione (0.037 µg/g) in clayey sedimentand seawater from the Sound (sediment LS) Aerobic conditions. Dottedcurve represents 14CO2 released by acidification.
0
1
2
3
4
5
6
7
8
9
10
0 5 10 15 20 25 30 35 40 45
Days
14C
O2 (
% o
f 14C
add
ed)
Figure 4.2Mineralization of [14C] zinc pyrithione (0.037 µg/g) in sandy sedimentand seawater from the Sound (sediment SS) Aerobic conditions. Dottedcurve represents 14CO2 released by acidification.
Water and sediment samples from the tests were taken at the start of thetests and after 28 days. Chemical analyses of zinc pyrithione and me-tabolites were made by Arch Chemicals (Cheshire, Connecticut). These

45
analyses showed that zinc pyrithione was mainly transformed intoomadine sulfonic acid, pyridine sulfonic acid and NP1 in both sediments(Table 4.3).
Table 4.3Aerobic biodegradation of [14C]zinc pyrithione into metabolites andcarbon dioxide in seawater and sediment from the Sound.
Sample Zincpyrithione
NP1 Omadinesulfonic acid +
pyridinesulfonic acid*
NP2 NP3 NP5 Non-extractable
CO2
% of 14C added
Day 0
LS, water 1 2.3 4.5 0.5 - - - - -
LS, sediment 1 34.6 6.2 3.6 17.0 4.6 2.6 13.3
LS, total 1 36.9 10.7 4.1 17.0 4.6 2.6 13.3
Day 28
LS, water 2 - 4.4 41.0 - - - - 1.5
LS, sediment 2 0.6 2.8 5.3 3.9 3.0 2.9 30.3
LS, total 2 0.6 7.2 46.3 3.9 3.0 2.9 30.3
Day 0
SS, water 1 19.5 22.7 - 1.9 - 3.8 - -
SS, sediment 1 11.1 4.1 1.2 3.4 1.9 1.1 11.7
SS, total 1 30.6 26.8 1.2 5.3 1.9 4.9 11.7
Day 28
SS, water 2 - 24.5 26.3 1.2 - - - 2.5
SS, sediment 2 4.1 0.7 4.3 1.5 - 0.3 19.4
SS, total 2 4.1 25.2 30.6 2.7 - 0.3 19.4
LS, clayey sediment; SS, sandy sediment;*, contained also NP4; 1, tests performedby Arch Chemicals; 2, tests performed by VKI; -, not detected.
4.3.2 Mineralization and metabolites in anoxic sedimentThe anaerobic biodegradability of zinc pyrithione (3 µg/g) was investi-gated by use of water and sediments collected in the same freshwater andmarine localities as in the aerobic experiments (Ritter 1996). Later in-vestigations with seawater and sediment were made with both copperpyrithione and zinc pyrithione, which were added at a concentration of0.05 µg/g (Ritter 1999a, c, e). In the assessment of the fate of zinc pyri-thione under anaerobic conditions, the greatest importance is attached tothe most recent results from experiments carried out at the concentrationof 0.05 µg/g (Ritter 1999a, b, d).
Mineralization andmetabolitesAs was the case with the results from the aerobic biodegradation studies,the mineralization of [pyridine-2,6-14C]zinc pyrithione to carbon dioxidewas negligible in anoxic marine sediment. After 182 days of incubation
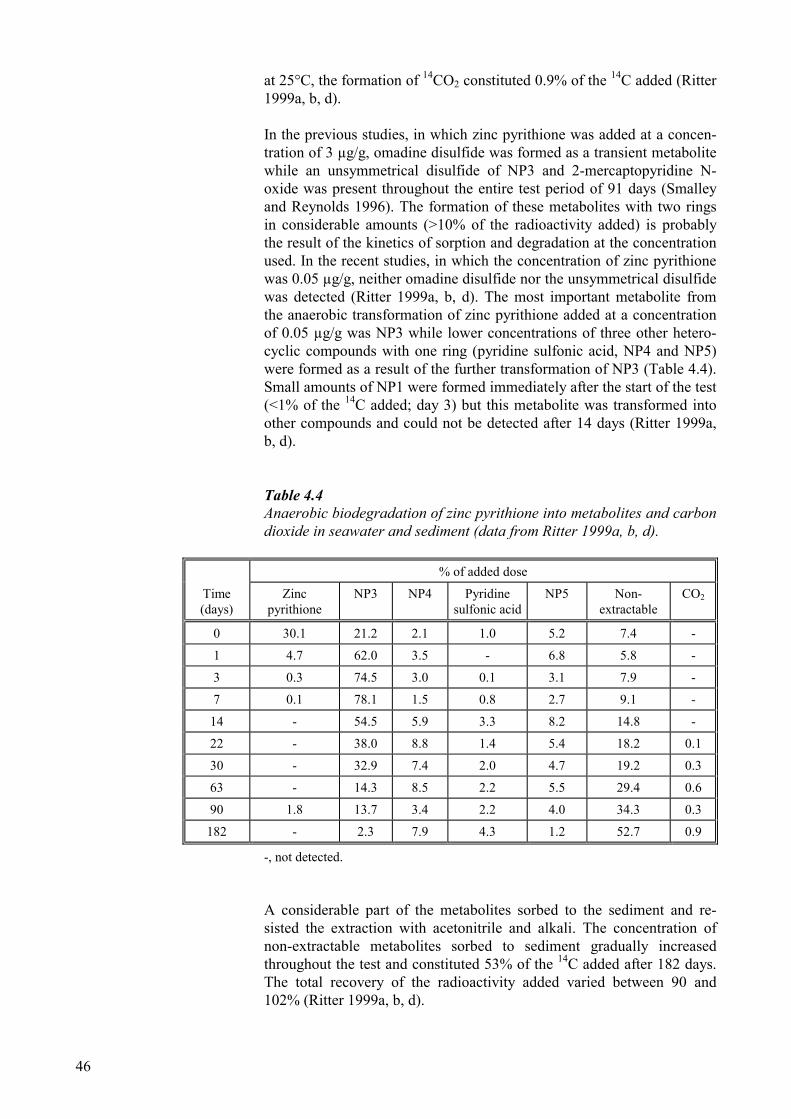
46
at 25°C, the formation of 14CO2 constituted 0.9% of the 14C added (Ritter1999a, b, d).
In the previous studies, in which zinc pyrithione was added at a concen-tration of 3 µg/g, omadine disulfide was formed as a transient metabolitewhile an unsymmetrical disulfide of NP3 and 2-mercaptopyridine N-oxide was present throughout the entire test period of 91 days (Smalleyand Reynolds 1996). The formation of these metabolites with two ringsin considerable amounts (>10% of the radioactivity added) is probablythe result of the kinetics of sorption and degradation at the concentrationused. In the recent studies, in which the concentration of zinc pyrithionewas 0.05 µg/g, neither omadine disulfide nor the unsymmetrical disulfidewas detected (Ritter 1999a, b, d). The most important metabolite fromthe anaerobic transformation of zinc pyrithione added at a concentrationof 0.05 µg/g was NP3 while lower concentrations of three other hetero-cyclic compounds with one ring (pyridine sulfonic acid, NP4 and NP5)were formed as a result of the further transformation of NP3 (Table 4.4).Small amounts of NP1 were formed immediately after the start of the test(<1% of the 14C added; day 3) but this metabolite was transformed intoother compounds and could not be detected after 14 days (Ritter 1999a,b, d).
Table 4.4Anaerobic biodegradation of zinc pyrithione into metabolites and carbondioxide in seawater and sediment (data from Ritter 1999a, b, d).
% of added dose
Time(days)
Zincpyrithione
NP3 NP4 Pyridinesulfonic acid
NP5 Non-extractable
CO2
0 30.1 21.2 2.1 1.0 5.2 7.4 -
1 4.7 62.0 3.5 - 6.8 5.8 -
3 0.3 74.5 3.0 0.1 3.1 7.9 -
7 0.1 78.1 1.5 0.8 2.7 9.1 -
14 - 54.5 5.9 3.3 8.2 14.8 -
22 - 38.0 8.8 1.4 5.4 18.2 0.1
30 - 32.9 7.4 2.0 4.7 19.2 0.3
63 - 14.3 8.5 2.2 5.5 29.4 0.6
90 1.8 13.7 3.4 2.2 4.0 34.3 0.3
182 - 2.3 7.9 4.3 1.2 52.7 0.9
-, not detected.
A considerable part of the metabolites sorbed to the sediment and re-sisted the extraction with acetonitrile and alkali. The concentration ofnon-extractable metabolites sorbed to sediment gradually increasedthroughout the test and constituted 53% of the 14C added after 182 days.The total recovery of the radioactivity added varied between 90 and102% (Ritter 1999a, b, d).
47
Studies with DanishsedimentsThe anaerobic biodegradation of zinc pyrithione (0.037 µg/g) was ex-amined by use of the clayey sediment and its seawater (Appendix 2),which was also used in the aerobic tests (cf. Section 4.3.1). Sediment andseawater were incubated under anaerobic sulfate-reducing conditions,which are normally prevalent in coastal marine sediments. The minerali-zation of [pyridine-2,6-14C]zinc pyrithione into 14CO2 constituted 3.5%of the 14C added after 56 days’ incubation at 15°C (Figure 4.3). Com-pared with the tests performed under aerobic conditions, a larger part ofthe metabolites formed under anaerobic conditions was bound to humicacids, humin and clay minerals in the sediment. This part constituted39% of the 14C added after 56 days’ incubation of the clayey sedimentand its seawater. More water-soluble metabolites in the water phase ofthe system or bound to hydrolizable compounds and fulvic acids consti-tuted, however, a considerable part of 35% in total of the radioactivityadded. As in the aerobic tests, zinc pyrithione was transformed into me-tabolites (Table 4.5), of which several are considered to have a high bio-availability. Methods and results are described in detail in Appendix 2.
0
1
2
3
4
5
6
7
8
9
10
0 10 20 30 40 50 60
Days
14C
O2 (
% o
f 14C
add
ed)
Figure 4.3Mineralization of [14C] zinc pyrithione (0.037 µg/g) in clayey sedimentand seawater from the Sound (sediment SS) Anaerobic conditions. Dot-ted curve represents 14CO2 released by acidification.
Water and sediment samples from the tests were taken at the start of thetests and after 28 days. Chemical analyses of zinc pyrithione and me-tabolites in these samples were made by Arch Chemicals (Cheshire,Connecticut). The results from the analyses performed showed that thequantitatively most essential metabolites under anaerobic sulfate-reducing conditions were the heterocyclic compounds with one ring, i.e.NP3 and NP5 (Table 4.5).

48
Table 4.5Anaerobic biodegradation of [14C]zinc pyrithione into metabolites andcarbon dioxide in seawater and sediment from the Sound.
Time(days)
Sample Zincpyrithione
NP3 Omadinesulfonic acid +
pyridinesulfonic acid*
NP1 NP2 NP5 Non-extractable
CO2
% of 14C added
0 LS, water 1 15.1 13.7 0.8 0.5 - - - -
0 LS, sediment 1 19.0 18.9 6.3 3.3 1.1 2.7 11.0
0 LS, total 1 34.1 32.6 7.1 3.8 1.1 2.7 11.0
28 LS, water 2 - 0.7 10.2 - - 21.2 - 2.6
28 LS, sediment 2 - 21.2 3.2 - - 1.3 25.7
28 LS, total 2 - 21.9 13.4 - - 22.5 25.7
LS, clayey sediment; *, contained also NP4; 1, tests performed by Arch Chemicals; 2,tests performed by VKI; -, not detected.
4.4 Toxicity to aquatic organisms
Zinc pyrithioneThe toxicity of the active substance zinc pyrithione has been investigatedin standard laboratory tests with a number of aquatic organisms living infresh water (the green alga Selenastrum capricornutum, the crustaceanDaphnia magna, the fish rainbow trout (Oncorhynchus mykiss) andfathead minnow (Pimephales promelas)) and in seawater (the crustaceanMysidopsis bahia, the fish sheepshead minnow (Cyprinodon variegatus)and the oyster (Crassostrea virginica)) (Boeri et al. 1993; 1994a-e; Wardet al. 1994a). Furthermore, five species of freshwater fish were used atthe same time in a single test (Olin 1997). Pimephales promelas was alsoused in this test and the results for this species agreed with the results inthe standard test. Besides, P. promelas was the most sensitive of the fivespecies. Because of the lack of stability of zinc pyrithione when exposedto light, the tests were carried out with subdued light and all tests - withthe exception of the algal test - were made with constant renewal of thetest solution (flow through). By so doing, the exposure concentration wassuccessfully kept almost constant in all of the tests - even in the algal test(Ward et al. 1994a), in which the medium cannot be renewed, and allresults are calculated on the basis of measured concentrations.
The results summarized in Appendix 5 show that the difference in sensi-tivity was not pronounced between the freshwater and the marine organ-isms. Algae are apparently the taxonomic group least sensitive to zincpyrithione. Table 4.6 gives an overview of the toxicity of zinc pyrithioneto various groups of organisms.
Long-term studies have been made with crustaceans (daphnids and smallprawns) and fish (the most sensitive fish, Pimephales promelas, in ashort-term test). In the studies with crustaceans, reproduction was ex-
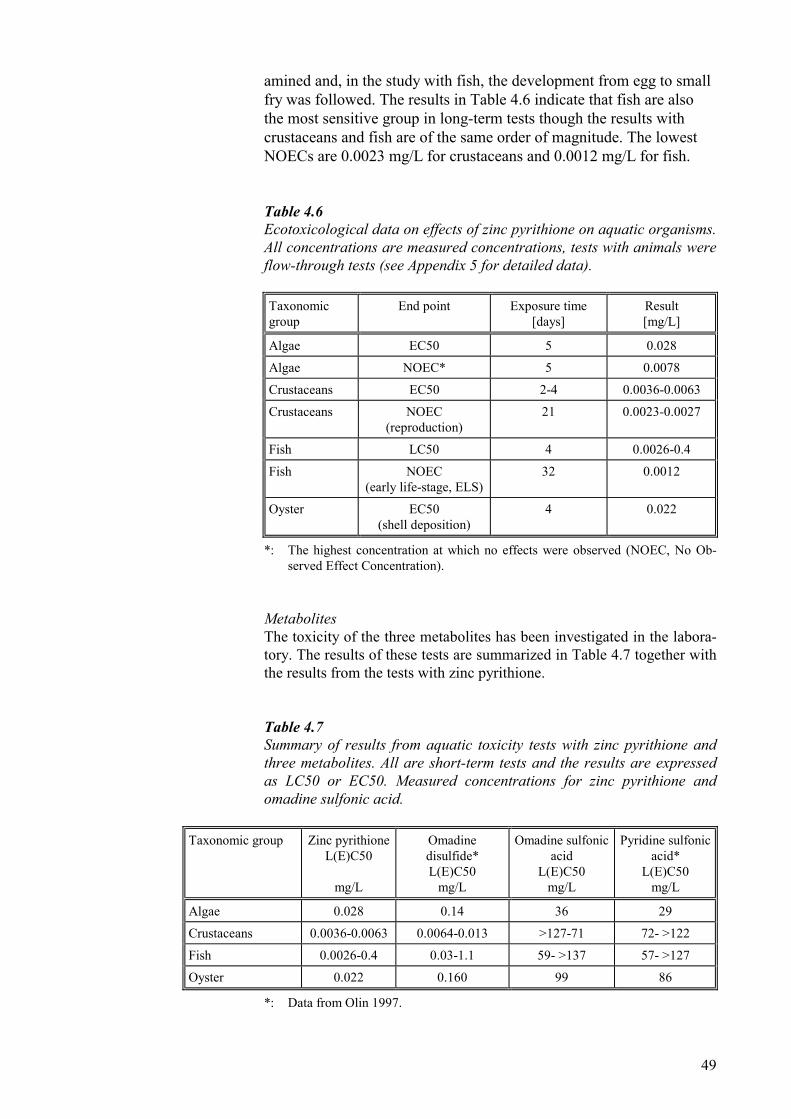
49
amined and, in the study with fish, the development from egg to smallfry was followed. The results in Table 4.6 indicate that fish are alsothe most sensitive group in long-term tests though the results withcrustaceans and fish are of the same order of magnitude. The lowestNOECs are 0.0023 mg/L for crustaceans and 0.0012 mg/L for fish.
Table 4.6Ecotoxicological data on effects of zinc pyrithione on aquatic organisms.All concentrations are measured concentrations, tests with animals wereflow-through tests (see Appendix 5 for detailed data).
Taxonomicgroup
End point Exposure time[days]
Result[mg/L]
Algae EC50 5 0.028
Algae NOEC* 5 0.0078
Crustaceans EC50 2-4 0.0036-0.0063
Crustaceans NOEC(reproduction)
21 0.0023-0.0027
Fish LC50 4 0.0026-0.4
Fish NOEC(early life-stage, ELS)
32 0.0012
Oyster EC50(shell deposition)
4 0.022
*: The highest concentration at which no effects were observed (NOEC, No Ob-served Effect Concentration).
MetabolitesThe toxicity of the three metabolites has been investigated in the labora-tory. The results of these tests are summarized in Table 4.7 together withthe results from the tests with zinc pyrithione.
Table 4.7Summary of results from aquatic toxicity tests with zinc pyrithione andthree metabolites. All are short-term tests and the results are expressedas LC50 or EC50. Measured concentrations for zinc pyrithione andomadine sulfonic acid.
Taxonomic group Zinc pyrithioneL(E)C50
mg/L
Omadinedisulfide*L(E)C50
mg/L
Omadine sulfonicacid
L(E)C50mg/L
Pyridine sulfonicacid*
L(E)C50mg/L
Algae 0.028 0.14 36 29
Crustaceans 0.0036-0.0063 0.0064-0.013 >127-71 72- >122
Fish 0.0026-0.4 0.03-1.1 59- >137 57- >127
Oyster 0.022 0.160 99 86
*: Data from Olin 1997.
50
It applies to all four substances (in Table 4.7) that they have been testedwith one freshwater alga (Selenastrum capricornutum), one freshwatercrustacean (Daphnia magna), one marine crustacean (Mysidopsis bahia),two freshwater fish (Pimephales promelas and Oncorhynchus mykiss)and one sea fish (Cyprinodon variegatus) and furthermore, a shell depo-sition test with the oyster species Crassostrea virginica (marine). Fur-thermore, pyridine sulfonic acid was used in a long-term test with thefish Pimephales promelas (Boeri et al. 1999).
In the algal test with omadine sulfonic acid, the concentration of the sub-stance fell during the test. The concentrations used for calculating theeffect concentration are measured at the start of the test and the realEC50 is probably somewhat lower than the value stated in Table 4.7(EC50: 36 mg/L) (Boeri et al. 1994g). In the other tests, the results arecalculated as the average of the concentrations at the start and at the endof the test (Ward et al. 1994b, c, d; Boeri et al. 1994f, h, i). If this methodof calculation is applied to the results of the algal test, an EC50 = 23mg/L is achieved.
The results show that while zinc pyrithione and omadine disulfide werevery toxic to aquatic organisms (L(E)C50 in the order of 3-300 µg/L),omadine sulfonic acid and pyridine sulfonic acid were considerably lesstoxic (L(E)C50 in the order of >20 mg/L) (Olin 1977). In a long-termstudy with fish eggs and larvae, pyridine sulfonic acid gave no effects ata concentration of 0.01 mg/L (Boeri et al. 1999). Algae were the group oforganisms most sensitive to the last two substances.
Effects of degradation ofzinc pyrithione on aquatictoxicityA parallel test, like the one described in relation to DCOI (cf. Section3.3.2), was performed in order to examine the relation between degrada-tion of zinc pyrithione and the acute toxicity towards Acartia tonsa. Thestudies were made in the same way as those of DCOI by use of sediment-seawater systems dosed with zinc pyrithione in a concentration of 25µg/kg. Water phase and sediment were separated 20 min after dosing.The use of the water phase in tests with A. tonsa resulted in a lethalitycorresponding to 100% of the test organisms. The test results showed thatstationary incubation in the dark or in the light (340 µmol/m2 · s) at 20-25°C resulted in the fact that no lethal effects on A. tonsa were observedafter one day (Figure 4.4). The rapid detoxification demonstrates thatzinc pyrithione was rapidly bound to the sediment or transformed to me-tabolites with considerably lower toxicity than the parent compound aswas the case in relation to DCOI (cf. Section 3.3.2). The methods usedare described in detail in Appendix 3.

51
0
10
20
30
40
50
60
70
80
90
100
0 2 4 6 8 10 12 14 16Days
% le
thal
ity
Figure 4.4Effects of degradation of zinc pyrithione (25 µg/kg) dosed to sedimentand seawater on the acute toxicity to Acartia tonsa (test performed in thedark).
4.5 Assessment of zinc pyrithione and metabolites
Zinc pyrithione is transformed very rapidly in aquatic systems. Tables 4.2and 4.4 show that, after incubation for less than 24 hours, the intact zincpyrithione constituted less than half of the radioactivity added (day 0). Itis assumed that zinc pyrithione is transformed via the structurally compa-rable omadine disulfide, which is rapidly transformed to heterocycliccompounds with one ring under environmentally realistic test conditions.The tests performed with zinc pyrithione showed that the quantitativelymost important metabolites were omadine sulfonic acid and pyridinesulfonic acid under aerobic conditions and NP3, NP4, NP5 and pyridinesulfonic acid under anaerobic conditions (Tables 4.2-4.5). The heterocy-clic compounds with one ring are all considered to be recalcitrant andstable in aquatic systems. The biological degradation of zinc pyrithioneresults in a quantitatively considerable formation of metabolites that sorbto the sediment. This appears from the fact that, at the end of the aerobicbiodegradation test after 84 days, approx. 30% of the radioactivity addedwas sorbed to the sediment while, in the anaerobic test, approx. 50% ofthe 14C added could be recovered in the sediment after 182 days (Ritter1999a, b, d).
The aquatic toxicity was investigated for omadine sulfonic acid and pyri-dine sulfonic acid, which were both considerably less toxic (L(E)C50 inthe order of >20 mg/L) than zinc pyrithione and omadine disulfide(L(E)C50 in the order of 3-300 µg/L). Based on the chemical structure ofthe substances, the toxicity of the other metabolites with one ring is ex-pected to be at the same level as the toxicity of omadine sulfonic acidand pyridine sulfonic acid. On this basis, the known stable metabolitesfrom the transformation of zinc pyrithione under aerobic and anaerobicconditions are considered to have an aquatic toxicity that is between1,000 and 10,000 times lower than the toxicity of zinc pyrithione (cf.

52
Table 4.7). The metabolites sorbed to sediment are not yet identified. Asthese metabolites could not be extracted from the sediment with acetoni-trile and KOH, they are considered to have a low bioavailability and thusa low toxicity to aquatic organisms.
4.6 Risk assessment of zinc pyrithione
Calculation of exposureconcentrations (PEC)Exposure concentrations (PEC, Predicted Environmental Concentration)were calculated for a pleasure craft harbour (Jyllinge) and a busy naviga-tion route by use of internationally recognized principles (EC 1996) asdescribed in relation to DCOI (cf. Section 3.4). The model and the twoscenarios are described in detail in Appendix 1. For parent compoundand the most essential metabolites, the following exposure concentra-tions were calculated:
• PEC (water column)• PEC (sediment)• PEC (sediment-pore water) The three exposure concentrations were defined as the steady-state con-centration of the sub-environment in question. I.e., the concentrationwhich the calculated concentrations eventually approach when a con-tinuous leaching of the parent compound to the water environment issimulated. The model used is not validated towards measured concentra-tions in harbour environments or navigation routes. The exposure con-centrations were calculated on the basis of the following assumptions: • The background concentrations for both the parent compound and the
metabolites were assumed to be zero. • 70% of the pleasure craft was assumed to have been painted with
paint containing zinc pyrithione. • The leaching rate of zinc pyrithione from bottom paints was calcu-
lated at 21 mg/m2/day in harbours and 41 mg/m2/day when sailing. • The average photolytical half-life of zinc pyrithione was calculated at
9.8 hours for the pleasure craft harbour of Jyllinge and 6.6 hours forKronprins Frederiks Bro (cf. Appendix 1). It was not possible toquantify the influence of the presence of the pleasure craft and theshadow effects from the pier on the amount of light falling on thesurface and calculations have thus been made with and without the in-clusion of photolysis.
• The primary biological transformation of zinc pyrithione into hetero-
cyclic compounds with one ring was assumed to proceed with a half-life of 12 hours in surface water at a temperature of 25°C.
The half-life for zinc pyrithione, which is assumed in the simulation, cor-responds to a considerably slower transformation of zinc pyrithione than

53
the initial removal of the substance from the water phase in studies withseawater and sediment (cf. Section 4.3). Compared with the removal ofzinc pyrithione from the water phase (Ritter 1999a-e), a longer half-lifewas used in the simulation as aquatic systems with sediment make sorp-tion possible and normally have a larger potential for biodegradationcompared with the degradation potential in the surface water. The reasonfor using a half-life for transformation of zinc pyrithione correspondingto the expected transformation in surface water is that the result of thesimulation is exposure concentrations at a continuous leaching of zincpyrithione after steady state was achieved. When the pleasure craft aretaken out of the water at the end of the sailing season, zinc pyrithionewill probably be rapidly eliminated as the substance is either transformedin the water phase or sorbs to the sediment, in which it is transformedwith a very short half-life (cf. Sections 4.2 and 4.3).
The exposure concentrations calculated for zinc pyrithione and its me-tabolites are approx. 50 times higher in the pleasure craft harbour than inthe busy navigation route outside the harbour (Table 4.8).
Table 4.8aCalculation of PEC for zinc pyrithione and metabolites at steady-state.Photolysis included.
Scenario Substance PEC(water)
PEC(sediment,pore water)
PEC (sediment,sorbed)
µg/L µg/L µg/kg
Pleasure craft Zinc pyrithione 0.56 0.00056 0.089
harbour NP3 1.22 0.25 0.68
NP4 0.099 0.19 0.078
Pyridine sulfonic acid 0.0080 0.068 0.040
NP1 0.15 0.091 0.062
Omadine sulfonic acid 0.012 0.48 0.47
Other compounds 0.11 - -
Navigation Zinc pyrithione 0.0053 0.00001 0.00090
route NP3 0.027 0.0028 0.0076
NP4 0.0027 0.0022 0.00089
Pyridine sulfonic acid 0.00040 0.00077 0.00045
NP1 0.0032 0.0011 0.00077
Omadine sulfonic acid 0.00046 0.0059 0.0058
Other compounds 0.0032 - -

54
Table 4.8bCalculation of PEC for zinc pyrithione and metabolites at steady-state.Photolysis not included.
Scenario Substance PEC(water)
PEC(sediment,pore water)
PEC(sediment,
sorbed)µg/L µg/L µg/kg
Pleasure craft Zinc pyrithione 1.7 0.0013 0.21
harbour NP3 0.00006 0.54 1.5
NP4 0.20 0.43 0.18
Pyridine sulfonic acid 0.016 0.15 0.090
NP1 0.45 0.24 0.17
Omadine sulfonic acid 0.036 1.3 1.3
Other compounds 0.24 - -
Navigation Zinc pyrithione 0.022 0.00002 0.0027
route NP3 0.00001 0.0072 0.019
NP4 0.0059 0.0061 0.0025
Pyridine sulfonic acid 0.00088 0.0022 0.0013
NP1 0.013 0.0042 0.0028
Omadine sulfonic acid 0.0019 0.022 0.021
Other compounds - - -
Calculation of Predicted No Effect Concentrations (PNEC)Predicted No Effect Concentrations (PNECs) are estimated for zinc py-rithione and pyridine sulfonic acid. The other stable metabolites from thetransformation of zinc pyrithione are considered to have the same aquatictoxicity as pyridine sulfonic acid.
The available studies of the aquatic toxicity of zinc pyrithione are con-sidered representative and the data material includes long-term studieswith crustaceans and the most sensitive group of organisms, i.e. fish. Thealgal test may be interpreted both as a short-term test and as a long-termtest (EC 1996).
For zinc pyrithione, data are interpreted as including three NOEC valuesfrom long-term tests (crustaceans, algae and fish), which includes thegroup of organisms that was most sensitive in the short-term test (fish).On this basis, PNEC is calculated by dividing the lowest NOEC value,which is 0.0012 mg/L for fish, by an assessment factor of 10 (EC 1996).This results in a PNEC of 0.0001 mg/L = 0.1 µg/L for zinc pyrithione.
The result from the long-term test carried out with fish and pyridine sul-fonic acid (Boeri et al. 1999) is not considered applicable for calculationof PNEC. This is due to the fact that the study used only one concentra-tion (0.01 mg/L) at which no effects were measured. The result does thusnot give any indications of the concentration area in which effects maybe expected. Calculations of PNEC for pyridine sulfonic acid are thusbased on the lowest effect concentrations shown in Table 4.7. The algal
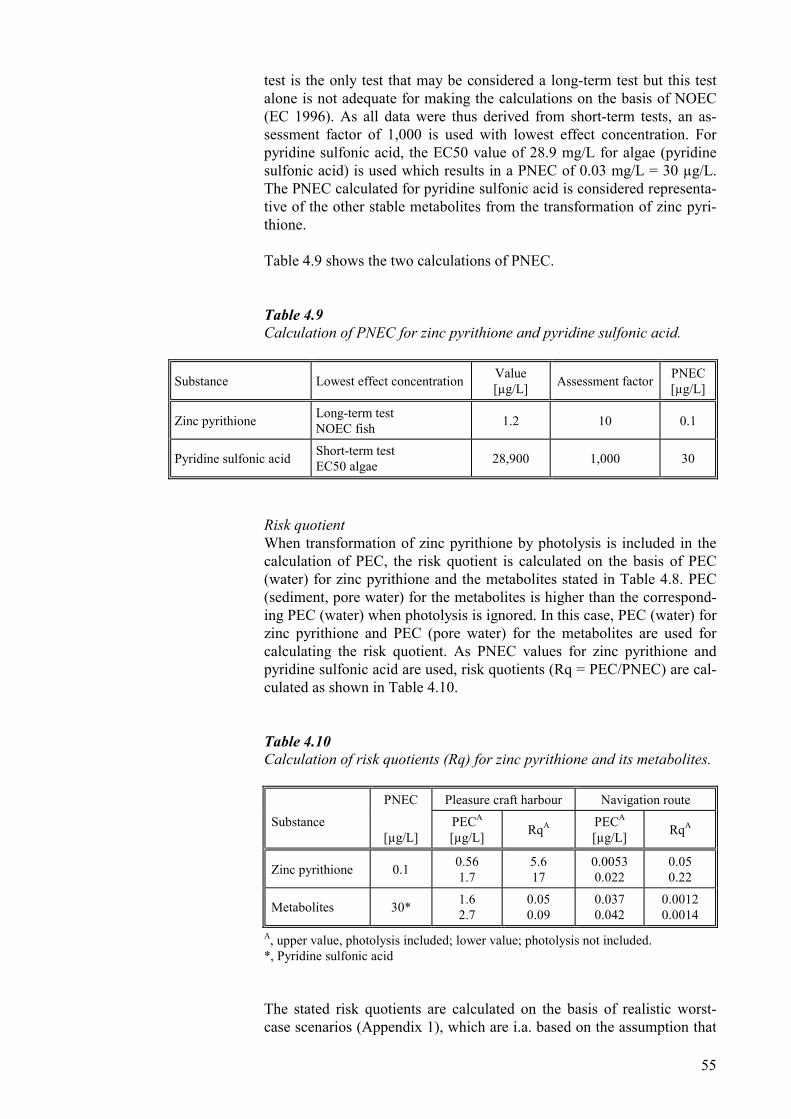
55
test is the only test that may be considered a long-term test but this testalone is not adequate for making the calculations on the basis of NOEC(EC 1996). As all data were thus derived from short-term tests, an as-sessment factor of 1,000 is used with lowest effect concentration. Forpyridine sulfonic acid, the EC50 value of 28.9 mg/L for algae (pyridinesulfonic acid) is used which results in a PNEC of 0.03 mg/L = 30 µg/L.The PNEC calculated for pyridine sulfonic acid is considered representa-tive of the other stable metabolites from the transformation of zinc pyri-thione.
Table 4.9 shows the two calculations of PNEC.
Table 4.9Calculation of PNEC for zinc pyrithione and pyridine sulfonic acid.
Substance Lowest effect concentration Value[µg/L] Assessment factor PNEC
[µg/L]
Zinc pyrithione Long-term testNOEC fish 1.2 10 0.1
Pyridine sulfonic acid Short-term testEC50 algae 28,900 1,000 30
Risk quotientWhen transformation of zinc pyrithione by photolysis is included in thecalculation of PEC, the risk quotient is calculated on the basis of PEC(water) for zinc pyrithione and the metabolites stated in Table 4.8. PEC(sediment, pore water) for the metabolites is higher than the correspond-ing PEC (water) when photolysis is ignored. In this case, PEC (water) forzinc pyrithione and PEC (pore water) for the metabolites are used forcalculating the risk quotient. As PNEC values for zinc pyrithione andpyridine sulfonic acid are used, risk quotients (Rq = PEC/PNEC) are cal-culated as shown in Table 4.10.
Table 4.10Calculation of risk quotients (Rq) for zinc pyrithione and its metabolites.
PNEC Pleasure craft harbour Navigation route
Substance[µg/L]
PECA
[µg/L] RqA PECA
[µg/L] RqA
Zinc pyrithione 0.1 0.561.7
5.617
0.00530.022
0.050.22
Metabolites 30* 1.62.7
0.050.09
0.0370.042
0.00120.0014
A, upper value, photolysis included; lower value; photolysis not included.*, Pyridine sulfonic acid
The stated risk quotients are calculated on the basis of realistic worst-case scenarios (Appendix 1), which are i.a. based on the assumption that
56
70% of the pleasure craft are painted with a bottom paint containing zincpyrithione. On the basis of the assumptions made in the simulation and ofthe calculated PEC values, it is considered likely that a risk of chronicecotoxic effects within the pleasure craft harbour may exist as, presuma-bly, zinc pyrithione will constantly be applied by leaching from bottompaints. The risk quotient for zinc pyrithione within the pleasure craft har-bour is between 0.05 and 0.22 and here the risk of ecotoxic effect of zincpyrithione is considered to be low. The risk quotient out of the pleasurecraft harbour is probably closest to 0.05, in which photolysis has beenincluded in the calculation of PEC as major shadow effects are not ex-pected on a normal navigation route.
Within the pleasure craft harbour, a low risk of ecotoxic effects of stablemetabolites from the transformation of zinc pyrithione is considered pos-sible and this risk is considered very low in areas out of the pleasure craftharbour.

57

58
5 Non-biocidal paints
5.1 Investigations of non-biocidal paints
Field tests with mechanical cleaning of two non-biocidal marine bottompaints were carried out by the Danish Sailing Association and Hempelduring the sailing season in 1998 (Danish Sailing Association and Hem-pel 1999).
Non-biocidal antifouling paints are defined and interpreted in variousways in different official connexions. In this report, the following defini-tion applies: A non-biocidal antifouling paint does not contain any activesubstances (biocides) added in order to prevent fouling through the toxiceffect of these substances. Examples of biocides that have been or arestill used in antifouling paints in Denmark are: TBT, copper, Diuron,Irgarol, Nopcocide, Sea-Nine (active substance is DCOI), zinc pyrithio-ne, etc.
In stead, the antifouling effect is achieved by a very smooth surface onwhich the fouling has difficulty in sticking to the paint (corresponding toa “non-stick” effect, often based on silicone). Also very hard epoxy-based paints are considered as non-biocidal alternatives. Very heavy fou-ling is then expected but these epoxy-based paints allow repeated me-chanical cleaning without destroying the surface of the paint.
The two types of paint were an experimental silicone-containing paint,86330, and an epoxy-based paint, High Protect 35651, which is a com-mercial product designed to prevent osmosis. The environmental proper-ties of the two non-biocidal paints were examined in ecotoxicologicallaboratory tests of water samples from a leaching test with painted pan-els. The ecotoxicological tests included the marine green alga Skeleto-nema costatum and the marine crustacean Acartia tonsa. As effects ofsubstances leaching from the paints were only examined in tests with twowater-living organisms, a test setup ensuring a worst-case situation wasapplied in the leaching test.
In the leaching test, the ratio of the painted area to the surroundingamount of water was established in accordance with calculations basedon the conditions in the pleasure craft harbour of Jyllinge. On the basis ofestimations from the Danish Sailing Association (personal communica-tion with Steen Wintlev-Jensen, Danish Sailing Association), the boats inthe harbour are considered to be composed of 360 sailing boats with atotal of immersed bottom area of 6840 m2 (360 ⋅ 19 m2) and 60 motorboats with a total of immersed bottom area of 1320 m2 (60 ⋅ 22 m2). Inthe pleasure craft harbour of Jyllinge, the area is approx. 31,500 m2 andthe average water depth is 2.3 m, after which the amount of water in theharbour can be calculated at 70,450 m3 (cf. Appendix, Table A.1.). Basedon these assumptions, the ratio of the painted bottom area of the pleasurecraft of the harbour to the amount of water in the harbour is calculated at0.11 m2:1 m3. The ratio of the painted area to the total amount of water inthe leaching tests was 1.5 m2:1 m3. The painted surface per volume unit

59
was thus 13-14 times higher in the leaching test than this ratio would beif the boats in the pleasure craft harbour of Jyllinge were painted with thesame paint.
5.2 Leaching and ecotoxicological tests
Test paintsThe laboratory tests included two non-biocidal paints (1 and 2 below)and Hempel’s Antifouling Nautic 76800, which is an organotin-basedbottom paint for large-scale navigation. The test paints in the study wereas follows:
1. An experimental 86330 paint (silicone-containing)2. High Protect 35651 (epoxy-based)3. Hempel's Antifouling Nautic 76800 (organotin-based)
Leaching testsThe leaching tests were performed in cast solid glass aquaria with 38litres of filtered seawater. Four panels painted on both sides with testpaint were submerged into each aquarium so that only the painted part ofthe panels made contact with the seawater. The painted surface of eachpanel was 150 cm2. The water in the aquaria was continuously aeratedwith a weak current of atmospheric air and vaporized liquid was replacedonce a week. The aquaria were covered with black plastic and placed at20°C. Water samples from the aquaria were sampled after 0, 6, 13, 20and 34 days. On the first day of the leaching test (day 0), 0.5 litres weresampled from each aquarium after 3 hours while, at all other samplings,9 litres were taken from each aquarium. At each sampling of 9-litre watersamples, one panel was removed from the aquaria so that the ratio of thepainted area to the liquid volume remained unchanged throughout theleaching test.
Ecotoxicological testThe toxicity of the water samples was determined in a growth inhibitiontest with the marine green alga Skeletonema costatum, which was con-ducted in accordance with the procedures in the OECD Guideline forTesting of Chemicals No. 201 “Algal Growth Inhibition Test” (OECD1984). The algal test was performed with water samples taken after 0, 6,13, 20 and 34 days’ leaching. The results from this test were used forselecting water samples for the examination of chronic effects on crusta-ceans and for determination of potentially bioaccumulable substances.
On the basis of the results from the algal test, the toxicity of water sam-ples taken after 13 and 34 days was determined in tests with the marinecrustacean Acartia tonsa. The toxicity towards A. tonsa was examined ina screening test for acute toxicity (ISO 1998) and in a test for chronictoxicity, which has been described in detail by the National Environ-mental Research Institute (NERI 1986) and Johansen and Møhlenberg(1987). The presence of hydrophobic, potentially bioaccumulable sub-stances in the leachate was determined in accordance with the OECDGuideline for Testing of Chemicals No. 117 "Partition Coefficient (n-

60
octanol/water), High Performance Liquid Chromatography (HPLC)Method" (OECD 1989).
The materials and methods used are described in detail in the report"Ecotoxicological tests of leachates of antifouling paints" (Bjørnestad etal. 1999), which also contains a detailed description of the study results.The most essential results are summarized below.
Growth inhibition testwith algaeThe toxicity test with S. costatum showed that the leachate from HighProtect 35651 did not inhibit the growth of the algae. However, Hem-pel’s Antifouling Nautic 76800 as well as the experimental 86330 paintleached substances to the surrounding water, which caused an inhibitionof the growth of the algae (Table 5.1).
Table 5.1Inhibition of growth of Skeletonema costatum in tests of leachates in aconcentration of 900 mL/L.
Test paint Inhibition of growth (%)
Day 0 Day 6 Day 13 Day 20 Day 34
Control < 1 < 1 < 1 < 1 < 1
High Protect 35651 < 1 < 1 < 1 < 1 < 1
Experimental 86330 2 48 100 100 100
Hempel's Antifouling Nautic 76800 100 100 100 100 100
As the results with the experimental 86330 paint (Table 5.1) were aston-ishing, Hempel’s laboratory has performed more leaching tests using themethod described above (personal communication with Susanne HolmFaarbæk, Hempel). In this test, leachates were sampled after 20 days,after which the toxicity of the coded water samples was determined byVKI. Water samples from two separate leaching tests with the experi-mental 86330 caused an inhibition of S. costatum of 78% and 100%, re-spectively. The leachate from another paint, 97003-057, which composi-tion is very similar to that of the experimental 86330, caused no inhibi-tion of the algal growth. The test with 97003-057 could, however, not bereproduced as a new laboratory batch of the paint, 97003-128, caused aninhibition of 90% of S. costatum (personal communication with SusanneHolm Faarbæk, Hempel).
While the additional leaching tests with the experimental 86330 paintgenerally confirmed the results in Table 5.1, the diverging results for the97003 paint indicate that variations in the production or painting processhas great influence on the leaching of substances from the painted sur-face. It has not been possible to shed light on these conditions in connec-tion with this study.Toxicity test with Acartiatonsa

61
Water samples from leaching test with High Protect 35651 caused noacute toxicity towards A. tonsa in screening tests. The chronic toxicitytest, however, showed that undiluted water samples from the leachingtest with High Protect 35651 inhibited the development of Acartia nau-plii while no inhibition was observed when the water samples were di-luted 10 times (100 mL/L) (Figure 5.1). As no effects were observed ei-ther on the egg production at a concentration of 100 mL/L, NOEC (NoObserved Effect Concentration) was 100 mL/L for the leachate fromHigh Protect 35651.
Contrary to High Protect 35651, the leachate from the test with the ex-perimental 86330 paint was acutely toxic to A. tonsa as the lethality ofadult Acartia was 100% for undiluted water samples taken after 20 and34 days, respectively. Leachate diluted 10 times (100 mL/L) caused alethality of 40% (20 days) and 20% (34 days), respectively. In thechronic toxicity tests, no nauplii developed into copepodites and adults atan impact of leachate diluted to 100 mL/L (water sample taken after 13days) and 10 mL/L (water sample taken after 34 days) (Figures 5.2-5.3.).On the basis of these results, it is concluded that NOEC was less than 10mL/L for the leachate from the experimental 86330 paint.
0
200
400
600
800
1000
1200
N1 3 N1 5 N2 5 N1 7 N2 7 C1 7 C2 7 C1 10 C2 10 adult 10 female12
male 12 female14
male 14 female17
male 17
Life stage, test day
Leng
th (u
m)
Control 100 mL/L 1000 mL/L
Figure 5.1Development of nauplii, copepodites and adults in leachate from HighProtect 35651, day 13.

62
0
100
200
300
400
500
600
700
800
900
1000
N1 3 N1 5 N2 5 C1 5 C1 7 C2 7 C2 10 adult 10 female 12 male 12 female 17 male 17
Life stage, test day
Leng
th (u
m)
Control 10 mL/L 100 mL/L 1000 mL/L
Figure 5.2Development of nauplii, copepodites and adults in leachate from the ex-perimental 86330 paint, day 13.
0
100
200
300
400
500
600
700
800
900
1000
N1 3 N1 5 N2 5 C1 5 C1 7 C2 7 C2 10 adult 10 female 12 male 12 female 17 male 17
Life stage, test day
Leng
th (u
m)
Control 10 mL/L 100 mL/L 1000 mL/L
Figure 5.3Development of nauplii, copepodites and adults in leachate from the ex-perimental 86330 paint, day 34.
The water samples from the leaching test with Hempel's AntifoulingNautic 76800 had a high acute toxicity towards A. tonsa as the watersample taken after 20 days and diluted 100 times (10 mL/L) caused alethality of 100%. No nauplii developed into copepodites and adults at animpact of leachate diluted to 0.1 mL/L (water sample taken after 13days). On the basis of these results, it is concluded that NOEC was lessthan 0.1 mL/L for the leachate from Hempel's Antifouling Nautic 76800.
Table 5.2 gives the NOEC values for acute and chronic effects.
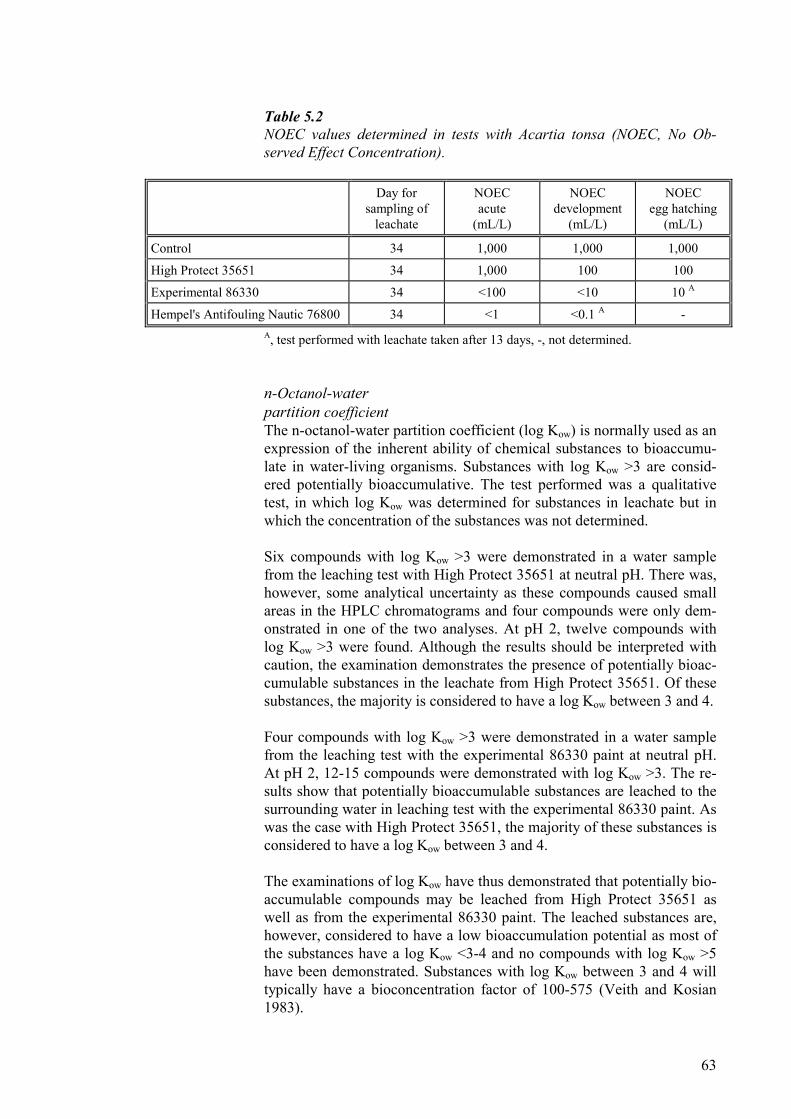
63
Table 5.2NOEC values determined in tests with Acartia tonsa (NOEC, No Ob-served Effect Concentration).
Day forsampling of
leachate
NOECacute
(mL/L)
NOECdevelopment
(mL/L)
NOECegg hatching
(mL/L)
Control 34 1,000 1,000 1,000
High Protect 35651 34 1,000 100 100
Experimental 86330 34 <100 <10 10 A
Hempel's Antifouling Nautic 76800 34 <1 <0.1 A -A, test performed with leachate taken after 13 days, -, not determined.
n-Octanol-waterpartition coefficientThe n-octanol-water partition coefficient (log Kow) is normally used as anexpression of the inherent ability of chemical substances to bioaccumu-late in water-living organisms. Substances with log Kow >3 are consid-ered potentially bioaccumulative. The test performed was a qualitativetest, in which log Kow was determined for substances in leachate but inwhich the concentration of the substances was not determined.
Six compounds with log Kow >3 were demonstrated in a water samplefrom the leaching test with High Protect 35651 at neutral pH. There was,however, some analytical uncertainty as these compounds caused smallareas in the HPLC chromatograms and four compounds were only dem-onstrated in one of the two analyses. At pH 2, twelve compounds withlog Kow >3 were found. Although the results should be interpreted withcaution, the examination demonstrates the presence of potentially bioac-cumulable substances in the leachate from High Protect 35651. Of thesesubstances, the majority is considered to have a log Kow between 3 and 4.
Four compounds with log Kow >3 were demonstrated in a water samplefrom the leaching test with the experimental 86330 paint at neutral pH.At pH 2, 12-15 compounds were demonstrated with log Kow >3. The re-sults show that potentially bioaccumulable substances are leached to thesurrounding water in leaching test with the experimental 86330 paint. Aswas the case with High Protect 35651, the majority of these substances isconsidered to have a log Kow between 3 and 4.
The examinations of log Kow have thus demonstrated that potentially bio-accumulable compounds may be leached from High Protect 35651 aswell as from the experimental 86330 paint. The leached substances are,however, considered to have a low bioaccumulation potential as most ofthe substances have a log Kow <3-4 and no compounds with log Kow >5have been demonstrated. Substances with log Kow between 3 and 4 willtypically have a bioconcentration factor of 100-575 (Veith and Kosian1983).

64
5.3 Assessment of non-biocidal paints
The performed leaching tests were carried out with a ratio of the paintedarea to the surrounding liquid volume that was at least 13-14 timeshigher than the corresponding ratio in the pleasure craft harbour of Jyl-linge (cf. Section 5.1). For both non-biocidal paints, High Protect 35651and the experimental 86330 paint, water samples from leaching testshave markedly less effect than water samples from similar test with thecommercial paint, Hempel's Antifouling Nautic 76800. Table 5.2 showsthat leachates from High Protect 35651 and the experimental 86330 paintcaused NOEC values for A. tonsa that were at least 1,000 and 100 times,respectively, higher than NOEC for leachate from Hempel's AntifoulingNautic 76800.
Water samples from the leaching test with High Protect 35651 caused noinhibition of S. costatum and chronic effects on A. tonsa were only ob-served with undiluted leachate (NOEC = 100 mL/L).
Water samples from the leaching test with the experimental 86330 paintwere toxic to S. costatum and in acute and chronic tests with A. tonsa(NOEC, acute <100 mL/L; NOEC, chronic <10 mL/L). There are, how-ever, problems in the leaching of substances from this type of paint thathave not been fully examined (cf. the results with S. costatum). Theseproblems should be further examined before a final assessment is madeof the environmental properties of the paint.

65

66
6 Conclusion
The following conclusions may be drawn on the basis of the presentstudy:
Bioavailable copper is very toxic to aquatic organisms. The potentialtoxic effect of copper on the aquatic environment is reduced by sorptionto organic matter and sediments which causes the actual bioavailabilityof copper to be low. Disturbances of the sediment and the consequentchange in oxygen conditions may, however, remobilize sequestratedcopper and such changes may probably cause effects on sensitive organ-isms in the vicinity of harbours and dumping sites.
DCOI is rapidly transformed into metabolites in seawater in which half-lives of between 11 and 14 hours have been found. The transformation ofDCOI is considerably quicker in aquatic sediment as half-lives of lessthan 1 hour have been demonstrated. DCOI is very toxic to aquatic or-ganisms as the lowest effect concentrations (EC/LC50) are lower than 10µg/L. The aquatic toxicity of the stable metabolite, N-(n-octyl) malo-manic acid, is several orders of magnitude lower as the lowest effectconcentrations (LC50) are estimated to be between 90 and 160 mg/L.
On the basis of realistic worst-case scenarios, risk quotients (PEC/PNEC)for DCOI have been calculated at 8.7 for the pleasure craft harbour and0.1 for the navigation route. Based on the calculation prerequisites, it isestimated that, within the pleasure craft harbour, there is a risk of chronicecotoxic effects as DCOI is assumed to be applied constantly by theleaching from bottom paints. The risk quotient for DCOI out of thepleasure craft harbour is less than 1, and here the risk of ecotoxic effectsis considered to be low. The calculated exposure concentrations (PEC)are based on realistically conservative assumptions, which means that, inpractice, the calculated PEC values are seldom exceeded. When thepleasure craft are taken out of the water at the end of the sailing season,DCOI will probably be rapidly eliminated as DCOI is either transformedin the water phase or sorbs to the sediment, in which it is transformedwith a very short half-life.
Zinc pyrithione is very rapidly transformed by photolysis and biodegra-dation. Zinc pyrithione is very toxic to aquatic organisms as the lowesteffect concentrations (EC/LC50) are lower than 10 µg/L. The toxicity ofthe stable metabolites, omadine sulfonic acid and pyridine sulfonic acid,is several orders of magnitude lower as the lowest effect concentrations(LC50) for these compounds are 36 and 29 mg/L, respectively.
By using the same realistic worst-case scenarios as for DCOI, the riskquotients (PEC/PNEC) for zinc pyrithione have been calculated to be5.6-17 for the pleasure craft harbour and 0.05-0.22 for the navigationroute. The lowest risk quotients are based on PEC values in whichtransformation of zinc pyrithione by photolysis is included in the calcu-lations while the highest risk quotients are based on calculations in whichphotolysis is totally ignored. Based on the calculation prerequisites, it is
67
estimated that, within the pleasure craft harbour, there is a risk of chronicecotoxic effects as zinc pyrithione is assumed to be applied constantly bythe leaching from bottom paints. The risk quotient for zinc pyrithione outof the pleasure craft harbour is less than 1, and here the risk of ecotoxiceffects is considered to be low. The risk quotient out of the pleasure craftharbour is probably closest to 0.05, in which photolysis has been in-cluded in the calculation of PEC as permanent shadow effects are notexpected on a normal navigation route. As described for DCOI, the real-istically conservative assumptions mean that, in practice, the calculatedPEC values are seldom exceeded. When the pleasure craft are taken outof the water at the end of the sailing season, zinc pyrithione will probablybe rapidly eliminated as a result of its short half-life in water and sedi-ment.
Water samples from the leaching tests with High Protect 35651 causedno inhibition of the growth of S. costatum and chronic effects on A. tonsawere observed only in undiluted leachates (No Observed Effect Concen-tration, NOEC = 100 mL/L). Water samples from the leaching test withthe experimental 86330 paint showed toxicity towards S. costatum and inacute and chronic tests with A. tonsa (NOEC, acute <100 mL/L; NOEC,chronic <10 mL/L). However, some factors seem to indicate that varia-tions in the production or painting process may influence the leaching ofsubstances from this type of paint. These problems should be further ex-amined before a final assessment is made of the environmental propertiesof this paint. For both non-biocidal paints, water samples from leachingtests have significantly less effect than water samples from similar testswith the commercial paint, Hempel's Antifouling Nautic 76800.Leachates from High Protect 35651 and the experimental 86330 paintcaused NOEC values for A. tonsa that were at least 1,000 and 100 times,respectively, higher than the corresponding NOEC values for leachatefrom the organotin-based paint.
68
7 References
Allen, H.E. (1993): The significance of trace metal speciation for water,sediment and soil quality criteria and standards. The Science of the TotalEnvironment, Suppl. 1993.
Ankley, G.T. (1996): Evaluation of metal/acid-volatile sulfide relation-ships in the prediction of metal bioaccumulation by benthic macroverte-brates. Environ. Toxicol. Chem., 15, 2138-2146.
Ankley, G.T., N.A. Thomas, D.M. Di Toro, D.J. Hansen, J.D. Mahony,W.J. Berry, R.C. Schwartz and R.A. Hoke (1994): Assessing potentialbioavailability of metals in sediments: A proposed approach. Environ-mental Management, 18, 331-337.
AQUIRE (1999): Aquatic toxicity information retrieval. US EPA, Na-tional Health and Environmental Effects Laboratory, Mid-ContinentEcology Division. On-line available via Internet.http:\\www.epa.gov\ecotoxy.
Arch Chemicals (1999a): Results of mysid test. Received from P. Turley.
Arch Chemicals (1999b): Analytical protocol. Received from J.C. Ritter.
Arrhenius, Å. (1997): Effects of 4,5-dichloro-2-n-octyl-4-isothiazoline-3-one, the active ingredient of the new antifouling agent Sea-nine TM211Biocide, on marine microalgal communities. Master thesis. University ofGöteborg, Göteborg, 20 pp.
Bach, H., D. Rasmussen, J.A. Farr and N. Nyholm (1986): Calculationsof chemical fate of substances discharged into the Stenungsund recipient[Beregninger af chemical fate for stoffer udledt til Stenungsund recipi-enten]. VKI, Report to Statens Vandvårsverk (Sweden) (in Danish).
Bard, J. (1997): Supplement 1 to the ecotoxicological evaluation of cop-per in antifouling paints, copper, cuprous oxide, cuprous thiocyanate.Report to KemI, Sweden, 40 pp.
Bjørnestad, E., T. Madsen, C. Helweg, H.B. Rasmussen, C. Seierø, H.Enevoldsen and F. Pedersen (1999): Ecotoxicological tests of leachatesof antifouling paints. VKI report No. 11324/100 prepared for Hempel'sMarine Paints A/S.
Boeri, R.L. and T.J. Ward (1990): Acute flow-through toxicity of RH-287 to the mysid, Mysidopsis bahia. Rohm and Haas report No. 89RC-0305. EnviroSystems Division, Resource Analysts, Incorporated, Hamp-ton, New Hampshire 03842.
Boeri, R.L., J.P. Magazu and T.J. Ward (1993): Acute toxicity of zincomadine (zinc bis-1-oxide-2(1H)-pyridinethionate) to the mysid, Mysi-dopsis bahia. Study report. U.S. EPA-FIFRA, Guideline 72-3(b). T.R.Wilbury Study Number 23-OL, pp. 1-28. Arch Chemicals.

69
Boeri, R.L., J.P. Magazu and T.J. Ward (1994a): Acute toxicity of zincomadine (zinc bis-1-oxide-2(1h)-pyridinethionate) to the fathead min-now, Pimephales promelas. Study report. U.S. EPA-FIFRA, Guideline72-1. T.R. Wilbury Study Number 19-OL, pp. 1-29. Arch Chemicals.
Boeri, R.L., J.P. Magazu and T.J. Ward (1994b): Acute toxicity of zincomadine to the rainbow trout, Oncorhynchus mykiss. Study report. U.S.EPA-FIFRA, Guideline 72-1. T.R. Wilbury Study Number 20-OL, pp. 1-28. Arch Chemicals.
Boeri, R.L., J.P. Magazu and T.J. Ward (1994c): Acute toxicity of zincomadine (zinc bis-1-oxide-2(1H)-pyridinethionate) to the sheepsheadminnow, Cyprinodon variegatus. Study report. U.S. EPA-FIFRA,Guideline 72-3(b). T.R. Wilbury Study Number 22-OL, pp. 1-30. ArchChemicals.
Boeri, R.L., J.P. Magazu and T.J. Ward (1994d): Acute toxicity of zincomadine (zinc bis-1-oxide-2(1H)-pyridinethionate) to the daphnid,Daphnia magna. Study report. U.S. EPA-FIFRA, Guideline 72-2. T.R.Wilbury Study Number 21-OL, pp. 1-28. Arch Chemicals.
Boeri, R.L., J.P. Magazu and T.J. Ward (1994e): Acute flow-throughmollusc shell deposition test with zinc omadine (zinc bis-1-oxide-2(1H)-pyridinethionate). Study report. U.S. EPA-FIFRA, Guideline 72-3(c).T.R. Wilbury Study Number 24-OL, pp. 1-27. Arch Chemicals.
Boeri, R.L., P.L. Kowalski and T.J. Ward (1994f): Acute toxicity ofomadine sulfonic acid (pyridine-N-oxide-2-sulfonic acid) to the sheep-shead minnow, Cyprinodon variegatus. Study report. U.S. EPA-FIFRA,Guideline 72-3. T.R. Wilbury Study Number 36-OL, pp. 1-27. ArchChemicals.
Boeri, R.L., P.L. Kowalski and T.J. Ward (1994g): Growth and repro-duction test with omadine sulfonic acid (pyridine-N-oxide-2-sulfonicacid) and the freshwater alga, Selenastrum capricornutum. Study report.Guidelines referenced FIFRA 122-2. T.R. Wilbury Study Number 39-OL,pp. 1-28. Arch Chemicals.
Boeri, R.L., P.L. Kowalski and T.J. Ward (1994h): Acute toxicity ofomadine sulfonic acid (pyridine-N-oxide-2-sulfonic acid) to the mysid,Mysidopsis bahia. Study report. U.S. EPA-FIFRA, Guideline 72-3 (b).T.R. Wilbury Study Number 37-OL, pp. 1-28. Arch Chemicals.
Boeri, R.L., P.L. Kowalski and T.J. Ward (1994i): Acute flow-throughmollusc shell deposition test (pyridine-N-oxide-2-sulfonic acid) withomadine sulfonic acid. Study report. U.S. EPA-FIFRA, Guideline 72-3.T.R. Wilbury Study Number 38-OL, pp. 1-27. Arch Chemicals.
Boeri, R.L., J.P. Magazu and T.J. Ward (1999): Early life-stage toxicityof zinc pyrithione and pyridine-2-sulfonic acid (persistent terminal de-gradant) to the fathead minnow, Pimephales promelas. Study report.OECD 210 guideline. T.R. Wilbury. Study number 1678-OL, pp. 69.Arch Chemicals.
70
Borgman, U. and W.P. Norwood (1997): Toxicity and accumulation ofzinc and copper in Hyalella azteca exposed to metal spiked sediments.Can. J. Fish. Aquat. Sci., 54, 1046-1054.
Brand, L.E., W.G. Sunda and R.R.L. Guillard (1986): Reduction of ma-rine phytoplankton reproduction by copper and cadmium. J. Exp. Mar.Biol. Ecol., 96, 225-250.
Bruland, K.W., J.R. Donat and D.A. Hutchins (1991): Interactive influ-ences of bioactive trace metals on biological production in oceanic wa-ters. Limnol. Oceanogr., 36, 1555-1577.
Burgess, D. (1990): Acute flow-through toxicity of RH-287 technical toDapnia magna. Rohm and Haas report No. 89RC-0017. ABC Labora-tory, Inc., Columbia, Missouri 65205.
Burns, L.A., D.M. Cline and R.R. Lassiter (1981): Exposure analysismodelling system (EXAMS): User manual and system documentation.EPA – Environmental Resarch Laboratory, Athens.
Calkins, J., (1975): Measurements of the penetration of solar UV-B intovarious natural waters”. In: climatic impact assessment program, 1975.Monograph 5, U.S. Department of Transportation, Washington D.C.
Callow, M.E. and J.A. Finlay (1995): A simple method to evaluate thepotential for degradation of antifouling biocides. Biofouling, 9, 153-165.
Callow, M.E. and G.L. Willingham (1996): Degradation of antifoulingbiocides. Biofouling, 10, 239-249.
Calmano, W., W. Ahlf and U. Förstner (1990): Exchange of heavy metalsbetween sediment components and water. NATO ASI Series, Vol. G.23.Metal speciation in the environment. Broekaert, J.A.C., Gücer, S., Ad-ams; F. (eds). Springer-Verlag, Berlin.
Campbell, P.G.C (1995): Interactions between trace metals and aquaticorganisms: A critique of free-ion activity model. A. Tessier and D.R.Turner (eds). Metal speciation and bioavailability in aquatic systems..John Wiley and Sons Ltd.
Ciceri, G., S. Maran, W. Martinotti and G. Queirazza (1992): Geochemi-cal cycling of heavy metals in a marine coastal area: Benthic flux deter-mination from pore water profiles and in situ measurements using ben-thic chambers. Hydrobiol., 235/236, 501-517.
Claisse, D. and C.I. Alzieu (1993): Copper contamination as a result ofantifouling paint regulations? Mar. Poll. Bulletin, 26, 395-397.
Counties of Roskilde and Frederiksborg (1997): Monitoring of the Ro-skilde Inlet in 1996 [Overvågning af Roskilde Fjord, 1996] (in Danish).
County of Funen (1999): Unpublished data (Søren Larsen).
Danish Meteorological Office (1999): Weather information data from theDanish Meteorological Office.

71
Danish Ministry of Environment and Energy (1996): Statutory Order No.921 of 8 October 1996 on waters and requirements on discharge of spe-cific hazardous substances into watercourses, lakes or the sea [Bek-endtgørelse nr. 921 af 8. oktober 1996 om kvalitetskrav for vandområderog krav til udledning af visse farlige stoffer til vandløb, søer eller havet](in Danish).
Danish Statistical Office (1996): Statistical year-book.
Danish Sailing Association and Hempel (1999): Preliminary assessmentof mechanical cleaning as an alternative to biocide-containing marinebottom paint and assessment of biocide-containing antifoulants with pre-sumed reduced environmental impact [Indledende vurdering af mekaniskrensning som alternativ til biocidholdig bundmaling samt vurdering afbiocidholdige antibegroningsmidler med forventet reduceret miljøbelast-ning]. Final draft report for the Danish Environmental ProtectionAgency, June 1999 (in Danish).
Debourg, C., A. Johnson, C. Lye, L. Törnqvist and C. Unger (1993): An-tifouling products. Pleasure boats, commercial vessels, nets, fish cagesand other underwater equipment. KEMI Report No. 2/93. The SwedishNational Chemicals Inspectorate. Solna.
Derbyshire, R.L., A.H. Jacobson, M.L. O’Dowd and M.A. Santangelo(1991): Metabolism of RH-5287 in bluegill sunfish. Rohm and HaasCompany Technical Report No. 34-90-71, Rohm and Haas Company,Spring House, PA.
DHI (1994): The cove and broad of Roskilde: A wastewater study [Ro-skilde vig og bredning: Spildevandsundersøgelse]. August 1994 (in Dan-ish).
EC (1996): Technical Guidance Document in support of commissiondirective 93/67/EEC on risk assessment for new notified substances andcommission regulation (EC) No 1488/94 on risk assessment for existingsubstances. Part II Environmental risk assessment. Brussels.
European Chemicals Bureau (1997): EUSES – The European Unionsystem for the evaluation of substances. Joint Research Centre EuropeanCommission Environment Institute, European Chemicals Bureau, Ispra.
Fenn, R. (1999): Photolysis of zinc pyrithione in natural sunligth. Studyconducted by Arch Chemicals Inc., 1999.
Forbes, T.L., V.E. Forbes, A. Giessing, R. Hansen and L.K. Kure (1998):Relative role of porewater versus ingested sediment in bioavailability oforganic contaminants in marine sediments. Environ. Toxicol. Chem., 17,2453-2462.
Forbis, A.D. (1990): Acute toxicity of RH-287 to Selenastrum capricor-nutum Printz. Final report #37740. U.S. EPA-FIFRA, 40 CFR, Part158.150, Guideline 122-2. ABC Laboratories, Columbia, Missouri65205. Rohm and Haas.

72
Forbis, A.D., L. Georgie and B. Bunch (1985): Uptake, depuration andbioconcentration of 14C-RH-5287 by bluegill sunfish (Lepomis macrochi-rus). Rohm and Haas Company Technical Report No. 310-86-33, ABCLabs, Inc., Columbia, MO.
Förstner, U. (1985): Chemical forms and reactivities of metals in sedi-ments. Leschber, R., R.D. Davis and P. L’Hermite (eds). Chemical meth-ods for assessing bio-available metals in sludges and soils. Elsevier Ap-plied Science, London, pp. 1-30.
Förstner, U., W. Ahlf, W. Calmano, M. Karsten and J. Schoer (1990):Assessment of metal mobility in sludges and solid wastes. NATO ASISeries, Vol. G.23. Metal speciation in the environment. Broekaert,J.A.C., S. Gücer and F. Adams (eds). Springer-Verlag, Berlin.
Fredenslund, F., M. Severinsen and M. Bugge Andersen (1995): Evalua-tion of the SimpleBox model for Danish conditions. Environmental Proj-ect No. 307, Danish Environmental Protection Agency, Copenhagen.
Garvey, J.E., H.A. Owen and R.W. Winner (1991): Toxicity of copper tothe green algae, Chlamydomonas reinhardtii (Chlorophyceae), as af-fected by humic substances of terrestrial and freshwater origin. AquaticToxicology, 19, 89-96.
Gustavson, K., S. Petersen, B. Pedersen, F. Stuer-Lauridsen and S.Å.Wängberg (1999): Pollution-induced community tolerance (PICT) incoastal phytoplankton communities exposure to copper. Hydrobiologia(in press).
Hall, L.W. and R.D. Anderson (1998): A deterministic ecological riskassessment for copper in European saltwater environments. Rohm andHaas Company. Biocides Technical Report No. 98-23.
Harremoës, P. and A. Malmgren-Hansen (1989): Textbook of water pol-lution [Lærebog i vandforurening]. Polyteknisk Forlag (in Danish).
Heitmuller, T. (1977): Acute toxicity of C-9211 to brown shrimp (Pe-naeus aztecus). Toxicity test report. EGandG, Bionomics, Marine Re-search Laboratory, Route 6, Box 1002, Pensacola, Florida 32507.
Hempel (1999a): Telefax dated 21 April 1999 from Martin Wiese Chris-toffersen (Hempel).
Hempel (1999b): Telefax dated 16 September 1999 from Eva Bie Kjær(Hempel).
Hempel (1999c): Telefax dated 30 September 1999 from Eva Bie Kjær(Hempel).
Howard, P.H. (1991): Handbook of environmental fate and exposure datafor organic chemicals. Vol. III, Pesticides, Lewis Publ. 684 pp.
Hunt, C.D. and D.L. Smith (1983): Remobilization of metals from pol-luted marine sediments. Can. J. Fish. Aquat. Sci., 40, 132-142.

73
ISO (1998): Water quality - determination of acute lethal toxicity to ma-rine copepods (Copepoda, Crustacea). ISO/FDIS 14669.
ISO (1999): Draft standard for calculation method (ISO 15184-4). For-warded to members of ISO/TC35/SC9/WG27, general test methods forpaints and varnishes - determination of leaching rates from antifoulingpaints. Date 24 June 1999.
Jacobson, A. (1993). RH-5287: Octanol:water partition coefficient.Rohm and Hass Company, Research Laboratories, Pennsylvania.
Jacobson, A. and V. Kramer (1999): Additonal information on water-sediment partitioning and half-life of DCOI in a harbor. Note preparedfor VKI. Rohm and Haas Company, Research Laboratories, Pennsylva-nia.
Jensen, C.A. and J.A. Heslop (1997a): Study of environmental problemsin the use of bottom paints on pleasure craft [Undersøgelse af mil-jøproblemer ved brug af bundmalinger på lystbåde]. The County ofÅrhus (in Danish).
Jensen, C.A. and J.A. Heslop (1997b): New analytical results publishedin relation to the above report (in Danish).
Johansen, K. and F. Møhlenberg (1987): Impairment of egg production inAcartia tonsa exposed to tributyltin oxide. Ophelia 27, 1327-1341.
Karman, C.C., E.A. Vik, H.P.M. Schobben, G.D. Øfjord and H.P. vanDokkum (1996): Charm III Main Report. TNO-MEP R96/355. Instituteof Environmental Sciences, Energy Research and Process Innovation(TNO-MEP), Department of Ecological Risk Studies, Den Helder (Neth-erlands).
Kawashima, Y. (1997a): Acute toxicity test of RH-287 with Japaneseflounder. Test report. Kurume Research Laboratories, Chemical Bio-testing Center, Chemicals Inspection and Testing Institute, Japan.
Kawashima, Y. (1997b): Acute toxicity test of RH-287 with Red Seabream. Test report. Kurume Research Laboratories, Chemical BiotestingCenter, Chemicals Inspection and Testing Institute, Japan.
Kesterson, A. and R. Atkins (1992a): Supplemental study on the aerobicaquatic metabolism of 13/14C RH-5287. PTRL East, Inc., Kentucky. Sub-mitting laboratory: Rohm and Haas Company, Pennsylvania.
Kesterson, A. and R. Atkins (1992b): Supplemental study on the anaero-bic aquatic metabolism of 13/14C RH-5287. PTRL East, Inc., Kentucky.Submitting laboratory: Rohm and Haas Company, Pennsylvania.
Kronprins Frederiks Bro (1996): Statistics of bridge openings and pass-ing-through of craft in 1995 (in Danish).
Kronprins Frederiks Bro (1998): Statistics of bridge openings and pass-ing-through of craft in 1997 (in Danish).

74
Kronprins Frederiks Bro (1999): Statistics of bridge openings and pass-ing-through of craft in 1998 (in Danish).
Lawrence, L.J., B. Lawrence, S. Jackson and A. Kesterson (1991a):Aerobic aquatic metabolism of 13/14C RH-5287. PTRL East, Inc., Ken-tucky. Submitting laboratory: Rohm and Haas Company, Pennsylvania.
Lawrence, L.J., B. Lawrence and A. Kesterson (1991b): Anaerobicaquatic metabolism of 13/14C RH-5287. PTRL East, Inc., Kentucky. Sub-mitting laboratory: Rohm and Haas Company, Pennsylvania.
Leak, T. (1986): Characterization of RH-5287 in fish tissues and waterfrom a bioconcentration study. Technical report No. 310-86-32. Rohmand Haas Company, Independence Mall West, Philadelphia, Pennsylva-nia 19105.
Lewis, A.G. (1995): Copper in water and aquatic environments. Int.Copper Association, Ltd. New York.
Luoma, S.N. (1989): Can we determine the biological availability ofsediment-bound trace elements? Hydrobiol. 176/177, 379-396
Madsen, T. and P. Kristensen (1997): Effects of bacterial inoculation andnonionic surfactants on degradation of polycyclic aromatic hydrocarbonsin soil. Environ. Toxicol. Chem., 16, 631-637.
Madsen, T., K. Gustavson, L. Samsøe-Petersen, F. Simonsen, J. Jacob-sen, S. Foverskov and M.M. Larsen (1998): Survey and assessment ofantifouling products for pleasure craft in Denmark [Kortlægning og vur-dering af antibegroningsmidler til lystbåde i Danmark]. EnvironmentalProject No. 384. The Danish Environmental Protection Agency, Copen-hagen, 108 pp (in Danish).
Mazza, L.S. (1993): Supplemental study on the aerobic aquatic metabo-lism of RH-5287. Rohm and Haas Company, Research Laboratories,Pennsylvania.
NERI (1986): A novel life-cycle test with copepods. M. Chen and F.Møhlenberg. The National Environmental Research Institute.
OECD (1984): Alga, growth inhibition test. Guideline for testing ofchemicals, No. 201.
OECD (1989): Partition coefficient (n-octanol/water), high performanceliquid chromatography (HPLC) method. Guideline for testing of chemi-cals, No. 117.
Olin (1997): Evaluation of the safety and efficacy of Zinc omadine in-dustrial fungicide. Technical summary submitted by Olin. Arch Chemi-cals.

75
Paulson, A.J., H.C. Curl and J.F. Gendron (1994): Partitioning of Cu inestuarine waters, II. Control of partitioning by the biota. Marine Chemis-try, 45, 81-93.
Petersen, W., E. Willer and C. Willamowski (1997): Remobilization oftrace elements from polluted anoxic sediments after resuspension in oxicwater. Water, Air and Soil Pollution, 99: 515-522.
Peterson, G.S., G.T. Ankley and E.N. Leonard (1996): Effect of biotur-bation on metal-sulfide oxidation in surficial freshwater sediments. Envi-ron. Toxicol. Chem., 15, 2147-2155.
Putt, A.E. (1994): RH-287 Technical - acute toxicity to amphipods (Am-pelisca abdita) during a 10-day sediment exposure under static condi-tions. Rohm and Haas Report No. # 94RC-0092. Springborn Laborato-ries, Inc., Wareham, Massachusetts 02571-1075.
Reichelt, A.J. and G.B. Jones (1994): Trace metals as tracers of dredgingactivity in Cleveland Bay - field and laboratory studies.
Reynolds, J.L. (1995a): Aqueous photolysis of [pyridine-2,6-14C]zincomadine in pH 9 buffer and artificial sea water. XenoBiotic Laboratories,Inc., Plainsboro, NJ. Arch Chemicals.
Reynolds, J.L. (1995b): Hydrolysis of [pyridine-2,6-14C]zinc omadine.XenoBiotic Laboratories, Inc., Plainsboro, NJ. Arch Chemicals.
Ritter, J.C. (1996): Aerobic aquatic metabolism of [pyridine-2,6-14C]zinc omadine. Central Analytical Laboratory, Cheshire, CT. ArchChemicals.
Ritter, J.C. (1999a): Summary of the aerobic and anaerobic aquatic me-tabolism of [pyridine-2,6-14C]copper omadine and [pyridine-2,6-14C]zincomadine in marine water and sediment. Olin Research Centre, Cheshire,CT. Arch Chemicals.
Ritter, J.C. (1999b): Aerobic aquatic metabolism of [pyridine-2,6-14C]copper omadine® in marine water and sediment. Olin ResearchCentre, Cheshire, CT. Arch Chemicals.
Ritter, J.C. (1999c): Anaerobic aquatic metabolism of [pyridine-2,6-14C]copper omadine® in marine water and sediment. Olin ResearchCentre, Cheshire, CT. Arch Chemicals.
Ritter, J.C. (1999d): Supplemental aerobic aquatic metabolism of [pyri-dine-2,6-14C]zinc omadine® in marine water and sediment. Olin Re-search Centre, Cheshire, CT. Arch Chemicals.
Ritter, J.C. (1999e): Supplemental anaerobic aquatic metabolism of[pyridine-2,6-14C]zinc omadine® in marine water and sediment. OlinResearch Centre, Cheshire, CT. Arch Chemicals.
Roberts Jr., M.H., P.F. de Lisle, M.A. Vogelbein and R.C. Hale (1990):Acute toxicity of RH-287 to the American oyster, Crassostrea virginica
76
in static natural and synthetic estuarine waters. Rohm and Haas ReportNo. 89RC-0037.
Salomons, W., N.M. de Rooij, H. Kerdijk and J. Bril (1987): Sedimentsas a source for contaminants? Hydrobiol., 149, 13-30.
Schwarzenbach, R.P., P.M. Gschwend and D.M. Imboden (1993): Envi-ronmental organic chemistry. John Wiley and Sons, Inc.
Shade, W.D., S.H. Hurt, A.H. Jacobson and K.H. Reinert (1993): Eco-logical risk assessment of a novel marine antifoulant. Environmentaltoxicology and risk assessment: 2nd Volume, ASTM STP 1216. J.W.Gorsuch, F.J. Dwyer, C.G. Ingersoll and T.W. La Point (eds.), AmericanSociety for Testing and Materials, Philadelphia, 1993.
Slotton, D.G. and J.E. Reuter (1995): Heavy metals in intact and resus-pended sediments of a California reservoir, with emphasis on potentialbioavailability of copper and zinc. Mar. Freshwater Res., 46, 257-265.
Smalley, J.D. and J.L. Reynolds (1996): Anaerobic aquatic metabolismof [pyridine-2,6-14C]zinc omadine in fresh water and seawater. XenoBi-otic Laboratories, Inc., Plainsboro, NJ. Arch Chemicals.
Steen, R.J.C.A., J. Jacobsen, F. Ariese and A.G.M. van Hattum (1999):Monitoring Sea-Nine 211 antifouling agent in a Danish harbor. IvM,Vrije Universiteit, Report number E99/10.
Sword, M.C. and M. Muckerman (1994a): Static acute toxicity of N-(n-octyl) malonamic acid to rainbow trout (Oncorhynchus mykiss). Rohmand Haas Report No. #93RC-0166. ABC Laboratories, Columbia, Mis-souri 65202.
Sword, M.C. and M. Muckerman (1994b): Static acute toxicity of N-(n-octyl) malonamic acid to Daphnia magna. Rohm and Haas Report No.#93RC-0165. ABC Laboratories, Columbia, Missouri 65202.
Syracuse Research Corporation (1996): LOGKOW software program.Syracuse Research Corporation, New York.
Sørensen, J., B.B. Jørgensen and N.P. Revsbech (1979). A comparison ofoxygen, nitrate, and sulfate respiration in coastal marine sediments. Mi-crobial Ecology, 5, 105-115.
Turley, P.A. and N.P. Skoulis (1997): A review of the aquatic fate andtoxic effects of zinc omadine. Arch Chemicals.
U.S. EPA (1999): GCSOLAR. Program from U.S. EPA.
Veith, G.D. and P. Kosian (1983): Estimating bioconcentration potentialfrom octanol/water partition coefficients. D. Mackay, S. Paterson, S.J.Eisenreich and M.S. Simons (eds.), Physical behavior of PCBs in theGreat Lakes. Ann Arbor Science, Ann Arbor, MI, USA.

77
Wang, W. and N.S. Fisher (1996): Assimilation of trace elements andcarbon by the mussel Mytilius edulis: Effects of food composition. Lim-nol. Oceanogr., 41, 197-207.
Wängberg S.-Å., S. Alexanderson and M. Hellgren (1995): The contri-bution from bottom paints to the occurrence of copper in the aquatic en-vironment. Follow-up on KemI’s decision on bottom paints by uses ofPICT examination of microalgal communities [Båtbottonfärgernas bidragtil kobberförekomsten i den akvatiske miljö. Upföljning av KemI´s beslutom båtbottonfärger, med hjælp av PICT-undersökning på microalgesam-hällen]. KemI report (in Swedish).
Ward, T.J. and R.L. Boeri (1990): Chronic toxicity of RH-287 to thedaphnid, Daphnia magna. Study report. EnviroSystems Study No. 9031-RH. Rohm and Haas Report No. 9ORC-0050. EnviroSystems Division,Resource Analysts, Incorporated, Hampton, New Hampshire 03842.
Ward, T.J., J.P. Magazu and R.L. Boeri (1994a): Growth and reproduc-tion test with zinc omadine (zinc bis-1-oxide-2(1H)-pyridinethionate)and the freshwater alga, Selenastrum capricornutum. Study report.Guidelines referenced FIFRA 122-2. T.R. Wilbury Study Number 25-OL.Page 1-29. Arch Chemicals.
Ward, T.J., P.L. Kowalski and R.L. Boeri (1994b): Acute toxicity ofomadine sulfonic acid (pyridine-N-oxide-2-sulfonic acid) to the fatheadminnow, Pimephales promelas. Study report. U.S. EPA-FIFRA, Guide-line 72-1. T.R. Wilbury Study Number 33-OL, pp. 1-28. Arch Chemicals.
Ward, T.J., P.L. Kowaski and R.L. Boeri (1994c): Acute toxicity ofomadine sulfonic acid (pyridine-N-oxide-2-sulfonic acid) to the rainbowtrout, Oncorhynchus mykiss. Study report. U.S. EPA-FIFRA, Guideline72-1. T.R. Wilbury Study Number 34-OL, pp. 1-28. Arch Chemicals.
Ward, T.J., P.L. Kowaski and R.L. Boeri (1994d): Acute toxicity ofomadine sulfonic acid (pyridine-N-oxide-2-sulfonic acid) to the daphnid,Daphnia magna. Study report. U.S. EPA-FIFRA, Guideline 72-2. T.R.Wilbury Study Number 35-OL, pp. 1-26. Arch Chemicals.
Wells, M.L., P.B. Kozelka and K.W. Bruland (1998): The complexationof ”dissolved” Cu, Zn, Cd and Pb by soluble and colloidal organic matterin Nraragansett Bay, RI. Mar. Chem., 62, 203-217.
Westerlund, S.F.G., L.G. Anderson, P.O.J. Hall, Å. Iverfeldt, M.M. Rut-gers van der Loeff and B. Sundby (1986): Benthic fluxes of cadmium,copper, nickel, zinc and lead in the coastal environment. Geochimica etCosmochimica Acta, 50, 1289-1296.
Zafirioiu, O.C. (1977): Marine organic photochemistry previewed. Ma-rine Chemistry 5, 497-522.
Zehnder, A.J.B., B. Huser and T.D. Brock (1979). Measuring radioactivemethane with the liquid scintillation counter. Appl. Environ. Microbiol.,37, 897-899.

78
Zepp, R.G. and D.M. Cline (1977): Rates of direct photolysis in aquaticenvironment. Env. Sci.Techn., 11, 359-366.

79
Appendix 1: Model for calculation of ex-posure concentrations (PEC)
1. Introduction
This appendix describes the exposure model which was used for calcu-lating the exposure concentrations PEC (Predicted Environmental Con-centration) for DCOI and zinc pyrithione (ZPT) and their main metabo-lites.
The established model applies modelling principles that are generallyused at the determination of PEC. Numerous models for calculating ex-posure are described in literature, i.a.:
• SimpleBox, which is a ”multi-compartment” model based on the fu-gacity principle (Fredenslund et al. 1995). This model is used in theTechnical Guidance Document (TGD) for generic risk assessments ofindividual substances (EC 1996) and is thus incorporated in the edpmodel EUSES, which is an “electronic” edition of the TGD (Euro-pean Chemicals Bureau 1997).
• Furthermore, EUSES includes a module for estimation of PEC for
antifoulants. • The CHARM model, which is used for risk assessments of offshore
chemicals (Karman et al. 1996). • EXAMS, which is an interactive computer program for simulation of
the fate of environmentally hazardous substances in aquatic ecosys-tems (Burns et al. 1981).
2. Establishing a calculation model In general, exposure assessments are composed of the following items: • Setting up of scenarios describing the environmental parameters of
importance to the emission and the fate of the substances • Determination of the emission of chemicals • Calculation of PEC in relevant sub-environments • Sensitivity analysis in which the relative dependency of PEC of the
parameters forming part of the standard scenarios and the relativedependency of PEC of the parameters of the substances are esti-mated.
These elements were also applied in the present exposure calculations.

80
2.1 ScenariosTwo standard scenarios have been set up for the calculation of exposureconcentrations (PEC):
1. Pleasure craft harbour. The pleasure craft harbour of Jyllinge hasbeen chosen as standard pleasure craft harbour. This pleasure craftharbour was selected as a realistic worst-case as the harbour has alarge number of boats compared to the water volume of the harbourand a low water exchange. The whole harbour area is included in thescenario and total mixing is assumed for the entire harbour area.
2. Busy navigation route. The narrows of Kronprins Frederiks Bro (near
Frederikssund) was chosen as standard navigation route. Partly be-cause there is relatively heavy traffic of pleasure craft and partly be-cause statistics have been made of the number of boats passing thebridge. The scenario comprises a water column with a length of 1metre in the sailing direction and a width similar to that of the boats.Total mixing is assumed in the vertical direction of the water column.
Both standard scenarios are thus placed in Roskilde Fjord.
Each scenario was characterized as regards:
• Water exchange The net water exchange between Roskilde Fjord (inlet) and its mouthat Isefjord is assumed to correspond to the net water supply to theinlet, which is stated to be approx. 1.25 ⋅ 10-4 m3 ⋅ s-1 per metre of thelength of the inlet (Harremoës and Malmgren-Hansen 1989). As Ro-skilde Fjord is approx. 38 km long (Harremoës and Malmgren-Hansen 1989), a total of approx. 410,400 m3 water is supplied a day.With a surface area of approx. 125 km2, this corresponds to a netwater exchange of 0.003 m3/m2/day. The net water exchange is thusvery low. DHI (1994) thus also indicates that the water level in Ro-skilde Fjord is primarily determined by wind conditions and tidalvariations. The water level variations determine the currents and thusthe water exchange of the inlet. The largest variations in water levelare induced by the wind but the tide determines the regular minimumvariations and thus which minimum water exchange occurs in a shortview. At Hundested in the north, the normal range of the tide is ap-prox. 20 cm, which corresponds to the daily variation in calmweather observed by the bridge guard at Kronprins Frederiks Bronear Frederikssund. At the bottom of the inlet near Roskilde, the tidalvariations are as low as 6-7 cm (DHI 1994). Due to the wind, nor-mally occurring variations over longer periods of time are, however,much larger.
• For the pleasure craft harbour of Jyllinge, it is primarily north-westerly winds that may cause up to 1 metre high tides andsoutheast and southerly winds that may cause 0.5-1.0 m lowtides. Data on the water level (for the years 1996, 1997 and 1998)for a station at Værebro Å (stream), which falls into RoskildeFjord a few kilometres north of the pleasure craft harbour, state amean daily total change in the water level of approx. 0.6 m/day

81
(0.6 m3/m2/day). The data on water levels were obtained fromIvar Thorstein Hansen, the County of Roskilde. This water levelfigure is considered to reflect the water exchange in the pleasurecraft harbour of Jyllinge and is used in the model calculations.
• For the narrows at Frederikssund, the difference between dailyminimum and maximum water depths (at times without highwinds when the differences may be much more considerable) isstated by the bridge guard to be approx. 0.2 m. Furthermore, windconditions will contribute to the water exchange. We have notsucceeded in obtaining exact data on the water depth under thebridge, Kronprins Frederiks Bro, but the water exchange willprobably as a minimum be at the same level as the water ex-change in the pleasure craft harbour of Jyllinge and at Værebro.Therefore, a water exchange of approx. 0.6 m3/m2/day was as-sumed for the narrows at Frederikssund.
For both scenarios, the concentration of substance in the water trans-ported into the waters in question is considered insignificant.
• Water depth. • Composition and characterization of suspended matter. The sus-
pended matter was characterized with respect to the contents of or-ganic matter. Furthermore, the suspended matter was considerednegatively charged.
• Salinity. • Temperature. In the present study, the temperature is put at 12.5°C,
corresponding to the mean air temperature from April till September(the sailing season is typically from the end of April to the beginningof October).
• pH. • The number of m2 of bottom areas of ships that are in the waters per
time unit. • The percentage of the ships having bottom paint with the examined
antifoulant (P). • Water-holding capacity of the sediment. Apart from a minor content
of organic carbon in the sediment, the composition of the uppersediment layer was assumed to be identical to the composition of thesuspended matter. The sediment was assumed to be anaerobic.
• Number of boats in the waters in question.
• Danish Sailing Association (personal correspondence with SteenWintlev, Danish Sailing Association) has passed on informationon the capacity (number of sailing and motor boats) of the pleas-ure craft harbour of Jyllinge. Furthermore, Danish Sailing Asso-

82
ciation has estimated the average wet surface of the boats to beapprox. 18 m2.
• Statistics on the passing-through of pleasure craft for 1995, 1996and 1998 (Kronprins Frederiks Bro 1996, 1998, 1999) were usedfor determining the number of sailing and motor boats passingthe bridge. Based on these statistics, the average daily number ofpassing-throughs in the peak season (May - October) was fixed atapprox. 70 pleasure craft a day. The distribution of pleasure crafton sailing boats and motor boats and thus the average wet surfaceof the boats is assumed to be the same as that for the pleasurecraft harbour of Jyllinge.
• Average time which the centre of gravity of the boat stay in the wa-
ters:
• For the pleasure craft harbour, it was assumed that all the boatsare in the harbour. Danish Sailing Association states that theberths are occupied from approx. mid-May till end-September.During summer holidays (1 July - 15 August), approx. a third ofthe boats are gone, and there are almost no visitors in the harbouras it is situated inconveniently to tourists on their way throughRoskilde Fjord (personal correspondence with Steen Wintlev,Danish Sailing Association). Assuming that all berths are alwaysoccupied will thus overestimate the total leaching of antifoulantsto the harbour.
• Furthermore, Danish Sailing Association (personal correspon-dence with Steen Wintlev, Danish Sailing Association) states thatthe passing-through at Frederikssund takes place at relatively lowspeed because of the narrow fairway and the large number ofboats. When passing through, the sea speed is estimated to be ap-prox. 3-4 knots, corresponding to 5.5-7.4 km/h. The time that thecentre of gravity of a boat stays in the water column in question isthus approx. 5.6 ⋅ 10-6 – 7.5 ⋅ 10-6 days.
Table B1.1 summarizes the parameters characterizing the two scenarios.These parameters are applied in the basic calculations. Table B1.1 Standard scenario.
Parameter Remarks Unit Standard scenario Harbour Busy navigation route Selected location Pleasure craft harbour
of Jyllinge Kronprins Frederiks
Bro near Frederikssund
pH 7 7 Oxygen conditions(water column)
aerobic aerobic
Oxygen conditions(sediment)
anoxic anoxic
Salinity From Harremoës andMalmgren-Hansen (1989)
‰ 14.5 14.5
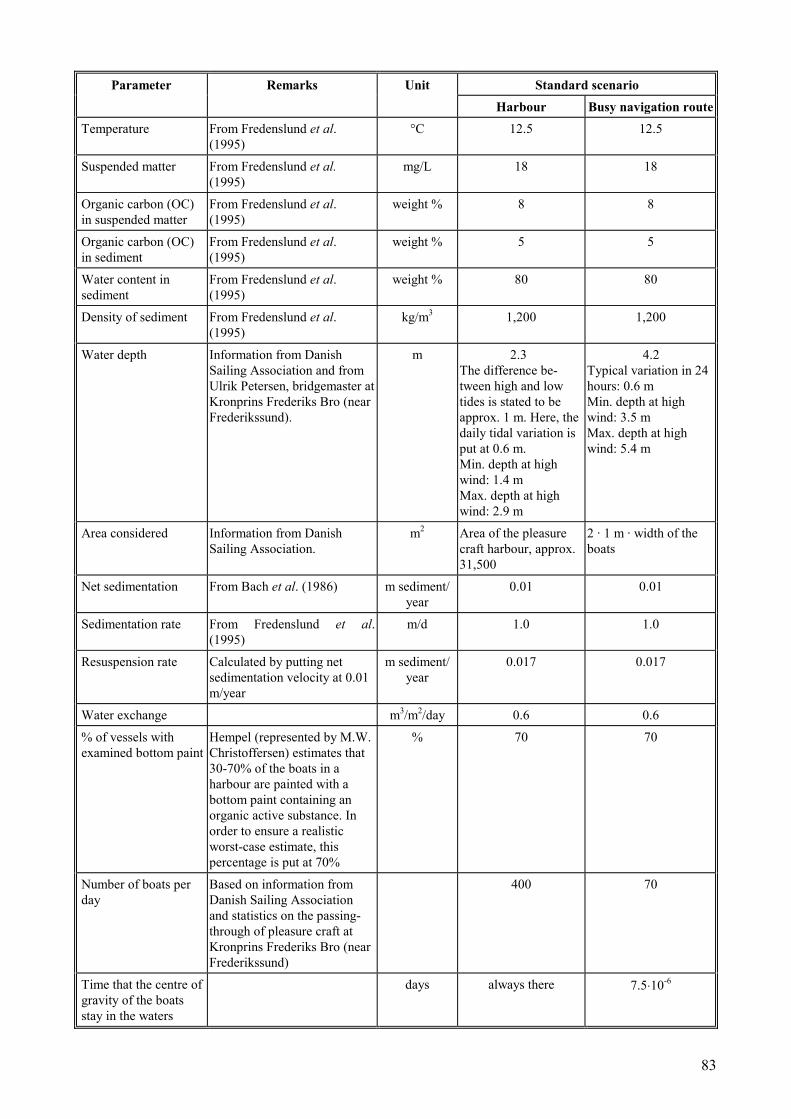
83
Parameter Remarks Unit Standard scenario Harbour Busy navigation route Temperature From Fredenslund et al.
(1995) °C 12.5 12.5
Suspended matter From Fredenslund et al.(1995)
mg/L 18 18
Organic carbon (OC)in suspended matter
From Fredenslund et al.(1995)
weight % 8 8
Organic carbon (OC)in sediment
From Fredenslund et al.(1995)
weight % 5 5
Water content insediment
From Fredenslund et al.(1995)
weight % 80 80
Density of sediment From Fredenslund et al.(1995)
kg/m3 1,200 1,200
Water depth Information from DanishSailing Association and fromUlrik Petersen, bridgemaster atKronprins Frederiks Bro (nearFrederikssund).
m 2.3The difference be-tween high and lowtides is stated to beapprox. 1 m. Here, thedaily tidal variation isput at 0.6 m.Min. depth at highwind: 1.4 mMax. depth at highwind: 2.9 m
4.2Typical variation in 24hours: 0.6 mMin. depth at highwind: 3.5 mMax. depth at highwind: 5.4 m
Area considered Information from DanishSailing Association.
m2 Area of the pleasurecraft harbour, approx.31,500
2 · 1 m · width of theboats
Net sedimentation From Bach et al. (1986) m sediment/year
0.01 0.01
Sedimentation rate From Fredenslund et al.(1995)
m/d 1.0 1.0
Resuspension rate Calculated by putting netsedimentation velocity at 0.01m/year
m sediment/year
0.017 0.017
Water exchange m3/m2/day 0.6 0.6
% of vessels withexamined bottom paint
Hempel (represented by M.W.Christoffersen) estimates that30-70% of the boats in aharbour are painted with abottom paint containing anorganic active substance. Inorder to ensure a realisticworst-case estimate, thispercentage is put at 70%
% 70 70
Number of boats perday
Based on information fromDanish Sailing Associationand statistics on the passing-through of pleasure craft atKronprins Frederiks Bro (nearFrederikssund)
400 70
Time that the centre ofgravity of the boatsstay in the waters
days always there 7.5⋅10-6

84
2.2 Emission of antifoulants The rate, at which the antifoulant leaches into the aquatic environment, isexpressed as follows:
U = [leached substance per area per time unit]. The measuring of realistic leaching rates of antifoulants is causing greatproblems as the leaching rate depends on various factors such as: • The time after painting. The leaching rate has often been demon-
strated to decrease as a function of the time as a result of the fallingconcentration of the substances in the paint.
• Thickness of the coat of paint • Liberation of other substances in the paint • Outward circumstances, i.e. whether the boat is sailing or not, cur-
rents/water exchange, temperature, etc. The leaching rate is typicallyhigher when the boat is sailing than when it is in port.
A draft standard (ISO 1999) is available from which the leaching rate canbe calculated. The leaching rate is determined on the basis of an estimateof the life of the paint, in which it is simply assumed that all of the anti-foulant will be released throughout the life of the paint. The first twoweeks after the boat has been painted, a higher leaching rate is antici-pated. After two weeks, the leaching rate is considered to be constant.The standard does not take into account that the leaching rate is probablyhigher while sailing than when the boat is in port, and the standard willthus be likely to overestimate the leaching rate when the boat is in portand underestimate the leaching rate while sailing. Furthermore, the draftstandard proposes typical thicknesses of coating and lives of differentpaints (ISO 1999). On the basis of the proposals of the draft standard oncoat thicknesses and lives, the thickness of the coat worn down in sixmonths (corresponding to a sailing season) can be calculated to be 42 µm(soluble matrix), 38 µm (insoluble matrix), 45 µm (tin-based self-polishing paint) and 50 µm (tin-free self-polishing paint). These coatthicknesses are in good agreement with the estimates that Hempel hasmade, stating an average worn down coat of paint of 42 µm per sailingseason for pleasure craft in Denmark (Hempel 1999c). Hempel has basedtheir calculation on the amount of bottom paint sold in the Danish marketa year and the number of sailing/motor boats of more than 6 m (corre-sponding to those painted) and their average bottom area.
In order to simulate the increased leaching rate while sailing, it is as-sumed that 60 µm of the coat of paint is worn off at constant sailing for 6months. In order to simulate the lower leaching rate when the boat is inport, it is assumed that 30 µm of the coat of paint is worn off when theboat is constantly in port for 6 months. The above corresponds to the as-sumption that the boats are sailing for approx. 2 months of a sailing sea-

85
son and are in port for the remaining 4 months and that the leaching ratewhile sailing is twice the rate when not sailing.
On the basis of confidential information from Hempel on the content ofantifoulants, dry matter and density (Hempel 1999b), the average leach-ing rates for the two types of antifoulants can be calculated. Table B1.2gives the results of these calculations.
Table B1.2Calculated average leaching rates.
Antifoulants Leaching rate (U) (mg/m2/day)In port While sailing
DCOI 13 25
ZPT 21 41
In the model, the total leaching of the active substance to the water pertime unit is expressed as:
[ ] τ⋅⋅⋅⋅⋅= U100
PANmg/dayF
whereN is the number of boats being in the water area per day [boats/day]
A is the average wet bottom area [m2/boat]
τ is the time that the centre of gravity of the boats stays in the wa-ters in question [days]
P is the percentage of the boats that have been painted with the an-tifoulant in question [%]
2.3 PEC modelThe model is divided into the following parts:
1. Mass balance in the water column2. Mass balance in the sediment
The following conditions in the water column were taken into considera-tion:
• The degradation rate of the parent compound and the subsequentformation of metabolites. Aerobic conditions in the water columnwere assumed. The effect of the temperature on the degradation ratewas included by assuming that the degradation rate is halved whenthe temperature falls by 10°C (or vice versa). During the modellingperiod, temperatures are not so low that degradation stops.
• Abiotic transformation. Degradation of ZPT by photolysis is in-
cluded. For the two investigated substances, hydrolysis is not consid-
Transformation inthe water column

86
ered a significant reaction (cf. Chapters 3 and 4). Like other reac-tions, degradation by photolysis is temperature dependent but the ef-fect of the temperature is less than for other reactions. Schwarzen-bach et al. (1993) thus states that a change in temperature of 10°Conly changes the reaction rate by a factor of between 1.15 and 1.5.Therefore, the effect of the temperature on the degradation by pho-tolysis is ignored in the present study.
• A first order degradation kinetics was assumed for all degradation
reactions. • No discrimination was made between dissolved substance and sub-
stance sorbed to dissolved organic matter (DOC). • Sorption to the suspended matter was expressed as a linear adsorp-
tion. • Linear sedimentation of the suspended matter was assumed. • Resuspension of sedimentated matter. In the calculations, the resus-
pension rate was assumed to be constant. The following conditions in the sediment were taken into consideration: • Sedimentation of suspended matter from the upper water layer. • Resuspension of sediment to the upper water layer. • A first order anaerobic degradation. The sediment was assumed to be
anaerobic for which reason only anaerobic degradation was included. • Only the sediment formed during the simulation period was exam-
ined. This sediment layer was considered to be a completely homo-geneous mixture.
For both the parent compound and its main metabolites, a mass balancewas established for the water column and the sediment. The following three PECs (Predicted Environmental Concentration) werecalculated: • PEC(water column)• PEC(sediment)• PEC(sediment, pore water) These three concentrations were put equal to the steady-state concentra-tion, i.e. the concentration that the calculated concentrations eventuallyapproach when simulating a continuous leaching of the substance to theaquatic environment. For all substances, the background level is assumed to be 0.
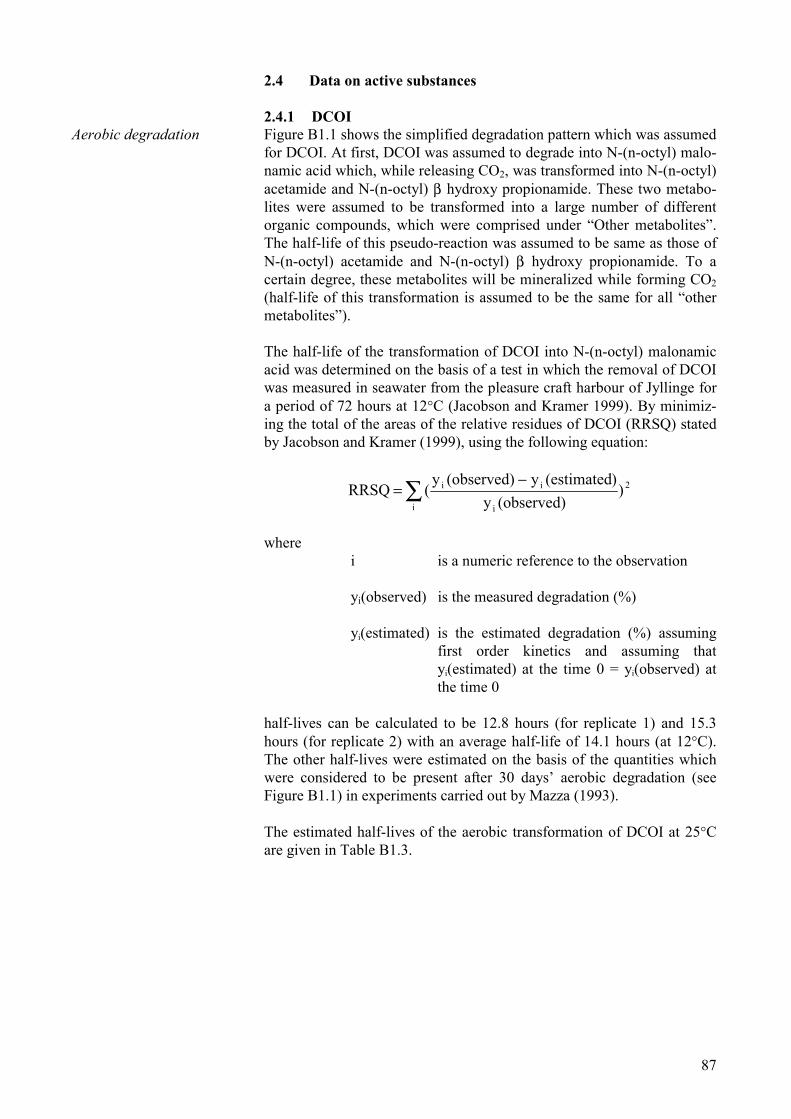
87
2.4 Data on active substances 2.4.1 DCOI Figure B1.1 shows the simplified degradation pattern which was assumedfor DCOI. At first, DCOI was assumed to degrade into N-(n-octyl) malo-namic acid which, while releasing CO2, was transformed into N-(n-octyl)acetamide and N-(n-octyl) β hydroxy propionamide. These two metabo-lites were assumed to be transformed into a large number of differentorganic compounds, which were comprised under “Other metabolites”.The half-life of this pseudo-reaction was assumed to be same as those ofN-(n-octyl) acetamide and N-(n-octyl) β hydroxy propionamide. To acertain degree, these metabolites will be mineralized while forming CO2(half-life of this transformation is assumed to be the same for all “othermetabolites”). The half-life of the transformation of DCOI into N-(n-octyl) malonamicacid was determined on the basis of a test in which the removal of DCOIwas measured in seawater from the pleasure craft harbour of Jyllinge fora period of 72 hours at 12°C (Jacobson and Kramer 1999). By minimiz-ing the total of the areas of the relative residues of DCOI (RRSQ) statedby Jacobson and Kramer (1999), using the following equation:
∑ −=
i
2
i
ii )(observed)y
)(estimatedy(observed)y( RRSQ
where i is a numeric reference to the observation yi(observed) is the measured degradation (%) yi(estimated) is the estimated degradation (%) assuming
first order kinetics and assuming thatyi(estimated) at the time 0 = yi(observed) atthe time 0
half-lives can be calculated to be 12.8 hours (for replicate 1) and 15.3hours (for replicate 2) with an average half-life of 14.1 hours (at 12°C).The other half-lives were estimated on the basis of the quantities whichwere considered to be present after 30 days’ aerobic degradation (seeFigure B1.1) in experiments carried out by Mazza (1993). The estimated half-lives of the aerobic transformation of DCOI at 25°Care given in Table B1.3.
Aerobic degradation
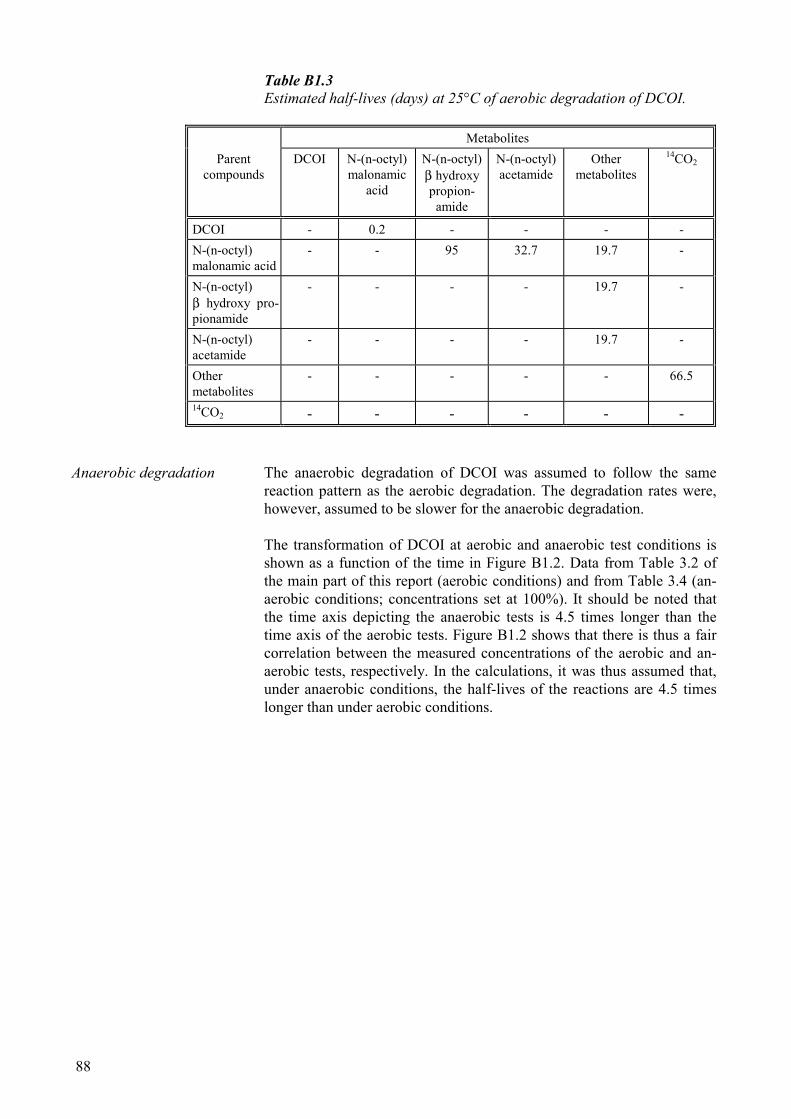
88
Table B1.3 Estimated half-lives (days) at 25°C of aerobic degradation of DCOI.
Metabolites Parent
compounds DCOI N-(n-octyl)
malonamicacid
N-(n-octyl)β hydroxypropion-
amide
N-(n-octyl)acetamide
Othermetabolites
14CO2
DCOI - 0.2 - - - - N-(n-octyl)malonamic acid
- - 95 32.7 19.7 -
N-(n-octyl)β hydroxy pro-pionamide
- - - - 19.7 -
N-(n-octyl)acetamide
- - - - 19.7 -
Othermetabolites
- - - - - 66.5
14CO2 - - - - - - The anaerobic degradation of DCOI was assumed to follow the samereaction pattern as the aerobic degradation. The degradation rates were,however, assumed to be slower for the anaerobic degradation. The transformation of DCOI at aerobic and anaerobic test conditions isshown as a function of the time in Figure B1.2. Data from Table 3.2 ofthe main part of this report (aerobic conditions) and from Table 3.4 (an-aerobic conditions; concentrations set at 100%). It should be noted thatthe time axis depicting the anaerobic tests is 4.5 times longer than thetime axis of the aerobic tests. Figure B1.2 shows that there is thus a faircorrelation between the measured concentrations of the aerobic and an-aerobic tests, respectively. In the calculations, it was thus assumed that,under anaerobic conditions, the half-lives of the reactions are 4.5 timeslonger than under aerobic conditions.
Anaerobic degradation

89
Figure B1.1 Degradation of DCOI.
0102030405060708090
100
0 10 20 30 40 50 60 70 80 90
Aerobic, DCOIAerobic, polar substancesAerobic, non-polar substancesAerobic, CO2Aerobic, non-extractable substancesAnaerobic, DCOIAnaerobic, polar substancesAnaerobic, non-polar substancesAnaerobic, CO2Anaerobic, non-extractable substances
Test period of aerobic test (days)
% of 14C added
45 90 135 180 270225 315 360 405
Test period of anaerobic tests (days)
0
Figure B1.2 Degradation of DCOI under aerobic and anaerobic conditions.
DCOI
N-(n-octyl) malonamic acid
After 30 days approx. 15%
N-(n-octyl) β hydroxy
propionamide
After 30 days approx. 5%
N-(n-octyl) acetamide
After 30 days approx. 15%
CO2
Other
metabolites
CO2
After 30 days approx. 20%
Anaerobic

90
Table B1.4 gives selected properties of DCOI and its metabolites. DCOIand the three metabolites were not assumed to be present in ionized format pH = 7. Table B1.4 Properties of DCOI and its metabolites.
Substance Molar weight(g/mol)
Log KOW Log KOC
DCOI 282 2.8** 3.2 N-(n-octyl)malonamic acid 215 2.00* 1.75*
N-(n-octyl) β hydroxy propionamide 201 1.77* 1.789*
N-(n-octyl) acetamide 171 2.74* 2.756*
* Calculated by means of KowWin (Syracuse Research Corporation 1996). ** Measured (data stated in the main report). 2.4.2 Zinc pyrithione (ZPT) Figure B1.3 shows the simplified biological degradation paths of ZPTwhich were simulated in the exposure calculations. It is a very simplifiedmodel compared to the very complicated degradation pathways of ZPT. The following abbreviations are used:
• Zinc pyrithione ZPT• Pyrithione PT• Omadine disulfide OMDS• Omadine sulfonic acid OMSo• 2-Pyridine sulfonic acid PSoA
Other heterocyclic metabolites with one ring are given as NP1-NP5 (cf.Chapter 4 of the main report). The identity of NP1-NP5 is known to VKI. Two main degradation paths are assumed:
1) Primarily under aerobic conditions: ZPT → OMDS → NP1 → OMSo + other compounds
2) Primarily under anaerobic conditions: ZPT→ NP3 + OMDS → NP4 → PSoA + other compounds
It was assumed that OMDS, NP3, PSoA and OMSo were further trans-formed into other compounds, which, to a minor degree, are mineralized. The half-life of the primary reaction (ZPT → PT-→ OMDS + NP3) wasset at 0.5 days. The other half-lives were estimated on the basis of thequantities found in the aerobic and anaerobic degradation tests in whichthe concentrations of substance were measured as a function of the time(these tests are discussed in the main report). The estimated half-lives of the aerobic and anaerobic degradation aregiven in Tables B1.5 and B1.6. Measured and calculated concentrationsare depicted in Figure B1.4.
Properties of the substance
Biodegradation

91
Table B1.5 Model simulation of aerobic biodegradation of zinc pyrithione. Esti-mated half-lives (days) at 25°C.
Metabolites Parent compound ZPT OMDS NP4 PSoA NP1 OMSo Other
compounds CO2
ZPT - 0.5 - - - - - - NP3 - - - - - - 50 - OMDS - - 4.0 - 2.0 - 4.0 - NP4 - - - 15.0 - - - - PSoA - - - - - - 250 - NP1 - - - - - 15.0 - - OMSo - - - - - - 80 - Other compounds - - - - - - - 2,000 CO2 - - - - - - - -
Table B1.6 Model simulation of anaerobic biodegradation of zinc pyrithione. Esti-mated half-lives (days) at 25°C.
Metabolites Parent compound ZPT NP3 OMDS NP4 PSoA NP1 OMSo Other
compounds CO2
ZPT - 0.5 30 - - - - - - NP3 - - - 50 - - - 50 - OMDS - - - 4.0 - 2.0 - 4.0 - NP4 - - - - 15.0 - - - - PSoA - - - - - - - 5.0 - NP1 - - - - - - 15.0 - - OMSo - - - - - - - 80 - Other compounds - - - - - - - - 6,000 CO2 - - - - - - - - -
As mentioned above, the degradation of ZPT by photolysis is included inthe model simulations. ZPT is assumed to be transformed into NP3 in thephotolytical degradation. In daylight about noon, the photolytical half-life of ZPT was estimatedat:
• 1.78 min without cloud cover• 3.74 min with cloud cover The tests were made in September on the parallel approx. 42°N, wherethe degradation rate of ZPT in seawater was followed (Fenn 1999). Thetests were made in curved tubes. A first order rate constant kP can be es-
Photolysis
92
timated to be 0.18 min-1 (without cloud cover) and 0.08 min-1 (with cloudcover). A factor of 2.2 was used in order to correct for the curving of thetubes. At a cloudless sky, it is assumed that the measured photolytical rate con-stant may be described by (cf. Schwarzenbach et al. 1993):
0aP kk ⋅Φ=
where Φ is the so-called quantum yield, which is here assumed
to be independent of the wavelength [-]. Φ states theamount of molecules exited by the light that aretransformed into another compound.
0ak is the specific rate of light absorption [time-1]. This
rate was calculated by (Schwarzenbach et al. 1993):
λλε⋅λ⋅λ⋅= ∫λ
d)()(D)(W)10ln(k 0a
λ is wavelength [nm].
W(λ) is the light intensity at various wavelengths[milliEinstein/cm2/time/nm]. The light intensity in
theautumn on the parallel 40°N was borrowed from
Zeppand Cline (1977).
D(λ) is the ratio of the average length of the trajectory ofthe light to the depth of a water element, which can
beassumed to be completely mixed [-]. D(λ) is here as-sumed to be equal to 1 for all wavelengths.
ε(λ) is the so-called molar extinction coefficient[(mol/l- 1/cm]. For ZPT, these values are borrowedfrom Fenn (1999).
The light deflection of the cuvette has been taken into consideration.
Φ was thus determined to be 0.07.
Then the American program GCSOLAR (U.S. EPA 1999) was used forcalculating the photolytical half-life. This program uses the so-calledattenuation coefficients, α1, which are applied in order to calculate towhich degree the water absorbs the light as a function of the depth. The attenuation coefficient for the water at Kronprins Frederiks Bro isdetermined on the basis of measured Secchi disk transparencies at twostations in the vicinity of the bridge (Counties of Roskilde and Frederiks-borg 1997). In the summer, the shortest Secchi disk transparency is ap-prox. 2.5 m. By using data from Calkins (1977), the following correlationbetween the Secchi disk transparency and the attenuation coefficient αwas found at Secchi disk transparencies of less than 4 m: 1 If the light intensity at the surface is expressed as I0 and the light intensity in the
depth z as I, the correlation between I and I0 is described as log10(I/I0) = -α⋅z
93
α [m-1] = 3.05 - 0.57 ⋅ Secchi disk transparency [m].
The attenuation coefficient for the pleasure craft harbour of Jyllinge wasfound on the basis of literature data on coastal areas (Zafirioiu 1977).The values are here stated as a function of wavelength and with a mini-mum and a maximum value. The highest values are used in the presentcalculations. GCSOLAR does not take the effect of the cloud cover on the photolysisrate into account. The American program EXAMS (Burns et al. 1981),which can also be used for simulating the photolysis of substance, does,however, take the effect of the cloud cover on the photolysis rate intoaccount. By using EXAMS, it was estimated that, compared to the half-life at a blue sky, the half-life will be approx. 50% higher at a cloudcover of 60% which is the average cloud cover in Denmark from April toSeptember (Danish Statistical Office 1996). GCSOLAR can calculate the average photolytical half-life for each of theseasons: Spring, summer, autumn and winter and on various lattitudes(however, only lattitudes divisible by 10). The average photolytical half-life of ZPT for the seasons spring, summer and autumn and on the latti-tudes 50° and 60° was found to be 9.8 hours for the pleasure craft har-bour of Jyllinge (6.5 hours at blue sky) and 6.6 hours for the narrows atKronprins Frederiks Bro (4.4 hours at blue sky). The degradation by photolysis is slightly dependent on the temperature.A dependency of the photolytical degradation on temperature is, how-ever, not included in the present calculations. The photolytical half-life was determined for open waters where cloudcover and the falling light intensity down through the water column aretaken into consideration but where the boats in the harbour and theshadow effects of the pier are not taken into account. Therefore, twotypes of calculations have been made, one in which the degradation byphotolysis is taken into account and another in which the photolyticaldegradation is ignored. The actual conditions will probably be some-where between these two reflections but it is not possible right away toquantify the importance of the shadow effect of the boats and the pier onthe amount of light actually falling on the water surface. For the busynavigation route under the bridge (Kronprins Frederiks Bro), there willbe limited admittance of sunlight right under the bridge while there willbe no important shadow effects in the other part of the navigation route. The properties of zinc pyrithione and its metabolites are summarized inTable B1.7. The different heterocyclic metabolites with one ring have a low calcu-lated log KOW, which indicates a high water solubility. The sulfonic acidsare also expected to be very strong acids for which reason they areprobably fully ionized at the prevailing pH in the two waters. For thesetwo compounds, the sorption to sediment and suspended matter is thusexpected to be low. The calculated KOC values are, however, used forestimating the sorption to suspended matter and to the sediment.
Properties of the substance
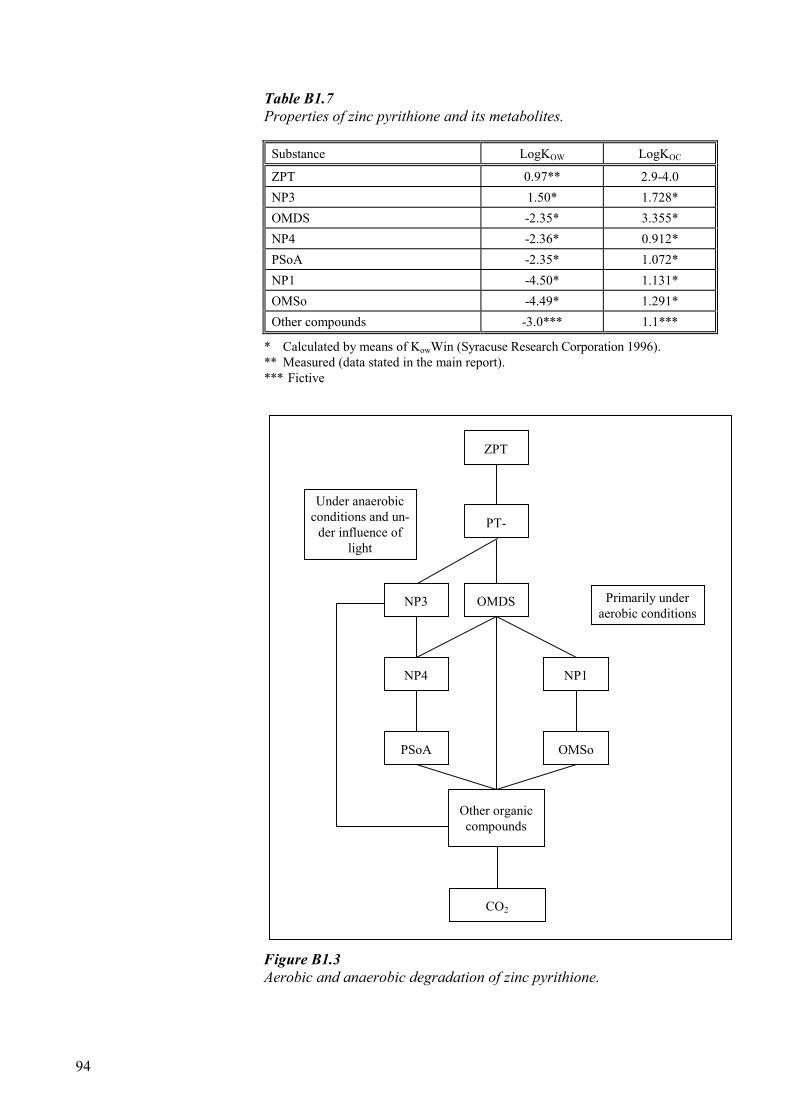
94
Table B1.7 Properties of zinc pyrithione and its metabolites.
Substance LogKOW LogKOC
ZPT 0.97** 2.9-4.0 NP3 1.50* 1.728* OMDS -2.35* 3.355* NP4 -2.36* 0.912* PSoA -2.35* 1.072* NP1 -4.50* 1.131* OMSo -4.49* 1.291* Other compounds -3.0*** 1.1***
* Calculated by means of KowWin (Syracuse Research Corporation 1996). ** Measured (data stated in the main report). *** Fictive Figure B1.3 Aerobic and anaerobic degradation of zinc pyrithione.
ZPT
PT-
NP3
Under anaerobicconditions and un-
der influence oflight
OMDS
Other organiccompounds
NP4
PSoA
NP1
OMSo
CO2
Primarily underaerobic conditions
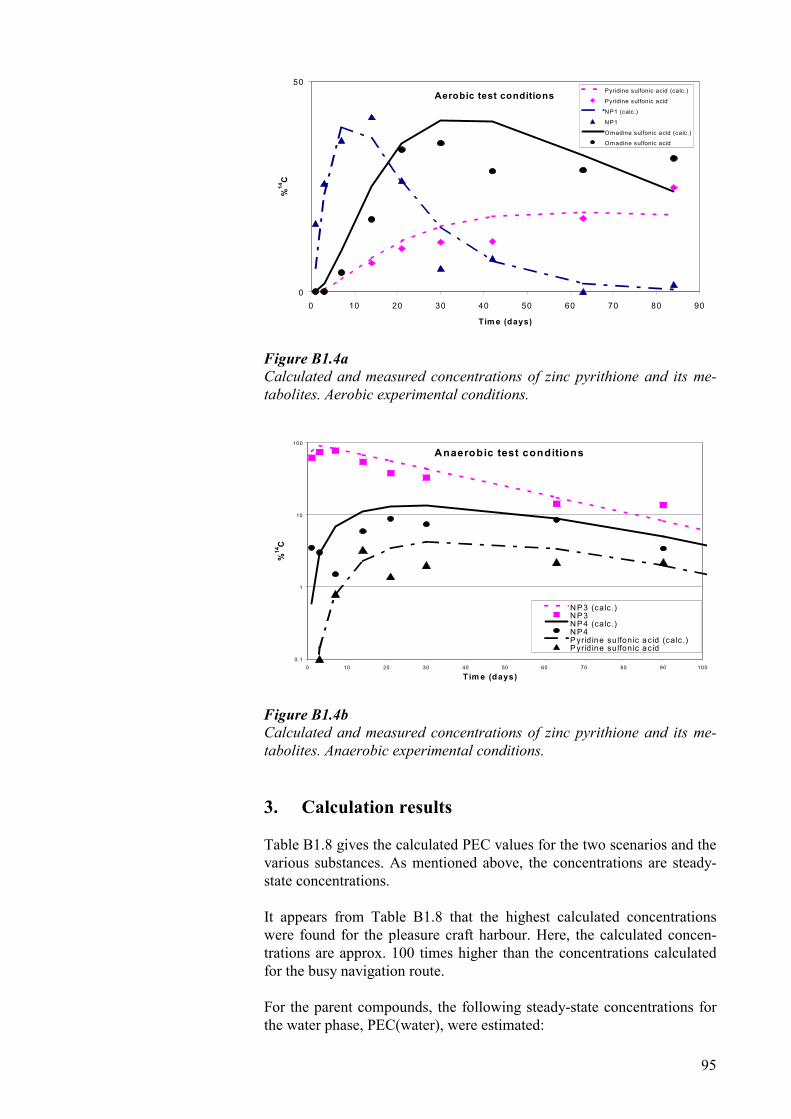
95
Aerobic test conditions
0
50
0 10 20 30 40 50 60 70 80 90
Tim e (days)
%14
C
Pyridine sulfonic acid (calc.)
Pyridine sulfonic acid
NP1 (calc.)
NP1
Omadine sulfonic acid (calc.)
Omadine sulfonic acid
Figure B1.4a Calculated and measured concentrations of zinc pyrithione and its me-tabolites. Aerobic experimental conditions.
Anaerobic test conditions
0.1
1
10
100
0 10 20 30 40 50 60 70 80 90 100
Tim e (days)
%14
C
NP3 (calc.)NP3NP4 (calc.)NP4Pyrid ine sulfonic acid (calc.)Pyrid ine sulfonic acid
Figure B1.4b Calculated and measured concentrations of zinc pyrithione and its me-tabolites. Anaerobic experimental conditions. 3. Calculation results Table B1.8 gives the calculated PEC values for the two scenarios and thevarious substances. As mentioned above, the concentrations are steady-state concentrations. It appears from Table B1.8 that the highest calculated concentrationswere found for the pleasure craft harbour. Here, the calculated concen-trations are approx. 100 times higher than the concentrations calculatedfor the busy navigation route. For the parent compounds, the following steady-state concentrations forthe water phase, PEC(water), were estimated:
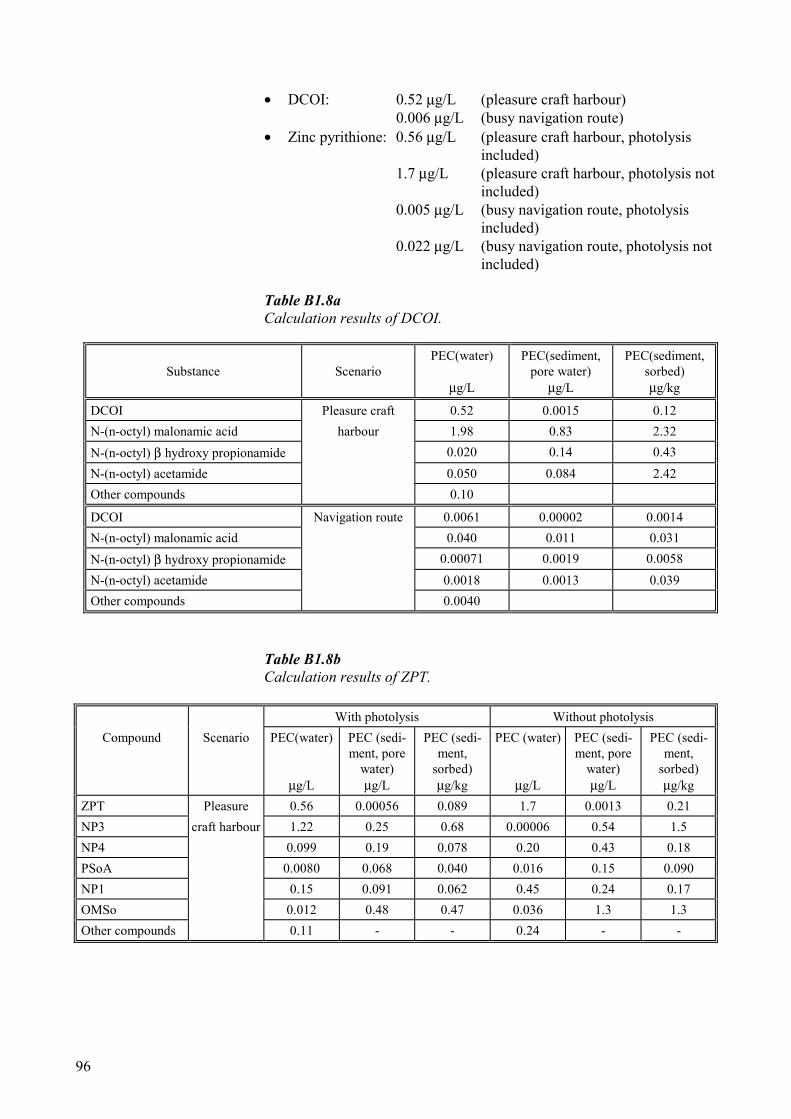
96
• DCOI: 0.52 µg/L (pleasure craft harbour)
0.006 µg/L (busy navigation route)• Zinc pyrithione: 0.56 µg/L (pleasure craft harbour, photolysis
included) 1.7 µg/L (pleasure craft harbour, photolysis not included) 0.005 µg/L (busy navigation route, photolysis included) 0.022 µg/L (busy navigation route, photolysis not included)
Table B1.8a Calculation results of DCOI.
Substance
Scenario
PEC(water)
µg/L
PEC(sediment,pore water)
µg/L
PEC(sediment,sorbed)µg/kg
DCOI Pleasure craft 0.52 0.0015 0.12 N-(n-octyl) malonamic acid harbour 1.98 0.83 2.32 N-(n-octyl) β hydroxy propionamide 0.020 0.14 0.43 N-(n-octyl) acetamide 0.050 0.084 2.42 Other compounds 0.10
DCOI Navigation route 0.0061 0.00002 0.0014 N-(n-octyl) malonamic acid 0.040 0.011 0.031 N-(n-octyl) β hydroxy propionamide 0.00071 0.0019 0.0058 N-(n-octyl) acetamide 0.0018 0.0013 0.039 Other compounds 0.0040
Table B1.8b Calculation results of ZPT.
With photolysis Without photolysis Compound Scenario PEC(water)
µg/L
PEC (sedi-ment, pore
water)µg/L
PEC (sedi-ment,
sorbed)µg/kg
PEC (water)
µg/L
PEC (sedi-ment, pore
water)µg/L
PEC (sedi-ment,
sorbed)µg/kg
ZPT Pleasure 0.56 0.00056 0.089 1.7 0.0013 0.21 NP3 craft harbour 1.22 0.25 0.68 0.00006 0.54 1.5 NP4 0.099 0.19 0.078 0.20 0.43 0.18 PSoA 0.0080 0.068 0.040 0.016 0.15 0.090 NP1 0.15 0.091 0.062 0.45 0.24 0.17 OMSo 0.012 0.48 0.47 0.036 1.3 1.3 Other compounds 0.11 - - 0.24 - -
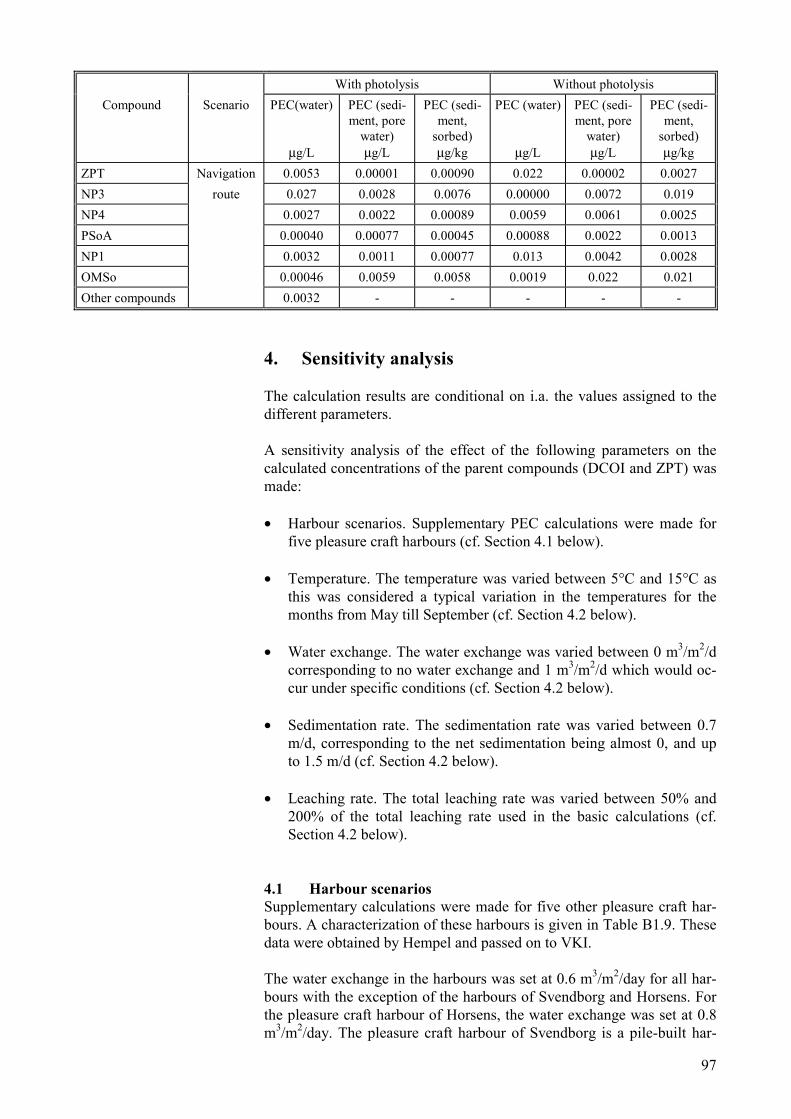
97
With photolysis Without photolysis Compound Scenario PEC(water)
µg/L
PEC (sedi-ment, pore
water)µg/L
PEC (sedi-ment,
sorbed)µg/kg
PEC (water)
µg/L
PEC (sedi-ment, pore
water)µg/L
PEC (sedi-ment,
sorbed)µg/kg
ZPT Navigation 0.0053 0.00001 0.00090 0.022 0.00002 0.0027 NP3 route 0.027 0.0028 0.0076 0.00000 0.0072 0.019 NP4 0.0027 0.0022 0.00089 0.0059 0.0061 0.0025 PSoA 0.00040 0.00077 0.00045 0.00088 0.0022 0.0013 NP1 0.0032 0.0011 0.00077 0.013 0.0042 0.0028 OMSo 0.00046 0.0059 0.0058 0.0019 0.022 0.021 Other compounds 0.0032 - - - - -
4. Sensitivity analysis The calculation results are conditional on i.a. the values assigned to thedifferent parameters. A sensitivity analysis of the effect of the following parameters on thecalculated concentrations of the parent compounds (DCOI and ZPT) wasmade: • Harbour scenarios. Supplementary PEC calculations were made for
five pleasure craft harbours (cf. Section 4.1 below). • Temperature. The temperature was varied between 5°C and 15°C as
this was considered a typical variation in the temperatures for themonths from May till September (cf. Section 4.2 below).
• Water exchange. The water exchange was varied between 0 m3/m2/d
corresponding to no water exchange and 1 m3/m2/d which would oc-cur under specific conditions (cf. Section 4.2 below).
• Sedimentation rate. The sedimentation rate was varied between 0.7
m/d, corresponding to the net sedimentation being almost 0, and upto 1.5 m/d (cf. Section 4.2 below).
• Leaching rate. The total leaching rate was varied between 50% and
200% of the total leaching rate used in the basic calculations (cf.Section 4.2 below).
4.1 Harbour scenariosSupplementary calculations were made for five other pleasure craft har-bours. A characterization of these harbours is given in Table B1.9. Thesedata were obtained by Hempel and passed on to VKI.
The water exchange in the harbours was set at 0.6 m3/m2/day for all har-bours with the exception of the harbours of Svendborg and Horsens. Forthe pleasure craft harbour of Horsens, the water exchange was set at 0.8m3/m2/day. The pleasure craft harbour of Svendborg is a pile-built har-

98
bour in Svendborg Sund. Therefore, the flow conditions are assumed tocorrespond to those of Svendborg Sund. An average flow rate of 0.5 m/swas assumed for the pleasure craft harbour of Svendborg correspondingto the amplitude of the drastic periodic velocity variation caused by thetides in Svendborg Sund (Harremoës and Malmgren-Hansen 1989).
Table B1.9Harbour scenario (prepared by Hempel).
HarbourWater
depth (m)Average
Flow rate justoutside the
harbour(m/s)*
Number ofboats in the
harbour
Boat size
(m2)
Area ofharbour
(m2)
Differenceof height
(m)
Differenceof height
max.(m)
Number ofdaily
changes
Mouth
(m)
Jyllinge 2.3 (map) low (0.2) 400 (DS) 18 (DS) 31,500 (map) 0.3-1.5 (DS) 1.5 3 (DS) 25 (map)
Grenå 3 (HO) high (1.5) 250 (HO) 18 (HO) 98,000 (HO) 0.3-1 (HO) 2.3 2 (HO) 40 (map)
Svendborg 2.5 (HO) high (2.0) 150 (HO) 18 (HO) 20,000 (HO) 0.3 - 0.5(HP)
2 4 (HO) 200***
Horsens 2.8 (HO) low (0.3) 650 (HO) 18 (HO) 61,000 (map) 0.6 (HO) 2.5 2 (HO) 100**
Rungsted 2.7 (map) medium (0.5) 776 (HO) 18 (HO) 160,000 (map) 0.3-1.2 (HO) 2 2 (HO) 40 (map)
EgåMarina
2.5 (HO) high (1.5) 750 (HO) 18 (HO) 112,500 (HO) 0.3-0.5 (HO) 2 2 (HO) 50 (HO)
Brackets indicate source of information.HO:Harbour officeDS: Danish Sailing AssociationHP: Harbour pilotFigures in brackets are estimates based on our and others knowledge of the harbourenvironments.Boat size in m2: 28-30 feet boat as the average (all harbours).**: 4 · 35 m from map 100 m used***:the harbour is open 200 m used
Note: Difference of height is used as a parameter in stead of tides. As the tidalvariation in Denmark is very small (10-40 cm), the primary water exchange ismade by wind and currents. Therefore, the difference in height is an overallassessment of the different parameters.
Information was obtained from (conversations with):Jyllinge: Steen Wintlev DS + map receivedGrenå: Benny AndersenSvendborg: Kurt HansenRungsted: Finn RosdahlHorsens: Hilmer ChristoffersenEgå Marina: Dan Nilsson (harbour master Børge Heilbach)
The calculated steady-state concentrations for these harbour scenarios aregiven in Table 1.10.

99
Table B1.10Calculated steady-state concentrations.
Harbour
Number of boatsper harbour volumein relation to num-
ber of boats perharbour volume in
PEC(water)(ZPT)
(µg/L)
PEC(water)(DCOI)
the pleasure craftharbour of Jyllinge
Withphotolysis
Withoutphotolysis
(µg/L)
Jyllinge 1.0 0.56 1.70 0.52
Grenå 0.2 0.11 0.28 0.08
Horsens 0.7 0.49 1.14 0.35
Rungsted 0.3 0.02 0.08 0.02
Egå Marina 0.5 0.29 0.81 0.25
Svendborg 0.5 <0.01 <0.01 <0.01
Table B1.10 indicates that the pleasure craft harbour of Jyllinge results inthe highest calculated concentrations. The main reason for this is thatthere are relatively more boats in the pleasure craft harbour of Jyllingecompared to the volume of water needed in order to dilute the leachedchemical (Table B1.10). The scenario used is thus a conservative sce-nario as assumed at the selection of the pleasure craft harbour of Jyllinge.
4.2 Sensitivity analysis of other parametersTables B1.11a and B1.11b show the relation between the calculated con-centration of the parent compound in the water phase after changing theparameter and the calculated concentration of the standard scenario.
Tables B1.11a and B1.11b indicate that, within the variation assigned tothe individual parameters, it is the total leaching rate that causes the larg-est variations in the calculated concentrations. The sedimentation rateonly slightly influences the calculated concentrations of the parent com-pounds.
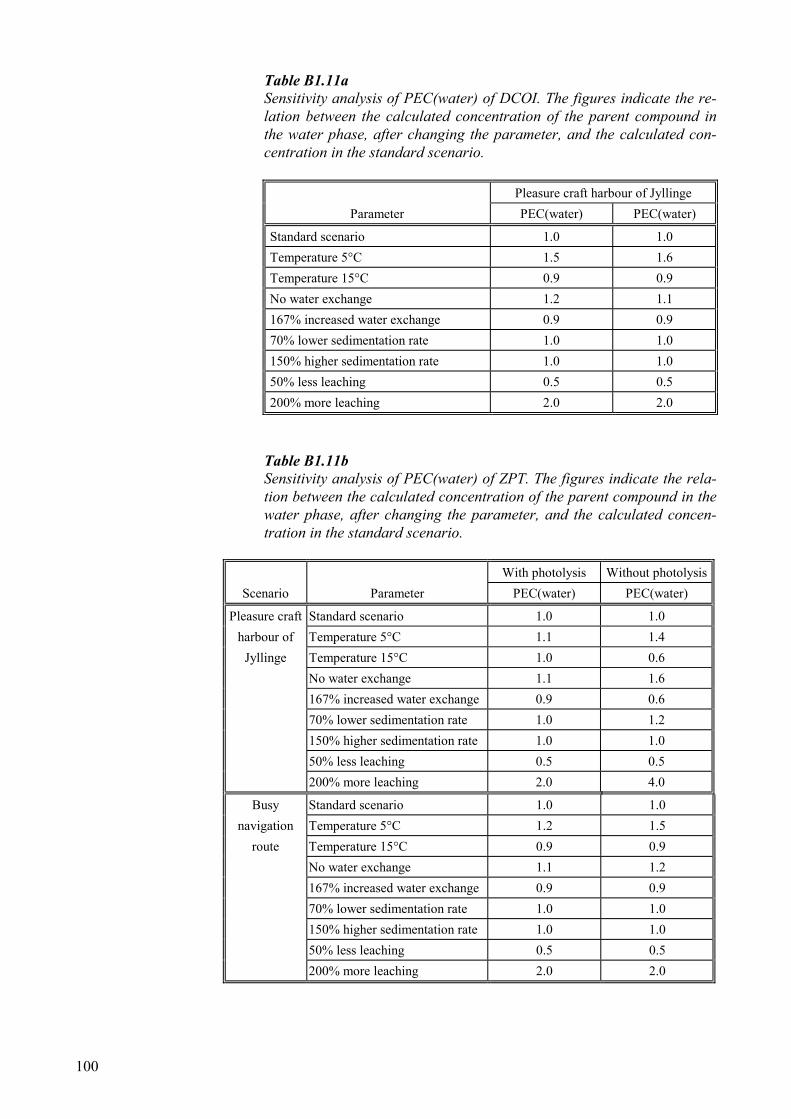
100
Table B1.11aSensitivity analysis of PEC(water) of DCOI. The figures indicate the re-lation between the calculated concentration of the parent compound inthe water phase, after changing the parameter, and the calculated con-centration in the standard scenario.
Pleasure craft harbour of JyllingeParameter PEC(water) PEC(water)
Standard scenario 1.0 1.0Temperature 5°C 1.5 1.6Temperature 15°C 0.9 0.9No water exchange 1.2 1.1167% increased water exchange 0.9 0.970% lower sedimentation rate 1.0 1.0150% higher sedimentation rate 1.0 1.050% less leaching 0.5 0.5200% more leaching 2.0 2.0
Table B1.11bSensitivity analysis of PEC(water) of ZPT. The figures indicate the rela-tion between the calculated concentration of the parent compound in thewater phase, after changing the parameter, and the calculated concen-tration in the standard scenario.
With photolysis Without photolysisScenario Parameter PEC(water) PEC(water)
Pleasure craft Standard scenario 1.0 1.0harbour of Temperature 5°C 1.1 1.4
Jyllinge Temperature 15°C 1.0 0.6No water exchange 1.1 1.6167% increased water exchange 0.9 0.670% lower sedimentation rate 1.0 1.2150% higher sedimentation rate 1.0 1.050% less leaching 0.5 0.5200% more leaching 2.0 4.0
Busy Standard scenario 1.0 1.0navigation Temperature 5°C 1.2 1.5
route Temperature 15°C 0.9 0.9No water exchange 1.1 1.2167% increased water exchange 0.9 0.970% lower sedimentation rate 1.0 1.0150% higher sedimentation rate 1.0 1.050% less leaching 0.5 0.5200% more leaching 2.0 2.0

101
Appendix 2: Examination of the minera-lization of DCOI and zinc pyrithione inmarine sediments
1. Introduction
The mineralization of 4,5-dichloro-2-n-octyl-4-isothiazolin-3-on (DCOI)and zinc pyrithione was examined in laboratory tests with marine coastalsediments. The tests were performed under aerobic and anaerobic condi-tions using test concentrations of ng/g, which is assumed to result in en-vironmentally realistic transformation kinetics. In the anaerobic experi-ments, sulfate-reducing conditions were established by adding sulfate.Marine coastal sediments contain considerable amounts of sulfate (Sø-rensen et al. 1979). Glucose was included in the tests in order to examinethe mineralization of a readily biodegradable substance at low concen-trations and under the given test conditions.
2. Materials and methods
Sediment samples and their seawater were collected at two localities inthe Sound. The two sets of sediment and water samples can be describedas follows:
Clayey sediment (LS)• Location: The Sound, 55°50'642N - 12°40'854E; depth (sediment),
22 m; depth (water), 20 m.• Texture: coarse sand (0.25-2 mm), 0.9%; fine sand (0.063-0.25 mm),
26.4%; silt and clay (<0.063 mm), 65.8%; organic matter, 6.9%.• Number of bacteria (water): 3.1 ⋅ 103 per mL.• Number of bacteria (sediment): 1.5 ⋅ 105 per g.
Sandy sediment (SS)• Location: The Sound, 55°50'030N - 12°37'534E; depth (sediment),
4 m; depth (water), 2 m.• Texture: coarse sand, 91.5%; fine sand, 7.3%; silt and clay, 1.0%; or-
ganic matter, 0.2%.• Number of bacteria (water): 2.1 ⋅ 103 per mL.• Number of bacteria (sediment): 4.8 ⋅ 104 per g.
The number of bacteria in seawater and sediment was determined as thebacterial count by embedding a known amount of the sample in BactoMarine Agar 2216 (Difco). Sediment (approx. 1.6 g) is mixed with 9 mLfosfate buffer and is then treated as a water sample. The bacterial count isdetermined as the number of colonies occurring after 72 hours’ incubati-on at 21°C. Sediment and water samples were stored separately stored inthe dark at 4°C until use.
Sediment and seawater
102
[2,3-14C]DCOI (Lot Nos. 853.0208 and 853.0209; 15.9 mCi/mmol, 56.44µCi/mg, radio-chemical purity 98.6%) was supplied by Rohm and HaasResearch Laboratories (Spring House, Pennsylvania). [14C]zinc pyrithio-ne (Lot. No. 3228-143; 157.63 mCi/mmol, 0.50 mCi/mg) and [UL-14C]D-glucose (Lot 48H9476 Sigma; 212.5 mCi/mmol, 1.18 mCi/mg, dissolvedin ethanol:water, 9:1) was supplied by Arch Chemicals (Cheshire, Con-necticut). All other chemicals are commercially available and of analyti-cal purity.
The aerobic biodegradation tests were made with sediment LS as well assediment SS. Stock solutions of [14C]DCOI (in methanol), [14C]zinc py-rithione (in dimethyl sulfoxid) and [14C]glucose (in deionized water) we-re added to 300-mL glass flasks with 10 g sediment (wet weight) and 50mL seawater which had beforehand been aerated with atmospheric air forapprox. 20 hours. For [14C]DCOI, the stock solution was added to the testflasks with 0,5 g dried sediment and the methanol was allowed to evapo-rate before more sediment and water were added. The other substanceswere added by mixing the stock solution with the sediment, after whichseawater was added. The resulting concentrations of the three modelcompounds are indicated in Table B2.1. Two glass pipes were placed inthe test flasks, one pipe with 1N KOH (3 mL) for absorption of 14CO2and another with ethylene glycol for trapping other gaseous compounds.The flasks were closed with rubber stoppers and aluminium screw capsand placed in the dark at 15°C.
The mineralization of the substances was followed by determining the14C activity which was trapped in the glass pipes. Each week, sampleswere taken for liquid scintillation counting and the test flasks were pla-ced in the dark without stoppers and caps for approx. 10 min in order toexchange the gas phase of the flasks with atmospheric air. Then the con-tents of the glass pipes were replaced with fresh KOH or ethylene glycol.At the end of the test after 42 days, CO2 in the water phase was releasedafter acidification of the sediment-water system to pH 1-2 by addition ofconcentrated sulfuric acid.
The anaerobic biodegradation tests were only made with sediment LS. Inthe same way as in the aerobic tests, the stock solutions of the three mo-del compounds were added to 117-mL serum flasks with 30 g of sedi-ment (wet weight) and 30 mL seawater. The resulting concentrations ofthe three model compounds are indicated in Table B2.1. Before use, theseawater was pre-treated with an addition of a fosfate buffer (27 mgKH2PO4 and 112 mg Na2HPO4 ⋅ 12H2O per litre) in order to stabilize pHand a redox indicator (1.0 mg resazurin per litre) in order to control thatanaerobic conditions were present throughout the test. Sulfide (0.5 gNa2S ⋅ 9H2O/ kg) was added to each serum flask as reducing agent whilesulfate (Na2SO4; 25 mM in the water phase) was added as electron ac-ceptor in order to establish sulfate-reducing conditions, which are cha-racteristic of marine sediments. A glass pipe with 1N KOH (3 mL) wasplaced in the serum flasks for absorption of 14CO2. Throughout all of theabove procedure, the serum flasks were carefully aerated with oxygen-free N2 gas until they were closed with 1-cm butyl rubber stoppers andaluminium screw caps. The test flasks were placed in the dark at 15°C
Chemicals
Aerobic biodegradationtests
Anaerobic biodegradationtests

103
The mineralization of the substances was followed by determining the14C activity (from 14CO2) which was trapped in the glass pipe with KOH.Sampling of KOH for liquid scintillation counting was made after 14, 28and 56 days after which the liquid in the glass pipe was replaced withfresh KOH. As part of the carbon at the mineralization of the modelcompounds may be transformed into methane, 14CH4 was determined byinjecting 2-mL gas samples into scintillation vials which were modifiedso that the caps could hold a septum (Zehnder et al. 1979). Before use, ahole was made in the screw cap of each scintillation vial and a butyl rub-ber septum inserted. 20 mL of a liquid scintillation cocktail (Insta gel IIplus, Packard) was added to the scintillation vials. It turned out that thecocktail was capable of absorbing approx. 2/3 of the methane added inpilot tests. At the end of the test after 56 days, CO2 in the water phasewas released after acidification of the sediment-water system to pH 1-2by addition of concentrated sulfuric acid.
Table B2.1Aerobic and anaerobic mineralization. Initial concentrations of modelcompounds.
Model compound Test type Initial concentration(µg/g)
[14C]DCOI Aerobic conditionsSediment LS
0.83
[14C]DCOI Aerobic conditionsSediment SS 0.033
[14C]DCOI Anaerobic conditionsSediment LS
0.83
[14C]Zinc pyrithione Aerobic conditionsSediment LS
0.037
[14C]Zinc pyrithione Aerobic conditions Sedi-ment SS
0.037
[14C]Zinc pyrithione Anaerobic conditionsSediment LS
0.037
[14C]Glucose Aerobic conditionsSediment LS
0.025
[14C]Glucose Aerobic conditionsSediment SS
0.025
[14C]Glucose Anaerobic conditionsSediment LS
0.025
After the termination of the aerobic and anaerobic tests, the 14C remai-ning in water sediment was determined by the following procedures. Inthe test, in which [14C]DCOI had been added at a concentration of 0.033µg/g, and in the tests with [14C]glucose, the remaining radioactivity wasdetermined after liquid scintillation counting of sub-sample of the waterphase and incineration of 0.1-g sediment samples in excess of oxygen. Inthe other tests, the 14C remaining in the sediment was determined by ex-traction with 6N HCl followed by 1N NaOH, after which the extractedsediment was incinerated in excess of oxygen (Madsen and Kristensen1997). This method makes it possible to determine fractions of 14C,
Recovery ofremaining 14C

104
which are bound in the form of hydrolyzable compounds, humic and ful-vic acids or to humin/ clay minerals.
DCOI and metabolites from the transformation of DCOI were analy-zed and characterized by Rohm and Haas (Andrew Jacobson, Rohmand Haas Research Laboratories, Spring House, Pennsylvania). Watersamples were treated with solid phase extraction (SPE) by use of ace-tate:methanol (1:1) before analysis in HPLC. Sediment samples wereextracted twice with acetonitril: 0.01 N HCl (4:1) followed by extrac-tion with dichloromethane for analysis in HPLC.
Zinc pyrithione and its metabolites were determined by Arch Chemi-cals (James C. Ritter, Department of Ecotoxicology, Cheshire, Con-necticut). Sediment samples were extracted with acetonitril followedby two extractions with 1,0 N KOH. Then the water samples and theextracts from sediment were derived before analysis in HPLC (ArchChemicals 1999b).
3. Results
The cumulated development of 14CO2 from the mineralization of DCOIand zinc pyrithione is shown in the Figures 3.1-3.3 (Section 3.2 of themain report) and Figures 4.1-4.3 (Section 4.3 of the main report). Thetotal mineralization and distribution of the radioactivity remaining at theend of the tests are shown in Tables B2.2-B2.4. The amount of 14C inabsorbers with ethylene glycol (aerobic tests) constituted <0.1% of theradioactivity added.
Table B2.2Mineralization of DCOI in sediment and seawater under aerobic oranaerobic conditions. Distribution and recovery of 14C after an incubati-on of 42 days (aerobic test) or 56 days (anaerobic test).
Retrieved 14C activity (% of added 14C ± SD)
Sediment/test type
CO2 Water phase Sediment,hydrolyzablecompoundsB
Sediment,fulvic acidC
Sediment,humic acidC
Sediment,humic and
clay mineralsD
Totalretrieval
SS, aerobic 24.3 ± 0.58 19.1 ± 1.9 - - - - 70.0E
LS, aerobic 12.9 ± 0.52 2.0 ± 0.35 1.4 ± 0.35 14.0 ± 0.92 23.8 ± 0.92 24.2 ± 2.4 78.3
LS, anaerobic 14.5 ± 0.19 A 0.9 ± 0.12 1.0 ± 0.10 5.0 ± 0.16 14.7 ± 0.46 30.3 ± 1.4 66.4A, hereof 0.06% as 14CH4; B, extraction with HCl; C, extraction with NaOH; D, incine-ration of extracted sediment; E, incineration of non-extracted sediment; SD, standarddeviations between four replicates; not determined.
Chemical analyses

105
Table B2.3Mineralization of zinc pyrithione in sediment and seawater under aero-bic or anaerobic conditions. Distribution and recovery of 14C after anincubation of 42 days (aerobic test) or 56 days (anaerobic test).
Retrieved 14C activity (% of added 14C ± SD)
Sediment/test type
CO2 Water phase Sediment,hydrolyzablecompoundsB
Sediment,fulvic acidC
Sediment,humic acidC
Sediment,humic and
clay mineralsD
Totalretrieval
SS, aerobic 5.0 ± 1.2 65.2 ± 1.4 8.3 ± 0.22 13.2 ± 0.52 2.6 ± 0.17 1.0 ± 0.13 95.3
LS, aerobic 2.8 ± 0.06 31.5 ± 0.66 5.3 ± 0.10 32.7 ± 1.0 9.4 ± 0.16 7.0 ± 0.39 88.7
LS, anaerobic 3.7 ± 0.59 A 18.8 ± 4.0 2.6 ± 0.15 13.7 ± 1.6 5.3 ± 0.88 33.4 ± 1.9 77.5A, hereof 0.11% as 14CH4; B, extraction with HCl; C, extraction with NaOH; D, incine-ration of extracted sediment; SD, standard deviations between four replicates.
Table B2.4Mineralization of D glucose in sediment and seawater under aerobic oranaerobic conditions. Recovery of 14C after incubation of 42 days (aero-bic test) or 56 days (anaerobic test)
Sediment/test type
CO2 Water phase SedimentB Total retrieval
SS, aerobic 59.6 ± 2.0 6.0 ± 0.75 12.5 ± 0.89 78.1
LS, aerobic 52.3 ± 0.76 4.6 ± 0.48 25.5 ± 0.39 82.4
LS, anaerobic 58.5 ± 1.9A 3.1 ± 0.38 17.3 ± 0.10 78.9A, hereof <0.01% as 14CH4; B, incineration of non-extracted sediment; SD, standarddeviations between four replicates.

106
Appendix 3: Examination of the effect ofdegradation and sorption on the aquatictoxicity of DCOI and zinc pyrithione
1. Introduction
The effect of degradation and sorption on the toxicity of 4,5-dichloro-2-n-octyl-4-isothiazolin-3-on (DCOI) and zinc pyrithione was examined inlaboratory tests with the marine crustacean Acartia tonsa. As especiallyzinc pyrithione is degradable by photolysis, the tests were made in thedark as well as at a constant exposure to light.
2. Materials and methods
This test was made with the sandy sediment (SS) and its seawater as de-scribed in Appendix 2.
DCOI (Lot No. 14-SS-18F; purity, 99.86%) was supplied by Rohm andHaas Research Laboratories (Spring House, Pennsylvania). Zinc pyri-thione (Lot. No. J116659; purity, 98.9%) was supplied by Arch Chemi-cals (Cheshire, Connecticut).
DCOI and zinc pyrithione were added from stock solutions with metha-nol (50 µL) and dimethyl sulfoxid (50 µL), respectively, to 55-mL serumflasks with 0.5 g dried sediment. The methanol from the stock solution ofDCOI was allowed to evaporate. Seven grammes of sediment (dryweight) was then added together with 35 mL of the respective seawater,which, before addition, had been adjusted to a salinity of 3.2%. The ini-tial concentrations were 0.1 µg/g for DCOI and 0.025 µg/g for zinc pyri-thione. As the gas phase of the test system, pure oxygen was added, afterwhich the serum flasks were closed by Teflon-coated rubber septa andaluminium caps. One series of serum flasks were incubated in the darkwhile a parallel series of flasks were incubated at constant exposure tolight. Both series of test flasks were incubated at a temperature of 20 ±2°C. The light-exposed serum flasks were incubated bottom up and witha distance of 5 cm to fluorescent tubes (Pope FID 18W/33; a total of 14tubes), which had been mounted with spaces of approx. 1.8 cm in be-tween. The average light intensity at the distance of 5 cm from the lightsource was measured at 458 ± 32 µmol/m2 ⋅ s in air, which was extrapo-lated to 342 µmol/m2 ⋅ s in water. Measurements performed by VKI inthe Sound have shown that the average light intensity in a depth of ap-prox. 1 m (0.6-1.4 m) was 548 µmol/m2 ⋅ s in 1997 and 420 µmol/m2 ⋅ sin 1998 (the measurements in 1997 as well as in 1998 were made in theperiod from 9 May till 30 September by daylight).
Three replicate serum flasks from bioassays were harvested after 0; 1; 2;4; 7 and 14 days. Before sampling, the flasks were shaken after whichthey were placed in the dark in order for the sediment to settle. The waterphase from each replicate was carefully transferred to centrifugal vials
Sediment and seawater
Chemicals
Bioassays

107
and, after centrifuging (1,500 rpm for 15 min), the supernatant was storedin a deep-freeze until use in the test with A. tonsa.
The acute toxicity to A. tonsa was tested by use of the ISO/FDIS 14669procedure with the modification that the test was made in the dark in or-der to prevent transformation by photolysis of zinc pyrithione. Controlsin this test included:
• Supernatant (t = 0 d) from test system without biocide• Supernatant (t = 0 d) from test system without biocide with addition
of 50 µL methanol as in the test• Supernatant (t = 0 d) from test system without biocide with addition
of 50 µL dimethyl sulfoxid as in the test• Supernatant (t = 14 d) from test system without biocide incubated in
the dark as in the test• Supernatant (t = 14 d) from test system without biocide exposed to
light as in the test• Seawater from the Sound (sediment SS; cf. Appendix 2) adjusted to a
salinity of 3.2%• Seawater from the Kattegat adjusted to a salinity of 3.2%
Further information on the toxicity test with A. tonsa is given in the re-port "Ecotoxicological tests of leachates of antifouling paints"(Bjørnestad et al. 1999).
The effect of dosing with biocides on the number of bacteria in the testsystem was determined as the bacterial count (cf. Appendix 2). Thenumber of bacteria in an untreated control sample was 9.1 ⋅105 per mLafter 1 day’s incubation while the corresponding numbers were 1.5 ⋅ 105
and 1.4 ⋅ 105 per mL in samples with dosages of DCOI and zinc pyri-thione, respectively.
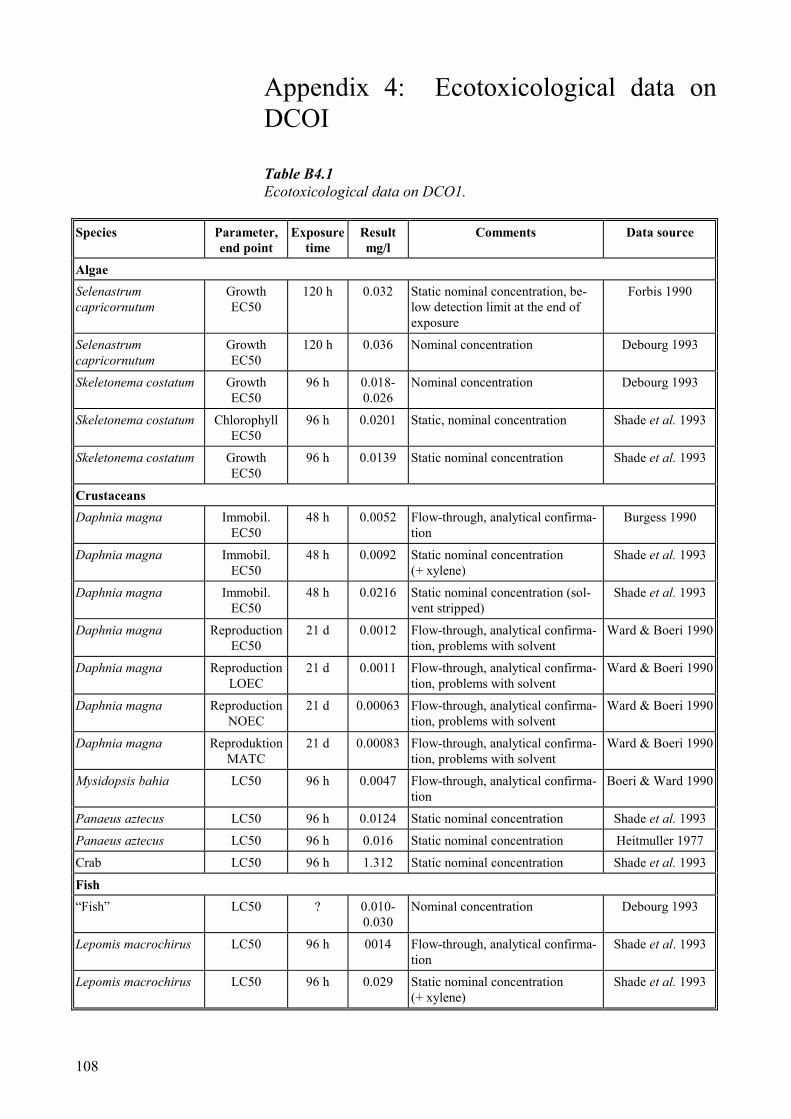
108
Appendix 4: Ecotoxicological data onDCOI
Table B4.1Ecotoxicological data on DCO1.
Species Parameter,end point
Exposuretime
Resultmg/l
Comments Data source
AlgaeSelenastrumcapricornutum
GrowthEC50
120 h 0.032 Static nominal concentration, be-low detection limit at the end ofexposure
Forbis 1990
Selenastrumcapricornutum
GrowthEC50
120 h 0.036 Nominal concentration Debourg 1993
Skeletonema costatum GrowthEC50
96 h 0.018-0.026
Nominal concentration Debourg 1993
Skeletonema costatum ChlorophyllEC50
96 h 0.0201 Static, nominal concentration Shade et al. 1993
Skeletonema costatum GrowthEC50
96 h 0.0139 Static nominal concentration Shade et al. 1993
CrustaceansDaphnia magna Immobil.
EC5048 h 0.0052 Flow-through, analytical confirma-
tionBurgess 1990
Daphnia magna Immobil.EC50
48 h 0.0092 Static nominal concentration(+ xylene)
Shade et al. 1993
Daphnia magna Immobil.EC50
48 h 0.0216 Static nominal concentration (sol-vent stripped)
Shade et al. 1993
Daphnia magna ReproductionEC50
21 d 0.0012 Flow-through, analytical confirma-tion, problems with solvent
Ward & Boeri 1990
Daphnia magna ReproductionLOEC
21 d 0.0011 Flow-through, analytical confirma-tion, problems with solvent
Ward & Boeri 1990
Daphnia magna ReproductionNOEC
21 d 0.00063 Flow-through, analytical confirma-tion, problems with solvent
Ward & Boeri 1990
Daphnia magna ReproduktionMATC
21 d 0.00083 Flow-through, analytical confirma-tion, problems with solvent
Ward & Boeri 1990
Mysidopsis bahia LC50 96 h 0.0047 Flow-through, analytical confirma-tion
Boeri & Ward 1990
Panaeus aztecus LC50 96 h 0.0124 Static nominal concentration Shade et al. 1993
Panaeus aztecus LC50 96 h 0.016 Static nominal concentration Heitmuller 1977
Crab LC50 96 h 1.312 Static nominal concentration Shade et al. 1993
Fish“Fish” LC50 ? 0.010-
0.030Nominal concentration Debourg 1993
Lepomis macrochirus LC50 96 h 0014 Flow-through, analytical confirma-tion
Shade et al. 1993
Lepomis macrochirus LC50 96 h 0.029 Static nominal concentration(+ xylene)
Shade et al. 1993
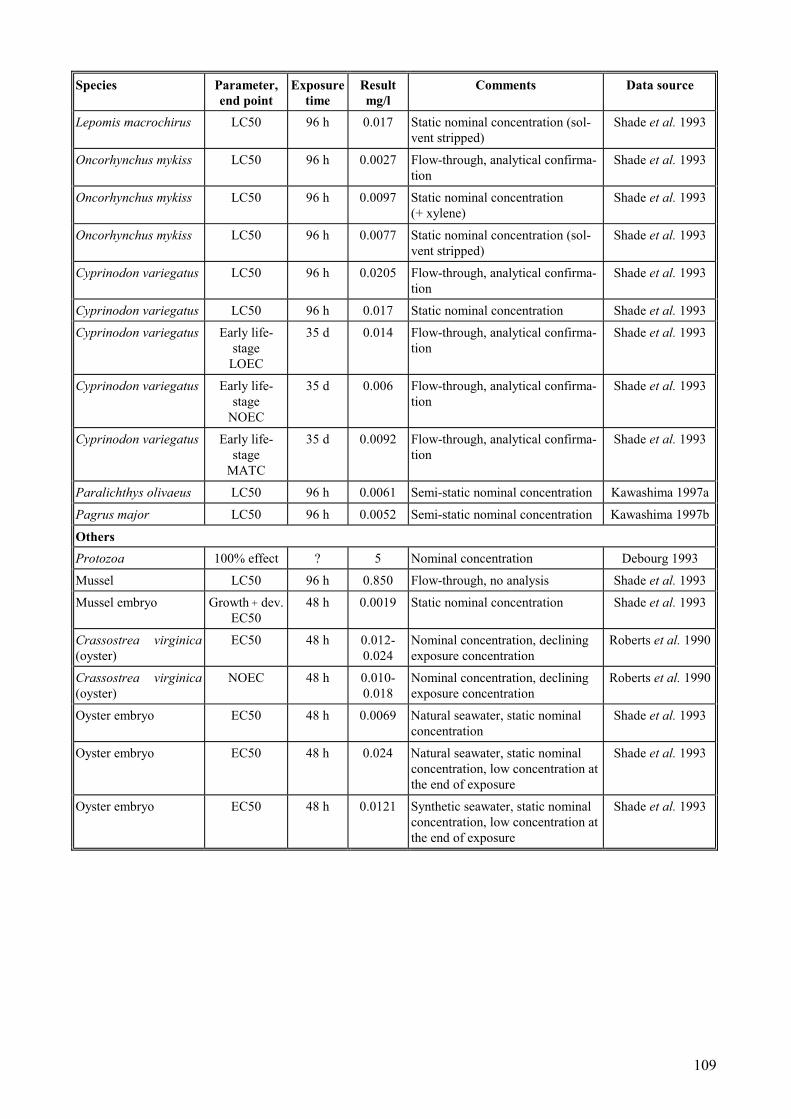
109
Species Parameter,end point
Exposuretime
Resultmg/l
Comments Data source
Lepomis macrochirus LC50 96 h 0.017 Static nominal concentration (sol-vent stripped)
Shade et al. 1993
Oncorhynchus mykiss LC50 96 h 0.0027 Flow-through, analytical confirma-tion
Shade et al. 1993
Oncorhynchus mykiss LC50 96 h 0.0097 Static nominal concentration(+ xylene)
Shade et al. 1993
Oncorhynchus mykiss LC50 96 h 0.0077 Static nominal concentration (sol-vent stripped)
Shade et al. 1993
Cyprinodon variegatus LC50 96 h 0.0205 Flow-through, analytical confirma-tion
Shade et al. 1993
Cyprinodon variegatus LC50 96 h 0.017 Static nominal concentration Shade et al. 1993
Cyprinodon variegatus Early life-stage
LOEC
35 d 0.014 Flow-through, analytical confirma-tion
Shade et al. 1993
Cyprinodon variegatus Early life-stage
NOEC
35 d 0.006 Flow-through, analytical confirma-tion
Shade et al. 1993
Cyprinodon variegatus Early life-stage
MATC
35 d 0.0092 Flow-through, analytical confirma-tion
Shade et al. 1993
Paralichthys olivaeus LC50 96 h 0.0061 Semi-static nominal concentration Kawashima 1997a
Pagrus major LC50 96 h 0.0052 Semi-static nominal concentration Kawashima 1997b
OthersProtozoa 100% effect ? 5 Nominal concentration Debourg 1993
Mussel LC50 96 h 0.850 Flow-through, no analysis Shade et al. 1993
Mussel embryo Growth + dev.EC50
48 h 0.0019 Static nominal concentration Shade et al. 1993
Crassostrea virginica(oyster)
EC50 48 h 0.012-0.024
Nominal concentration, decliningexposure concentration
Roberts et al. 1990
Crassostrea virginica(oyster)
NOEC 48 h 0.010-0.018
Nominal concentration, decliningexposure concentration
Roberts et al. 1990
Oyster embryo EC50 48 h 0.0069 Natural seawater, static nominalconcentration
Shade et al. 1993
Oyster embryo EC50 48 h 0.024 Natural seawater, static nominalconcentration, low concentration atthe end of exposure
Shade et al. 1993
Oyster embryo EC50 48 h 0.0121 Synthetic seawater, static nominalconcentration, low concentration atthe end of exposure
Shade et al. 1993
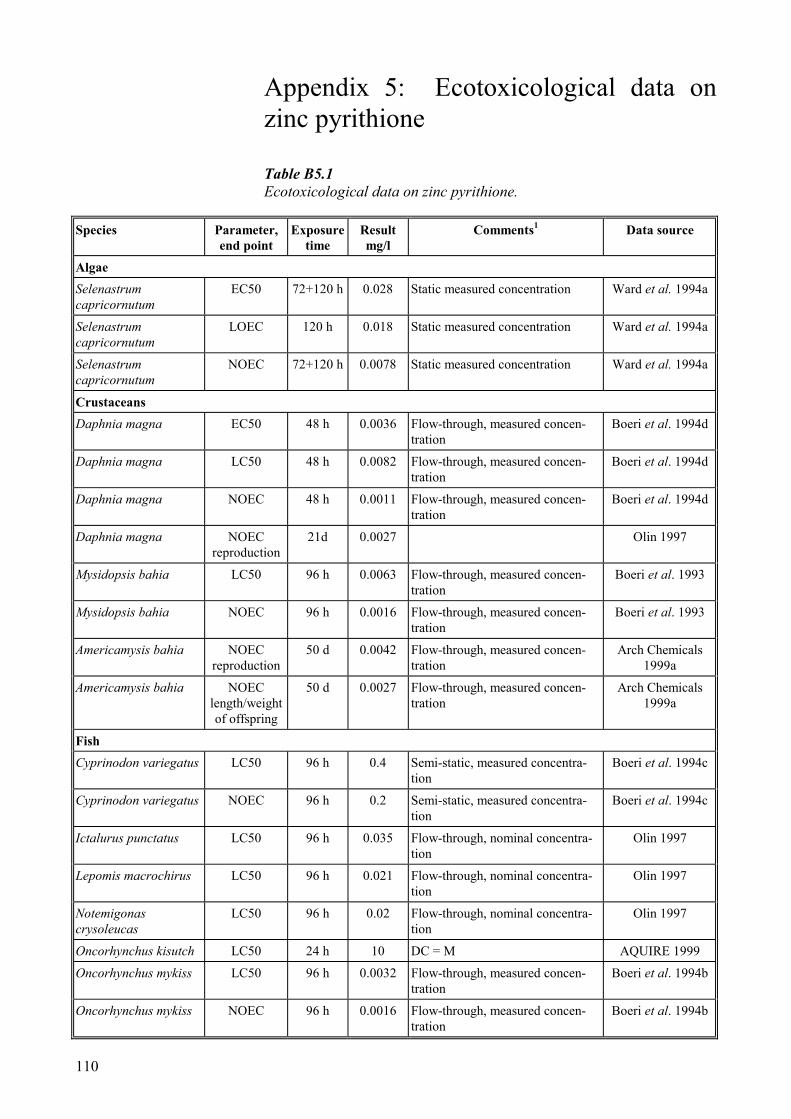
110
Appendix 5: Ecotoxicological data onzinc pyrithione
Table B5.1Ecotoxicological data on zinc pyrithione.
Species Parameter,end point
Exposuretime
Resultmg/l
Comments1 Data source
AlgaeSelenastrumcapricornutum
EC50 72+120 h 0.028 Static measured concentration Ward et al. 1994a
Selenastrumcapricornutum
LOEC 120 h 0.018 Static measured concentration Ward et al. 1994a
Selenastrumcapricornutum
NOEC 72+120 h 0.0078 Static measured concentration Ward et al. 1994a
CrustaceansDaphnia magna EC50 48 h 0.0036 Flow-through, measured concen-
trationBoeri et al. 1994d
Daphnia magna LC50 48 h 0.0082 Flow-through, measured concen-tration
Boeri et al. 1994d
Daphnia magna NOEC 48 h 0.0011 Flow-through, measured concen-tration
Boeri et al. 1994d
Daphnia magna NOECreproduction
21d 0.0027 Olin 1997
Mysidopsis bahia LC50 96 h 0.0063 Flow-through, measured concen-tration
Boeri et al. 1993
Mysidopsis bahia NOEC 96 h 0.0016 Flow-through, measured concen-tration
Boeri et al. 1993
Americamysis bahia NOECreproduction
50 d 0.0042 Flow-through, measured concen-tration
Arch Chemicals1999a
Americamysis bahia NOEClength/weightof offspring
50 d 0.0027 Flow-through, measured concen-tration
Arch Chemicals1999a
FishCyprinodon variegatus LC50 96 h 0.4 Semi-static, measured concentra-
tionBoeri et al. 1994c
Cyprinodon variegatus NOEC 96 h 0.2 Semi-static, measured concentra-tion
Boeri et al. 1994c
Ictalurus punctatus LC50 96 h 0.035 Flow-through, nominal concentra-tion
Olin 1997
Lepomis macrochirus LC50 96 h 0.021 Flow-through, nominal concentra-tion
Olin 1997
Notemigonascrysoleucas
LC50 96 h 0.02 Flow-through, nominal concentra-tion
Olin 1997
Oncorhynchus kisutch LC50 24 h 10 DC = M AQUIRE 1999
Oncorhynchus mykiss LC50 96 h 0.0032 Flow-through, measured concen-tration
Boeri et al. 1994b
Oncorhynchus mykiss NOEC 96 h 0.0016 Flow-through, measured concen-tration
Boeri et al. 1994b

111
Species Parameter,end point
Exposuretime
Resultmg/l
Comments1 Data source
Oncorhynchustshawytscha
LC50 24 h 10 DC = M AQUIRE 1999
Pimephales promelas LC50 96 h 0.0026 Flow-through, measured concen-tration
Boeri et al. 1994a
Pimephales promelas NOEC 96 h 0.0011 Flow-through, measured concen-tration
Boeri et al. 1994a
Pimephales promelas LC50 96 h 0.04 Flow-through, nominal concentra-tion
Olin 1997
Pimephales promelas NOECearly life-
stage
32 d 0.00122 Flow through, measured concen-tration
Boeri et al. 1999
Ptychicheilusoregonensis
LC50 24 h 10 DC = M AQUIRE 1999
Salmo gairdneri LC50 96 h 0.0032 Flow-through, measured concen-tration
Olin 1997
Salmo gairdneri NOEC 96 h 0.0016 Flow-through, measured concen-tration
Olin 1997
Salvelinus fontinalis LC50 96 h 0.008 Flow-through, nominal concentra-tion
Olin 1997
OthersCrassostrea virginica(oyster)
LC50 96 h 0.022 Measured concentration Boeri et al. 1994e
Crassostrea virginica(oyster)
NOEC(shell deposit)
96 h 0.010 Measured concentration Boeri et al. 1994e
1: DQR = Data Quality Rating. In AQUIRE, the studies are evaluated according tothe completeness of the descriptions, with a so-called Documentation Code (DC): I =incomplete, M = moderate, C = complete.
Filnavn: helepubl.docBibliotek: G:\Ecotoxicological assessment of antifouling biocides and nonbiocidal
antifouling paints.zipSkabelon: C:\MSOFFICE\WINWORD\SKABELON\a4.dotTitel: 1 IntroductionEmne:Forfatter: VKINøgleord:Kommentarer:Oprettelsesdato: 08-06-00 12:08Versionsnummer: 3Senest gemt: 08-06-00 12:10Senest gemt af: Medarbejder 2Redigeringstid: 3 minutterSenest udskrevet: 09-06-00 08:38Ved seneste fulde udskrift
Sider: 111Ord: 32.542 (ca.)Tegn: 185.495 (ca.)