Embed Size (px)
Citation preview
Ecosystem Accoun-ng for the
Laguna de Bay Basin
Jocelyn G. Sta. Ana Focal Person – LLDA WAVES
SEARCA, Los Banos, Laguna
February 26, 2015
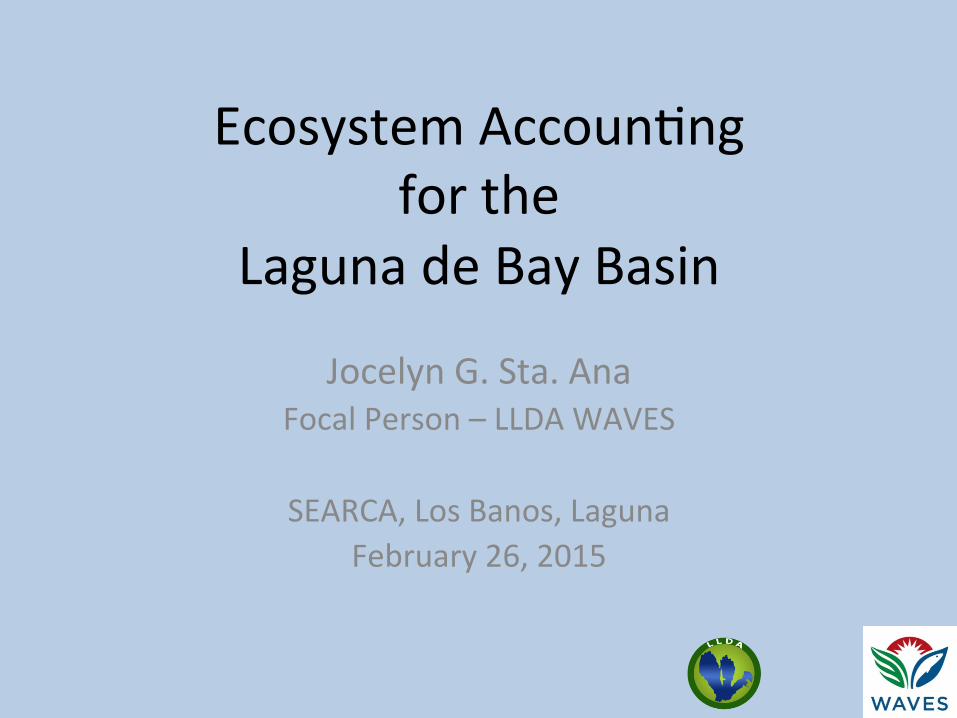
LAGUNA LAKE DEVELOPMENT AUTHORITY
LLDA
RA 4850 (1966)). . .to promote and accelerate the development and balanced growth….with due regard for environmental management….)
EO 349 (1996) Adoption and implementation of Laguna de Bay Master Plan PD 813
(1975) Expanded the Mandate of LLDA to address environmental protection including the power to issue permit for the use of surface waters
EO 927 (1983) Classified LLDA as Class A Corporation Authorized to modify its organization Granted water rights over Laguna de Bay and other water bodies within the region Granted power to control and abate pollution within the region Authorized to collect fees for the use of lake water
EO 149 (1993) placed under DENR for administrative supervision and policy coordination
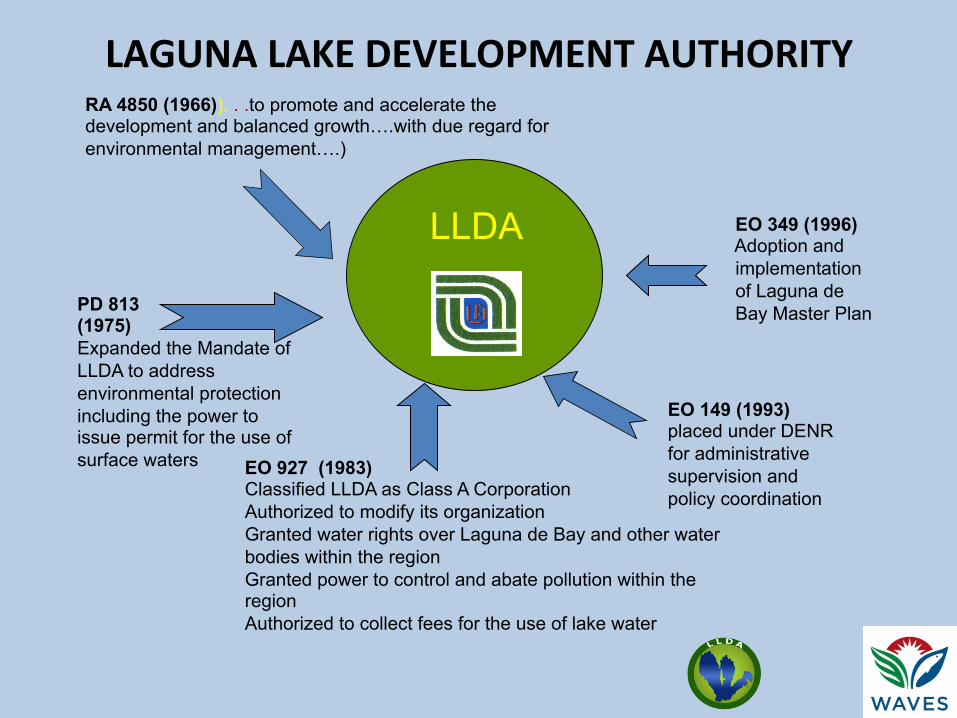
• total surface area = some 900 km2
• average volume = 2,250,000,000 m3
• shoreline length = some 220 kilometers
• watershed area = approx. 3,820 km2
• catchment total human popula-on = about 15 million
• divided into 24 hydrological sub-‐basins with some 100 streams that drain into the lake
• three dis-nct bays: West Bay, Central Bay and East Bay
• average depth of the lake is 2.5 m
• Pasig River is the only outlet of the lake
Salient Features of Laguna de Bay
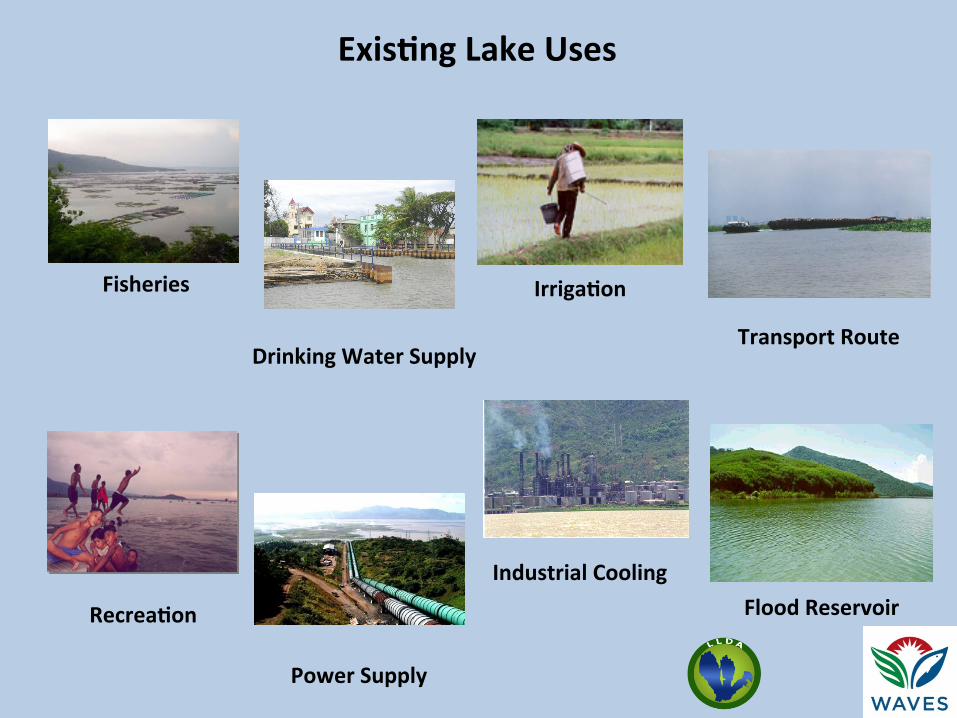
ExisEng Lake Uses
Fisheries
Drinking Water Supply Transport Route
IrrigaEon
RecreaEon
Power Supply
Industrial Cooling Flood Reservoir
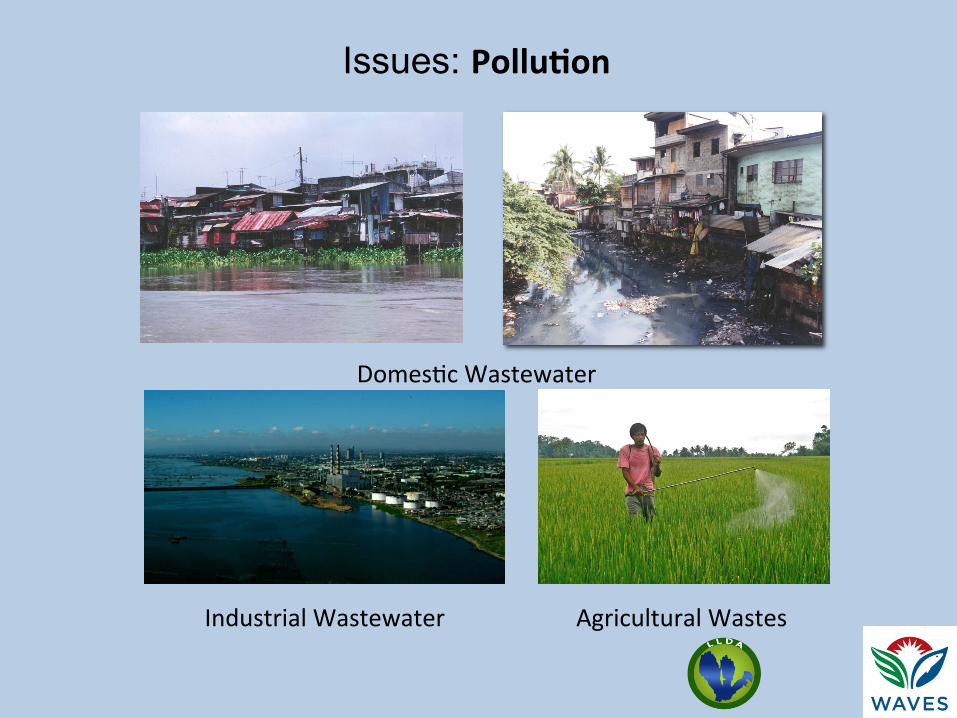
Issues: PolluEon
Domes-c Wastewater
Industrial Wastewater Agricultural Wastes
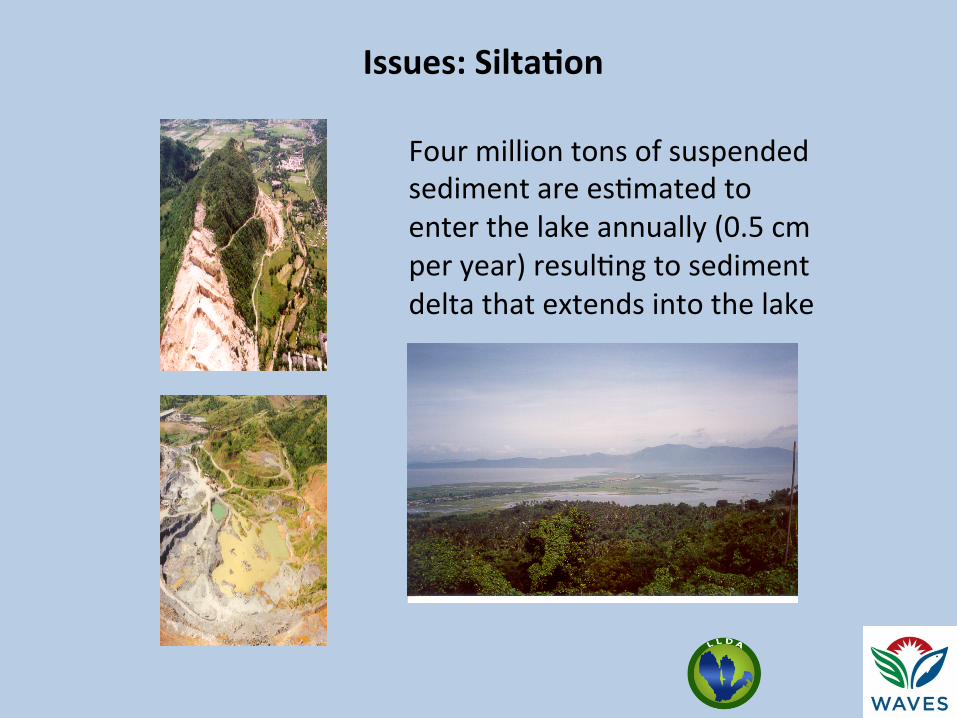
Issues: SiltaEon
Four million tons of suspended sediment are es-mated to enter the lake annually (0.5 cm per year) resul-ng to sediment delta that extends into the lake
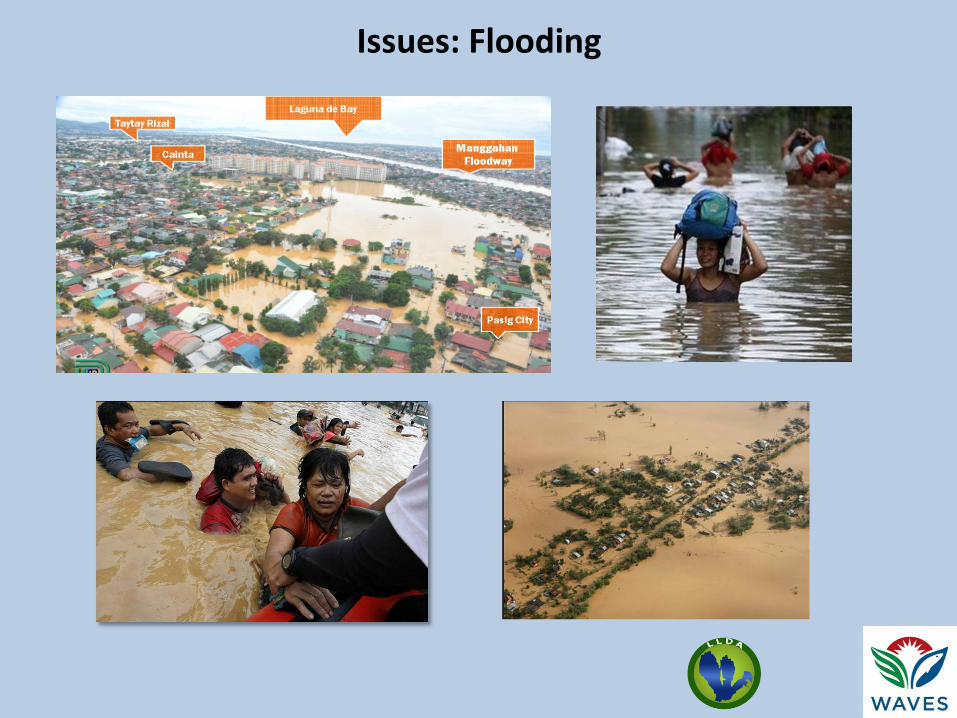
Issues: Flooding
Policy Issues idenEfied in the Stakeholders consultaEon
• Priority uses for the lake • Fishery resource management, valua-on of the contribu-on of Laguna de Bay to total fish produc-on in the country
• Priority areas for protec-on where law enforcement could be more extensive – pollu-on, sediment loading
• Water pricing • Land development planning – integrate green development, urban design
Ini-al Steps
• Crea-on of Technical Working Group -‐ water, land and fishery accounts
• Data availability and gap assessment • Use DPSI table ( drivers, pressures, state, impacts)
• Develop a framework
Challenges on Data Collec-on
• Different data formats – tables, graphs, maps • Different survey methodologies • Different -me periods • Fee for certain data • Takes some -me to gather data • Hesita-on to release data on produc-on costs (apprehension that the user fees will increase)

Solu-ons
• Training on Data Processing • Training on GIS Mapping and Processing • Conduct Focus Group Discussions and Mee-ngs with concerned agencies
• Memorandum of Understanding /Agreement with partner agencies
• Communica-ons Plan/ Report to the stakeholders
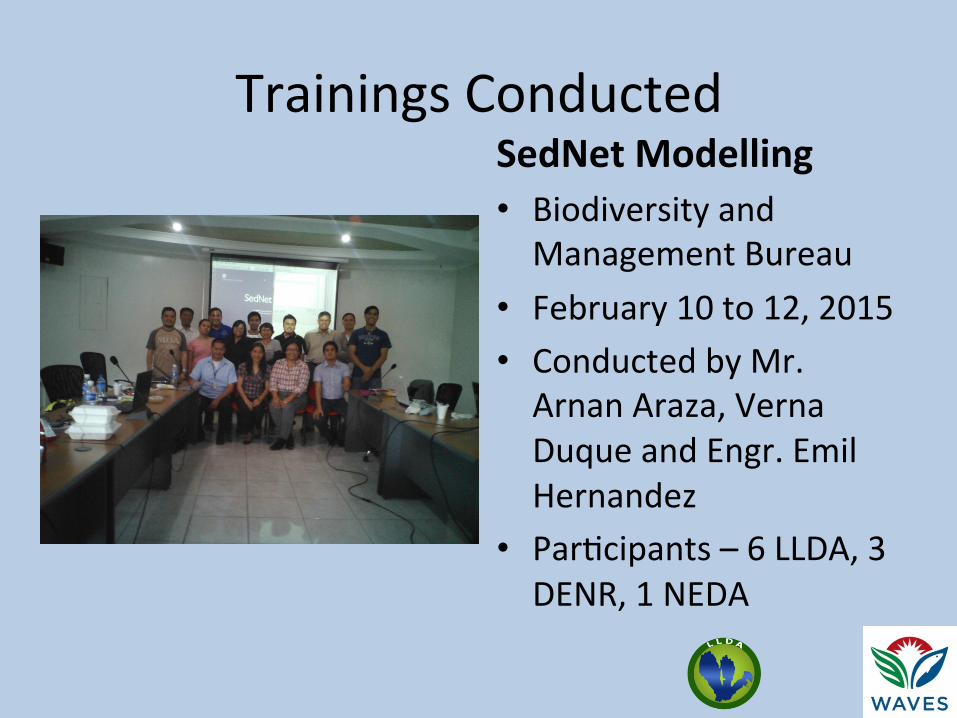
Trainings Conducted SedNet Modelling • Biodiversity and Management Bureau
• February 10 to 12, 2015 • Conducted by Mr. Arnan Araza, Verna Duque and Engr. Emil Hernandez
• Par-cipants – 6 LLDA, 3 DENR, 1 NEDA
Results • Currently: finalising results first phase (1 year) • Results include:
– Analysis of land use change 2003-‐2010 by municipality and by sub-‐basin
– Analysis of discharges and water quality – Upland services: erosion control – Lake services: fisheries (capture + aquaculture), water supply and flood reten-on
• Focus has been on physical services, monetary analysis planned in coming months
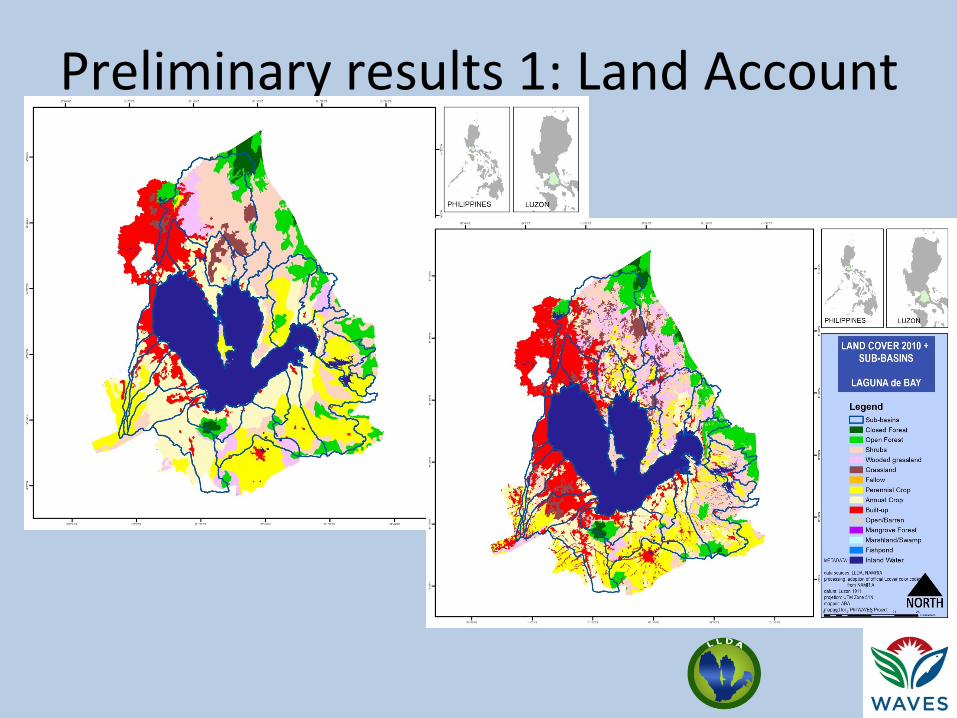
Preliminary results 1: Land Account
Figure 8. Land Cover by Watershed, 2003
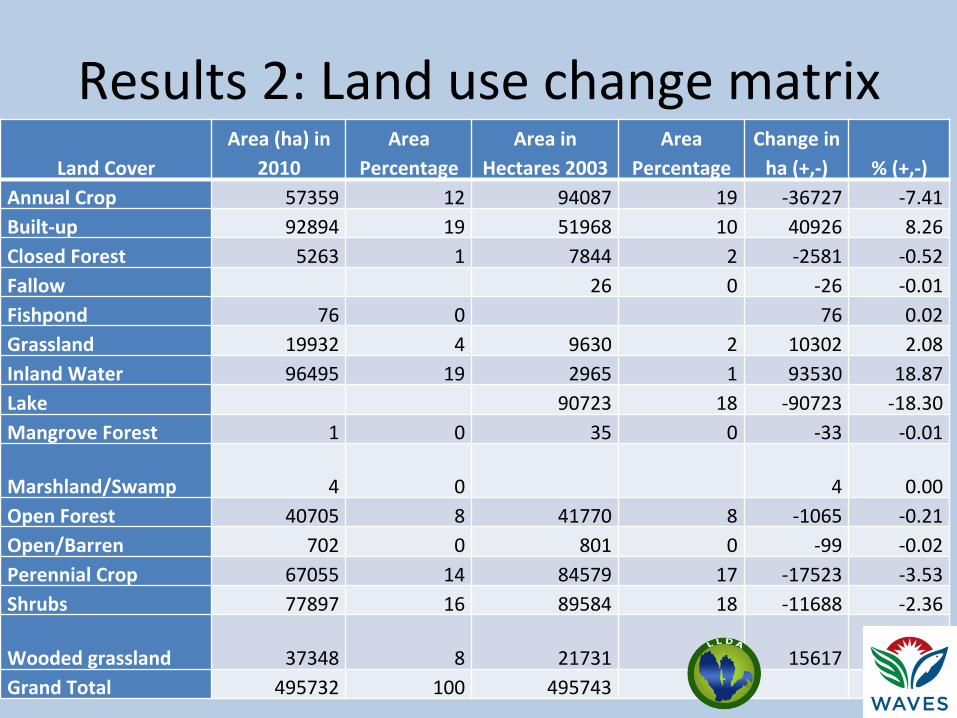
Results 2: Land use change matrix Land Cover
Area (ha) in 2010
Area Percentage
Area in Hectares 2003
Area Percentage
Change in ha (+,-‐) % (+,-‐)
Annual Crop 57359 12 94087 19 -‐36727 -‐7.41 Built-‐up 92894 19 51968 10 40926 8.26 Closed Forest 5263 1 7844 2 -‐2581 -‐0.52 Fallow 26 0 -‐26 -‐0.01 Fishpond 76 0 76 0.02 Grassland 19932 4 9630 2 10302 2.08 Inland Water 96495 19 2965 1 93530 18.87 Lake 90723 18 -‐90723 -‐18.30 Mangrove Forest 1 0 35 0 -‐33 -‐0.01
Marshland/Swamp 4 0 4 0.00 Open Forest 40705 8 41770 8 -‐1065 -‐0.21 Open/Barren 702 0 801 0 -‐99 -‐0.02 Perennial Crop 67055 14 84579 17 -‐17523 -‐3.53 Shrubs 77897 16 89584 18 -‐11688 -‐2.36
Wooded grassland 37348 8 21731 4 15617 3.15 Grand Total 495732 100 495743 100 0.00
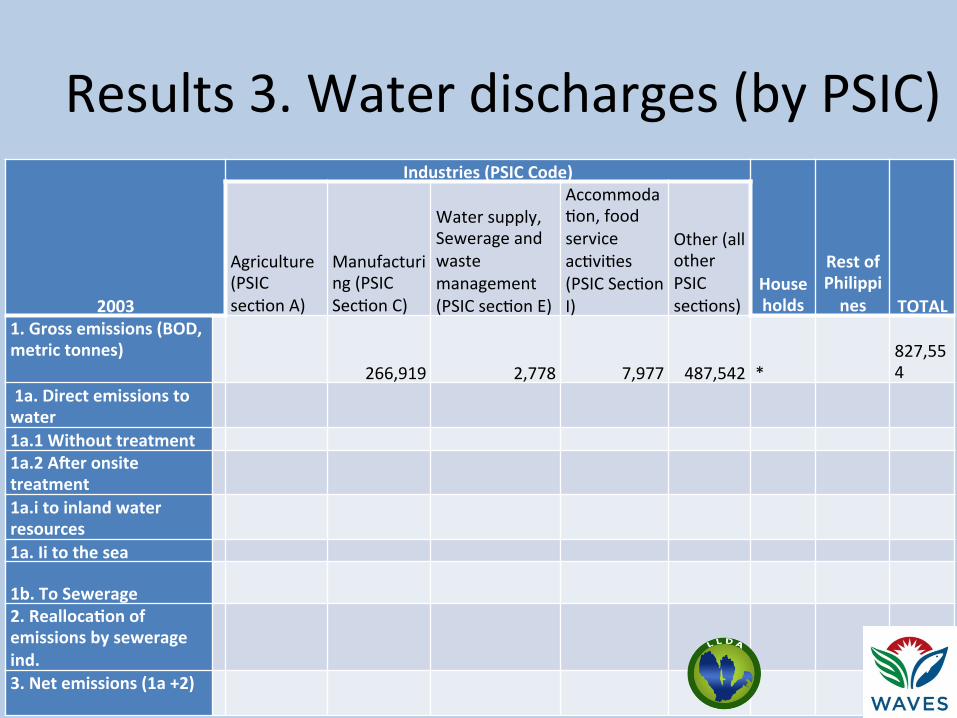
Results 3. Water discharges (by PSIC)
2003
Industries (PSIC Code)
Households
Rest of Philippines TOTAL
Agriculture (PSIC sec-on A)
Manufacturing (PSIC Sec-on C)
Water supply, Sewerage and waste management (PSIC sec-on E)
Accommoda-on, food service ac-vi-es (PSIC Sec-on I)
Other (all other PSIC sec-ons)
1. Gross emissions (BOD, metric tonnes) 266,919 2,778 7,977 487,542 *
827,554
1a. Direct emissions to water 1a.1 Without treatment 1a.2 A_er onsite treatment 1a.i to inland water resources 1a. Ii to the sea
1b. To Sewerage 2. ReallocaEon of emissions by sewerage ind. 3. Net emissions (1a +2)
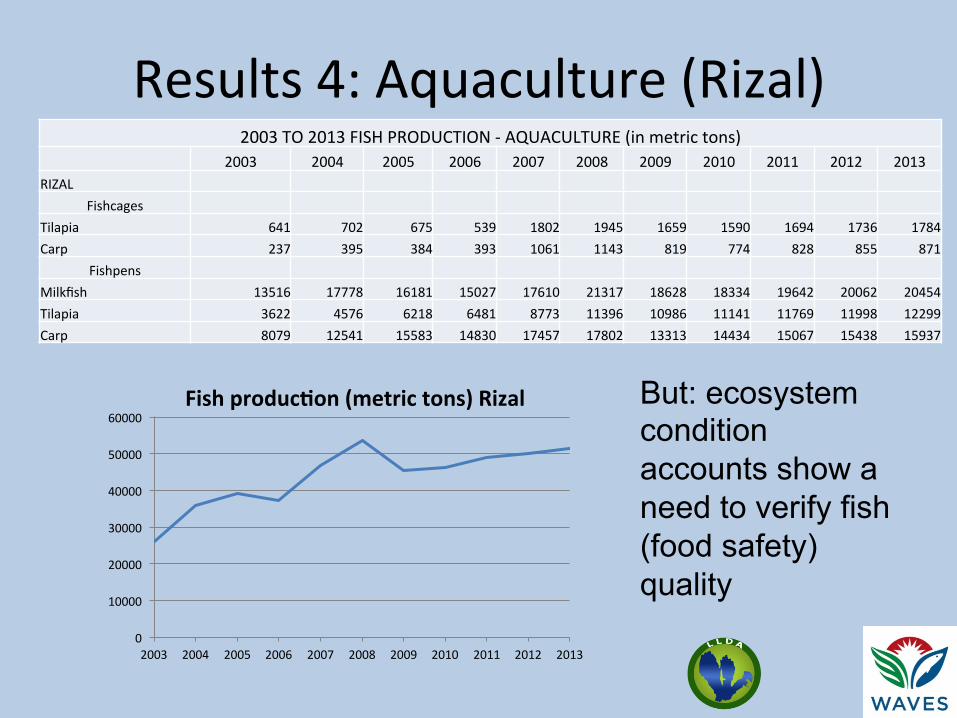
Results 4: Aquaculture (Rizal) 2003 TO 2013 FISH PRODUCTION -‐ AQUACULTURE (in metric tons)
2003 2004 2005 2006 2007 2008 2009 2010 2011 2012 2013 RIZAL
Fishcages Tilapia 641 702 675 539 1802 1945 1659 1590 1694 1736 1784 Carp 237 395 384 393 1061 1143 819 774 828 855 871
Fishpens Milkfish 13516 17778 16181 15027 17610 21317 18628 18334 19642 20062 20454 Tilapia 3622 4576 6218 6481 8773 11396 10986 11141 11769 11998 12299 Carp 8079 12541 15583 14830 17457 17802 13313 14434 15067 15438 15937
0
10000
20000
30000
40000
50000
60000
2003 2004 2005 2006 2007 2008 2009 2010 2011 2012 2013
Fish producEon (metric tons) Rizal But: ecosystem condition accounts show a need to verify fish (food safety) quality
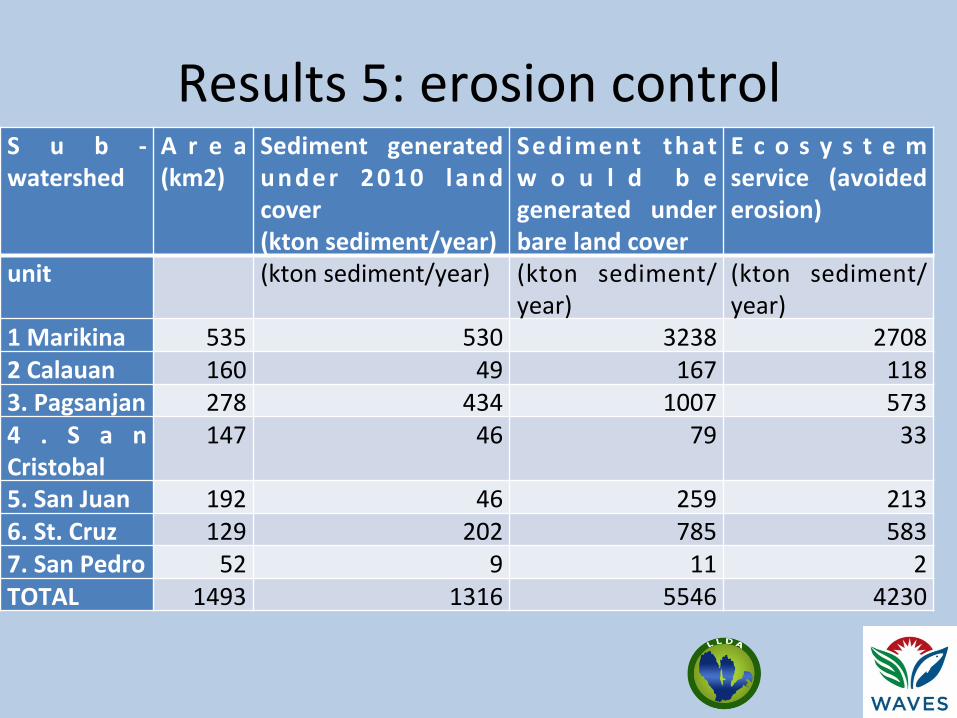
Results 5: erosion control S u b -‐watershed
A r e a (km2)
Sediment generated under 2010 land cover (kton sediment/year)
Sediment that w o u l d b e generated under bare land cover
E c o s y s t e m service (avoided erosion)
unit (kton sediment/year) (kton sediment/year)
(kton sediment/year)
1 Marikina 535 530 3238 2708 2 Calauan 160 49 167 118 3. Pagsanjan 278 434 1007 573 4 . S a n Cristobal
147 46 79 33
5. San Juan 192 46 259 213 6. St. Cruz 129 202 785 583 7. San Pedro 52 9 11 2 TOTAL 1493 1316 5546 4230
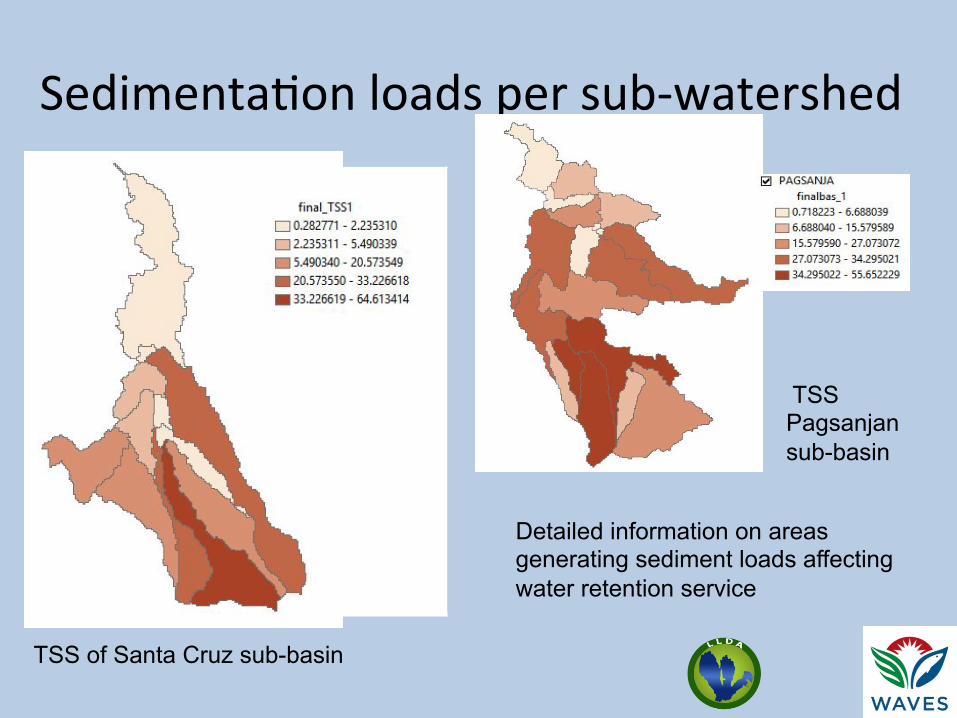
Sedimenta-on loads per sub-‐watershed Figure 7 TSS of Santa Cruz sub-‐basin
TSS Pagsanjan sub-basin
TSS of Santa Cruz sub-basin
Detailed information on areas generating sediment loads affecting water retention service
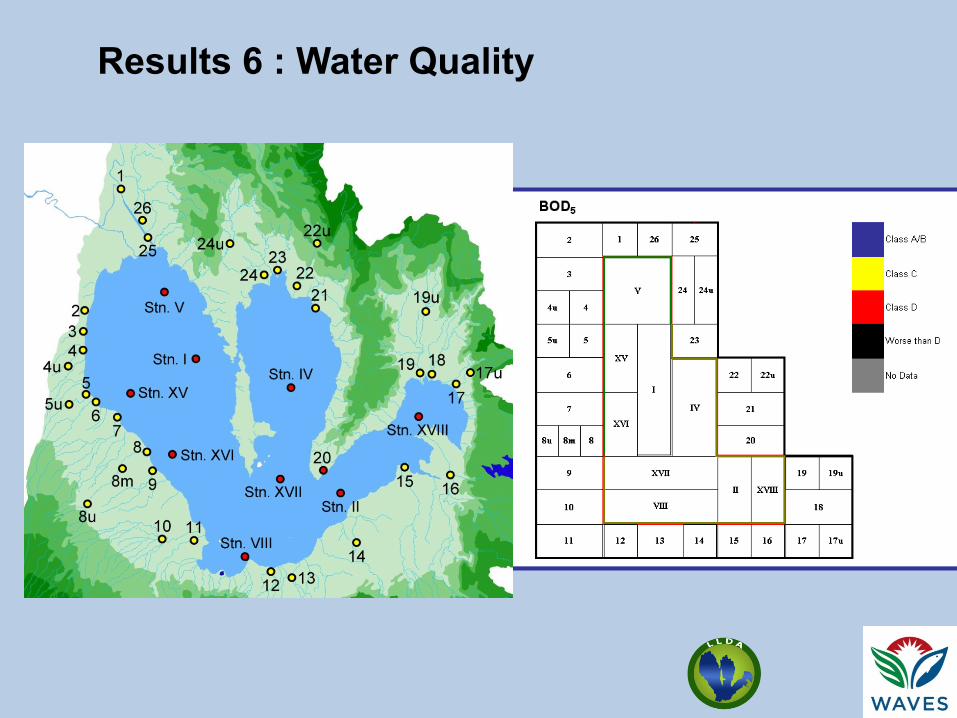
Results 6 : Water Quality
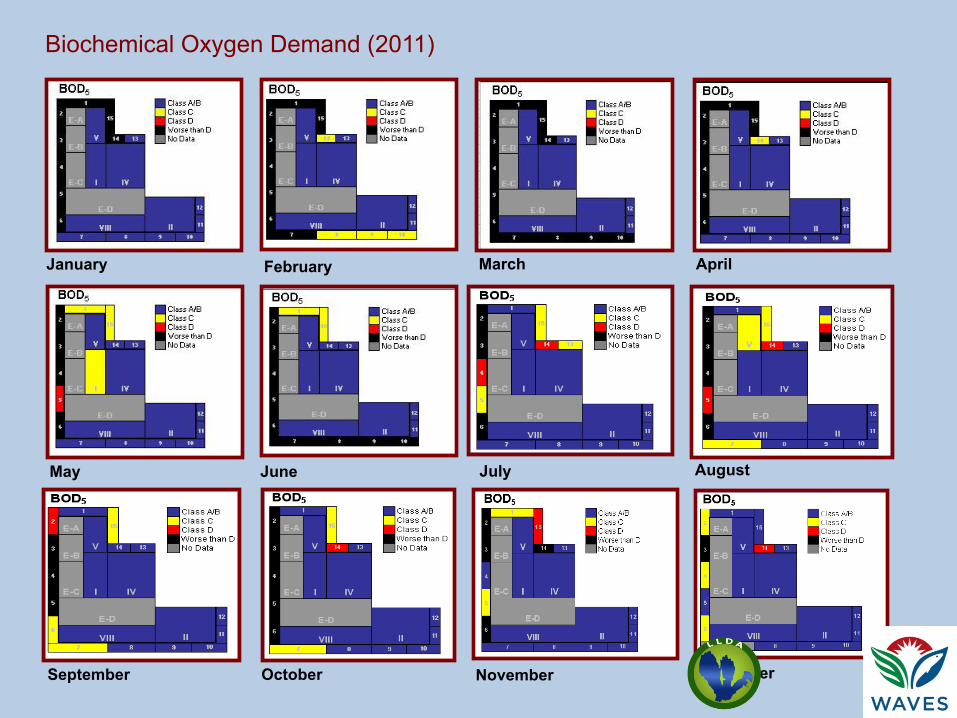
Biochemical Oxygen Demand (2011)
January February March April
May June July August
September October November December
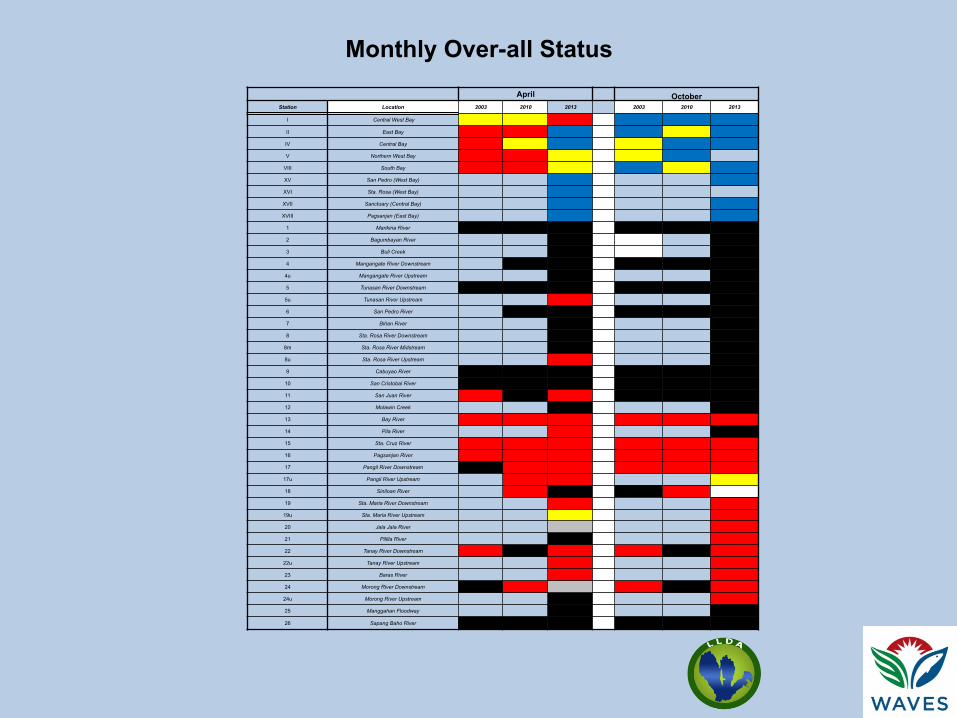
April October Station Location 2003 2010 2013 2003 2010 2013
I Central West Bay II East Bay IV Central Bay V Northern West Bay
VIII South Bay XV San Pedro (West Bay) XVI Sta. Rosa (West Bay) XVII Sanctuary (Central Bay) XVIII Pagsanjan (East Bay)
1 Marikina River 2 Bagumbayan River 3 Buli Creek 4 Mangangate River Downstream
4u Mangangate River Upstream 5 Tunasan River Downstream
5u Tunasan River Upstream 6 San Pedro River 7 Biñan River 8 Sta. Rosa River Downstream
8m Sta. Rosa River Midstream 8u Sta. Rosa River Upstream 9 Cabuyao River
10 San Cristobal River 11 San Juan River 12 Molawin Creek 13 Bay River 14 Pila River 15 Sta. Cruz River 16 Pagsanjan River 17 Pangil River Downstream
17u Pangil River Upstream 18 Siniloan River 19 Sta. Maria River Downstream
19u Sta. Maria River Upstream 20 Jala Jala River 21 Pililla River 22 Tanay River Downstream
22u Tanay River Upstream 23 Baras River 24 Morong River Downstream
24u Morong River Upstream 25 Manggahan Floodway 26 Sapang Baho River
Monthly Over-all Status
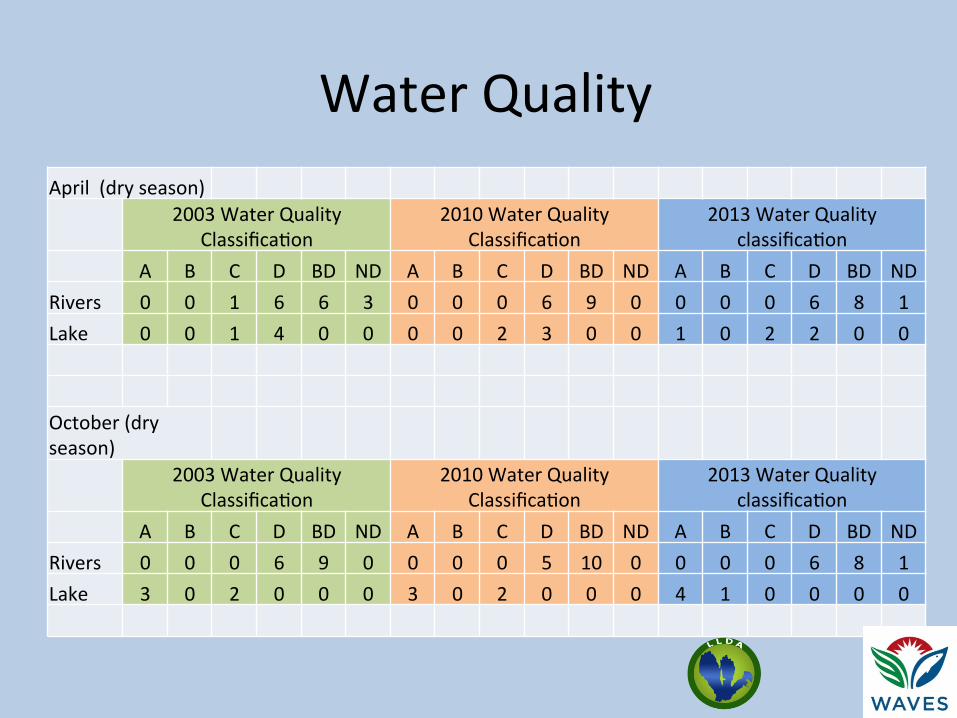
Water Quality April (dry season)
2003 Water Quality Classifica-on
2010 Water Quality Classifica-on
2013 Water Quality classifica-on
A B C D BD ND A B C D BD ND A B C D BD ND Rivers 0 0 1 6 6 3 0 0 0 6 9 0 0 0 0 6 8 1 Lake 0 0 1 4 0 0 0 0 2 3 0 0 1 0 2 2 0 0
October (dry season)
2003 Water Quality Classifica-on
2010 Water Quality Classifica-on
2013 Water Quality classifica-on
A B C D BD ND A B C D BD ND A B C D BD ND Rivers 0 0 0 6 9 0 0 0 0 5 10 0 0 0 0 6 8 1 Lake 3 0 2 0 0 0 3 0 2 0 0 0 4 1 0 0 0 0
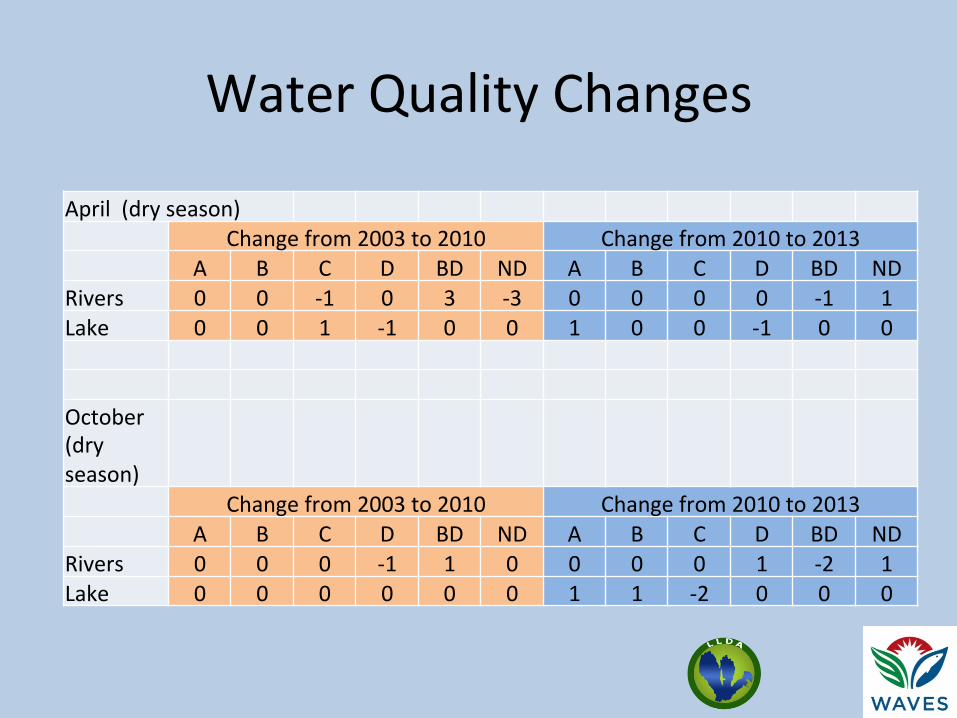
Water Quality Changes
April (dry season) Change from 2003 to 2010 Change from 2010 to 2013
A B C D BD ND A B C D BD ND Rivers 0 0 -‐1 0 3 -‐3 0 0 0 0 -‐1 1 Lake 0 0 1 -‐1 0 0 1 0 0 -‐1 0 0
October (dry season)
Change from 2003 to 2010 Change from 2010 to 2013 A B C D BD ND A B C D BD ND Rivers 0 0 0 -‐1 1 0 0 0 0 1 -‐2 1 Lake 0 0 0 0 0 0 1 1 -‐2 0 0 0
Next steps (by March)
• Analysis of flood zones and flood risks in number of households
• Monetary valua-on of flood risk • Fisheries survey for monetary valua-on fisheries service