Embed Size (px)
Citation preview
A86045 Accoun,ng and Financial Repor,ng (2014/2015)
Session 3 Financial Analysis Cont’d
Paul G. Smith B.A., F.C.A.
Course Objec,ves
A 86045 Accoun,ng and Financial Repor,ng 2
At the end of this course students will be able to: • Read and perform a high level interpreta2on of the financial statements of companies applying interna9onal accoun9ng standards
• Iden2fy and evaluate the impact on a companies accounts of alterna9ve accoun9ng methods
• Carry out a high level assessment of the the economic-‐ financial posi9on of a company repor9ng under IAS/IFRS.
Course Overview
A 86045 Accoun,ng and Financial Repor,ng 3
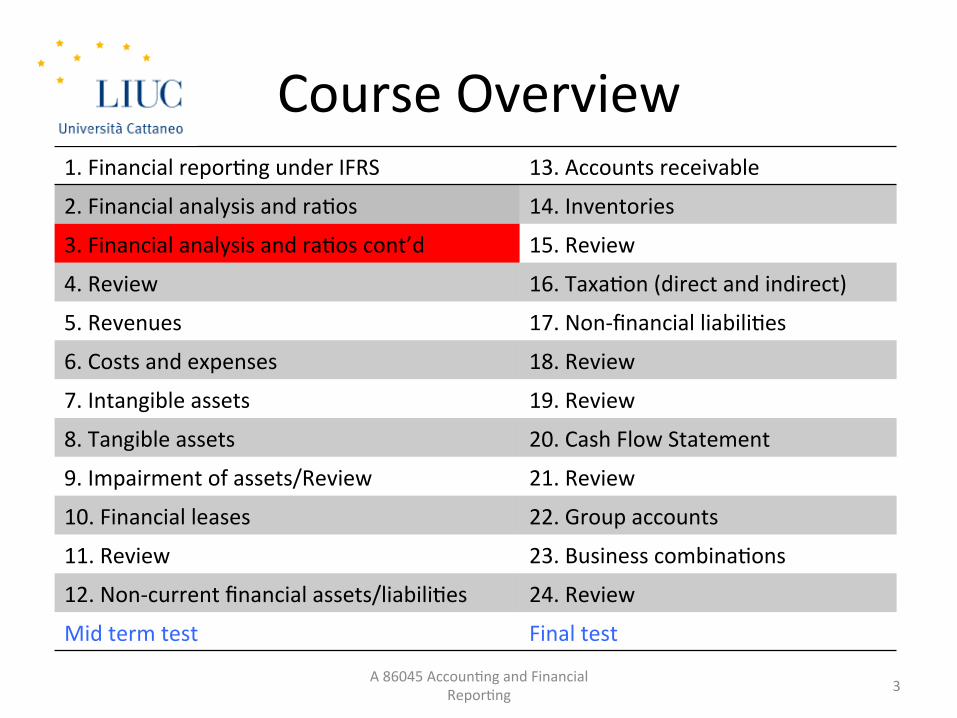
1. Financial repor,ng under IFRS 13. Accounts receivable
2. Financial analysis and ra,os 14. Inventories
3. Financial analysis and ra,os cont’d 15. Review
4. Review 16. Taxa,on (direct and indirect)
5. Revenues 17. Non-‐financial liabili,es
6. Costs and expenses 18. Review
7. Intangible assets 19. Review
8. Tangible assets 20. Cash Flow Statement
9. Impairment of assets/Review 21. Review
10. Financial leases 22. Group accounts
11. Review 23. Business combina,ons
12. Non-‐current financial assets/liabili,es 24. Review
Mid term test Final test
SESSION 3 OVERVIEW
A 86045 Accoun,ng and Financial Repor,ng 4
Session 3 Overview
Mins
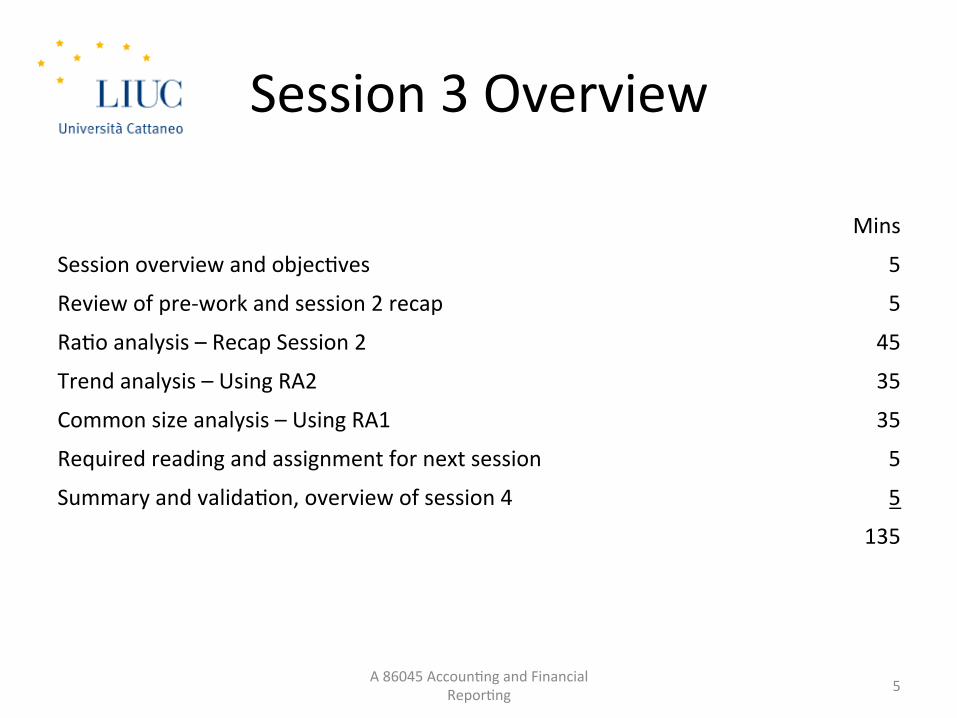
Session overview and objec,ves 5
Review of pre-‐work and session 2 recap 5
Ra,o analysis – Recap Session 2 45
Trend analysis – Using RA2 35
Common size analysis – Using RA1 35
Required reading and assignment for next session 5
Summary and valida,on, overview of session 4 5
135
5 A 86045 Accoun,ng and Financial Repor,ng
Objec,ves of Session 3
A 86045 Accoun,ng and Financial Repor,ng 6
At the end of this session session students will be able to: • Apply the basic techniques of financial analysis
• Ra,o analysis • Trend analysis • Common size analysis
• Perform a high level assessment of a company’s: • Profitability • Liquidity • Efficiency • Investment
SESSION 2 RECAP AND PRE-‐WORK
A 86045 Accoun,ng and Financial Repor,ng 7
Session 2 summary
• Financial analysis • Ra,o analysis – profitability – liquidity – Efficiency – investment
A 86045 Accoun,ng and Financial Repor,ng 8
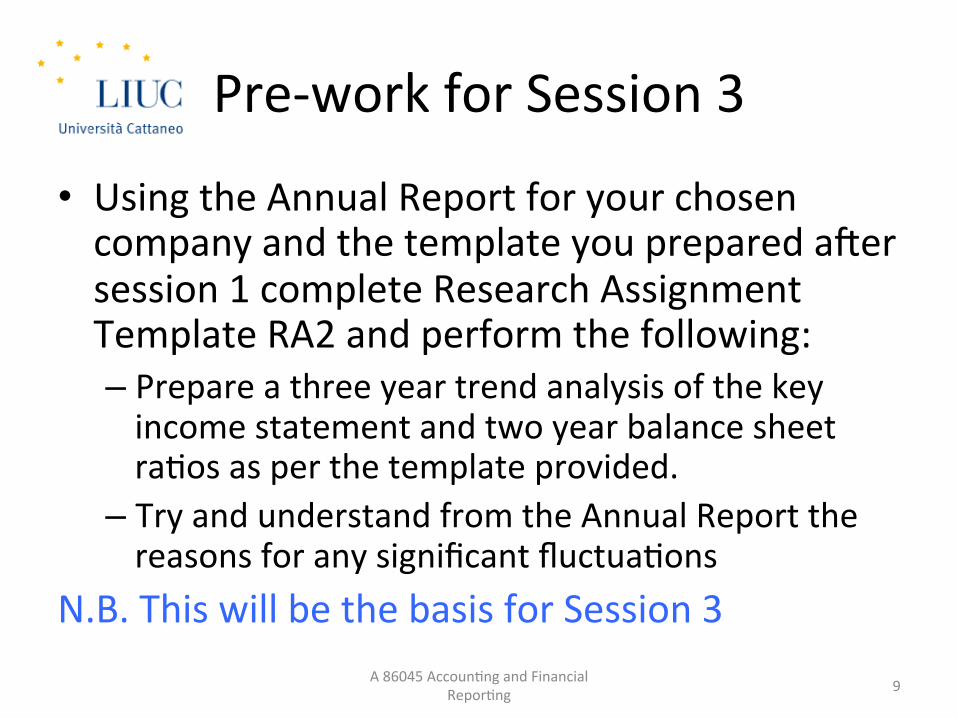
Pre-‐work for Session 3
• Using the Annual Report for your chosen company and the template you prepared aber session 1 complete Research Assignment Template RA2 and perform the following: – Prepare a three year trend analysis of the key income statement and two year balance sheet ra,os as per the template provided.
– Try and understand from the Annual Report the reasons for any significant fluctua,ons
N.B. This will be the basis for Session 3 A 86045 Accoun,ng and Financial
Repor,ng 9
RATIO ANALYSIS
A 86045 Accoun,ng and Financial Repor,ng 10
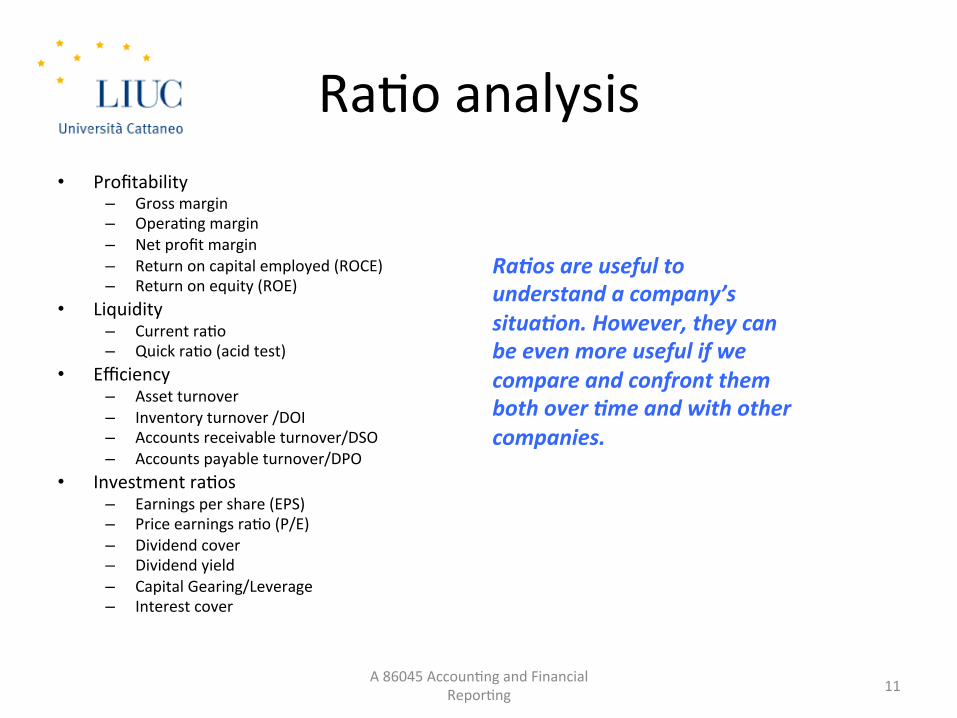
Ra,o analysis • Profitability
– Gross margin – Opera,ng margin – Net profit margin – Return on capital employed (ROCE) – Return on equity (ROE)
• Liquidity – Current ra,o – Quick ra,o (acid test)
• Efficiency – Asset turnover – Inventory turnover /DOI – Accounts receivable turnover/DSO – Accounts payable turnover/DPO
• Investment ra,os – Earnings per share (EPS) – Price earnings ra,o (P/E) – Dividend cover – Dividend yield – Capital Gearing/Leverage – Interest cover
A 86045 Accoun,ng and Financial Repor,ng 11
Ra2os are useful to understand a company’s situa2on. However, they can be even more useful if we compare and confront them both over 2me and with other companies.
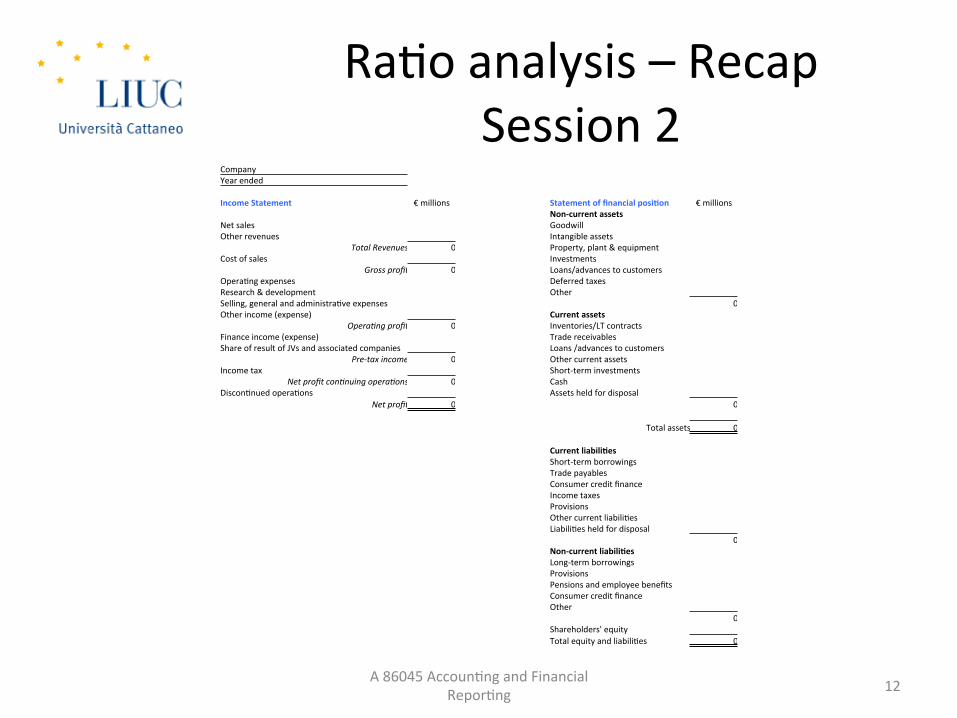
Ra,o analysis – Recap Session 2
A 86045 Accoun,ng and Financial Repor,ng 12
Company Year ended
Income Statement € millions Statement of financial posiBon € millions Non-‐current assets
Net sales Goodwill Other revenues Intangible assets
Total Revenues 0 Property, plant & equipment Cost of sales Investments
Gross profit 0 Loans/advances to customers Opera,ng expenses Deferred taxes Research & development Other Selling, general and administra,ve expenses 0 Other income (expense) Current assets
Opera9ng profit 0 Inventories/LT contracts Finance income (expense) Trade receivables Share of result of JVs and associated companies Loans /advances to customers
Pre-‐tax income 0 Other current assets Income tax Short-‐term investments
Net profit con9nuing opera9ons 0 Cash Discon,nued opera,ons Assets held for disposal
Net profit 0 0
Total assets 0
Current liabiliBes Short-‐term borrowings Trade payables Consumer credit finance Income taxes Provisions Other current liabili,es Liabili,es held for disposal
0 Non-‐current liabiliBes Long-‐term borrowings Provisions Pensions and employee benefits Consumer credit finance Other
0 Shareholders' equity Total equity and liabili,es 0
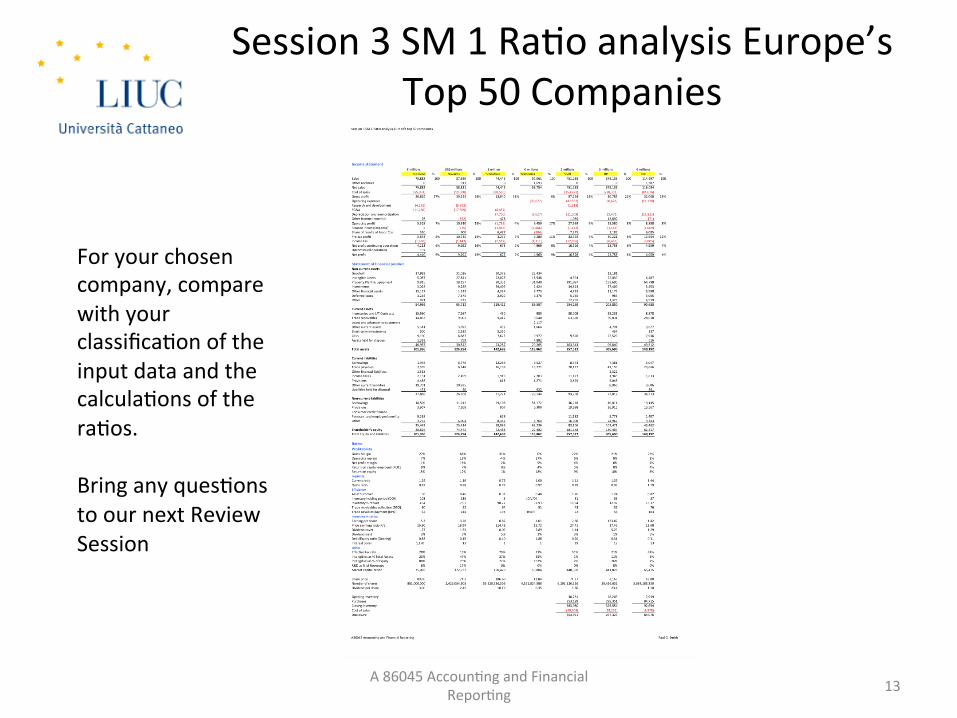
Session 3 SM 1 Ra,o analysis Europe’s Top 50 Companies
A 86045 Accoun,ng and Financial Repor,ng 13
For your chosen company, compare with your classifica,on of the input data and the calcula,ons of the ra,os. Bring any ques,ons to our next Review Session
TREND ANALYSIS
A 86045 Accoun,ng and Financial Repor,ng 14
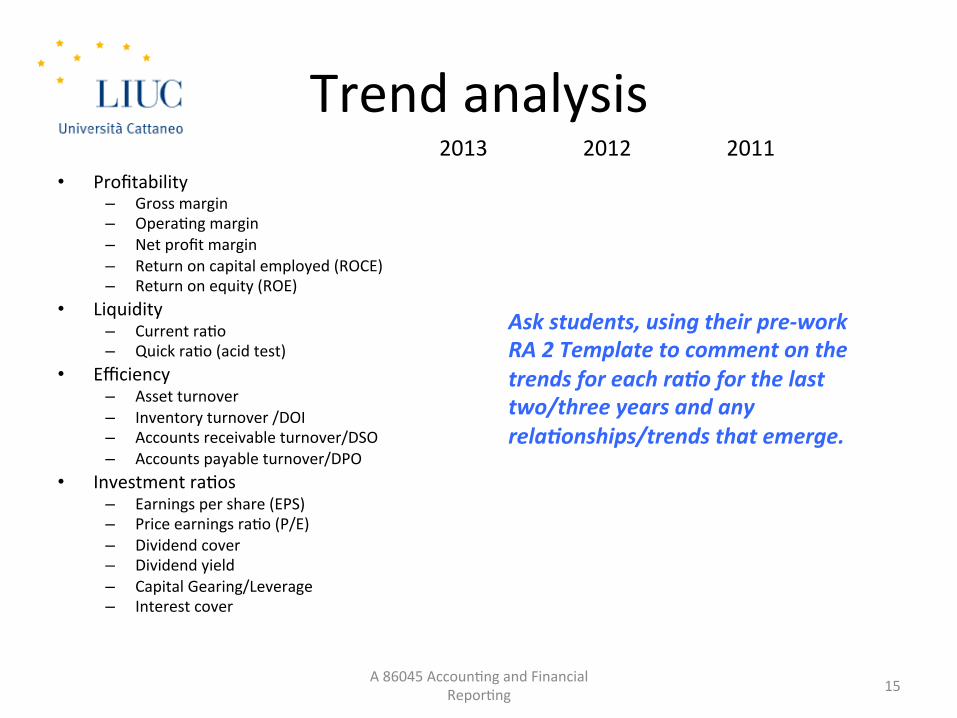
Trend analysis • Profitability
– Gross margin – Opera,ng margin – Net profit margin – Return on capital employed (ROCE) – Return on equity (ROE)
• Liquidity – Current ra,o – Quick ra,o (acid test)
• Efficiency – Asset turnover – Inventory turnover /DOI – Accounts receivable turnover/DSO – Accounts payable turnover/DPO
• Investment ra,os – Earnings per share (EPS) – Price earnings ra,o (P/E) – Dividend cover – Dividend yield – Capital Gearing/Leverage – Interest cover
A 86045 Accoun,ng and Financial Repor,ng 15
Ask students, using their pre-‐work RA 2 Template to comment on the trends for each ra2o for the last two/three years and any rela2onships/trends that emerge.
2013 2012 2011
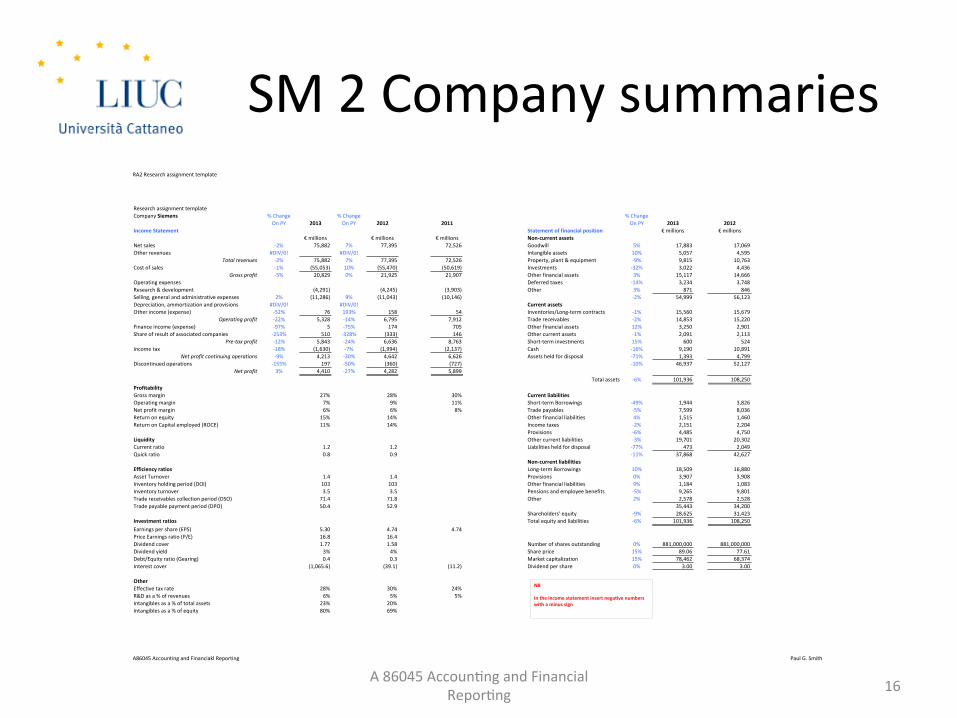
SM 2 Company summaries
A 86045 Accoun,ng and Financial Repor,ng 16
RA2$Research$assignment$template$
A86045$Accounting$and$Financiakl$Reporting Paul$G.$Smith
Research$assignment$templateCompany$Siemens %$Change %$Change %$Change
On$PY 2013 On$PY 2012 2011 On$PY 2013 2012Income.Statement Statement.of.financial.position €$millions €$millions
€$millions €$millions €$millions Non5current.assetsNet$sales G2% 75,882 7% 77,395 72,526 Goodwill 5% 17,883 17,069Other$revenues #DIV/0! #DIV/0! Intangible$assets 10% 5,057 4,595
Total&revenues G2% 75,882 7% 77,395 72,526 Property,$plant$&$equipment G9% 9,815 10,763Cost$of$sales G1% (55,053) 10% (55,470) (50,619) Investments G32% 3,022 4,436
Gross&profit G5% 20,829 0% 21,925 21,907 Other$financial$assets 3% 15,117 14,666Operating$expenses Deferred$taxes G14% 3,234 3,748Research$&$development (4,291) (4,245) (3,903) Other$ 3% 871 846Selling,$general$and$administrative$expenses 2% (11,286) 9% (11,043) (10,146) G2% 54,999 56,123Depreciation,$ammortization$and$provisions #DIV/0! #DIV/0! Current.assetsOther$income$(expense) G52% 76 193% 158 54 Inventories/LongGterm$contracts G1% 15,560 15,679
Operating&profit G22% 5,328 G14% 6,795 7,912 Trade$receivables G2% 14,853 15,220Finance$income$(expense) G97% 5 G75% 174 705 Other$financial$assets 12% 3,250 2,901Share$of$result$of$associated$companies G253% 510 G328% (333) 146 Other$current$assets G1% 2,091 2,113
Pre4tax&profit G12% 5,843 G24% 6,636 8,763 ShortGterm$investments 15% 600 524Income$tax G18% (1,630) G7% (1,994) (2,137) Cash G16% 9,190 10,891
Net&profit&continuing&operations G9% 4,213 G30% 4,642 6,626 Assets$held$for$disposal G71% 1,393 4,799Discontinued$operations G155% 197 G50% (360) (727) G10% 46,937 52,127
Net&profit 3% 4,410 G27% 4,282 5,899Total$assets G6% 101,936 108,250
ProfitabilityGross$margin 27% 28% 30% Current.liabilitiesOperating$margin 7% 9% 11% ShortGterm$Borrowings G49% 1,944 3,826Net$profit$margin 6% 6% 8% Trade$payables G5% 7,599 8,036Return$on$equity 15% 14% Other$financial$liabilities 4% 1,515 1,460Return$on$Capital$employed$(ROCE) 11% 14% Income$taxes G2% 2,151 2,204
Provisions G6% 4,485 4,750Liquidity Other$current$liabilities G3% 19,701 20,302Current$ratio 1.2 1.2 Liabilities$held$for$disposal G77% 473 2,049Quick$ratio 0.8 0.9 G11% 37,868 42,627
Non5current.liabilitiesEfficiency.ratios LongGterm$Borrowings 10% 18,509 16,880Asset$Turnover 1.4 1.4 Provisions 0% 3,907 3,908Inventory$holding$period$(DOI) 103 103 Other$financial$liabilities 9% 1,184 1,083Inventory$turnover 3.5 3.5 Pensions$and$employee$benefits G5% 9,265 9,801Trade$receivables$collection$period$(DSO) 71.4 71.8 Other$ 2% 2,578 2,528Trade$payable$payment$period$(DPO) 50.4 52.9 35,443 34,200
Shareholders'$equity G9% 28,625 31,423Investment.ratios Total$equity$and$liabilities G6% 101,936 108,250Earnings$per$share$(EPS) 5.30 4.74 4.74Price$Earnings$ratio$(P/E) 16.8 16.4Dividend$cover 1.77 1.58 Number$of$shares$outstanding 0% 881,000,000 881,000,000Dividend$yield 3% 4% Share$price 15% 89.06 77.61Debt/Equity$ratio$(Gearing) 0.4 0.3 Market$capitalization 15% 78,462 68,374Interest$cover (1,065.6) (39.1) (11.2) Dividend$per$share 0% 3.00 3.00
OtherEffective$tax$rate 28% 30% 24%R&D$as$a$%$of$revenues 6% 5% 5%Intangibles$as$a$%$of$total$assets 23% 20%Intangibles$as$a$%$of$equity 80% 69%
NB..In.the.income.statement.insert.negaEve.numbers.with.a.minus.sign.
COMMON SIZE ANALYSIS
A 86045 Accoun,ng and Financial Repor,ng 17
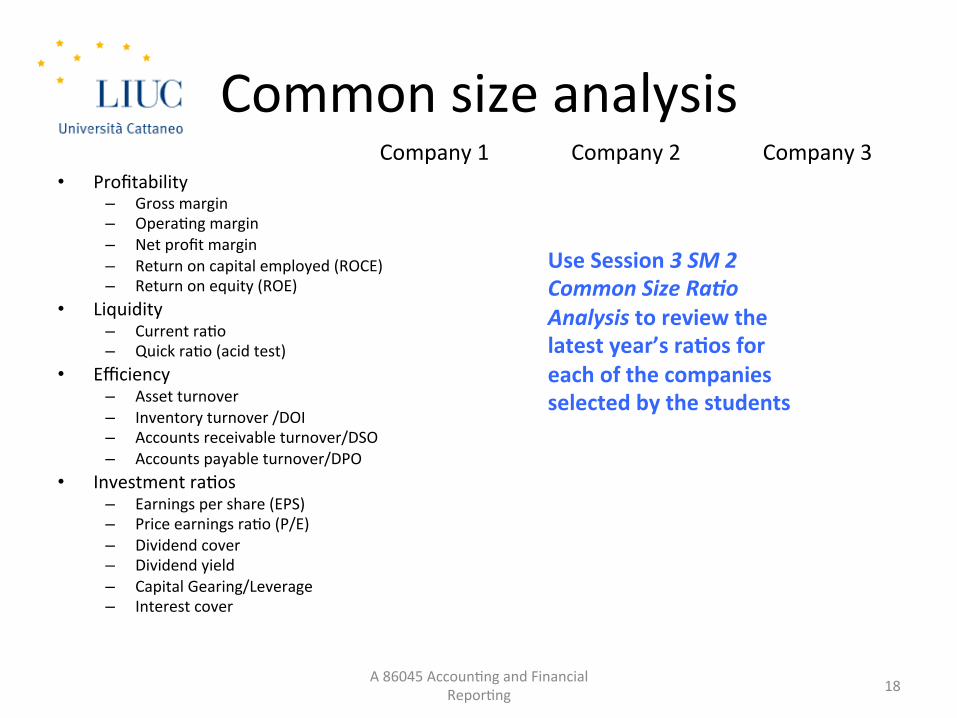
Common size analysis • Profitability
– Gross margin – Opera,ng margin – Net profit margin – Return on capital employed (ROCE) – Return on equity (ROE)
• Liquidity – Current ra,o – Quick ra,o (acid test)
• Efficiency – Asset turnover – Inventory turnover /DOI – Accounts receivable turnover/DSO – Accounts payable turnover/DPO
• Investment ra,os – Earnings per share (EPS) – Price earnings ra,o (P/E) – Dividend cover – Dividend yield – Capital Gearing/Leverage – Interest cover
A 86045 Accoun,ng and Financial Repor,ng 18
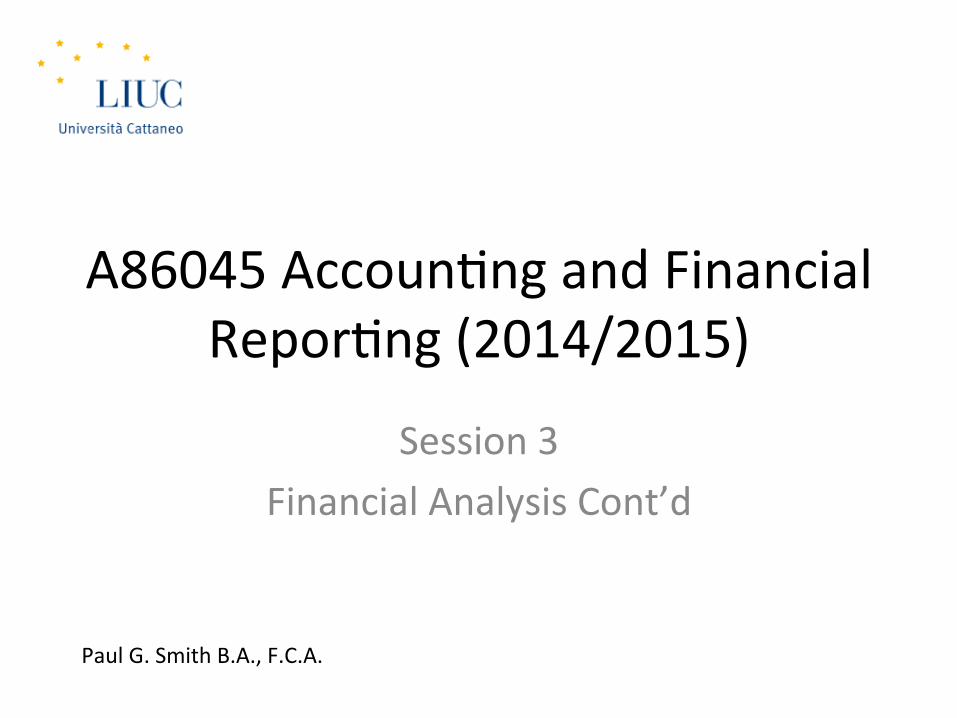
Use Session 3 SM 2 Common Size Ra2o Analysis to review the latest year’s raBos for each of the companies selected by the students
Company 1 Company 2 Company 3
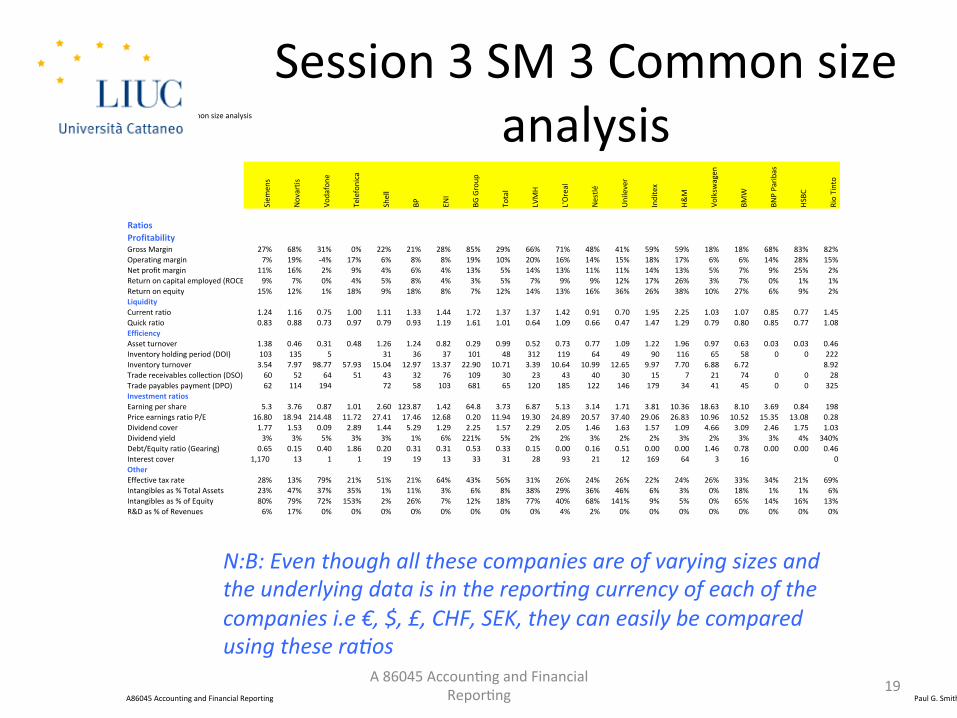
Session 3 SM 3 Common size analysis
A 86045 Accoun,ng and Financial Repor,ng 19
Session'3'SM'2'Common'size'analysis
A86045'Accounting'and'Financial'Reporting Paul'G.'Smith
Siem
ens
Novartis
Vodafone
'
Telefonica
Shell
BP ENI
BG'Group
Total
LVMH
L'Oreal
Nestlé
Unilever
Inditex
H&M
Volksw
agen
BMW
BNP'Parib
as
HSBC
Rio'Tinto'
RatiosProfitabilityGross'Margin 27% 68% 31% 0% 22% 21% 28% 85% 29% 66% 71% 48% 41% 59% 59% 18% 18% 68% 83% 82%Operating'margin 7% 19% \4% 17% 6% 8% 8% 19% 10% 20% 16% 14% 15% 18% 17% 6% 6% 14% 28% 15%Net'profit'margin 11% 16% 2% 9% 4% 6% 4% 13% 5% 14% 13% 11% 11% 14% 13% 5% 7% 9% 25% 2%Return'on'capital'employed'(ROCE) 9% 7% 0% 4% 5% 8% 4% 3% 5% 7% 9% 9% 12% 17% 26% 3% 7% 0% 1% 1%Return'on'equity 15% 12% 1% 18% 9% 18% 8% 7% 12% 14% 13% 16% 36% 26% 38% 10% 27% 6% 9% 2%LiquidityCurrent'ratio 1.24 1.16 0.75 1.00 1.11 1.33 1.44 1.72 1.37 1.37 1.42 0.91 0.70 1.95 2.25 1.03 1.07 0.85 0.77 1.45Quick'ratio 0.83 0.88 0.73 0.97 0.79 0.93 1.19 1.61 1.01 0.64 1.09 0.66 0.47 1.47 1.29 0.79 0.80 0.85 0.77 1.08EfficiencyAsset'turnover 1.38 0.46 0.31 0.48 1.26 1.24 0.82 0.29 0.99 0.52 0.73 0.77 1.09 1.22 1.96 0.97 0.63 0.03 0.03 0.46Inventory'holding'period'(DOI) 103 135 5 31 36 37 101 48 312 119 64 49 90 116 65 58 0 0 222Inventory'turnover 3.54 7.97 98.77 57.93 15.04 12.97 13.37 22.90 10.71 3.39 10.64 10.99 12.65 9.97 7.70 6.88 6.72 8.92Trade'receivables'collection'(DSO) 60 52 64 51 43 32 76 109 30 23 43 40 30 15 7 21 74 0 0 28Trade'payables'payment'(DPO) 62 114 194 72 58 103 681 65 120 185 122 146 179 34 41 45 0 0 325Investment8ratiosEarning'per'share 5.3 3.76 0.87 1.01 2.60 123.87 1.42 64.8 3.73 6.87 5.13 3.14 1.71 3.81 10.36 18.63 8.10 3.69 0.84 198Price'earnings'ratio'P/E 16.80 18.94 214.48 11.72 27.41 17.46 12.68 0.20 11.94 19.30 24.89 20.57 37.40 29.06 26.83 10.96 10.52 15.35 13.08 0.28Dividend'cover 1.77 1.53 0.09 2.89 1.44 5.29 1.29 2.25 1.57 2.29 2.05 1.46 1.63 1.57 1.09 4.66 3.09 2.46 1.75 1.03Dividend'yield 3% 3% 5% 3% 3% 1% 6% 221% 5% 2% 2% 3% 2% 2% 3% 2% 3% 3% 4% 340%Debt/Equity'ratio'(Gearing) 0.65 0.15 0.40 1.86 0.20 0.31 0.31 0.53 0.33 0.15 0.00 0.16 0.51 0.00 0.00 1.46 0.78 0.00 0.00 0.46Interest'cover 1,170'' 13 1 1 19 19 13 33 31 28 93 21 12 169 64 3 16 0OtherEffective'tax'rate 28% 13% 79% 21% 51% 21% 64% 43% 56% 31% 26% 24% 26% 22% 24% 26% 33% 34% 21% 69%Intangibles'as'%'Total'Assets 23% 47% 37% 35% 1% 11% 3% 6% 8% 38% 29% 36% 46% 6% 3% 0% 18% 1% 1% 6%Intangibles'as'%'of'Equity 80% 79% 72% 153% 2% 26% 7% 12% 18% 77% 40% 68% 141% 9% 5% 0% 65% 14% 16% 13%R&D'as'%'of'Revenues 6% 17% 0% 0% 0% 0% 0% 0% 0% 0% 4% 2% 0% 0% 0% 0% 0% 0% 0% 0%
N:B: Even though all these companies are of varying sizes and the underlying data is in the repor9ng currency of each of the companies i.e €, $, £, CHF, SEK, they can easily be compared using these ra9os
SUMMARY, VALIDATION AND PRE-‐WORK SESSION 4
A 86045 Accoun,ng and Financial Repor,ng 20
Sessions 1-‐3 Summary
• The 4 basic financial statements, presenta,on op,ons and basic underlying assump,ons
• Linkages between the financial statements • Basic bookkeeping • Financial analysis, ra,o analysis, common size analysis and trend analysis
• Importance of industry context and understanding
A 86045 Accoun,ng and Financial Repor,ng 21
Session Valida,on
• Name the 4 financial statements required by IFRS and the presenta,on op,ons available for each of these
• What is meant by a company’s “Gearing” ra,o?
• What is the defini,on of a current asset or current liability?
• What is “DSO” and what is the op,mum DSO for a company?
A 86045 Accoun,ng and Financial Repor,ng 22
Overview of Session 4
• In Session 4 we will Review what we have done so far
• Work through the examples that have been provided for your chosen company and come prepared with ques,ons for anything that you don’t understand.
• We will use some addi,onal companies to understand some industry differences
A 86045 Accoun,ng and Financial Repor,ng 23
Required Reading Recap
• Reading – Melville
• Chapter 3 – Presenta,on of Financial Statements • Chapter 9 – Accoun,ng policies, accoun,ng es,mates and errors
• Chapter 22 -‐ Ra,o Analysis
– IFRS • IAS 1Presenta,on of Financial Statements • IASB Technical summaries IAS 8, IFRS 5, IFRS 8, IAS 10, IAS 20, IAS 21, IAS 24, IAS 33, IAS 34
A 86045 Accoun,ng and Financial Repor,ng 24