Embed Size (px)
Citation preview
JANUARY 28, 2011
Economy News4 Rising oil prices and firming up of global and domestic food prices are
likely to have a significant impact on inflation outlook in 2011 (ET).
4 After registering positive growth for three months in a row, India'sapparel exports again slipped about 3% to $716 million in Novemberyear-on-year, due to less demand from the West and rising input cost(ET).
4 The power capacity addition during the first nine months of the currentfiscal has surpassed the record 9,585 MW achieved in 2009-10 (BL).
Corporate News4 Larsen & Toubro (L&T) may sell stake in its infotech subsidiary after
failing to turn it into a bigger business, by its planned buy out of SatyamComputer Services in 2009,a number of persons familiar with thedevelopment told ET (ET).
4 Power Finance Corporation (PFC) is likely to have the.70 bn follow-onpublic offer in April or May this year (ET).
4 Kingfisher Airlines will add eight aircraft to its fleet by October in orderto arrest a slide in market share. The aircraft will be taken on lease fromthe market (ET).
4 Reliance Power plans to expand four large coal-fired power projects by50% to generate an additional 8,000 megawatts (mw) of power, whichmay be sold at more attractive merchant rates (ET).
4 Hindustan Construction Corporation's hopes on a compromise withthe Union ministry of environment and forests on the stalled Lavasa hillcity project near Pune (BS)
4 Responding to the arbitration panel's ruling that struck down SterliteIndustries' call option to acquire the remaining 49 per cent stake inBharat Aluminium Company (Balco), the Vedanta Group company isconsidering the next course of action (BS).
4 Mahindra & Mahindra launched the Genio, a pick-up vehicle based onthe Xylo model, with an introductory price tag of Rs 0.5 mn (ex-showroom, Navi Mumbai) for the Bharat Stage (BS) III variant.
4 BEML Limited has concluded wage settlement with its employees unionsat Bangalore, Mysore, KGF complexes and marketing division at thecorporate office in Bangalore.
4 Cummins Inc. has announced that it has entered into an agreement tosell its exhaust business to Global Tube, a portfolio company of WindPoint Partners, a private equity firm in Chicago (BS).
4 Reliance Communications (RCom) launched its 3G services in theHimachal Pradesh state earlier this week. By the end of this week, RComwill commercially offer 3G services to customers in this area (BS).
Equity% Chg
27 Jan 11 1 Day 1 Mth 3 Mths
Indian IndicesSENSEX Index 18,684 (1.5) (6.9) (7.6)NIFTY Index 5,604 (1.5) (6.8) (7.9)BANKEX Index 12,122 (1.8) (6.9) (13.8)BSET Index 6,529 (1.2) (2.5) 6.9BSETCG INDEX 13,513 (1.4) (11.1) (16.0)BSEOIL INDEX 9,529 (1.6) (10.4) (13.5)CNXMcap Index 8,067 (2.1) (7.3) (15.1)BSESMCAP INDEX 8,864 (1.3) (5.2) (18.3)
World IndicesDow Jones 11,990 0.0 3.6 7.9Nasdaq 2,755 0.6 3.5 9.9FTSE 5,965 (0.1) (0.7) 5.1Nikkei 10,479 0.7 0.9 10.8Hangseng 23,780 (0.3) 4.6 1.9
Value traded (Rs cr)27 Jan 11 % Chg - Day
Cash BSE 3,048 (7.3)Cash NSE 16,452 25.9Derivatives 211,339 2.6
Net inflows (Rs cr)25 Jan 11 % Chg MTD YTD
FII 428 119.8 (3,440) (3,440)Mutual Fund (52) (119.6) 899 899
FII open interest (Rs cr)25 Jan 11 % Chg
FII Index Futures 10,568 (28.2)FII Index Options 36,991 (30.0)FII Stock Futures 28,186 (15.9)FII Stock Options 132 (79.6)
Advances / Declines (BSE)27 Jan 11 A B S Total % total
Advances 27 551 142 720 32Declines 178 1,203 263 1,381 62Unchanged 1 94 24 119 5
Commodity % Chg
27 Jan 11 1 Day 1 Mth 3 Mths
Crude (NYMEX) (US$/BBL) 85.1 (0.6) (6.9) 3.6Gold (US$/OZ) 1,322.1 (0.6) (6.6) (2.2)Silver (US$/OZ) 27.1 0.4 (12.3) 11.3
Debt / forex market27 Jan 11 1 Day 1 Mth 3 Mths
10 yr G-Sec yield % 8.14 8.15 7.91 8.13Re/US$ 45.57 45.71 45.24 44.46
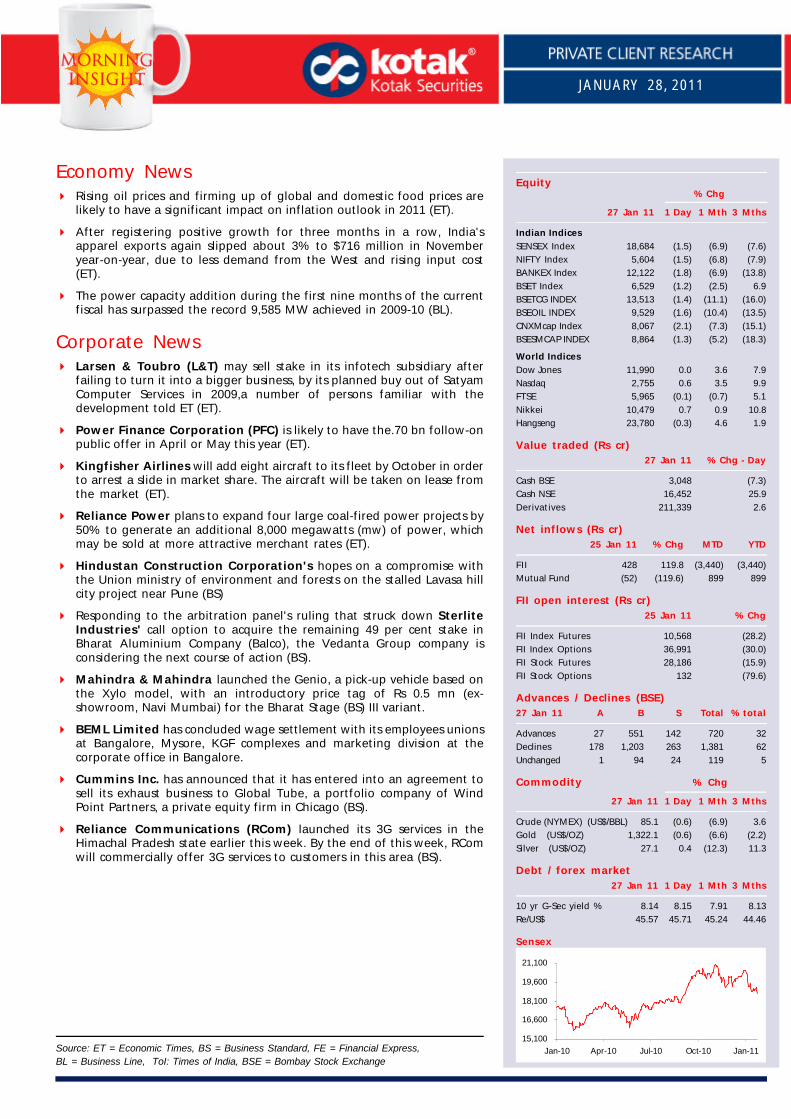
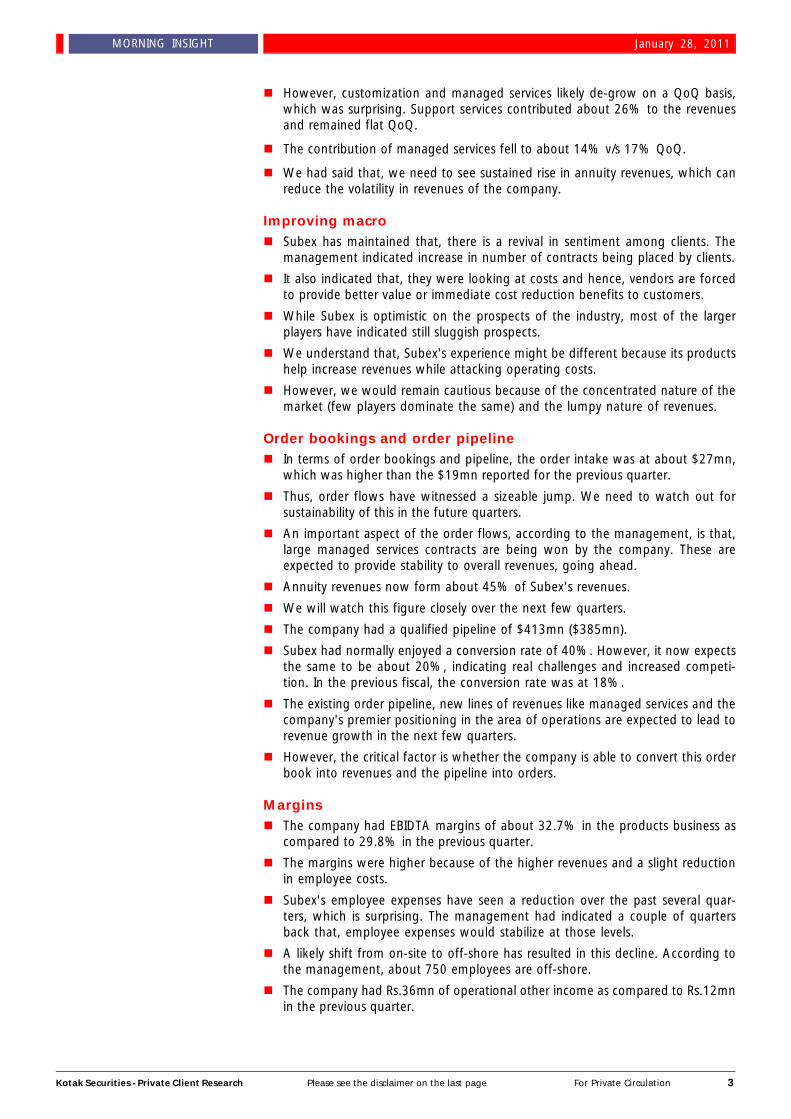
Sensex
Source: ET = Economic Times, BS = Business Standard, FE = Financial Express,BL = Business Line, ToI: Times of India, BSE = Bombay Stock Exchange
15,100
16,600
18,100
19,600
21,100
Jan-10 Apr-10 Jul-10 Oct-10 Jan-11
Kotak Securities - Private Client Research Please see the disclaimer on the last page For Private Circulation 2
MORNING INSIGHT January 28, 2011
SUBEX AZURE LIMITED (SUBEX)PRICE: RS.69 RECOMMENDATION: ACCUMULATETARGET PRICE: RS.88 FY12E P/E: 6.7X
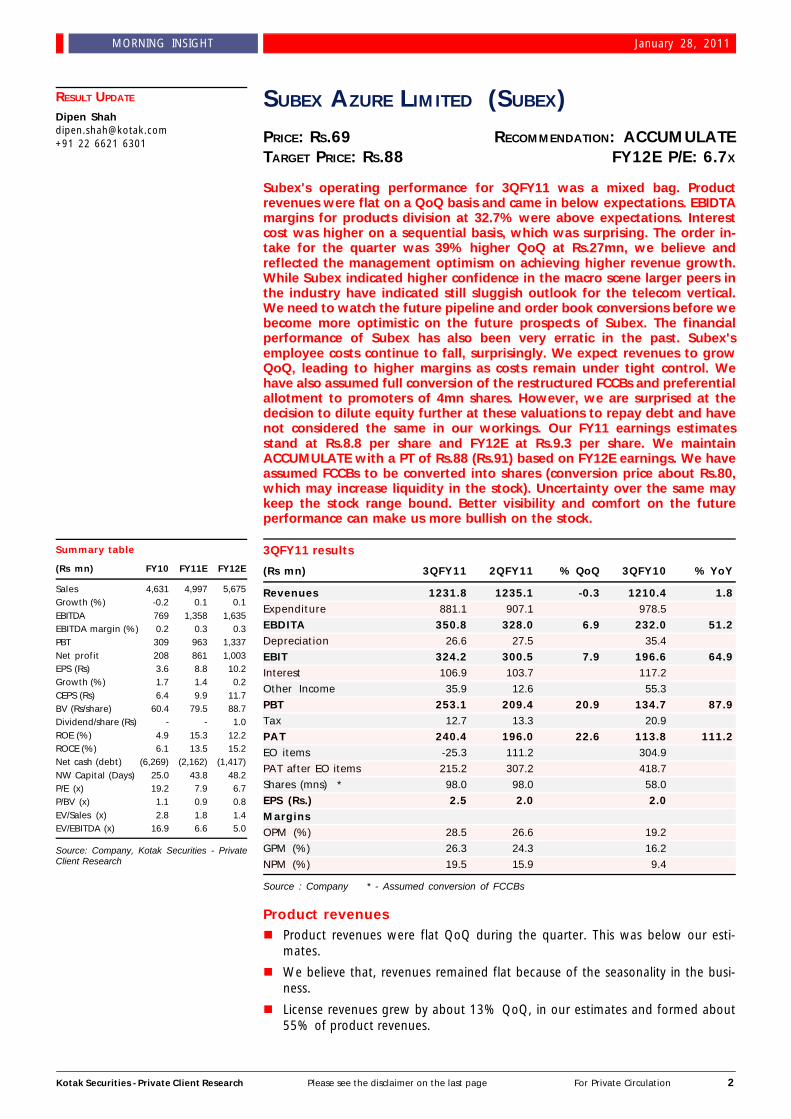
Subex's operating performance for 3QFY11 was a mixed bag. Productrevenues were flat on a QoQ basis and came in below expectations. EBIDTAmargins for products division at 32.7% were above expectations. Interestcost was higher on a sequential basis, which was surprising. The order in-take for the quarter was 39% higher QoQ at Rs.27mn, we believe andreflected the management optimism on achieving higher revenue growth.While Subex indicated higher confidence in the macro scene larger peers inthe industry have indicated still sluggish outlook for the telecom vertical.We need to watch the future pipeline and order book conversions before webecome more optimistic on the future prospects of Subex. The financialperformance of Subex has also been very erratic in the past. Subex'semployee costs continue to fall, surprisingly. We expect revenues to growQoQ, leading to higher margins as costs remain under tight control. Wehave also assumed full conversion of the restructured FCCBs and preferentialallotment to promoters of 4mn shares. However, we are surprised at thedecision to dilute equity further at these valuations to repay debt and havenot considered the same in our workings. Our FY11 earnings estimatesstand at Rs.8.8 per share and FY12E at Rs.9.3 per share. We maintainACCUMULATE with a PT of Rs.88 (Rs.91) based on FY12E earnings. We haveassumed FCCBs to be converted into shares (conversion price about Rs.80,which may increase liquidity in the stock). Uncertainty over the same maykeep the stock range bound. Better visibility and comfort on the futureperformance can make us more bullish on the stock.
3QFY11 results
(Rs mn) 3QFY11 2QFY11 % QoQ 3QFY10 % YoY
Revenues 1231.8 1235.1 -0.3 1210.4 1.8Expenditure 881.1 907.1 978.5
EBDITA 350.8 328.0 6.9 232.0 51.2Depreciation 26.6 27.5 35.4
EBIT 324.2 300.5 7.9 196.6 64.9Interest 106.9 103.7 117.2
Other Income 35.9 12.6 55.3
PBT 253.1 209.4 20.9 134.7 87.9Tax 12.7 13.3 20.9
PAT 240.4 196.0 22.6 113.8 111.2EO items -25.3 111.2 304.9
PAT after EO items 215.2 307.2 418.7
Shares (mns) * 98.0 98.0 58.0
EPS (Rs.) 2.5 2.0 2.0MarginsOPM (%) 28.5 26.6 19.2
GPM (%) 26.3 24.3 16.2
NPM (%) 19.5 15.9 9.4
Source : Company * - Assumed conversion of FCCBs
Product revenuesn Product revenues were flat QoQ during the quarter. This was below our esti-
mates.
n We believe that, revenues remained flat because of the seasonality in the busi-ness.
n License revenues grew by about 13% QoQ, in our estimates and formed about55% of product revenues.
Summary table
(Rs mn) FY10 FY11E FY12E
Sales 4,631 4,997 5,675Growth (%) -0.2 0.1 0.1EBITDA 769 1,358 1,635EBITDA margin (%) 0.2 0.3 0.3PBT 309 963 1,337Net profit 208 861 1,003EPS (Rs) 3.6 8.8 10.2Growth (%) 1.7 1.4 0.2CEPS (Rs) 6.4 9.9 11.7BV (Rs/share) 60.4 79.5 88.7Dividend/share (Rs) - - 1.0ROE (%) 4.9 15.3 12.2ROCE (%) 6.1 13.5 15.2Net cash (debt) (6,269) (2,162) (1,417)NW Capital (Days) 25.0 43.8 48.2P/E (x) 19.2 7.9 6.7P/BV (x) 1.1 0.9 0.8EV/Sales (x) 2.8 1.8 1.4EV/EBITDA (x) 16.9 6.6 5.0
Source: Company, Kotak Securities - PrivateClient Research
RESULT UPDATE
Dipen [email protected]+91 22 6621 6301
Kotak Securities - Private Client Research Please see the disclaimer on the last page For Private Circulation 3
MORNING INSIGHT January 28, 2011
n However, customization and managed services likely de-grow on a QoQ basis,which was surprising. Support services contributed about 26% to the revenuesand remained flat QoQ.
n The contribution of managed services fell to about 14% v/s 17% QoQ.
n We had said that, we need to see sustained rise in annuity revenues, which canreduce the volatility in revenues of the company.
Improving macron Subex has maintained that, there is a revival in sentiment among clients. The
management indicated increase in number of contracts being placed by clients.
n It also indicated that, they were looking at costs and hence, vendors are forcedto provide better value or immediate cost reduction benefits to customers.
n While Subex is optimistic on the prospects of the industry, most of the largerplayers have indicated still sluggish prospects.
n We understand that, Subex's experience might be different because its productshelp increase revenues while attacking operating costs.
n However, we would remain cautious because of the concentrated nature of themarket (few players dominate the same) and the lumpy nature of revenues.
Order bookings and order pipelinen In terms of order bookings and pipeline, the order intake was at about $27mn,
which was higher than the $19mn reported for the previous quarter.
n Thus, order flows have witnessed a sizeable jump. We need to watch out forsustainability of this in the future quarters.
n An important aspect of the order flows, according to the management, is that,large managed services contracts are being won by the company. These areexpected to provide stability to overall revenues, going ahead.
n Annuity revenues now form about 45% of Subex's revenues.
n We will watch this figure closely over the next few quarters.
n The company had a qualified pipeline of $413mn ($385mn).
n Subex had normally enjoyed a conversion rate of 40%. However, it now expectsthe same to be about 20%, indicating real challenges and increased competi-tion. In the previous fiscal, the conversion rate was at 18%.
n The existing order pipeline, new lines of revenues like managed services and thecompany's premier positioning in the area of operations are expected to lead torevenue growth in the next few quarters.
n However, the critical factor is whether the company is able to convert this orderbook into revenues and the pipeline into orders.
Marginsn The company had EBIDTA margins of about 32.7% in the products business as
compared to 29.8% in the previous quarter.
n The margins were higher because of the higher revenues and a slight reductionin employee costs.
n Subex's employee expenses have seen a reduction over the past several quar-ters, which is surprising. The management had indicated a couple of quartersback that, employee expenses would stabilize at those levels.
n A likely shift from on-site to off-shore has resulted in this decline. According tothe management, about 750 employees are off-shore.
n The company had Rs.36mn of operational other income as compared to Rs.12mnin the previous quarter.
Kotak Securities - Private Client Research Please see the disclaimer on the last page For Private Circulation 4
MORNING INSIGHT January 28, 2011
Conversion / restructuring of FCCBs, Preferential placementn Subex had restructured about $141mn of FCCBs (out of a total of $180mn). The
company has issued new FCCBs of $98.7mn against the cancellation of theseolder FCCBs. The new FCCBs carry a coupon of 5% and are convertible intoshares at a price of Rs.80 per share (Rs.656 per share earlier).
n The company has already reduced its liability partly, we have assumed the con-version of FCCBs to happen over the fiscal.
n Of the restructured FCCBs, about $55.8mn worth of FCCBs are outstanding.
n The company is holding an EGM in February to consider the allotment of about5.1mn shares on preferential basis at Rs.81 per share, to M/s KBC Aldini CapitalMauritius Ltd.
n According to the management, the funds will be utilized to repay bank debts(non-FCCB debts), which are currently at Rs.1.49bn. The company has likely ob-ligations to repay the same.
n We are surprised by the fact that, the company has neither opted to re-structurethe debt nor replace the debt, but has agreed to dilute the equity at these valu-ations.
n We also note that, till recently, management had been indicating high degree ofcomfort in repaying all its obligations without further dilution.
n We have assumed the dilution due to FCCB conversion to Rs.979.6mn as againstthe current Rs.651.8mn.
n The increased liquidity may keep the price range bound in the near term.
We make changes to our FY11 and FY12 estimates.n We expect Subex to report revenues of Rs.5bn in FY11 and Rs.5.67bn in FY12E.
n Product revenues are expected to be at Rs.4.34bn and Rs.5.04bn, respectively.
n EBIDTA margins are expected to improve to about 27.2% in FY11 and further to28.8% in FY12E, on the back of higher product revenues and cost control initia-tives.
n We arrive at a PAT of Rs.861mn for FY11E and Rs.1bn in FY12E, leading to anEPS of Rs.8.8 for FY11E and Rs.10.2 for FY12E, on the enhanced equity (prepreferential allotment).
n We have neither considered the MTM gains / losses on the FCCBs nor the otherforex gains / losses in line with the company policy, which treats them as extraor-dinary items.
Risksn A delayed recovery in major user economies may impact our projections.
n A sharp acceleration in rupee from the current levels may impact our earningsestimates for the company.
n Delays in receipt and execution of orders may make earnings volatile in futurequarters while likely impacting the overall revenue and profit growth of the com-pany.
We recommend ACCUMULATE onSubex with a revised price target
of Rs.88
Kotak Securities - Private Client Research Please see the disclaimer on the last page For Private Circulation 5
MORNING INSIGHT January 28, 2011
ULTRATECH CEMENTS
PRICE: RS.1003 RECOMMENDATION: REDUCETARGET PRICE: RS.951 FY12E P/E: 16X
q Ultratech Cements' financials for Q3FY11 are not comparable with corre-sponding quarter last year due to merger of Samruddhi Cements withitself.
q Company's revenues were inline with our estimates
q Operating margin and net profit performance was marginally better thanour estimates. This was led by improvement in cement realizations dur-ing Q3FY11 as compared to Q3FY10.
q We maintain our estimates as well as price target. Though we are posi-tive on the company due to its largest cement capacity as well as signifi-cant volume upside is expected from the cement division but currentvaluations don't leave much upside from the current levels.
q Stock is trading at steep valuations of 16x P/E and 9.1x EV/EBITDA onFY12 estimates on consolidated financials. We thus continue to maintainREDUCE on the stock with an unchanged price target of Rs 951.
Financial highlights - results not comparable with previous qtr
(Rs mn) Q3FY11 Q3FY10 YoY (%)
Net Sales 37,152 16,518 124.9
Expenditure 30,074 12,682
Inc/Dec in trade -174 -78
RM 5,037 2,617
As a % of net sales 13.6 15.8
Purchase of finished goods 279 110
As a % of net sales 0.8 0.7
Staff cost 1,876 623
As a % of net sales 5.0 3.8
Power and fuel 8,959 3,564
As a % of net sales 24.1 21.6
Transportation & Handling 7,285 2,930
As a % of net sales 19.6 17.7
Other expenditure 6,813 2,917
As a % of net sales 18.3 17.7
Operating Profit 7,078 3,836 85
Operating Profit Margin 19.1 23.2
Depreciation 2,191 985
EBIT 4,887 2,851 71
Interest 818 262
EBT(exc other income) 4,069 2,589
Other Income 606 300
EBT 4,675 2,888 62
Tax 1,486 928
Tax Rate (%) 31.8% 32.1%
PAT 3,190 1,960
Net Profit 3,190 1,960 63
NPM (%) 8.6% 11.9%
Equity Capital 2,740.2 1,244.9
EPS (Rs) 11.6 15.7
Source: Company
Summary table
(Rs mn) FY10 FY11E FY12E
Sales 70,497 130,628 163,577Growth (%) 10 85 25EBITDA 19,711 24,042 34,898EBITDA margin (%) 28.0 18.4 21.3PBT 13,615 15,691 24,869Net profit 10,932 10,827 17,159EPS (Rs) 87.8 39.5 62.6Growth (%) 12 -55 58CEPS(Rs) 104.4 67.6 94.5BV (Rs/share) 336.1 370.5 428.0Dividend/share(Rs) 5.0 4.4 4.4ROE (%) 26.6 11.2 15.7ROCE (%) 28.5 13.2 17.8Net cash (debt) (15,208) (41,013) (41,418)NW Capital (Days) 27.3 32.2 32.2EV/Sales (x) 1.8 2.2 1.9EV/EBITDA (x) 6.3 12.2 9.1P/E (x) 11.4 25.4 16.0P/BV (x) 2.7 2.7 2.3
Source: Company, Kotak Securities - PrivateClient Research
RESULT UPDATE
Teena [email protected]+91 22 6621 6302
Kotak Securities - Private Client Research Please see the disclaimer on the last page For Private Circulation 6
MORNING INSIGHT January 28, 2011
Revenues in line with our estimatesn Ultratech Cements' financials for Q3FY11 are not comparable with corresponding
quarter last year due to merger of Samruddhi Cements with itself.
n Dispatches of the company on a consolidated basis stood at 10.55MT forQ3FY11 and it includes dispatches of Star Cement also. Grey cement volumes in-cluding stood at 9.34MT, clinker volumes at 0.46MT and white cement volumesstood at 0.143 MT. Star Cement volumes stood at 0.75MT and is expected toimprove going forward. Dispatches in the current quarter were impacted by lowdemand growth in various regions. Dispatches were also impacted by retreatingmonsoons in the southern region during Q3FY11.
n Cement realizations witnessed an improvement of 8.5% QoQ and grey cementrealizations stood at Rs 3279 per tonne vs Rs 3021 per tonne in Q2FY11. Blendedrealizations for Q3FY11 stood at Rs 3522 per tonne. Blended realizations aremuch higher than pure grey cement realizations due to higher realizations ofwhite cement.
n Ultratech Cements has earmarked a capex of Rs 100 bn to be spent over next 3years on setting up of additional clinkerisation plants at Chattisgarh andKarnataka along with grinding units and bulk terminal across various states. Outof this capex of Rs 100 bn, Rs 26 bn is expected to be spent on augmentation ofgrinding capacity in Gujarat, installation of waste heat recovery system as well assetting up for packaging terminals across locations. For setting up new capaci-ties, company has earmarked a capex of Rs 56 bn and remaining amount is ex-pected to be spent on logistical infrastructure.
n We continue to expect cement prices to remain under pressure going forwarddue to incremental supplies coupled with lower than expected demand growth.Recently, cement prices were hiked by Rs 10-15 per bag in most of the regionsbut sustainability of these price hikes may remain difficult. Our belief of non-sustainability of these prices hikes comes from the fact that past price hikes seenin March 2010 and August 2010 could not remain sustainable in correspondingmonths of May 2010 as well as Oct 2010 due to demand slowdown as well asaddition of supplies.
n We maintain our estimates and expect dispatches of 35.8 MT and 42.9 MT forFY11 and FY12 respectively for the company. Correspondingly, we expect rev-enues to Rs 131 bn and Rs 164 bn for FY11 and FY12 respectively.
Operating margins improved sequentiallyn Operating margins stood at 19.1% for Q3FY11, in line with our estimates. Mar-
gins are down on yearly basis due to increase in power and fuel, freight andother expenditure.
n On a sequential basis, margins have improved due to improvement in cementrealizations. EBITDA/tonne for Q3FY11 stood at Rs 671 as against Rs 444 inQ2FY11.
n Power and fuel cost, though declined marginally, may continue to remain highgoing forward due to steep increase in prices of imported coal. But company hasindicated that they have secured arrangements for Q4FY11 for coal at nearly$125 per tonne.
n We maintain our estimates and on a consolidated basis, we expect EBITDA mar-gins to be 21.3% and 26.6% for FY11 and FY12 respectively.
Kotak Securities - Private Client Research Please see the disclaimer on the last page For Private Circulation 7
MORNING INSIGHT January 28, 2011
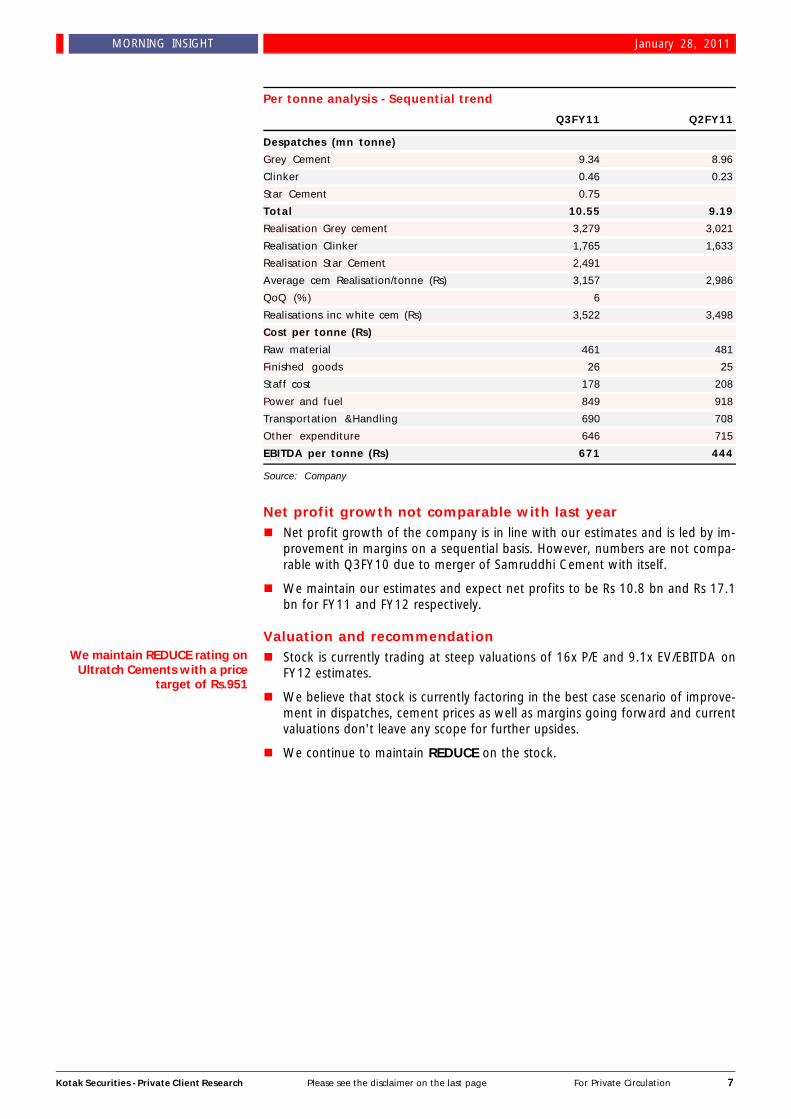
Per tonne analysis - Sequential trend
Q3FY11 Q2FY11
Despatches (mn tonne)
Grey Cement 9.34 8.96
Clinker 0.46 0.23
Star Cement 0.75
Total 10.55 9.19
Realisation Grey cement 3,279 3,021
Realisation Clinker 1,765 1,633
Realisation Star Cement 2,491
Average cem Realisation/tonne (Rs) 3,157 2,986
QoQ (%) 6
Realisations inc white cem (Rs) 3,522 3,498
Cost per tonne (Rs)
Raw material 461 481
Finished goods 26 25
Staff cost 178 208
Power and fuel 849 918
Transportation &Handling 690 708
Other expenditure 646 715
EBITDA per tonne (Rs) 671 444
Source: Company
Net profit growth not comparable with last yearn Net profit growth of the company is in line with our estimates and is led by im-
provement in margins on a sequential basis. However, numbers are not compa-rable with Q3FY10 due to merger of Samruddhi Cement with itself.
n We maintain our estimates and expect net profits to be Rs 10.8 bn and Rs 17.1bn for FY11 and FY12 respectively.
Valuation and recommendationn Stock is currently trading at steep valuations of 16x P/E and 9.1x EV/EBITDA on
FY12 estimates.
n We believe that stock is currently factoring in the best case scenario of improve-ment in dispatches, cement prices as well as margins going forward and currentvaluations don't leave any scope for further upsides.
n We continue to maintain REDUCE on the stock.
We maintain REDUCE rating onUltratch Cements with a price
target of Rs.951
Kotak Securities - Private Client Research Please see the disclaimer on the last page For Private Circulation 8
MORNING INSIGHT January 28, 2011
RESULT UPDATE
Teena [email protected]+91 22 6621 6302
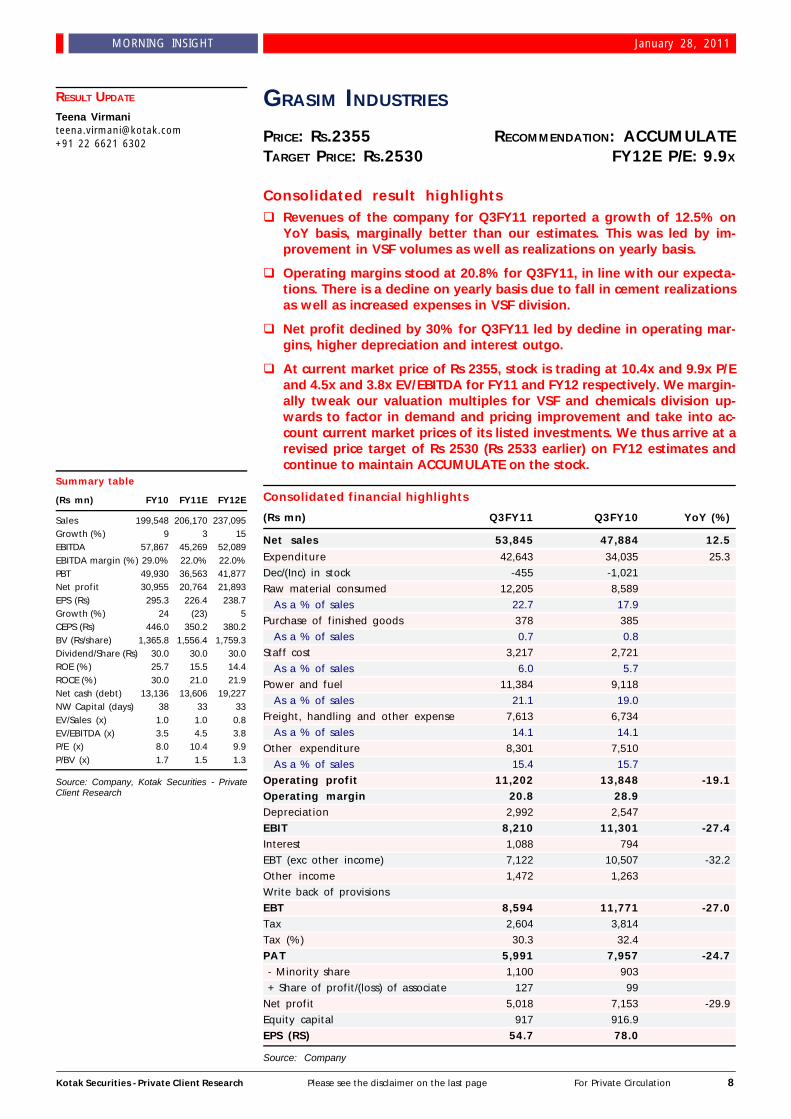
GRASIM INDUSTRIES
PRICE: RS.2355 RECOMMENDATION: ACCUMULATETARGET PRICE: RS.2530 FY12E P/E: 9.9X
Consolidated result highlightsq Revenues of the company for Q3FY11 reported a growth of 12.5% on
YoY basis, marginally better than our estimates. This was led by im-provement in VSF volumes as well as realizations on yearly basis.
q Operating margins stood at 20.8% for Q3FY11, in line with our expecta-tions. There is a decline on yearly basis due to fall in cement realizationsas well as increased expenses in VSF division.
q Net profit declined by 30% for Q3FY11 led by decline in operating mar-gins, higher depreciation and interest outgo.
q At current market price of Rs 2355, stock is trading at 10.4x and 9.9x P/Eand 4.5x and 3.8x EV/EBITDA for FY11 and FY12 respectively. We margin-ally tweak our valuation multiples for VSF and chemicals division up-wards to factor in demand and pricing improvement and take into ac-count current market prices of its listed investments. We thus arrive at arevised price target of Rs 2530 (Rs 2533 earlier) on FY12 estimates andcontinue to maintain ACCUMULATE on the stock.
Consolidated financial highlights
(Rs mn) Q3FY11 Q3FY10 YoY (%)
Net sales 53,845 47,884 12.5
Expenditure 42,643 34,035 25.3
Dec/(Inc) in stock -455 -1,021
Raw material consumed 12,205 8,589
As a % of sales 22.7 17.9
Purchase of finished goods 378 385
As a % of sales 0.7 0.8
Staff cost 3,217 2,721
As a % of sales 6.0 5.7
Power and fuel 11,384 9,118
As a % of sales 21.1 19.0
Freight, handling and other expense 7,613 6,734
As a % of sales 14.1 14.1
Other expenditure 8,301 7,510
As a % of sales 15.4 15.7
Operating profit 11,202 13,848 -19.1Operating margin 20.8 28.9Depreciation 2,992 2,547
EBIT 8,210 11,301 -27.4Interest 1,088 794
EBT (exc other income) 7,122 10,507 -32.2
Other income 1,472 1,263
Write back of provisions
EBT 8,594 11,771 -27.0Tax 2,604 3,814
Tax (%) 30.3 32.4
PAT 5,991 7,957 -24.7 - Minority share 1,100 903
+ Share of profit/(loss) of associate 127 99
Net profit 5,018 7,153 -29.9
Equity capital 917 916.9
EPS (RS) 54.7 78.0
Source: Company
Summary table
(Rs mn) FY10 FY11E FY12E
Sales 199,548 206,170 237,095Growth (%) 9 3 15EBITDA 57,867 45,269 52,089EBITDA margin (%) 29.0% 22.0% 22.0%PBT 49,930 36,563 41,877Net profit 30,955 20,764 21,893EPS (Rs) 295.3 226.4 238.7Growth (%) 24 (23) 5CEPS (Rs) 446.0 350.2 380.2BV (Rs/share) 1,365.8 1,556.4 1,759.3Dividend/Share (Rs) 30.0 30.0 30.0ROE (%) 25.7 15.5 14.4ROCE (%) 30.0 21.0 21.9Net cash (debt) 13,136 13,606 19,227NW Capital (days) 38 33 33EV/Sales (x) 1.0 1.0 0.8EV/EBITDA (x) 3.5 4.5 3.8P/E (x) 8.0 10.4 9.9P/BV (x) 1.7 1.5 1.3
Source: Company, Kotak Securities - PrivateClient Research
Kotak Securities - Private Client Research Please see the disclaimer on the last page For Private Circulation 9
MORNING INSIGHT January 28, 2011
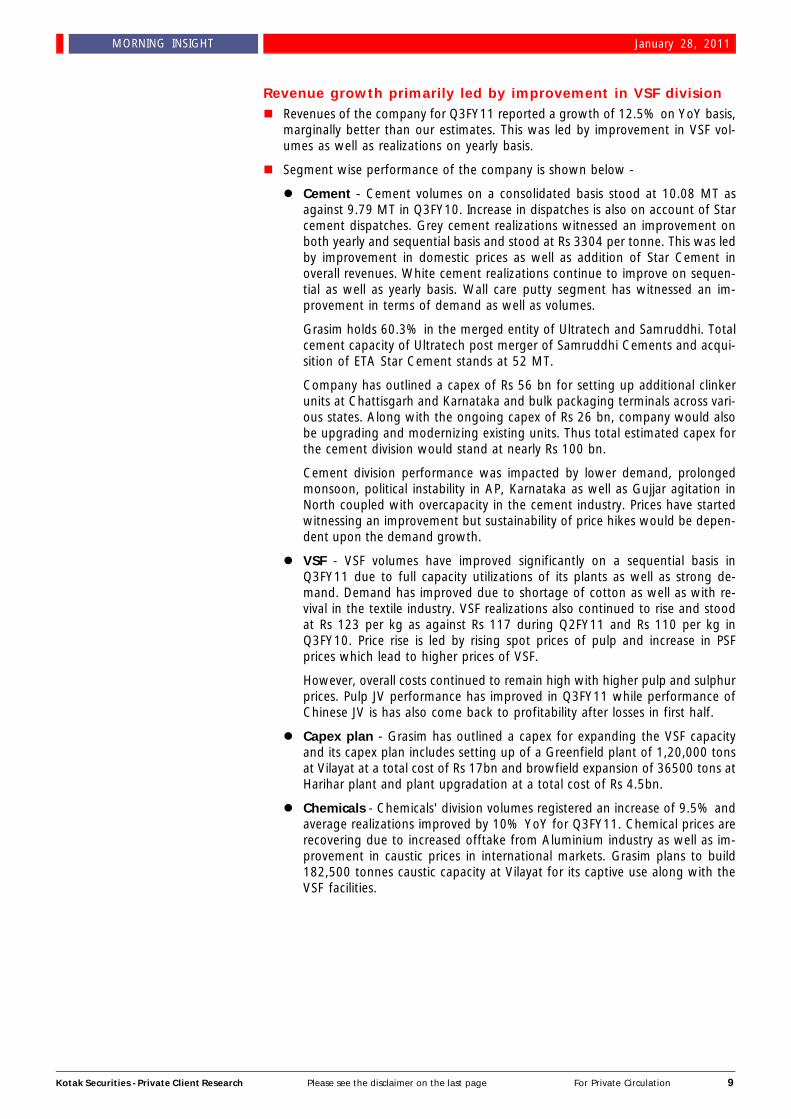
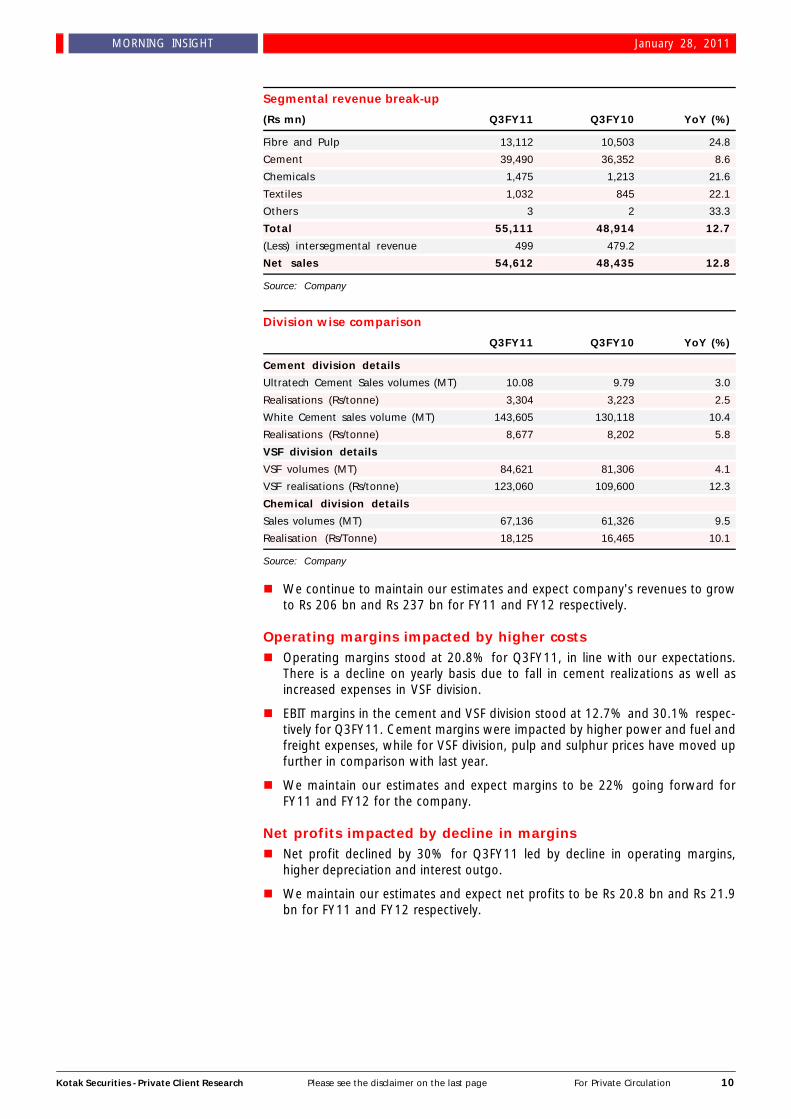
Revenue growth primarily led by improvement in VSF divisionn Revenues of the company for Q3FY11 reported a growth of 12.5% on YoY basis,
marginally better than our estimates. This was led by improvement in VSF vol-umes as well as realizations on yearly basis.
n Segment wise performance of the company is shown below -
l Cement - Cement volumes on a consolidated basis stood at 10.08 MT asagainst 9.79 MT in Q3FY10. Increase in dispatches is also on account of Starcement dispatches. Grey cement realizations witnessed an improvement onboth yearly and sequential basis and stood at Rs 3304 per tonne. This was ledby improvement in domestic prices as well as addition of Star Cement inoverall revenues. White cement realizations continue to improve on sequen-tial as well as yearly basis. Wall care putty segment has witnessed an im-provement in terms of demand as well as volumes.
Grasim holds 60.3% in the merged entity of Ultratech and Samruddhi. Totalcement capacity of Ultratech post merger of Samruddhi Cements and acqui-sition of ETA Star Cement stands at 52 MT.
Company has outlined a capex of Rs 56 bn for setting up additional clinkerunits at Chattisgarh and Karnataka and bulk packaging terminals across vari-ous states. Along with the ongoing capex of Rs 26 bn, company would alsobe upgrading and modernizing existing units. Thus total estimated capex forthe cement division would stand at nearly Rs 100 bn.
Cement division performance was impacted by lower demand, prolongedmonsoon, political instability in AP, Karnataka as well as Gujjar agitation inNorth coupled with overcapacity in the cement industry. Prices have startedwitnessing an improvement but sustainability of price hikes would be depen-dent upon the demand growth.
l VSF - VSF volumes have improved significantly on a sequential basis inQ3FY11 due to full capacity utilizations of its plants as well as strong de-mand. Demand has improved due to shortage of cotton as well as with re-vival in the textile industry. VSF realizations also continued to rise and stoodat Rs 123 per kg as against Rs 117 during Q2FY11 and Rs 110 per kg inQ3FY10. Price rise is led by rising spot prices of pulp and increase in PSFprices which lead to higher prices of VSF.
However, overall costs continued to remain high with higher pulp and sulphurprices. Pulp JV performance has improved in Q3FY11 while performance ofChinese JV is has also come back to profitability after losses in first half.
l Capex plan - Grasim has outlined a capex for expanding the VSF capacityand its capex plan includes setting up of a Greenfield plant of 1,20,000 tonsat Vilayat at a total cost of Rs 17bn and browfield expansion of 36500 tons atHarihar plant and plant upgradation at a total cost of Rs 4.5bn.
l Chemicals - Chemicals' division volumes registered an increase of 9.5% andaverage realizations improved by 10% YoY for Q3FY11. Chemical prices arerecovering due to increased offtake from Aluminium industry as well as im-provement in caustic prices in international markets. Grasim plans to build182,500 tonnes caustic capacity at Vilayat for its captive use along with theVSF facilities.
Kotak Securities - Private Client Research Please see the disclaimer on the last page For Private Circulation 10
MORNING INSIGHT January 28, 2011
Segmental revenue break-up
(Rs mn) Q3FY11 Q3FY10 YoY (%)
Fibre and Pulp 13,112 10,503 24.8
Cement 39,490 36,352 8.6
Chemicals 1,475 1,213 21.6
Textiles 1,032 845 22.1
Others 3 2 33.3
Total 55,111 48,914 12.7
(Less) intersegmental revenue 499 479.2
Net sales 54,612 48,435 12.8
Source: Company
Division wise comparison
Q3FY11 Q3FY10 YoY (%)
Cement division details
Ultratech Cement Sales volumes (MT) 10.08 9.79 3.0
Realisations (Rs/tonne) 3,304 3,223 2.5
White Cement sales volume (MT) 143,605 130,118 10.4
Realisations (Rs/tonne) 8,677 8,202 5.8
VSF division details
VSF volumes (MT) 84,621 81,306 4.1
VSF realisations (Rs/tonne) 123,060 109,600 12.3
Chemical division details
Sales volumes (MT) 67,136 61,326 9.5
Realisation (Rs/Tonne) 18,125 16,465 10.1
Source: Company
n We continue to maintain our estimates and expect company's revenues to growto Rs 206 bn and Rs 237 bn for FY11 and FY12 respectively.
Operating margins impacted by higher costsn Operating margins stood at 20.8% for Q3FY11, in line with our expectations.
There is a decline on yearly basis due to fall in cement realizations as well asincreased expenses in VSF division.
n EBIT margins in the cement and VSF division stood at 12.7% and 30.1% respec-tively for Q3FY11. Cement margins were impacted by higher power and fuel andfreight expenses, while for VSF division, pulp and sulphur prices have moved upfurther in comparison with last year.
n We maintain our estimates and expect margins to be 22% going forward forFY11 and FY12 for the company.
Net profits impacted by decline in marginsn Net profit declined by 30% for Q3FY11 led by decline in operating margins,
higher depreciation and interest outgo.
n We maintain our estimates and expect net profits to be Rs 20.8 bn and Rs 21.9bn for FY11 and FY12 respectively.
Kotak Securities - Private Client Research Please see the disclaimer on the last page For Private Circulation 11
MORNING INSIGHT January 28, 2011
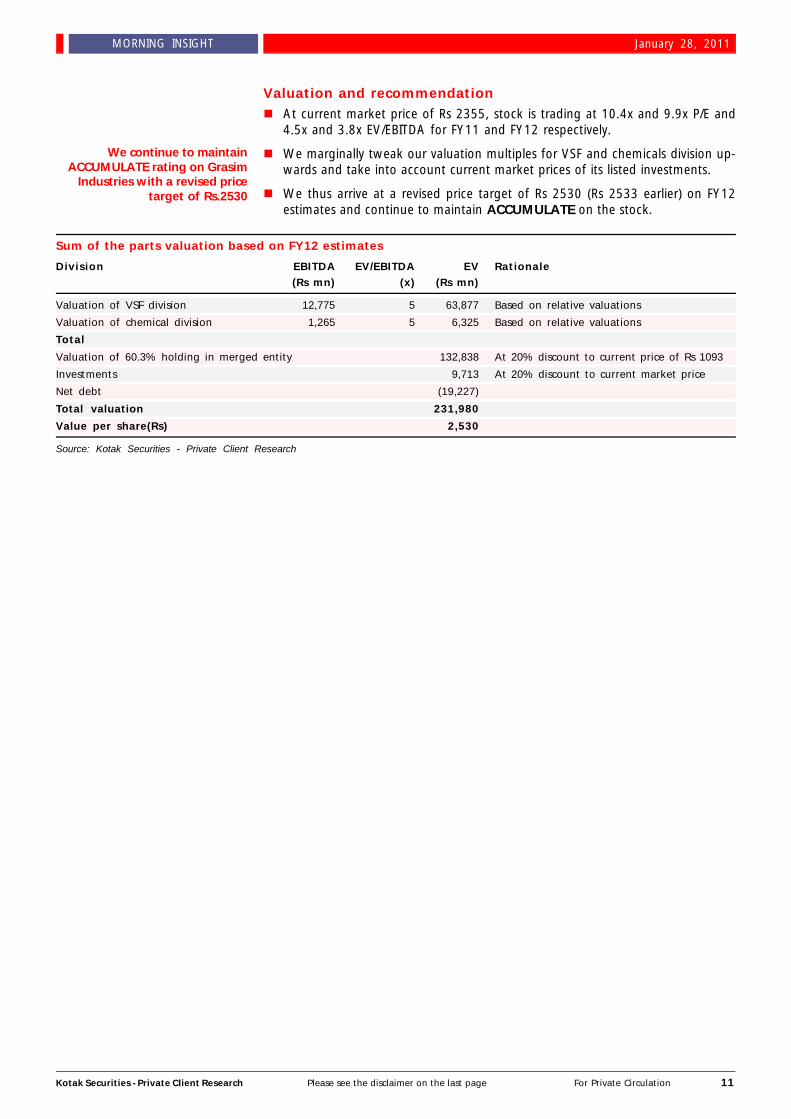
Valuation and recommendationn At current market price of Rs 2355, stock is trading at 10.4x and 9.9x P/E and
4.5x and 3.8x EV/EBITDA for FY11 and FY12 respectively.
n We marginally tweak our valuation multiples for VSF and chemicals division up-wards and take into account current market prices of its listed investments.
n We thus arrive at a revised price target of Rs 2530 (Rs 2533 earlier) on FY12estimates and continue to maintain ACCUMULATE on the stock.
Sum of the parts valuation based on FY12 estimates
Division EBITDA EV/EBITDA EV Rationale(Rs mn) (x) (Rs mn)
Valuation of VSF division 12,775 5 63,877 Based on relative valuations
Valuation of chemical division 1,265 5 6,325 Based on relative valuations
Total
Valuation of 60.3% holding in merged entity 132,838 At 20% discount to current price of Rs 1093
Investments 9,713 At 20% discount to current market price
Net debt (19,227)
Total valuation 231,980
Value per share(Rs) 2,530
Source: Kotak Securities - Private Client Research
We continue to maintainACCUMULATE rating on Grasim
Industries with a revised pricetarget of Rs.2530
Kotak Securities - Private Client Research Please see the disclaimer on the last page For Private Circulation 12
MORNING INSIGHT January 28, 2011
BLUE STAR LTD
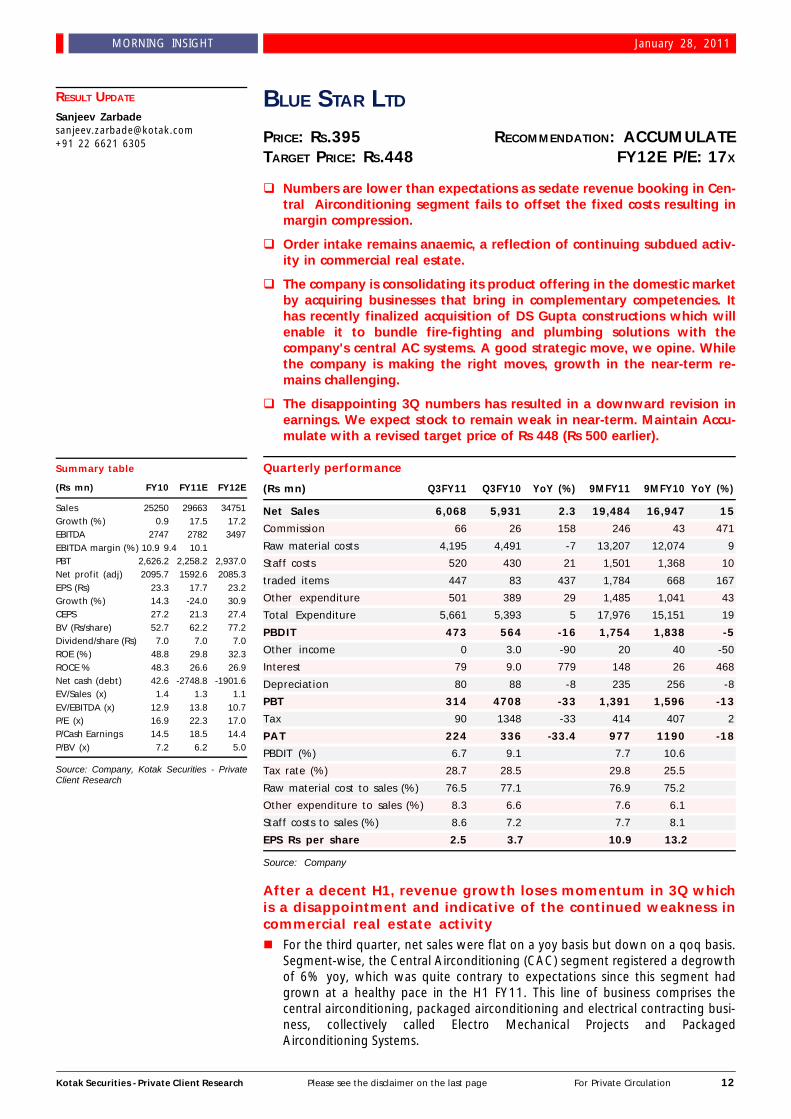
PRICE: RS.395 RECOMMENDATION: ACCUMULATETARGET PRICE: RS.448 FY12E P/E: 17X
q Numbers are lower than expectations as sedate revenue booking in Cen-tral Airconditioning segment fails to offset the fixed costs resulting inmargin compression.
q Order intake remains anaemic, a reflection of continuing subdued activ-ity in commercial real estate.
q The company is consolidating its product offering in the domestic marketby acquiring businesses that bring in complementary competencies. Ithas recently finalized acquisition of DS Gupta constructions which willenable it to bundle fire-fighting and plumbing solutions with thecompany's central AC systems. A good strategic move, we opine. Whilethe company is making the right moves, growth in the near-term re-mains challenging.
q The disappointing 3Q numbers has resulted in a downward revision inearnings. We expect stock to remain weak in near-term. Maintain Accu-mulate with a revised target price of Rs 448 (Rs 500 earlier).
Quarterly performance
(Rs mn) Q3FY11 Q3FY10 YoY (%) 9MFY11 9MFY10 YoY (%)
Net Sales 6,068 5,931 2.3 19,484 16,947 15
Commission 66 26 158 246 43 471
Raw material costs 4,195 4,491 -7 13,207 12,074 9
Staff costs 520 430 21 1,501 1,368 10
traded items 447 83 437 1,784 668 167
Other expenditure 501 389 29 1,485 1,041 43
Total Expenditure 5,661 5,393 5 17,976 15,151 19
PBDIT 473 564 -16 1,754 1,838 -5
Other income 0 3.0 -90 20 40 -50
Interest 79 9.0 779 148 26 468
Depreciation 80 88 -8 235 256 -8
PBT 314 4708 -33 1,391 1,596 -13
Tax 90 1348 -33 414 407 2
PAT 224 336 -33.4 977 1190 -18
PBDIT (%) 6.7 9.1 7.7 10.6
Tax rate (%) 28.7 28.5 29.8 25.5
Raw material cost to sales (%) 76.5 77.1 76.9 75.2
Other expenditure to sales (%) 8.3 6.6 7.6 6.1
Staff costs to sales (%) 8.6 7.2 7.7 8.1
EPS Rs per share 2.5 3.7 10.9 13.2
Source: Company
After a decent H1, revenue growth loses momentum in 3Q whichis a disappointment and indicative of the continued weakness incommercial real estate activityn For the third quarter, net sales were flat on a yoy basis but down on a qoq basis.
Segment-wise, the Central Airconditioning (CAC) segment registered a degrowthof 6% yoy, which was quite contrary to expectations since this segment hadgrown at a healthy pace in the H1 FY11. This line of business comprises thecentral airconditioning, packaged airconditioning and electrical contracting busi-ness, collectively called Electro Mechanical Projects and PackagedAirconditioning Systems.
Summary table
(Rs mn) FY10 FY11E FY12E
Sales 25250 29663 34751Growth (%) 0.9 17.5 17.2EBITDA 2747 2782 3497EBITDA margin (%) 10.9 9.4 10.1PBT 2,626.2 2,258.2 2,937.0Net profit (adj) 2095.7 1592.6 2085.3EPS (Rs) 23.3 17.7 23.2Growth (%) 14.3 -24.0 30.9CEPS 27.2 21.3 27.4BV (Rs/share) 52.7 62.2 77.2Dividend/share (Rs) 7.0 7.0 7.0ROE (%) 48.8 29.8 32.3ROCE % 48.3 26.6 26.9Net cash (debt) 42.6 -2748.8 -1901.6EV/Sales (x) 1.4 1.3 1.1EV/EBITDA (x) 12.9 13.8 10.7P/E (x) 16.9 22.3 17.0P/Cash Earnings 14.5 18.5 14.4P/BV (x) 7.2 6.2 5.0
Source: Company, Kotak Securities - PrivateClient Research
RESULT UPDATE
Sanjeev [email protected]+91 22 6621 6305
Kotak Securities - Private Client Research Please see the disclaimer on the last page For Private Circulation 13
MORNING INSIGHT January 28, 2011
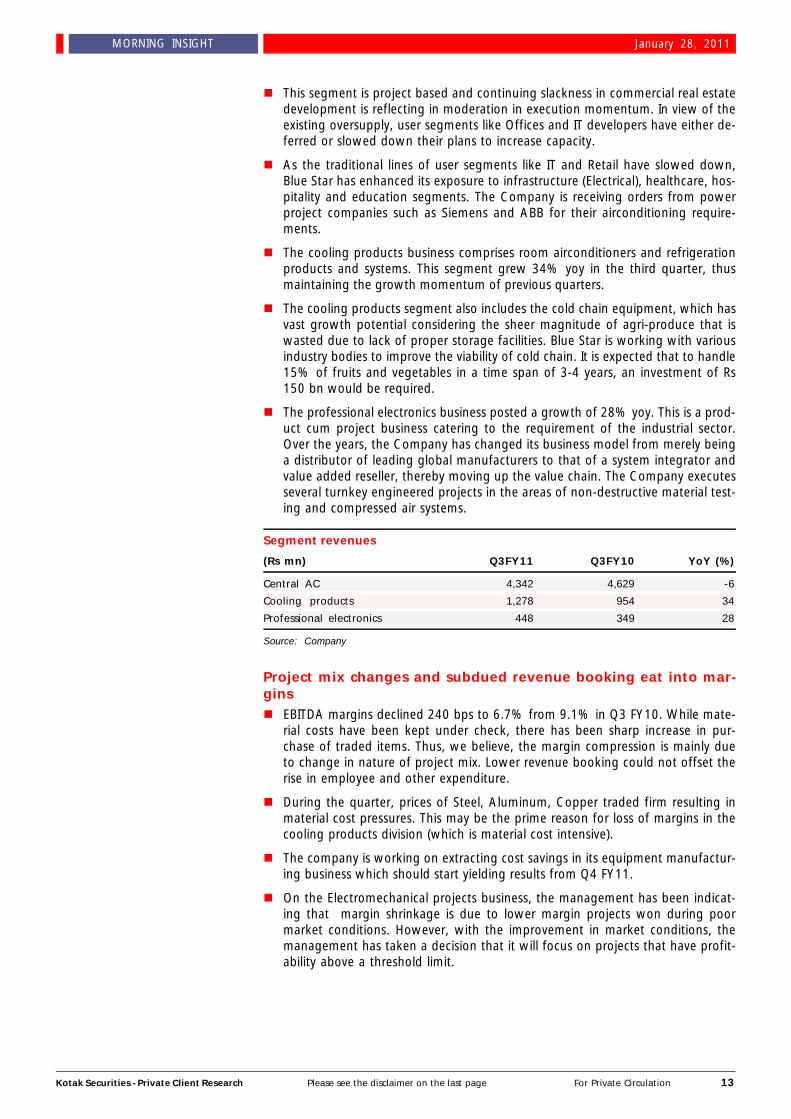
n This segment is project based and continuing slackness in commercial real estatedevelopment is reflecting in moderation in execution momentum. In view of theexisting oversupply, user segments like Offices and IT developers have either de-ferred or slowed down their plans to increase capacity.
n As the traditional lines of user segments like IT and Retail have slowed down,Blue Star has enhanced its exposure to infrastructure (Electrical), healthcare, hos-pitality and education segments. The Company is receiving orders from powerproject companies such as Siemens and ABB for their airconditioning require-ments.
n The cooling products business comprises room airconditioners and refrigerationproducts and systems. This segment grew 34% yoy in the third quarter, thusmaintaining the growth momentum of previous quarters.
n The cooling products segment also includes the cold chain equipment, which hasvast growth potential considering the sheer magnitude of agri-produce that iswasted due to lack of proper storage facilities. Blue Star is working with variousindustry bodies to improve the viability of cold chain. It is expected that to handle15% of fruits and vegetables in a time span of 3-4 years, an investment of Rs150 bn would be required.
n The professional electronics business posted a growth of 28% yoy. This is a prod-uct cum project business catering to the requirement of the industrial sector.Over the years, the Company has changed its business model from merely beinga distributor of leading global manufacturers to that of a system integrator andvalue added reseller, thereby moving up the value chain. The Company executesseveral turnkey engineered projects in the areas of non-destructive material test-ing and compressed air systems.
Segment revenues
(Rs mn) Q3FY11 Q3FY10 YoY (%)
Central AC 4,342 4,629 -6
Cooling products 1,278 954 34
Professional electronics 448 349 28
Source: Company
Project mix changes and subdued revenue booking eat into mar-ginsn EBITDA margins declined 240 bps to 6.7% from 9.1% in Q3 FY10. While mate-
rial costs have been kept under check, there has been sharp increase in pur-chase of traded items. Thus, we believe, the margin compression is mainly dueto change in nature of project mix. Lower revenue booking could not offset therise in employee and other expenditure.
n During the quarter, prices of Steel, Aluminum, Copper traded firm resulting inmaterial cost pressures. This may be the prime reason for loss of margins in thecooling products division (which is material cost intensive).
n The company is working on extracting cost savings in its equipment manufactur-ing business which should start yielding results from Q4 FY11.
n On the Electromechanical projects business, the management has been indicat-ing that margin shrinkage is due to lower margin projects won during poormarket conditions. However, with the improvement in market conditions, themanagement has taken a decision that it will focus on projects that have profit-ability above a threshold limit.
Kotak Securities - Private Client Research Please see the disclaimer on the last page For Private Circulation 14
MORNING INSIGHT January 28, 2011
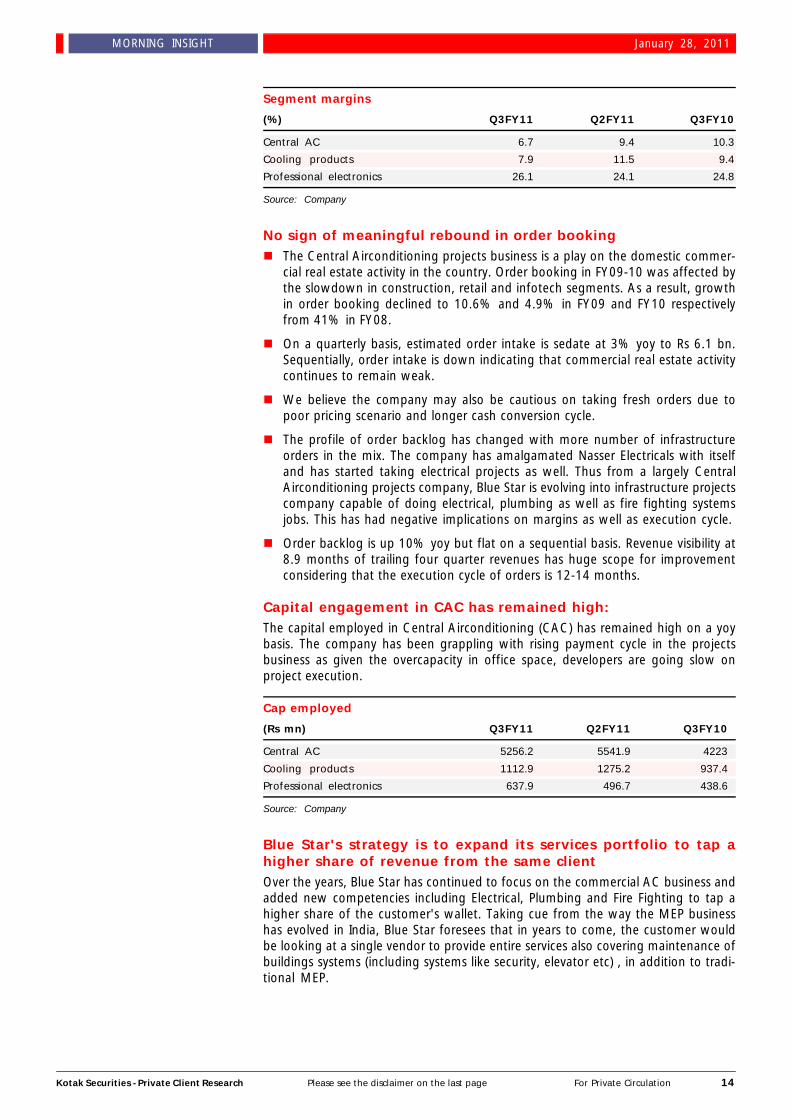
Segment margins
(%) Q3FY11 Q2FY11 Q3FY10
Central AC 6.7 9.4 10.3
Cooling products 7.9 11.5 9.4
Professional electronics 26.1 24.1 24.8
Source: Company
No sign of meaningful rebound in order bookingn The Central Airconditioning projects business is a play on the domestic commer-
cial real estate activity in the country. Order booking in FY09-10 was affected bythe slowdown in construction, retail and infotech segments. As a result, growthin order booking declined to 10.6% and 4.9% in FY09 and FY10 respectivelyfrom 41% in FY08.
n On a quarterly basis, estimated order intake is sedate at 3% yoy to Rs 6.1 bn.Sequentially, order intake is down indicating that commercial real estate activitycontinues to remain weak.
n We believe the company may also be cautious on taking fresh orders due topoor pricing scenario and longer cash conversion cycle.
n The profile of order backlog has changed with more number of infrastructureorders in the mix. The company has amalgamated Nasser Electricals with itselfand has started taking electrical projects as well. Thus from a largely CentralAirconditioning projects company, Blue Star is evolving into infrastructure projectscompany capable of doing electrical, plumbing as well as fire fighting systemsjobs. This has had negative implications on margins as well as execution cycle.
n Order backlog is up 10% yoy but flat on a sequential basis. Revenue visibility at8.9 months of trailing four quarter revenues has huge scope for improvementconsidering that the execution cycle of orders is 12-14 months.
Capital engagement in CAC has remained high:The capital employed in Central Airconditioning (CAC) has remained high on a yoybasis. The company has been grappling with rising payment cycle in the projectsbusiness as given the overcapacity in office space, developers are going slow onproject execution.
Cap employed
(Rs mn) Q3FY11 Q2FY11 Q3FY10
Central AC 5256.2 5541.9 4223
Cooling products 1112.9 1275.2 937.4
Professional electronics 637.9 496.7 438.6
Source: Company
Blue Star's strategy is to expand its services portfolio to tap ahigher share of revenue from the same clientOver the years, Blue Star has continued to focus on the commercial AC business andadded new competencies including Electrical, Plumbing and Fire Fighting to tap ahigher share of the customer's wallet. Taking cue from the way the MEP businesshas evolved in India, Blue Star foresees that in years to come, the customer wouldbe looking at a single vendor to provide entire services also covering maintenance ofbuildings systems (including systems like security, elevator etc) , in addition to tradi-tional MEP.
Kotak Securities - Private Client Research Please see the disclaimer on the last page For Private Circulation 15
MORNING INSIGHT January 28, 2011
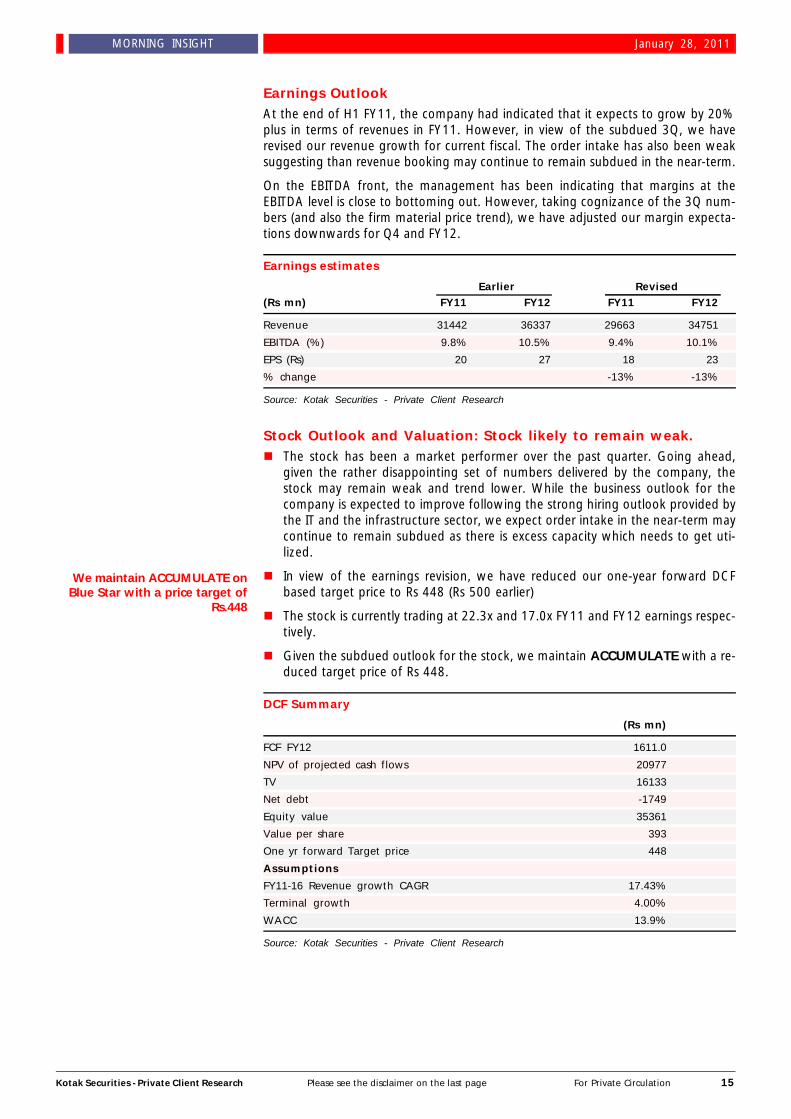
Earnings OutlookAt the end of H1 FY11, the company had indicated that it expects to grow by 20%plus in terms of revenues in FY11. However, in view of the subdued 3Q, we haverevised our revenue growth for current fiscal. The order intake has also been weaksuggesting than revenue booking may continue to remain subdued in the near-term.
On the EBITDA front, the management has been indicating that margins at theEBITDA level is close to bottoming out. However, taking cognizance of the 3Q num-bers (and also the firm material price trend), we have adjusted our margin expecta-tions downwards for Q4 and FY12.
Earnings estimates
Earlier Revised(Rs mn) FY11 FY12 FY11 FY12
Revenue 31442 36337 29663 34751
EBITDA (%) 9.8% 10.5% 9.4% 10.1%
EPS (Rs) 20 27 18 23
% change -13% -13%
Source: Kotak Securities - Private Client Research
Stock Outlook and Valuation: Stock likely to remain weak.n The stock has been a market performer over the past quarter. Going ahead,
given the rather disappointing set of numbers delivered by the company, thestock may remain weak and trend lower. While the business outlook for thecompany is expected to improve following the strong hiring outlook provided bythe IT and the infrastructure sector, we expect order intake in the near-term maycontinue to remain subdued as there is excess capacity which needs to get uti-lized.
n In view of the earnings revision, we have reduced our one-year forward DCFbased target price to Rs 448 (Rs 500 earlier)
n The stock is currently trading at 22.3x and 17.0x FY11 and FY12 earnings respec-tively.
n Given the subdued outlook for the stock, we maintain ACCUMULATE with a re-duced target price of Rs 448.
DCF Summary
(Rs mn)
FCF FY12 1611.0
NPV of projected cash flows 20977
TV 16133
Net debt -1749
Equity value 35361
Value per share 393
One yr forward Target price 448
Assumptions
FY11-16 Revenue growth CAGR 17.43%
Terminal growth 4.00%
WACC 13.9%
Source: Kotak Securities - Private Client Research
We maintain ACCUMULATE onBlue Star with a price target of
Rs.448
Kotak Securities - Private Client Research Please see the disclaimer on the last page For Private Circulation 16
MORNING INSIGHT January 28, 2011
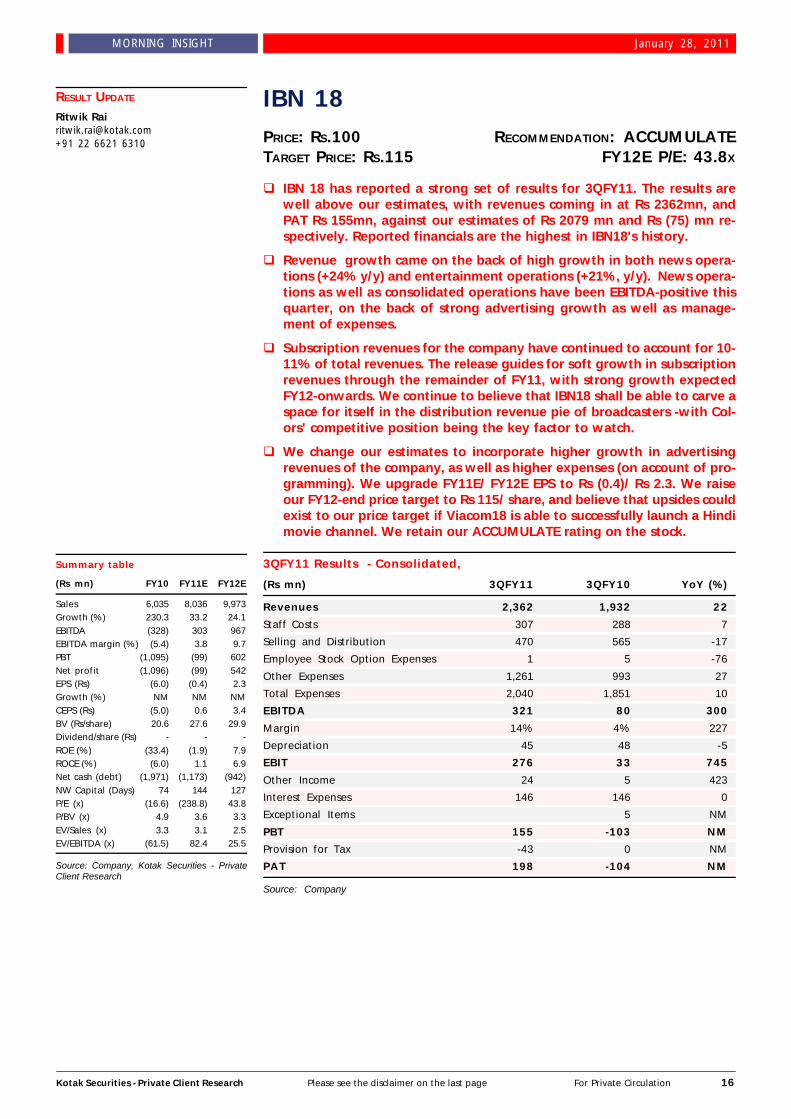
IBN 18PRICE: RS.100 RECOMMENDATION: ACCUMULATETARGET PRICE: RS.115 FY12E P/E: 43.8X
q IBN 18 has reported a strong set of results for 3QFY11. The results arewell above our estimates, with revenues coming in at Rs 2362mn, andPAT Rs 155mn, against our estimates of Rs 2079 mn and Rs (75) mn re-spectively. Reported financials are the highest in IBN18's history.
q Revenue growth came on the back of high growth in both news opera-tions (+24% y/y) and entertainment operations (+21%, y/y). News opera-tions as well as consolidated operations have been EBITDA-positive thisquarter, on the back of strong advertising growth as well as manage-ment of expenses.
q Subscription revenues for the company have continued to account for 10-11% of total revenues. The release guides for soft growth in subscriptionrevenues through the remainder of FY11, with strong growth expectedFY12-onwards. We continue to believe that IBN18 shall be able to carve aspace for itself in the distribution revenue pie of broadcasters -with Col-ors' competitive position being the key factor to watch.
q We change our estimates to incorporate higher growth in advertisingrevenues of the company, as well as higher expenses (on account of pro-gramming). We upgrade FY11E/ FY12E EPS to Rs (0.4)/ Rs 2.3. We raiseour FY12-end price target to Rs 115/ share, and believe that upsides couldexist to our price target if Viacom18 is able to successfully launch a Hindimovie channel. We retain our ACCUMULATE rating on the stock.
3QFY11 Results - Consolidated,
(Rs mn) 3QFY11 3QFY10 YoY (%)
Revenues 2,362 1,932 22
Staff Costs 307 288 7
Selling and Distribution 470 565 -17
Employee Stock Option Expenses 1 5 -76
Other Expenses 1,261 993 27
Total Expenses 2,040 1,851 10
EBITDA 321 80 300
Margin 14% 4% 227
Depreciation 45 48 -5
EBIT 276 33 745
Other Income 24 5 423
Interest Expenses 146 146 0
Exceptional Items 5 NM
PBT 155 -103 NM
Provision for Tax -43 0 NM
PAT 198 -104 NM
Source: Company
Summary table
(Rs mn) FY10 FY11E FY12E
Sales 6,035 8,036 9,973Growth (%) 230.3 33.2 24.1EBITDA (328) 303 967EBITDA margin (%) (5.4) 3.8 9.7PBT (1,095) (99) 602Net profit (1,096) (99) 542EPS (Rs) (6.0) (0.4) 2.3Growth (%) NM NM NMCEPS (Rs) (5.0) 0.6 3.4BV (Rs/share) 20.6 27.6 29.9Dividend/share (Rs) - - -ROE (%) (33.4) (1.9) 7.9ROCE (%) (6.0) 1.1 6.9Net cash (debt) (1,971) (1,173) (942)NW Capital (Days) 74 144 127P/E (x) (16.6) (238.8) 43.8P/BV (x) 4.9 3.6 3.3EV/Sales (x) 3.3 3.1 2.5EV/EBITDA (x) (61.5) 82.4 25.5
Source: Company, Kotak Securities - PrivateClient Research
RESULT UPDATE
Ritwik [email protected]+91 22 6621 6310
Kotak Securities - Private Client Research Please see the disclaimer on the last page For Private Circulation 17
MORNING INSIGHT January 28, 2011
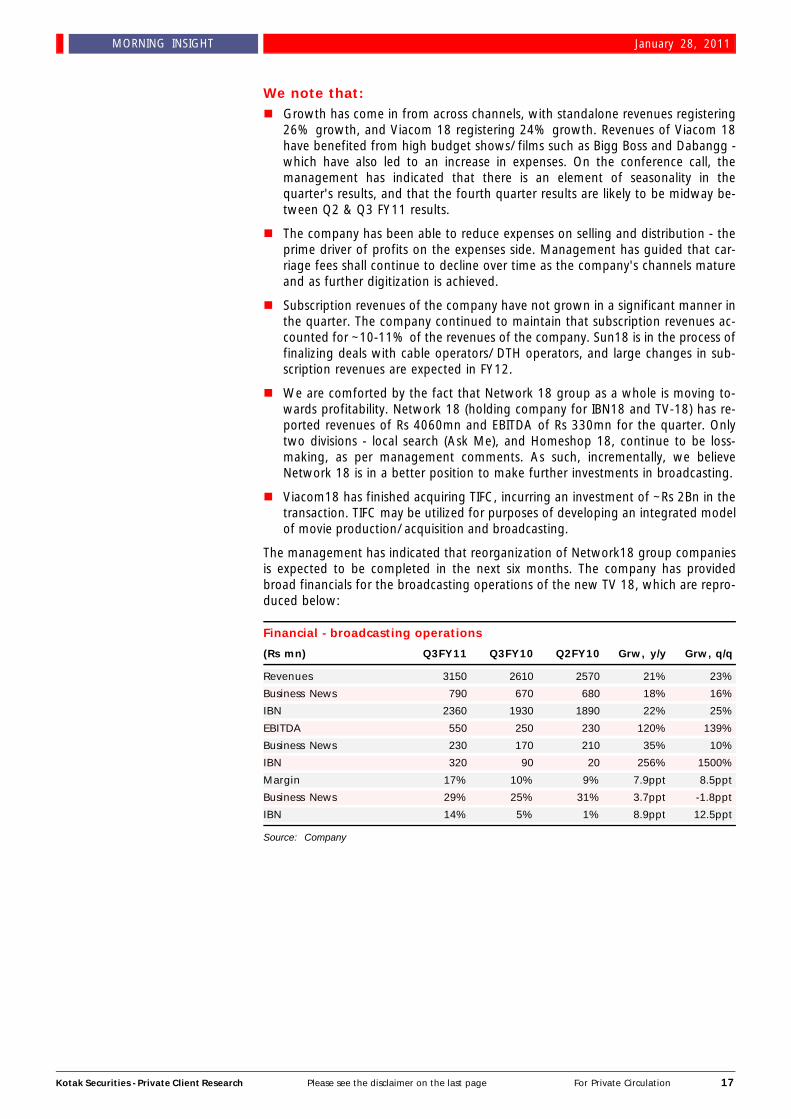
We note that:n Growth has come in from across channels, with standalone revenues registering
26% growth, and Viacom 18 registering 24% growth. Revenues of Viacom 18have benefited from high budget shows/ films such as Bigg Boss and Dabangg -which have also led to an increase in expenses. On the conference call, themanagement has indicated that there is an element of seasonality in thequarter's results, and that the fourth quarter results are likely to be midway be-tween Q2 & Q3 FY11 results.
n The company has been able to reduce expenses on selling and distribution - theprime driver of profits on the expenses side. Management has guided that car-riage fees shall continue to decline over time as the company's channels matureand as further digitization is achieved.
n Subscription revenues of the company have not grown in a significant manner inthe quarter. The company continued to maintain that subscription revenues ac-counted for ~10-11% of the revenues of the company. Sun18 is in the process offinalizing deals with cable operators/ DTH operators, and large changes in sub-scription revenues are expected in FY12.
n We are comforted by the fact that Network 18 group as a whole is moving to-wards profitability. Network 18 (holding company for IBN18 and TV-18) has re-ported revenues of Rs 4060mn and EBITDA of Rs 330mn for the quarter. Onlytwo divisions - local search (Ask Me), and Homeshop 18, continue to be loss-making, as per management comments. As such, incrementally, we believeNetwork 18 is in a better position to make further investments in broadcasting.
n Viacom18 has finished acquiring TIFC, incurring an investment of ~Rs 2Bn in thetransaction. TIFC may be utilized for purposes of developing an integrated modelof movie production/ acquisition and broadcasting.
The management has indicated that reorganization of Network18 group companiesis expected to be completed in the next six months. The company has providedbroad financials for the broadcasting operations of the new TV 18, which are repro-duced below:
Financial - broadcasting operations
(Rs mn) Q3FY11 Q3FY10 Q2FY10 Grw, y/y Grw, q/q
Revenues 3150 2610 2570 21% 23%
Business News 790 670 680 18% 16%
IBN 2360 1930 1890 22% 25%
EBITDA 550 250 230 120% 139%
Business News 230 170 210 35% 10%
IBN 320 90 20 256% 1500%
Margin 17% 10% 9% 7.9ppt 8.5ppt
Business News 29% 25% 31% 3.7ppt -1.8ppt
IBN 14% 5% 1% 8.9ppt 12.5ppt
Source: Company
Kotak Securities - Private Client Research Please see the disclaimer on the last page For Private Circulation 18
MORNING INSIGHT January 28, 2011
Investment Viewn IBN18 is a play on the monetization of mass channels held under its JV Viacom
18. The channels' viewership is under-monetized relative to players such as ZeeEntertainment. While we agree that other broadcasters in the Indian market(Zee, Star, Sony) have a more complete bouquet, we think IBN18 shall be ableto create a space for itself, in so much as higher subscription revenues are con-cerned. While, we expect the process to be gradual, we expect IBN18 to bring in~50% of IBN18's analogue revenues in two-three years.
n Expansion in subscription revenues shall flow into EBITDA in a large way, leadingto substantial improvement in margins for IBN18 - the driver for IBN18's valuecreation.
n 3QFY11 results are a positive, as they demonstrate that the company can remainEBITDA positive even in the absence of substantial subscription revenues - adver-tising revenue growth along with reduction in distribution expenses can lead tosubstantial value creation.
n Restructuring of the Network 18 group companies shall be beneficial to IBN18 inthe near -term as it shall provide a more stable profit path for the company.
n The company has stated that it would be launching a Hindi movie channel in afew months. Given IBN18's strong execution record in establishing viewership,and the fact that Viacom 18 has become a cash-generative entity, we are posi-tive on the development, and we believe a successful launch of movie channelcan help fill gaps in IBN18's bouquet, and lead to an upside in our price target.
n Based on our DCF valuation, we assess the fair value of IBN18 at Rs 115/ share.We maintain a positive stance on the stock and retain our ACCUMULATE rating.
We recommend ACCUMULATE onIBN18 with a price target of
Rs.115
Kotak Securities - Private Client Research Please see the disclaimer on the last page For Private Circulation 19
MORNING INSIGHT January 28, 2011
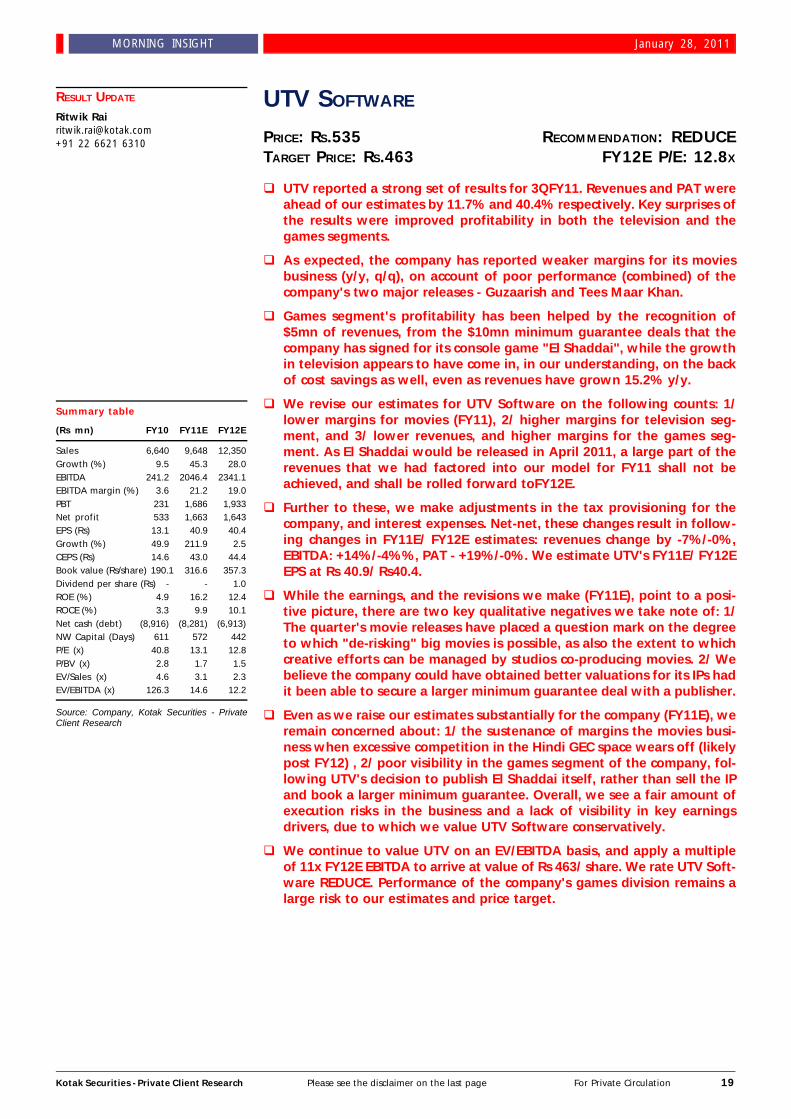
UTV SOFTWARE
PRICE: RS.535 RECOMMENDATION: REDUCETARGET PRICE: RS.463 FY12E P/E: 12.8X
q UTV reported a strong set of results for 3QFY11. Revenues and PAT wereahead of our estimates by 11.7% and 40.4% respectively. Key surprises ofthe results were improved profitability in both the television and thegames segments.
q As expected, the company has reported weaker margins for its moviesbusiness (y/y, q/q), on account of poor performance (combined) of thecompany's two major releases - Guzaarish and Tees Maar Khan.
q Games segment's profitability has been helped by the recognition of$5mn of revenues, from the $10mn minimum guarantee deals that thecompany has signed for its console game "El Shaddai", while the growthin television appears to have come in, in our understanding, on the backof cost savings as well, even as revenues have grown 15.2% y/y.
q We revise our estimates for UTV Software on the following counts: 1/lower margins for movies (FY11), 2/ higher margins for television seg-ment, and 3/ lower revenues, and higher margins for the games seg-ment. As El Shaddai would be released in April 2011, a large part of therevenues that we had factored into our model for FY11 shall not beachieved, and shall be rolled forward toFY12E.
q Further to these, we make adjustments in the tax provisioning for thecompany, and interest expenses. Net-net, these changes result in follow-ing changes in FY11E/ FY12E estimates: revenues change by -7%/-0%,EBITDA: +14%/-4%%, PAT - +19%/-0%. We estimate UTV's FY11E/ FY12EEPS at Rs 40.9/ Rs40.4.
q While the earnings, and the revisions we make (FY11E), point to a posi-tive picture, there are two key qualitative negatives we take note of: 1/The quarter's movie releases have placed a question mark on the degreeto which "de-risking" big movies is possible, as also the extent to whichcreative efforts can be managed by studios co-producing movies. 2/ Webelieve the company could have obtained better valuations for its IPs hadit been able to secure a larger minimum guarantee deal with a publisher.
q Even as we raise our estimates substantially for the company (FY11E), weremain concerned about: 1/ the sustenance of margins the movies busi-ness when excessive competition in the Hindi GEC space wears off (likelypost FY12) , 2/ poor visibility in the games segment of the company, fol-lowing UTV's decision to publish El Shaddai itself, rather than sell the IPand book a larger minimum guarantee. Overall, we see a fair amount ofexecution risks in the business and a lack of visibility in key earningsdrivers, due to which we value UTV Software conservatively.
q We continue to value UTV on an EV/EBITDA basis, and apply a multipleof 11x FY12E EBITDA to arrive at value of Rs 463/ share. We rate UTV Soft-ware REDUCE. Performance of the company's games division remains alarge risk to our estimates and price target.
Summary table
(Rs mn) FY10 FY11E FY12E
Sales 6,640 9,648 12,350Growth (%) 9.5 45.3 28.0EBITDA 241.2 2046.4 2341.1EBITDA margin (%) 3.6 21.2 19.0PBT 231 1,686 1,933Net profit 533 1,663 1,643EPS (Rs) 13.1 40.9 40.4Growth (%) 49.9 211.9 2.5CEPS (Rs) 14.6 43.0 44.4Book value (Rs/share) 190.1 316.6 357.3Dividend per share (Rs) - - 1.0ROE (%) 4.9 16.2 12.4ROCE (%) 3.3 9.9 10.1Net cash (debt) (8,916) (8,281) (6,913)NW Capital (Days) 611 572 442P/E (x) 40.8 13.1 12.8P/BV (x) 2.8 1.7 1.5EV/Sales (x) 4.6 3.1 2.3EV/EBITDA (x) 126.3 14.6 12.2
Source: Company, Kotak Securities - PrivateClient Research
RESULT UPDATE
Ritwik [email protected]+91 22 6621 6310
Kotak Securities - Private Client Research Please see the disclaimer on the last page For Private Circulation 20
MORNING INSIGHT January 28, 2011
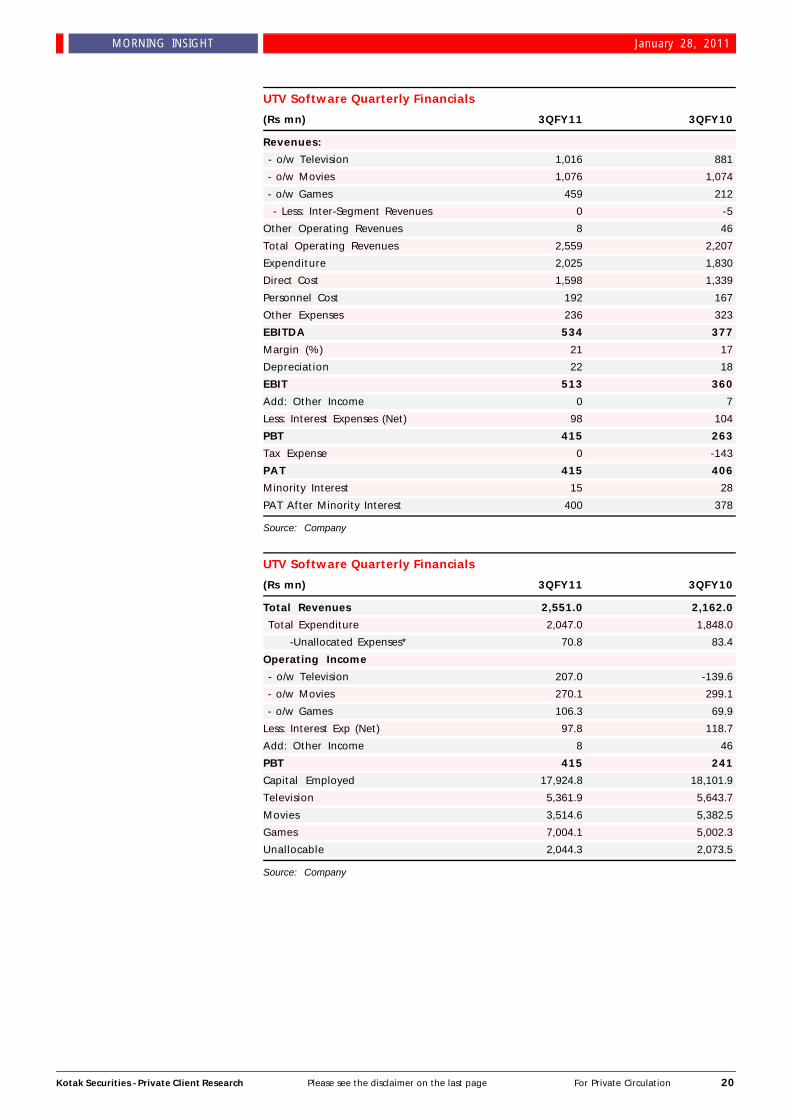
UTV Software Quarterly Financials
(Rs mn) 3QFY11 3QFY10
Revenues:
- o/w Television 1,016 881
- o/w Movies 1,076 1,074
- o/w Games 459 212
- Less: Inter-Segment Revenues 0 -5
Other Operating Revenues 8 46
Total Operating Revenues 2,559 2,207
Expenditure 2,025 1,830
Direct Cost 1,598 1,339
Personnel Cost 192 167
Other Expenses 236 323
EBITDA 534 377
Margin (%) 21 17
Depreciation 22 18
EBIT 513 360
Add: Other Income 0 7
Less: Interest Expenses (Net) 98 104
PBT 415 263
Tax Expense 0 -143
PAT 415 406
Minority Interest 15 28
PAT After Minority Interest 400 378
Source: Company
UTV Software Quarterly Financials
(Rs mn) 3QFY11 3QFY10
Total Revenues 2,551.0 2,162.0
Total Expenditure 2,047.0 1,848.0
-Unallocated Expenses* 70.8 83.4
Operating Income
- o/w Television 207.0 -139.6
- o/w Movies 270.1 299.1
- o/w Games 106.3 69.9
Less: Interest Exp (Net) 97.8 118.7
Add: Other Income 8 46
PBT 415 241
Capital Employed 17,924.8 18,101.9
Television 5,361.9 5,643.7
Movies 3,514.6 5,382.5
Games 7,004.1 5,002.3
Unallocable 2,044.3 2,073.5
Source: Company
Kotak Securities - Private Client Research Please see the disclaimer on the last page For Private Circulation 21
MORNING INSIGHT January 28, 2011
n Margins in the movie segment declined sharply as a result of weaker perfor-mance of the company's releases in this quarter, which included two big movies- namely Guzaarish and Tees Maar Khan. The company has booked revenues forboth the movies' theatrical revenues, although Tees Maar Khan's satellite rights'revenues were not booked in the quarter.
n Profitability in the television segment improved substantially. The improvement,as per management, is a combined result of improved revenue traction in itsbroadcasting vertical and cost control affected by the company. Strong perfor-mance in the television segment is one of the important factors that has led toUTV's performance being ahead of our estimates.
n Revenues in the games segment benefited from $5mn revenues booked for thecompany's El Shaddai IP - which is set to be launched in Japan on April 28th.The company shall be publishing the game itself, and would, beginning 1QFY12,book revenues from actual sales of the game.
Our investment thesis on UTV may be summarized as follows:n Three of UTV's business segments lie in three separate states of monetization -
a/ the movie business is monetized, and is a strong profitability driver for thecompany, b/ the television business, consisting of content production and broad-casting is, in our view, yet to achieve stability, c/ The games and interactive seg-ment of the company is under-monetized, and the largest consumer of capitalemployed.
n The company is committed to growing the three segments together, and seessynergies in the running of these businesses. As such, it is not useful to seek asum-of-parts valuation for the company.
n There is, even now, a significant amount of uncertainty on the revenues that thegames segment can bring in. While television segment has brought in substantialmargins in the quarter, we remain unclear about the drivers of the change aswell as sustainability - we note that 3Q is a strong quarter for broadcasters. Ongames, we note that the company had initially guided for FY11 revenues of Rs4Bn , which it has had to revise downward on account of deferral of revenuesfrom El Shaddai. As of now, the company is publishing the game itself. Otherkey IPs of the company - three in number and accounting for about $25mn eachin development expenses - are yet to provide any visibility in terms of revenues.
n We value UTV Software using an EV/ EBITDA multiple of 11xFY12E, and arriveat a price target of Rs 463/ share (upgrade from prior price target of Rs 458/share). We remain REDUCE on the stock at present. We shall revisit our invest-ment thesis on the company post a detailed discussion with the management.
We maintain REDUCE on UTVSoftware with a price target of
Rs.463
Kotak Securities - Private Client Research Please see the disclaimer on the last page For Private Circulation 22
MORNING INSIGHT January 28, 2011
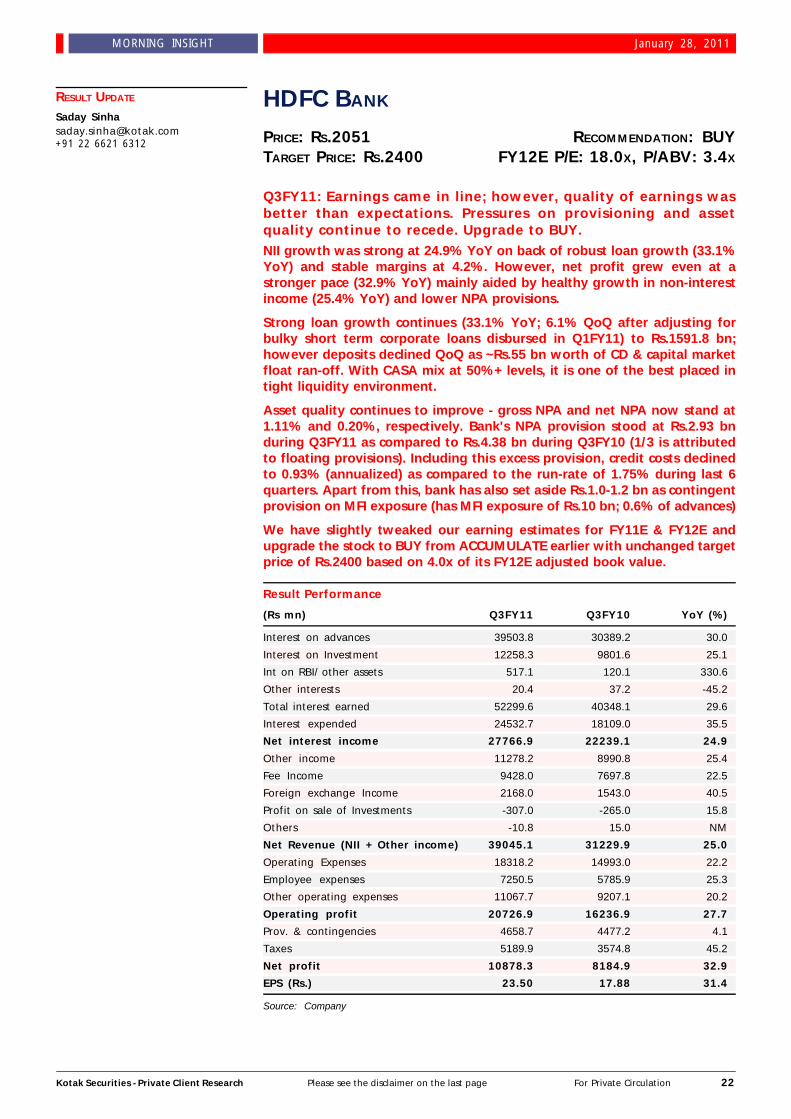
HDFC BANK
PRICE: RS.2051 RECOMMENDATION: BUYTARGET PRICE: RS.2400 FY12E P/E: 18.0X, P/ABV: 3.4X
Q3FY11: Earnings came in line; however, quality of earnings wasbetter than expectations. Pressures on provisioning and assetquality continue to recede. Upgrade to BUY.NII growth was strong at 24.9% YoY on back of robust loan growth (33.1%YoY) and stable margins at 4.2%. However, net profit grew even at astronger pace (32.9% YoY) mainly aided by healthy growth in non-interestincome (25.4% YoY) and lower NPA provisions.
Strong loan growth continues (33.1% YoY; 6.1% QoQ after adjusting forbulky short term corporate loans disbursed in Q1FY11) to Rs.1591.8 bn;however deposits declined QoQ as ~Rs.55 bn worth of CD & capital marketfloat ran-off. With CASA mix at 50%+ levels, it is one of the best placed intight liquidity environment.
Asset quality continues to improve - gross NPA and net NPA now stand at1.11% and 0.20%, respectively. Bank's NPA provision stood at Rs.2.93 bnduring Q3FY11 as compared to Rs.4.38 bn during Q3FY10 (1/3 is attributedto floating provisions). Including this excess provision, credit costs declinedto 0.93% (annualized) as compared to the run-rate of 1.75% during last 6quarters. Apart from this, bank has also set aside Rs.1.0-1.2 bn as contingentprovision on MFI exposure (has MFI exposure of Rs.10 bn; 0.6% of advances)
We have slightly tweaked our earning estimates for FY11E & FY12E andupgrade the stock to BUY from ACCUMULATE earlier with unchanged targetprice of Rs.2400 based on 4.0x of its FY12E adjusted book value.
Result Performance
(Rs mn) Q3FY11 Q3FY10 YoY (%)
Interest on advances 39503.8 30389.2 30.0
Interest on Investment 12258.3 9801.6 25.1
Int on RBI/ other assets 517.1 120.1 330.6
Other interests 20.4 37.2 -45.2
Total interest earned 52299.6 40348.1 29.6
Interest expended 24532.7 18109.0 35.5
Net interest income 27766.9 22239.1 24.9
Other income 11278.2 8990.8 25.4
Fee Income 9428.0 7697.8 22.5
Foreign exchange Income 2168.0 1543.0 40.5
Profit on sale of Investments -307.0 -265.0 15.8
Others -10.8 15.0 NM
Net Revenue (NII + Other income) 39045.1 31229.9 25.0
Operating Expenses 18318.2 14993.0 22.2
Employee expenses 7250.5 5785.9 25.3
Other operating expenses 11067.7 9207.1 20.2
Operating profit 20726.9 16236.9 27.7
Prov. & contingencies 4658.7 4477.2 4.1
Taxes 5189.9 3574.8 45.2
Net profit 10878.3 8184.9 32.9
EPS (Rs.) 23.50 17.88 31.4
Source: Company
RESULT UPDATE
Saday [email protected]+91 22 6621 6312
Kotak Securities - Private Client Research Please see the disclaimer on the last page For Private Circulation 23
MORNING INSIGHT January 28, 2011
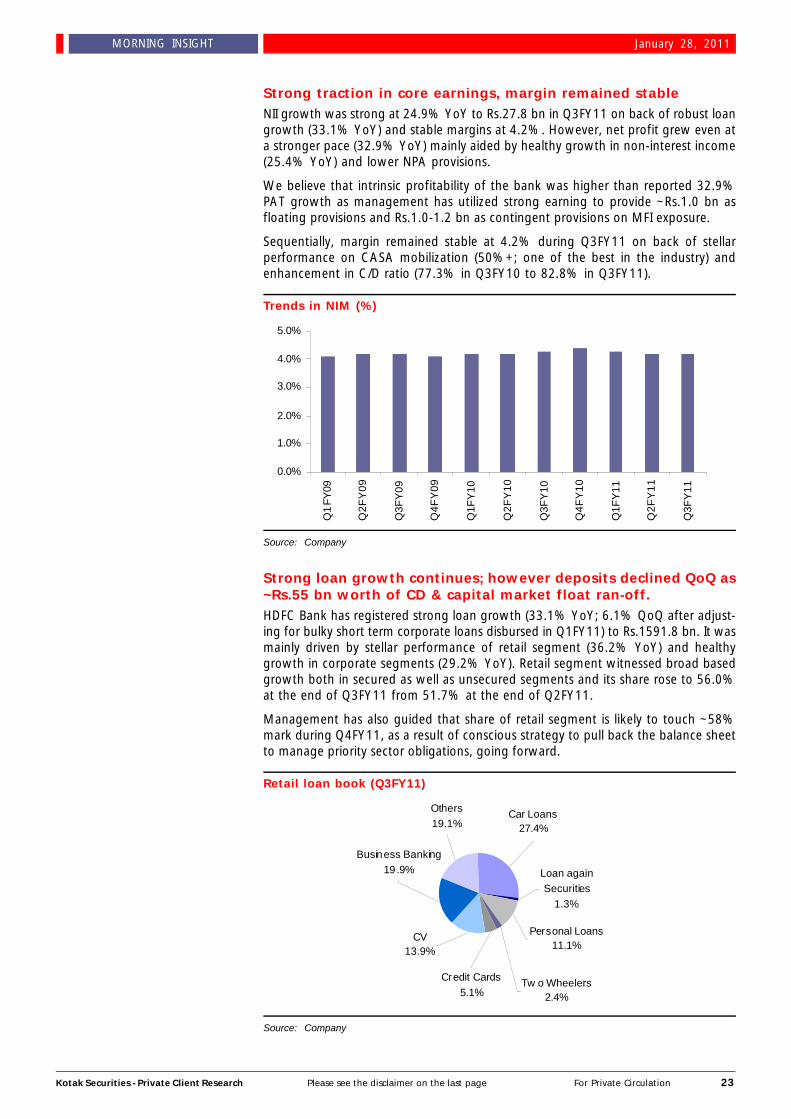
Strong traction in core earnings, margin remained stableNII growth was strong at 24.9% YoY to Rs.27.8 bn in Q3FY11 on back of robust loangrowth (33.1% YoY) and stable margins at 4.2%. However, net profit grew even ata stronger pace (32.9% YoY) mainly aided by healthy growth in non-interest income(25.4% YoY) and lower NPA provisions.
We believe that intrinsic profitability of the bank was higher than reported 32.9%PAT growth as management has utilized strong earning to provide ~Rs.1.0 bn asfloating provisions and Rs.1.0-1.2 bn as contingent provisions on MFI exposure.
Sequentially, margin remained stable at 4.2% during Q3FY11 on back of stellarperformance on CASA mobilization (50%+; one of the best in the industry) andenhancement in C/D ratio (77.3% in Q3FY10 to 82.8% in Q3FY11).
Trends in NIM (%)
Source: Company
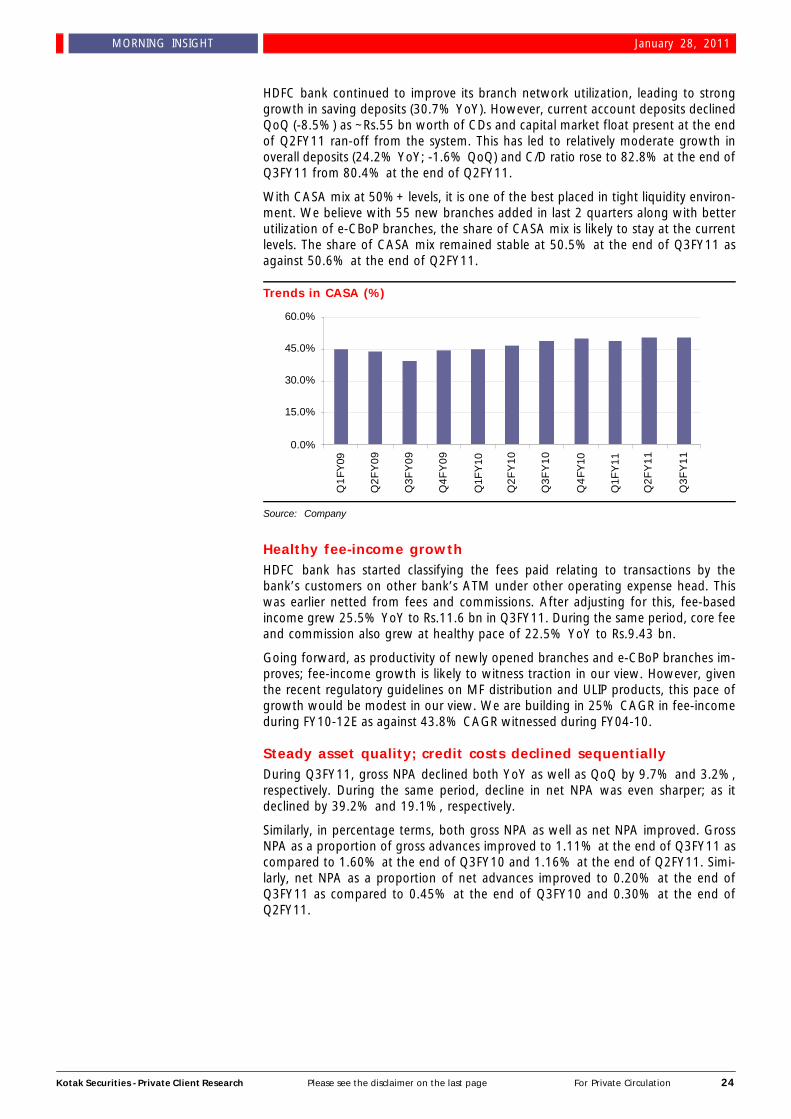
Strong loan growth continues; however deposits declined QoQ as~Rs.55 bn worth of CD & capital market float ran-off.HDFC Bank has registered strong loan growth (33.1% YoY; 6.1% QoQ after adjust-ing for bulky short term corporate loans disbursed in Q1FY11) to Rs.1591.8 bn. It wasmainly driven by stellar performance of retail segment (36.2% YoY) and healthygrowth in corporate segments (29.2% YoY). Retail segment witnessed broad basedgrowth both in secured as well as unsecured segments and its share rose to 56.0%at the end of Q3FY11 from 51.7% at the end of Q2FY11.
Management has also guided that share of retail segment is likely to touch ~58%mark during Q4FY11, as a result of conscious strategy to pull back the balance sheetto manage priority sector obligations, going forward.
Retail loan book (Q3FY11)
Source: Company
0.0%
1.0%
2.0%
3.0%
4.0%
5.0%Q
1FY
09
Q2F
Y09
Q3F
Y09
Q4F
Y09
Q1F
Y10
Q2F
Y10
Q3F
Y10
Q4F
Y10
Q1F
Y11
Q2F
Y11
Q3F
Y11
Tw o Wheelers2.4%
Loan again Securities
1.3%
Personal Loans11.1%
Credit Cards5.1%
CV13.9%
Business Banking19.9%
Others19.1%
Car Loans27.4%
Kotak Securities - Private Client Research Please see the disclaimer on the last page For Private Circulation 24
MORNING INSIGHT January 28, 2011
HDFC bank continued to improve its branch network utilization, leading to stronggrowth in saving deposits (30.7% YoY). However, current account deposits declinedQoQ (-8.5%) as ~Rs.55 bn worth of CDs and capital market float present at the endof Q2FY11 ran-off from the system. This has led to relatively moderate growth inoverall deposits (24.2% YoY; -1.6% QoQ) and C/D ratio rose to 82.8% at the end ofQ3FY11 from 80.4% at the end of Q2FY11.
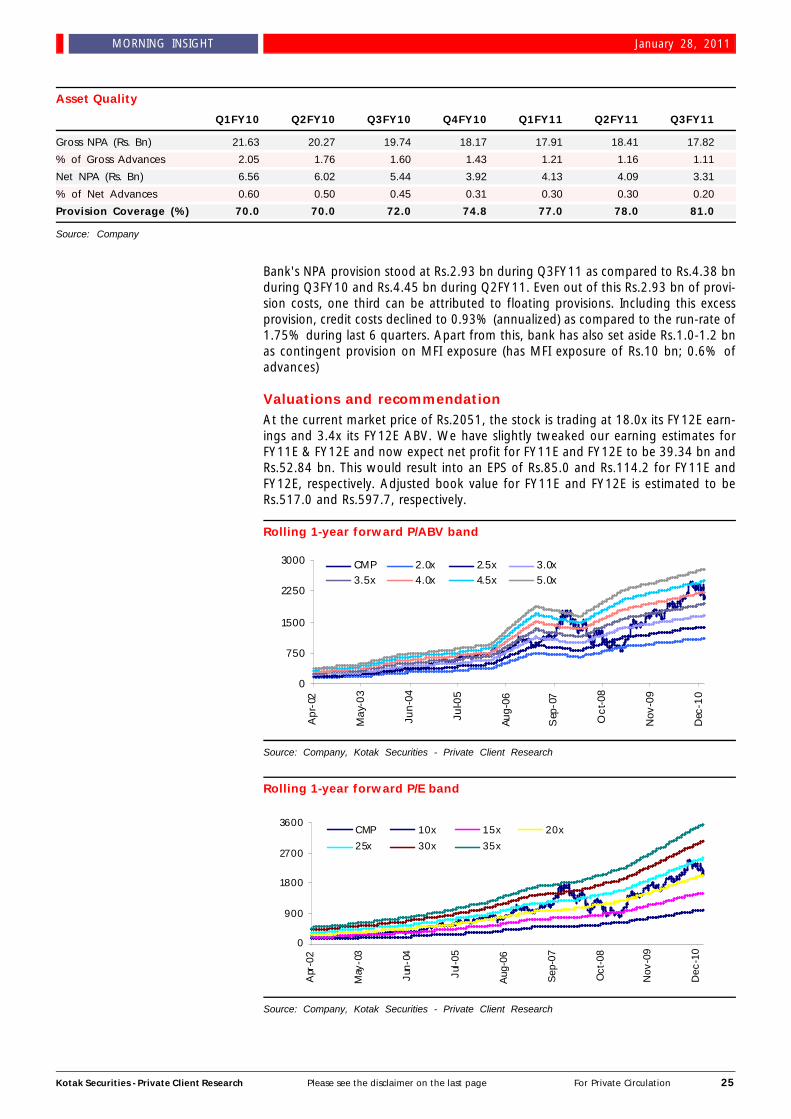
With CASA mix at 50%+ levels, it is one of the best placed in tight liquidity environ-ment. We believe with 55 new branches added in last 2 quarters along with betterutilization of e-CBoP branches, the share of CASA mix is likely to stay at the currentlevels. The share of CASA mix remained stable at 50.5% at the end of Q3FY11 asagainst 50.6% at the end of Q2FY11.
Trends in CASA (%)
Source: Company
Healthy fee-income growthHDFC bank has started classifying the fees paid relating to transactions by thebank’s customers on other bank’s ATM under other operating expense head. Thiswas earlier netted from fees and commissions. After adjusting for this, fee-basedincome grew 25.5% YoY to Rs.11.6 bn in Q3FY11. During the same period, core feeand commission also grew at healthy pace of 22.5% YoY to Rs.9.43 bn.
Going forward, as productivity of newly opened branches and e-CBoP branches im-proves; fee-income growth is likely to witness traction in our view. However, giventhe recent regulatory guidelines on MF distribution and ULIP products, this pace ofgrowth would be modest in our view. We are building in 25% CAGR in fee-incomeduring FY10-12E as against 43.8% CAGR witnessed during FY04-10.
Steady asset quality; credit costs declined sequentiallyDuring Q3FY11, gross NPA declined both YoY as well as QoQ by 9.7% and 3.2%,respectively. During the same period, decline in net NPA was even sharper; as itdeclined by 39.2% and 19.1%, respectively.
Similarly, in percentage terms, both gross NPA as well as net NPA improved. GrossNPA as a proportion of gross advances improved to 1.11% at the end of Q3FY11 ascompared to 1.60% at the end of Q3FY10 and 1.16% at the end of Q2FY11. Simi-larly, net NPA as a proportion of net advances improved to 0.20% at the end ofQ3FY11 as compared to 0.45% at the end of Q3FY10 and 0.30% at the end ofQ2FY11.
0.0%
15.0%
30.0%
45.0%
60.0%
Q1
FY09
Q2F
Y09
Q3F
Y09
Q4F
Y09
Q1F
Y10
Q2F
Y10
Q3F
Y10
Q4
FY10
Q1F
Y11
Q2F
Y11
Q3F
Y11
Kotak Securities - Private Client Research Please see the disclaimer on the last page For Private Circulation 25
MORNING INSIGHT January 28, 2011
Asset Quality
Q1FY10 Q2FY10 Q3FY10 Q4FY10 Q1FY11 Q2FY11 Q3FY11
Gross NPA (Rs. Bn) 21.63 20.27 19.74 18.17 17.91 18.41 17.82
% of Gross Advances 2.05 1.76 1.60 1.43 1.21 1.16 1.11
Net NPA (Rs. Bn) 6.56 6.02 5.44 3.92 4.13 4.09 3.31
% of Net Advances 0.60 0.50 0.45 0.31 0.30 0.30 0.20
Provision Coverage (%) 70.0 70.0 72.0 74.8 77.0 78.0 81.0
Source: Company
0
750
1500
2250
3000
Apr
-02
May
-03
Jun-
04
Jul-0
5
Aug-
06
Sep
-07
Oct
-08
Nov
-09
Dec
-10
CMP 2.0x 2.5x 3.0x3.5x 4.0x 4.5x 5.0x
0
900
1800
2700
3600
Apr
-02
May
-03
Jun-
04
Jul-
05
Aug
-06
Sep
-07
Oct
-08
Nov
-09
Dec
-10
CMP 10x 15x 20x
25x 30x 35x
Bank's NPA provision stood at Rs.2.93 bn during Q3FY11 as compared to Rs.4.38 bnduring Q3FY10 and Rs.4.45 bn during Q2FY11. Even out of this Rs.2.93 bn of provi-sion costs, one third can be attributed to floating provisions. Including this excessprovision, credit costs declined to 0.93% (annualized) as compared to the run-rate of1.75% during last 6 quarters. Apart from this, bank has also set aside Rs.1.0-1.2 bnas contingent provision on MFI exposure (has MFI exposure of Rs.10 bn; 0.6% ofadvances)
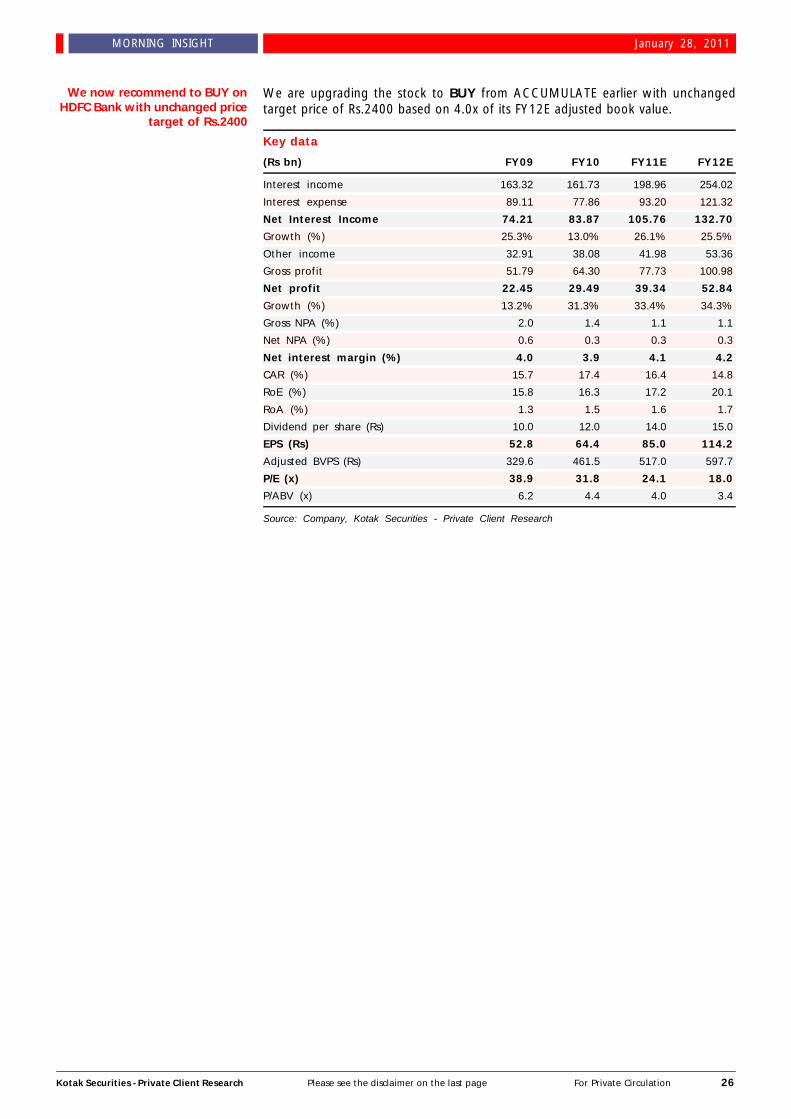
Valuations and recommendationAt the current market price of Rs.2051, the stock is trading at 18.0x its FY12E earn-ings and 3.4x its FY12E ABV. We have slightly tweaked our earning estimates forFY11E & FY12E and now expect net profit for FY11E and FY12E to be 39.34 bn andRs.52.84 bn. This would result into an EPS of Rs.85.0 and Rs.114.2 for FY11E andFY12E, respectively. Adjusted book value for FY11E and FY12E is estimated to beRs.517.0 and Rs.597.7, respectively.
Rolling 1-year forward P/ABV band
Source: Company, Kotak Securities - Private Client Research
Rolling 1-year forward P/E band
Source: Company, Kotak Securities - Private Client Research
Kotak Securities - Private Client Research Please see the disclaimer on the last page For Private Circulation 26
MORNING INSIGHT January 28, 2011
We are upgrading the stock to BUY from ACCUMULATE earlier with unchangedtarget price of Rs.2400 based on 4.0x of its FY12E adjusted book value.
Key data
(Rs bn) FY09 FY10 FY11E FY12E
Interest income 163.32 161.73 198.96 254.02
Interest expense 89.11 77.86 93.20 121.32
Net Interest Income 74.21 83.87 105.76 132.70
Growth (%) 25.3% 13.0% 26.1% 25.5%
Other income 32.91 38.08 41.98 53.36
Gross profit 51.79 64.30 77.73 100.98
Net profit 22.45 29.49 39.34 52.84
Growth (%) 13.2% 31.3% 33.4% 34.3%
Gross NPA (%) 2.0 1.4 1.1 1.1
Net NPA (%) 0.6 0.3 0.3 0.3
Net interest margin (%) 4.0 3.9 4.1 4.2
CAR (%) 15.7 17.4 16.4 14.8
RoE (%) 15.8 16.3 17.2 20.1
RoA (%) 1.3 1.5 1.6 1.7
Dividend per share (Rs) 10.0 12.0 14.0 15.0
EPS (Rs) 52.8 64.4 85.0 114.2
Adjusted BVPS (Rs) 329.6 461.5 517.0 597.7
P/E (x) 38.9 31.8 24.1 18.0
P/ABV (x) 6.2 4.4 4.0 3.4
Source: Company, Kotak Securities - Private Client Research
We now recommend to BUY onHDFC Bank with unchanged price
target of Rs.2400
Kotak Securities - Private Client Research Please see the disclaimer on the last page For Private Circulation 27
MORNING INSIGHT January 28, 2011
DisclaimerThis document is not for public distribution and has been furnished to you solely for your information and must not be reproduced or redistributed to anyother person. Persons into whose possession this document may come are required to observe these restrictions.
This material is for the personal information of the authorized recipient, and we are not soliciting any action based upon it. This report is not to be con-strued as an offer to sell or the solicitation of an offer to buy any security in any jurisdiction where such an offer or solicitation would be illegal. It is for thegeneral information of clients of Kotak Securities Ltd. It does not constitute a personal recommendation or take into account the particular investment ob-jectives, financial situations, or needs of individual clients.
We have reviewed the report, and in so far as it includes current or historical information, it is believed to be reliable though its accuracy or completenesscannot be guaranteed. Neither Kotak Securities Limited, nor any person connected with it, accepts any liability arising from the use of this document. Therecipients of this material should rely on their own investigations and take their own professional advice. Price and value of the investments referred to inthis material may go up or down. Past performance is not a guide for future performance. Certain transactions -including those involving futures, optionsand other derivatives as well as non-investment grade securities - involve substantial risk and are not suitable for all investors. Reports based on technicalanalysis centers on studying charts of a stock’s price movement and trading volume, as opposed to focusing on a company’s fundamentals and as such, maynot match with a report on a company’s fundamentals.
Opinions expressed are our current opinions as of the date appearing on this material only. While we endeavor to update on a reasonable basis the informa-tion discussed in this material, there may be regulatory, compliance, or other reasons that prevent us from doing so. Prospective investors and others arecautioned that any forward-looking statements are not predictions and may be subject to change without notice. Our proprietary trading and investmentbusinesses may make investment decisions that are inconsistent with the recommendations expressed herein.
Kotak Securities Limited has two independent equity research groups: Institutional Equities and Private Client Group. This report has been prepared by thePrivate Client Group . The views and opinions expressed in this document may or may not match or may be contrary with the views, estimates, rating, targetprice of the Institutional Equities Research Group of Kotak Securities Limited.
We and our affiliates, officers, directors, and employees world wide may: (a) from time to time, have long or short positions in, and buy or sell the securitiesthereof, of company (ies) mentioned herein or (b) be engaged in any other transaction involving such securities and earn brokerage or other compensationor act as a market maker in the financial instruments of the company (ies) discussed herein or act as advisor or lender / borrower to such company (ies) orhave other potential conflict of interest with respect to any recommendation and related information and opinions.
The analyst for this report certifies that all of the views expressed in this report accurately reflect his or her personal views about the subject company orcompanies and its or their securities, and no part of his or her compensation was, is or will be, directly or indirectly related to specific recommendations orviews expressed in this report.
No part of this material may be duplicated in any form and/or redistributed without Kotak Securities’ prior written consent.
Registered Office: Kotak Securities Limited, Bakhtawar, 1st floor, 229 Nariman Point, Mumbai 400021 India.
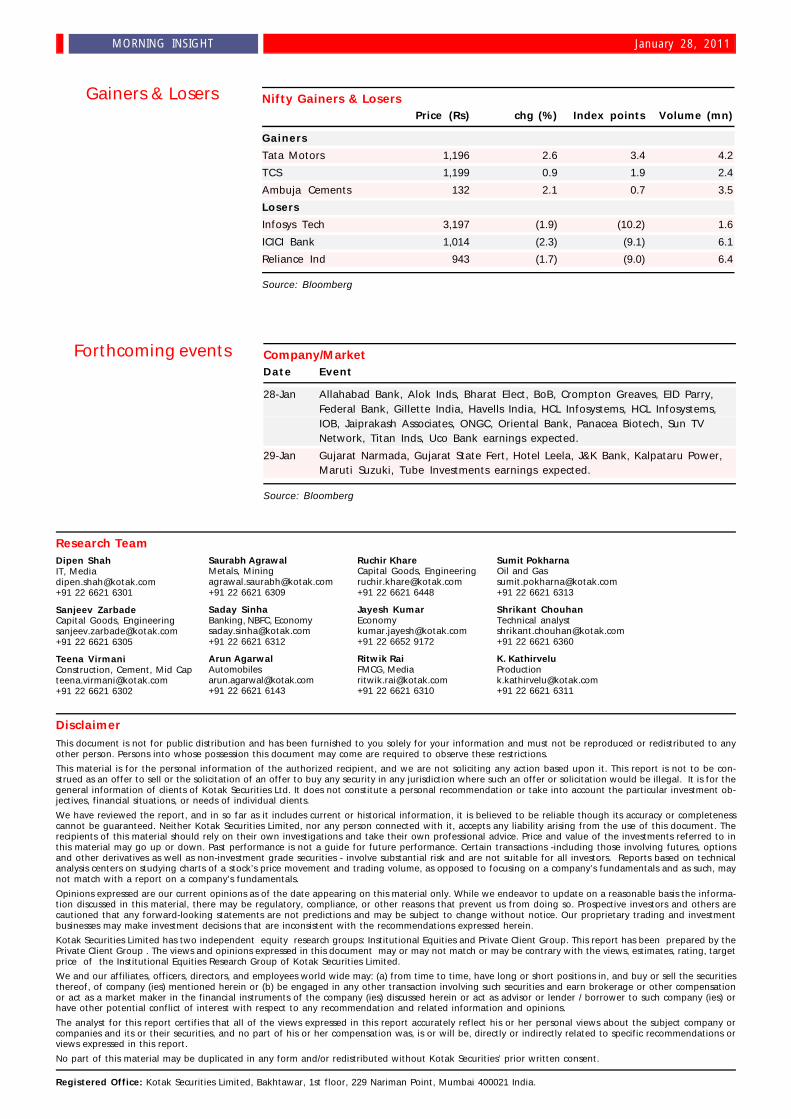
Gainers & Losers Nifty Gainers & LosersPrice (Rs) chg (%) Index points Volume (mn)
Gainers
Tata Motors 1,196 2.6 3.4 4.2
TCS 1,199 0.9 1.9 2.4
Ambuja Cements 132 2.1 0.7 3.5
Losers
Infosys Tech 3,197 (1.9) (10.2) 1.6
ICICI Bank 1,014 (2.3) (9.1) 6.1
Reliance Ind 943 (1.7) (9.0) 6.4
Source: Bloomberg
Research TeamDipen ShahIT, [email protected]+91 22 6621 6301
Sanjeev ZarbadeCapital Goods, [email protected]+91 22 6621 6305
Teena VirmaniConstruction, Cement, Mid [email protected]+91 22 6621 6302
Saurabh AgrawalMetals, [email protected]+91 22 6621 6309
Saday SinhaBanking, NBFC, [email protected]+91 22 6621 6312
Arun [email protected]+91 22 6621 6143
Ruchir KhareCapital Goods, [email protected]+91 22 6621 6448
Jayesh [email protected]+91 22 6652 9172
Ritwik RaiFMCG, [email protected]+91 22 6621 6310
Sumit PokharnaOil and [email protected]+91 22 6621 6313
Shrikant ChouhanTechnical [email protected]+91 22 6621 6360
K. [email protected]+91 22 6621 6311
Forthcoming events Company/MarketDate Event
28-Jan Allahabad Bank, Alok Inds, Bharat Elect, BoB, Crompton Greaves, EID Parry,Federal Bank, Gillette India, Havells India, HCL Infosystems, HCL Infosystems,IOB, Jaiprakash Associates, ONGC, Oriental Bank, Panacea Biotech, Sun TVNetwork, Titan Inds, Uco Bank earnings expected.
29-Jan Gujarat Narmada, Gujarat State Fert, Hotel Leela, J&K Bank, Kalpataru Power,Maruti Suzuki, Tube Investments earnings expected.
Source: Bloomberg