Embed Size (px)
Citation preview
2013-02-03
1
C H A P T E R
Thinking Like An Economist
Economics P R I N C I P L E S O F
N. Gregory Mankiw
2
THINKING LIKE AN ECONOMIST 1
The Economist as Scientist
Economists play two roles:
1. ( ): try to explain the world
2. Policy advisors: try to improve it
In the first, economists employ the
( ),
the dispassionate development and testing of
theories about how the world works.
2013-02-03
2
THINKING LIKE AN ECONOMIST 2
Assumptions & Models
Assumptions simplify the complex world,
make it easier to understand.
Example: To study international trade,
assume two countries and two goods.
Unrealistic, but simple to learn and
gives useful insights about the real world.
( ): a highly simplified representation of
a more complicated reality.
Economists use models to study economic
issues.
THINKING LIKE AN ECONOMIST 3
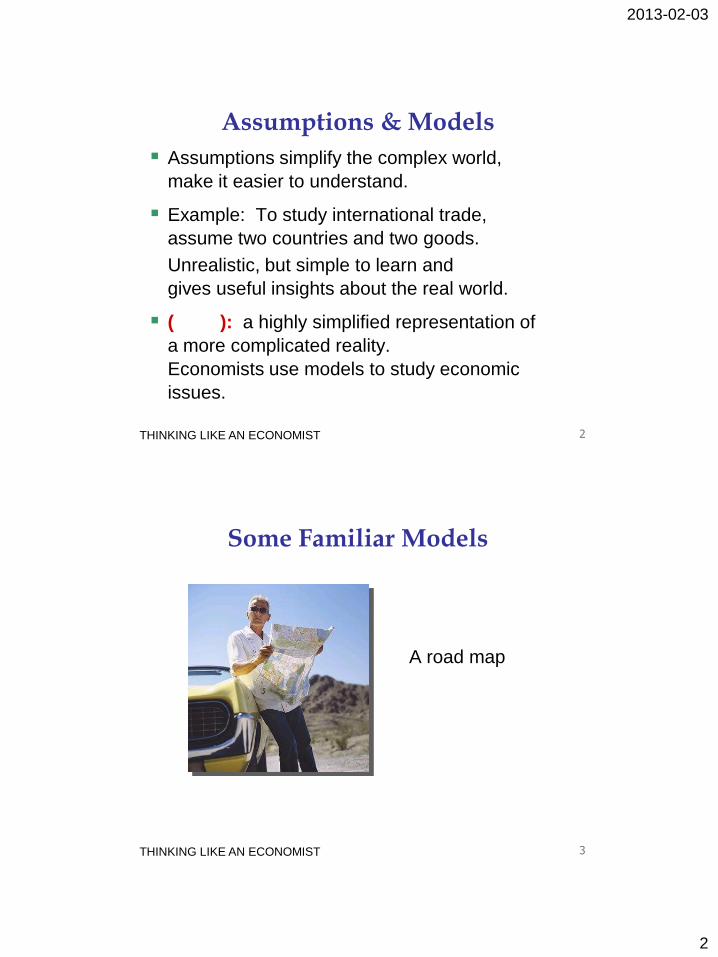
Some Familiar Models
A road map
2013-02-03
3
THINKING LIKE AN ECONOMIST 4
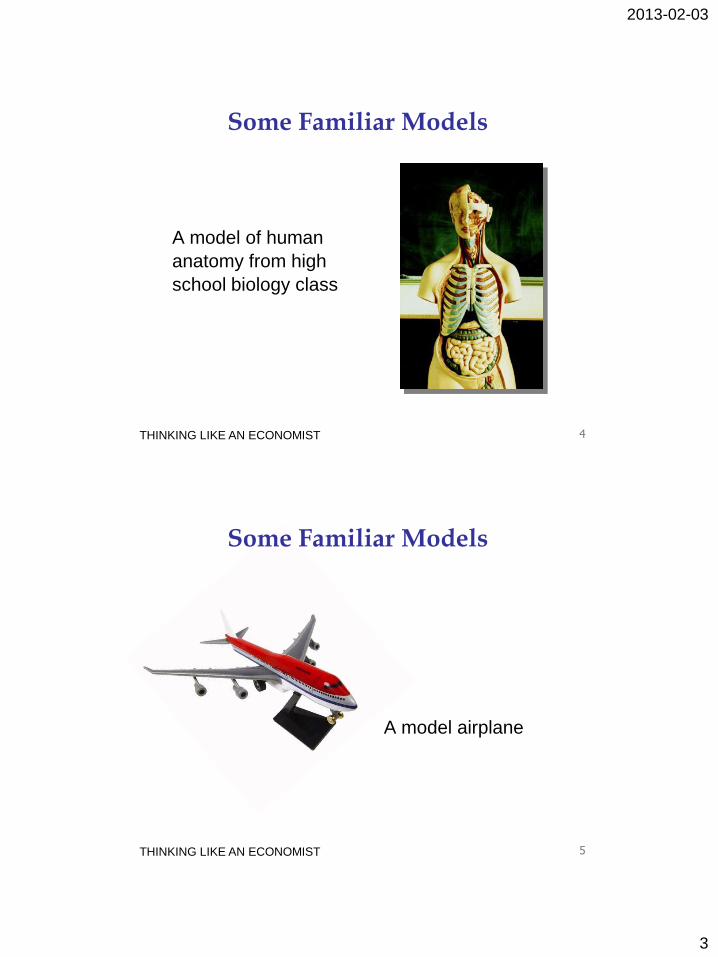
Some Familiar Models
A model of human
anatomy from high
school biology class
THINKING LIKE AN ECONOMIST 5
Some Familiar Models
A model airplane
2013-02-03
4
THINKING LIKE AN ECONOMIST 6
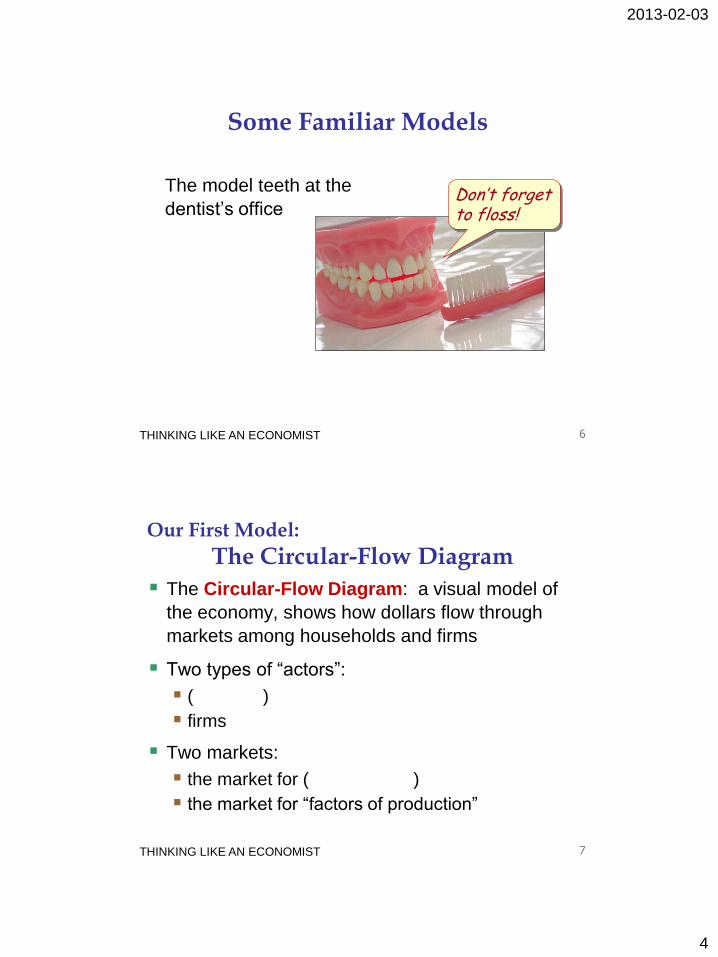
Some Familiar Models
The model teeth at the
dentist’s office Don’t forget to floss!
THINKING LIKE AN ECONOMIST 7
Our First Model:
The Circular-Flow Diagram
The Circular-Flow Diagram: a visual model of
the economy, shows how dollars flow through
markets among households and firms
Two types of “actors”:
( )
firms
Two markets:
the market for ( )
the market for “factors of production”
2013-02-03
5
THINKING LIKE AN ECONOMIST 8
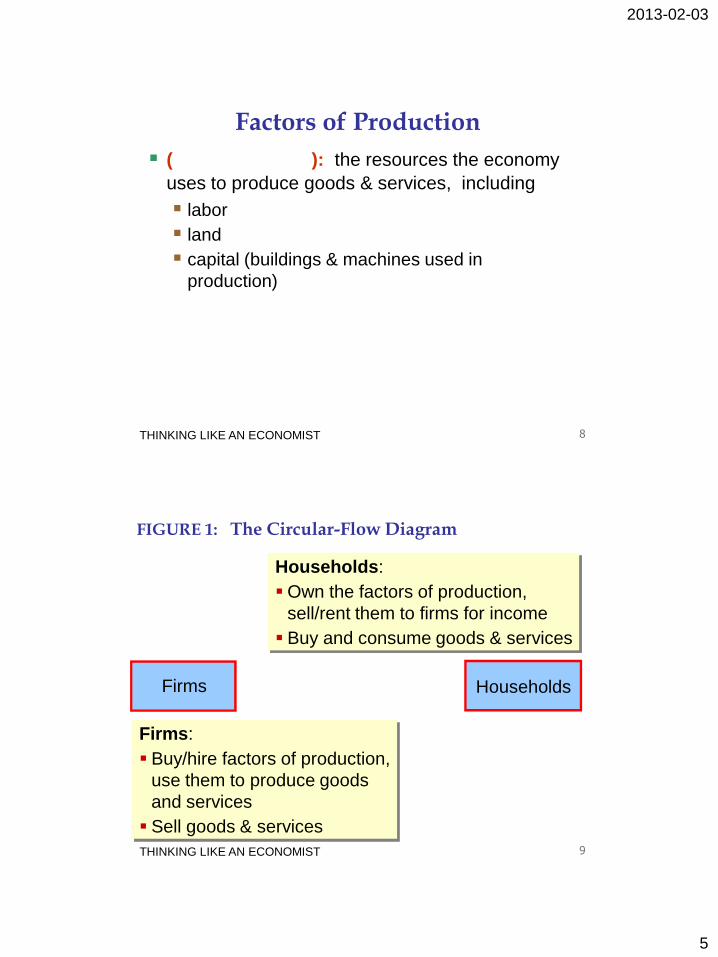
Factors of Production
( ): the resources the economy
uses to produce goods & services, including
labor
land
capital (buildings & machines used in
production)
THINKING LIKE AN ECONOMIST 9
FIGURE 1: The Circular-Flow Diagram
Households:
Own the factors of production,
sell/rent them to firms for income
Buy and consume goods & services
Households Firms
Firms:
Buy/hire factors of production,
use them to produce goods
and services
Sell goods & services
2013-02-03
6
THINKING LIKE AN ECONOMIST 10
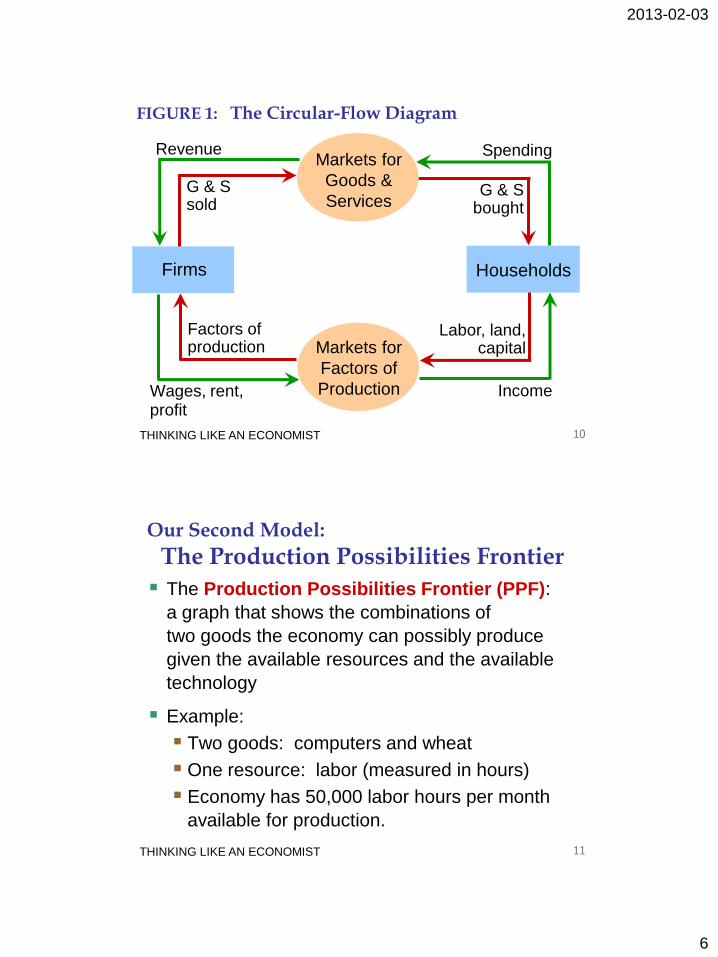
FIGURE 1: The Circular-Flow Diagram
Markets for
Factors of
Production
Households Firms
Income Wages, rent, profit
Factors of production
Labor, land, capital
Spending
G & S bought
G & S sold
Revenue Markets for
Goods &
Services
THINKING LIKE AN ECONOMIST 11
Our Second Model:
The Production Possibilities Frontier
The Production Possibilities Frontier (PPF):
a graph that shows the combinations of
two goods the economy can possibly produce
given the available resources and the available
technology
Example:
Two goods: computers and wheat
One resource: labor (measured in hours)
Economy has 50,000 labor hours per month
available for production.
2013-02-03
7
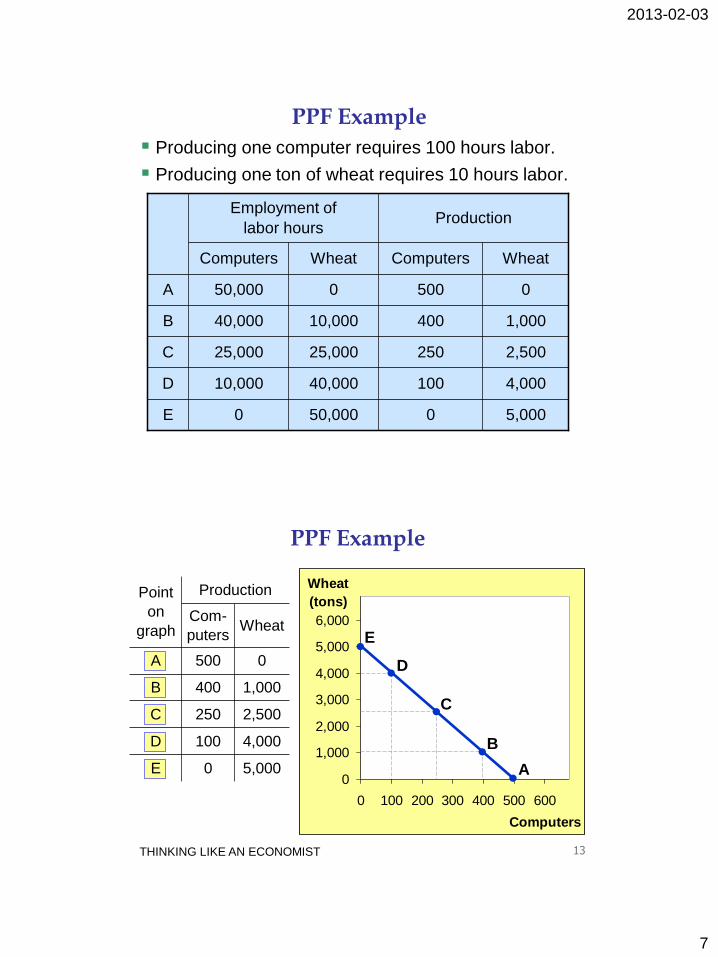
PPF Example
Producing one computer requires 100 hours labor.
Producing one ton of wheat requires 10 hours labor.
5,000 0
4,000 100
2,500 250
1,000 400
50,000 0
40,000 10,000
25,000 25,000
10,000 40,000
0 500 0 50,000
E
D
C
B
A
Wheat Computers Wheat Computers
Production Employment of
labor hours
THINKING LIKE AN ECONOMIST 13
Point
on
graph
Production
Com-
puters Wheat
A 500 0
B 400 1,000
C 250 2,500
D 100 4,000
E 0 5,000 0
1,000
2,000
3,000
4,000
5,000
6,000
0 100 200 300 400 500 600
Computers
Wheat
(tons)
A
B
C
D
E
PPF Example
2013-02-03
8
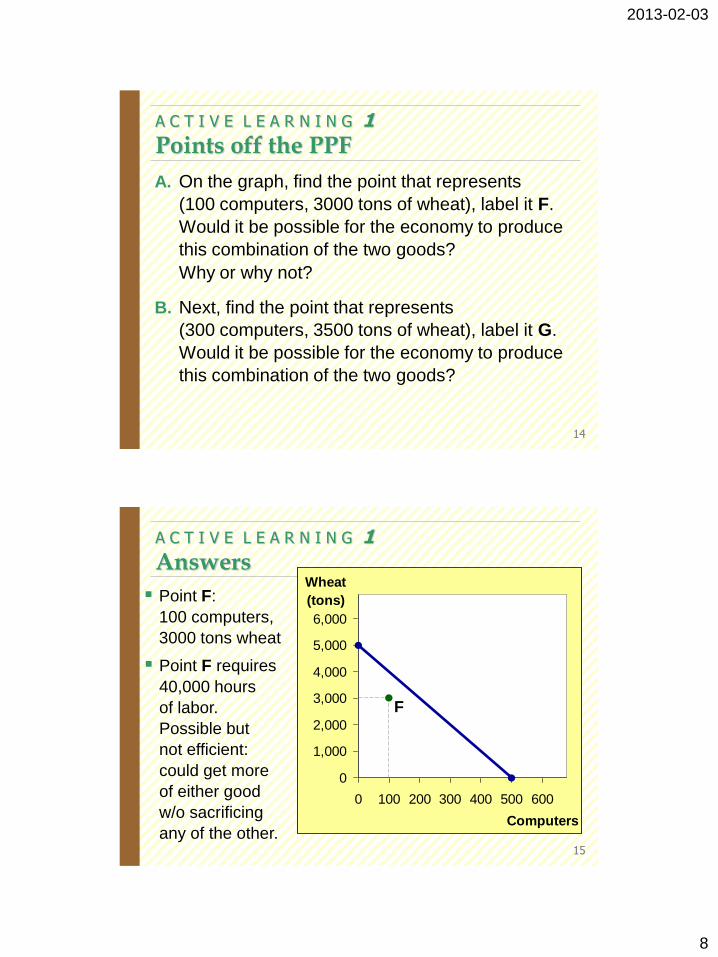
A. On the graph, find the point that represents
(100 computers, 3000 tons of wheat), label it F.
Would it be possible for the economy to produce
this combination of the two goods?
Why or why not?
B. Next, find the point that represents
(300 computers, 3500 tons of wheat), label it G.
Would it be possible for the economy to produce
this combination of the two goods?
A C T I V E L E A R N I N G 1
Points off the PPF
14
A C T I V E L E A R N I N G 1
Answers
15
Point F:
100 computers,
3000 tons wheat
Point F requires
40,000 hours
of labor.
Possible but
not efficient:
could get more
of either good
w/o sacrificing
any of the other.
0
1,000
2,000
3,000
4,000
5,000
6,000
0 100 200 300 400 500 600
Computers
Wheat
(tons)
F
2013-02-03
9
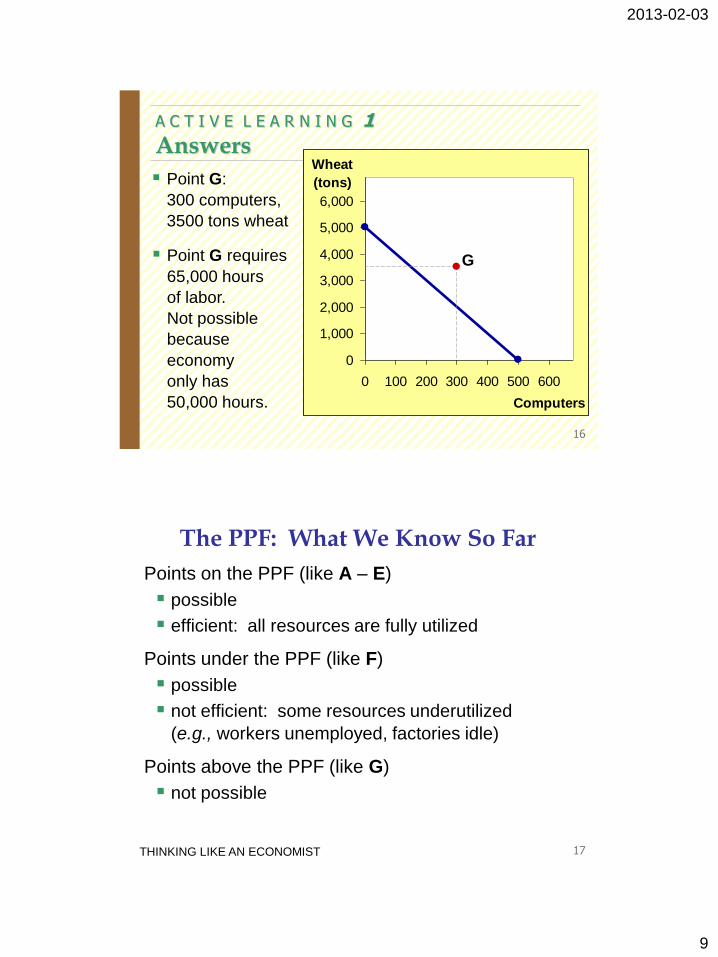
A C T I V E L E A R N I N G 1
Answers
16
0
1,000
2,000
3,000
4,000
5,000
6,000
0 100 200 300 400 500 600
Computers
Wheat
(tons) Point G:
300 computers,
3500 tons wheat
Point G requires
65,000 hours
of labor.
Not possible
because
economy
only has
50,000 hours.
G
THINKING LIKE AN ECONOMIST 17
The PPF: What We Know So Far
Points on the PPF (like A – E)
possible
efficient: all resources are fully utilized
Points under the PPF (like F)
possible
not efficient: some resources underutilized
(e.g., workers unemployed, factories idle)
Points above the PPF (like G)
not possible
2013-02-03
10
THINKING LIKE AN ECONOMIST 18
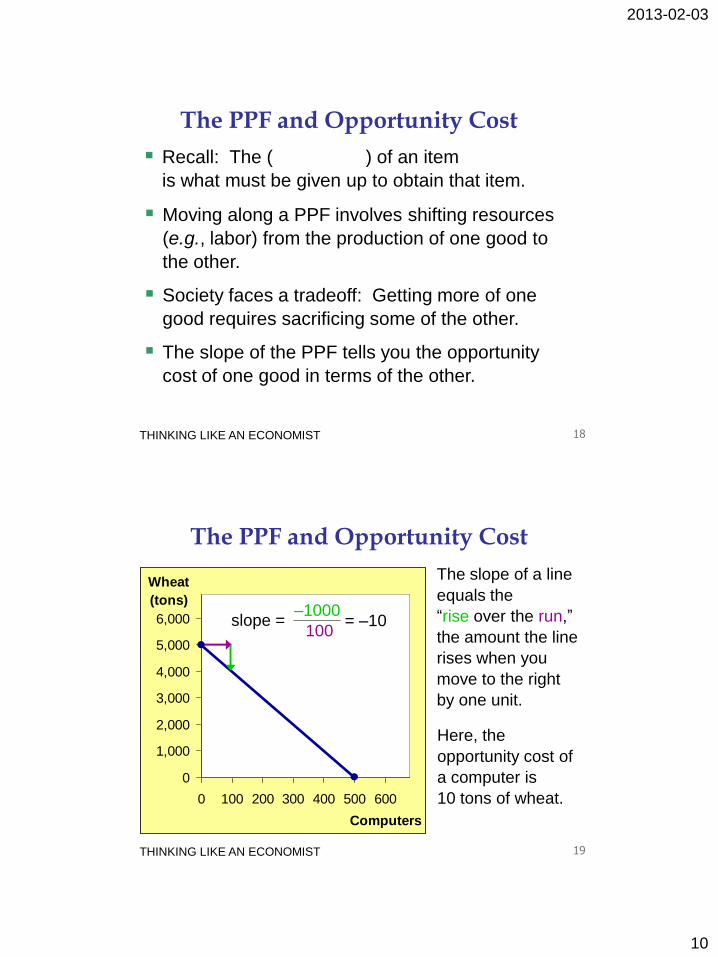
The PPF and Opportunity Cost
Recall: The ( ) of an item
is what must be given up to obtain that item.
Moving along a PPF involves shifting resources
(e.g., labor) from the production of one good to
the other.
Society faces a tradeoff: Getting more of one
good requires sacrificing some of the other.
The slope of the PPF tells you the opportunity
cost of one good in terms of the other.
THINKING LIKE AN ECONOMIST 19
The PPF and Opportunity Cost
The slope of a line
equals the
“rise over the run,”
the amount the line
rises when you
move to the right
by one unit.
0
1,000
2,000
3,000
4,000
5,000
6,000
0 100 200 300 400 500 600
Computers
Wheat
(tons)–1000
100 slope = = –10
Here, the
opportunity cost of
a computer is
10 tons of wheat.
2013-02-03
11
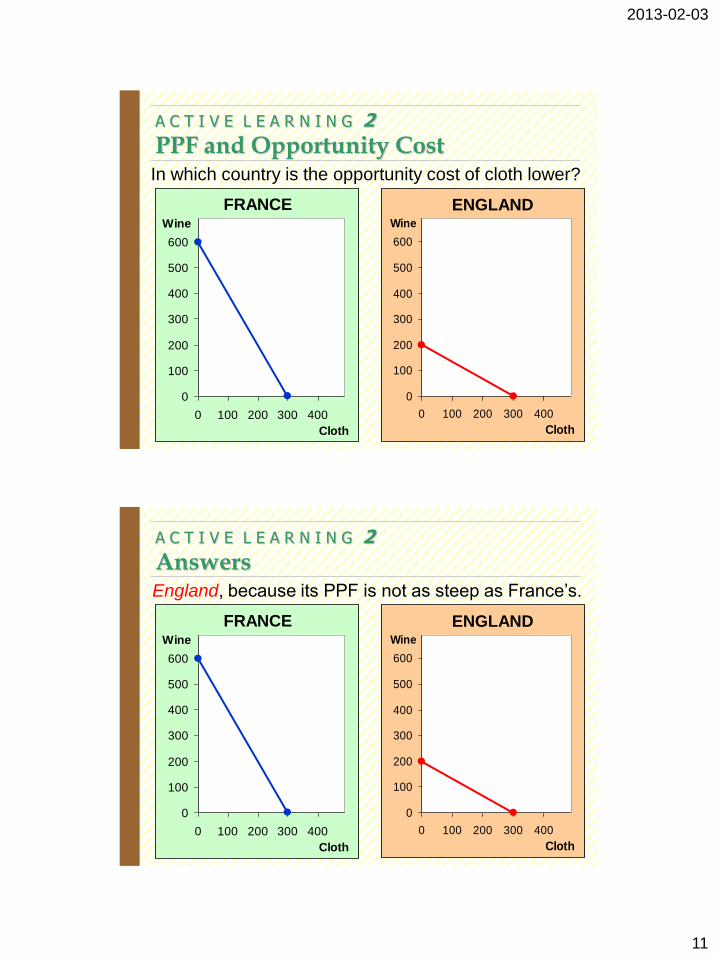
A C T I V E L E A R N I N G 2
PPF and Opportunity Cost
20
In which country is the opportunity cost of cloth lower?
0
100
200
300
400
500
600
0 100 200 300 400
Cloth
Wine
0
100
200
300
400
500
600
0 100 200 300 400
Cloth
Wine
FRANCE ENGLAND
A C T I V E L E A R N I N G 2
Answers
21
0
100
200
300
400
500
600
0 100 200 300 400
Cloth
Wine
0
100
200
300
400
500
600
0 100 200 300 400
Cloth
Wine
FRANCE ENGLAND
England, because its PPF is not as steep as France’s.
2013-02-03
12
THINKING LIKE AN ECONOMIST 22
0
1,000
2,000
3,000
4,000
5,000
6,000
0 100 200 300 400 500 600
Computers
Wheat
(tons)
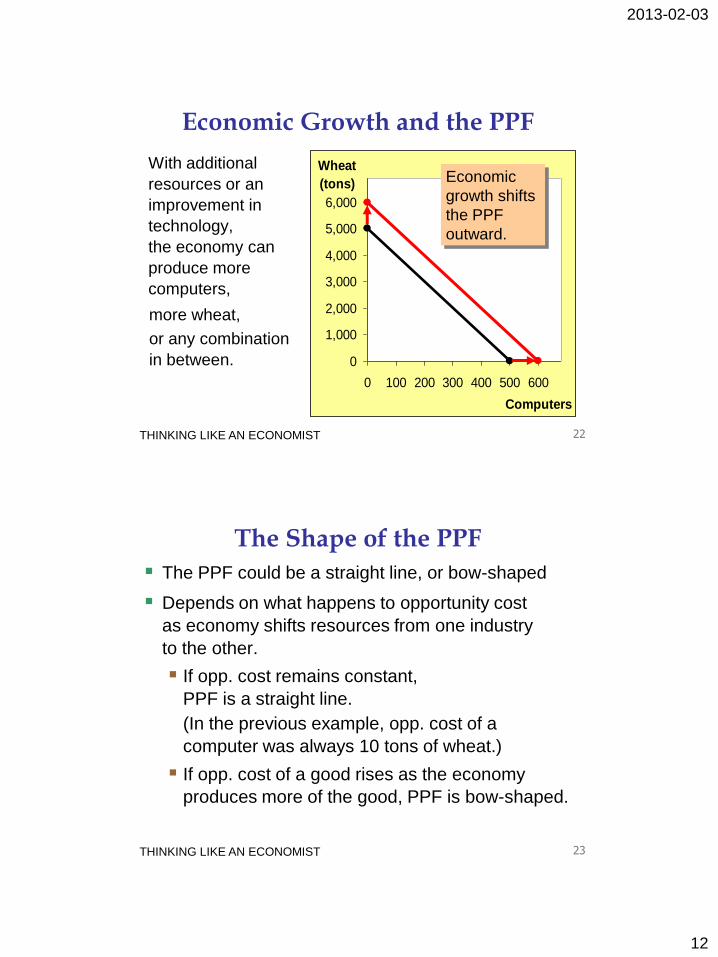
Economic Growth and the PPF
With additional
resources or an
improvement in
technology,
the economy can
produce more
computers,
more wheat,
or any combination
in between.
Economic
growth shifts
the PPF
outward.
THINKING LIKE AN ECONOMIST 23
The Shape of the PPF
The PPF could be a straight line, or bow-shaped
Depends on what happens to opportunity cost
as economy shifts resources from one industry
to the other.
If opp. cost remains constant,
PPF is a straight line.
(In the previous example, opp. cost of a
computer was always 10 tons of wheat.)
If opp. cost of a good rises as the economy
produces more of the good, PPF is bow-shaped.
2013-02-03
13
THINKING LIKE AN ECONOMIST 24
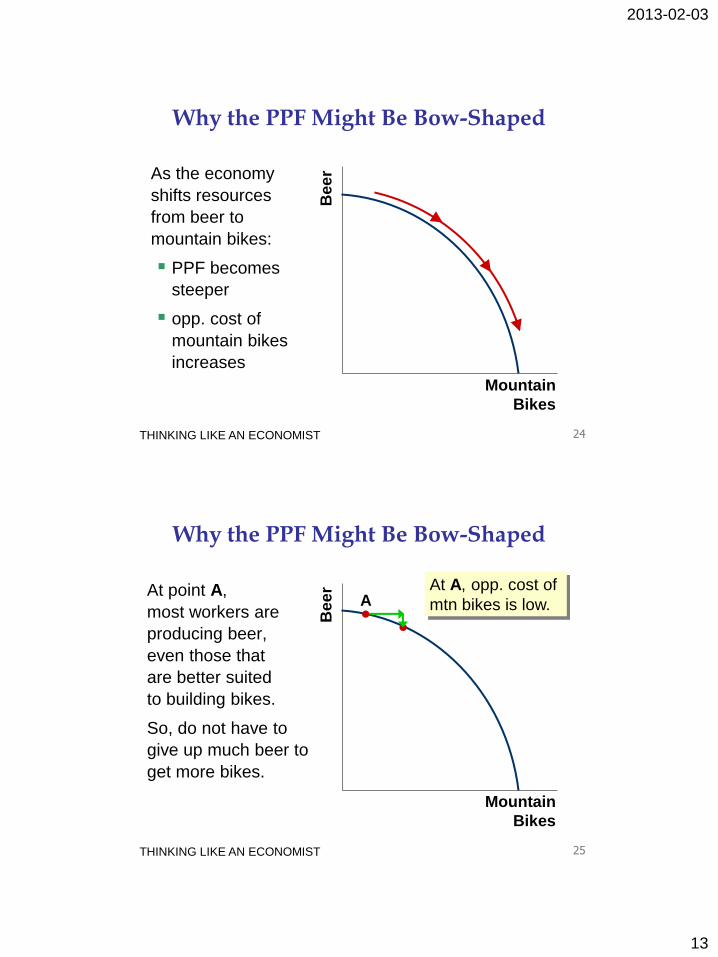
Why the PPF Might Be Bow-Shaped
Mountain
Bikes
Bee
r As the economy
shifts resources
from beer to
mountain bikes:
PPF becomes
steeper
opp. cost of
mountain bikes
increases
THINKING LIKE AN ECONOMIST 25
A
Why the PPF Might Be Bow-Shaped
At point A,
most workers are
producing beer,
even those that
are better suited
to building bikes.
So, do not have to
give up much beer to
get more bikes.
Mountain
Bikes
Bee
r At A, opp. cost of
mtn bikes is low.
2013-02-03
14
THINKING LIKE AN ECONOMIST 26
B
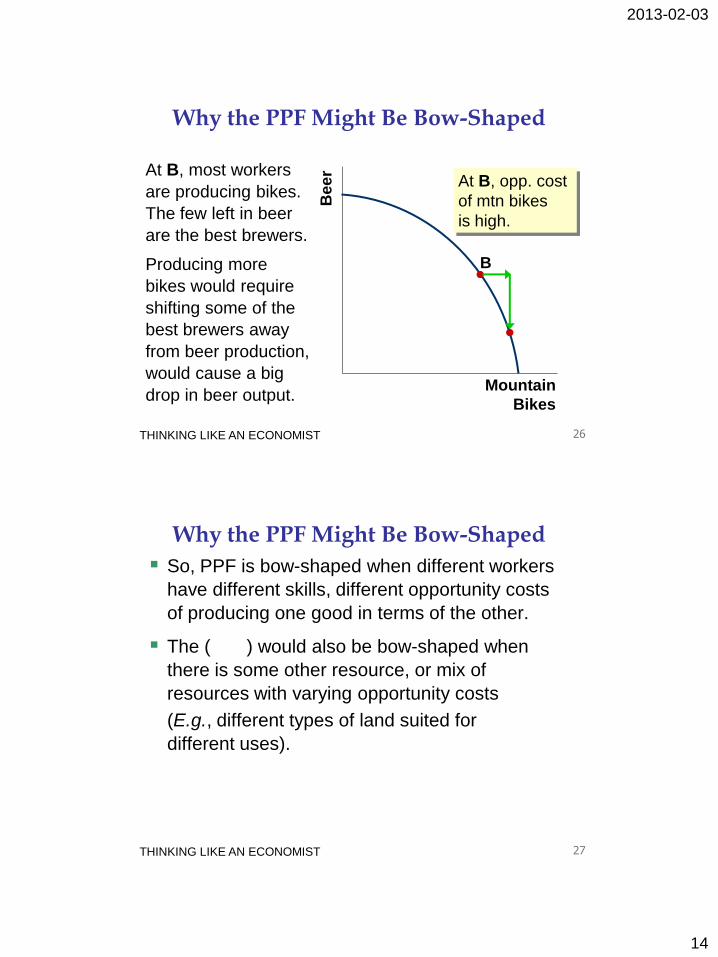
Why the PPF Might Be Bow-Shaped
At B, most workers
are producing bikes.
The few left in beer
are the best brewers.
Producing more
bikes would require
shifting some of the
best brewers away
from beer production,
would cause a big
drop in beer output. Mountain
Bikes
Bee
r
At B, opp. cost
of mtn bikes
is high.
THINKING LIKE AN ECONOMIST 27
Why the PPF Might Be Bow-Shaped
So, PPF is bow-shaped when different workers
have different skills, different opportunity costs
of producing one good in terms of the other.
The ( ) would also be bow-shaped when
there is some other resource, or mix of
resources with varying opportunity costs
(E.g., different types of land suited for
different uses).
2013-02-03
15
THINKING LIKE AN ECONOMIST 28
The PPF: A Summary
The PPF shows all combinations of two goods
that an economy can possibly produce,
given its resources and technology.
The PPF illustrates the concepts of
tradeoff and opportunity cost,
efficiency and inefficiency,
unemployment, and economic growth.
A bow-shaped PPF illustrates the concept of
increasing opportunity cost.
THINKING LIKE AN ECONOMIST 29
Microeconomics and Macroeconomics
Microeconomics is the study of how households
and firms make decisions and how they interact
in markets.
( ) is the study of economy-wide
phenomena, including inflation, unemployment,
and economic growth.
These two branches of economics are closely
intertwined, yet distinct – they address different
questions.
2013-02-03
16
The Economist as Policy Advisor As scientists, economists make
positive statements,
which attempt to describe the world as it is.
As policy advisors, economists make
( ),
which attempt to prescribe how the world should be.
Positive statements can be confirmed or refuted,
normative statements cannot.
Govt employs many economists for policy advice.
E.g., the U.S. President has a Council of Economic
Advisors, which the author of this textbook chaired
from 2003 to 2005. 30
A C T I V E L E A R N I N G 3
Identifying positive vs. normative
31
Which of these statements are “positive” and which
are “normative”? How can you tell the difference?
a. Prices rise when the government increases the
quantity of money.
b. The government should print less money.
c. A tax cut is needed to stimulate the economy.
d. An increase in the price of burritos will cause an
increase in consumer demand for video rentals.
2013-02-03
17
A C T I V E L E A R N I N G 3
Answers
32
a. Prices rise when the government increases the
quantity of money.
Positive – describes a relationship, could use
data to confirm or refute.
b. The government should print less money.
Normative – this is a value judgment, cannot be
confirmed or refuted.
A C T I V E L E A R N I N G 3
Answers
33
c. A tax cut is needed to stimulate the economy.
Normative – another value judgment.
d. An increase in the price of burritos will cause an
increase in consumer demand for video rentals.
Positive – describes a relationship.
Note that a statement need not be true to be
positive.
2013-02-03
18
THINKING LIKE AN ECONOMIST 34
Why Economists Disagree
( ) often give conflicting policy advice.
They sometimes disagree about the validity of
alternative positive theories about the world.
They may have different values and, therefore,
different normative views about what policy
should try to accomplish.
Yet, there are many propositions about which
most economists agree.
CHAPTER SUMMARY
As scientists, economists try to explain the world
using models with appropriate assumptions.
Two simple models are the Circular-Flow Diagram
and the Production Possibilities Frontier.
Microeconomics studies the behavior of
consumers and firms, and their interactions in
markets. Macroeconomics studies the economy
as a whole.
As policy advisers, economists offer advice on how
to improve the world. 35