Embed Size (px)
Citation preview
The Florida LegislatureOffice of Economic and
Demographic Research850.487.1402http://edr.state.fl.us
Presented by:
Economics of Health Care Spending
October 8, 2015
NOTE (10/15/2015): Slide #18 has been revised from the original presentation.
Health Care Market is Unique
1
The field of health economics is a growing research field, but it largely draws on the more general field of applied microeconomics, focusing on issues of demand and supply in the marketplace.
The health care product is ill-defined (a broad range of goods and services), the need for care is random and unpredictable for most events, and the outcome of care is sometimes uncertain.
Institutionally, health care is an atypical market. It not only has consumers and producers—it also has large segments of payers (private health insurance in all forms and government) that are separated from the consumers. This institutional structure leads to unique problems.
o The purpose of private insurers is to protect people against the risk of high out-of-pocket expenditures on personal health services. They do this by essentially financing personal health care services.
o In general, governments do not play an active role in resource allocation; however, direct government intervention is common in the health care sector. Collectively, government is also the largest payer.
Health Care Services as a GDP Component
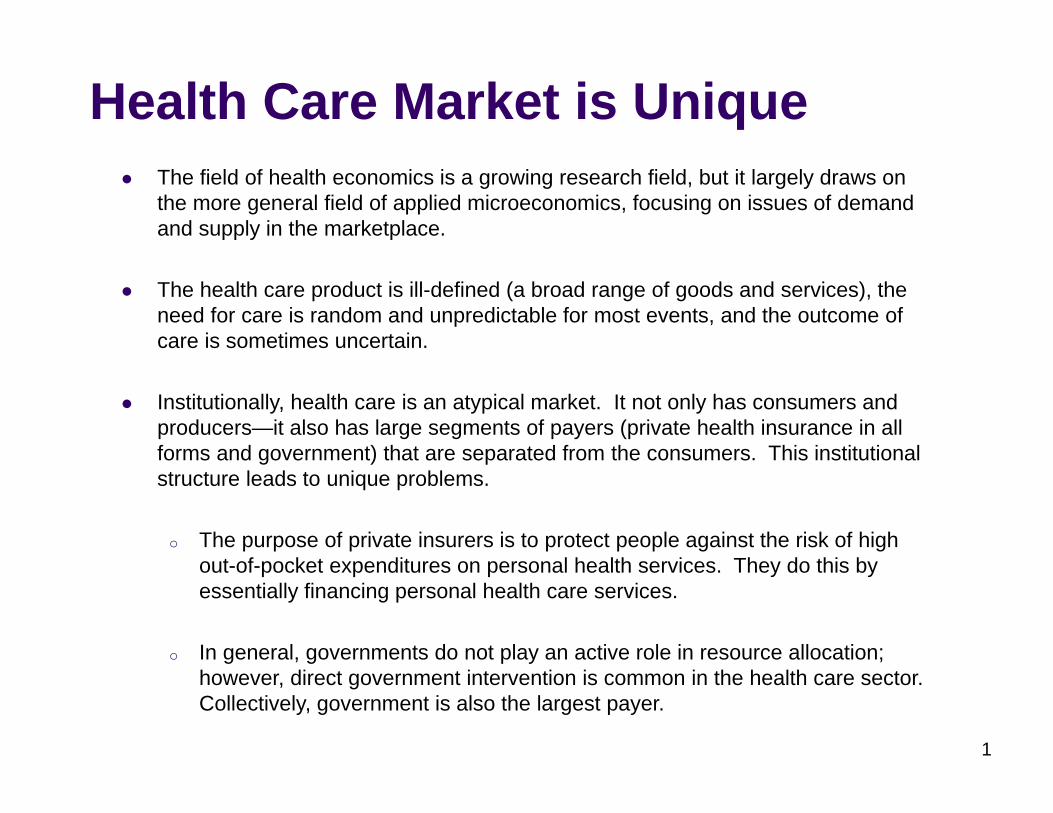
The US share of health care services is slightly above its 17-year average share of 6.0 percent; Florida is strongly above its 17-year average share of 7.0 percent. The gap between the US and Florida existed throughout this period, but began to widen in 2008. This means that the health care sector is a more important—and increasing—component of Florida’s economy.
2
However, Florida’s share of US Health Care Services GDP is slightly less than the state’s population share of the US—and—Florida’s per capita health care level is 4.9% less than the US as a whole.
Together, these metrics indicate that health care is an increasingly dominant force in Florida’s economy, but the recent strengthening is not out of line with Florida’s population growth over the same period.
The Health Care sector comprises establishments providing health care for individuals. All industries in the sector share a commonality of process, namely, labor inputs of health practitioners with the requisite expertise. Many of the industries are defined based on the educational degree held by the practitioners included in the industry. In this regard, the sector does not include commodities or insurance. When they are included, all US health care spending was 17.4% of GDP in 2013.
Economic Problems and Market Imperfections...Asymmetric Information...A situation where some participants in an economic transaction have access to more, or better, information pertinent to the transaction than other participants. The existence of asymmetric information is a market failure.
Adverse Selection...Essentially, the worst risks are the most likely to present, and this information is only known to the individual. In regard to health care and insurance, the sickest people have the greatest incentive to seek coverage.Moral Hazard...A contract which promises people a benefit on the occurrence of certain events will cause a change in behavior to make these events more likely. In regard to health care, the existence of insurance distorts consumption decisions (due to the lower perceived costs and financial risk) to make the use of health care services more likely (in terms of frequency and degree) than it otherwise would have been.
Externalities...a cost or benefit arising from any activity which does not accrue to the person or organization carrying out the activity, but rather to other people.
Public Health…vaccinations and control of contagions; focusing only on personal benefits and costs leads to suboptimal (too low) consumption of health care services from a societal perspective.Health Behaviors & Cost-Shifting to Others…individual choices and the presence of insurance risk-pooling or publicly provided health care (Medicaid and Medicare); this leads to over-consumption of health care services.Public Goods…research and development; the potential for free riders leads to sub-optimal production.
3
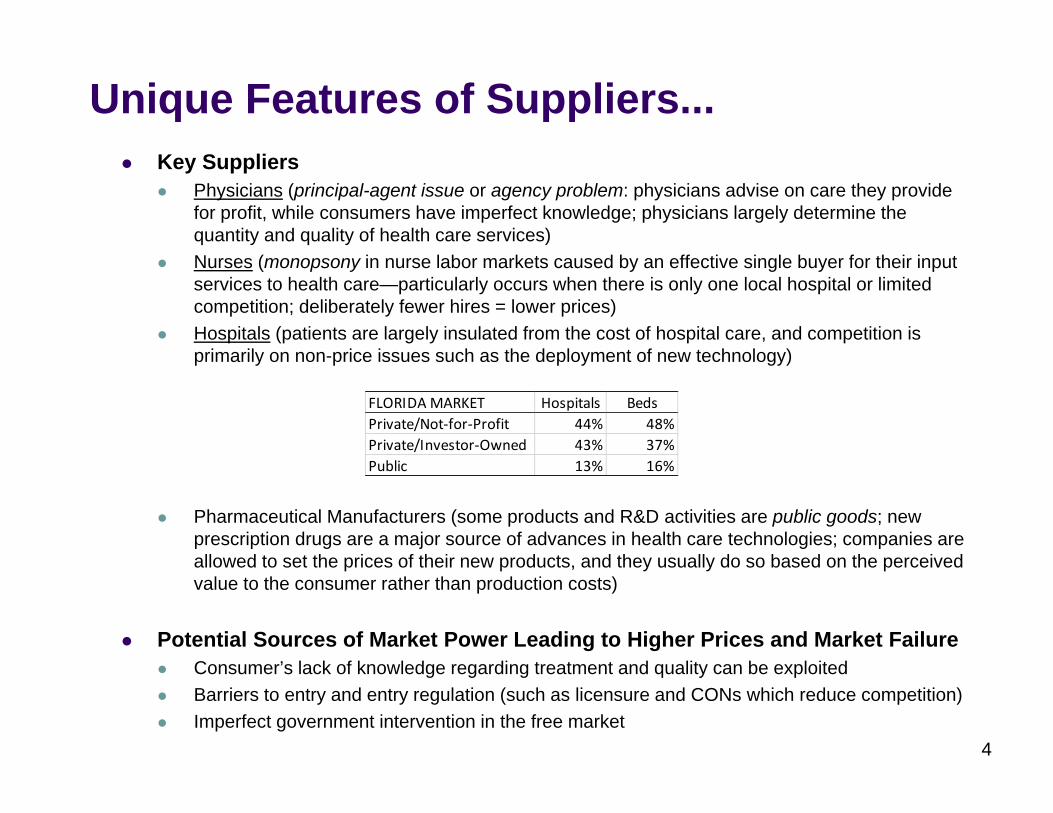
Unique Features of Suppliers...Key Suppliers
Physicians (principal-agent issue or agency problem: physicians advise on care they provide for profit, while consumers have imperfect knowledge; physicians largely determine the quantity and quality of health care services)Nurses (monopsony in nurse labor markets caused by an effective single buyer for their input services to health care—particularly occurs when there is only one local hospital or limited competition; deliberately fewer hires = lower prices)Hospitals (patients are largely insulated from the cost of hospital care, and competition is primarily on non-price issues such as the deployment of new technology)
Pharmaceutical Manufacturers (some products and R&D activities are public goods; new prescription drugs are a major source of advances in health care technologies; companies are allowed to set the prices of their new products, and they usually do so based on the perceived value to the consumer rather than production costs)
Potential Sources of Market Power Leading to Higher Prices and Market FailureConsumer’s lack of knowledge regarding treatment and quality can be exploitedBarriers to entry and entry regulation (such as licensure and CONs which reduce competition)Imperfect government intervention in the free market
4
FLORIDA MARKET Hospitals BedsPrivate/Not‐for‐Profit 44% 48%Private/Investor‐Owned 43% 37%Public 13% 16%
Market Imperfections Lead to Government Intervention...
5
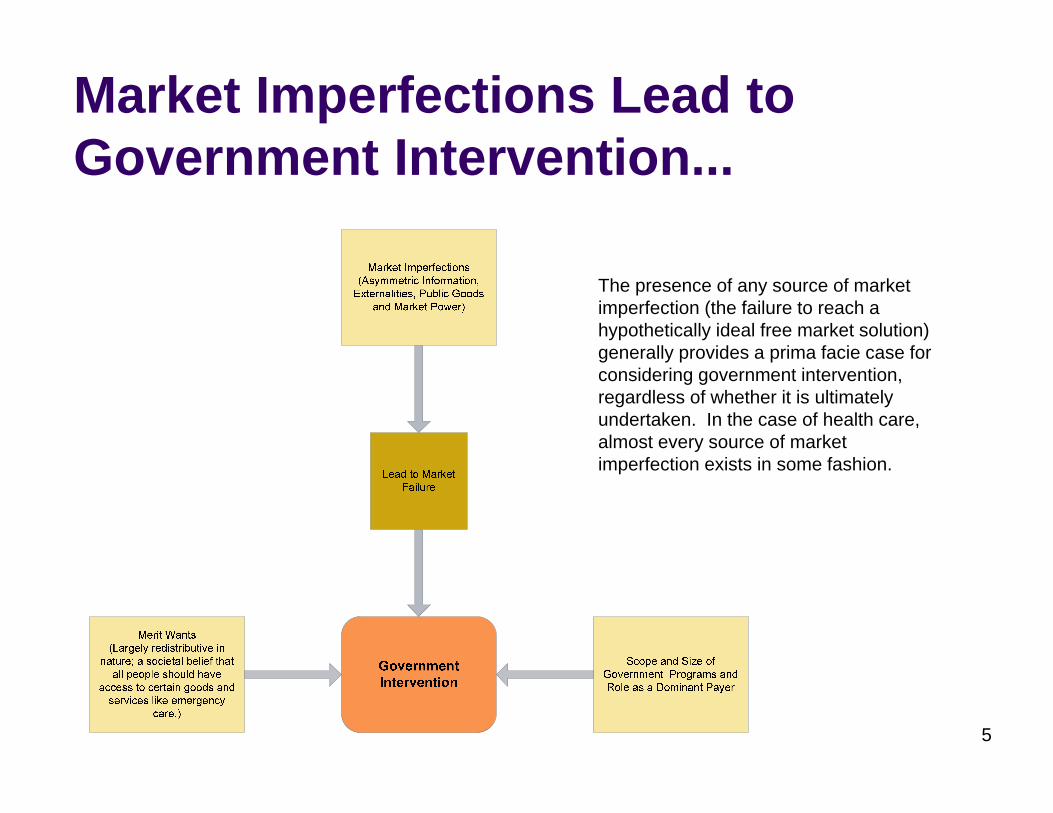
The presence of any source of market imperfection (the failure to reach a hypothetically ideal free market solution) generally provides a prima facie case for considering government intervention, regardless of whether it is ultimately undertaken. In the case of health care, almost every source of market imperfection exists in some fashion.
Key Determinants of Pricing...
6
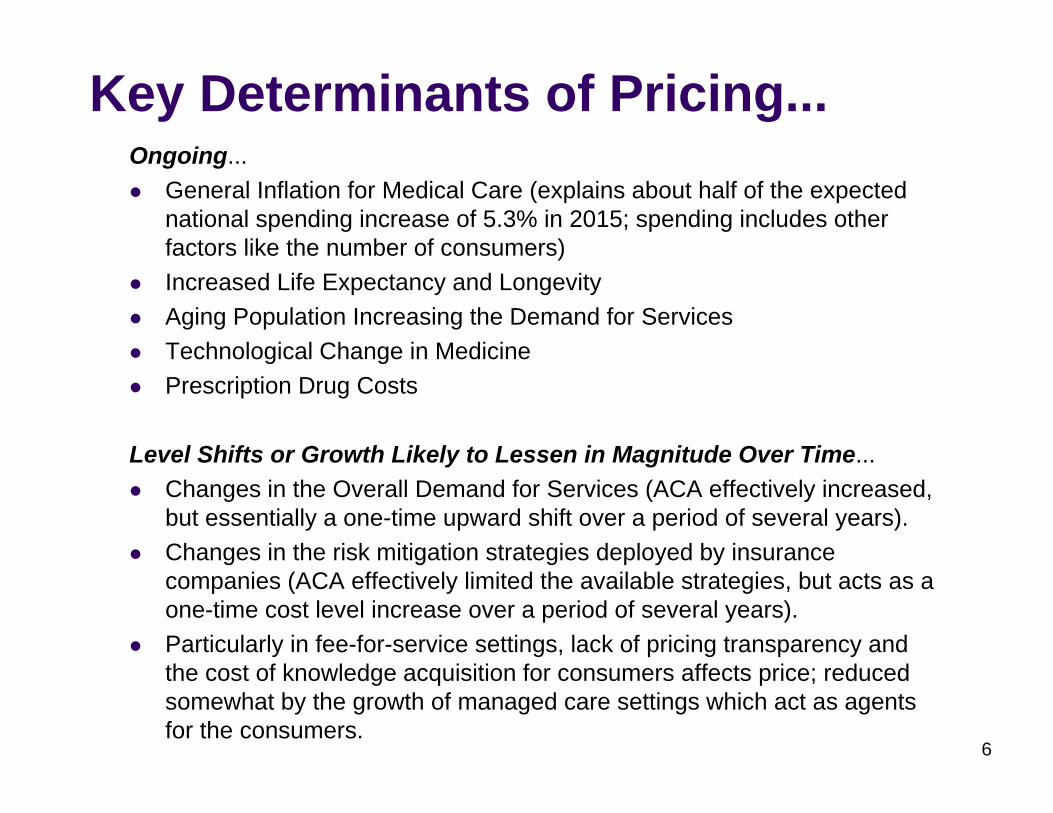
Ongoing...General Inflation for Medical Care (explains about half of the expected national spending increase of 5.3% in 2015; spending includes other factors like the number of consumers)Increased Life Expectancy and LongevityAging Population Increasing the Demand for ServicesTechnological Change in MedicinePrescription Drug Costs
Level Shifts or Growth Likely to Lessen in Magnitude Over Time...Changes in the Overall Demand for Services (ACA effectively increased, but essentially a one-time upward shift over a period of several years).Changes in the risk mitigation strategies deployed by insurance companies (ACA effectively limited the available strategies, but acts as a one-time cost level increase over a period of several years).Particularly in fee-for-service settings, lack of pricing transparency and the cost of knowledge acquisition for consumers affects price; reduced somewhat by the growth of managed care settings which act as agents for the consumers.
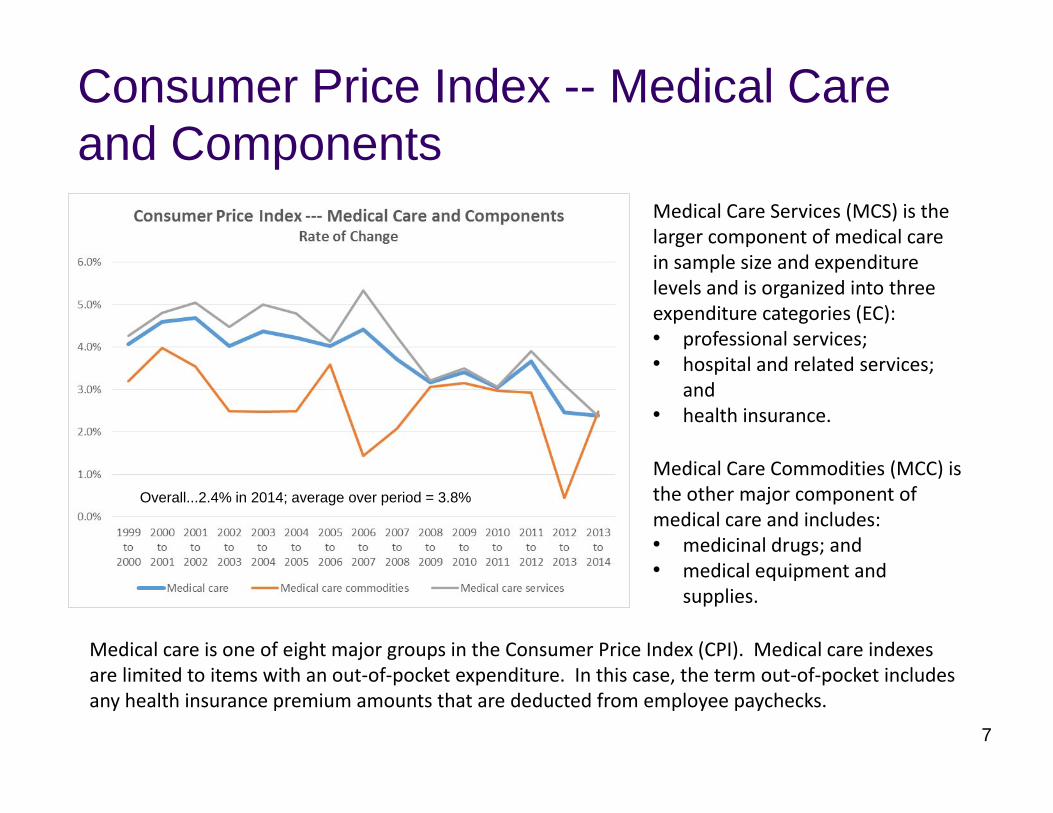
Consumer Price Index -- Medical Care and Components
Medical Care Services (MCS) is the larger component of medical care in sample size and expenditure levels and is organized into three expenditure categories (EC):• professional services;• hospital and related services;
and• health insurance.
Medical Care Commodities (MCC) is the other major component of medical care and includes:• medicinal drugs; and• medical equipment and
supplies.
Medical care is one of eight major groups in the Consumer Price Index (CPI). Medical care indexes are limited to items with an out‐of‐pocket expenditure. In this case, the term out‐of‐pocket includes any health insurance premium amounts that are deducted from employee paychecks.
Overall...2.4% in 2014; average over period = 3.8%
7
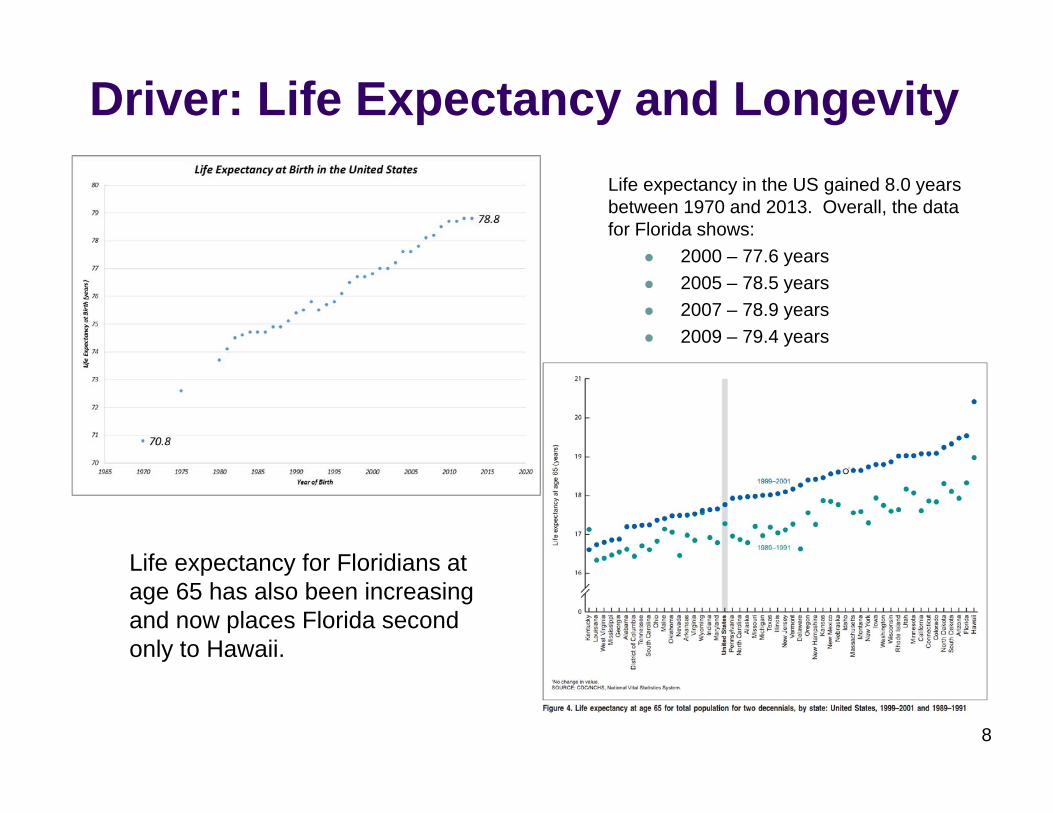
Driver: Life Expectancy and Longevity Life expectancy in the US gained 8.0 years between 1970 and 2013. Overall, the data for Florida shows:
2000 – 77.6 years2005 – 78.5 years2007 – 78.9 years2009 – 79.4 years
Life expectancy for Floridians at age 65 has also been increasing and now places Florida second only to Hawaii.
8
Driver: Aging Population
9
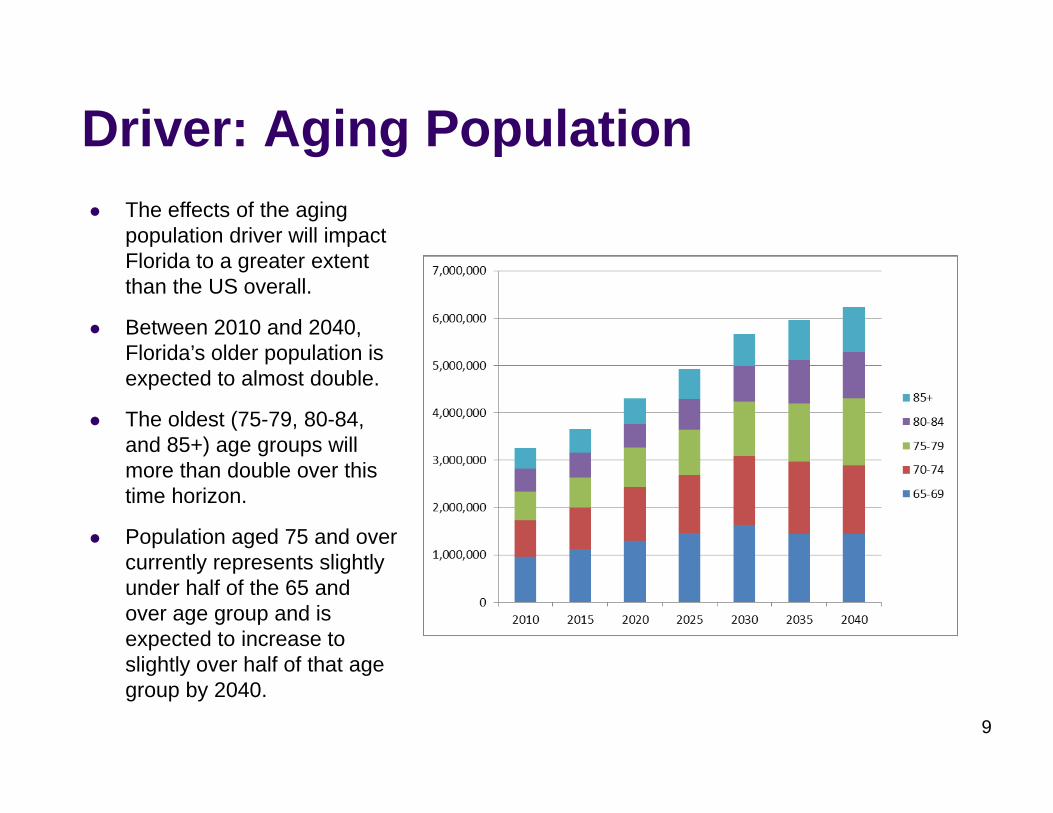
The effects of the aging population driver will impact Florida to a greater extent than the US overall.
Between 2010 and 2040, Florida’s older population is expected to almost double.
The oldest (75-79, 80-84, and 85+) age groups will more than double over this time horizon.
Population aged 75 and over currently represents slightly under half of the 65 and over age group and is expected to increase to slightly over half of that age group by 2040.
Aging (continued)…An increasing array of new services, procedures and drugs prolong life – but also the potential for chronic problems.
Medicare’s main trust fund is expected to be unable to cover its expenses starting in 2030.
The 5% of Medicare fee-for-service beneficiaries who die each year account for one-fourth of all Medicare inpatient expenditures.
Today, elderly and disabled Medicaid recipients account for an estimated 29.83% of the total caseload -- but 63.12% of Medicaid spending.
Use of acute and long-term care services is high.
The majority of nursing home residents rely on Medicaid support after the cost of their care exhausts their savings (spend-down), qualifying them for assistance.
The number of available family caregivers will diminish in relation to the number who need care. 10
Aging (continued)...
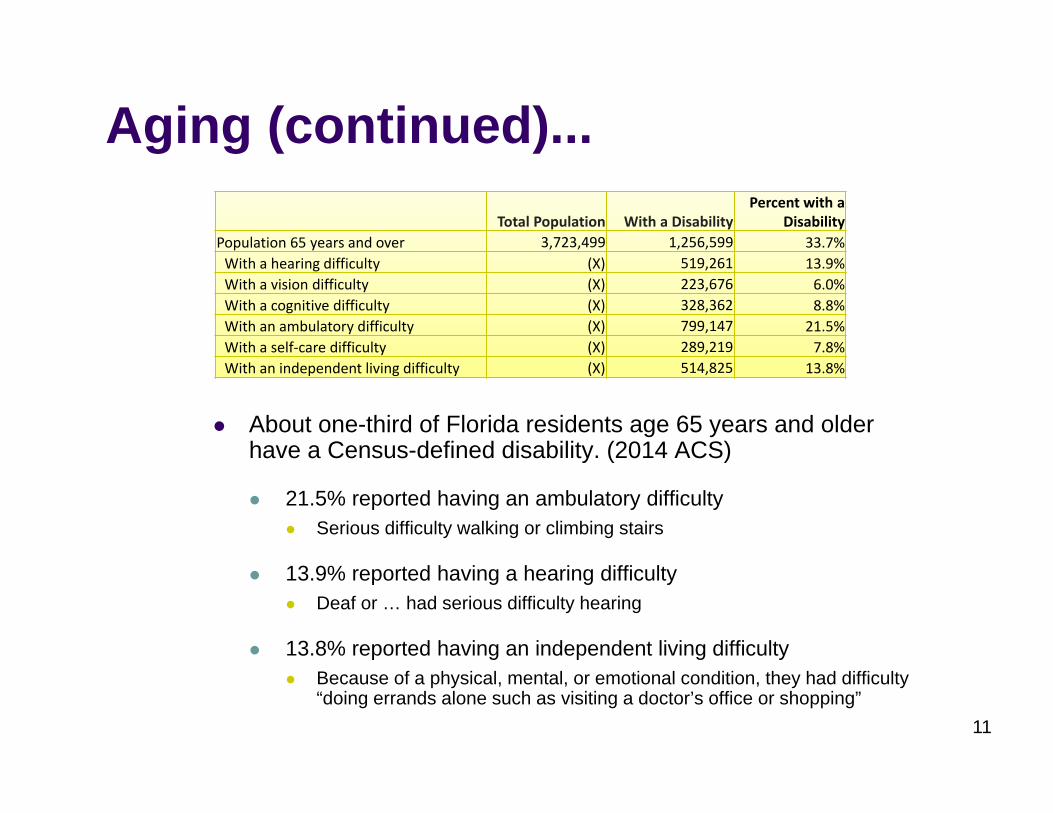
About one-third of Florida residents age 65 years and older have a Census-defined disability. (2014 ACS)
21.5% reported having an ambulatory difficulty Serious difficulty walking or climbing stairs
13.9% reported having a hearing difficultyDeaf or … had serious difficulty hearing
13.8% reported having an independent living difficultyBecause of a physical, mental, or emotional condition, they had difficulty “doing errands alone such as visiting a doctor’s office or shopping”
11
Total Population With a DisabilityPercent with a
DisabilityPopulation 65 years and over 3,723,499 1,256,599 33.7%With a hearing difficulty (X) 519,261 13.9%With a vision difficulty (X) 223,676 6.0%With a cognitive difficulty (X) 328,362 8.8%With an ambulatory difficulty (X) 799,147 21.5%With a self‐care difficulty (X) 289,219 7.8%With an independent living difficulty (X) 514,825 13.8%
Driver: New Medical TechnologiesEconomic Tradeoffs…Techology gains in what medicine can do are outpacing what it is economically feasible to do.
Non-Price Competition...Hospitals and some individual providers invest in new technologies and equipment to attract patients (described as the medical arms race in the literature). Intense competition of this type has been associated with higher costs. Cost-based reimbursement further exacerbates this situation.
Outcomes...Innovations are not equal in their effects on health care outcomes. If reductions in the rate of technology diffusion are mainly attributable to changes in the adoption of technologies with low marginal benefits, these reductions may not affect outcomes in a material way.
12
Driver: Prescription Drug CostsThe use of and expenditures on prescription drugs have both been significantly increasing. New specialty drugs are a major cost factor in overall price growth.
Many aspects of research and development have the nature of a public good.
Governments make decisions about drug approval, drug formularies, and patent protection. The field is also subject to strong entry regulation in that government approval is needed before a drug can be marketed.
The drug development and discovery process is lengthy, risky and costly—it takes about 14 years to move from basic research to market launch for a successful product. There is also a high failure rate—only 8% of the drugs starting the FDA approval process succeed. In 2000, the costs for clinical trials alone ranged from $15.2 million to $86.3 million. Revenue from the sale of a drug is years in coming, but costs are front-loaded.
Each firm develops strategies to address the actual and anticipated decisions of rivals and governments.
13
Special Case: Quality
14
Producers / suppliers in all sectors make decisions about levels of quality to offer, and consumers make decisions about the level of quality to accept or purchase.
In most markets, consumers pay more for products that are known to have higher quality.
Health care’s quality has higher ramifications, potentially even the difference between life and death.
The provision of quality is costly to providers, but not typically used as a basis for payment because individual patients have difficulty assessing the level of quality being offered.
Mechanisms typically associated with quality control:1. Professional Norms (initiated by providers)2. Regulation (initiated by governments)3. Market Competition (initiated by patients)4. Tort Law (initiated by injured persons)
Special Case: Managed Care
15
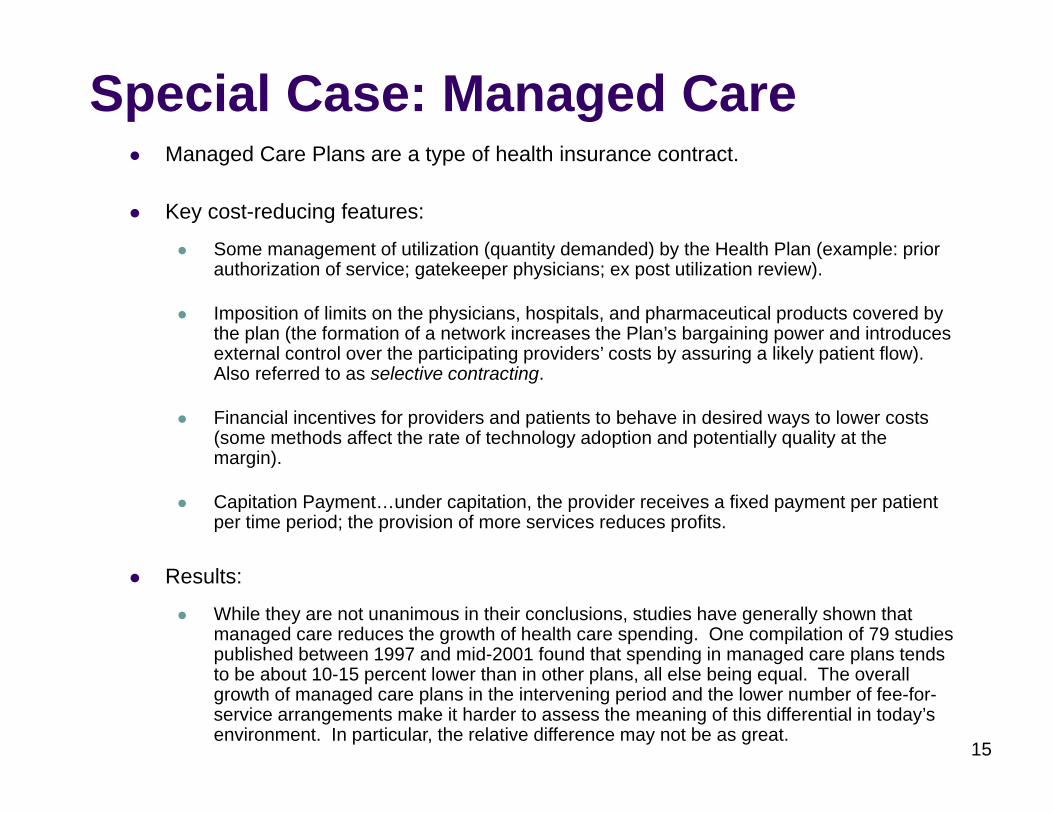
Managed Care Plans are a type of health insurance contract.
Key cost-reducing features:
Some management of utilization (quantity demanded) by the Health Plan (example: prior authorization of service; gatekeeper physicians; ex post utilization review).
Imposition of limits on the physicians, hospitals, and pharmaceutical products covered by the plan (the formation of a network increases the Plan’s bargaining power and introduces external control over the participating providers’ costs by assuring a likely patient flow). Also referred to as selective contracting.
Financial incentives for providers and patients to behave in desired ways to lower costs (some methods affect the rate of technology adoption and potentially quality at the margin).
Capitation Payment…under capitation, the provider receives a fixed payment per patient per time period; the provision of more services reduces profits.
Results:
While they are not unanimous in their conclusions, studies have generally shown that managed care reduces the growth of health care spending. One compilation of 79 studies published between 1997 and mid-2001 found that spending in managed care plans tends to be about 10-15 percent lower than in other plans, all else being equal. The overall growth of managed care plans in the intervening period and the lower number of fee-for-service arrangements make it harder to assess the meaning of this differential in today’s environment. In particular, the relative difference may not be as great.
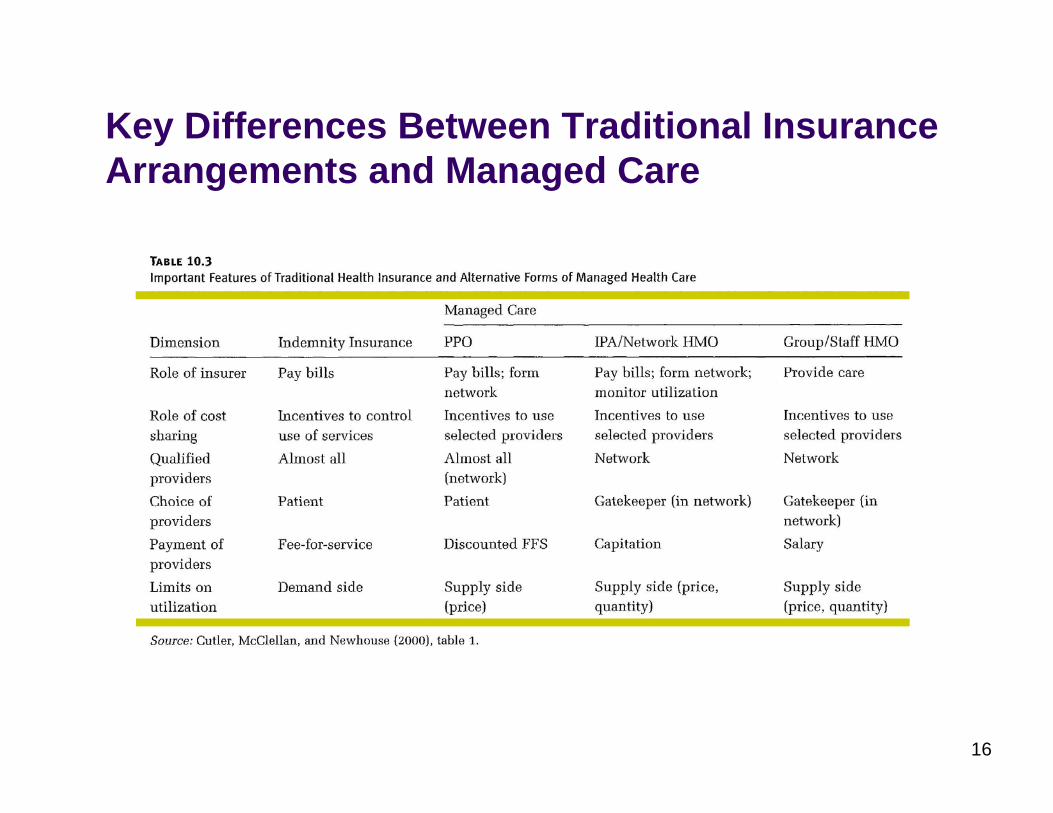
Key Differences Between Traditional Insurance Arrangements and Managed Care
16
The Combined Roles of Government (Federal and States) in Health Care
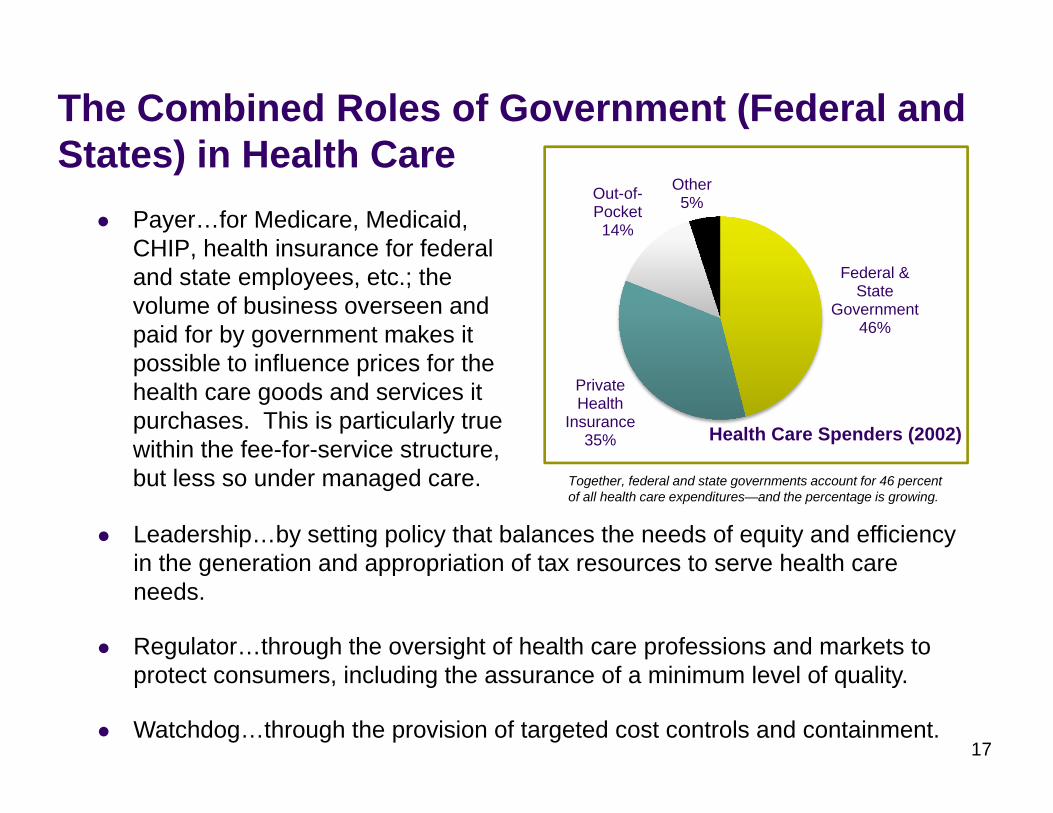
Payer…for Medicare, Medicaid, CHIP, health insurance for federal and state employees, etc.; the volume of business overseen and paid for by government makes it possible to influence prices for the health care goods and services it purchases. This is particularly true within the fee-for-service structure, but less so under managed care.
17
Federal & State
Government46%
Private Health
Insurance35%
Out-of-Pocket14%
Other5%
Health Care Spenders (2002)
Leadership…by setting policy that balances the needs of equity and efficiency in the generation and appropriation of tax resources to serve health care needs.
Regulator…through the oversight of health care professions and markets to protect consumers, including the assurance of a minimum level of quality.
Watchdog…through the provision of targeted cost controls and containment.
Together, federal and state governments account for 46 percent of all health care expenditures—and the percentage is growing.
State Budget for Medicaid
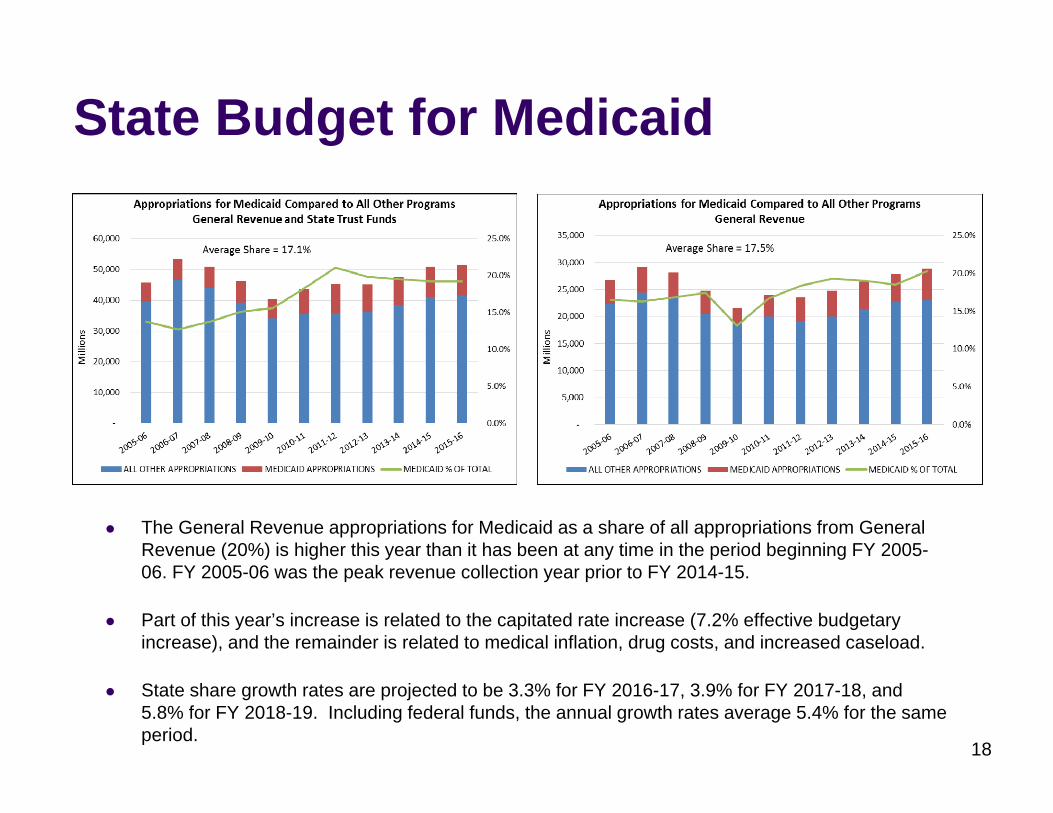
The General Revenue appropriations for Medicaid as a share of all appropriations from General Revenue (20%) is higher this year than it has been at any time in the period beginning FY 2005-06. FY 2005-06 was the peak revenue collection year prior to FY 2014-15.
Part of this year’s increase is related to the capitated rate increase (7.2% effective budgetary increase), and the remainder is related to medical inflation, drug costs, and increased caseload.
State share growth rates are projected to be 3.3% for FY 2016-17, 3.9% for FY 2017-18, and 5.8% for FY 2018-19. Including federal funds, the annual growth rates average 5.4% for the same period.
18
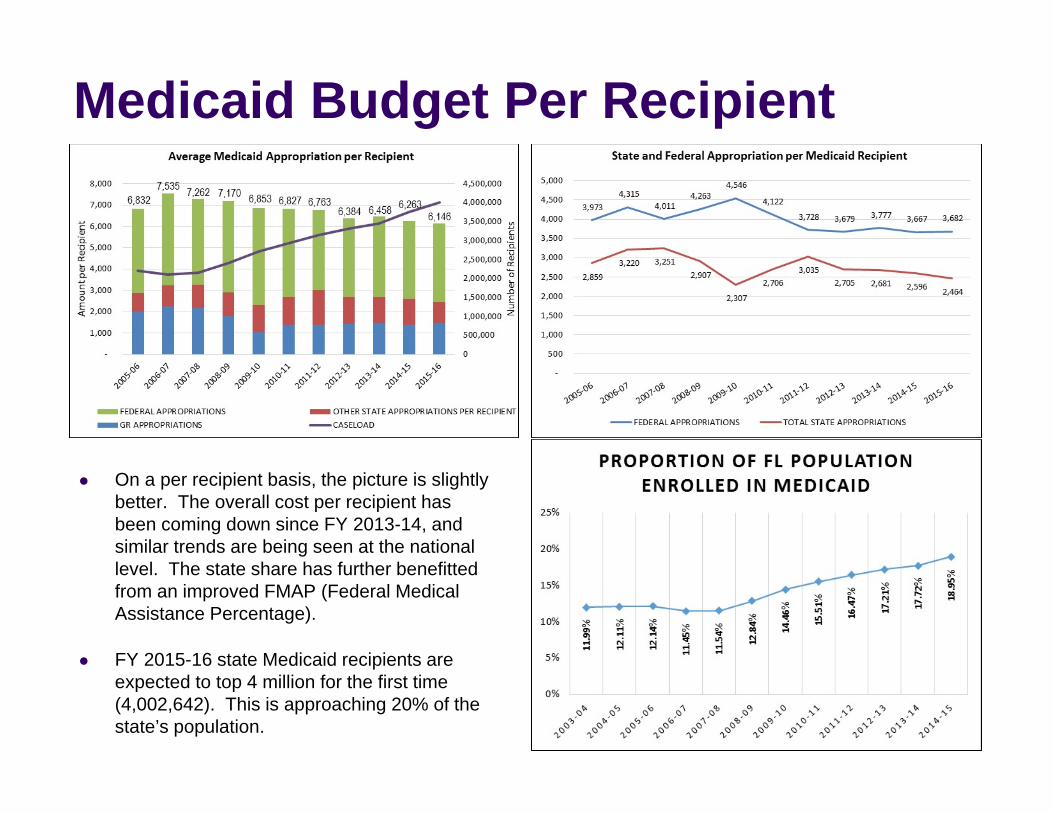
Medicaid Budget Per Recipient
On a per recipient basis, the picture is slightly better. The overall cost per recipient has been coming down since FY 2013-14, and similar trends are being seen at the national level. The state share has further benefitted from an improved FMAP (Federal Medical Assistance Percentage).
FY 2015-16 state Medicaid recipients are expected to top 4 million for the first time (4,002,642). This is approaching 20% of the state’s population.
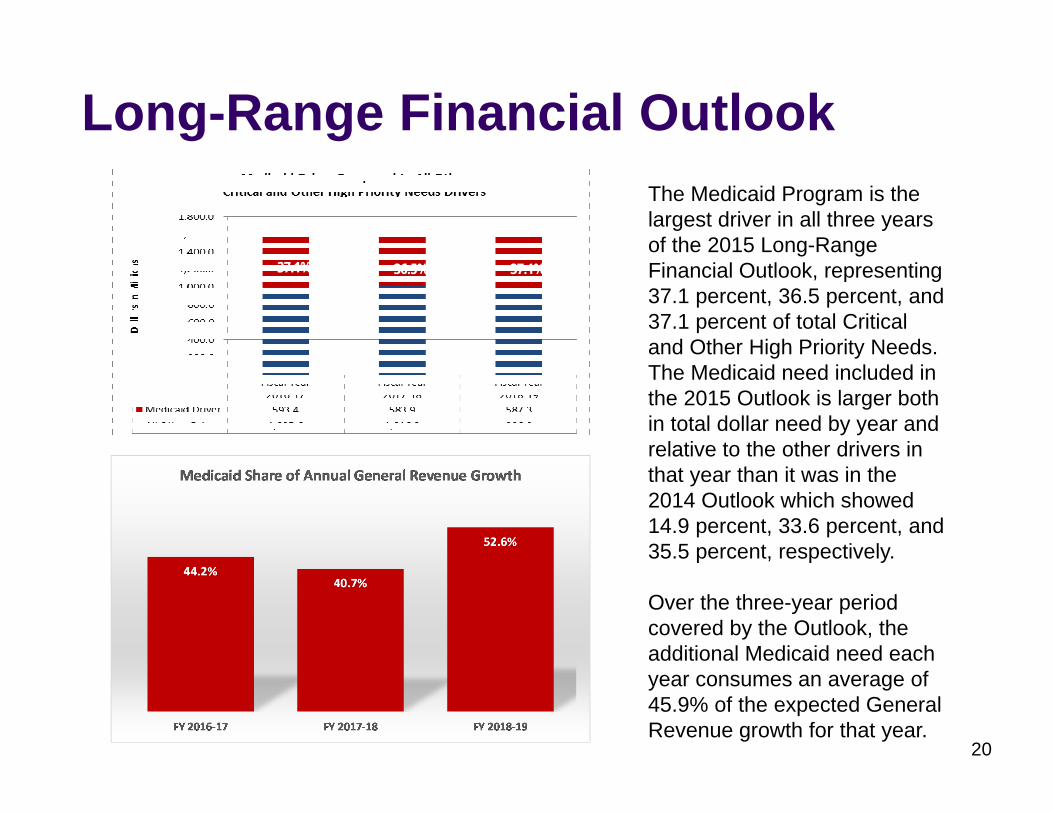
Long-Range Financial OutlookThe Medicaid Program is the largest driver in all three years of the 2015 Long-Range Financial Outlook, representing37.1 percent, 36.5 percent, and 37.1 percent of total Critical and Other High Priority Needs.The Medicaid need included in the 2015 Outlook is larger both in total dollar need by year and relative to the other drivers in that year than it was in the 2014 Outlook which showed 14.9 percent, 33.6 percent, and 35.5 percent, respectively.
Over the three-year period covered by the Outlook, the additional Medicaid need each year consumes an average of 45.9% of the expected General Revenue growth for that year.
20
37.1%
37.1% 36.5% 37.1%
State Driver: Medicaid Conversion There is an additional factor which may be driving the initial growth in Florida’s managed care program for Medicaid. CMS requires rates to be actuarially sound, which has been defined by some actuaries to mean rates that “provide for all reasonable, appropriate and attainable costs, including health benefits, health benefit settlement expenses, marketing and administrative expenses, any state-mandated assessments and taxes, and the cost of capital.” To the extent that the state tightly controlled prior cost increases under the old fee-for-service model, there may be a one-time adjustment to comply with the CMS requirement to be actuarially sound.
21
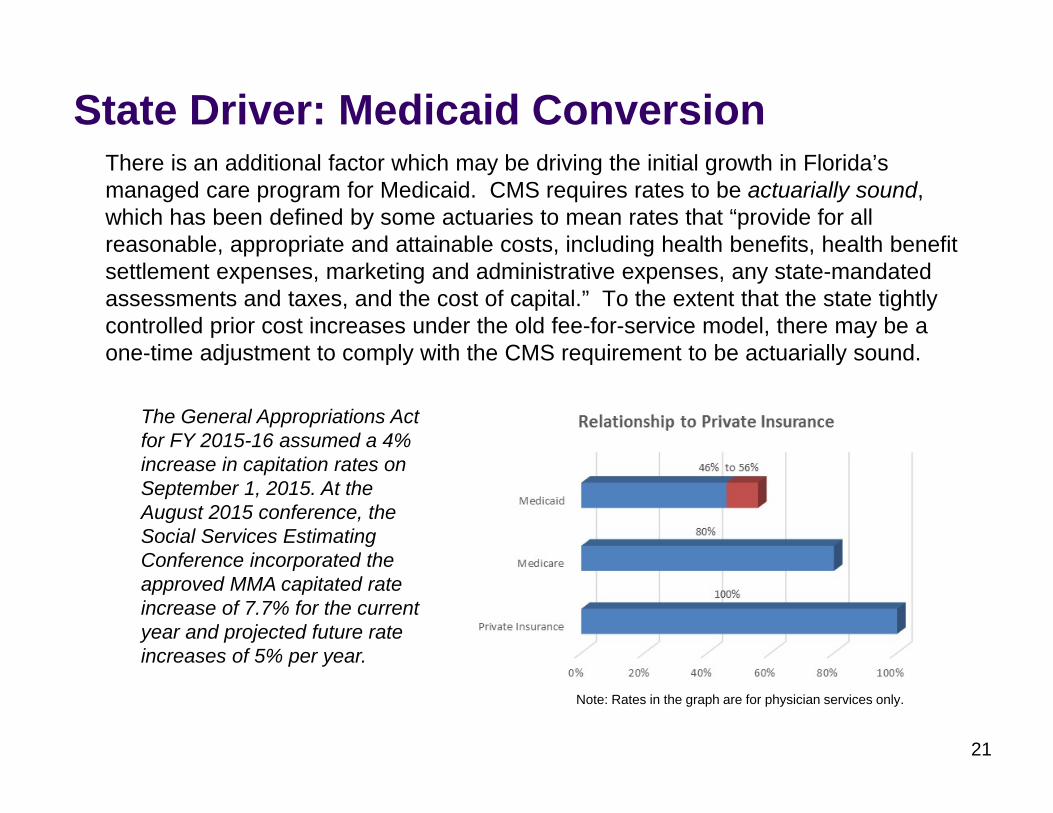
The General Appropriations Act for FY 2015-16 assumed a 4% increase in capitation rates on September 1, 2015. At the August 2015 conference, the Social Services Estimating Conference incorporated the approved MMA capitated rate increase of 7.7% for the current year and projected future rate increases of 5% per year.
Note: Rates in the graph are for physician services only.