Embed Size (px)
Citation preview

Spatial Analysis for Medicare Spending

Does Higher Spending Translate to Better Health or Better Quality Health Care?
Compare Health Care Spending to HCC Scores and Hospital Readmission Rates
Examine Spatial Patterns
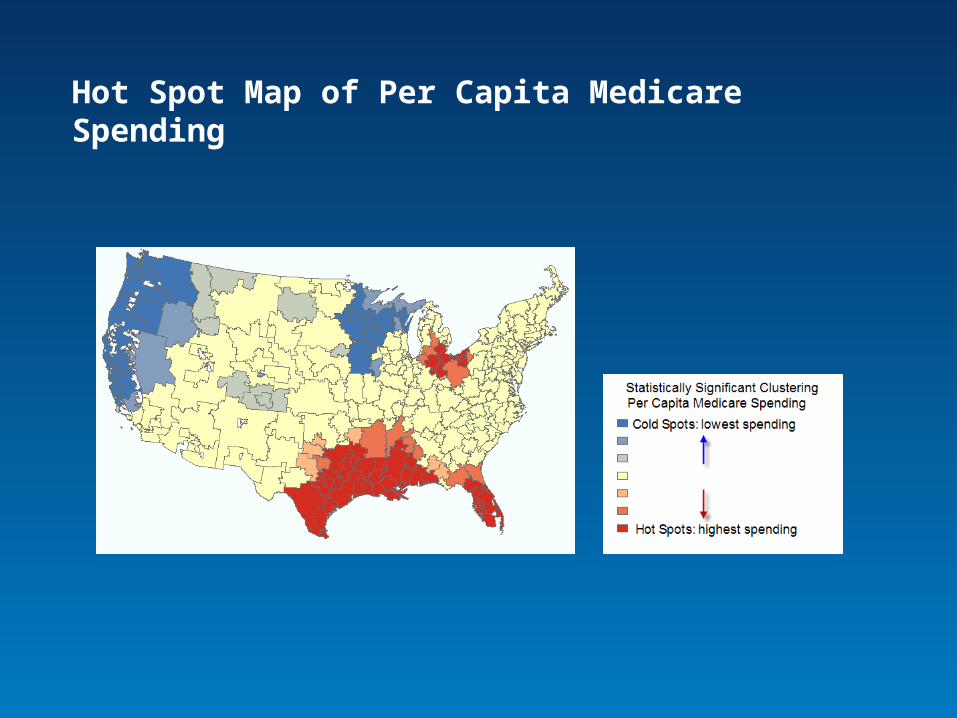
Hot Spot Map of Per Capita Medicare Spending

• Higher HCC scores indicate a sicker population: higher incidence of diabetes, heart disease, hypertension, and other chronic health conditions
Hot Spot Map of HCC ScoresHierarchical Condition Categories (HCC)

Hot Spot Map of Hospital Readmissions
• Consistently high readmission rates indicate that the medical needs of patients are not being adequately addressed

Spending
HCC Scores
Readmissions
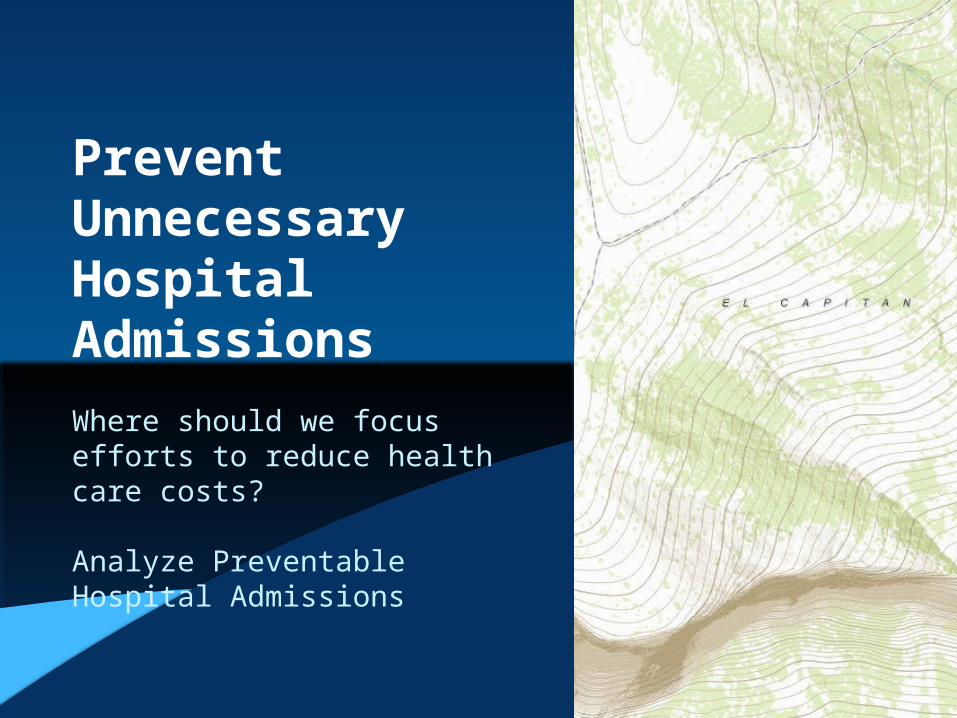
Where should we focus efforts to reduce health care costs?
Analyze Preventable Hospital Admissions
Prevent UnnecessaryHospital Admissions

Map of Preventable Hospital Admissions• Red – diabetes and lower extremity amputation
• Orange – bacterial pneumonia and dehydration
• Yellow – hypertension
• Green – bright spots: low rates for all above factors

Are the Factors Promoting Higher Spending the Same Everywhere?
Understanding the Factors that Promote Higher Spending Provides Tools for Reducing Costs
Explore Factors Contributing to Higher Spending

• Geography matters
• Factors vary over regions
• Global policies may not be effective
Map of Spatial Data RelationshipsExploring Data
Factors for higher spending
• Region 3:- Dehydration
- Imaging
- Hospital readmissions
• Region 7:- Days in nursing facilities
- Congestive heart failure
- Number of hospital beds

Where does each Factor have the Biggest Impact on Health Care Spending?
Understanding Where each Factor is Most Important to Health Care Costs is Key
Remediate Using Targeted Strategies

Focus on Region 3
• Dehydration and Imaging are factors that affect high Medicare spending in the South.
• Analyze these factors individually

ImagingDehydration
Darker areas are:
• not necessarily where imaging costs are highest
• where imaging costs are an important contributor to higher health care costs
• where greatest impact on decreased spending might be, if remediation efforts were focused there
Where is each factor most important?

Which Programs or Policies Will Have the Biggest Impact?
Knowing Which Programs or Policies Will Make the Biggest Difference Gives You An Advantage
Compare “What-If” Analyses
Evaluate the Impact of Investments

After Before
• Messaging programs – importance of staying hydrated
• Target families, nursing care facilities and medical staff
What if Dehydration was Reduced by 75%?