Embed Size (px)
Citation preview

Economics and Finance in Indonesia Vol. 56 (3), Page 297 - 327
© 2008 LPEM 297
Inter-Island Economic Linkages and Connections in Indonesia
Budy P. Resosudarmo Djoni Hartono
Ditya A. Nurdianto
Abstract
Economic performances across regions in Indonesia vary a lot. For example, in the early 2000s, gross regional domestic product in East Kalimantan and Riau was respectively 23 and 20 times higher than that in Maluku. This raises the question on how well economic linkages and connections among regions operate in Indonesia. This paper develops an inter-regional input-output table for Indonesia and utilizes it to understand the economic structures and linkages among regions in Indonesia. This paper confirms that Java-Bali is the centre of the Indonesian economy. The other regions, namely Sumatra, Kalimantan, Sulawesi, and Eastern Indonesia, are more connected to Java-Bali than to each other. Economic connections between Java-Bali and Sumatra are the strongest among any inter-regional economic connections in the country. The four key traded products connecting Java-Bali with the other regions are basic metals, petrochemical products, processed food and beverages, and oil refinery products.
Keywords: Development Economics, Regional Economics, Input-output JEL Classification: O18, R13, O21

Budy P. Resosudarmo ; Djoni Hartono ; Ditya A. Nurdianto
298
I. INTRODUCTION With its 13,000 islands, Indonesia is the world’s largest archipelagic state and one of the most spatially diverse nations on earth in its resource endowments, population settlements, location of economic activity, ecology, and ethnicity. There are about 350 identified ethnic groups. In the early 2000s, gross regional domestic product in the two richest provinces outside Java, East Kalimantan and Riau was around 23 and 20 times higher respectively than that in the poorest province, Maluku (Table 1). Based on the per capita regional product, East Kalimantan by far left behind the rest of the country, including Java. East Kalimantan was twice as rich as the runner-up province, Riau, and 16 times richer than Maluku in terms of per capita regional product.
Table 1
Indonesia’s Regional Outlook
GDP GDP per Capita
Growth of GDP per Capita
Percentage of Poor People
2004 2004 1976-04 2002
(current Rp. trillion)
( Current Rp. 000) (%) (%)
Aceh 47.9 11,927 4.0 29.8 North Sumatra 118.1 9,606 4.6 15.8 West Sumatra 37.2 8,500 5.2 11.6 Riau 149.8 25,555 -3.0 13.6 Jambi 18.2 6,981 2.8 13.2 South Sumatra 73.5 9,666 2.5 21.1 Bengkulu 8.1 5,103 4.3 22.7 Lampung 36.2 5,041 4.1 24.1 Sumatra 488.9 10,741 1.6 Jakarta 377.2 43,673 5.0 3.4 West Java 379.9 8,951 4.6 12.6 Central Java 193.4 6,091 5.0 23.1 Yogyakarta 21.8 6,725 3.7 20.1 East Java 341.8 9,655 4.6 21.9 Bali 29.0 8,694 6.2 6.9 Java-Bali 1343.1 10,761 4.9 West Kalimantan 29.6 6,862 4.1 15.5 Central Kalimantan 18.2 8,742 3.7 11.9 South Kalimantan 25.6 8,028 4.3 8.5 East Kalimantan 131.9 48,176 2.8 12.2 Kalimantan 205.3 16,657 3.9 North Sulawesi 18.5 6,206 5.0 17.4 Central Sulawesi 14.7 6,252 4.2 24.9 South Sulawesi 48.5 5,759 4.6 15.9 Southeast Sulawesi 10.3 5,055 4.4 24.2 Sulawesi 92.0 5,826 4.5 WestNusa Tenggara 22.6 5,272 5.2 27.8 East Nusa Tenggara 12.9 3,181 4.5 30.7

Inter-Island Economic Linkages and Connections in Indonesia
299
Maluku 6.4 3,024 2.8 26.6 Papua 31.6 12,872 1.6 41.8 Eastern Indonesia 73.6 5,690 3.4 Indonesia (total) 2202.9 10,421 3.9 18.2
Note: Growth is calculated in 1993 constant prices Source: Statistics Indonesia (BPS)
In terms of growth of per capita regional product, the table shows growth rates ranging from -3.0 percent in Riau and 6.2 percent in Bali with a national average of 3.9 percent. Aside from the large gap, note also that the growth rates of per capita regional product in the two poorest provinces, Maluku and East Nusa Tenggara, were only 2.8 and 1.6 percent respectively. Furthermore, the growth rate of per capita regional product in Papua, also located in Eastern Indonesia, like the former two provinces, was the second lowest at 1.6 percent. Meanwhile, the range of poverty incidence ranged from 3.4 percent of the population in Jakarta to 42 percent in Papua.
The question is then: (1) why economic performances across regions vary a lo and (2) are economic linkages and connections across regions in Indonesia weak and so creating these large variations of regional economic performances? There are several works dealing with the first question, for example Hill (1989), Garcia and Soelistianingsing (1998), Resosudarmo and Vidyattama (2006), and Hill, Resosudarmo, and Vidyattama (2008). Less available are works dealing with the second questions. Among the few are Hidayat (1991), Hulu and Hewings (1993), and Resosudarmo et al. (1999). Therefore, the goal of this paper is to understand inter-regional economic linkages and connections in Indonesia.
This paper develops an inter-island input-output table for Indonesia to achieve this goal. In this model Indonesia is divided into five different regions, namely Sumatra, Java-Bali, Kalimantan, Sulawesi, and Eastern Indonesia with thirty-five production sectors, ranging from rice to services. A fundamental input-output analysis is utilized albeit with some modifications at a later stage to incorporate certain characteristics of the model to, first, reveal differences among economic structures of these five regions and, second, analyze economic inter-linkages among these regions. Finally, this paper tries to come up with several policy suggestions to stimulate a more equal economic performance among regions in Indonesia.
II. METHODOLOGY This section describes the method used in this paper. It starts off by reviewing the fundamentals of an inter-regional input-output model.
Budy P. Resosudarmo ; Djoni Hartono ; Ditya A. Nurdianto
300
This is followed by two sub-sections on the Hirschman-Rasmussen index and the export-import index to analyze the input-output table. These indices are necessary tools for understanding the linkages and connections among regions in Indonesia.
2.1. Fundamentals of an Inter-regional Input-Output Table1
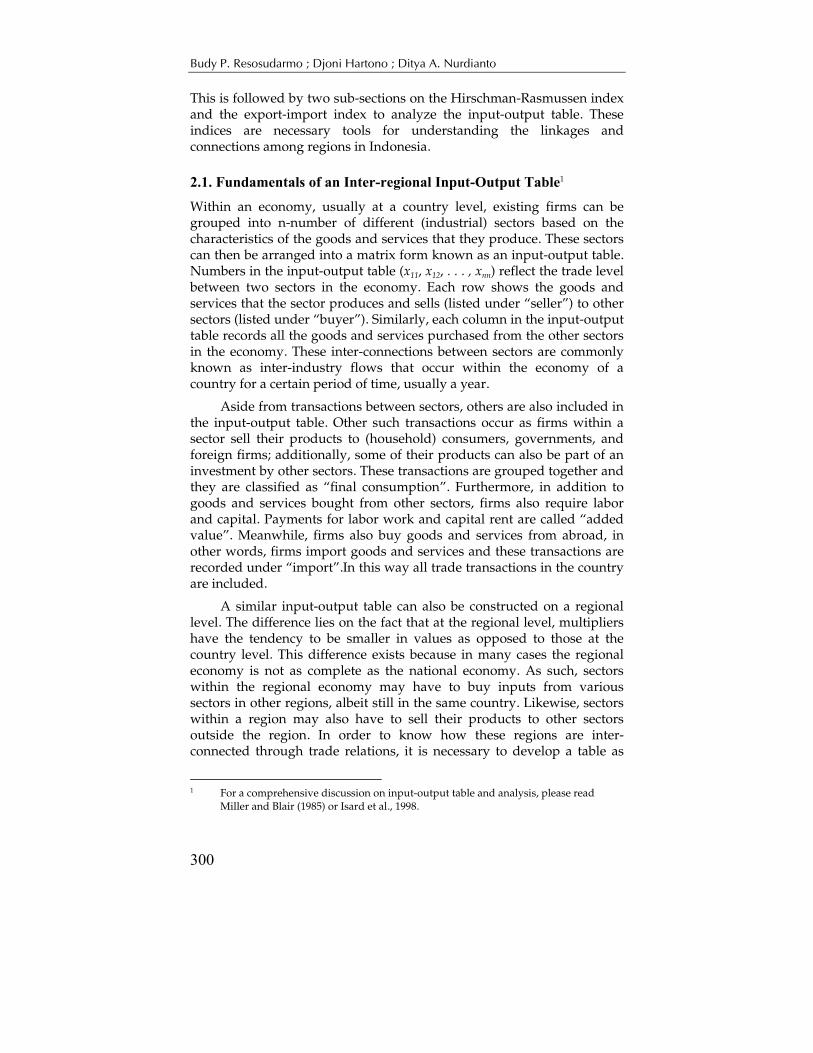
Within an economy, usually at a country level, existing firms can be grouped into n-number of different (industrial) sectors based on the characteristics of the goods and services that they produce. These sectors can then be arranged into a matrix form known as an input-output table. Numbers in the input-output table (x11, x12, . . . , xnn) reflect the trade level between two sectors in the economy. Each row shows the goods and services that the sector produces and sells (listed under “seller”) to other sectors (listed under “buyer”). Similarly, each column in the input-output table records all the goods and services purchased from the other sectors in the economy. These inter-connections between sectors are commonly known as inter-industry flows that occur within the economy of a country for a certain period of time, usually a year.
Aside from transactions between sectors, others are also included in the input-output table. Other such transactions occur as firms within a sector sell their products to (household) consumers, governments, and foreign firms; additionally, some of their products can also be part of an investment by other sectors. These transactions are grouped together and they are classified as “final consumption”. Furthermore, in addition to goods and services bought from other sectors, firms also require labor and capital. Payments for labor work and capital rent are called “added value”. Meanwhile, firms also buy goods and services from abroad, in other words, firms import goods and services and these transactions are recorded under “import”.In this way all trade transactions in the country are included.
A similar input-output table can also be constructed on a regional level. The difference lies on the fact that at the regional level, multipliers have the tendency to be smaller in values as opposed to those at the country level. This difference exists because in many cases the regional economy is not as complete as the national economy. As such, sectors within the regional economy may have to buy inputs from various sectors in other regions, albeit still in the same country. Likewise, sectors within a region may also have to sell their products to other sectors outside the region. In order to know how these regions are inter-connected through trade relations, it is necessary to develop a table as
1 For a comprehensive discussion on input-output table and analysis, please read
Miller and Blair (1985) or Isard et al., 1998.
Inter-Island Economic Linkages and Connections in Indonesia
301
shown in Figure 1. For the time being, transactions are limited to those conducted between two regions of the same country, in other words, the country is divided into two separate regions.
Each row in Figure 1 (representing a specific sector in a specific region) shows the amount of goods and services that are sold to all sectors in both regions. Similarly, each column (representing a specific sector in a specific region) shows the amount of goods and services that are bought from all sectors in both regions. Variables within the inter-industry flows matrix are written as follows:
sj
rsij Xa /x rs
ij= where i,j = 1,…,n; r,s = 1,2 ......................................... (1)
Figure 1 Inter-Regional Input-Output Table
Sector Buyer Final Total Seller Region 1 Region 2 Cons. Prod. 1 2 .. .. n 1 2 .. .. N
R 1 x1111 x1112 x111n x1211 x1212 x121n f11 X11 E 2 x1121 f12 X12 G .... .... 1 .... n x11n1 x11nn x12n1 x12nn f1n X1n R 1 x2111 x2211 f21 X21 E 2 x2121 G .... .... 2 .... n x21n1 x21nn x22n1 x22nn f2n X2n Added Value
v11 v1n v21 v2n
Import m11 m1n m21 m2n Total Input X11 X12 X1n X21 m2n
If a A a A a A a Aij ij ij ij
1111
2222
1212
2121∈ ∈ ∈ ∈; ; and then the inter-
industry flows matrix can be illustrated in a block matrix form as follows:
=
2221
1211
AAAA
A .................................................................................. (2)

Budy P. Resosudarmo ; Djoni Hartono ; Ditya A. Nurdianto
302
where A A11 22 and are the inter-industry flows in the region, while
A A12 21 and are the inter-industry flows between region 1 and region 2.
If final consumption and total production are also regionally separated as the inter-industry flows then the following equation can be written representing Figure 1:
=
+
2
1
2
1
2
1
2221
1211
XX
ff
XX
AAAA
.................................................... (3)
and the fundamental input-output relation can be written as
follows:
=
2
1
2
1
2221
1211
XX
ff
BBBB
................................................................... (4)
In this case, the elements ( ) 1−−=∈ AIBBij are the multipliers
effect and B is known as the Leontief inverse matrix. Note that:
( )[ ] 1
211
22121111
−−−−−= AAIAAIB ...................................................... (5)
For a one region case, ( ) 1
1111−−= AIB ; as such, what do the other
variables in equation (5) represent? Basically, these variables show different flows. When a sector in region 1 grows as a result of an increase in the final consumption, the growth will cause an increase in available raw materials for production use in region 2. This effect is represented by the variable 12A in equation (5). Additionally, a demand increase for goods produced in region 2 will cause an increase of economic activities
in region 2. This effect is represented by the equation ( ) 211
22 AAI −− .

Inter-Island Economic Linkages and Connections in Indonesia
303
2.2. Hirschman-Rasmussen Index In order to do a comparative analysis of the economic structures of different regions, a relatively popular method is through the classification of existing sectors into key sectors and non-key sectors. The basic concept behind these classifications is by measuring backward linkages (a demand pull concept) and forward linkages (a supply push concept) as developed by Rasmussen (1956) and Hirschman (1958). Essentially, a sector is classified as a key sector if the growth effect in this sector is greater than the average growth effect of all the other sectors on the economy of the country (Hewings, 1982). Two commonly used indices are as follows:
(1) Backward linkages index, BLj :
BLn
bn
b
nB
nV B
nV
j iji
n
ijj
n
i
n
j j
= =
= =
= ==
• •
∑ ∑∑1 1
1 1 11
211
2 .................................................................. (6)
where Bbij ∈ (a backward linkage multiplier matrix) and
(2) Forward linkages index, FLi :
FLn
bn
b
nB
nV B
nV
i ijj
n
ijj
n
i
n
i i
= =
= =
= ==
• •
∑ ∑∑1 1
1 1 11
211
2
r r
r r r r
................................................................... (7)
where Bbijrr
∈ (a forward linkage multiplier matrix).2
Suppose BLj > 1 then an increase of one unit of final consumption in sector j will cause an increase of economic activities above the average increase due to one extra unit of final consumption in any other sectors. Likewise, FLj > 1 means that an increase of one unit of production in sector i will cause an increase of economic activities above the average increase due to an extra unit of production in any other sectors.
2 In practice, we typically assume that BB
r≈ , although theoretically they are not.

Budy P. Resosudarmo ; Djoni Hartono ; Ditya A. Nurdianto
304
By measuring BLj and FLi the following classifications can be
established:
key sector if BLj > 1 and FLi > 1
forward-oriented sector if FLi > 1 but BLj < 1
backward-oriented sector if BLj > 1 but FLi < 1
non-key sector if BLj < 1 and FLi < 1.
It should be noted that classifying a sector as a key sector is a means of showing the importance of that particular sector. However, the definition of a key sector does not measure how connected the key sector is to other sectors. For example, a sector may have strong forward linkages and backward linkages with itself (significant transactions among firms in the same industry), nevertheless, this sector may be isolated from all the other sectors (little transactions occurring with other sectors). Note that this sector may be classified as a key sector if BLj > 1
and FLi > 1. As such, classifying sectors into key sectors and non-key sectors is simply a means of analyzing the economic structure. Other methods are needed in order to gain greater insights, such as using import and export indices, to look at the inter-regional connection.
In an inter-regional input-output analysis, it is common to calculate key sectors for the whole county economy and for the local/regional
economy. For the whole economy, we use rsijb ; and for the local
economy, we use rrijb (or ijb within a region).
2.4. Export Index and Import Index Inter-regional trade flows can be analyzed in two ways, sector-wise and region-wise. The first way identifies the dominant sector in the inter-regional trade. Trade indices are measured by determining the inter-regional import index and the inter-regional export index for each sector:
(1). Import index of region s for each sector:
IMn
bn
b
nB
nV B
nV
jrs
ijrs
i
n
ijrs
j
n
i
n
jrs
jrs
= =
= =
= ==
• •
∑ ∑∑1 1
1 1 11
211
2 for r s≠ ............................................ (8)
(2). Export index of region r for each sector:

Inter-Island Economic Linkages and Connections in Indonesia
305
EXn
bn
b
nB
nV B
nV
irs
ijrs
j
n
ijrs
j
n
i
n
irs
irs
= =
= =
= ==
• •
∑ ∑∑1 1
1 1 11
211
2
r r
r r
for r s≠ ........................................... (9)
By calculating IM jrs and EXi
rs , the following classifications can be
established:
key trade sector between r and s, if IM jrs > 1 and IE j
rs > 1
export-oriented sector from r to s, if EXirs > 1 but IM j
rs < 1
import-oriented sector from r to s, if IM jrs > 1 but EXi
rs < 1
non-key trade sector, if IM jrs < 1 but EXi
rs < 1.
Meanwhile, in order to analyze the inter-regional trade intensity, the following calculations can be performed:
(1). Import index of region s:
IMsn
bsn r
bjrs
ijrs
j
n
s
S
ijrs
j
n
s
S
r s=
−== ==≠∑∑ ∑∑∑1 1
111 11( ) ...................................... (10)
(2). Export index of region r:
EXrn
brn s
birs
ijrs
j
n
r
R
ijrs
j
n
r
R
s r
=−== ==≠
∑∑ ∑∑∑1 1111 11
r r
( )...................................... (11)
III. INDONESIAN INTER-REGIONAL INPUT-OUTPUT TABLE FOR 2005
The Indonesian Inter-Regional Input-Output (IRIO) constructed for this paper consists of five regions: Sumatra, Java-Bali, Kalimantan, Sulawesi and Eastern Indonesia regions. Within each region, there are 35 production sectors (See Table 2). The main sources of data sets for constructing the IRIO are the 2000 Indonesian IO, 2000 Social Accounting Matrix, 2005 National Socio Economic Survey (SUSENAS), and 2005 provincial gross domestic products available at Statistics Indonesia (BPS),

Budy P. Resosudarmo ; Djoni Hartono ; Ditya A. Nurdianto
306
and the draft provincial IO for 2005 available at the National Development Planning Agency (BAPPENAS). In constructing the IRIO, this paper follows the procedures utilized by Hulu and Hewings (1993) and heuristically controls inter-island trades using a simple gravity model (Isard, 1954).3 The complete IRIO Table for 2005 can be requested from [email protected].
Table 2.
Sectors in the Indonesian Inter-Regional Input-Output Table
Sector Sector
1 Rice 19 Cement
2 Other Food Crops 20 Basic Metals 3 Estate Crops / Plantations 21 Metal Products 4 Livestock 22 Electricity Equipments and Machineries 5 Forestry 23 Vehicles 6 Fishery 24 Other Industries 7 Oil. Gas and Geothermal Mining 25 Electric. Gas and Clean Water 8 Coal and Other Mining 26 Construction 9 Oil Refinery 27 Trade 10 Palm Oil Processing 28 Hotel and Restaurant 11 Marine Captured Processing 29 Land Transportation 12 Food and Beverage Processing 30 Water Transportation 13 Textile and Textile Products 31 Air Transportation
14 Footwares 32 Communication
15 Wood. Rattan and Bamboo Products 33 Financial Sector
16 Pulp and Paper 34 Government and Military 17 Rubber and Rubber Products 35 Other Services 18 Petrochemical Products
Table 3 shows the miniature of the Indonesian IRIO for 2005. Numbers within the table show the inter-regional trade level where goods and services from regions in the vertical axis are sold to regions in the horizontal axis. Table 3 also shows goods and services that are sold to household consumers, government, and foreign firms that are included in the “final demand” column. For goods and services that are obtained from abroad, their values are reflected in the “import” row, whereas the “value added” item contains workers’ compensation and capital rent.
3 Trade flow of commodity i from region x to region y is a function of (1) total
production of commodity i by x, (2) total consumption of commodity i by y, (3) distance from x to y and (4) some error.

Inter-Island Economic Linkages and Connections in Indonesia
307
Table 3 Miniature Inter-Regional Input-Output (IRIO) Model
(in trillions of rupiah)
INPUT / OUTPUT
Sumatra Java-Bali Kalimantan Sulawesi Eastern
IndonesiaFinal
Demand OUTPUT
Sumatra 374.72 111.00 14.81 0.07 0.11 556.47 1,057.18
Java-Bali 66.89 1.191.71 16.74 16.21 11.30 1,930.30 3,233.14
Kalimantan 8.20 74.37 143.88 5.47 1.23 213.24 446.40
Sulawesi 0.66 10.49 0.84 60.67 2.20 117.98 192.83
Eastern Indonesia
0.45 25.68 0.19 0.68 36.07 91.32 154.40
Import 26.61 214.30 11.18 2.02 4.47 175.37 433.95
Value Added
579.65 1,605.60 258.75 107.71 99.02
INPUT 1,057.18 3,233.14 446.40 192.83 154.40
Table 3 shows that each region fulfills most of its needs. Not
surprisingly, geographical proximity seems to affect the level of trade between the regions. Sumatra’s greatest trading partner is Java-Bali, but less trade is conducted with the eastern regions, i.e. Kalimantan, Sulawesi, and Eastern Indonesia. Meanwhile, Java-Bali receives most of its goods and services almost equally from Sumatra and Kalimantan, although it sells more to Sumatra by far than to any of the other regions. This phenomenon can partly be explained by the fact that Sumatra is the second largest region after Java-Bali in economic terms. It should be noted that the sheer size of Java-Bali’s economy makes it the primary market for all the other regions outside the region itself. As for Kalimantan, Sulawesi, and Eastern Indonesia, the same pattern applies for all of them where Java-Bali is their primary market and main source of goods and services from outside the region.
IV. ANALYSIS
4.1. Multipliers in the Inter-Regional Input-Output Model Following the procedures explained in equations (1) till (3), it is possible to acquire the multipliers matrix of the Indonesian IRIO 2005. These multipliers contain important information as they explain how an exogenous shock in one region affects other regions. The essence of an inter-regional input-output model is that it includes impacts in one region that are caused by changes in another region.

Budy P. Resosudarmo ; Djoni Hartono ; Ditya A. Nurdianto
308
Suppose Sumatra’s final demand increases, this means that there will be increased demands from Sumatra (as a puller) on regions whose products are used as inputs to production in Sumatra. The term “backward linkage” is used to indicate this kind of inter-connection of a particular region to those regions from which it purchases inputs. On the other hand, suppose Sumatra’s production increases, this means additional amounts of Sumatra’s products are available (as a pusher) to be used as inputs to other regions for their productions. That is, there will be increased supplies from Sumatra (as a seller) for regions which use goods from Sumatra in their productions. The term “forward linkage” is used to indicate this kind of inter-connection.
The following table (Table 4) shows the simple (backward) multipliers matrix obtained from Table 3.
Table 4
Simple Multipliers
Region Sumatra Java-Bali Kalimantan Sulawesi Eastern
Indonesia
Sumatra 1.559 0.088 0.081 0.015 0.011
Java-Bali 0.158 1.599 0.097 0.201 0.158
Kalimantan 0.023 0.056 1.480 0.068 0.022
Sulawesi 0.002 0.008 0.005 1.460 0.028
Eastern Indonesia
0.003 0.017 0.002 0.009 1.307
Based on the simple multipliers table above, Sumatra’s strongest
backward linkage is to Java-Bali, whereas its strongest forward linkages are to Java-Bali and Kalimantan.4 Simply put, a hundred rupiah’s worth of increase in the final demand of Sumatra’s output will increase Java-Bali’s worth of output as much as 15.8 rupiah. On the other hand, a hundred rupiah’s worth of increase in the production of Sumatra’s output will increase Java-Bali’s worth of output as much as 8.8 rupiah and Kalimantan’s as much as 8.1 rupiah.
As for Java-Bali, its strongest forward linkage is to Sulawesi at 0.201 followed by Sumatra and Eastern Indonesia, both at 0.158. Meanwhile, Java-Bali strongest backward linkage is to Sumatra at 0.088.
In the cases of Kalimantan, Sulawesi, and Eastern Indonesia, their forward linkage multipliers are rather small, partly due to their relatively 4 Note that we assume the forward linkage multiplier matrix is the same as the
backward linkage multiplier matrix. In practice, this is not a bad assumption.

Inter-Island Economic Linkages and Connections in Indonesia
309
small economies, which in turn limits the goods and services that they can produce and provide to the other regions. All three regions have their strongest backward linkages to Java-Bali at 0.097, 0.201, and 0.158, respectively. Meanwhile, Kalimantan strongest forward linkage is to Sulawesi at 0.068, while Sulawesi strongest forward linkage is to Eastern Indonesia at 0.028, and Eastern Indonesia is to Java-Bali at 0.017.
4.2. Regional Outputs and Inputs The following figure (Figure 2) shows a three-dimensional representation of the Input-Output Table that has been broken down into four different sectors, namely agriculture, mining, industry, and services, in terms of percentage of national output.
Figure 2
Sectoral Output
Java‐BaliSumatra
KalimantanSulawesi
EasternIndonesia
Agriculture
Mining
Industry
Services0
5
10
15
20
25
30
35
% o
f Nat
iona
l Out
put
The above figure shows that Java-Bali produces the largest amount of output in all sectors, except for mining. Taking into account the sheer size of Java-Bali’s economy compared to the other regions as shown in Table 3, this result is quite expected. Goods that are produced by the industrial sector is the main regional output followed by services, agriculture, and mining. The same pattern exists for Sumatra where the majority of its output comes from the industrial sector followed by services, agriculture, and mining. In terms of total regional output,

Budy P. Resosudarmo ; Djoni Hartono ; Ditya A. Nurdianto
310
Sumatra is the second largest economy after Java-Bali. Note, however, that the mining sector in Sumatra is bigger than the mining sector in Java-Bali as it still has some natural resources left for exploitation.
In Kalimantan, the industrial sector also dominates the regional output and it is followed by the mining and service sectors with the agricultural sector trailing behind. As for Sulawesi, its output comes almost equally from the agricultural, industrial, and service sectors with a very small amount of output from the mining sector. In Eastern Indonesia, unlike the other regions, the mining sector is its largest sector followed by the service, agricultural, and industrial sectors. A point of interest is the fact that Eastern Indonesia is the least developed region in Indonesia, which explains why its total output is the smallest compared to all the other regions with the mining sector being its largest sector.
Meanwhile, Figure 3 provides the same data in terms of percentage of national value added. Remember that the value added item consists of amounts paid for workers’ compensation and capital rent.
Figure 3 shows that Java-Bali the most intensive user of the national’s capital and labor stock. Services use most of these inputs followed by the industrial and agricultural sectors. The mining sector in Java-Bali is relatively negligible as this sector has largely been abandoned due to the region’s depleting natural resources. Meanwhile, capital and labor are intensively used equally in all sectors in Sumatra with slightly less value added inputs usage in the mining sector.
As for Kalimantan, the mining and industrial sectors use most of the value added inputs followed by services and agriculture. In Sulawesi, the largest sectors to use capital and labor are the agricultural and service sectors followed by the industrial and mining sectors, while in Eastern Indonesia, the mining sector uses the largest amount of capital and labor followed by the service, agricultural, and industrial sectors.
Note that in both Figures 2 and 3, Java-Bali produces the largest total output and uses the largest amount of value added inputs. This is followed by Sumatra and Kalimantan with the least developed regions in Indonesia, namely Sulawesi and Eastern Indonesia, producing the least amount of output and using the least amount of value added inputs.

Inter-Island Economic Linkages and Connections in Indonesia
311
Figure 3. Sectoral Input
Java‐BaliSumatra
KalimantanSulawesi
EasternIndonesia
Agriculture
Mining
Industry
Services
0
5
10
15
20
25
30%
of N
atio
nal V
alue
Add
ed
4.4. National Key Sectors As mentioned in the previous section, backward and forward linkages are important concepts in order to see how an exogenous shock in one region affects other regions. A policy implication of identifying national key sectors is that the greatest impact throughout the national economy, as measured by the total output, per unit increase of the final demand can be achieved through government spending on a region’s key sector output.
A national key sector is defined as a sector if its backward and forward linkage indices at the national level are greater than 1. Hence, a national key sector is a sector that is important to the national economy, sometimes called the national prime-mover sector.
4.4.1. Sumatra In Sumatra, four national key sectors are identified, namely basic metals; pulp and paper; food and beverage processing; and palm oil processing (Figure 4). The palm oil processing sector has the strongest backward linkage with an index close to 1.40 as well as the strongest forward linkage with an index close to 1.30. This is followed by the food and beverage processing sector with a backward linkage at 1.30 and a forward linkage at almost 1.20. The backward linkage for the pulp and paper sector is at 1.20, while its forward linkage is at 1.10. The basic

Budy P. Resosudarmo ; Djoni Hartono ; Ditya A. Nurdianto
312
metals sector is also a key sector with a backward linkage at 1.10 and a forward linkage at 1.05. Lastly, it appears that all of the national key sectors in Sumatra have stronger backward linkages than forward linkages, with the strongest linkages emanating from the palm oil processing sector.
Figure 4
National Key Sectors in Sumatra
0.00 0.20 0.40 0.60 0.80 1.00 1.20 1.40 1.60
Palm Oil Processing
Food and BeverageProcessing
Pulp and Papers
Basic Metal
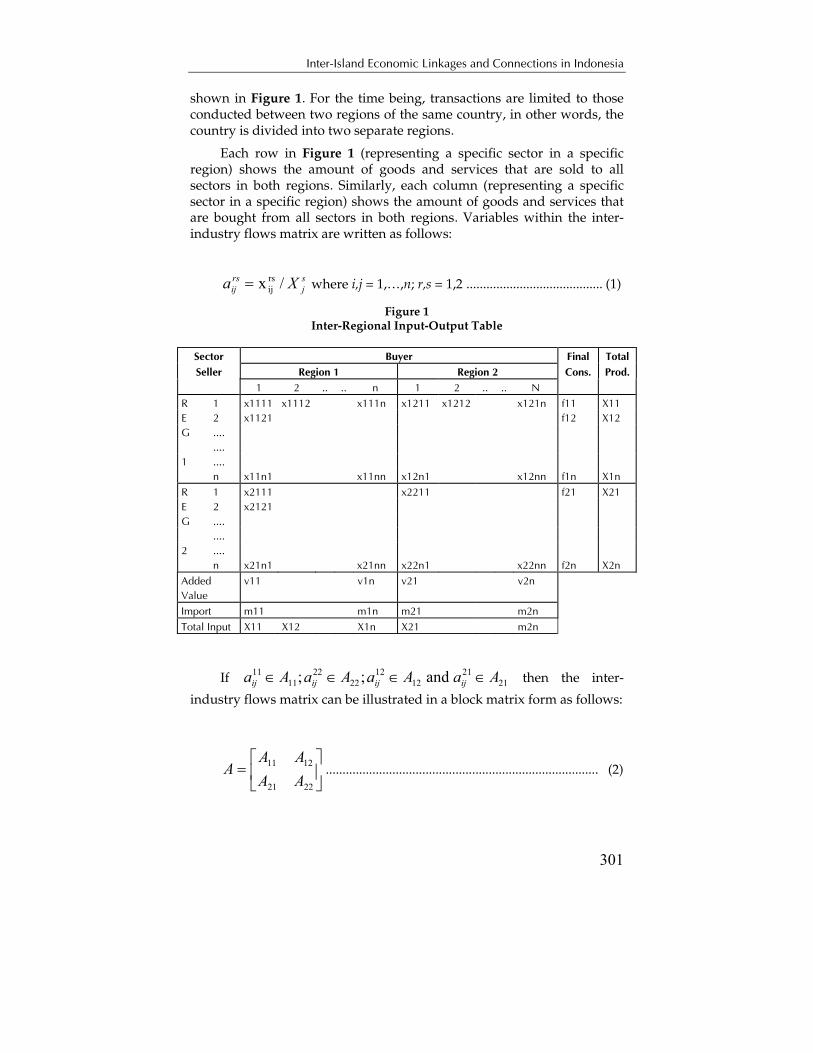
Backward Linkage Forward Linkage 4.4.2. Java-Bali With eight national key sectors identified, Java-Bali has the largest number of key sectors compared to all the other regions (Figure 5). Its strongest forward linkage is in the motor vehicle sector followed by food and beverage processing; textile and textile products; electricity equipments and machineries; rubber and rubber products; pulp and paper; utilities; and land tranportation sectors. Meanwhile, its strongest backward linkage lies in the utilities sector followed by food and beverage processing; electricity equipments and machineries; rubber and rubber products; pulp and paper; land transportation; and textile and textile products.
Unlike Sumatra, some key sectors in Java-Bali have a stronger forward linkage than a backward linkage, namely motor vehicles; electricity equipments and machineries; rubber and rubber products; textile and textile products; as well as food and beverage processing sectors. Meanwhile, the land transportion, utilities as well as pulp and paper sectors have stronger backward linkages than forward linkages.
Inter-Island Economic Linkages and Connections in Indonesia
313
Figure 5. National Key Sectors in Java-Bali
0.00 0.50 1.00 1.50 2.00 2.50 3.00 3.50
Food and Beverage Processing
Textiles
Pulp and Papers
Rubber Processing
Electricity Machinery
Transport Equipment
Electricity, Gas, and Drinking Water
Land Transportation
Backward Linkage Forward Linkage 4.4.3. Kalimantan Similar to Sumatra, Kalimantan also has four identified key sectors with the strongest forward linkage in the petrochemical products sector followed by the food and beverage processing; pulp and papers; and palm oil processing sectors (Figure 6). The former two sectors also have stronger forward linkages than backward linkages. Meanwhile, Kalimantan’s strongest backward linkage is in the palm oil processing sector followed by the food and beverage processing; pulp and papers; and petrochemical products sectors.

Budy P. Resosudarmo ; Djoni Hartono ; Ditya A. Nurdianto
314
Figure 6. National Key Sectors in Kalimantan
0.00 0.20 0.40 0.60 0.80 1.00 1.20 1.40 1.60
Palm Oil Processing
Food and BeverageProcessing
Pulp and Papers
Petrochemical
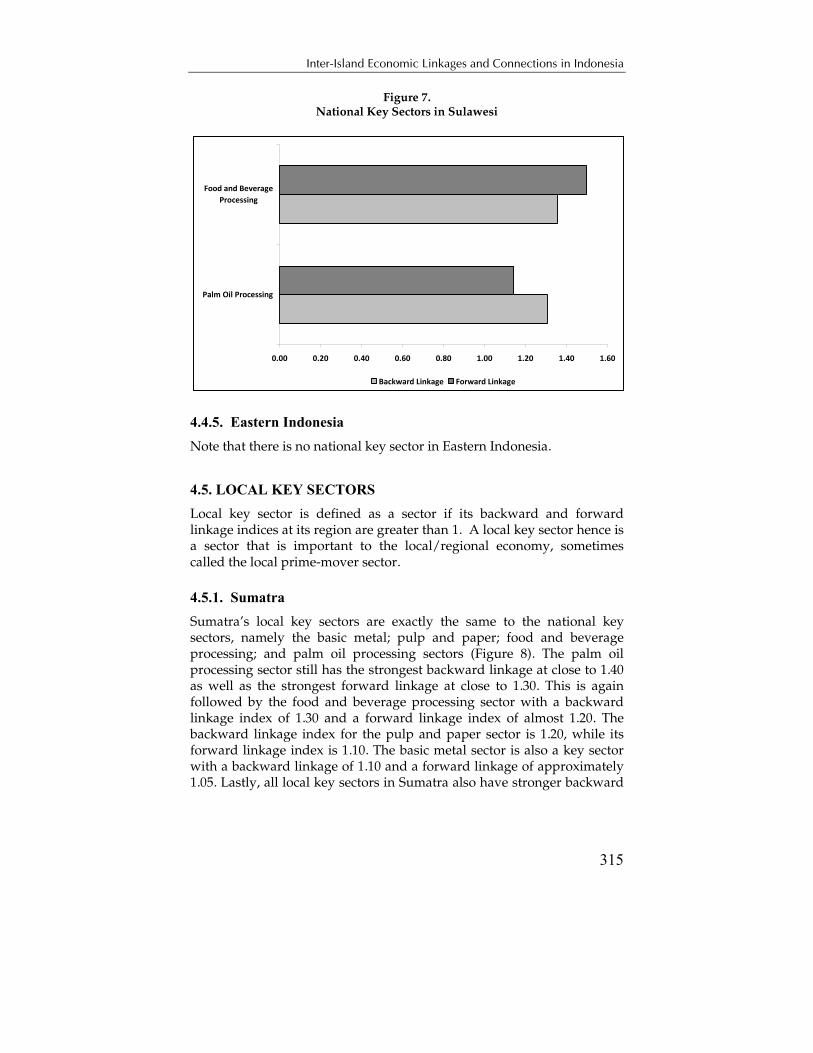
Backward Linkage Forward Linkage 4.4.4. Sulawesi Sulawesi only has two identified national key sectors, which are the food and beverage processing sector and the palm oil processing sector (Figure 7). Its strongest forward linkage and backward linkage are in the food and beverage processing sector where its forward linkage is also stronger than its backward linkage. In the palm oil processing sector, its backward linkage is stronger than its forward linkage where both linkages are weaker than in the food and beverage processing sector.
Inter-Island Economic Linkages and Connections in Indonesia
315
Figure 7. National Key Sectors in Sulawesi
0.00 0.20 0.40 0.60 0.80 1.00 1.20 1.40 1.60
Palm Oil Processing
Food and BeverageProcessing
Backward Linkage Forward Linkage 4.4.5. Eastern Indonesia Note that there is no national key sector in Eastern Indonesia.
4.5. LOCAL KEY SECTORS Local key sector is defined as a sector if its backward and forward linkage indices at its region are greater than 1. A local key sector hence is a sector that is important to the local/regional economy, sometimes called the local prime-mover sector.
4.5.1. Sumatra Sumatra’s local key sectors are exactly the same to the national key sectors, namely the basic metal; pulp and paper; food and beverage processing; and palm oil processing sectors (Figure 8). The palm oil processing sector still has the strongest backward linkage at close to 1.40 as well as the strongest forward linkage at close to 1.30. This is again followed by the food and beverage processing sector with a backward linkage index of 1.30 and a forward linkage index of almost 1.20. The backward linkage index for the pulp and paper sector is 1.20, while its forward linkage index is 1.10. The basic metal sector is also a key sector with a backward linkage of 1.10 and a forward linkage of approximately 1.05. Lastly, all local key sectors in Sumatra also have stronger backward

Budy P. Resosudarmo ; Djoni Hartono ; Ditya A. Nurdianto
316
linkages than forward linkages and the palm oil processing sector has the stongest forward and backward linkages.
Figure 8.
Local Key Sectors in Sumatra
0.00 0.20 0.40 0.60 0.80 1.00 1.20 1.40
Palm Oil Processing
Food and BeverageProcessing
Pulp and Papers
Basic Metal
Backward Linkage Forward Linkage 4.5.2. Java-Bali In the case of Java-Bali, the local key sectors identified are less than the national key sectors (Figure 9). All four of the local key sectors have stronger forward linkages than backward linkages with the motor vehicle sector having the strongest forward linkage followed by the food and beverage processing; textile and textile products; and electricity equipments and machineries sectors. The food and beverage processing sector has the strongest backward linkage followed by the electricity equipments and machineries; textile and textile products; and motor vehicle sectors.

Inter-Island Economic Linkages and Connections in Indonesia
317
Figure 9. Local Key Sectors in Java-Bali
0.00 0.50 1.00 1.50 2.00 2.50 3.00
Food and BeverageProcessing
Textiles
Electricity Machinery
Transport Equipment
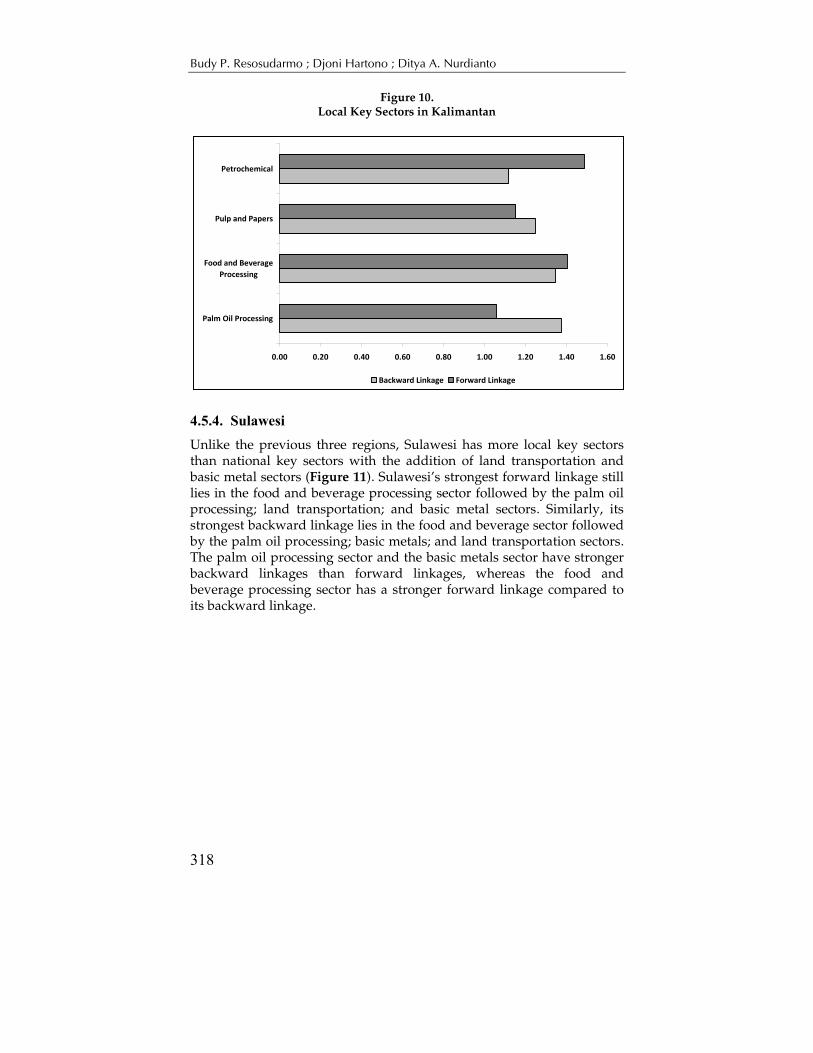
Backward Linkage Forward Linkage 4.5.3. Kalimantan In the case of Kalimantan, its local key sectors exhibit the same pattern as its national key sectors with its strongest forward linkage in the petrochemical products sector followed by the food and beverage processing; pulp and papers; and palm oil processing sectors (Figure 10). The former two sectors also have stronger forward linkages than backward linkages, while Kalimantan’s strongest backward linkage is in the palm oil processing sector followed by the food and beverage processing; pulp and papers; and petrochemical products sectors.
Budy P. Resosudarmo ; Djoni Hartono ; Ditya A. Nurdianto
318
Figure 10. Local Key Sectors in Kalimantan
0.00 0.20 0.40 0.60 0.80 1.00 1.20 1.40 1.60
Palm Oil Processing
Food and BeverageProcessing
Pulp and Papers
Petrochemical
Backward Linkage Forward Linkage 4.5.4. Sulawesi Unlike the previous three regions, Sulawesi has more local key sectors than national key sectors with the addition of land transportation and basic metal sectors (Figure 11). Sulawesi’s strongest forward linkage still lies in the food and beverage processing sector followed by the palm oil processing; land transportation; and basic metal sectors. Similarly, its strongest backward linkage lies in the food and beverage sector followed by the palm oil processing; basic metals; and land transportation sectors. The palm oil processing sector and the basic metals sector have stronger backward linkages than forward linkages, whereas the food and beverage processing sector has a stronger forward linkage compared to its backward linkage.

Inter-Island Economic Linkages and Connections in Indonesia
319
Figure 11. Local Key Sectors in Sulawesi
0.00 0.20 0.40 0.60 0.80 1.00 1.20 1.40 1.60 1.80
Palm Oil Processing
Food and BeverageProcessing
Basic Metal
Land Transportation
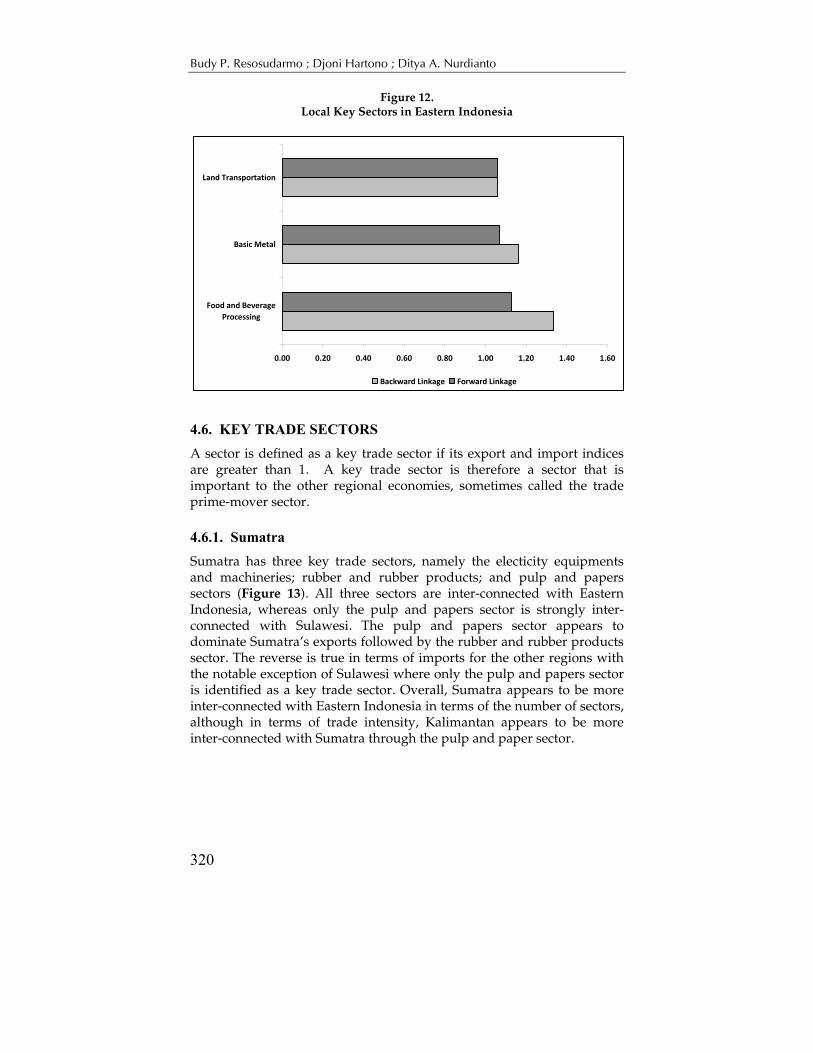
Backward Linkage Forward Linkage 4.5.5. Eastern Indonesia Eastern Indonesia has three identified local key sectors, namely the land transportation, basic metals as well as food and beverages processing sectors (Figure 12). Its strongest backward and forward linkages are in the food and beverage processing sector followed by the basic metal sector with a stronger backward linkage than a forward linkage. The land transportation sector appears to have equally strong forward and backward linkages.
Budy P. Resosudarmo ; Djoni Hartono ; Ditya A. Nurdianto
320
Figure 12. Local Key Sectors in Eastern Indonesia
0.00 0.20 0.40 0.60 0.80 1.00 1.20 1.40 1.60
Food and BeverageProcessing
Basic Metal
Land Transportation
Backward Linkage Forward Linkage
4.6. KEY TRADE SECTORS A sector is defined as a key trade sector if its export and import indices are greater than 1. A key trade sector is therefore a sector that is important to the other regional economies, sometimes called the trade prime-mover sector.
4.6.1. Sumatra Sumatra has three key trade sectors, namely the electicity equipments and machineries; rubber and rubber products; and pulp and papers sectors (Figure 13). All three sectors are inter-connected with Eastern Indonesia, whereas only the pulp and papers sector is strongly inter-connected with Sulawesi. The pulp and papers sector appears to dominate Sumatra’s exports followed by the rubber and rubber products sector. The reverse is true in terms of imports for the other regions with the notable exception of Sulawesi where only the pulp and papers sector is identified as a key trade sector. Overall, Sumatra appears to be more inter-connected with Eastern Indonesia in terms of the number of sectors, although in terms of trade intensity, Kalimantan appears to be more inter-connected with Sumatra through the pulp and paper sector.

Inter-Island Economic Linkages and Connections in Indonesia
321
Figure 13. Key Trade Sectors in Sumatra
0.00 0.50 1.00 1.50 2.00 2.50 3.00 3.50 4.00
IM
EX
IM
EX
IM
EX
Kalim
anta
nSu
law
esi
East
ern
Indo
Electricity Machinery
Rubber Processing
Pulp and Papers
4.6.2. Java-Bali There are four key trade sectors identified in Java-Bali, namely the basic metals; petrochemical products; food and beverage processing; and oil refinery sectors (Figure 14). In terms of intensity, Java-Bali appears to be highly inter-connected with Sulawesi although it is limited to petrochemical products. Eastern Indonesia is closely behind in terms of trade intensity with Java-Bali although it has more sectors that are strongly inter-connected. The Java-Bali trade with Sumatra is largely limited to the petrochemical products and oil refinery sector, whereas trade with Kalimantan is limited to the basic metals and food and beverage processing sectors.
Budy P. Resosudarmo ; Djoni Hartono ; Ditya A. Nurdianto
322
Figure 14. Key Trade Sectors in Java-Bali
0.00 1.00 2.00 3.00 4.00 5.00 6.00 7.00
IM
EX
IM
EX
IM
EX
IM
EX
Sum
atra
Kalim
anta
nSu
law
esi
East
ern
Indo
Basic Metal
Petrochemical
Food and Beverage Processing
Refinery
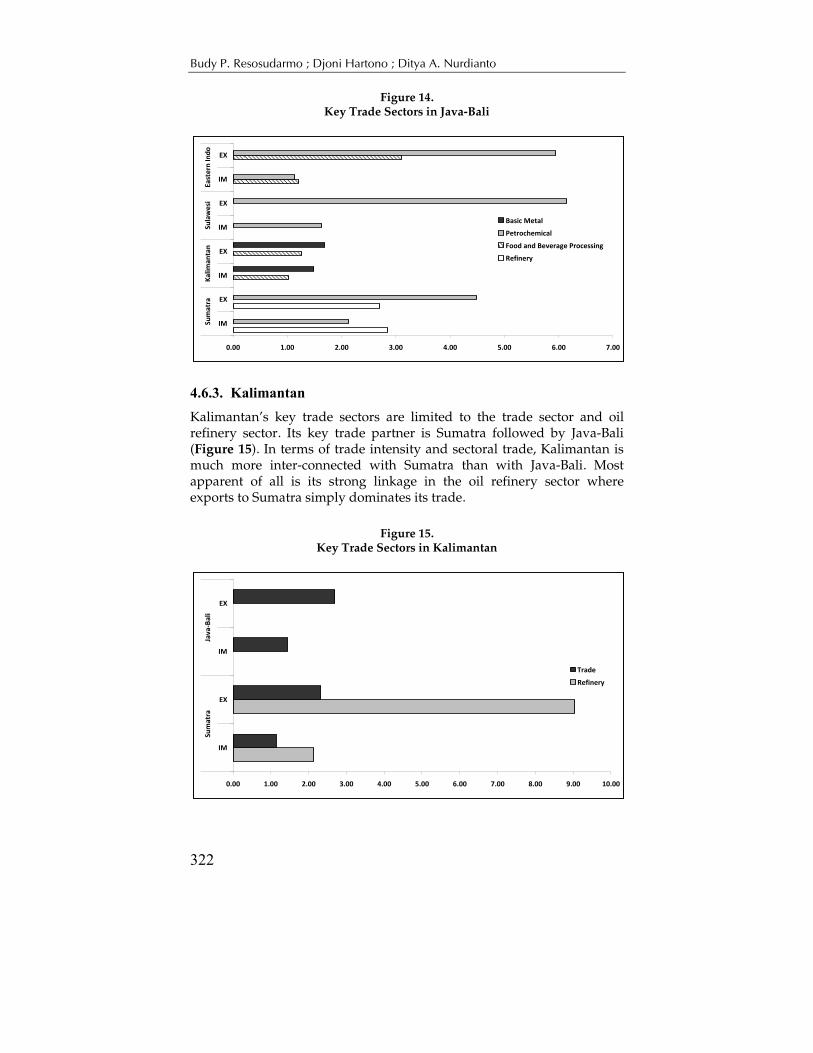
4.6.3. Kalimantan Kalimantan’s key trade sectors are limited to the trade sector and oil refinery sector. Its key trade partner is Sumatra followed by Java-Bali (Figure 15). In terms of trade intensity and sectoral trade, Kalimantan is much more inter-connected with Sumatra than with Java-Bali. Most apparent of all is its strong linkage in the oil refinery sector where exports to Sumatra simply dominates its trade.
Figure 15.
Key Trade Sectors in Kalimantan
0.00 1.00 2.00 3.00 4.00 5.00 6.00 7.00 8.00 9.00 10.00
IM
EX
IM
EX
Sum
atra
Java‐B
ali
Trade
Refinery

Inter-Island Economic Linkages and Connections in Indonesia
323
4.6.4. Sulawesi Four key trade sectors have been identified in Sulawesi, which are the land transportation; trade; wood, rattan, and bamboo products; and food and beverage processing sectors (Figure 16). Sulawesi’s main trading partner appears to be Kalimantan in terms of trade intensity and sectoral trade with export from the food and beverage processing sector dominating its trade relations. Eastern Indonesia and Java-Bali closely follow Kalimantan where exports from the food and beverage processing sector dominates trade with Java-Bali, while imports of wood, rattan, and bamboo products dominate trade with Eastern Indonesia. Less trade linkages are conducted with Sumatra which is only limited to the land transportation sector
Figure 16.
Key Trade Sectors in Sulawesi
0.00 1.00 2.00 3.00 4.00 5.00 6.00 7.00 8.00 9.00
IM
EX
IM
EX
IM
EX
IM
EX
Sum
atra
Java‐B
ali
Kalim
anta
nEa
ster
n In
do
Land Transportation
Trade
Wood Processing
Food and Beverage Processing
4.6.5. Eastern Indonesia Eastern Indonesia’s key trade sectors are the inland transportation; trade; as well as wood, rattan, and bamboo products sectors. In terms of intensity, Sulawesi is its largest trading partners by far, dominated by exports and import s from the wood processing sector (Figure 17). Meanwhile, Eastern Indonesia’s trade with Java-Bali is mostly inter-connected in the wood, rattan, and bamboo products sector for both exports and imports ; whereas linkages with Java-Bali appears to be dominated by the trade sector.

Budy P. Resosudarmo ; Djoni Hartono ; Ditya A. Nurdianto
324
Figure 17. Key Trade Sectors in Eastern Indonesia
0.00 0.50 1.00 1.50 2.00 2.50 3.00 3.50 4.00 4.50
IM
EX
IM
EX
IM
EX
Java‐B
ali
Kalim
anta
nSu
law
esi
Land Transportation
Trade
Wood Processing
V. CONCLUSION An Inter-Regional Input-Output (IRIO) table contains valuable information on the market allocation of resources in an economic system. The 2005 IRIO developed in this paper divides the Indonesian economy into five regions: Sumatra; Java-Bali; Kalimantan; Sulawesi; and Eastern Indonesia. The regional analysis of the economy uses the economic structure, regional connectivity, national importance, and local importance as indicators. The economic structure indicator presents a general picture of the economy of a region, while the regional connectivity is defined as the inter-dependency between one region to another. The key sectors in the national or the local perspective are defined as the sectors that can significantly push or pull the national or the local economy.
At this point, it would be prudent to note once more the limitations inherent in the model utilized in this paper partly due to its static nature. Limitations of an inter-regional input-output model partly arise from the assumptions that the production function excludes price induced substitution of production factors and intermediates as well as a static demand function.
Nevertheless, the essence of an inter-regional input-output model is that it includes impacts in one region that are caused by changes in another region. As such, although the magnitude of the impacts based on this model may differ vis-à-vis “real” data, in terms of the relative impacts of different sectors in different regions and their subsequent conclusions, the model can be relied upon.

Inter-Island Economic Linkages and Connections in Indonesia
325
Conclusions can be drawn from the analysis of this paper are as follows. The economic structure in each region significantly varies. The manufacturing and services sectors are very dominant in Java. They are less so in Sumatra, even less in Kalimantan, Sulawesi and Eastern Indonesia. In Eastern Indonesia, the most dominant sector is Mining; in Sulawesi, Agriculture and Services; and in Kalimantan, Mining and Manufacturing.
The national key sectors in Sumatra are basic metal, pulp and papers, food and beverage processing, and palm oil processing sectors. In Java-Bali, they are the land transportation, utilities, motor vehicle, electricity equipment, rubber and rubber product, pulp and paper, textile, and food and beverage processing sectors. In Kalimantan, they are the petrochemical products, pulp and paper, food and beverage processing, and palm oil processing sectors. In Sulawesi, they include the food and beverage processing and palm oil processing sectors. Meanwhile, a national key sector is non-existent in Eastern Indonesia. From these national key sectors, one can see the importance of the pulp and paper, food and beverage processing, and palm oil sectors for the Indonesian economy.
The local or regional key sectors — sectors that matter for the local economies are the basic metals, pulp and paper, food and beverage processing, and palm oil processing sectors in Sumatra. In Java-Bali, they are the motor vehicle, electricity equipments, textile, and food and beverage processing sectors. In Kalimantan, petrochemical products, pulp and paper, food and beverage processing, and palm oil processing sectors. In Sulawesi they include the land transportation, basic metals, food and beverage processing, and palm oil processing sectors. In Eastern Indonesia the local or regional key sectors are the land transportation, basic metals, and food and beverage sectors. It can be seen that in general the food and beverage processing and palm oil processing sectors are important for the local economy.
Through the identification of these key sectors, the government can choose certain key sectors to invest in to increase the economic performance across Indonesia. For a small-scale intervention, i.e. investment in a specific sector in a specific region, the largest gain can be achieved by investing in the motor vehicle sector in Java-Bali due to its very strong forward linkages. Meanwhile, for a large-scale intervention, i.e. an industry-wide investment, the food and beverages processing sector is the most potential sector as it is an identified national key sector in four out of five regions with very strong forward and backward linkages.
As for stimulating the local economy, aside from the motor vehicle as well as food and beverage processing sectors, Java-Bali stands to gain

Budy P. Resosudarmo ; Djoni Hartono ; Ditya A. Nurdianto
326
from investment in the pulp and paper sector, Sumatra and Sulawesi stand to gain from investment in the palm oil processing sector, Kalimantan from the petrochemical products sector, and Eastern Indonesia from the basic metals sector.
Finally, the 2005 IRIO confirms that Java-Bali is the centre of the Indonesian economy (Hill, 1989; Hill et al., 2008). The other regions, namely Sumatra, Kalimantan, Sulawesi, and Eastern Indonesia, are more connected to Java-Bali than to each other. Economic connections between Java-Bali and Sumatra are the strongest among any inter-regional economic connections in the country. The four key trade sectors connecting Java-Bali with the other regions are the basic metals, petrochemical products, food and beverage processing, and oil refinery sectors.
REFERENCES Garcia, J.G. and L. Soelistianingsih. 1998. “Why do Differences in
Provincial Incomes Persist in Indonesia?” Bulletin of Indonesian Economic Studies, 34(1): 95–120.
Isard, W. 1954. “Location Theory and Trade Theory: Short-Run Analysis”. Quarterly of Economics, 68:305-322.
Isard, W., I.J. Azis, M.P. Drennan, R.E. Miller, S. Saltzman, and E. Thorbecke. 1998. Methods in Interregional and Regional Analysis. Brookfield, VT: Ashgate.
Hewings, G.J.D (1982) “The empirical identification of key sectors in an economy: a regional perspective,” The Developing Economies, 20:173-95.
Hirschman, A.O. 1958. The Strategy of Economic Development. New Haven: Yale University Press.
Hidayat, T. 1991. “An Interregional Social Accounting Matrix for Indonesia: Theoretical Background and Construction”. Ekonomi dan Keuangan Indonesia, 39:335-357.
Hill, H (ed). 1989. Unity and Diversity: Regional Economic Development in Indonesia since 1970. Singapore: Oxford University Press.
Hill, H., B.P. Resosudarmo and Y. Vidyattama. 2008. "Indonesia's Changing Economic Geography." Working Papers in Trade and Development No. 2008/02, the Arndt-Corden Division of Economics, Research School of Pacific and Asian Studies, the Australian National University.
Hulu, E. dan G.J.D. Hewings, (1993) "The development and use of interregional input-output models for Indonesia under conditions
Inter-Island Economic Linkages and Connections in Indonesia
327
of limited information," Review of Regional Development Studies, 5: 135-153.
Miller, R. and P. Blair. 1985. Input Output Analysis: Foundations and Extensions. Englewood Cliffs, NJ: Prentice-Hall.
Rasmussen, P. 1956. Studies in Intersectoral Relations. Amsterdam: North Holland.
Resosudarmo, B.P., L..E. Wuryanto, G.J.D. Hewings, and L. Saunders. 1999. “Decentralization and Income Distribution in the Inter-Regional Indonesian Economy.” In G.J.D. Hewings, M. Sonis, M. Madden and Y. Kimura (eds.), Advances in Spatial Sciences: Understanding and Interpreting Economic Structure, Germany: Springer-Verlag, Heidelberg.
Resosudarmo, B.P. and Y. Vidyattama. 2006. “Regional Income Disparity in Indonesia: A Panel Data Analysis.” ASEAN Economic Bulletin, 23(1): 31-44.
***