Embed Size (px)
Citation preview

ECONOMIC VALUATION ON CLIMATE CHANGE
IN THE MARINE FISHERIES IN CILACAP,
CENTRAL JAVA
PROJECT PAPER
Submitted in Partial Fulfillment of the Requirements for the Undergraduate
Degree (S1) of Economics in Faculty of Economics
Universitas Diponegoro
By:
RIZKY YULIANISA
NIM. C2B006063
FACULTY OF ECONOMICS
UNIVERSITAS DIPONEGORO
SEMARANG
2011
APPROVAL

It is hereby certified that we have read this project paper entitled „Economic
Valuation on Climate Change in the Marine Fisheries in Cilacap, Central Java‟ by
Rizky Yulianisa, and in our opinion it is satisfactory in terms of the scope, quality,
and presentation as a partial fulfillment of the requirements for undergraduate
degree in Economics.
........................................ Prof. Dra. Hj. Indah Susilowati, M.Sc., Ph.D
Supervisor
Department of Economics
Universitas Diponegoro

CERTIFICATION OF EXAMINATION
I certify that the board of examiners have met on Tuesday, June 21st, 2011 to
conduct a final examination of this candidate on her undergraduate degree and
recommended that the candidate be awarded the relevant degree.
........................................ Prof. Dra. Hj. Indah Susilowati, M.Sc., Ph.D
Supervisor
Department of Economics
Universitas Diponegoro
Chair Examiner
........................................ Drs. Edy Yusuf AG, M.Sc., Ph.D
Department of Economics
Universitas Diponegoro
Member
........................................ Achma Hendra Setiawan, S.E., M.Si
Department of Economics
Universitas Diponegoro
Member

STATEMENT OF ORIGINALITY
I hereby,
Name : Rizky Yulianisa
NIM : C2B006063
Faculty/Major : Economics/Economics (IESP)
stated that this project paper is the work itself and has never been proposed as
the fulfillment of the requirements to obtain a degree from the University of
Diponegoro and other universities.
All information contained in this project paper which is derived from the
work of others had been given an award by citing the name of the
source author correctly. And all the contents of this paper is fully the
responsibility of the authors.
Semarang, June 2011
Rizky Yulianisa
C2B 006 063

ABSTRACT
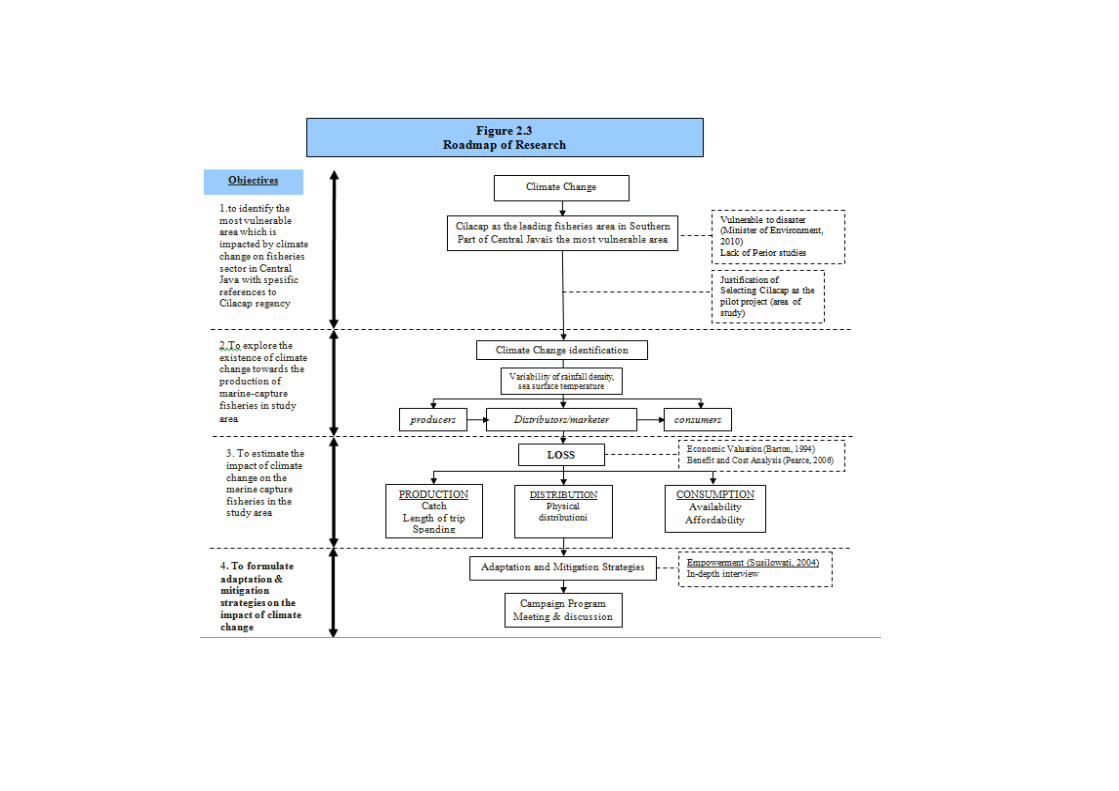
The objective of this study is to estimate the impact of climate change in
the marine capture fisheries in Cilacap, Central Java. Also to formulate the
adaptation and mitigation strategies on the impacts of climate change.
Data collection was done through multi-stages sampling. Samples of
respondents were: 73 marine-fisher respondents, 43 collector respondents, and
100 consumer respondents, which were analyzed by descriptive statistics. In the
aspect of production, there was a decrease in catch which caused severe losses in
26 respondents, an increase in length of trip which was vary from 1 day to 7 days,
and changes in fishers spending, such as: change in cost of fuel, change in food &
lodging cost, and change in productivity. Lack of production has led to a decrease
in fish-stocks. Therefore availability and sustainability of fish-stock in the aspect
of distribution became questionable, which influenced availability and
affordability of fish in market (Aspect of consumption).
Thus, enhancing the performance of extension institution was needed to
anticipate the impact of climate change in marine fisheries sector. An ideal
extension institution was made to enhance the performance of extension
institution was made in order to estimate transaction cost of the policy. The result
has shown the amount of information cost, policing cost and operational &
maintenance cost to establish a successful program.
Keywords: climate change, marine-fisheries, Cilacap, direct use value,
transaction cost, extension institution.

ACKNOWLEDGEMENT
My deep appreciation is accorded to Prof. Drs. Mohammad Nasir, M.Si,
Akt, Ph.D, the dean of Faculty of Economics for providing the opportunity and
assistance during my undergraduate study at Universitas Diponegoro.
I extend my sincere gratitude to my supervisor, Prof. Dra. Indah
Susilowati, M.Sc, Ph.D for her guidance and supervision throughout the
preparation of this project paper. Despite her tight work schedule, she always had
time for discussion and deliberation of the various aspect of this study.
My appreciation and gratitude go to my academic adviser, Drs. R. Mulyo
Hendarto, MSP for his help and guidance throughout the entire for years of study.
My special gratitude also due to Dr. Jusup Supriyanto and Dr. Efri
Sumastuti, for borrowing necessary data of their research project in cooperation
with BMKG.
My special thanks are also due to the Provincial and Cilacap fisheries
Offices in Central Java and Fishermen Community in PPSC Cilacap which has
permitted me to utilize their data for this study. I am indebted to its officers
namely, Mr. Nanang, Mr. Riyanto, Mr. Agustinus, Mrs. Rita, Mr. Sampo all of
whom have helped me in data collection. Also, to Dr. SuciPrajanti and Dr.
SungkowoEdyMulyono for their sharing for completing this project paper.
My special gratitude are also due to my parents, DwiAriyanto and Mei
Christina, for their love and caring, for full supports and understanding, for

making me being responsible in every decision that I take. I love you, and I will
make the best of me to make you proud.
I owe a great deal of gratitude to MayanggitaKirana and Himawan for
their guidance and point of view throughout the preparation of this project paper.
My thanks also to my classmates IESP 2006, especially to Indah YulianaPutri and
TyasDwiHapsari. My thanksare due to my best friends AnnissaRosfadilla and
Ariesha Widi Puspita for their supports throughout my entire years of study. I love
you, thank you for giving me such supports and keeping my spirit alive.
My deep appreciations are also due to my London-team: Pulung Widhi
Hari Hananto, Hanindya Prasojo, Age Ayu Merdiani, and Muhammad Rizki
Febrianto for always reminding me to finish my project paper soon. Also my
thanks are due to Undip Debating Forum members: Satrio Pratama, Mashita
Kamilia, Buna Rizal, Ary Adiati, Resha Adi Pradipta, Rizky Akita and Edward
Sutanto for giving me a broader point of view and precious experiences.
Last but not least, my appreciation is also due to Narottama T. Hariwangsa
for his endless supports, love, and helps. Thank you for always be there. I could
not do this without you.
Finally, I do hope this study can give knowledge to whomever reading this
study, and beneficial to whomever making further related studies.
Semarang, June2011
Rizky Yulianisa
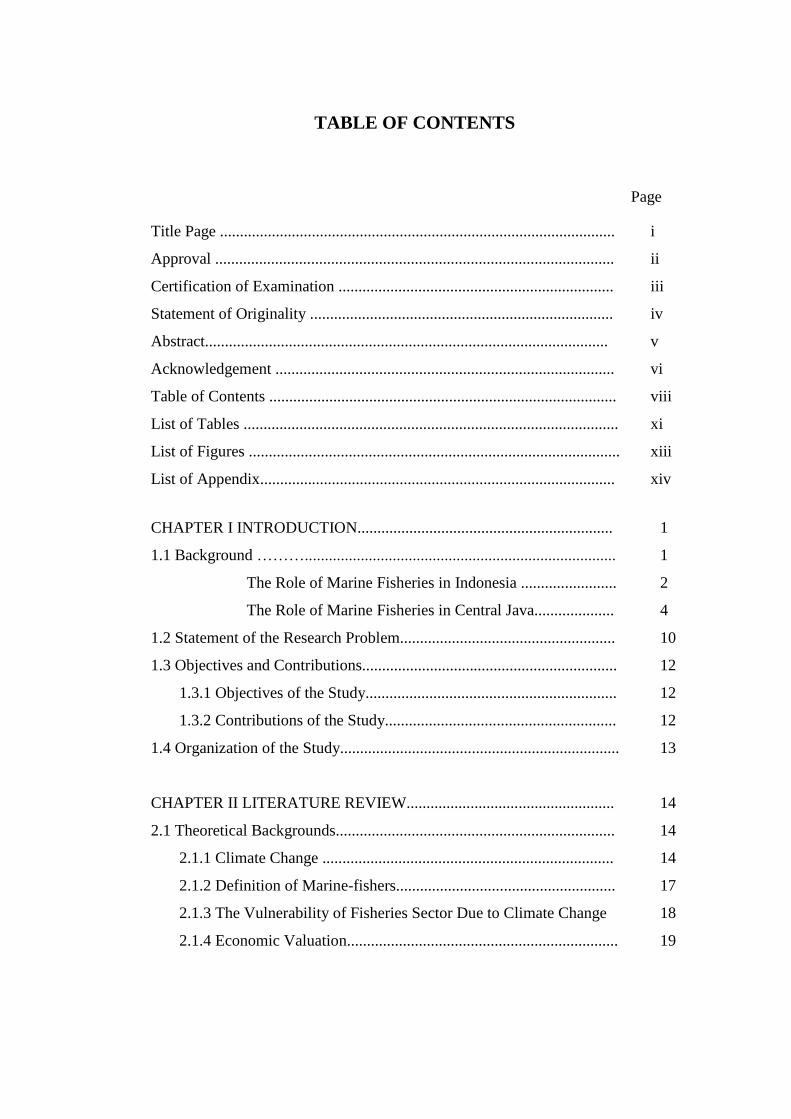
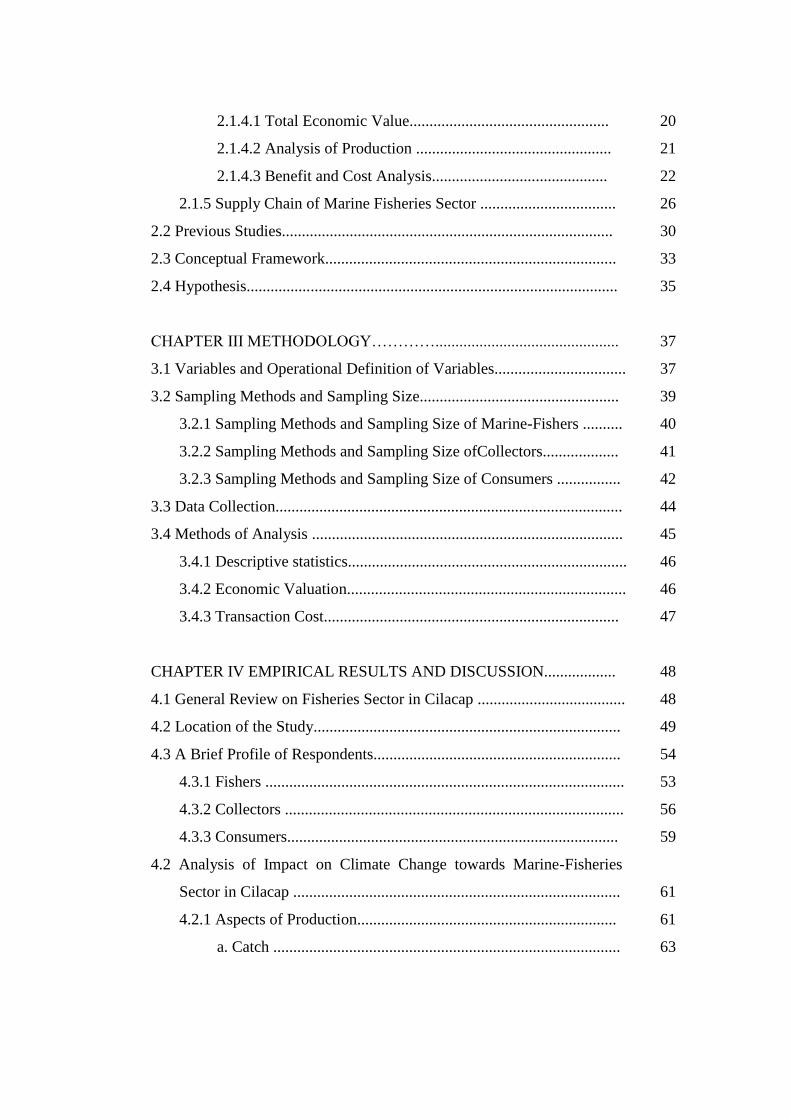
TABLE OF CONTENTS
Page
Title Page ................................................................................................... i
Approval .................................................................................................... ii
Certification of Examination ..................................................................... iii
Statement of Originality ............................................................................ iv
Abstract..................................................................................................... v
Acknowledgement ..................................................................................... vi
Table of Contents ....................................................................................... viii
List of Tables .............................................................................................. xi
List of Figures ............................................................................................. xiii
List of Appendix......................................................................................... xiv
CHAPTER I INTRODUCTION................................................................ 1
1.1 Background ……….............................................................................. 1
The Role of Marine Fisheries in Indonesia ........................ 2
The Role of Marine Fisheries in Central Java.................... 4
1.2 Statement of the Research Problem...................................................... 10
1.3 Objectives and Contributions................................................................ 12
1.3.1 Objectives of the Study............................................................... 12
1.3.2 Contributions of the Study.......................................................... 12
1.4 Organization of the Study...................................................................... 13
CHAPTER II LITERATURE REVIEW.................................................... 14
2.1 Theoretical Backgrounds...................................................................... 14
2.1.1 Climate Change ......................................................................... 14
2.1.2 Definition of Marine-fishers....................................................... 17
2.1.3 The Vulnerability of Fisheries Sector Due to Climate Change 18
2.1.4 Economic Valuation.................................................................... 19
2.1.4.1 Total Economic Value.................................................. 20
2.1.4.2 Analysis of Production ................................................. 21
2.1.4.3 Benefit and Cost Analysis............................................ 22
2.1.5 Supply Chain of Marine Fisheries Sector .................................. 26
2.2 Previous Studies................................................................................... 30
2.3 Conceptual Framework......................................................................... 33
2.4 Hypothesis............................................................................................. 35
CHAPTER III METHODOLOGY………….............................................. 37
3.1 Variables and Operational Definition of Variables................................. 37
3.2 Sampling Methods and Sampling Size.................................................. 39
3.2.1 Sampling Methods and Sampling Size of Marine-Fishers .......... 40
3.2.2 Sampling Methods and Sampling Size ofCollectors................... 41
3.2.3 Sampling Methods and Sampling Size of Consumers ................ 42
3.3 Data Collection....................................................................................... 44
3.4 Methods of Analysis .............................................................................. 45
3.4.1 Descriptive statistics...................................................................... 46
3.4.2 Economic Valuation...................................................................... 46
3.4.3 Transaction Cost.......................................................................... 47
CHAPTER IV EMPIRICAL RESULTS AND DISCUSSION.................. 48
4.1 General Review on Fisheries Sector in Cilacap ..................................... 48
4.2 Location of the Study............................................................................. 49
4.3 A Brief Profile of Respondents.............................................................. 54
4.3.1 Fishers .......................................................................................... 53
4.3.2 Collectors ..................................................................................... 56
4.3.3 Consumers................................................................................... 59
4.2 Analysis of Impact on Climate Change towards Marine-Fisheries
Sector in Cilacap .................................................................................. 61
4.2.1 Aspects of Production................................................................. 61
a. Catch ....................................................................................... 63

b. Length of Trip ......................................................................... 65
c. Costs / Spending ...................................................................... 66
4.2.2 Aspect of Distribution ................................................................ 70
4.2.3 Aspect of Consumption.............................................................. 77
4.3 Perception of Respondents Regarding Climate Change ..................... 80
4.4 Extension Institution Model in Cilacap Regency ............................... 82
4.5 Estimation of Transaction Cost (Scenario 1) ..................................... 84
4.6 Estimation of Transaction Cost (Scenario 2) ..................................... 87
4.7 Estimation of Transaction Cost for Extension Institution in Cilacap
Based on an Ideal Scenario (Scenario 1)............................................ 88
CHAPTER V CONCLUSION AND POLICY IMPLICATIONS............ 91
5.1 Conclusion...................................................................................... 91
5.2 Policy Implications......................................................................... 91
BIBLIOGRAPHY...................................................................................... 93
APPENDICES............................................................................................ 95
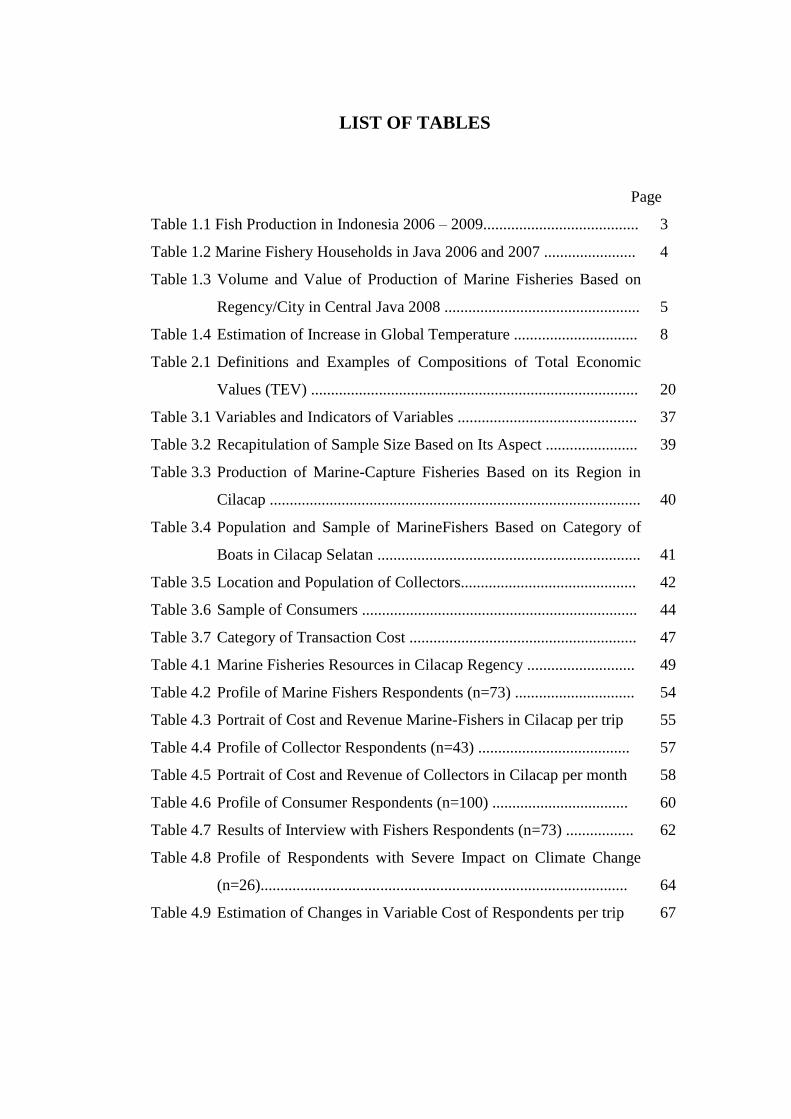
LIST OF TABLES
Page
Table 1.1 Fish Production in Indonesia 2006 – 2009....................................... 3
Table 1.2 Marine Fishery Households in Java 2006 and 2007 ....................... 4
Table 1.3 Volume and Value of Production of Marine Fisheries Based on
Regency/City in Central Java 2008 ................................................. 5
Table 1.4 Estimation of Increase in Global Temperature ............................... 8
Table 2.1 Definitions and Examples of Compositions of Total Economic
Values (TEV) .................................................................................. 20
Table 3.1 Variables and Indicators of Variables ............................................. 37
Table 3.2 Recapitulation of Sample Size Based on Its Aspect ....................... 39
Table 3.3 Production of Marine-Capture Fisheries Based on its Region in
Cilacap ............................................................................................. 40
Table 3.4 Population and Sample of MarineFishers Based on Category of
Boats in Cilacap Selatan .................................................................. 41
Table 3.5 Location and Population of Collectors............................................ 42
Table 3.6 Sample of Consumers ..................................................................... 44
Table 3.7 Category of Transaction Cost ......................................................... 47
Table 4.1 Marine Fisheries Resources in Cilacap Regency ........................... 49
Table 4.2 Profile of Marine Fishers Respondents (n=73) .............................. 54
Table 4.3 Portrait of Cost and Revenue Marine-Fishers in Cilacap per trip 55
Table 4.4 Profile of Collector Respondents (n=43) ...................................... 57
Table 4.5 Portrait of Cost and Revenue of Collectors in Cilacap per month 58
Table 4.6 Profile of Consumer Respondents (n=100) .................................. 60
Table 4.7 Results of Interview with Fishers Respondents (n=73) ................. 62
Table 4.8 Profile of Respondents with Severe Impact on Climate Change
(n=26)............................................................................................ 64
Table 4.9 Estimation of Changes in Variable Cost of Respondents per trip 67

Table 4.10 Estimation of Change in Productivity of Respondents per trip (in
Rupiah) .......................................................................................... 68
Table 4.11 Result of Interview with Collector Respondents (n=43) .............. 70
Table 4.12 Cross Tabulation between Fluctuation of Fish Selling-Price and
its Causes...................................................................................... 76
Table 4.13 Cross Tabulation between Fluctuation of Fish Availability and
its Sustainability............................................................................ 79
Table 4.14 Cross Tabulation between Fluctuation of Fish-Price and its
Affordability ................................................................................. 79
Table 4.15 Estimation of Transaction Cost (Scenario 1)................................ 86
Table 4.16 Estimation of Transaction Cost (Scenario 2)................................ 88
Table 4.17 Estimation of Transaction Cost in Cilacap................................... 89
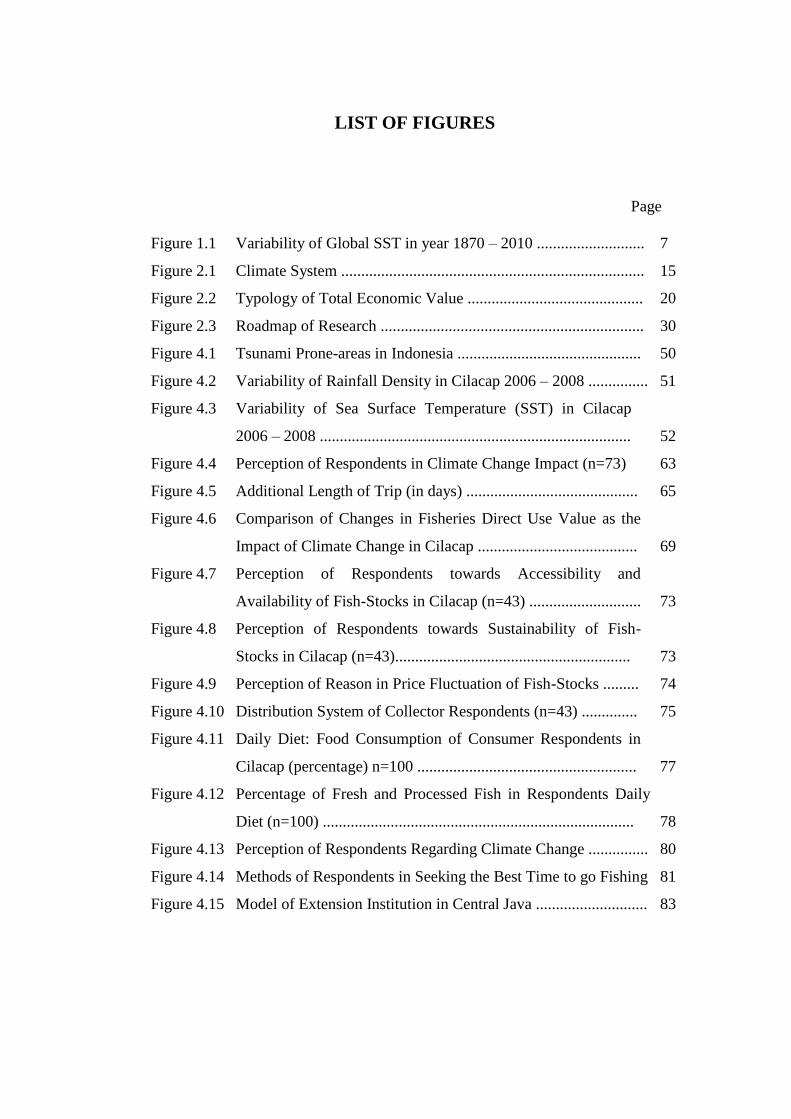
LIST OF FIGURES
Page
Figure 1.1 Variability of Global SST in year 1870 – 2010 ........................... 7
Figure 2.1 Climate System ............................................................................ 15
Figure 2.2 Typology of Total Economic Value ............................................ 20
Figure 2.3 Roadmap of Research .................................................................. 30
Figure 4.1 Tsunami Prone-areas in Indonesia .............................................. 50
Figure 4.2 Variability of Rainfall Density in Cilacap 2006 – 2008 ............... 51
Figure 4.3 Variability of Sea Surface Temperature (SST) in Cilacap
2006 – 2008 .............................................................................. 52
Figure 4.4 Perception of Respondents in Climate Change Impact (n=73) 63
Figure 4.5 Additional Length of Trip (in days) ........................................... 65
Figure 4.6 Comparison of Changes in Fisheries Direct Use Value as the
Impact of Climate Change in Cilacap ........................................ 69
Figure 4.7 Perception of Respondents towards Accessibility and
Availability of Fish-Stocks in Cilacap (n=43) ............................ 73
Figure 4.8 Perception of Respondents towards Sustainability of Fish-
Stocks in Cilacap (n=43)........................................................... 73
Figure 4.9 Perception of Reason in Price Fluctuation of Fish-Stocks ......... 74
Figure 4.10 Distribution System of Collector Respondents (n=43) .............. 75
Figure 4.11 Daily Diet: Food Consumption of Consumer Respondents in
Cilacap (percentage) n=100 ....................................................... 77
Figure 4.12 Percentage of Fresh and Processed Fish in Respondents Daily
Diet (n=100) .............................................................................. 78
Figure 4.13 Perception of Respondents Regarding Climate Change ............... 80
Figure 4.14 Methods of Respondents in Seeking the Best Time to go Fishing 81
Figure 4.15 Model of Extension Institution in Central Java ............................ 83

LIST OF APPENDIX
Appendix A Questionnaires .............................................................................. 94
Appendix B Data of Respondents ..................................................................... 108
Appendix C Output SPSS (By SPSS 17) .......................................................... 127
Appendix D Transaction Cost ........................................................................... 155

CHAPTER I
INTRODUCTION
1.1 Background
Indonesia is located between 6 08‟ North latitude and 11 15‟ South
latitude, and between 94 45‟ - 141 05‟ East longitude and equator line located at
0 latitude line. Indonesia covers an archipelagic area of 1,910,931.2 sq.km
consists of 17,504 islands, with a total population of 231.4 million in 2009 (BPS –
Statistics of Indonesia, 2009). It stretches about 5,000 km from West to East and
about 2,000 km from North to South. Two-thirds of Indonesia territory is covered
by sea, with the area of about 3.1 million sq.km, excluding 2.7 million sq.km
areas of marine waters which is under the Exclusive Economic Zone (EEZ).
Therefore, Indonesia has vast marine resources with various stocks of fish and
other marine assets.
According to Bailey (1987), the geographic location of Indonesia, between
Continent of Asia and Continent of Australia, and between Indian Oceans and
Pacific Oceans, influences the condition of the current surface for Indonesian
waters. The current surface condition is also affected by the winds of prevailing
monsoons. North of the equator during November through March, the monsoons
winds flow out of the Northeast. From June to September is dominated by the
Southeast monsoons. During this period, the circulation of surface waters is
through the Banda, Flores, Java, and Shout China Sea. But, during these last

decades this condition might change due to global warming and/ or climate
change.
Climate change is defined as any substantial change in Earth‟s climate that
lasts for an extended period of time. Global warming refers to climate change that
causes an increase in the average temperature of the lower atmosphere (Kim,
Granger, Puckett, Hasar, and Francel; 2006). Sea level rise, changing sea
temperature, inland temperature changes, changes in precipitation and water
availability, and also extreme weather, such as cyclone and inland flood, are
caused by climate change.
Climate change and or global warming can cause an increase in sea
temperature, which leads to a melting of ice and snow surface on earth. This
causes sea water volume increase and sea level rise. Over the last decade, sea
level has risen approximately 0.1 to 0.3 meters (Numberi, 2009). If this continues,
mangrove forests and wetlands will reduce, causing a decrease in water
productivity and disrupt the marine biota, which is associated with coastal
ecosystems. Moreover, coral bleaching will increase, reducing nutrition and
population of fish. This may threaten fisheries and aquacultures by shifting the
distribution of fish stocks, especially in Indonesia.
The Role of Marine Fisheries in Indonesia
The coastline of Indonesia spans over 81.000 km (Marine and Fisheries
Services, 2009) making Indonesia famous for its rich and diverse marine biota/life
as one of the largest in the world. This diversity consists of coastal ecosystem,

including mangrove forests, sea grass, coral reef, and marine ecosystem, with
large number of fish.
Table 1.1
Fish Production in Indonesia 2006 - 2009
Year 2005 2006 2007 2008 2009
Production
(million tons) 6,87 7,49 8,24 9,05 10,07
Capture
fisheries
Sub Total 4,71 4,81 5,04 5,20 5,29
Marine
Fisheries 4,41 4,51 4,73 4,70 4,79
Inland
Open
water
Fisheries
0,30 0,29 0,31 0,49 0,50
Culture
fisheries
Sub Total 2,16 2,68 3,19 3,86 4,78
Marine
culture 0,89 1,37 1,51 1,97 2,44
Brackish-
water 0,64 0,63 0,93 0,96 1,18
Freshwater 0,33 0,38 0,41 0,48 0,59
Cage 0,07 0,06 0,06 0,08 0,09
Paddy
Field 0,12 0,11 0,09 0,11 0,14
Source: Ministry of Marine Affairs and Fisheries, 2010
Table 1.1 shows the trend in fisheries production in Indonesia from 2005 –
2009. In 2009, total fish production was about 10,07 million, with the marine and
inland fisheries contributed 7,23 million tons (71,80 percent) and 2,84 million
tons (28,20 percent) respectively, and contributed 3,14 percent of the total GDP
and 3,40 of the GDP of non-Oil and Gas. This clearly indicates that predominance
of the marine subsector in Indonesian fisheries.
The estimated potential production of marine fishery in Indonesian
territory is about 8,36 million ton per year. Nonetheless, this potential seems to be

primary dominated by small-scale operations, which are typical of Indonesian
fisheries, which are dictated by low technical inputs as well as productivity and
income. However, the contribution of small-scale fisheries to the national fish
production is substantial. Inevitably, the marine fishery occupies a very important
place in Indonesian economy.
The Role of Marine Fisheries in Central Java
The island of Java plays an important role in the fisheries sector in
Indonesia. The number of fishery households in Java consecutively in 2008 and
2009 were covers 44,71 percent and 41,79 percent of the total fishery households
in Indonesia. Table 1.2 shows the largest number of fishery households was in
Central Java, with the number of households in 2008 and 2009 were 271.003 and
221.979.
Table 1.2
Marine Fishery Households in Java 2008 and 2009
Province 2007 % 2008 %
DKI Jakarta 7.411 0,70 6.575 0,68
West Java 475.939 44,74 445.826 46,44
Banten 47.725 4,49 45.502 4,74
Central Java 271.003 25,48 221.979 23,12
D.I. Yogya 48.764 4,58 47.722 4,97
East Java 210.860 19,82 190.336 19,83
Total 1.063.708 100,00 959.947 100
Source: Statistics of Indonesia, 2010
Table 1.3 shows the volume and value of production in marine fisheries by
region in Central Java in 2009. Total fish production was 195.635,7 ton with value
of 902.423.272.000 rupiahs. The contribution of northern coast and southern coast
of Central Java were 91,3 percent and 8,7 percent of the total volume of
production. The northern and southern coast of Central Java contributed

871.888.051.000 rupiahs (96,6 percent) and 30.535.221.000 rupiahs (3,4 percent)
of total value of production.
Table 1.3
Volume and Value of Production of Marine Fisheries Based on Regency/City
in Central Java 2009
Regency/City
Volume Value of
Production
Ton Share
(%) Rupiah (thousand)
Share
(%)
TOTAL 195.635,7 100,0 902.423.272,0 100,0
Northern Coast 178.627,2 91,3 871.888.051,0 96,6
Regency of Brebes 2.503,8 1,4 8.523.577,0 1,0
Regency of Tegal 588,1 0,3 6.678.750,0 0,8
City of Tegal 25.231,3 14,1 144.343.723,0 16,6
Regency of Pemalang 11.014,4 6,2 60.158.360,0 6,9
Regency of Pekalongan 1.764,1 1,0 7.539.614,0 0,9
City of Pekalongan 33.045,3 18,5 146.523.222,0 16,8
Regency of Batang 23.296,2 13,0 94.308.575,0 10,8
Regency of Kendal 1.530,8 0,9 8.953.392,0 1,0
City of Semarang 175,1 0,1 649.995,0 0,1
Regency of Demak 1.903,9 1,1 7.329.215,0 0,8
Regency of Jepara 5.992,6 3,4 31.226.511,0 3,6
Regency of Pati 31.132,5 17,4 150.191.819,0 17,2
Regency of Rembang 40.449,1 22,6 205.461.298,0 23,6
Southern Coast 17.008,5 8,7 30.535.221,0 3,4
Regency of Wonogiri 24,3 0,1 230.946,0 0,2
Regency of Purworejo 67,4 0,4 1.546.954,0 0,6
Regency of Kebumen 2.249,4 13,2 28.757.321,0 23,8
Regency of Cilacap 14.667,4 86,2 201,291,942 75,4
Source: Marine and Fisheries Services, Central Java, 2010.
Southern coast of Java is proven to be more vulnerable of disaster and
climate change, because its direct adjacent to Indian Oceans and Australasian
Plate (National Disaster Management Agency, 2010). Therefore, southern coast of
Java is more relevant to be study-area than northern coast of Java. Table 1.3
shows that Regency of Cilacap is the leading area of fisheries sectors in southern

coast of central Java. It contributed 14.667,4 tons or 75,4 percent of the total
production with the value of 201.291.942.000 rupiahs. Cilacap has a coastline of
approximately 105 km and a fishing area of 5600 km2. Fishing in the coastal area
is done within 12 miles from the coastal line and isobaths of 3-100m, or within the
border line of Indonesian Maritime Territorial Area. Regency of Cilacap
The northern coast of Java has a different characteristic compares to
southern part of Java. Unlike the southern coast, the northern coast of Java is
characterized by the presence of broad deltaic plains built out into the relatively
low-wave energy micro-tidal environment of the Java Sea by silt-laden rivers.
These deltas are formed by mud, sand and other sediments resulting from siltation
in the mouth of the rivers. While the southern coast of Java is characterized by
relatively high-wave energy, this is because the coast directly adjacent to the open
sea (Indian oceans). In theory, there are three factors which trigger waves, such as
swell, local wind, and the plate shifting at the bottom of the ocean.
In certain places, the interference between the swell with the local wind
waves – for example in Cimaja, Pelabuhanratu, or in Cilacap - can form waves as
high as 3 – 4 meters. The southern coast of Java is also vulnerable to
tsunami. Tsunami is triggered by the shifting of the plate at the bottom of the
ocean. Interaction between the three types of waves (swell, local-wind waves, and
tsunami) is believed to produce a massive-wave which will be able to sweep the
coast.
Also, because of its direct adjacent to Indian Ocean, southern coast of
Java, especially Cilacap, is vulnerable to sea surface temperature (SST) changing.

According to Bailey (1987), the role of SST is important, since it is the interface
from the atmospheric to the oceanographic environment. SST changing (global
warming) will cause harm to the fishers, because it is related to the temperature
tolerance of microbial, plankton, larvae, and fish biomass.
Global climate change gives significant impact on the fisheries sector. A
significant impact of climate change in terms of ecological and oceanography
variables have been detected since the past 30 years. According to
Intergovernmental Panel on Climate Change (2004), one of the strongest variables
in measuring climate change is SST. The variability of global SST has shown a lot
more significant changes since 1970 – present compared to decades before.
Figure 1.1
Variability of Global SST in year 1870 – 2010
Source : IPCC, 2010
Recent estimates also suggest that the impact on global temperatures will
still be very large (Table 1.4). It is due to the increasing of greenhouse gases every
year, which is highly contributed by carbon dioxide. In 2006, the concentration of
greenhouse gases in the atmosphere was around 425 parts per million (ppm) of

carbon dioxide equivalent (380 CO2 only), and it has recently been increasing by
over 2 ppm each year. Because many greenhouse gases, including CO2, stay in
the atmosphere for more than a century and the effect of climate come through
with a lag, SST and sea level rise will continue to rise during the twenty-second
century. Most of damaging consequences of climate change are associated with
water in some form, especially storm and sea level rise, which furthermore create
enormous impact towards ocean habitats.
Table 1.4
Estimation of Increase in Global Temperature
Temperature change by 2100
Temperature change at
equilibrium
CO2
equivalent
Temperature
change (Based
on IPCC 2001
climate models
Temperature
change (Based
on 2004
Hadley Centre
ensembles)
Temperature
change (Based
on IPCC 2001
climate models
Temperature
change (Based
on 2004
Hadley Centre
ensembles)
400 ppm 1,2 – 2,5°C 1,6 – 2,8°C 0,8 – 2,4°C 1,3 – 2,8°C
450 ppm 1,3 – 2,7°C 1,8 – 3,0°C 1,0 – 3,1°C 1,7 – 3,7°C
550 ppm 1,5 – 3,2°C 2,2 – 3,6°C 1,5 – 4,4°C 2,4 – 5,3°C
Source: IPCC, 2010
In measuring the level of climate change and its vulnerability to the
fisheries sector, information on climate and weather is required. In Indonesia, the
measurement of the change in climate and weather is provided by BMKG (Badan
Meteorologi, Klimatologi dan Geofisika) or Meteorology, Climatology and
Geophysics Agency.
This information is provided by the Station of meteorology BMKG.
Station of meteorology is BMKG‟s unit which has main function in monitoring
the weather and providing weather information. This information includes:
a. Weather information in general
b. Maritime weather information
c. Weather information for flights
d. Climate information
e. Earthquakes and tsunami information
Central Java has 4 cities with BMKG stations. Class I climatology station,
class II meteorology station, and class I maritime meteorology station in
Semarang, geophysics station in Banjarnegara, which provides earthquakes and
tsunami information, and class III meteorology stations in Cilacap and Tegal,
which provide weather information only in Cilacap and Tegal.
Provided information includes rainfall density, temperature, and wind
flow that affects sea currents, weather forecast, and sea level rise. This
information is useful for agriculture and fisheries sectors, especially marine
fisheries sector. In the agriculture sector this information can help farmers to
determine the best time to seed and cultivate their rice-fields, so that they obtain
the best yields as possible. Whereas in the fisheries sector, especially marine
fisheries, this information is used to seek the best time to capture fish.
Although BMKG has provided information about climate change, the
marine-fishers have low capabilities in accepting this information. Therefore,
decreasing in quantity and quality of production happens every year, especially in
Cilacap as the leading fisheries sector in southern part of Central Java. Economic
valuation on the impact of climate change is important, to estimate how much the
impact of climate change in the marine fisheries sector in Cilacap and furthermore
to formulate strategies in order to anticipate and mitigate the impact of climate
change in marine fisheries sector in Cilacap, not only because its vulnerability on
climate change but also lack of previous research in study area.
1.2 Statement of the Research Problem
Fishermen are significantly dependent on the fisheries sector. Generally,
they live in a minimum standard of living, not only economically limited, but also
socially, politically, and they are limited to the access of education. Their livings
cannot be categorized as a decent living or poor which is shown by their financial
condition and living-facilities. Kirana (2008) stated that one of the most important
things included in poverty was incapability. This incapability was strongly
connected to the ownership, employment of simple technologies, and high
dependency on the climate condition, especially when the climate affects the tidal
which affects the number of fish captured. This shows that the coastal livelihood
is still vulnerable to climate change.
Climate change has caused the coastal livelihoods, which consist of
fishermen, fish farmers, and other households that depend their living on fisheries
sector, become economically unstable.
Although BMKG has provided information to the Marine and Fisheries
Services in the local areas, the coastal livelihoods still have a low acceptability to
this information. This can be proven from the fisheries sector that are still
dominated by small-scale fishermen, and that these fishermen still sail to the sea
to capture fish when the storm happening which causes them to get minimal
results from fish capturing. It proves that the information from BMKG is
important for the fishermen.
However, it is also proven that miss-match between BMKG information
and what the fishermen belief as a culture or social behavior happen. Fishermen
in central Java, especially in Cilacap regency, still have a tendency to use
traditional technologies in predicting the climate change, such as: constellations,
and local belief on the culture of catching in order to predict the location and time
of capturing fish, and these fishermen are difficult to accept information that has
been provided by BMKG, causing a decrease of productivity of marine fisheries.
Therefore an economical measurement of impact of climate change to
determine the cost/benefit of the fishermen in these local areas is required.
Based on explanation above, some questions of the research can be
concluded as follows:
1. Which area in the southern part of Central Java is the most vulnerable to
climate change?
2. How much is the impact towards the production of marine fisheries in that
particular vulnerable-area?
3. What is the total economic value of the impact of climate change in the
marine fisheries sector in the study-area?
4. What strategies can be done by the stakeholders in anticipating the impacts
of climate change?
1.3 Objectives and Contributions
1.3.1 Objectives of the Study
1. To identify the most vulnerable area of climate change on fisheries sector
in central Java.
2. To explore on climate change impact towards the marine fisheries
production in the prone-area.
3. To estimate economic valuation of the impact of climate change on
fisheries sector in the study-area.
4. To formulate the adaptation and mitigation strategies on the impacts of
climate change.
1.3.2 Contributions of the Study
1. As a consideration in determining the right policy, especially the
adaptation and mitigation strategies on the impact of climate change on
marine fisheries in Cilacap regency, central Java.
2. As a source of improvement in marine fisheries sector.
3. As a reference for the future research with similar problems and topics.

1.4 Organization of the Study
CHAPTER I
Introduction, this chapter presents the background of research,
research questions, purpose and advantages of research, and systematic of
writings.
CHAPTER II
Study of Literature, this chapter presents a brief view of theoretical
literature and empirical studies related to the study, as well as previous
research, critical framework, and hypothesis.
CHAPTER III
Methodological framework, this chapter presents the research
variables, operational definition, sample, research source, methods of
sample collection, and methods of analysis to answer the research
questions.
CHAPTER IV
Result and discussion, this chapter presents the description of
objects of research, data analysis which gives the estimation, discussion
which gives the interpretation and research result comprehensively.
CHAPTER V
Closing, this chapter includes the conclusion of data analysis and
discussion, as well as recommendation towards particular parties which
are related to this research..

CHAPTER II
LITERATURE REVIEW
2.1 Theoretical Backgrounds
2.1.1 Climate Change
According to the World Climate Conference (1979), weather is defined as
a condition of atmosphere in a certain period of time, including the changing and
the disappearance of a phenomenon. Whereas Gibbs (1987) defines weather as a
condition of atmosphere characterized by many parameters, including
temperature, pressure, wind, humidity, and several rain phenomenon, in an area in
a short period of time (minutes, hours, months, seasons, or years).
Climate is defined as a synthesis of events related to weather in a long
period of time, which is statistically sufficient enough to show the difference
between one period to another (BMKG). Gibbs (1987) defines climate as a
statistical chance of a condition of atmosphere, including temperature, pressure,
wind, humidity, which occur in an area in a long period of time.
Climate change is the change of conditions of earth‟s atmosphere,
including temperature and rainfall density which heavily impacts on many aspects
of human lives (Ministry of the Environment, 2001). These physical changes
happen in a long period of time. National Institute of Aeronautics and
Space(2002) defines climate change as the average change of one or more
elements of weather in an area and global climate change is defined as the change
of climate of the earth. IPCC (2001) stated that climate change refers to the
average variations of an area‟s climate or to the variability which is statistically

actual for a long period of time (usually decades or more). Further, it is also stated
that climate change happens due to internal natural process, as well as external
forces or continuous human activities change the atmosphere‟s composition and
land use patterns.
Climate change is often perceived as „global warming‟. However, global
warming is only one part of climate change because temperature is one of the
parameters of the climate. Other related parameters are precipitation, cloud, wind,
and sunscreen radiation. Global warming is an average increase of atmosphere
temperature near by the earth surface and troposphere which contributes to the
global climate change pattern. Global warming occurs as the result of an increase
of greenhouse effect on the atmosphere (NOAA). The increase of greenhouse
effects is mainly caused the over flows absorbance of the sun‟s infrared ray by the
atmosphere through the earth‟s reflection. This, causes global climate change
(Budianto, 2000)
Although global warming is only one part of the climate change
phenomenon, yet it is important to be observed. That is because the changes in
temperature will affect significantly to human activities. These changes could
change the condition of the environment which will affect to the places where
people live. This means, global warming threatens the entire human lives.
The climate system on figure 2.1 explains that climate change causes
changes in atmosphere, ice, vegetation, ocean, and land surface. This is caused by
the changes in plate tectonics, earth‟s orbit, and sun‟s strength.

Figure 2.1
Climate System
Source :NOAA, 2008 (http://www.ncdc.noaa.gov/paleo/ctl/about1a.html)
Climate change causes changes in sea surface temperature. SST is
important since it is the interface from the atmospheric to the oceanographic
environment. The most important analysis on SST variability carried out from
1971 to 2000. Before 1980, the anomaly of SST was below normal, or cooler than
its average value. After 1980, the SST anomaly has been above average. On the
basis of small scale fishery resources point of view, SST anomaly of 0,5C
(positive or negative) before 1980 was still tolerable. But when SST anomaly
reaches 2C, or above, it would be harmful for small scale fishery resources, and
the extreme anomaly is regarded since 1980. (Susilowati, 2010)
2.1.2 Definition of Marine-Fishers
Fishermen are a group of people who depend their lives on marine
products, both from fish catching and fish farming. Generally, fishermen live in
the coastal area close to their activities area.
Charles (2001) divided groups of fishermen into several terminologies.
Full fishermen are fishermen that depend all of their daily needs on capturing fish.
Part-time fishermen are fishermen that depend some of their daily needs on
capturing fish as well as doing other activities such as farming and labors. There
are ship-owner fishermen who can afford to run a fisheries business such as ships,
fishing nets, equipment and tools. Ship-crew is people that allocate their time to
operate ships and nets and earn wages from the job. Individual fisherman is a
fisherman who has his own ships, boats, and nets, and operates it individually.
Besides those groups, fishing industry in this region involves individuals working
in four major activities: fish-capturing, fish-farming, fish-processing, and sales of
fish (Indah Susilowati, 2004).
Some fishermen in this country face many challenges, such as: lack of
modern culture and knowledge. For example, they save money to repair the
facilities they own. They are generally lack of knowledge to solve the problem of
climate change. Poverty, slums, and marginalized community are the social
phenomenon arouse in this coastal marine-fishers community.

2.1.3 The Vulnerability of Fisheries Sector Due to Climate Change
Most of marine fisheries in Indonesia are community fisheries and only
few of marine fisheries are industrial ones. Community fisheries themselves are
still traditional. This means, that these fisheries are not well-informed and
equipped with modern technologies. They simply believe in the traditional
information inherited intergenerational and use traditional equipment and tools.
According to the Intergovernmental Panel on Climate Change (2007),
vulnerability is a state of which a system is vulnerable to, and the inability to
overcome the impacts from climate change, including climate variability and
extreme.
The two major considerations in measuring the level of vulnerability of
fisheries sector are how far the impacts of climate change including other changes
involving fisheries sectors would be and the vulnerability of that sector to the
impacts of the change.
Vulnerability is affected by many factors, such as the local government
policy regarding fisheries sector or the capability of related institutions,
technology, and other aspects. For example, people depend their lives on fisheries
sector are vulnerable because of their informal legal status, their poor livelihood
(both physically and socially), and their subsistence production (self-sufficiency).
The core of the vulnerability of fisheries sector is the critical risk. Risk, in
this context, is the disaster caused by climate change. Several indicators of
disaster can be obtained from secondary data, for example meteorology data that
shows the frequency of rainfall and the period of rainy season (BMKG). The risk

analysis will show how sensitive fisheries sector is to climate change and the
capability of fisheries sector to adapt. This will make the formulation of policy,
which overcomes the vulnerability of fisheries sector to climate change, become
more effective and well-targeted.
2.1.4 Economic Valuation
Economic valuation on ecosystem or environment is considered
significant. This is because economic valuation offers at least five benefits
according to NOAA. Firstly, it can be used to estimate the benefits offered by an
ecosystem to the community. Secondly, it is useful to estimating the cost and
benefit of various environmental systems, including conservations, ecotourism,
and others. Thirdly, it helps the process of decision making. Fourthly, economic
valuation also helps in estimating the cost that has to be spent by those using
resources, such as tourists and fishermen, or taxes that have to be paid by
individuals or companies which can cause negative effects to ecosystem. Last but
not least, economic valuation can be used to help formulate policies that are
efficient and suitable for the application and resource management.

Total Economic Value
Use Value
Direct Use
Value
Indirect Use Value
Option Value
Non-Use value
Bequest value
Existence Value
2.1.4.1 Total Economic Value (TEV)
According to Freeman III (2002) TEV is a sum of economic value based
on use value (UV) and economic value based on non-use value (NUV). UV
consists of direct use value, indirect use value, and option value. While NUV
consists of two components; bequest value and existence value. Typology of total
economic value can be seen in figure 2.2.
Figure 2.2
Typology of Total Economic Value
Source: Freeman III, 2002
Barton (1994) explains several methodological approaches to valuate
ecosystem/resource based on the typology above. Most of the approaches used are
based on cost-approach. This is because benefit-approach is relatively
unpredictable. Some popular methodologies are the effect of production (EOP) or
production analysis and benefit-cost analysis, where benefit is described as
production income. In its application in fishery, the widely used economic
valuation was direct use value, with the analysis of production as the basis of its
estimation.

Table 2.1 explains the values in total economic values (TEV) :
Table 2.1
Definitions and Examples of Compositions of Total Economic Values (TEV)
No Values Definition Example
1 Direct Use Value Value of economy obtained from
direct use of resource/ ecosystem
Fishery use, mangrove
wood use, etc
2 Indirect Use Value Value of economy obtained from
indirect use of resource/
ecosystem
Function of coral reefs
ecosystem as spawning
ground for coral-type
fish, etc
3 Option Value Value of economy obtained from
potential direct use and indirect
use of resource/ ecosystem
Benefit of biodiversity,
new species, etc
4 Bequest Value Value of economy obtained from
the use of protection of
resources/ ecosystem for future
generation
Value of a traditional
community system
related to resources/
ecosystem; habitat, and
biodiversity.
5 Existence Value Value of economy obtained from
a perception that a resource/
ecosystem exists regardless
being used or not
Coral reefs that reach
extinction, endemic
species, etc
Source : Barton (1994)
2.1.4.2 Analysis of Production
Production is defined as the use of resources which completely transforms
one commodity into another commodity, in terms of definition, place and time
where these commodities are allocated, and how the consumers work on those
commodities (Miller and Meiners, 2000). Production is not only limited to its
producers, but also storage, distribution, shipping, and repacking.

Production process involves production factors consisting of workforce,
land, capital, and entrepreneurship. In the economics theory, to analyze
production, it is always assumed that three factors of production (land, capital, and
entrepreneurship) are constant. The relations between factors of production used
and the amount produced is called production function. Soekartawi (1990)
explains that production function is the physical relation between dependent
variable (Y) and independent variable (X). Explained variable is usually an input
and dependent variable is usually an output.
2.1.4.3 Benefit and Cost Analysis
One of the means in economic valuation is by analyzing the cost and
benefit resulted from a production. (Pearceet. al, 2006)
1. Production Cost
Production cost is defined as all expenses of a producer to gain
production factors and raw materials which will be used in a production. In
Gilarso (2003), cost is all sacrifices in a production process, in the value of
money, according to the market price.
Sadono Sukirno stated that production cost can be divided into six
categories, based on the relation between the natures of cost and the level
of output:
a) Total fixed cost (TFC), the total permanent cost that has to be paid
regardless the level of output, for example: Ship or boat buying,
equipment epreciation, and others.

b) Total variable cost (TVC), the total cost that changes according to the
level of output, for example: fuel cost, workforce cost, and others.
c) Total cost, the sum of total fixed cost (TFC) and total variable cost
(TVC)
………………….………….………………….(2.4)
d) Average fixed cost (AVC), the permanent cost of each unit of output,
where:
…………………………………………………..(2.5)
TFC is the total fixed cost and Q is the total output.
e) Average Variable Cost (AVC), other cost besides AFC of each unit of
output, where :
………………………………………………….(2.6)
TVC is the total variable cost and Q is the total output.
f) Average total cost (ATC), the production cost of each unit of output,
where :
…………………………………………………..(2.7)
TC is the total cost and Q is the total output.
In production, including fishery production, cost usually reveives its
primacy because it requires many considerations to make decision. These
considerations are needed to fulfill the production cost which will lead to a
successful production.
Production cost in fishery consists of two categories; actual cost and input
cost. Actual cost consists of cash and non-cash. Cash costs in fishery businesses
are, such as, fuel (solar, gasoline, and oil), preservatives(ice and salt), cost of food
and drink supplies for crew members of ships, cost of ship/boat reparation, and
cost of retribution. Non cash cost is, for example, the wages of crew members
after the selling of production. Input costs are, for example, the depreciation value
of boat/ship, machines, and fishing nets. This is because such cost is not fixed, but
only a rough prediction (Mulyadi, 2005).
Wattanutchariya (1982), cost of fishery business is classified into three
components:
a) Variable cost, the cost that is actually paid and changed according to
number of fish produced, for example food supplies, fuel, wager, and
medicine.
b) Fixed cost, the cost outside the production and operation, such as
reduction of fishing nets and equipment.
c) Opportunity cost from input owners, both variable cost and fixed cost,
such as wager for crew members from own family, the use of land and
interests from capitals.
Fixed cost usually consists of depreciation cost of assets and the payment
of interests used to buy those assets. Opportunity cost of capital ownership
invested in fishery business is supposed to be fixed cost. Variable cost is defined
as the total cost from all inputs when the fishery business operates, which includes

workforce cost, fuel cost, other input cost, and opportunity cost from workforce
from own family.
Based on the result of pre survey on site, fixed cost includes value of ship
depreciation, value of nets depreciation, and value of machine depreciation.
Variable cost includes workforce cost, cost of raw material of fish, ice blocks,
herbs for cooking (salt, etc), clean water, cost of equipment maintenance,
retribution (security, license,etc), and other cost depends on the kinds of
businesses.
2. Revenue
There are several important concepts of analyzing producer‟s
behavior (Boediono, 1993):
a) Total Revenue (TR), the total revenue from the total output. In
Fisheries sector, TR is the total revenue of fishermen or fish farmers.
Total revenue is the multiplication of output/ number of fish produced
(Q) and Fish price (PQ), where :
…………………………………………………….(2.8)
b) Average Revenue (AR), the revenue per unit of output sold. Where :
………………………………………….(2.9)
Thus AR is price of output sold / fish per unit (PQ)
c) Marginal Revenue (MR), the increase of total revenue (TR) caused by
additional selling of one unit of output / fish. Where :
…………………………………………………………..(2.10)
3. Maximum Profit

Maximum profit () is a margin between total revenue (TR) and
total cost (TC). The total of maximum profit is the furthest vertical
distance between TR and TC curves (Sukirno, 2005).
2.1.5 Supply Chain of Marine Fisheries Sector
According to the Food and Agriculture Organization of the United Nations
(2009), the supply chain includes all links from the point of production to the end-
user or final consumer. The supply chain therefore contains a sub-set of markets
or marketing systems.
A marketing system is defined as the chain of links between
producers/suppliers and consumers/users, including all mechanisms, flow,
interchanges, services and operators, and which determine the relationships
between producer earnings and the supply of the physical product. Flows through
a well-functioning marketing system include information on prices, market
situation, trends, and consumer preferences as well as flows of physical product,
and of money, credit and property rights.
Flows of physical product or distribution process, according to Dent
(2008), is also a very important component of supply chain management.
Distribution refers to the distribution of a good from one business to another. It
can be from producers to supplier, supplier to retailer, or retailer to end customer.
It is defined as a chain of intermediaries; each passing the product down the chain
to the next organization, before it finally reaches the consumer or end-user. This
process is known as the 'distribution chain' or the 'channel.' Each of the elements

in these chains will have their own specific needs, which the producer must take
into account, along with those of the all-important end-user.
A number of alternate 'channels' of distribution may be available:
Distributor, who sells to retailers, (also called as wholesaler)
Supplier, who sells to wholesaler
Retailer (also called dealer or reseller), who sells to end customers
Whereas in the distribution of fish as consumer goods, there are five
alternatives of distribution channel:
1. Producers – Consumers
2. Producers – Retailer – Consumers
3. Producers – Wholesaler – Retailer – Consumers
4. Producers – Supplier – Wholesaler – Consumers
5. Producers – Supplier – Wholesaler – Retailer – Consumers
Traditionally, the distribution channels in most developing countries were
characterized by a series of different levels such as importers, distributors,
wholesalers and retailers as well as food brokers and agents, with each level
performing a specific task. More recently, increased competition and improved
logistics have shortened the chain in many markets in which imported products
directly bought from source by the wholesaler or by the retail chain operator.
Wholesale markets play an important role in the distribution of fish and
fishery products. They are generally divided into two categories; first hand
wholesale markets that act as distribution centers for locally produced fish, and
second hand wholesale markets that distribute products imported from other

regions or from abroad. The latter plays a significant role particularly in urban
areas.
Wholesale markets offer economic efficiency gains as the clients, usually
retailers and caterers, but also smaller local wholesalers can confront a large
variety of products from different sources all located in one area. The large
number of wholesalers present in the market guarantees a high level of
competition with prices that immediately reflect changes in supply and demand.
In many cities, the fish wholesale market is also integrated in a larger structure of
food wholesale markets. City governments or municipal authorities own most
wholesale markets. In order to ensure the competitiveness of the market in local
fish distribution, it is vital that the concerns and interests of the main stakeholders;
i.e. wholesalers and their clients, are taken into account and their role recognized
and not only seen as a source of revenue for the municipal finances.
Retail chains are growing up faster than wholesale markets. Numerous
international studies document the increasing power exercised in food distribution
by the retail chains, such as: a marketing strategy for sea farmed products in
Indonesia by Elsy, survey of value chain in Asia by Food & Agriculture
Organization. Despite the negative competitive impact on suppliers and smaller
retailers and fish mongers, the overall positive effects of modern retail channels
includes lower prices to the consumer, improved accessibility and added
convenience. It is also obvious that supermarket chains present important
opportunities for volume sales for low-cost producers. In the European and North
American markets for example, the chains have played an important role in
promotion and volume sales of aquaculture products such as salmon, bass, bream
and catfish.
The successful formula of retail chains is a balanced mix of competitive
pricing, large share of fresh produce and high quality standards obtained through
narrow product specifications, modern logistics and stringent controls. In fact, one
recurring result in consumer surveys is the trust placed by the consumer in the
supermarket brand. That this phenomenon is not only confined to developed
countries is evidenced by the proliferation of supermarket chains also in
developing countries
In any market, the price formation mechanism is of fundamental
importance. In order to guarantee economic efficiency and efficient allocation of
scarce economic resources, available prices must reflect the actual costs of
products and services but also the propensity of buyers to demand and of
producers to produce and offer for sale. In order to achieve this, prices must be
formed in a mechanism that gives voice to both the supply and the demand side.
In principle, a product can be sold in two ways: through private or direct
sale or through public selling such as auctions. An auction is a regulated public
sale in which goods are sold to the highest bidder. The seller will auction a
product when he is expecting a higher price through public sale than through
private sale.
2.2 Previous Studies
The previous studies are as follows:
1. Indah Susilowati (2010)
Indah Susilowati (2010) conducted a research entitled „Developing
Adaptation Strategies Due to The Vulnerable Small Scale Fisheries Sector in
Central Java – Indonesia‟. The main purpose of this research was framing
adaptation strategies and mitigations for fisheries sector due to climate change.
Data used in this research was primary and secondary data. Primary data was
obtained from the fishermen in Central Java with adequate sample, discussions
with key-persons and other competent people, whereas the secondary data was
used to enrich the analysis of this research. This study used GIS maritime
meteorology (Hartoko and Sulistya, 2009) and socio-economic approach
(Susilowati et al., 2004; 2005; 2007; 2009) with modifications. Results of this
research are: (1) the proof of the impacts of climate change on fishermen that are
vulnerable in chosen areas; and (2) short term mitigation and adaptation strategies
for small scale fisheries sector in order to survive the climate change.
2. E. Baran, N. Schwartz, Y. Kura (2008)
They conducted a research entitled „Climate Change and Fisheries:
Vulnerability and Adaptation in Cambodia‟. The purpose of this research was to
frame adaptation strategies for fishermen that were vulnerable to the impacts of
climate change. This research stated that Cambodian fishers were very vulnerable
to climate change. The hydrologic variations that happened in Mekong River were
caused by climate change, causing changes of pattern of fishing, followed by the

extreme decrease of fishery production. This change of production made the
people depend fully on fishery production. This in turn worsens poverty,
marginalization, and the lack of other livelihood alternatives making them
difficult to survive. Therefore, an adaptation plan that ensures irrigations and
hydraulics projects being useful to the fisheries sustainability in Cambodia was
needed. The adaptation strategy aroused from this research was the building of
capacity of fishery community to promptly adapt to the climate change, with more
diversification oflife dependency and more access to natural resources, which
were side by side with the increase of long term capacity to adapt to climate
change.
3. Mayanggita Kirana (2008)
The research entitled “Comparative analysis of empowerment level and
Fish Processing between The Northern Coast and Southern Coast of Central Java
in Supporting Food Security” has the objectives:
1 to identify the empowerment capability of fishermen and fish mongers
in Rembang and Cilacap regencies from the economic and non-
economic strength aspect.
2 to analyze their business strength in order to support the food stability
for the surrounding community.
3 to frame the correct strategy to increase empowerment.
Data which were used in this research consist of primary and secondary
data. Samples were collected using multistage sampling. Respondents taken as
samples were fishers that used gillnets as fishing gears in Rembang and Cilacap

regencies, with each regency consists of 100 people. Respondents used as samples
of fish mongers in Rembang and Cilacap regencies consist of respectively 133 and
129 people. And sample for consumers in Rembang and Cilacap regencies
consists of 100 people for each regency. A method of analysis used in this
research was descriptive analysis.
The result of the identification of the empowerment level of fishermen and
fish mongers in Rembang and Cilacap Regencies generally showed a lack of
power. However, if further compared, it was shown that fishermen and fish
mongers in Cilacap regency were relatively more powerful compared to those in
Rembang regency. This was caused by their lack of access to political power,
economy, social and culture, which leads to the fragility in supporting the food
stability. Therefore, strategy and alternatives are formed in order to increase the
empowerment of fishermen and fish mongers in Rembang and Cilacap regencies
using Analysis of Hierarchic Process (AHP).
The roles of stakeholders are needed through an activity of increasing the
empowerment by establishing groups of coastal community where education,
trainings, micro-credit loans according to their income cycle, and business
assistance can be done. Furthermore, education for consumers to safely fill the
needs of protein from fish also needs to be done. The food stability of an area can
be increased through the strategy of community empowerment; therefore they
have more roles in supporting the food stability.

2.3 Conceptual Framework
The invulnerability of coastal livelihood to the impact of climate change
has been the hope for all sectors including fisheries sector, fisheries business,
government, and other relevant sectors. However, that hope is seemingly far-
fetched, seeing the poverty in the research area. The poverty of this community is
strongly related to the ownership and the use of simple technology and the high
dependency of fisheries sector on climate (Indah Susilowati, 2004; Mayanggita
Kirana, 2008)
The change of ecosystem caused by climate change affects the
productivity of fisheries sector, mainly in the disaster prone areas where climate
change, storms, and abrasions can be found. These fishermen are vulnerable
because they still have a lack of understanding about climate and weather
information which is provided by BMKG, and they still use traditional technique
in predicting weather, making the output of production decrease. This causes their
bidding level lower.
Therefore, economic valuation to frame adaptation and mitigation
strategies is needed. It is expected that the income of the people working in small
scale fisheries sector and the fulfillment of needs of the coastal livelihood will
increase.


2.4 Hypothesis
Based on the research of Indah Susilowati (2010) entitled „Developing
Adaptation Strategies Due To Climate Change: with Special Reference to The
Vulnerable Small Scale Fisheries Sector in Central Java – Indonesia‟, small scale
fisheries sector, which consists of fishers with 5 – 30 GT speed boat, was the most
vulnerable sector to climate change in Java island. Their inability was caused by
their unawareness of the indicators of fishery vulnerability. Therefore, there
should be a continuous empowerment of stakeholder that was competent, such as
academics/NGO, businessman, government, and community in general. Marine
and Fisheries services, BMKG, local government, the department of industry, and
should immediately work together in the efforts of the empowerment of coastal
livelihood. This research also stated that the co-management approach is a
promising approach in overcoming the impacts of climate change on fisheries
sector.
E. Baran, N. Schwartz, Y. Kura (2008) also stated that most fisheries
workers in Cambodia are very vulnerable to climate change. Adaptation and
mitigation strategies offered by the research are increasing the adaptation capacity
in fisheries community by building infrastructure such as hydropower dam,
intensifying the fisheries sector, and building macroeconomics.
Based on prior research and studies, the hypotheses of this research are:
1. The level of vulnerability of people in fisheries sector due to climate
change is still high. This is caused by the ignorance of the local fishermen

about the information given by BMKG and the traditional culture of
fishing in study area.
2. The climate change shifts the best season for fishing. Thus, the fishermen
would not be able to go fishing in the same season like they used to be
which will decrease their productivity. Furthermore, climate change will
cause an additional length of trip and additional costs/spending of
fishermen.
CHAPTER III
METHODOLOGY
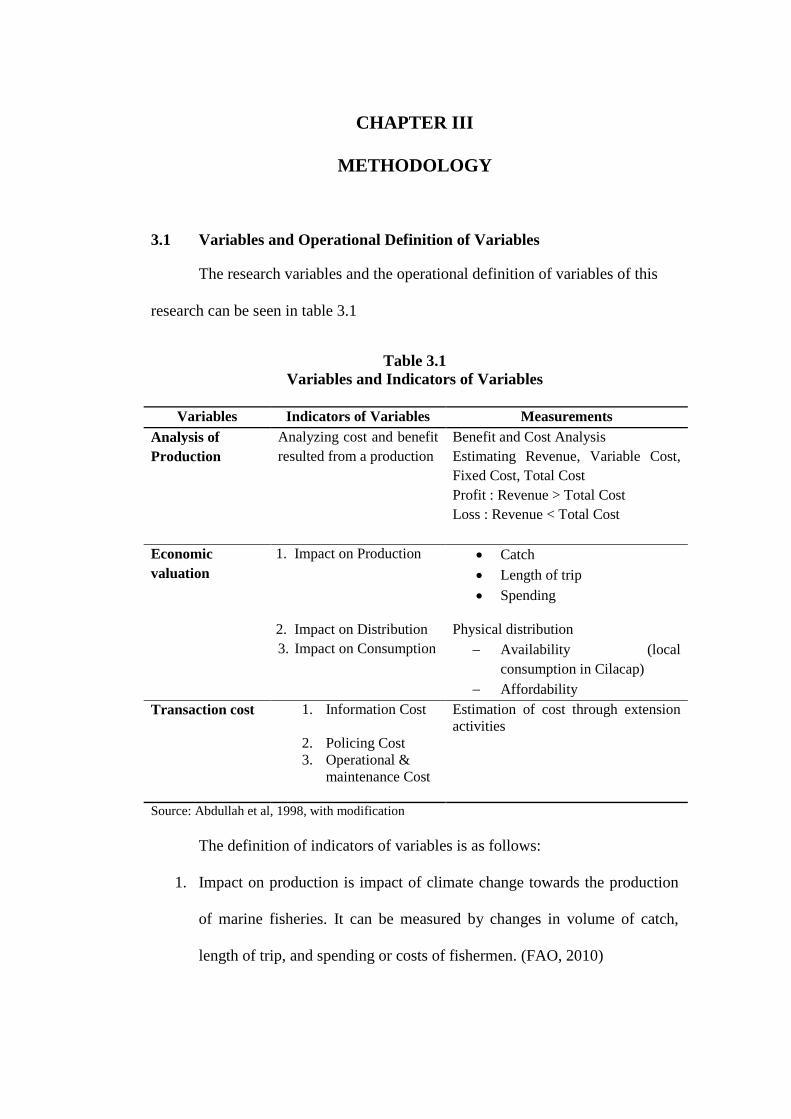
3.1 Variables and Operational Definition of Variables
The research variables and the operational definition of variables of this
research can be seen in table 3.1
Table 3.1
Variables and Indicators of Variables
Variables Indicators of Variables Measurements
Analysis of
Production
Analyzing cost and benefit
resulted from a production
Benefit and Cost Analysis
Estimating Revenue, Variable Cost,
Fixed Cost, Total Cost
Profit : Revenue > Total Cost
Loss : Revenue < Total Cost
Economic
valuation
1. Impact on Production Catch
Length of trip
Spending
2. Impact on Distribution Physical distribution
3. Impact on Consumption Availability (local
consumption in Cilacap)
Affordability
Transaction cost 1. Information Cost Estimation of cost through extension
activities
2. Policing Cost
3. Operational &
maintenance Cost
Source: Abdullah et al, 1998, with modification
The definition of indicators of variables is as follows:
1. Impact on production is impact of climate change towards the production
of marine fisheries. It can be measured by changes in volume of catch,
length of trip, and spending or costs of fishermen. (FAO, 2010)

2. Impact on distribution is the impact of climate change towards the
physical distribution of fisheries products (FAO, 2010). In this case is
production of marine fishers.
3. Impact on consumption is the impact of climate change towards the
consumption of fisheries products, which can be measured by availability
and affordability (how many product can be consumed by fisheries which
are relevant to their level of income).
4. Extension activity is the process of community learning and empowerment
involving fishermen, businessmen and traders of fishery products to do
“discovery learning” in order to obtain knowledge and technology to solve
problems independently and interdependently.
5. Information cost is the cost of gathering information in managing a system
to produce an efficient decision (Abdullah et al., 1998). The success of
education program depends heavily on the amount of information
available to policy makers, extension counselors, and extension targets
(fishermen). Examples of information include: information on fisheries
potential (quantity, quality, price, and location), and weather information
by BMKG.
6. Policing cost is the cost incurred in making an agreement between
stakeholders. Such costs include: coordination with communication
provider, coordination with related agencies, and coordination between
local and central government.
7. Operational cost is the cost used to implement and monitor education
programs. Operational costs include: execution of programs, trainings,
monitoring and evaluation, and institutional operational cost.
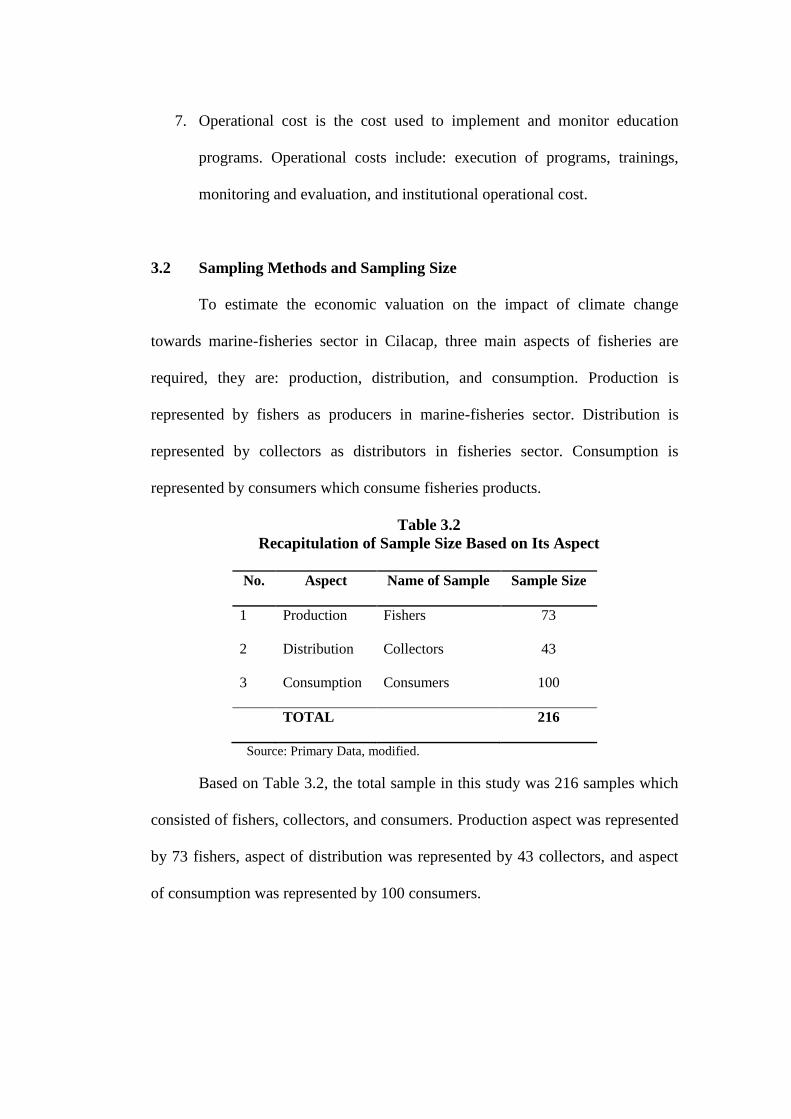
3.2 Sampling Methods and Sampling Size
To estimate the economic valuation on the impact of climate change
towards marine-fisheries sector in Cilacap, three main aspects of fisheries are
required, they are: production, distribution, and consumption. Production is
represented by fishers as producers in marine-fisheries sector. Distribution is
represented by collectors as distributors in fisheries sector. Consumption is
represented by consumers which consume fisheries products.
Table 3.2
Recapitulation of Sample Size Based on Its Aspect
No. Aspect Name of Sample Sample Size
1 Production Fishers 73
2 Distribution Collectors 43
3 Consumption Consumers 100
TOTAL 216
Source: Primary Data, modified.
Based on Table 3.2, the total sample in this study was 216 samples which
consisted of fishers, collectors, and consumers. Production aspect was represented
by 73 fishers, aspect of distribution was represented by 43 collectors, and aspect
of consumption was represented by 100 consumers.

3.2.1 Sampling Methods and Sampling Size of Marine-Fishers
Population in this research was marine capture fishers located in Cilacap
regency. As there were many limitations in conducting this research, samples
representing the entire population was taken. The sampling method of fishers in
Cilacap regency was multi-stages sampling, with several steps as follows:
Step 1
The first step is determining the region which would be used for the sampling
areas. Based on the volume of production which was produced by the marine
capture fisheries households (Table 3.2), the major area was located in Cilacap
Selatan which later on became the location of sampling. The sampling location
was determined based on the volume of production in those areas.
Table 3.3
Production of Marine-Capture Fisheries Based on its Region in Cilacap 2009
No. Region Volume of
Production (ton)
Value of
Production
(billion rupiahs)
1. District of Cilacap
Utara 811 16,42
2. District of Nusawungu 0,597 4,30
3. District of Cilacap
Selatan 5.850 47,96
Source: Marine and Fishery Offices, 2010
Step 2
The second step is determining the amount of sample. Sample was taken through
quoted sampling, which was marine-fishers with ship category of 10-50 GT for
production (n = 73) for the sample of fishermen in Cilacap Selatan. Due to limited
time of research and the field condition, especially ships which operated for 4 – 7
days, 15 – 25 days, and even 3 – 6months, the obtained data were 73 marine-

fishers boats, considering production variations, value of production, limited-time
of study and field condition. Data were collected from door to door. And the
distribution of sample was as follows:
Table 3.4
Population and Sample of Marine-Fishers Based on Category of Boats in
Cilacap Selatan
No Category of
Boats
Population (unit) Sample
1. 5 – 10 GT - -
2. 10 – 50 GT 202 73
3. 50 – 200 GT 30 -
Source: Marine and Fishery Offices, 2010
Category of boats which was taken as sample was considering requirements of
boat which can survive in wave above 3 meters high with built-in boat or not
outboard motors. Because wave above 3 meters high is considered as one of the
impact of climate change towards the currents of Indonesian waters (NOAA,
2009).
3.2.2 Sampling Methods and Sampling Size of Collectors
Population in this research was distributors or commonly named as
pengepul or collectors which was located in Cilacap regency. Since there were
many limitations in conducting this research, sample representing the entire
population was taken. The sampling method of collectors in Cilacap regency was
cluster sampling.
The number of collectors in Cilacap based on Profile of Marine and
Fisheries in Cilacap (Marine and Fisheries Offices, 2010) was 99 collectors,

which consisted of 90 small scales collectors, 8 medium scale collectors, and 1 big
scale collectors.
Step 1
The first step is determining the region which would be used for the sampling
areas. Based on the data of marine and fisheries offices, the major area was
located in TPI Pelabuhan Perikanan Samudra Cilacap (PPSC) which was taken
as the location of sampling. The sampling location was determined based on Table
3.5
Table 3.5
Location and Population of Collectors
No Name of TPI Number of
Collectors Sample Size
1. TPI PPSC 71 43
2. TPI Sidakaya 4 -
3. TPI Sentolokawat 6 -
4. Mina Usaha Jetis 8 -
Source: Marine and Fishery Offices, 2010
Another 7 TPI in Cilacap, such as: Lengkong, Seleko, Pandanarang,
Tegalkatilayu, Bateray, Kemiren, and RawaJarit, are considered active. But most
of these TPI are selling inland-fisheries (Marine and Fishery Offices, 2010),
which is irrelevant towards this study.
Step 2
The second step is determining the amount of sample. Roscoe (1975) recommends
sample size which is ideally between 30 to 500 elements. Thus, the number of
collectors which was taken was 43 persons in TPI PPSC.
3.2.3 Sampling Methods and Sampling Size of Consumers
Population in this study was consumers which were located in Cilacap
Regency. Sampling method of consumer respondents was done by stratified
cluster sampling. Consumers were classified into three clusters according to their
monthly-income, which were low-income cluster, middle-income cluster, and
high-income cluster. The clusters were classified as follows:
1. Low-income cluster: consumers whose income were less than 800.000,00
rupiahs per month
2. Middle-income cluster: consumers whose income were between
800.000,00 to 2.000.000,00 rupiahs per month
3. High-income cluster: consumers whose income were above than
2.000.000,00 rupiahs per month
Income level, which was used to determine the cluster, was based on Upah
Minimum Regional (UMR) or regional minimum wage of labor in Cilacap
regency. According to Central Bureau of Statistic of Central Java (2010), UMR of
labor in Cilacap was 760.000,00 to 790.000,00 rupiah per month. Thus, criteria
for low-income cluster was 800.000,00 rupiah, middle-income cluster was
2.000.000,00 rupiah, and high-income cluster was above 2.000.000,00 or 3 times
bigger than 800.000,00 (Mason et al., 1999).
In determining the sample size, quoted sampling was taken. Quotably, the
distribution of sample in each cluster can be seen in Table 3.6. Most samples were
in middle-income level or between 800.000,00 to 2.000.000,00. Therefore, the
most distribution was in the middle-income cluster.

Table 3.6
Sample of Consumers
Criteria Sub-sample
1. Low-income cluster 30
2. Middle income cluster 40
3. High-income cluster 30
TOTAL 100
Source: Primary Data, modified
3.3 Data Collection
The source of data is the subject from which the data is obtained (Mason et
al., 1999). The type and source of data employed in this research is primary and
secondary data.
a. Primary data are the data obtained directly from the source or the object of
research. The primary data in this research are collected from direct
interviews with respondents (fishermen) using series of questions from
„Economic Valuation of Climate Change in Marine Fisheries in Cilacap,
Central Java‟
b. Secondary data are the data published before or already used in previous
research or studies. Secondary data support this research which were
collected from the following institutions:
1) Central Java in Numbers 2009, BPS Central Java
2) Data of Fishery Production 2006-2009, Marine and Fishery Offices
Central Java

3) Data of Fishery Production 2006-2009, Marine and Fishery Offices in
Cilacap
4) Meteorology, Climatology, and Geophysics Services in Cilacap
Data collection in this study was gained by several methods, they are:
1. Interview, done by direct questioning to respondents through
questionnaire.
2. Observation, direct observation on respondents on site, that was the
fishermen around Cilacap. According to Arikunto (2006), observation is
observing and recording which is done at the location of object or
phenomenon of the study, along with the object studied, to get the real
picture of the study.
3. Documentations in this research are obtained from relevant literatures,
newspapers, and magazines, also written materials from related institutions
and the internet relevant to the study.
4. In-Depth Interview
In-depth interviewing is a qualitative research technique that involves
conducting intensive individual interviews with small number of
respondents to explore their perspectives on a particular idea, program,
and situation. In this case, in-depth interview was employed to obtain
perspective of stakeholders towards the impact of climate change towards
marine-capture fisheries in Cilacap.

3.4 Methods of Analysis
The method of analysis in this study was a descriptive statistics to
determine the impact on climate change to the stakeholders, and economic
valuation of benefit and cost which were obtained by the stakeholders because of
climate change.
3.4.1 Descriptive Statistics
The method of analysis in this study was a descriptive statistics.
Descriptive statistics is used to solve the problem of quantity measurements. This
approach departs from the processed data into valuable information for decision
making process (Mason et al., 1999)
It is used to calculate socio-economic profile of respondents, revenue and
cost patterns of respondents, and other related indicators.
3.4.2 Economic Valuation
Economic valuation in the context of environment is the measurement of
people‟s preferences on environment (which is less important). According to
Pearce (2006), economic valuation is mainly the process of value determination of
goods and services of the environment.
The approach of the model of economic valuation analysis used in this
research is Total Economic Value (TEV). TEV was employed to estimate the risk
caused by the climate change on marine-fisheries, especially the marine- fisheries
in Cilacap.
The risk encountered by the fishermen of marine-capture fisheries was the
loss caused by the decrease of the number of fish captured. Loss is defined as loss

in production (catch), additional length of trip, and increased spending. These
costs were estimated through the analysis of benefit and cost.
3.4.3 Transaction Cost
Transaction cost analysis was chosen to determine the amount of cost used
to establish a model of adaptation and mitigation strategies on the impact of
climate change which adopted the model of transaction cost. This model had been
engineered by Abdullah et al., (1998).
Transaction cost of an exchange is a characteristic inherent in a particular
institution. Transaction costs consist of information cost, policing cost, and
operational cost. Information cost is the cost of gathering information in managing
a system to produce an efficient decision (Abdullah et al., 1998), this includes:
creating new database, information on technology, weather and climate
information, etc. Policing cost is the cost incurred in making an agreement
between stakeholders. Such costs include: program planning, coordination with
related institution/agencies, and fishers-group. Operational and maintenance cost
is the cost used to implement and monitor extension education programs.
Operational costs include: Execution of programs, trainings, monitoring and
evaluation, and institutional operational cost. The category of transaction cost can
be seen on the Table 3.7 below:
Table 3.7
Category of Transaction Cost
No. Activity Rupiah
1. Information Cost Creating new database of
fisheries potential in Cilacap

Information on fisheries
technology in the area
Climate and weather
information
Information on capital
2.
Policing Cost
Program Planning
o Design of program
o Feasibility studies
o Meetings
o Socialization of
program
Coordination with related
institution
Coordination with fishers-group
3. Operational& Maintenance
Cost
Transportation cost
Field trip
Post-program assistance
Documentation Maintenance of infrastructure Maintenance of supporting
facility
Maintenance of database
Evaluation and monitoring of
program
TOTAL Source: Abdullah et al., 1998


![bulelengkab.bps.go...Kecamatan Banjar Dalam Angka 2011 iv KATA PENGANTAR Berkat karunia Ida Sang Hyang Widhi Wasa / Tuhan Yang Maha Esa, publikasi ^< u v Banjar Dalam Angka 2011^ lu]](https://img.pdfslide.us/doc/110x75/5e5c28e3a77c1a3ed82d4c52/-kecamatan-banjar-dalam-angka-2011-iv-kata-pengantar-berkat-karunia-ida-sang.jpg)