Embed Size (px)
Citation preview
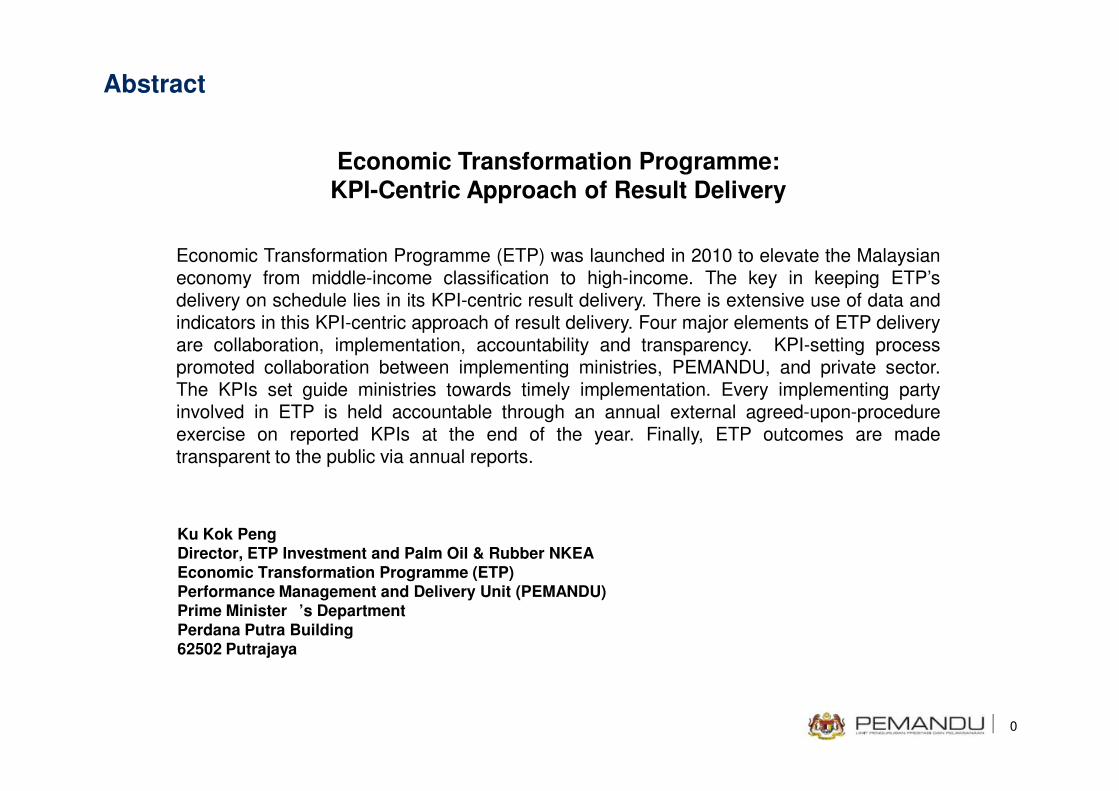
Abstract
Economic Transformation Programme (ETP) was launched in 2010 to elevate the Malaysianeconomy from middle-income classification to high-income. The key in keeping ETP’sdelivery on schedule lies in its KPI-centric result delivery. There is extensive use of data andindicators in this KPI-centric approach of result delivery. Four major elements of ETP deliveryare collaboration, implementation, accountability and transparency. KPI-setting processpromoted collaboration between implementing ministries, PEMANDU, and private sector.The KPIs set guide ministries towards timely implementation. Every implementing party
Economic Transformation Programme: KPI-Centric Approach of Result Delivery
0
The KPIs set guide ministries towards timely implementation. Every implementing partyinvolved in ETP is held accountable through an annual external agreed-upon-procedureexercise on reported KPIs at the end of the year. Finally, ETP outcomes are madetransparent to the public via annual reports.
Ku Kok PengDirector, ETP Investment and Palm Oil & Rubber NKEAEconomic Transformation Programme (ETP)Performance Management and Delivery Unit (PEMANDU)Prime Minister�’s DepartmentPerdana Putra Building62502 Putrajaya
Understanding Progress Through Data & IndicatorsMyStats 2013
1
18 November 2013
Ku Kok PengDirector, ETP Investment and Palm Oil & Rubber NKEA
MyStats 2013
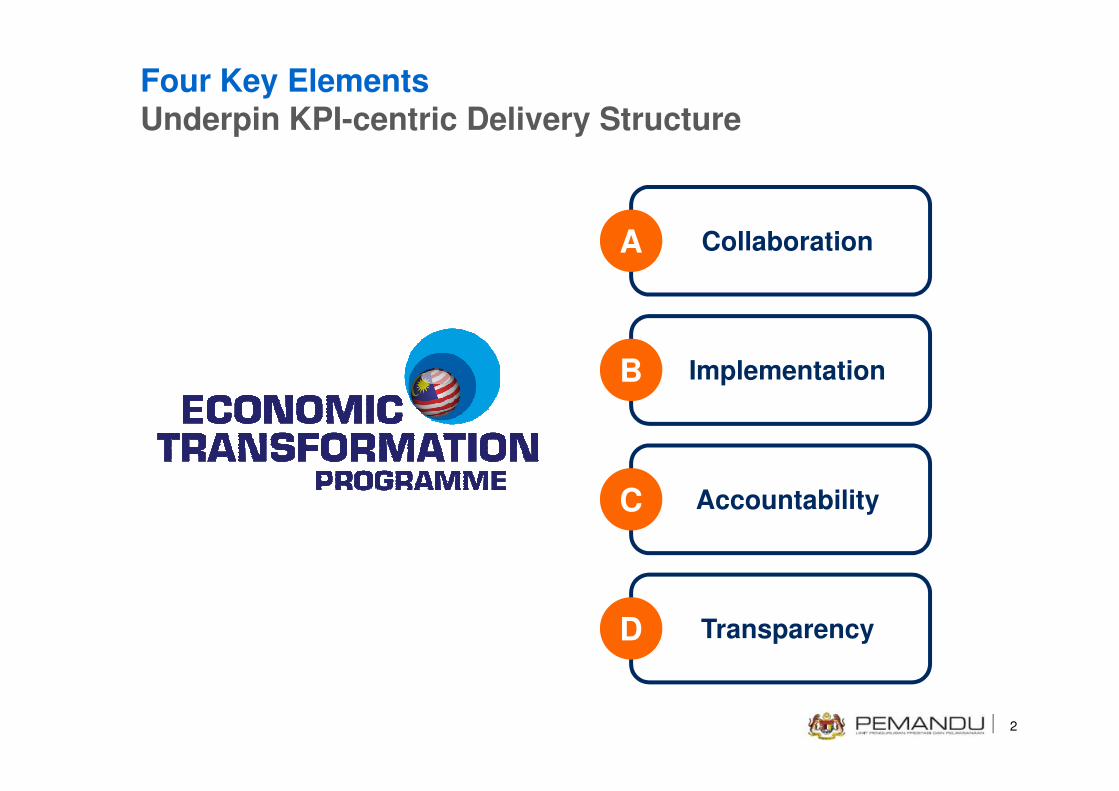
A Collaboration
B Implementation
Four Key Elements Underpin KPI-centric Delivery Structure
2
C Accountability
D Transparency
Gross National
Income (GNI)
GNI
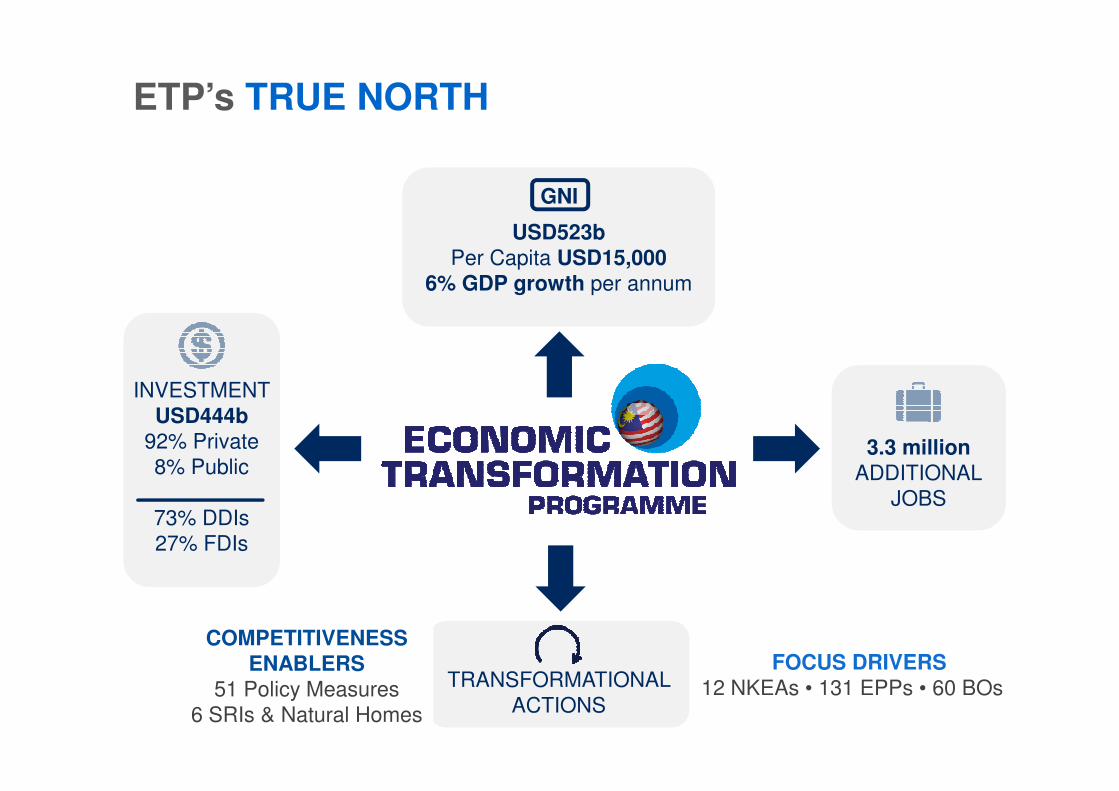
USD523bPer Capita USD15,000
6% GDP growth per annum
ETP’s TRUE NORTH
INVESTMENT
3.3 millionADDITIONAL
JOBS
INVESTMENT
USD444b92% Private
8% Public
73% DDIs
27% FDIs
FOCUS DRIVERS12 NKEAs • 131 EPPs • 60 BOsTRANSFORMATIONAL
ACTIONS
COMPETITIVENESSENABLERS
51 Policy Measures
6 SRIs & Natural Homes
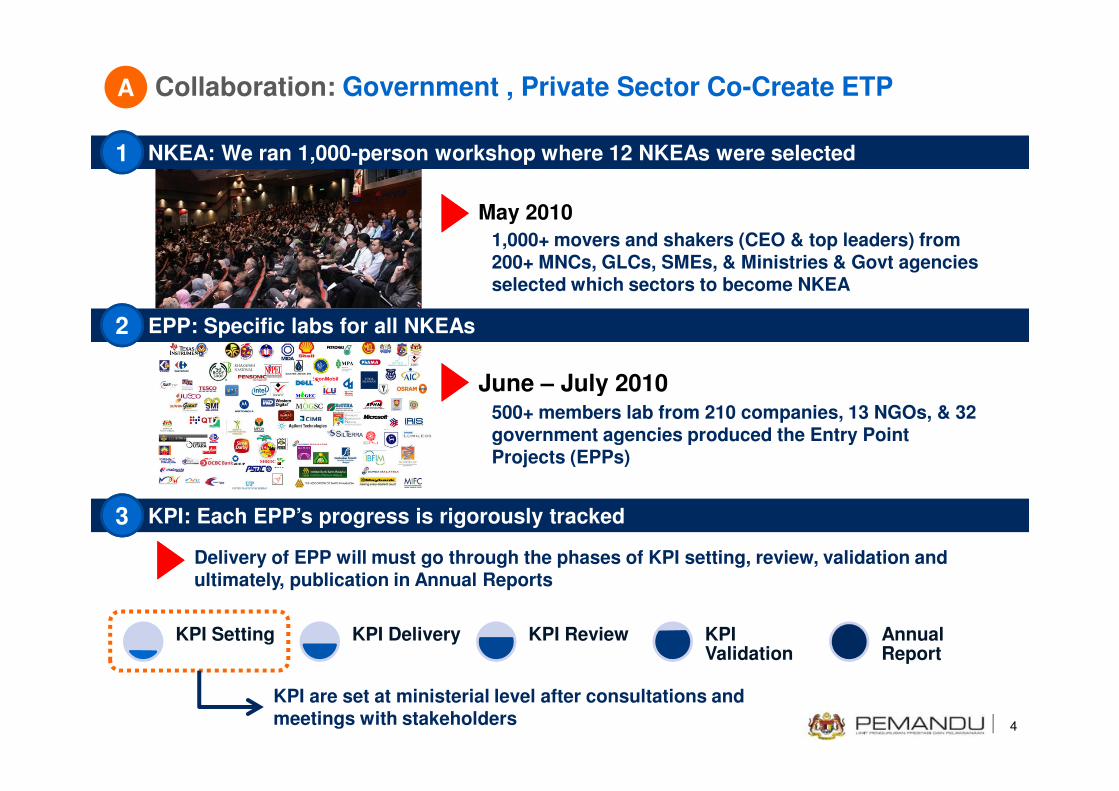
NKEA: We ran 1,000-person workshop where 12 NKEAs were selected
EPP: Specific labs for all NKEAs
June – July 2010
1,000+ movers and shakers (CEO & top leaders) from 200+ MNCs, GLCs, SMEs, & Ministries & Govt agencies selected which sectors to become NKEA
May 2010
1
2
Collaboration: Government , Private Sector Co-Create ETPA
4
June – July 2010500+ members lab from 210 companies, 13 NGOs, & 32 government agencies produced the Entry Point Projects (EPPs)
KPI: Each EPP’s progress is rigorously tracked3
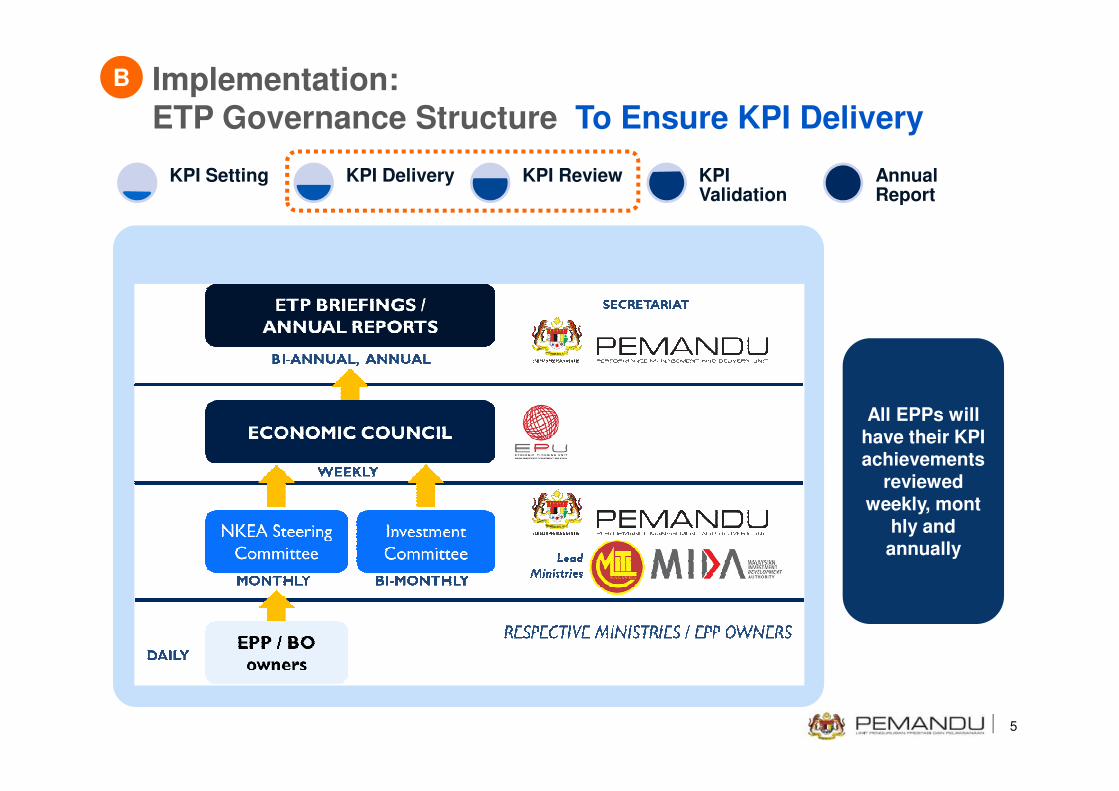
Delivery of EPP will must go through the phases of KPI setting, review, validation and ultimately, publication in Annual Reports
KPI Setting KPI Delivery KPI Review KPI Validation
Annual Report
KPI are set at ministerial level after consultations and meetings with stakeholders
KPI Setting KPI Delivery KPI Review KPI Validation
Annual Report
Implementation: ETP Governance Structure To Ensure KPI Delivery
B
5
All EPPs will have their KPI achievements
reviewed weekly, mont
hly and annually
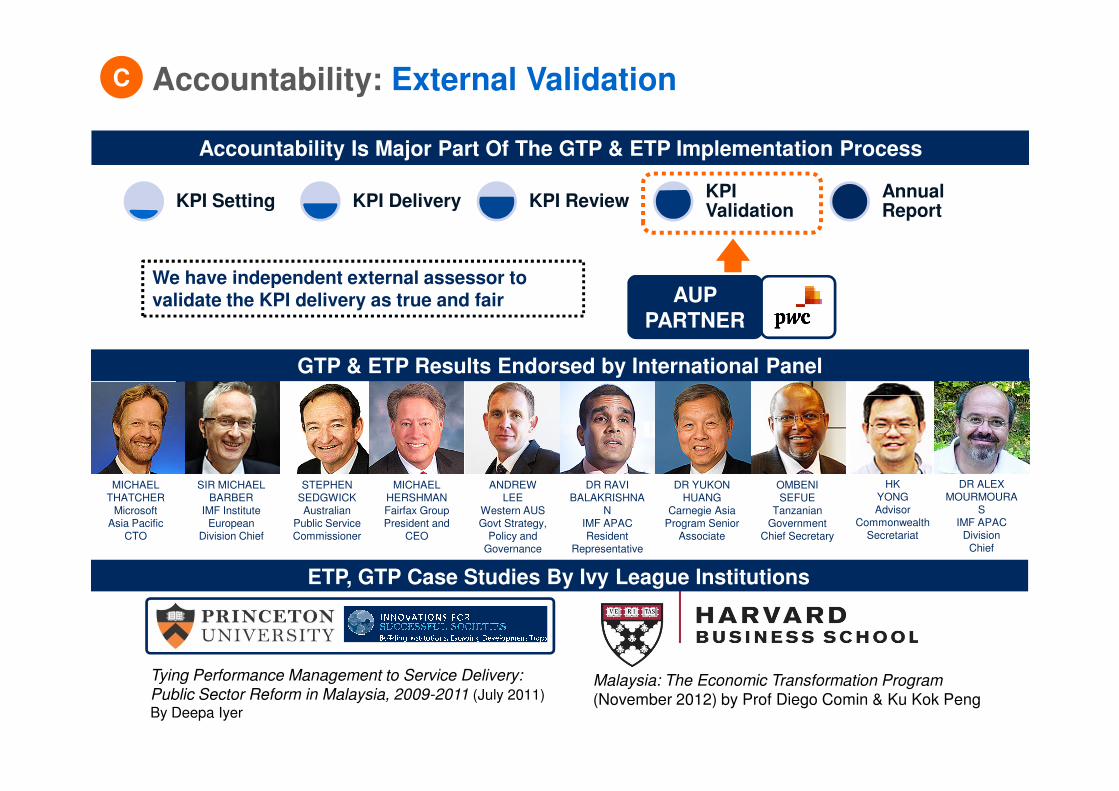
Accountability: External ValidationC
GTP & ETP Results Endorsed by International Panel
Accountability Is Major Part Of The GTP & ETP Implementation Process
KPI Setting KPI Delivery KPI ReviewKPI Validation
Annual Report
AUP PARTNER
We have independent external assessor to validate the KPI delivery as true and fair
DR ALEX MOURMOURA
SIMF APAC
DivisionChief
HKYONGAdvisor
CommonwealthSecretariat
OMBENI SEFUE
Tanzanian Government
Chief Secretary
DR YUKONHUANG
Carnegie Asia Program Senior
Associate
DR RAVIBALAKRISHNA
NIMF APACResident
Representative
ANDREWLEE
Western AUS Govt Strategy,
Policy and Governance
MICHAELHERSHMANFairfax GroupPresident and
CEO
STEPHEN SEDGWICKAustralian
Public ServiceCommissioner
SIR MICHAELBARBER
IMF Institute European
Division Chief
MICHAELTHATCHER
Microsoft Asia Pacific
CTO
Malaysia: The Economic Transformation Program
(November 2012) by Prof Diego Comin & Ku Kok Peng
Tying Performance Management to Service Delivery:
Public Sector Reform in Malaysia, 2009-2011 (July 2011)
By Deepa Iyer
ETP, GTP Case Studies By Ivy League Institutions
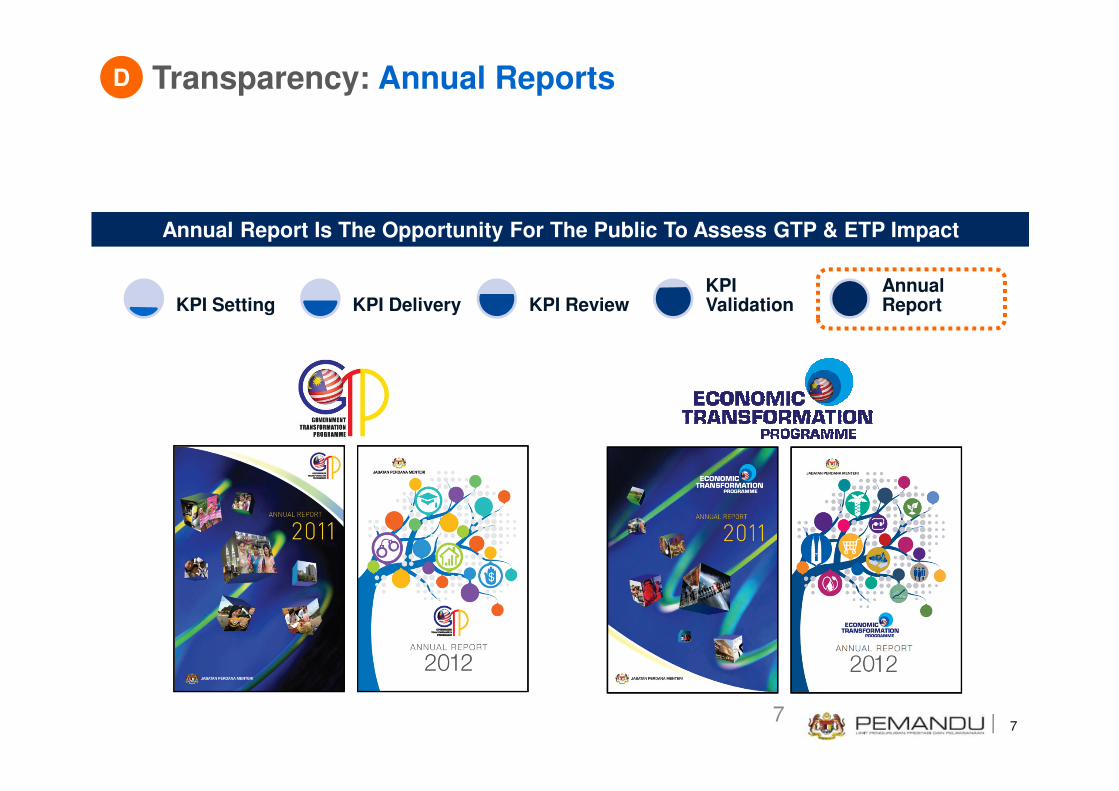
Transparency: Annual ReportsD
KPI Setting KPI Delivery KPI ReviewKPI Validation
Annual Report
Annual Report Is The Opportunity For The Public To Assess GTP & ETP Impact
77
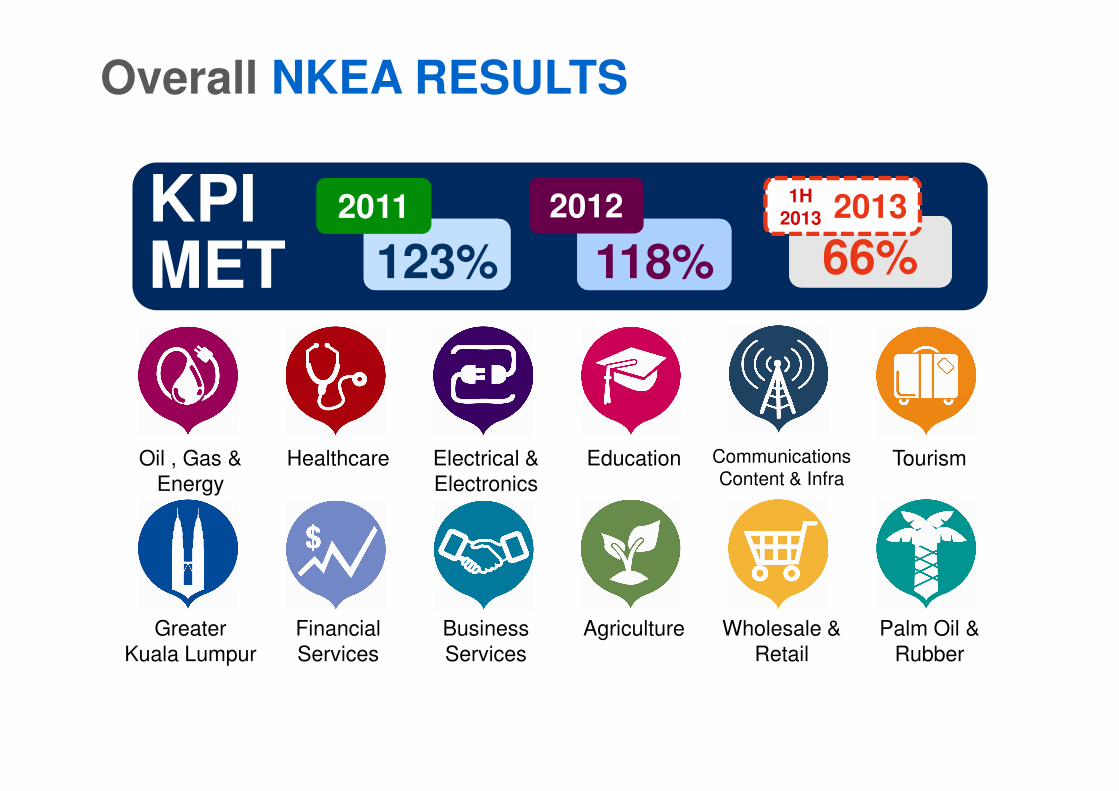
KPIMET
2011
123%
2012
118%
2013
66%
1H2013
Overall NKEA RESULTS
Oil , Gas &
Energy
Healthcare Electrical &
Electronics
Education Communications Content & Infra
Tourism
Greater
Kuala Lumpur
Financial
Services
Business
Services
Agriculture Wholesale &
Retail
Palm Oil &
Rubber
BENCHMARKINGBENCHMARKING
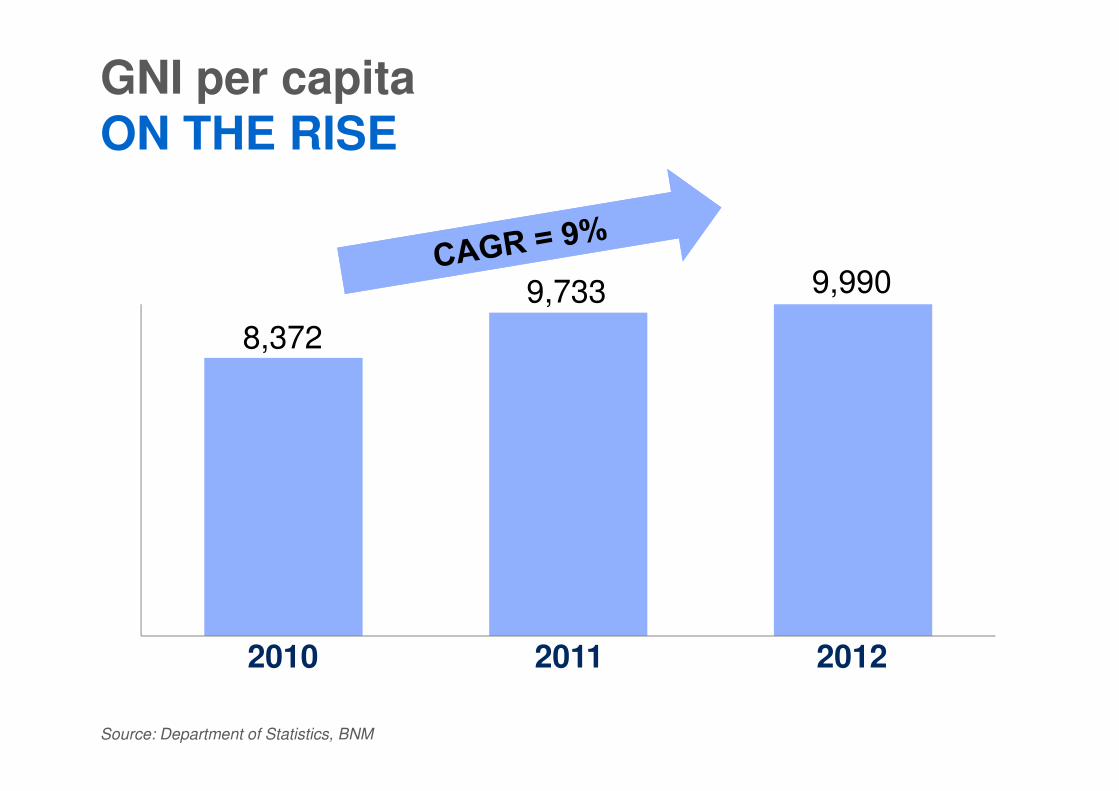
8,372
9,733 9,990
GNI per capitaON THE RISE
Source: Department of Statistics, BNM
201220112010
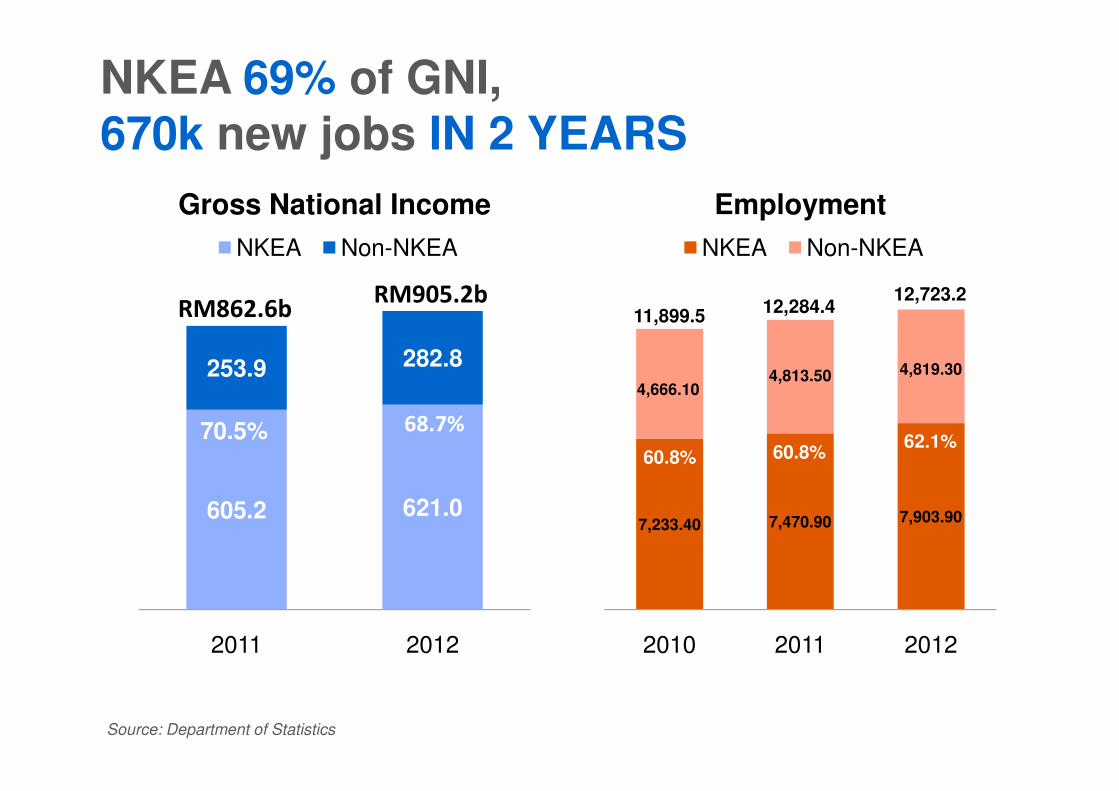
253.9 282.8
Gross National Income
NKEA Non-NKEA
RM862.6bRM905.2b
4,666.104,813.50 4,819.30
Employment
NKEA Non-NKEA
11,899.512,284.4
12,723.2
NKEA 69% of GNI, 670k new jobs IN 2 YEARS
605.2 621.0
2011 2012
70.5% 68.7%
7,233.40 7,470.90 7,903.90
4,666.10
2010 2011 2012
60.8% 60.8%62.1%
Source: Department of Statistics
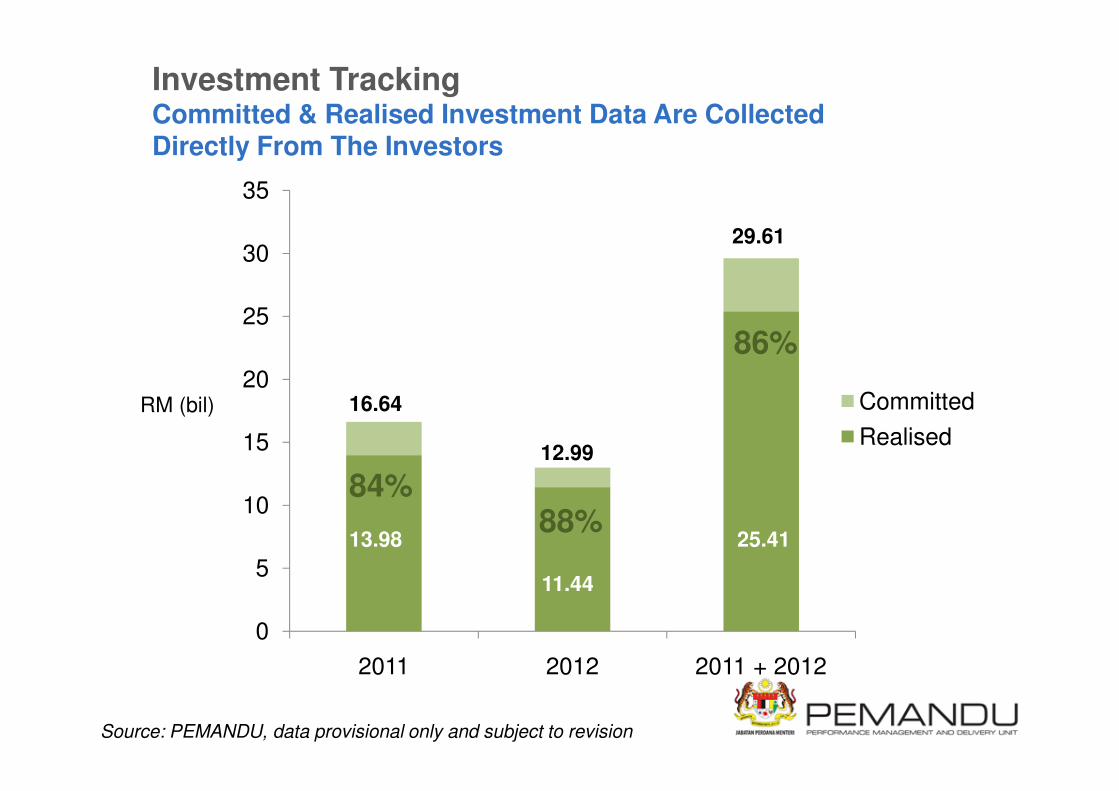
Investment TrackingCommitted & Realised Investment Data Are CollectedDirectly From The Investors
20
25
30
35
CommittedRM (bil)
86%
16.64
29.61
Source: PEMANDU, data provisional only and subject to revision
0
5
10
15
2011 2012 2011 + 2012
Committed
Realised
RM (bil)
84%88%
13.98
11.44
25.41
16.64
12.99
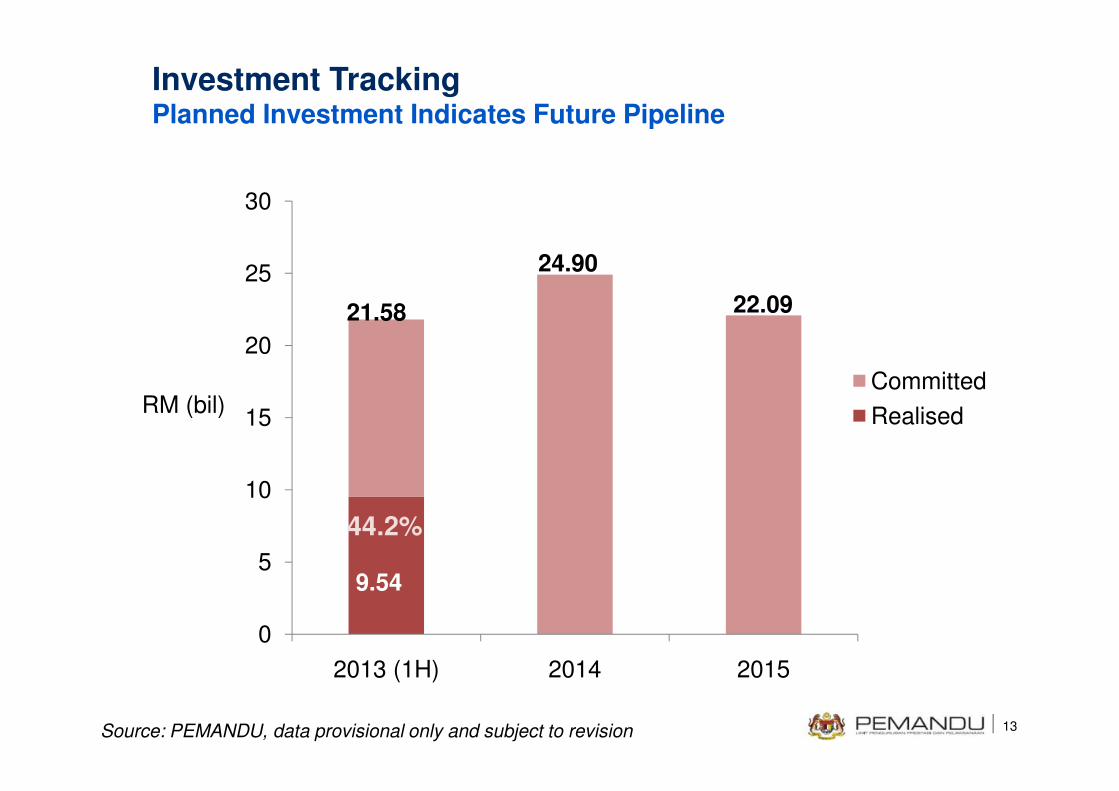
20
25
30
CommittedRM (bil)
21.58
24.90
22.09
Investment TrackingPlanned Investment Indicates Future Pipeline
13
0
5
10
15
2013 (1H) 2014 2015
RealisedRM (bil)
44.2%
9.54
Source: PEMANDU, data provisional only and subject to revision
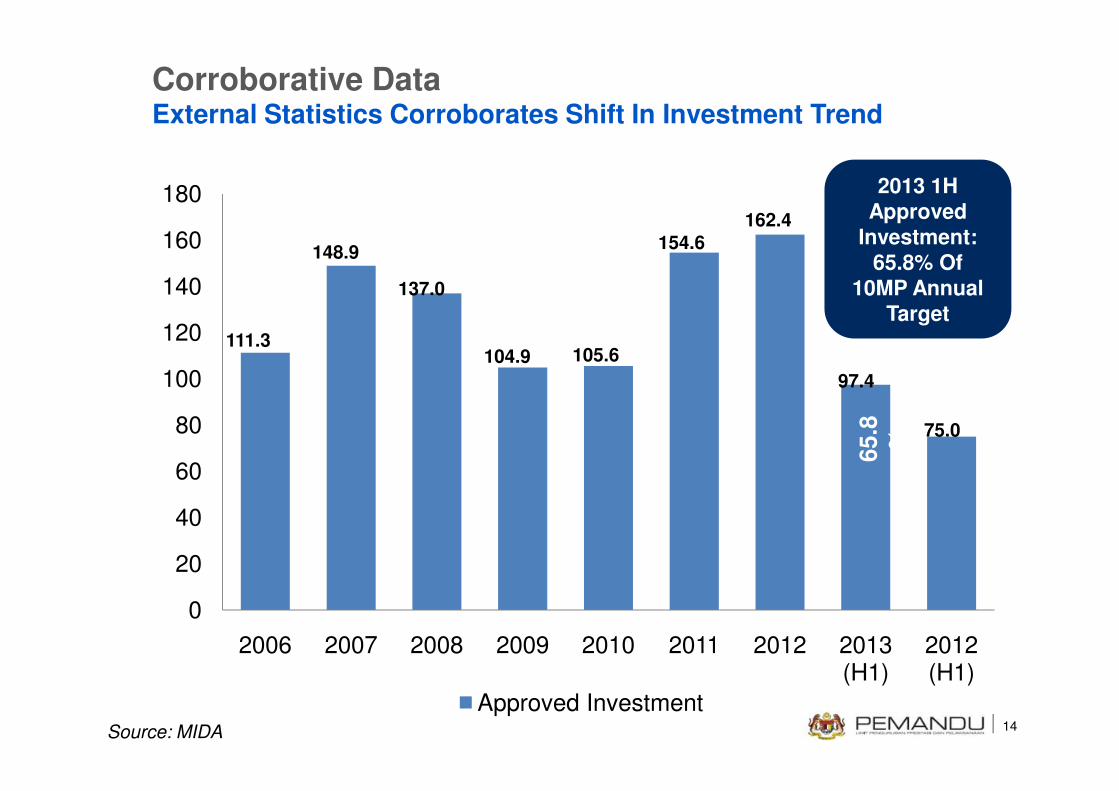
Corroborative DataExternal Statistics Corroborates Shift In Investment Trend
100
120
140
160
180
111.3
148.9
137.0
104.9 105.6
154.6
162.4
97.4
2013 1H Approved
Investment: 65.8% Of
10MP Annual Target
14
0
20
40
60
80
2006 2007 2008 2009 2010 2011 2012 2013 (H1)
2012 (H1)
Approved InvestmentSource: MIDA
75.0
65.8
%
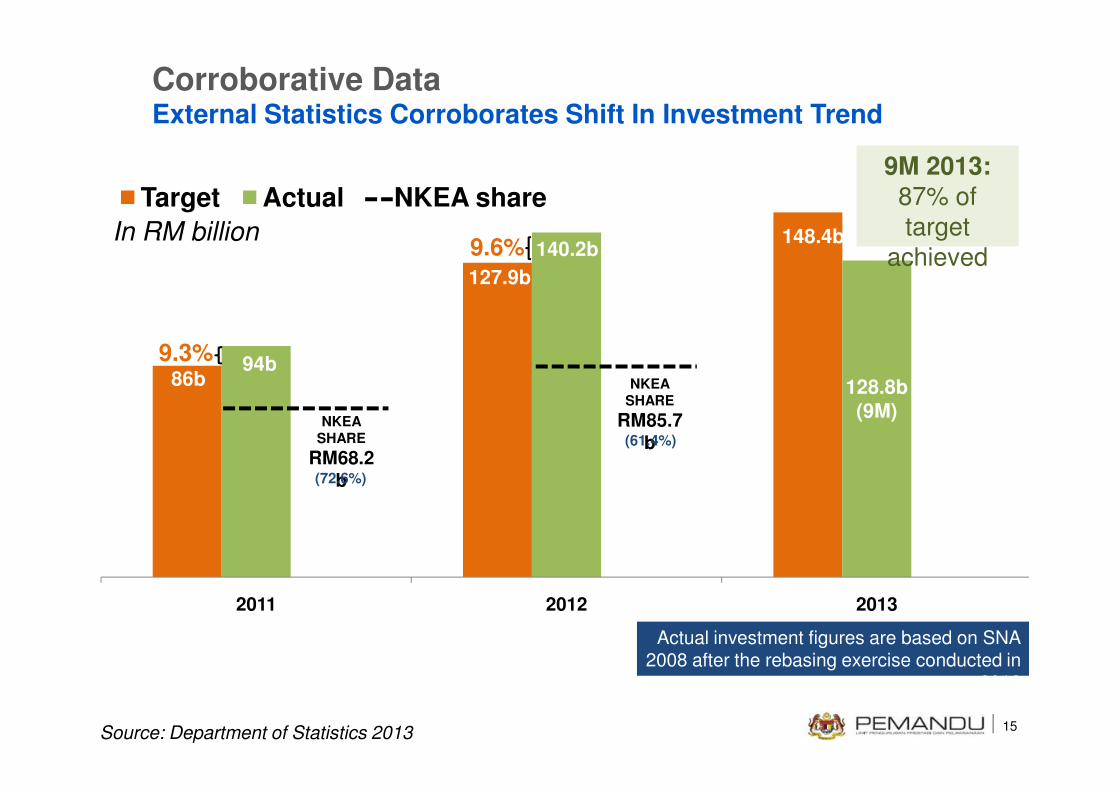
Target Actual NKEA share
In RM billion
9.3%86b
94b
140.2b
127.9b
128.8b
148.4b9.6%
9M 2013: 87% of
target
achieved
NKEASHARE
Corroborative DataExternal Statistics Corroborates Shift In Investment Trend
15
2011 2012 2013
128.8b (9M)
Source: Department of Statistics 2013
Actual investment figures are based on SNA 2008 after the rebasing exercise conducted in
2012
NKEASHARE
RM68.2b
SHARE
RM85.7b
(72.6%)
(61.4%)
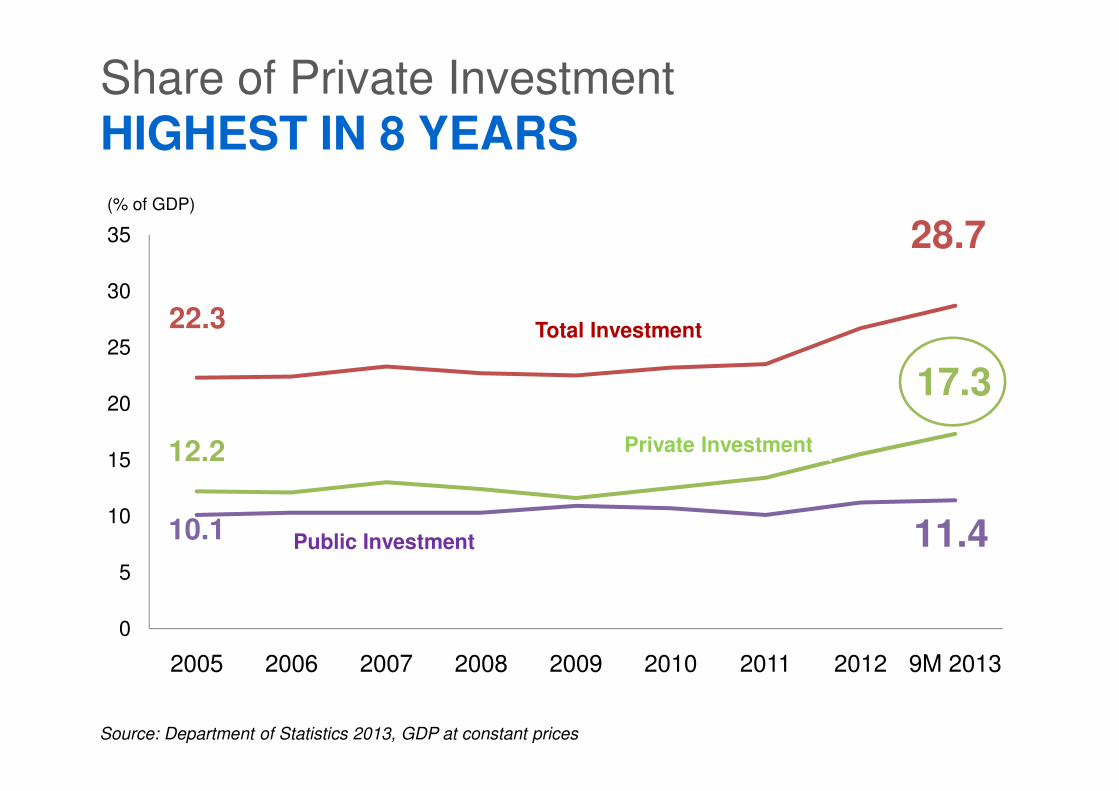
20
25
30
35
17.3
22.3
28.7(% of GDP)
Total Investment
Share of Private Investment HIGHEST IN 8 YEARS
0
5
10
15
20
2005 2006 2007 2008 2009 2010 2011 2012 9M 2013
17.3
12.2
10.1 11.4
Source: Department of Statistics 2013, GDP at constant prices
Private Investment
Public Investment
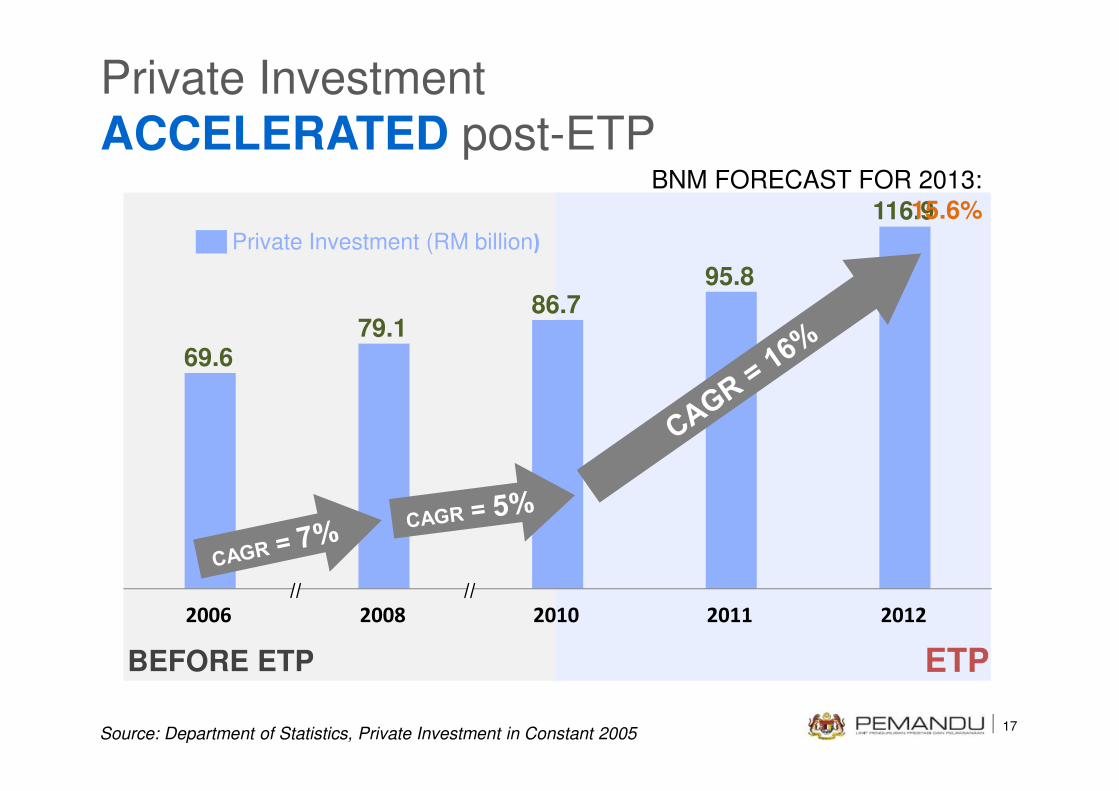
116.9
95.8
69.6
86.779.1
Private Investment (RM billion)
BNM FORECAST FOR 2013:
15.6%
Private Investment ACCELERATED post-ETP
17
2012201120102006 2008
ETP
Source: Department of Statistics, Private Investment in Constant 2005
Prices
BEFORE ETP
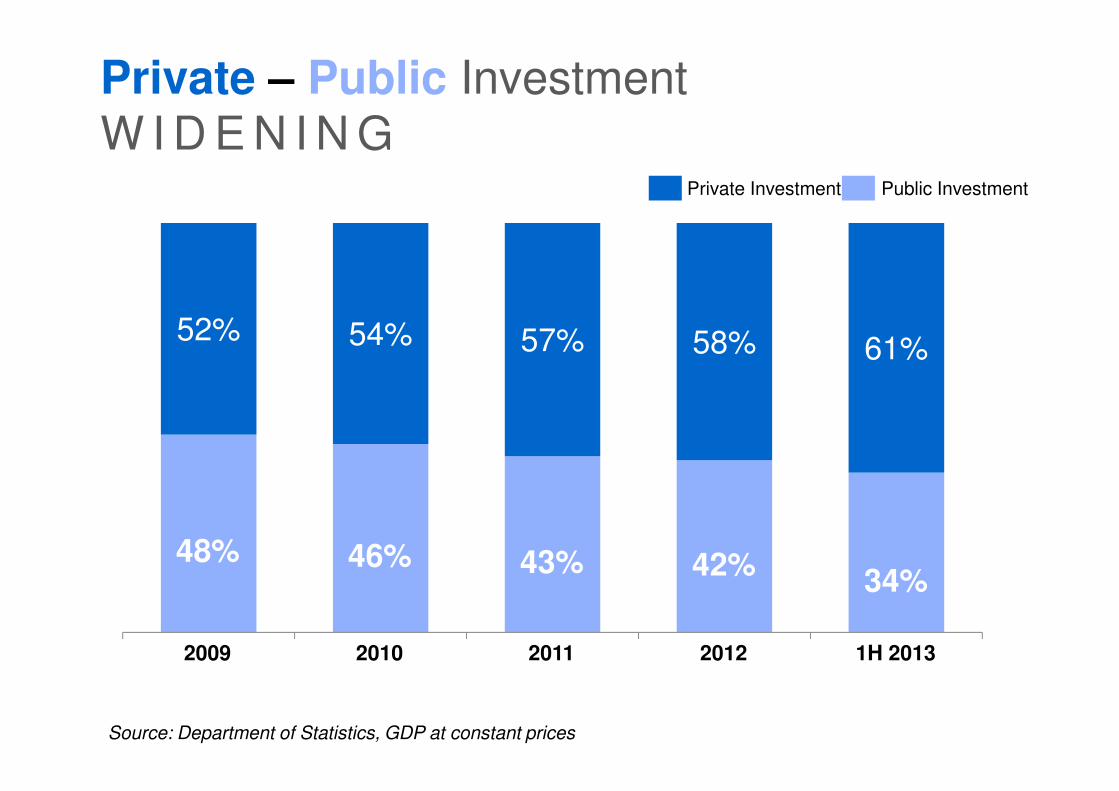
52% 54% 57% 58% 61%
Private Investment Public Investment
Private – Public InvestmentW I D E N I N G
Source: Department of Statistics, GDP at constant prices
42%43%34%
46%48%
1H 201320122009 20112010
THANK YOUTHANK YOUVisit us at www. pemandu.gov.my
Widen the discourse, follow us on Twitter
@etp_roadmap | @gtp_roadmap