Embed Size (px)
Citation preview
ECONOMIC SURVEY OF SINGAPORE2005
Published byMinistry of Trade and IndustryRepublic of SingaporeFebruary 2006
ISSN 0376–8791
Published February 2006
Ministry of Trade and IndustrySingapore
website: http://www.mti.gov.sgemail: [email protected]
All rights reserved. No part of thispublication may be reproduced, storedin a retrieval system or transmitted inany form or by any means, electronic,mechanised, photocopying, recordingor otherwise, without the prior permissionof the copyright holder.
Printed by SNP Security Printing Pte Ltd
CONTENTS
Economic Survey of Singapore 2005
Chapter 1The World Economy 5
Chapter 2Output, Expenditure and National Income 16
Chapter 3Employment, Wages and Productivity 24
Chapter 4Prices 34
Chapter 5Macroeconomic Policies 38
Chapter 6External Trade 48
Chapter 7Balance Of Payments 58
Chapter 8Economic Outlook 61
Chapter 9Manufacturing 65
Chapter 10Construction 77
Chapter 11Wholesale & Retail Trade and Hotels & Restaurants 81
Chapter 12Transport and Communications 85
Chapter 13Financial and Business Services 92
Feature ArticleLearning and Productivity Performance in Singapore
Manufacturing Industries 103
Statistical Appendix 111
Editorial Committee 195
Statistical and Administrative Support 196
1 The World Economy 5
1.1 GDP Growth 5
1.2 GDP Growth 6
1.3 Private Investment Growth 6
1.4 Private Consumption Growth 7
1.5 Inflation 8
1.6 Interest Rate 8
1.7 GDP Growth 9
1.8 Export Growth 9
1.9 Inflation 10
1.10 GDP Growth 12
1.11 Private Consumption Expenditure Growth 13
1.12 Gross Fixed Capital Formation Growth 13
1.13 Export Growth 14
1.14 Inflation 14
2 Output, Expenditure and National Income 16
2.1 Gross Domestic Product at Market Prices 16
2.2 Changes in Gross Domestic Product at Market Prices 16
2.3 Changes in Real GDP by Industry 17
2.4 Changes in Total Demand at 2000 Market Prices 20
2.5 Singapore’s Earnings from External Economy as Proportion ofTotal Income 22
3 Employment, Wages and Productivity 243.1 Changes in Total Employment 24
3.2 Changes in Employment by Industry 25
3.3 Unemployment Rate 26
3.4 Retrenchment 27
3.5 Changes in Labour Productivity by Industry 28
3.6 Changes in Real Average Monthly Earnings and Productivity 29
3.7 Wage Share in Nominal GDP 29
3.8 Unit Business Cost Index of Manufacturing 29
3.9 Singapore’s Relative Unit Labour Cost in ManufacturingAgainst Selected 16 Economies 30
CHARTS IN TEXT
4 Prices 34
4.1 Sources of Inflation 34
4.2 Changes in Consumer Price Index 35
4.3 Changes in Domestic Supply Price Index 36
4.4 Changes in Price Indices 36
5 Macroeconomic Policies 38
5.1 Government Operating Revenue as a Percentage of GDP 38
5.2 Government Operation Revenue, 2005 39
5.3 Government Expenditure as a Percentage of GDP 40
5.4 Government Expenditure, 2005 40
5.5 Movement of Singapore Dollar Against Major Currencies 43
5.6 Selected Interest Rates 44
5.7 Annual Growth Rates of Money Supply 44
6 External Trade 48
6.1 External Trade 48
6.2 Exports 48
6.3 Domestic Exports 49
6.4 Singapore’s Major Export Markets 50
7 Balance of Payments 58
7.1 Balance of Payments 58
7.2 Other Investment Flows 60
8 Economic Outlook 61
8.1 Gross Domestic Product and Composite Leading Index 61
8.2 General Business Situation of the Manufacturing Sector for theNext Six Months 61
8.3 General Business Expectations of the Services Sectors for theNext Six Months 63
9 Manufacturing 65
9.1 Quarterly Index of Industrial Production 65
9.2 Changes in Index of Industrial Production 66
9.3 Key Indicators in the Manufacturing Sector 68
9.4 Private Sector R&D Expenditure 70
9.5 Distribution of R&D Expenditure in the Manufacturing Industries in2004 70
9.6 Distribution of R&D Expenditure in the Services Industries in 2004 70
9.7 Local Establishments in Manufacturing and Services, 2003 71
9.8 SMEs’ Share of Manufacturing and Services 72
CHARTS IN TEXT (CONT’D)
10 Construction 77
10.1 Contracts Awarded 77
11 Wholesale & Retail Trade and Hotels & Restaurants 81
11.1 Changes in Retail Sales Index at Constant Prices 81
11.2 Average Occupancy Rate of Gazetted Hotels 82
11.3 Average Hotel Room Rate 83
11.4 Visitor Arrivals 83
12 Transport and Communications 85
12.1 Air Cargo Handled 86
12.2 Sea Cargo Handled 86
12.3 Motor Vehicles Registered 88
13 Financial and Business Services 92
13.1 Changes in Bank Loans and Advances by Sector 93
CHARTS IN TEXT (CONT’D)
TABLES IN TEXT
2 Output, Expenditure and National Income 16
2.1 Gross Domestic Product at 2000 Market Prices 18
2.2 Percentage Contribution to Growth in Real GDP 19
2.3 Annual Changes and Contribution to Growth in Total Demand at2000 Market Prices 20
2.4 Annual Changes in Gross Fixed Capital Formation at 2000 MarketPrices 21
2.5 Percentage Distribution of Gross Fixed Capital Formation atCurrent Market Prices 21
4 Prices 34
4.1 Measures of Inflation 34
4.2 Changes in Gross Domestic Product Deflator 37
5 Macroeconomic Policies 38
5.1 Government Operating Expenditure 41
5.2 Government Development Expenditure 42
7 Balance of Payments 58
7.1 Balance of Payments 59
9 Manufacturing 65
9.1 Manufacturing 67
9.2 Manufacturing Investment Commitments by Cluster, 2005 68
9.3 Researchers 69
9.4 Performance of Portfolio Companies under PLE Investmentsas at December 2005 71
10 Construction 77
10.1 Contracts Awarded 77
10.2 Projected Construction Demand in 2006 80
11 Wholesale & Retail Trade and Hotels & Restaurants 81
11.1 Wholesale & Retail Trade, and Hotels & Restaurants Sectors 81
11.2 Top Ten Visitor Generating Markets, 2005 84
12 Transport and Communications 85
12.1 Transport and Communications 85
13 Financial and Business Services 92
13.1 Financial & Business Services Sectors 92
13.2 Assets and Liabilities of Financial Institutions 94
13.3 Services Investment Commitments by Cluster, 2005 99

ECONOMIC SURVEY OF SINGAPORE 2005
1
MAIN INDICATORS
2002 2003 2004 2005
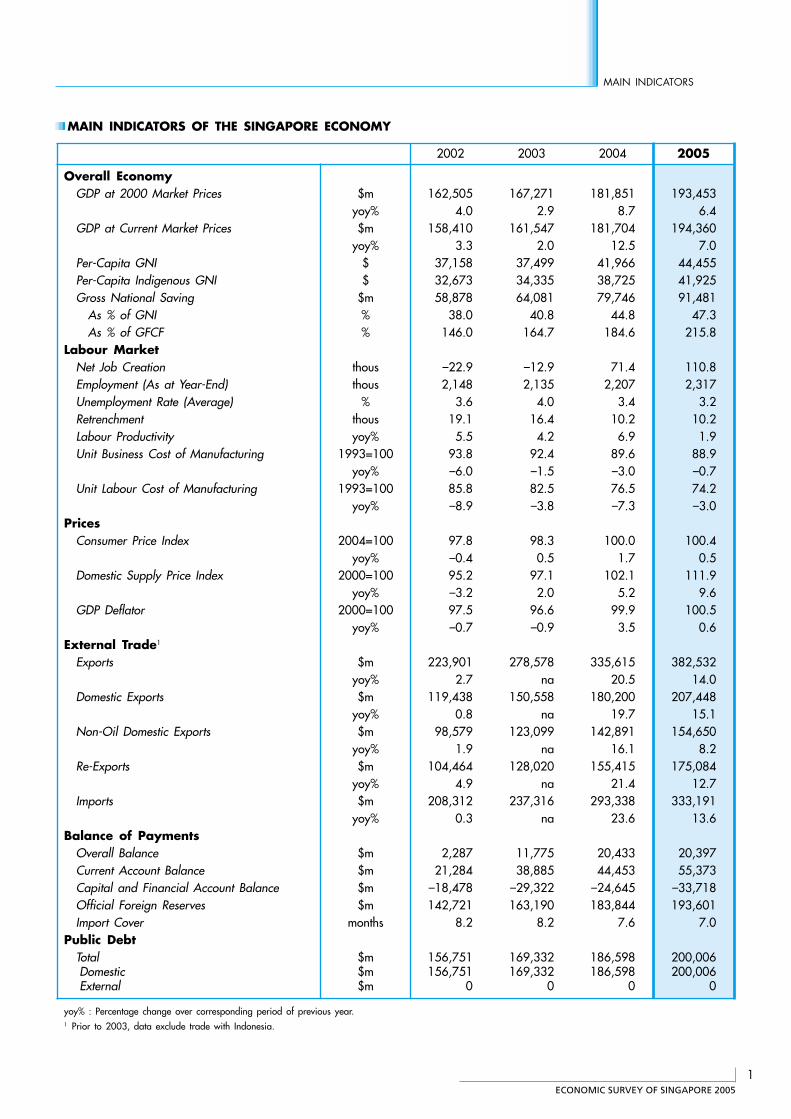
Overall EconomyGDP at 2000 Market Prices $m 162,505 167,271 181,851 193,453
yoy% 4.0 2.9 8.7 6.4GDP at Current Market Prices $m 158,410 161,547 181,704 194,360
yoy% 3.3 2.0 12.5 7.0Per-Capita GNI $ 37,158 37,499 41,966 44,455Per-Capita Indigenous GNI $ 32,673 34,335 38,725 41,925Gross National Saving $m 58,878 64,081 79,746 91,481
As % of GNI % 38.0 40.8 44.8 47.3As % of GFCF % 146.0 164.7 184.6 215.8
Labour MarketNet Job Creation thous –22.9 –12.9 71.4 110.8Employment (As at Year-End) thous 2,148 2,135 2,207 2,317Unemployment Rate (Average) % 3.6 4.0 3.4 3.2Retrenchment thous 19.1 16.4 10.2 10.2Labour Productivity yoy% 5.5 4.2 6.9 1.9Unit Business Cost of Manufacturing 1993=100 93.8 92.4 89.6 88.9
yoy% –6.0 –1.5 –3.0 –0.7Unit Labour Cost of Manufacturing 1993=100 85.8 82.5 76.5 74.2
yoy% –8.9 –3.8 –7.3 –3.0Prices
Consumer Price Index 2004=100 97.8 98.3 100.0 100.4yoy% –0.4 0.5 1.7 0.5
Domestic Supply Price Index 2000=100 95.2 97.1 102.1 111.9yoy% –3.2 2.0 5.2 9.6
GDP Deflator 2000=100 97.5 96.6 99.9 100.5yoy% –0.7 –0.9 3.5 0.6
External Trade1
Exports $m 223,901 278,578 335,615 382,532yoy% 2.7 na 20.5 14.0
Domestic Exports $m 119,438 150,558 180,200 207,448yoy% 0.8 na 19.7 15.1
Non-Oil Domestic Exports $m 98,579 123,099 142,891 154,650yoy% 1.9 na 16.1 8.2
Re-Exports $m 104,464 128,020 155,415 175,084yoy% 4.9 na 21.4 12.7
Imports $m 208,312 237,316 293,338 333,191yoy% 0.3 na 23.6 13.6
Balance of PaymentsOverall Balance $m 2,287 11,775 20,433 20,397Current Account Balance $m 21,284 38,885 44,453 55,373Capital and Financial Account Balance $m –18,478 –29,322 –24,645 –33,718Official Foreign Reserves $m 142,721 163,190 183,844 193,601Import Cover months 8.2 8.2 7.6 7.0
Public DebtTotal $m 156,751 169,332 186,598 200,006
Domestic $m 156,751 169,332 186,598 200,006 External $m 0 0 0 0
yoy% : Percentage change over corresponding period of previous year.1 Prior to 2003, data exclude trade with Indonesia.
MAIN INDICATORS OF THE SINGAPORE ECONOMY
ECONOMIC SURVEY OF SINGAPORE 2005
2
MAIN INDICATORS
MAIN INDICATORS OF THE SINGAPORE ECONOMY (CONT’D)
2002 2003 2004 2005
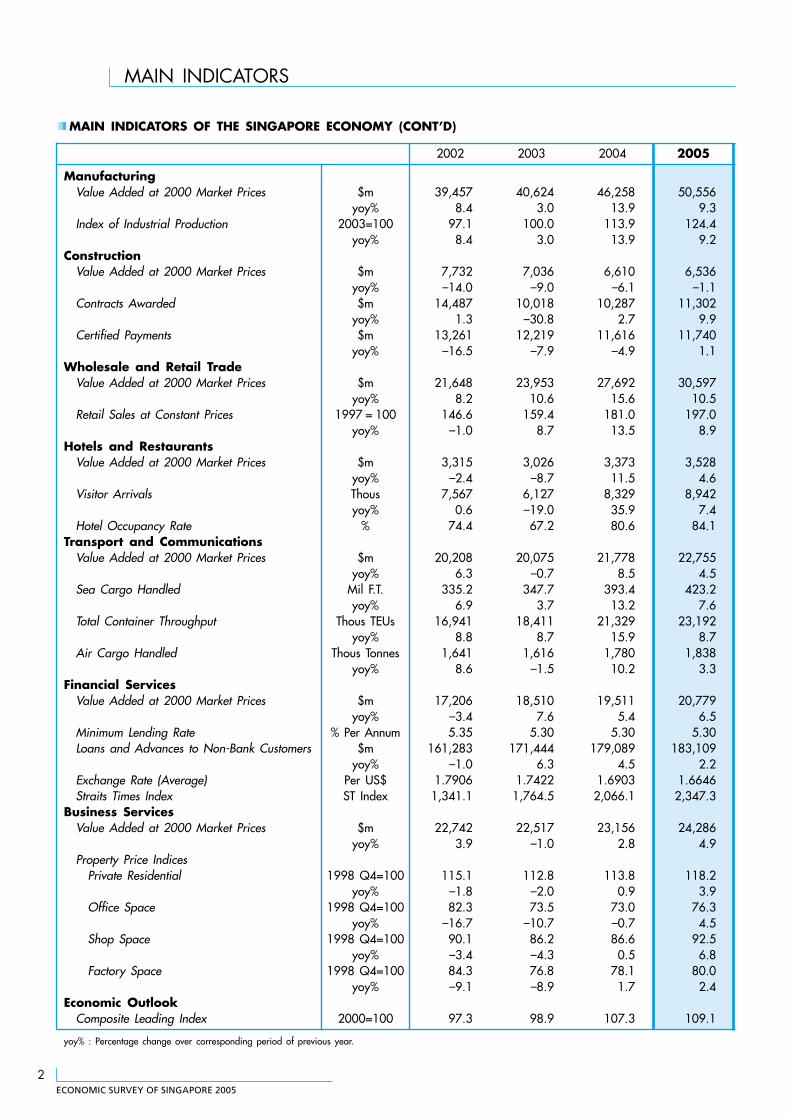
ManufacturingValue Added at 2000 Market Prices $m 39,457 40,624 46,258 50,556
yoy% 8.4 3.0 13.9 9.3Index of Industrial Production 2003=100 97.1 100.0 113.9 124.4
yoy% 8.4 3.0 13.9 9.2Construction
Value Added at 2000 Market Prices $m 7,732 7,036 6,610 6,536yoy% –14.0 –9.0 –6.1 –1.1
Contracts Awarded $m 14,487 10,018 10,287 11,302yoy% 1.3 –30.8 2.7 9.9
Certified Payments $m 13,261 12,219 11,616 11,740yoy% –16.5 –7.9 –4.9 1.1
Wholesale and Retail TradeValue Added at 2000 Market Prices $m 21,648 23,953 27,692 30,597
yoy% 8.2 10.6 15.6 10.5Retail Sales at Constant Prices 1997 = 100 146.6 159.4 181.0 197.0
yoy% –1.0 8.7 13.5 8.9Hotels and Restaurants
Value Added at 2000 Market Prices $m 3,315 3,026 3,373 3,528yoy% –2.4 –8.7 11.5 4.6
Visitor Arrivals Thous 7,567 6,127 8,329 8,942yoy% 0.6 –19.0 35.9 7.4
Hotel Occupancy Rate % 74.4 67.2 80.6 84.1Transport and Communications
Value Added at 2000 Market Prices $m 20,208 20,075 21,778 22,755yoy% 6.3 –0.7 8.5 4.5
Sea Cargo Handled Mil F.T. 335.2 347.7 393.4 423.2yoy% 6.9 3.7 13.2 7.6
Total Container Throughput Thous TEUs 16,941 18,411 21,329 23,192yoy% 8.8 8.7 15.9 8.7
Air Cargo Handled Thous Tonnes 1,641 1,616 1,780 1,838yoy% 8.6 –1.5 10.2 3.3
Financial ServicesValue Added at 2000 Market Prices $m 17,206 18,510 19,511 20,779
yoy% –3.4 7.6 5.4 6.5Minimum Lending Rate % Per Annum 5.35 5.30 5.30 5.30Loans and Advances to Non-Bank Customers $m 161,283 171,444 179,089 183,109
yoy% –1.0 6.3 4.5 2.2Exchange Rate (Average) Per US$ 1.7906 1.7422 1.6903 1.6646Straits Times Index ST Index 1,341.1 1,764.5 2,066.1 2,347.3
Business ServicesValue Added at 2000 Market Prices $m 22,742 22,517 23,156 24,286
yoy% 3.9 –1.0 2.8 4.9Property Price Indices
Private Residential 1998 Q4=100 115.1 112.8 113.8 118.2yoy% –1.8 –2.0 0.9 3.9
Office Space 1998 Q4=100 82.3 73.5 73.0 76.3yoy% –16.7 –10.7 –0.7 4.5
Shop Space 1998 Q4=100 90.1 86.2 86.6 92.5yoy% –3.4 –4.3 0.5 6.8
Factory Space 1998 Q4=100 84.3 76.8 78.1 80.0yoy% –9.1 –8.9 1.7 2.4
Economic OutlookComposite Leading Index 2000=100 97.3 98.9 107.3 109.1
yoy% : Percentage change over corresponding period of previous year.
ECONOMIC SURVEY OF SINGAPORE 2005
3
MAIN INDICATORS
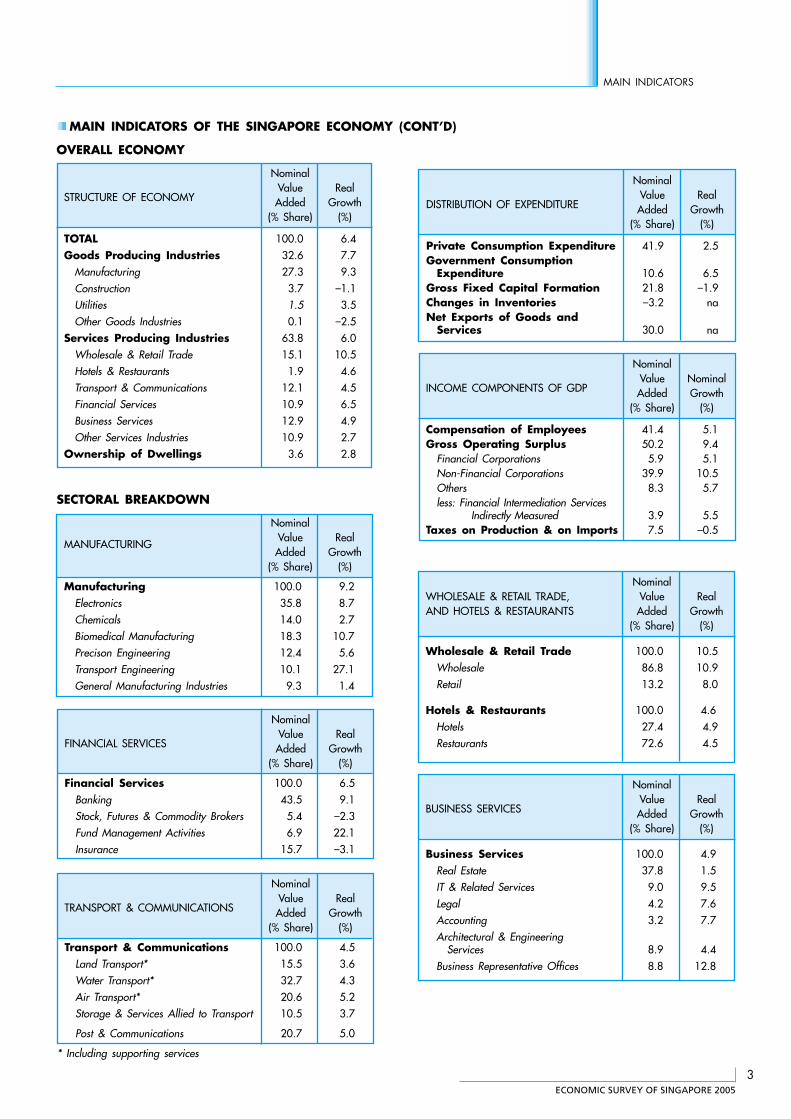
MAIN INDICATORS OF THE SINGAPORE ECONOMY (CONT’D)
OVERALL ECONOMY
Nominal
STRUCTURE OF ECONOMYValue RealAdded Growth
(% Share) (%)
TOTAL 100.0 6.4Goods Producing Industries 32.6 7.7
Manufacturing 27.3 9.3Construction 3.7 –1.1Utilities 1.5 3.5Other Goods Industries 0.1 –2.5
Services Producing Industries 63.8 6.0Wholesale & Retail Trade 15.1 10.5Hotels & Restaurants 1.9 4.6Transport & Communications 12.1 4.5Financial Services 10.9 6.5Business Services 12.9 4.9Other Services Industries 10.9 2.7
Ownership of Dwellings 3.6 2.8
Nominal
DISTRIBUTION OF EXPENDITUREValue RealAdded Growth
(% Share) (%)
Private Consumption Expenditure 41.9 2.5Government Consumption
Expenditure 10.6 6.5Gross Fixed Capital Formation 21.8 –1.9Changes in Inventories –3.2 naNet Exports of Goods and
Services 30.0 na
SECTORAL BREAKDOWN
Nominal
MANUFACTURINGValue RealAdded Growth
(% Share) (%)
Manufacturing 100.0 9.2Electronics 35.8 8.7Chemicals 14.0 2.7Biomedical Manufacturing 18.3 10.7Precison Engineering 12.4 5.6Transport Engineering 10.1 27.1General Manufacturing Industries 9.3 1.4
Nominal
INCOME COMPONENTS OF GDPValue NominalAdded Growth
(% Share) (%)
Compensation of Employees 41.4 5.1Gross Operating Surplus 50.2 9.4
Financial Corporations 5.9 5.1Non-Financial Corporations 39.9 10.5Others 8.3 5.7less: Financial Intermediation Services
Indirectly Measured 3.9 5.5Taxes on Production & on Imports 7.5 –0.5
Nominal
BUSINESS SERVICESValue RealAdded Growth
(% Share) (%)
Business Services 100.0 4.9Real Estate 37.8 1.5IT & Related Services 9.0 9.5Legal 4.2 7.6Accounting 3.2 7.7Architectural & Engineering
Services 8.9 4.4Business Representative Offices 8.8 12.8
Nominal
FINANCIAL SERVICESValue RealAdded Growth
(% Share) (%)
Financial Services 100.0 6.5Banking 43.5 9.1Stock, Futures & Commodity Brokers 5.4 –2.3Fund Management Activities 6.9 22.1Insurance 15.7 –3.1
Nominal
TRANSPORT & COMMUNICATIONSValue RealAdded Growth
(% Share) (%)
Transport & Communications 100.0 4.5Land Transport* 15.5 3.6Water Transport* 32.7 4.3Air Transport* 20.6 5.2Storage & Services Allied to Transport 10.5 3.7
Post & Communications 20.7 5.0
* Including supporting services
NominalWHOLESALE & RETAIL TRADE, Value RealAND HOTELS & RESTAURANTS Added Growth
(% Share) (%)
Wholesale & Retail Trade 100.0 10.5Wholesale 86.8 10.9Retail 13.2 8.0
Hotels & Restaurants 100.0 4.6Hotels 27.4 4.9Restaurants 72.6 4.5
ECONOMIC SURVEY OF SINGAPORE 2005
4
MAIN INDICATORS
INVESTMENT COMMITMENTS IN MANUFACTURING
INVESTMENT COMMITMENTS$ %
Million Share
Electronics 4,354 51.1Chemicals 1,980 23.2Biomedical Manufacturing 860 10.1Precision Engineering 418 4.9Transport Engineering 598 7.0General Manufacturing Industries 310 3.6
Foreign 6,387 75.0Local 2,132 25.0
Total 8,519 100.0
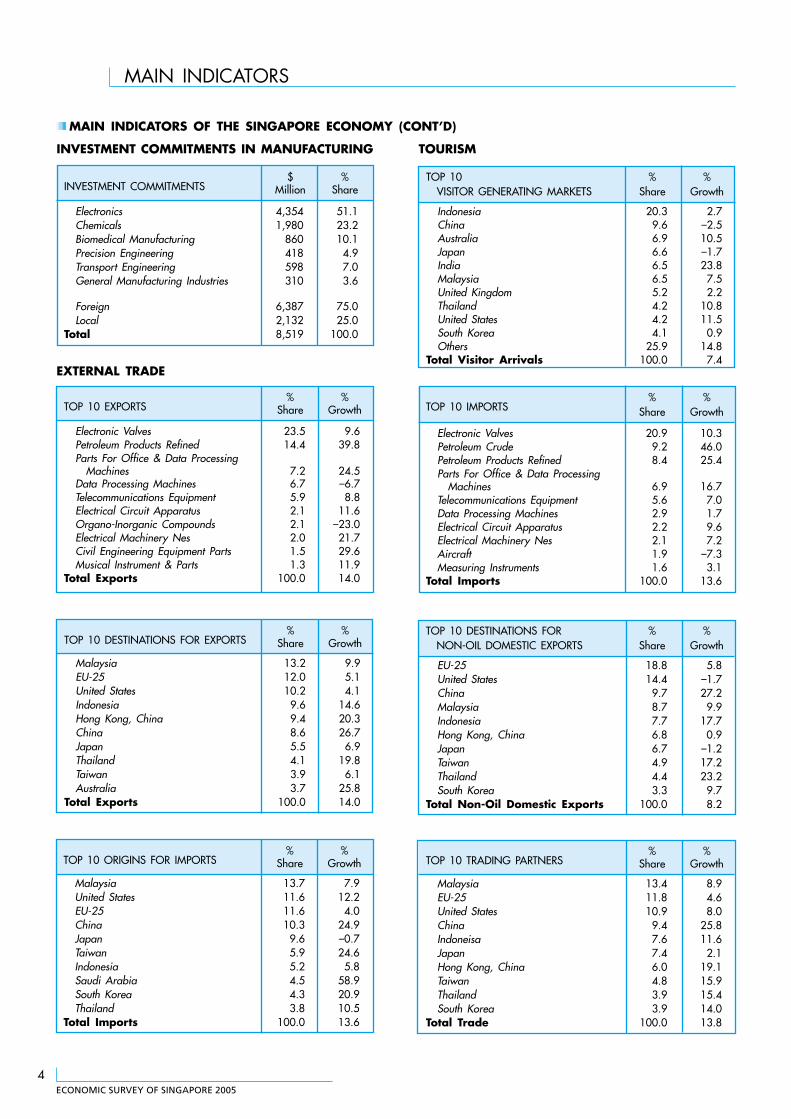
MAIN INDICATORS OF THE SINGAPORE ECONOMY (CONT’D)
EXTERNAL TRADE
TOP 10 EXPORTS% %
Share Growth
Electronic Valves 23.5 9.6Petroleum Products Refined 14.4 39.8Parts For Office & Data Processing
Machines 7.2 24.5Data Processing Machines 6.7 –6.7Telecommunications Equipment 5.9 8.8Electrical Circuit Apparatus 2.1 11.6Organo-Inorganic Compounds 2.1 –23.0Electrical Machinery Nes 2.0 21.7Civil Engineering Equipment Parts 1.5 29.6Musical Instrument & Parts 1.3 11.9
Total Exports 100.0 14.0
TOP 10 DESTINATIONS FOR EXPORTS% %
Share Growth
Malaysia 13.2 9.9EU-25 12.0 5.1United States 10.2 4.1Indonesia 9.6 14.6Hong Kong, China 9.4 20.3China 8.6 26.7Japan 5.5 6.9Thailand 4.1 19.8Taiwan 3.9 6.1Australia 3.7 25.8
Total Exports 100.0 14.0
TOP 10 ORIGINS FOR IMPORTS% %
Share Growth
Malaysia 13.7 7.9United States 11.6 12.2EU-25 11.6 4.0China 10.3 24.9Japan 9.6 –0.7Taiwan 5.9 24.6Indonesia 5.2 5.8Saudi Arabia 4.5 58.9South Korea 4.3 20.9Thailand 3.8 10.5
Total Imports 100.0 13.6
TOP 10 IMPORTS% %
Share Growth
Electronic Valves 20.9 10.3Petroleum Crude 9.2 46.0Petroleum Products Refined 8.4 25.4Parts For Office & Data Processing
Machines 6.9 16.7Telecommunications Equipment 5.6 7.0Data Processing Machines 2.9 1.7Electrical Circuit Apparatus 2.2 9.6Electrical Machinery Nes 2.1 7.2Aircraft 1.9 –7.3Measuring Instruments 1.6 3.1
Total Imports 100.0 13.6
TOP 10 DESTINATIONS FOR % %NON-OIL DOMESTIC EXPORTS Share Growth
EU-25 18.8 5.8United States 14.4 –1.7China 9.7 27.2Malaysia 8.7 9.9Indonesia 7.7 17.7Hong Kong, China 6.8 0.9Japan 6.7 –1.2Taiwan 4.9 17.2Thailand 4.4 23.2South Korea 3.3 9.7
Total Non-Oil Domestic Exports 100.0 8.2
TOP 10 TRADING PARTNERS% %
Share Growth
Malaysia 13.4 8.9EU-25 11.8 4.6United States 10.9 8.0China 9.4 25.8Indoneisa 7.6 11.6Japan 7.4 2.1Hong Kong, China 6.0 19.1Taiwan 4.8 15.9Thailand 3.9 15.4South Korea 3.9 14.0
Total Trade 100.0 13.8
TOURISM
TOP 10 % %VISITOR GENERATING MARKETS Share Growth
Indonesia 20.3 2.7China 9.6 –2.5Australia 6.9 10.5Japan 6.6 –1.7India 6.5 23.8Malaysia 6.5 7.5United Kingdom 5.2 2.2Thailand 4.2 10.8United States 4.2 11.5South Korea 4.1 0.9Others 25.9 14.8
Total Visitor Arrivals 100.0 7.4
ECONOMIC SURVEY OF SINGAPORE 2005
5
THE WORLD ECONOMY
THE WORLDECONOMY1
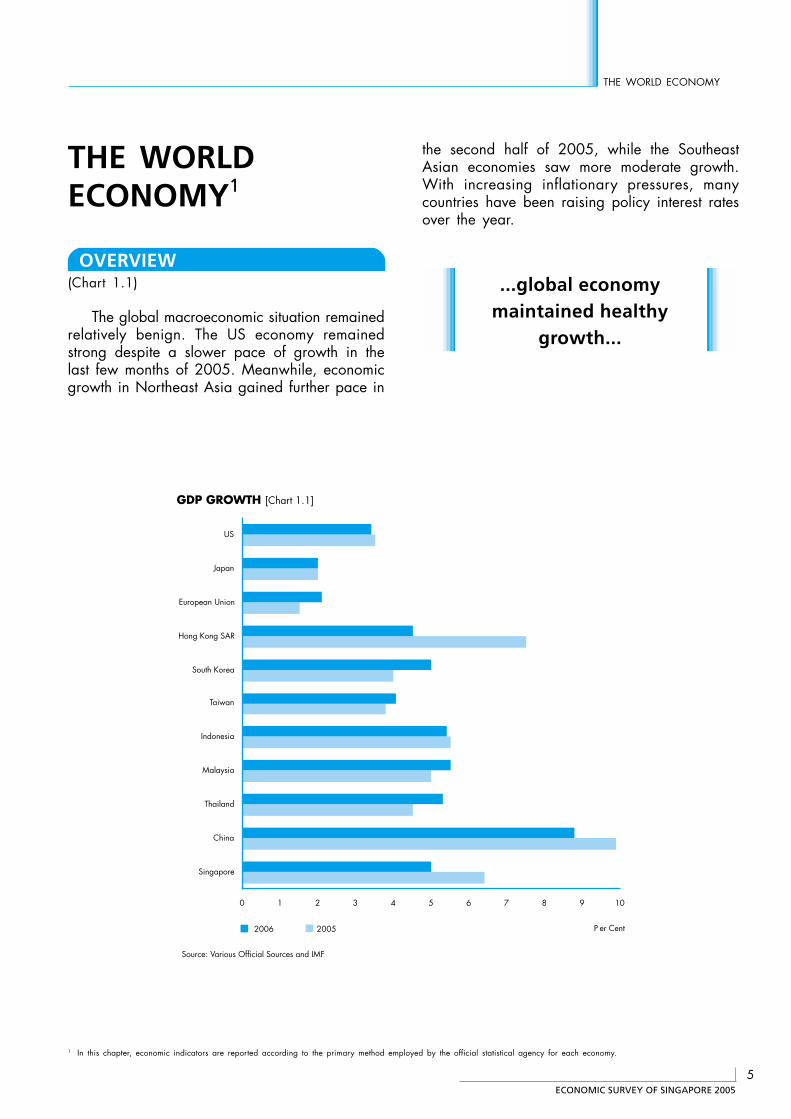
OVERVIEW(Chart 1.1)
The global macroeconomic situation remainedrelatively benign. The US economy remainedstrong despite a slower pace of growth in thelast few months of 2005. Meanwhile, economicgrowth in Northeast Asia gained further pace in
the second half of 2005, while the SoutheastAsian economies saw more moderate growth.With increasing inflationary pressures, manycountries have been raising policy interest ratesover the year.
GDP GROWTH [Chart 1.1]
0 1 2 3 4 5 6 7 8 9 10
Singapore
China
Thailand
Malaysia
Indonesia
Taiwan
South Korea
Hong Kong SAR
European Union
Japan
US
2006 2005 P er Cent
Source: Various Official Sources and IMF
1 In this chapter, economic indicators are reported according to the primary method employed by the official statistical agency for each economy.
...global economymaintained healthy
growth...
ECONOMIC SURVEY OF SINGAPORE 2005
6
Chapter 1
THE WORLD ECONOMY
DEVELOPED ECONOMIES
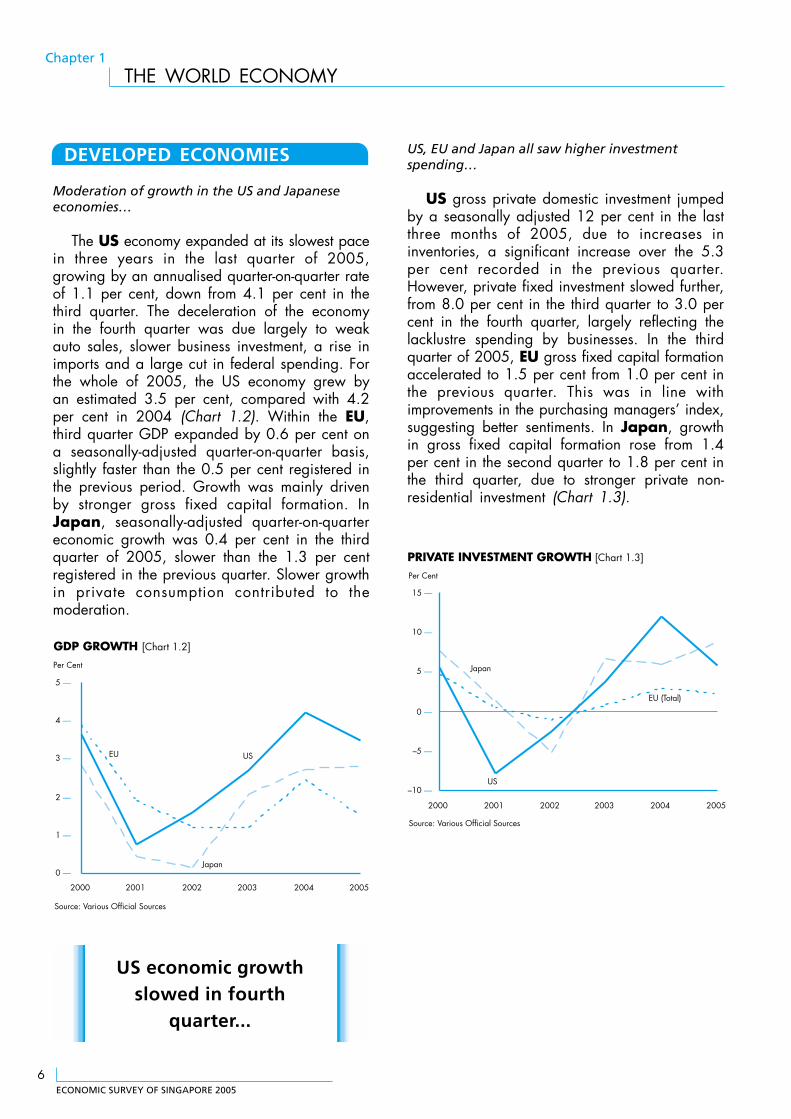
Moderation of growth in the US and Japaneseeconomies…
The US economy expanded at its slowest pacein three years in the last quarter of 2005,growing by an annualised quarter-on-quarter rateof 1.1 per cent, down from 4.1 per cent in thethird quarter. The deceleration of the economyin the fourth quarter was due largely to weakauto sales, slower business investment, a rise inimports and a large cut in federal spending. Forthe whole of 2005, the US economy grew byan estimated 3.5 per cent, compared with 4.2per cent in 2004 (Chart 1.2). Within the EU,third quarter GDP expanded by 0.6 per cent ona seasonally-adjusted quarter-on-quarter basis,slightly faster than the 0.5 per cent registered inthe previous period. Growth was mainly drivenby stronger gross fixed capital formation. InJapan, seasonally-adjusted quarter-on-quartereconomic growth was 0.4 per cent in the thirdquarter of 2005, slower than the 1.3 per centregistered in the previous quarter. Slower growthin private consumption contributed to themoderation.
US, EU and Japan all saw higher investmentspending…
US gross private domestic investment jumpedby a seasonally adjusted 12 per cent in the lastthree months of 2005, due to increases ininventories, a significant increase over the 5.3per cent recorded in the previous quarter.However, private fixed investment slowed further,from 8.0 per cent in the third quarter to 3.0 percent in the fourth quarter, largely reflecting thelacklustre spending by businesses. In the thirdquarter of 2005, EU gross fixed capital formationaccelerated to 1.5 per cent from 1.0 per cent inthe previous quarter. This was in line withimprovements in the purchasing managers’ index,suggesting better sentiments. In Japan, growthin gross fixed capital formation rose from 1.4per cent in the second quarter to 1.8 per cent inthe third quarter, due to stronger private non-residential investment (Chart 1.3).
0 —
1 —
2 —
3 —
4 —
5 —
2000 2001 2002 2003 2004 2005
GDP GROWTH [Chart 1.2]
Per Cent
Source: Various Official Sources
EU
Japan
US
–10 —
0 —
5 —
10 —
15 —
2000 2001 2002 2003 2004 2005
US
Source: Various Official Sources
PRIVATE INVESTMENT GROWTH [Chart 1.3]
Per Cent
EU (Total)
Japan
–5 —
US economic growthslowed in fourth
quarter...
ECONOMIC SURVEY OF SINGAPORE 2005
7
THE WORLD ECONOMY
Slowest pace of US consumer spending sincemid-2001…
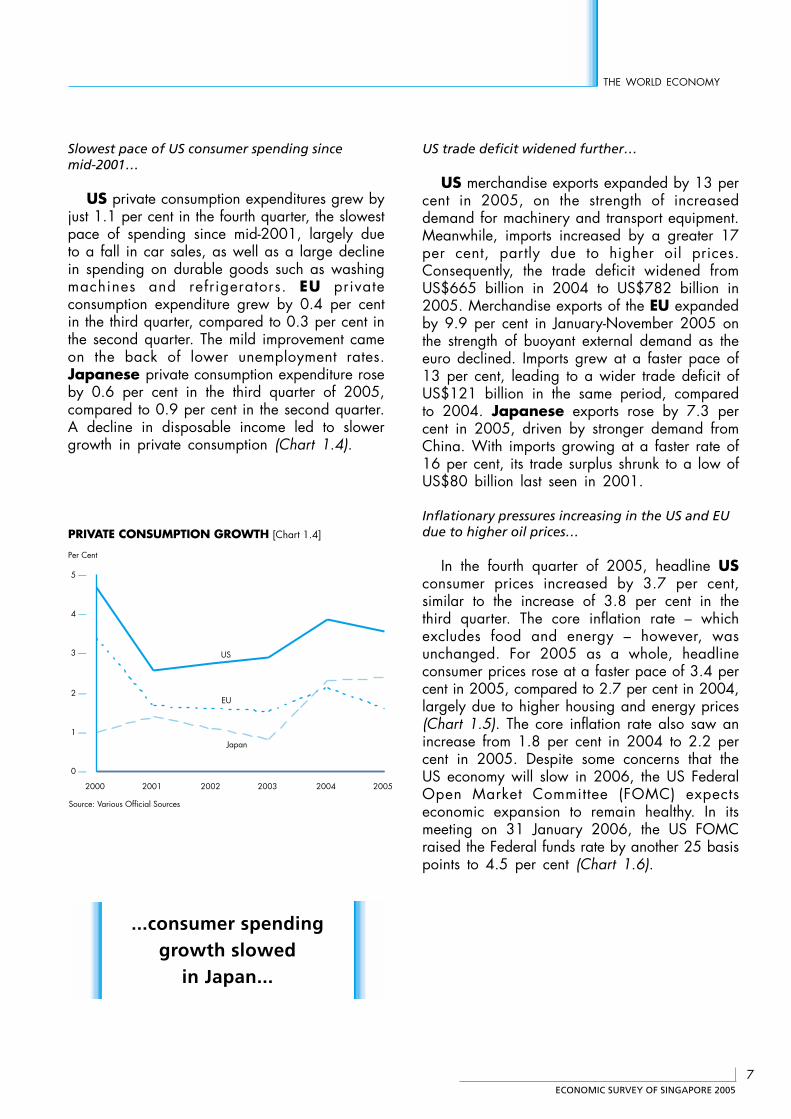
US private consumption expenditures grew byjust 1.1 per cent in the fourth quarter, the slowestpace of spending since mid-2001, largely dueto a fall in car sales, as well as a large declinein spending on durable goods such as washingmachines and refrigerators. EU privateconsumption expenditure grew by 0.4 per centin the third quarter, compared to 0.3 per cent inthe second quarter. The mild improvement cameon the back of lower unemployment rates.Japanese private consumption expenditure roseby 0.6 per cent in the third quarter of 2005,compared to 0.9 per cent in the second quarter.A decline in disposable income led to slowergrowth in private consumption (Chart 1.4).
US trade deficit widened further…
US merchandise exports expanded by 13 percent in 2005, on the strength of increaseddemand for machinery and transport equipment.Meanwhile, imports increased by a greater 17per cent, partly due to higher oil prices.Consequently, the trade deficit widened fromUS$665 billion in 2004 to US$782 billion in2005. Merchandise exports of the EU expandedby 9.9 per cent in January-November 2005 onthe strength of buoyant external demand as theeuro declined. Imports grew at a faster pace of13 per cent, leading to a wider trade deficit ofUS$121 billion in the same period, comparedto 2004. Japanese exports rose by 7.3 percent in 2005, driven by stronger demand fromChina. With imports growing at a faster rate of16 per cent, its trade surplus shrunk to a low ofUS$80 billion last seen in 2001.
Inflationary pressures increasing in the US and EUdue to higher oil prices…
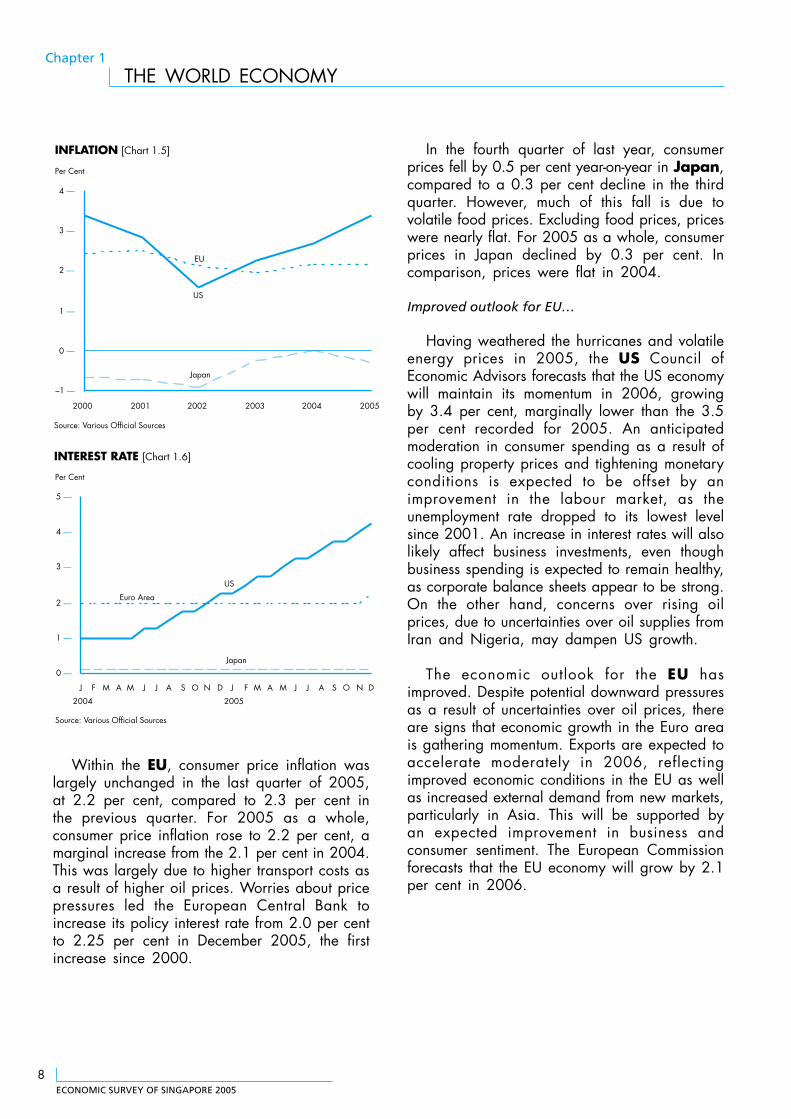
In the fourth quarter of 2005, headline USconsumer prices increased by 3.7 per cent,similar to the increase of 3.8 per cent in thethird quarter. The core inflation rate – whichexcludes food and energy – however, wasunchanged. For 2005 as a whole, headlineconsumer prices rose at a faster pace of 3.4 percent in 2005, compared to 2.7 per cent in 2004,largely due to higher housing and energy prices(Chart 1.5). The core inflation rate also saw anincrease from 1.8 per cent in 2004 to 2.2 percent in 2005. Despite some concerns that theUS economy will slow in 2006, the US FederalOpen Market Committee (FOMC) expectseconomic expansion to remain healthy. In itsmeeting on 31 January 2006, the US FOMCraised the Federal funds rate by another 25 basispoints to 4.5 per cent (Chart 1.6).
0 —
1 —
2 —
3 —
4 —
5 —
2000 2001 2002 2003 2004 2005
EU
US
PRIVATE CONSUMPTION GROWTH [Chart 1.4]
Per Cent
Source: Various Official Sources
Japan
...consumer spendinggrowth slowed
in Japan...
ECONOMIC SURVEY OF SINGAPORE 2005
8
Chapter 1
THE WORLD ECONOMY
Within the EU, consumer price inflation waslargely unchanged in the last quarter of 2005,at 2.2 per cent, compared to 2.3 per cent inthe previous quarter. For 2005 as a whole,consumer price inflation rose to 2.2 per cent, amarginal increase from the 2.1 per cent in 2004.This was largely due to higher transport costs asa result of higher oil prices. Worries about pricepressures led the European Central Bank toincrease its policy interest rate from 2.0 per centto 2.25 per cent in December 2005, the firstincrease since 2000.
In the fourth quarter of last year, consumerprices fell by 0.5 per cent year-on-year in Japan,compared to a 0.3 per cent decline in the thirdquarter. However, much of this fall is due tovolatile food prices. Excluding food prices, priceswere nearly flat. For 2005 as a whole, consumerprices in Japan declined by 0.3 per cent. Incomparison, prices were flat in 2004.
Improved outlook for EU…
Having weathered the hurricanes and volatileenergy prices in 2005, the US Council ofEconomic Advisors forecasts that the US economywill maintain its momentum in 2006, growingby 3.4 per cent, marginally lower than the 3.5per cent recorded for 2005. An anticipatedmoderation in consumer spending as a result ofcooling property prices and tightening monetaryconditions is expected to be offset by animprovement in the labour market, as theunemployment rate dropped to its lowest levelsince 2001. An increase in interest rates will alsolikely affect business investments, even thoughbusiness spending is expected to remain healthy,as corporate balance sheets appear to be strong.On the other hand, concerns over rising oilprices, due to uncertainties over oil supplies fromIran and Nigeria, may dampen US growth.
The economic outlook for the EU hasimproved. Despite potential downward pressuresas a result of uncertainties over oil prices, thereare signs that economic growth in the Euro areais gathering momentum. Exports are expected toaccelerate moderately in 2006, reflectingimproved economic conditions in the EU as wellas increased external demand from new markets,particularly in Asia. This will be supported byan expected improvement in business andconsumer sentiment. The European Commissionforecasts that the EU economy will grow by 2.1per cent in 2006.
–1 —
0 —
1 —
2 —
3 —
4 —
2000 2001 2002 2003 2004 2005
EU
US
INFLATION [Chart 1.5]
Per Cent
Source: Various Official Sources
Japan
0 —
1 —
2 —
3 —
4 —
5 —
J
2004
F M A M J J A S O N D J
2005
F M A M J J A S O N D
Euro Area
US
INTEREST RATE [Chart 1.6]
Per Cent
Source: Various Official Sources
Japan
ECONOMIC SURVEY OF SINGAPORE 2005
9
THE WORLD ECONOMY
Similarly, the economic outlook for Japan isimproving. According to the Bank of Japan’sTankan survey in December 2005, businessconditions are expected to continue improving.The survey also revealed better profit expectationsand a tightening labour market. In line with theseexpectations, industrial production expanded inthe last quarter of 2005, reversing fiveconsecutive quarters of slower growth. Inaddition, the seasonally adjusted consumerconfidence index excluding one person householdhas risen to a record high, since the last peak inJune 1991. For FY2006, the Bank of Japanexpects GDP growth to be between 1.6 and 2.2per cent.
NORTHEAST ASIA
Economic growth picked up in second half of2005…
Economic activity in Northeast Asia gainedfurther pace in the second half of 2005. For theyear as a whole, the region also consolidatedits economic growth following the strong recoveryof 2004.
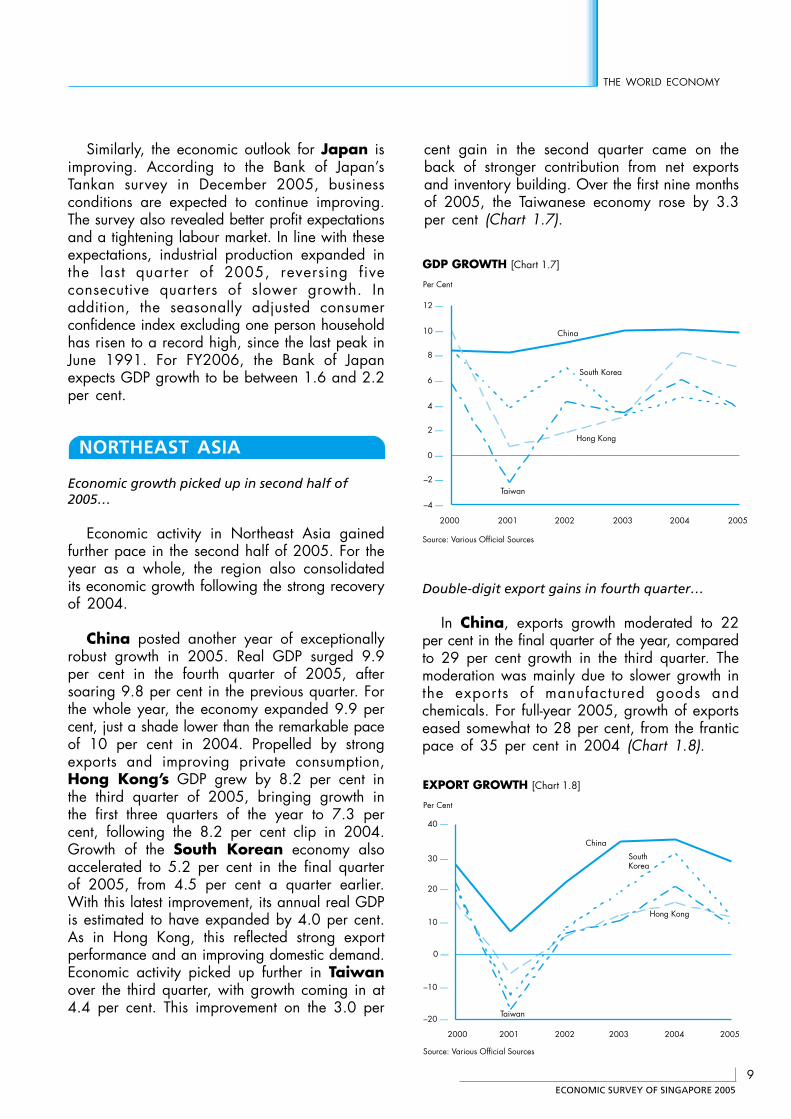
China posted another year of exceptionallyrobust growth in 2005. Real GDP surged 9.9per cent in the fourth quarter of 2005, aftersoaring 9.8 per cent in the previous quarter. Forthe whole year, the economy expanded 9.9 percent, just a shade lower than the remarkable paceof 10 per cent in 2004. Propelled by strongexports and improving private consumption,Hong Kong’s GDP grew by 8.2 per cent inthe third quarter of 2005, bringing growth inthe first three quarters of the year to 7.3 percent, following the 8.2 per cent clip in 2004.Growth of the South Korean economy alsoaccelerated to 5.2 per cent in the final quarterof 2005, from 4.5 per cent a quarter earlier.With this latest improvement, its annual real GDPis estimated to have expanded by 4.0 per cent.As in Hong Kong, this reflected strong exportperformance and an improving domestic demand.Economic activity picked up further in Taiwanover the third quarter, with growth coming in at4.4 per cent. This improvement on the 3.0 per
Double-digit export gains in fourth quarter…
In China, exports growth moderated to 22per cent in the final quarter of the year, comparedto 29 per cent growth in the third quarter. Themoderation was mainly due to slower growth inthe exports of manufactured goods andchemicals. For full-year 2005, growth of exportseased somewhat to 28 per cent, from the franticpace of 35 per cent in 2004 (Chart 1.8).
–4 —
–2 —
0 —
2 —
4 —
6 —
8 —
10 —
12 —
2000 2001 2002 2003 2004 2005
China
GDP GROWTH [Chart 1.7]
Per Cent
Hong Kong
South Korea
Taiwan
Source: Various Official Sources
–20 —
–10 —
0 —
10 —
20 —
30 —
40 —
SouthKorea
Hong Kong
Taiwan
Per Cent
China
EXPORT GROWTH [Chart 1.8]
Source: Various Official Sources
20012000 2002 2003 2004 2005
cent gain in the second quarter came on theback of stronger contribution from net exportsand inventory building. Over the first nine monthsof 2005, the Taiwanese economy rose by 3.3per cent (Chart 1.7).
ECONOMIC SURVEY OF SINGAPORE 2005
10
Chapter 1
THE WORLD ECONOMY
In Hong Kong, growth of domestic exportsimproved to 25 per cent in the final quarter of2005 from 14 per cent in the third quarter,fuelled by a 97 per cent leap in the exports ofelectronics goods. For the whole of 2005,domestic exports expanded 7.9 per cent,compared to 3.6 per cent increase a year ago.On the other hand, in line with the slowdown inChina’s external trade, Hong Kong’s re-exportsgrowth moderated to 9.0 per cent in the fourthquarter from 12 per cent in the third quarter.Full year re-exports growth receded to 12 percent from 17 per cent in 2004.
Taiwan’s exports in the final quarter of 2005rose sharply, compared to the more gradualincrease of the second and third quarters. Exportgrowth in October to December reached 14 percent, following a 7.1 per cent gain in the secondquarter. During this period, increased shipmentsto the mainland and to Hong Kong contributedmost to export growth. For the year as a whole,Taiwanese exports rose by 8.8 per cent afterchalking up a 21 per cent gain a year earlier.
South Korea’s exports increased by 12 percent in the final quarter of 2005, slowing froma 15 per cent gain in the earlier quarter. Thequarter saw lower growth of shipment of industrialinputs –such as metal and chemicals – after along period of double-digit gains. Lower growthof exports to China contributed most to theslowdown although the rate of growth remainedabove 20 per cent. Full year growth of exportsin 2005 remained healthy at 12 per cent,although it slowed from 31 per cent in 2004.
Private consumption continued to grow…
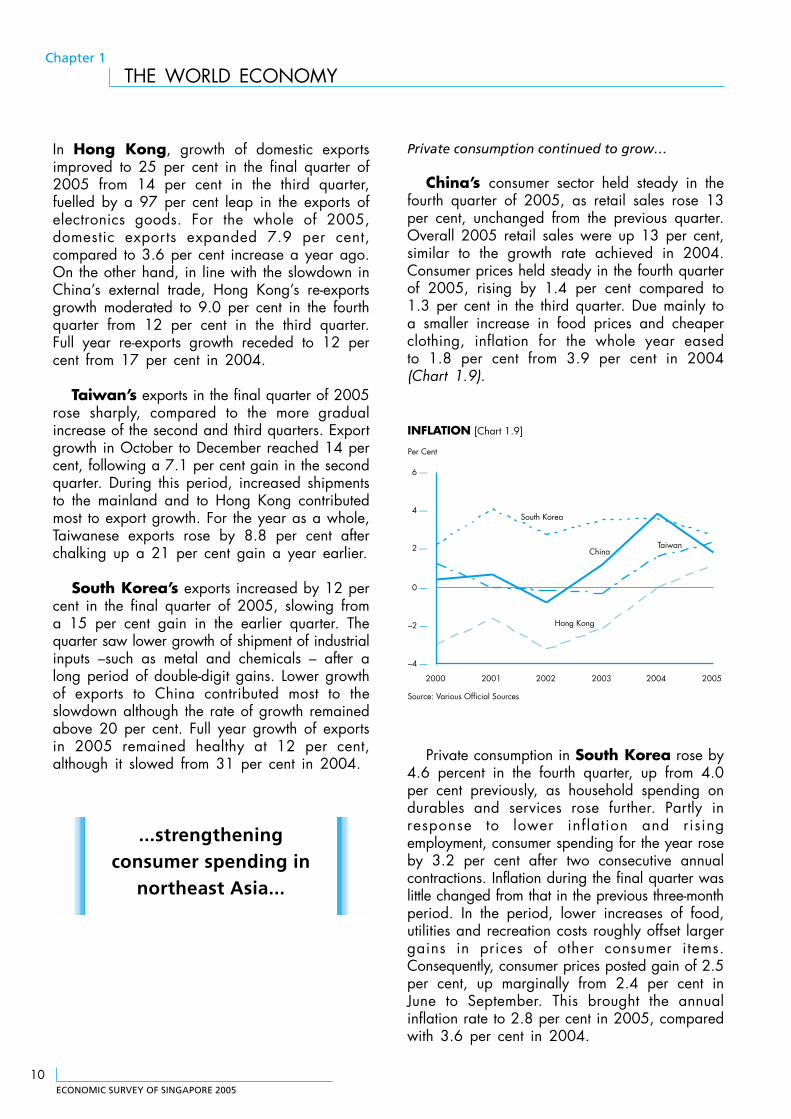
China’s consumer sector held steady in thefourth quarter of 2005, as retail sales rose 13per cent, unchanged from the previous quarter.Overall 2005 retail sales were up 13 per cent,similar to the growth rate achieved in 2004.Consumer prices held steady in the fourth quarterof 2005, rising by 1.4 per cent compared to1.3 per cent in the third quarter. Due mainly toa smaller increase in food prices and cheaperclothing, inflation for the whole year easedto 1.8 per cent from 3.9 per cent in 2004(Chart 1.9).
Private consumption in South Korea rose by4.6 percent in the fourth quarter, up from 4.0per cent previously, as household spending ondurables and services rose further. Partly inresponse to lower inflation and risingemployment, consumer spending for the year roseby 3.2 per cent after two consecutive annualcontractions. Inflation during the final quarter waslittle changed from that in the previous three-monthperiod. In the period, lower increases of food,utilities and recreation costs roughly offset largergains in prices of other consumer items.Consequently, consumer prices posted gain of 2.5per cent, up marginally from 2.4 per cent inJune to September. This brought the annualinflation rate to 2.8 per cent in 2005, comparedwith 3.6 per cent in 2004.
INFLATION [Chart 1.9]
Source: Various Official Sources
–4 —
–2 —
0 —
2 —
4 —
6 —
2000 2001 2002 2003 2004 2005
South Korea
Hong Kong
Taiwan
Per Cent
China
...strengtheningconsumer spending in
northeast Asia...
ECONOMIC SURVEY OF SINGAPORE 2005
11
THE WORLD ECONOMY
Similarly, private consumption in Hong Konggrew 4.6 per cent in the third quarter of 2005,after a 2.7 per cent growth in the second quarter.For the first three quarters of the year, however,consumption growth slowed to 3.9 per centcompared to 6.8 per cent in 2004, as consumersentiments were hit by successive interest ratehikes and a cooling property market. Consumerprices rose 1.7 per cent in the final quarter, upfrom 1.4 per cent in the preceding quarter, drivenby higher prices for housing, utilities andtransport. For 2005, consumer prices rose 1.2per cent, after six consecutive years of deflationthat began in 1999.
Consumer spending in Taiwan rose by 3.7per cent in the third quarter, compared to the3.0 per cent of the second quarter. Althoughprivate spending on medical care and transportand communications eased in the quarter, it wasmore than offset by rising spending on food andhousehold operations. Over the first nine months,overall private consumption expenditure rose by3.1 per cent, compared with 3.9 per cent in2004. Consumer price inflation eased in the finalquarter to 2.5 per cent, from 3.0 per cent in theprevious three-month period. Over the quarter,food prices eased from levels reached in thewake of disruptions to food production causedby typhoon damage. Over 2005, inflation roseto 2.3 per cent from 1.6 per cent in 2004, whenit came out of deflation. The increase camelargely on account of higher food prices.
China continues double-digit gains in investment…
In China, investment in fixed assets jumped26 per cent in 2005, similar to the growth ratein 2004. Reflecting continued strength of stateinvestments in rural infrastructure, fixed assetinvestment in rural areas rose 27 per cent in2005, outpacing the 18 per cent growth in urbanareas. Gross fixed capital formation in SouthKorea increased by 3.7 per cent in the fourthquarter, up substantially from 2.0 per cent in thethird quarter. This reflected mainly a sharpincrease in spending on transport equipment andmachinery investment. Due to weakness inspending early in the year, gross fixed capitalformation grew by just 2.1 per cent in 2005,little changed from 1.9 per cent in 2004.
In Hong Kong, investment slowed asconstruction activities eased following thecompletion of several major projects. Gross fixedcapital formation decelerated to 2.4 per cent inthe third quarter of 2005, from 4.5 per cent inthe previous quarter. For the first three quartersof 2005, investment grew 2.5 per cent, incontrast to 4.1 per cent for 2004. Similarly,Taiwanese gross fixed capital formation slowedsharply in the third quarter to 0.3 per cent, from7.4 per cent in the second quarter. The declinereflected a turnaround in private sector investmentin machinery and equipment. Due to the strengthof investment spending in the first half of theyear, however, gross fixed capital formation inthe first three quarters increased by 5.8 per centcompared to the same period a year earlier.
Steady growth expected in 2006…
Growth prospects in China remain bright thisyear. In December 2005, the National Bureauof Statistics revised 2004 nominal GDP upwardsby a hefty 16.8 per cent, which mostly reflecteda larger services industry than formerly recorded.The revision in national accounts also revealedthat growth has been more balanced betweenconsumption and investment than previouslythought. Looking ahead, the engines ofinvestment, consumption and exports are expectedto remain firm. The National Development andReform Commission expects GDP growth to reach8.5–9.0 per cent this year.
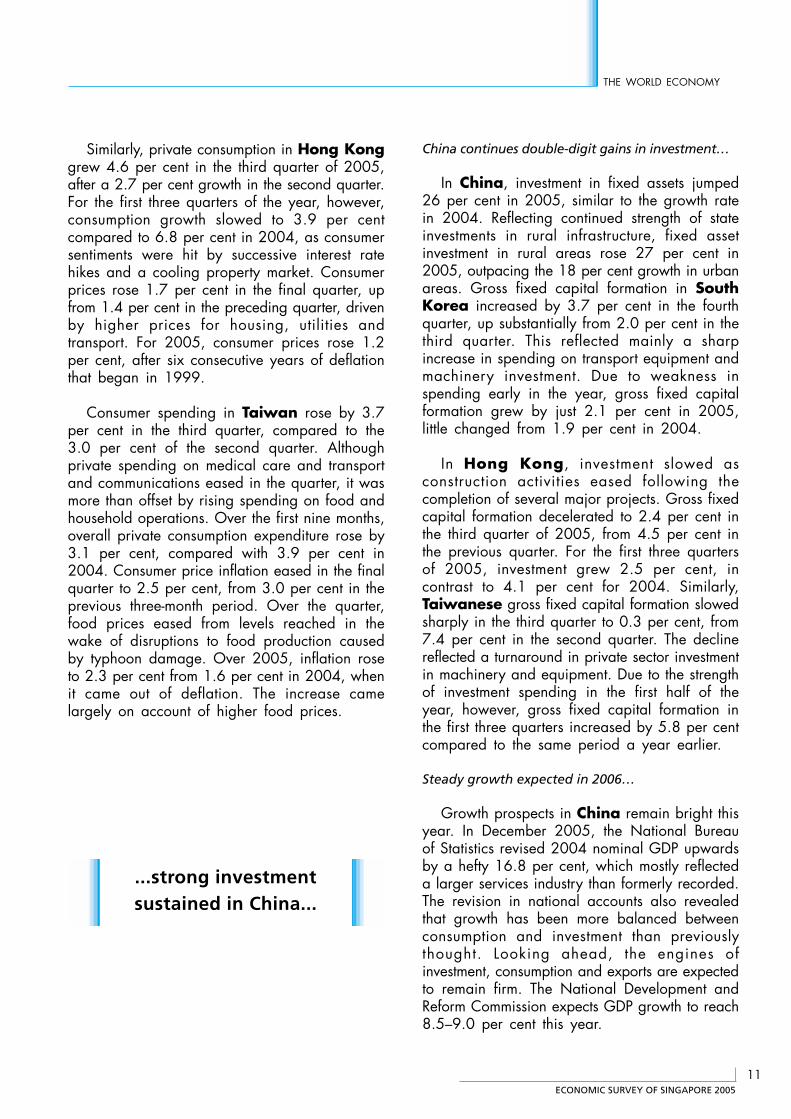
...strong investmentsustained in China...
ECONOMIC SURVEY OF SINGAPORE 2005
12
Chapter 1
THE WORLD ECONOMY
Economic activity in South Korea isexpected to accelerate in 2006, with the Bankof Korea expecting real GDP to grow 5.0 percent. Export performance is expected to remainthe main driver of growth, on expectations thatthe strength of global manufacturing activity ismaintained. This should also spur businessinvestments in equipment, while consumerspending should benefit from further improvementsin the labour market.
In Hong Kong, the continual strength of theChinese economy and robust demand in theglobal economy will provide support for exports.With healthy visitor arrivals growth, anchored bythe opening of Disneyland in September last year,retail sales are expected to remain firm.Improvements in the labour market will also helpto shore up consumer sentiments. The IMFforecasts the Hong Kong economy to grow by4.5 per cent in 2006.
The Taiwanese economy is projected tostrengthen in 2006, with exports growthmaintained at rates similar to that in 2005. Therecent improvements in labour market conditionsshould continue, with positive implications forhousehold income and private consumption.While private investment is likely to have peakedin 2005, some support is expected fromgovernment investment in 2006. The officialforecast for real GDP growth in 2006 is 4.08per cent.
SOUTHEAST ASIA
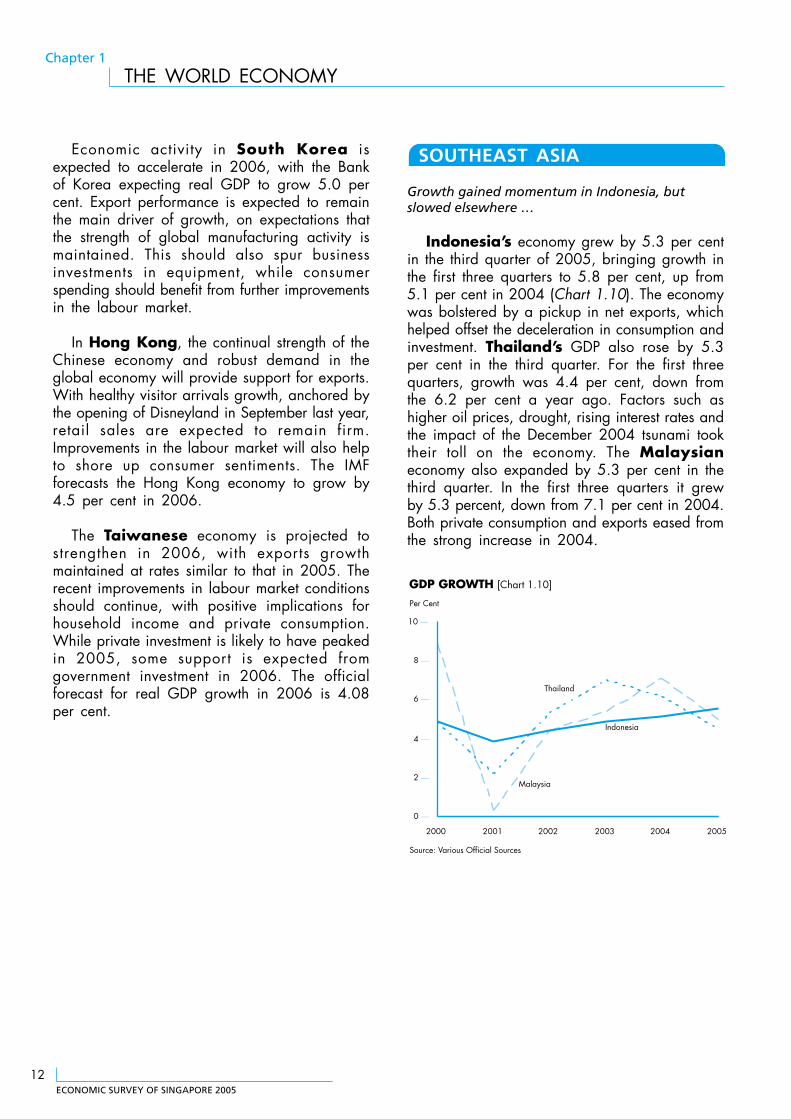
Growth gained momentum in Indonesia, butslowed elsewhere …
Indonesia’s economy grew by 5.3 per centin the third quarter of 2005, bringing growth inthe first three quarters to 5.8 per cent, up from5.1 per cent in 2004 (Chart 1.10). The economywas bolstered by a pickup in net exports, whichhelped offset the deceleration in consumption andinvestment. Thailand’s GDP also rose by 5.3per cent in the third quarter. For the first threequarters, growth was 4.4 per cent, down fromthe 6.2 per cent a year ago. Factors such ashigher oil prices, drought, rising interest rates andthe impact of the December 2004 tsunami tooktheir toll on the economy. The Malaysianeconomy also expanded by 5.3 per cent in thethird quarter. In the first three quarters it grewby 5.3 percent, down from 7.1 per cent in 2004.Both private consumption and exports eased fromthe strong increase in 2004.
GDP GROWTH [Chart 1.10]
Source: Various Official Sources
0 —
2 —
4 —
6 —
8 —
10 —
2000 2001 2002 2003 2004 2005
Indonesia
Malaysia
Per Cent
Thailand
ECONOMIC SURVEY OF SINGAPORE 2005
13
THE WORLD ECONOMY
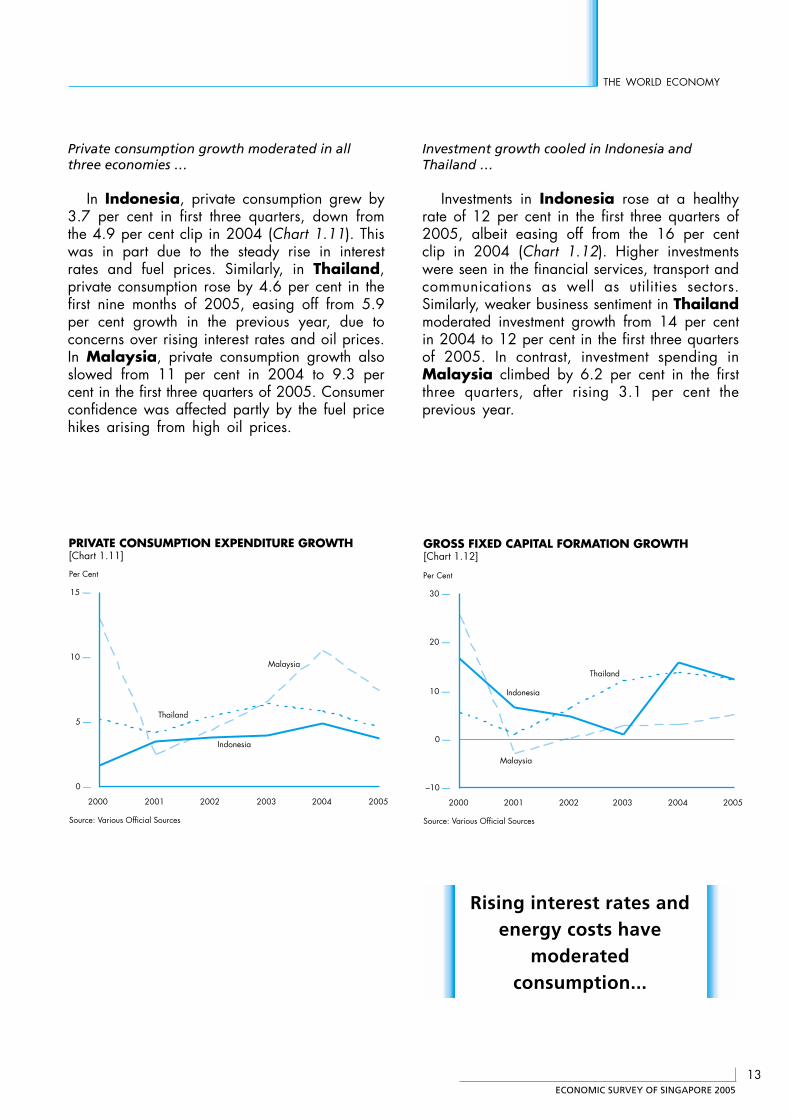
Private consumption growth moderated in allthree economies …
In Indonesia, private consumption grew by3.7 per cent in first three quarters, down fromthe 4.9 per cent clip in 2004 (Chart 1.11). Thiswas in part due to the steady rise in interestrates and fuel prices. Similarly, in Thailand,private consumption rose by 4.6 per cent in thefirst nine months of 2005, easing off from 5.9per cent growth in the previous year, due toconcerns over rising interest rates and oil prices.In Malaysia, private consumption growth alsoslowed from 11 per cent in 2004 to 9.3 percent in the first three quarters of 2005. Consumerconfidence was affected partly by the fuel pricehikes arising from high oil prices.
Investment growth cooled in Indonesia andThailand …
Investments in Indonesia rose at a healthyrate of 12 per cent in the first three quarters of2005, albeit easing off from the 16 per centclip in 2004 (Chart 1.12). Higher investmentswere seen in the financial services, transport andcommunications as well as utilities sectors.Similarly, weaker business sentiment in Thailandmoderated investment growth from 14 per centin 2004 to 12 per cent in the first three quartersof 2005. In contrast, investment spending inMalaysia climbed by 6.2 per cent in the firstthree quarters, after rising 3.1 per cent theprevious year.
PRIVATE CONSUMPTION EXPENDITURE GROWTH [Chart 1.11]
Source: Various Official Sources
0 —
5 —
10 —
15 —
2000 2001 2002 2003 2004 2005
Indonesia
Malaysia
Per Cent
Thailand
GROSS FIXED CAPITAL FORMATION GROWTH [Chart 1.12]
Source: Various Official Sources
–10 —
0 —
10 —
20 —
30 —
2000 2001 2002 2003 2004 2005
Indonesia
Malaysia
Per Cent
Thailand
Rising interest rates andenergy costs have
moderatedconsumption...
ECONOMIC SURVEY OF SINGAPORE 2005
14
Chapter 1
THE WORLD ECONOMY
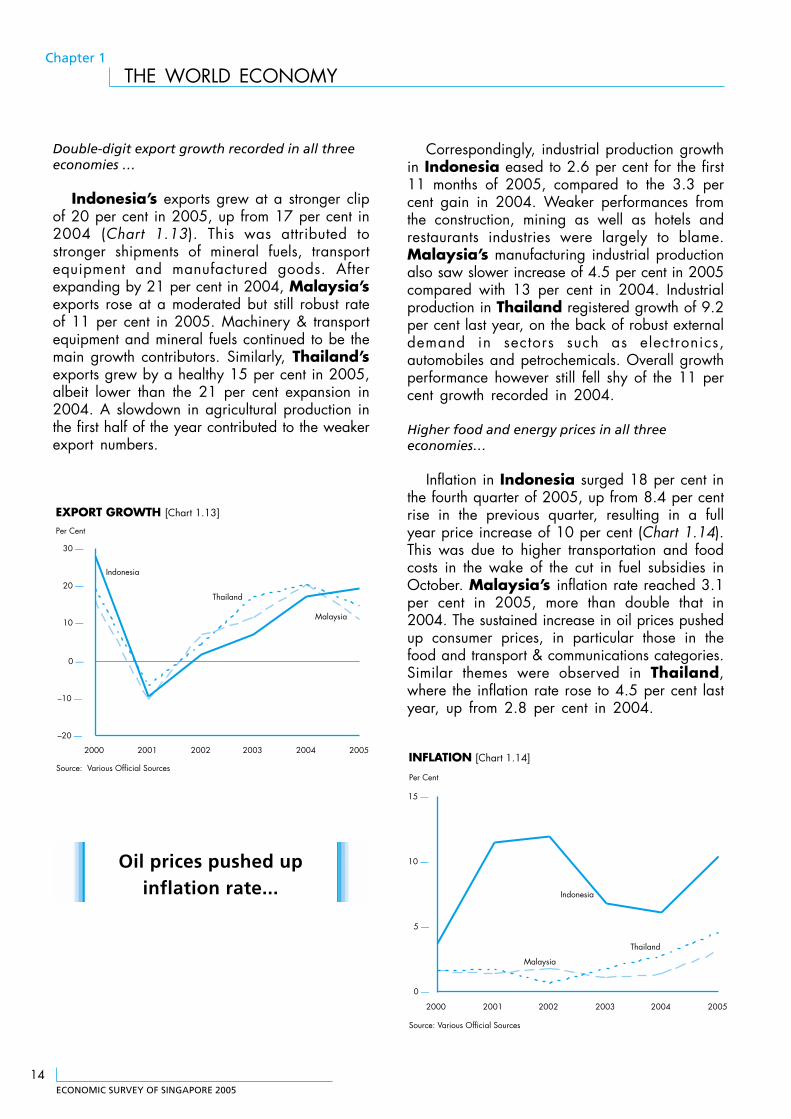
Double-digit export growth recorded in all threeeconomies …
Indonesia’s exports grew at a stronger clipof 20 per cent in 2005, up from 17 per cent in2004 (Chart 1.13). This was attributed tostronger shipments of mineral fuels, transportequipment and manufactured goods. Afterexpanding by 21 per cent in 2004, Malaysia’sexports rose at a moderated but still robust rateof 11 per cent in 2005. Machinery & transportequipment and mineral fuels continued to be themain growth contributors. Similarly, Thailand’sexports grew by a healthy 15 per cent in 2005,albeit lower than the 21 per cent expansion in2004. A slowdown in agricultural production inthe first half of the year contributed to the weakerexport numbers.
Correspondingly, industrial production growthin Indonesia eased to 2.6 per cent for the first11 months of 2005, compared to the 3.3 percent gain in 2004. Weaker performances fromthe construction, mining as well as hotels andrestaurants industries were largely to blame.Malaysia’s manufacturing industrial productionalso saw slower increase of 4.5 per cent in 2005compared with 13 per cent in 2004. Industrialproduction in Thailand registered growth of 9.2per cent last year, on the back of robust externaldemand in sectors such as electronics,automobiles and petrochemicals. Overall growthperformance however still fell shy of the 11 percent growth recorded in 2004.
Higher food and energy prices in all threeeconomies…
Inflation in Indonesia surged 18 per cent inthe fourth quarter of 2005, up from 8.4 per centrise in the previous quarter, resulting in a fullyear price increase of 10 per cent (Chart 1.14).This was due to higher transportation and foodcosts in the wake of the cut in fuel subsidies inOctober. Malaysia’s inflation rate reached 3.1per cent in 2005, more than double that in2004. The sustained increase in oil prices pushedup consumer prices, in particular those in thefood and transport & communications categories.Similar themes were observed in Thailand,where the inflation rate rose to 4.5 per cent lastyear, up from 2.8 per cent in 2004.
EXPORT GROWTH [Chart 1.13]
Source: Various Official Sources
–20 —
–10 —
0 —
10 —
20 —
30 —
2000 2001 2002 2003 2004 2005
Indonesia
Malaysia
Per Cent
Thailand
INFLATION [Chart 1.14]
Source: Various Official Sources
0 —
5 —
10 —
15 —
2000 2001 2002 2003 2004 2005
Indonesia
Malaysia
Per Cent
Thailand
Oil prices pushed upinflation rate...
ECONOMIC SURVEY OF SINGAPORE 2005
15
THE WORLD ECONOMY
Favourable economic growth across the region in2006 …
To curb inflationary tendencies, BankIndonesia raised benchmark interest rates againin December to 12.75 per cent, up from 11 percent in early October. While higher capital costswould cloud domestic consumption and businessspending, the Bank expects the economy to growby between 5.0 and 5.7 per cent in 2006,supported by planned fiscal stimulus packagesand a buoyant export outlook.
Growth momentum has gathered pace in theMalaysian economy after the slowdown in thefirst half of 2005. The continued growth in themajor economies and sustained expansion in theglobal electronics industry will provide impetusto the Malaysian economy this year. TheMalaysian government expects the economy togrow by 5.5 per cent in 2006.
Outlook remainsrosy in 2006...
To keep inflation in check, the Bank ofThailand raised its benchmark interest rate by25 basis points in January 2006, following asimilar increase in December 2005. Thai interestrates now stand at 4.25 per cent. For 2006, theBank of Thailand has narrowed its growthforecast to between 4.75 and 5.75 per cent.Strengthening external demand is expected tolend support to economic growth this year.
Contributed by:
Leong Wai Ho, Senior EconomistMs Soo Cheng Ghee, Senior EconomistTan Kim Eng, Senior EconomistLim Teng Kiat, Senior EconomistPuah Kok Keong, EconomistBenedict Chia, EconomistLee Lay Keng, EconomistLeong Wai Yan, Economist
Economics and Strategy DivisionMinistry of Trade and Industry
ECONOMIC SURVEY OF SINGAPORE 2005
16
Chapter 2
OUTPUT, EXPENDITURE AND NATIONAL INCOME
OUTPUT,EXPENDITURE ANDNATIONAL INCOME
OVERVIEW(Charts 2.1–2.2)
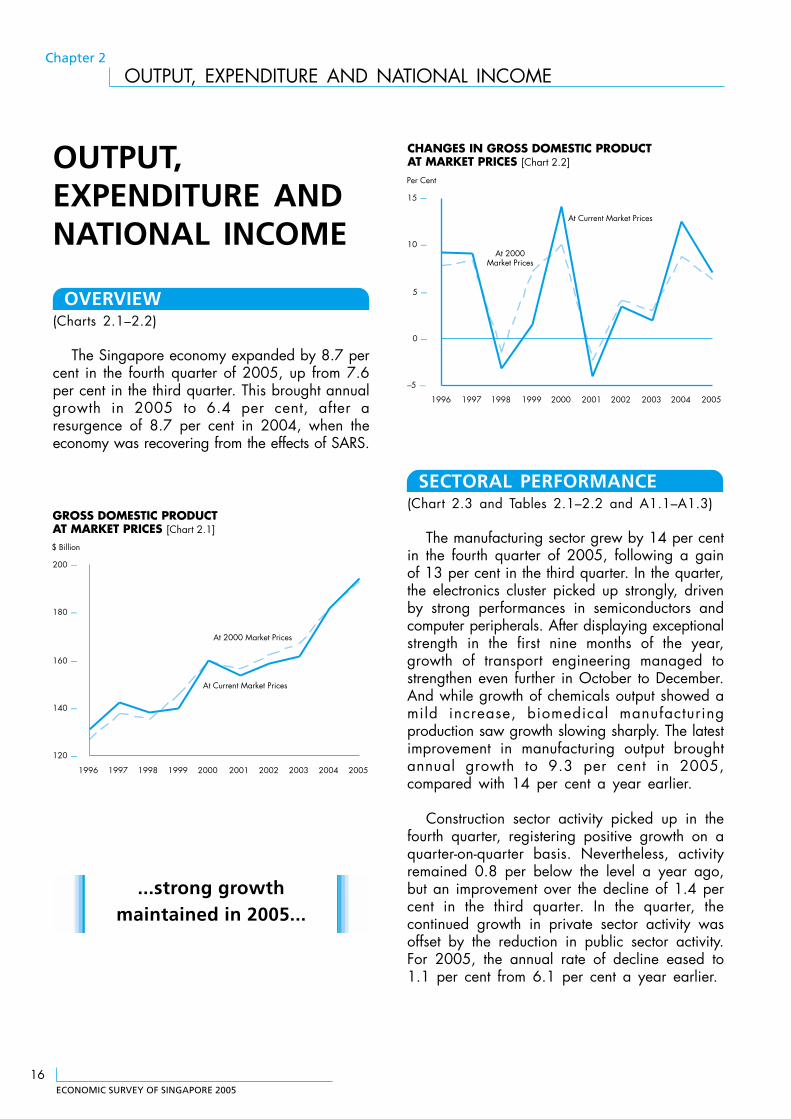
The Singapore economy expanded by 8.7 percent in the fourth quarter of 2005, up from 7.6per cent in the third quarter. This brought annualgrowth in 2005 to 6.4 per cent, after aresurgence of 8.7 per cent in 2004, when theeconomy was recovering from the effects of SARS.
...strong growthmaintained in 2005...
GROSS DOMESTIC PRODUCTAT MARKET PRICES [Chart 2.1]
120 —
140 —
160 —
180 —
200 —
1996 1997 1998 1999 2000 2001 2002 2003 2004 2005
At 2000 Market Prices
$ Billion
At Current Market Prices
CHANGES IN GROSS DOMESTIC PRODUCTAT MARKET PRICES [Chart 2.2]
–5 —
0 —
5 —
10 —
15 —
1996 1997 1998 1999 2000 2001 2002 2003 2004 2005
At Current Market Prices
Per Cent
At 2000Market Prices
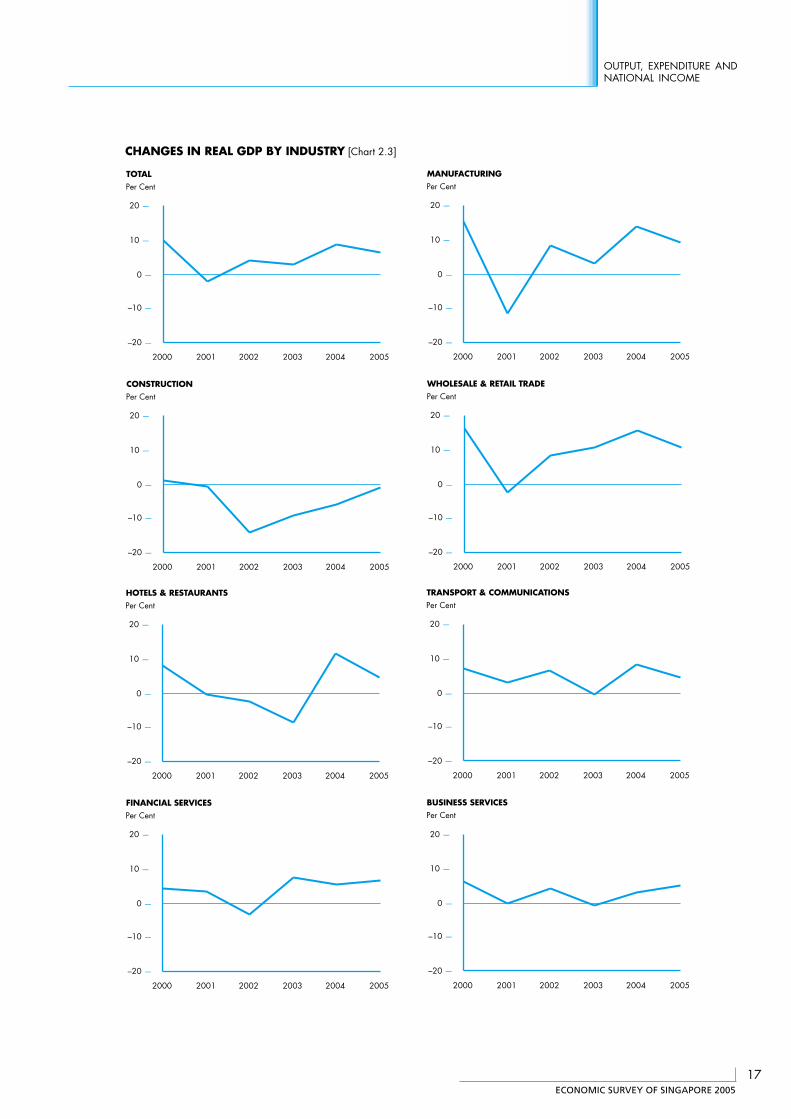
SECTORAL PERFORMANCE(Chart 2.3 and Tables 2.1–2.2 and A1.1–A1.3)
The manufacturing sector grew by 14 per centin the fourth quarter of 2005, following a gainof 13 per cent in the third quarter. In the quarter,the electronics cluster picked up strongly, drivenby strong performances in semiconductors andcomputer peripherals. After displaying exceptionalstrength in the first nine months of the year,growth of transport engineering managed tostrengthen even further in October to December.And while growth of chemicals output showed amild increase, biomedical manufacturingproduction saw growth slowing sharply. The latestimprovement in manufacturing output broughtannual growth to 9.3 per cent in 2005,compared with 14 per cent a year earlier.
Construction sector activity picked up in thefourth quarter, registering positive growth on aquarter-on-quarter basis. Nevertheless, activityremained 0.8 per below the level a year ago,but an improvement over the decline of 1.4 percent in the third quarter. In the quarter, thecontinued growth in private sector activity wasoffset by the reduction in public sector activity.For 2005, the annual rate of decline eased to1.1 per cent from 6.1 per cent a year earlier.
ECONOMIC SURVEY OF SINGAPORE 2005
17
OUTPUT, EXPENDITURE ANDNATIONAL INCOME
CHANGES IN REAL GDP BY INDUSTRY [Chart 2.3]
–20 —
–10 —
0 —
10 —
20 —
2000 2001 2002 2003 2004 2005
Per CentTOTAL
–20 —
–10 —
0 —
10 —
20 —
2000 2001 2002 2003 2004 2005
Per CentCONSTRUCTION
–20 —
–10 —
0 —
10 —
20 —
2000 2001 2002 2003 2004 2005
Per CentHOTELS & RESTAURANTS
–20 —
–10 —
0 —
10 —
20 — 20 —
2000 2001 2002 2003 2004 2005
Per CentFINANCIAL SERVICES
–20 —
–10 —
0 —
10 —
20 —
2000 2001 2002 2003 2004 2005
Per CentMANUFACTURING
–20 —
–10 —
0 —
10 —
20 —
2000 2001 2002 2003 2004 2005
Per CentWHOLESALE & RETAIL TRADE
–20 —
–10 —
0 —
10 —
20 —
2000 2001 2002 2003 2004 2005
Per CentTRANSPORT & COMMUNICATIONS
–20 —
–10 —
0 —
10 —
2000 2001 2002 2003 2004 2005
Per CentBUSINESS SERVICES
ECONOMIC SURVEY OF SINGAPORE 2005
18
Chapter 2
OUTPUT, EXPENDITURE AND NATIONAL INCOME
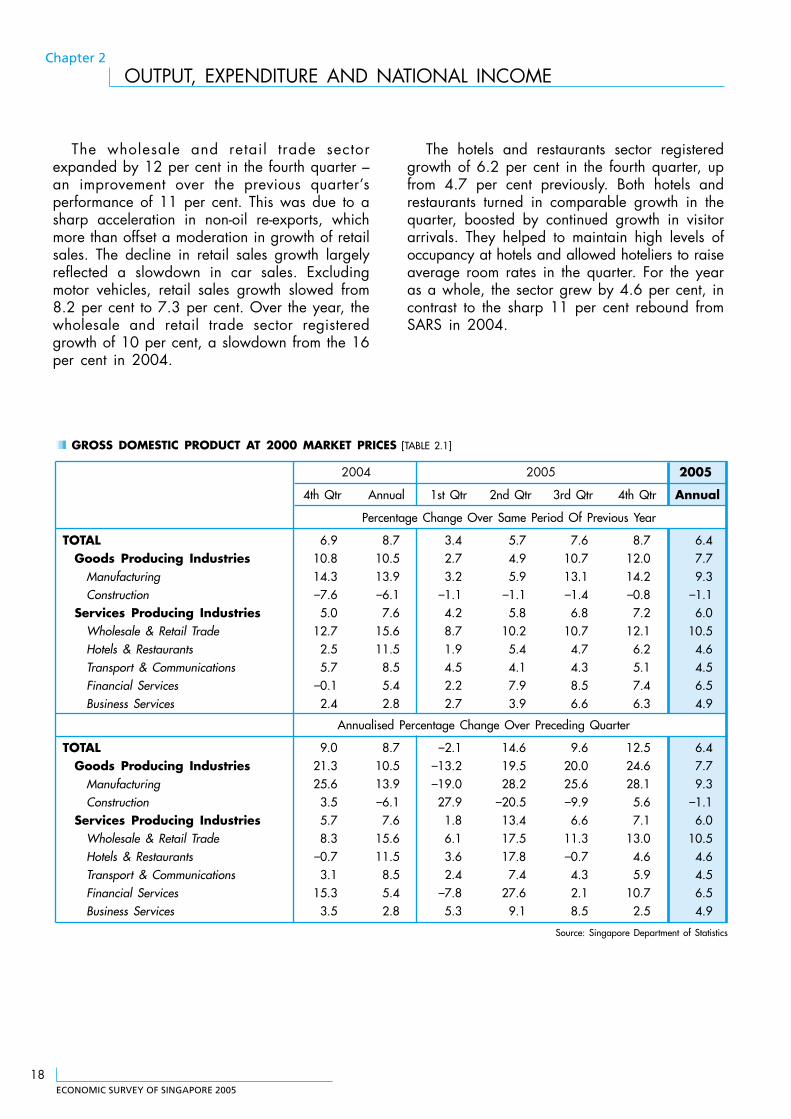
The wholesale and retail trade sectorexpanded by 12 per cent in the fourth quarter –an improvement over the previous quarter’sperformance of 11 per cent. This was due to asharp acceleration in non-oil re-exports, whichmore than offset a moderation in growth of retailsales. The decline in retail sales growth largelyreflected a slowdown in car sales. Excludingmotor vehicles, retail sales growth slowed from8.2 per cent to 7.3 per cent. Over the year, thewholesale and retail trade sector registeredgrowth of 10 per cent, a slowdown from the 16per cent in 2004.
The hotels and restaurants sector registeredgrowth of 6.2 per cent in the fourth quarter, upfrom 4.7 per cent previously. Both hotels andrestaurants turned in comparable growth in thequarter, boosted by continued growth in visitorarrivals. They helped to maintain high levels ofoccupancy at hotels and allowed hoteliers to raiseaverage room rates in the quarter. For the yearas a whole, the sector grew by 4.6 per cent, incontrast to the sharp 11 per cent rebound fromSARS in 2004.
GROSS DOMESTIC PRODUCT AT 2000 MARKET PRICES [TABLE 2.1]
2004 2005 2005
4th Qtr Annual 1st Qtr 2nd Qtr 3rd Qtr 4th Qtr Annual
Percentage Change Over Same Period Of Previous Year
TOTAL 6.9 8.7 3.4 5.7 7.6 8.7 6.4Goods Producing Industries 10.8 10.5 2.7 4.9 10.7 12.0 7.7
Manufacturing 14.3 13.9 3.2 5.9 13.1 14.2 9.3Construction –7.6 –6.1 –1.1 –1.1 –1.4 –0.8 –1.1
Services Producing Industries 5.0 7.6 4.2 5.8 6.8 7.2 6.0Wholesale & Retail Trade 12.7 15.6 8.7 10.2 10.7 12.1 10.5Hotels & Restaurants 2.5 11.5 1.9 5.4 4.7 6.2 4.6Transport & Communications 5.7 8.5 4.5 4.1 4.3 5.1 4.5Financial Services –0.1 5.4 2.2 7.9 8.5 7.4 6.5Business Services 2.4 2.8 2.7 3.9 6.6 6.3 4.9
Annualised Percentage Change Over Preceding Quarter
TOTAL 9.0 8.7 –2.1 14.6 9.6 12.5 6.4Goods Producing Industries 21.3 10.5 –13.2 19.5 20.0 24.6 7.7
Manufacturing 25.6 13.9 –19.0 28.2 25.6 28.1 9.3Construction 3.5 –6.1 27.9 –20.5 –9.9 5.6 –1.1
Services Producing Industries 5.7 7.6 1.8 13.4 6.6 7.1 6.0Wholesale & Retail Trade 8.3 15.6 6.1 17.5 11.3 13.0 10.5Hotels & Restaurants –0.7 11.5 3.6 17.8 –0.7 4.6 4.6Transport & Communications 3.1 8.5 2.4 7.4 4.3 5.9 4.5Financial Services 15.3 5.4 –7.8 27.6 2.1 10.7 6.5Business Services 3.5 2.8 5.3 9.1 8.5 2.5 4.9
Source: Singapore Department of Statistics
ECONOMIC SURVEY OF SINGAPORE 2005
19
OUTPUT, EXPENDITURE ANDNATIONAL INCOME
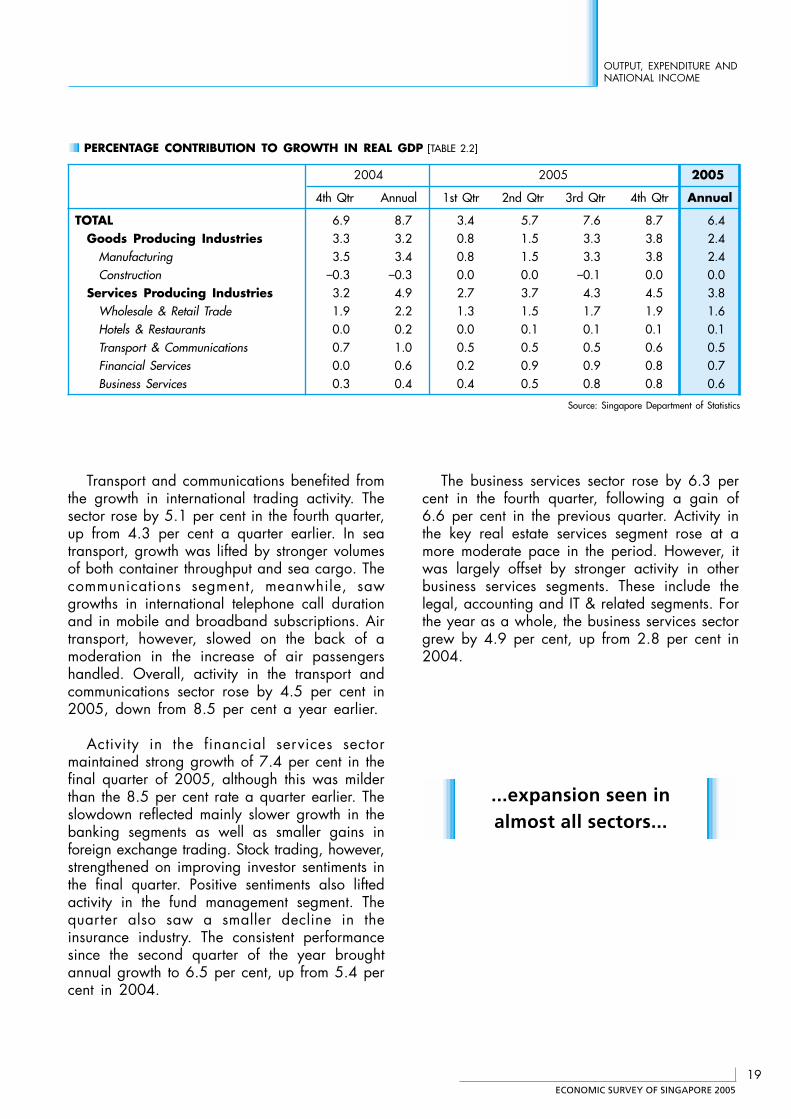
Transport and communications benefited fromthe growth in international trading activity. Thesector rose by 5.1 per cent in the fourth quarter,up from 4.3 per cent a quarter earlier. In seatransport, growth was lifted by stronger volumesof both container throughput and sea cargo. Thecommunications segment, meanwhile, sawgrowths in international telephone call durationand in mobile and broadband subscriptions. Airtransport, however, slowed on the back of amoderation in the increase of air passengershandled. Overall, activity in the transport andcommunications sector rose by 4.5 per cent in2005, down from 8.5 per cent a year earlier.
Activity in the financial services sectormaintained strong growth of 7.4 per cent in thefinal quarter of 2005, although this was milderthan the 8.5 per cent rate a quarter earlier. Theslowdown reflected mainly slower growth in thebanking segments as well as smaller gains inforeign exchange trading. Stock trading, however,strengthened on improving investor sentiments inthe final quarter. Positive sentiments also liftedactivity in the fund management segment. Thequarter also saw a smaller decline in theinsurance industry. The consistent performancesince the second quarter of the year broughtannual growth to 6.5 per cent, up from 5.4 percent in 2004.
The business services sector rose by 6.3 percent in the fourth quarter, following a gain of6.6 per cent in the previous quarter. Activity inthe key real estate services segment rose at amore moderate pace in the period. However, itwas largely offset by stronger activity in otherbusiness services segments. These include thelegal, accounting and IT & related segments. Forthe year as a whole, the business services sectorgrew by 4.9 per cent, up from 2.8 per cent in2004.
PERCENTAGE CONTRIBUTION TO GROWTH IN REAL GDP [TABLE 2.2]
2004 2005 2005
4th Qtr Annual 1st Qtr 2nd Qtr 3rd Qtr 4th Qtr Annual
TOTAL 6.9 8.7 3.4 5.7 7.6 8.7 6.4Goods Producing Industries 3.3 3.2 0.8 1.5 3.3 3.8 2.4
Manufacturing 3.5 3.4 0.8 1.5 3.3 3.8 2.4Construction –0.3 –0.3 0.0 0.0 –0.1 0.0 0.0
Services Producing Industries 3.2 4.9 2.7 3.7 4.3 4.5 3.8Wholesale & Retail Trade 1.9 2.2 1.3 1.5 1.7 1.9 1.6Hotels & Restaurants 0.0 0.2 0.0 0.1 0.1 0.1 0.1Transport & Communications 0.7 1.0 0.5 0.5 0.5 0.6 0.5Financial Services 0.0 0.6 0.2 0.9 0.9 0.8 0.7Business Services 0.3 0.4 0.4 0.5 0.8 0.8 0.6
Source: Singapore Department of Statistics
...expansion seen inalmost all sectors...
ECONOMIC SURVEY OF SINGAPORE 2005
20
Chapter 2
OUTPUT, EXPENDITURE AND NATIONAL INCOME
SOURCES OF GROWTH(Chart 2.4 and Tables 2.3 and A1.4–A1.5)
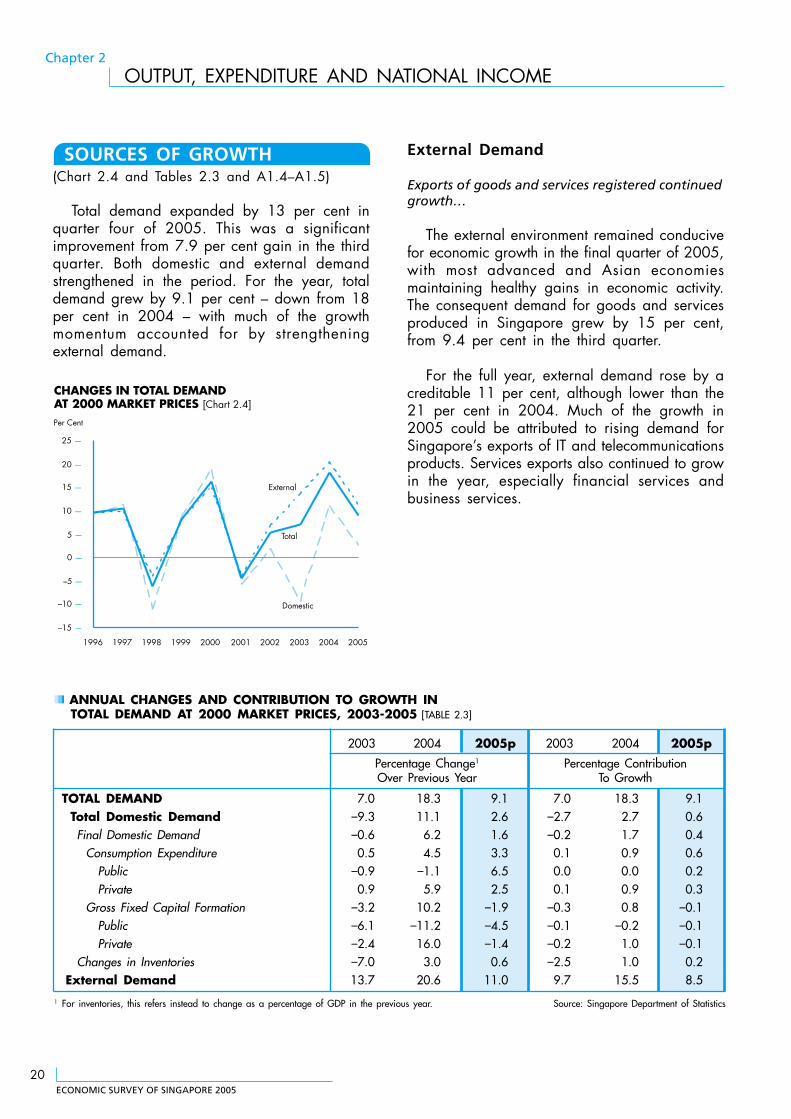
Total demand expanded by 13 per cent inquarter four of 2005. This was a significantimprovement from 7.9 per cent gain in the thirdquarter. Both domestic and external demandstrengthened in the period. For the year, totaldemand grew by 9.1 per cent – down from 18per cent in 2004 – with much of the growthmomentum accounted for by strengtheningexternal demand.
External Demand
Exports of goods and services registered continuedgrowth…
The external environment remained conducivefor economic growth in the final quarter of 2005,with most advanced and Asian economiesmaintaining healthy gains in economic activity.The consequent demand for goods and servicesproduced in Singapore grew by 15 per cent,from 9.4 per cent in the third quarter.
For the full year, external demand rose by acreditable 11 per cent, although lower than the21 per cent in 2004. Much of the growth in2005 could be attributed to rising demand forSingapore’s exports of IT and telecommunicationsproducts. Services exports also continued to growin the year, especially financial services andbusiness services.
CHANGES IN TOTAL DEMANDAT 2000 MARKET PRICES [Chart 2.4]
–15 —
–10 —
–5 —
0 —
5 —
10 —
15 —
20 —
25 —
1996 1997 1998 1999 2000 2001 2002 2003 2004 2005
External
Per Cent
Domestic
Total
ANNUAL CHANGES AND CONTRIBUTION TO GROWTH INTOTAL DEMAND AT 2000 MARKET PRICES, 2003-2005 [TABLE 2.3]
2003 2004 2005p 2003 2004 2005p
Percentage Change1 Percentage ContributionOver Previous Year To Growth
TOTAL DEMAND 7.0 18.3 9.1 7.0 18.3 9.1Total Domestic Demand –9.3 11.1 2.6 –2.7 2.7 0.6Final Domestic Demand –0.6 6.2 1.6 –0.2 1.7 0.4
Consumption Expenditure 0.5 4.5 3.3 0.1 0.9 0.6Public –0.9 –1.1 6.5 0.0 0.0 0.2Private 0.9 5.9 2.5 0.1 0.9 0.3
Gross Fixed Capital Formation –3.2 10.2 –1.9 –0.3 0.8 –0.1Public –6.1 –11.2 –4.5 –0.1 –0.2 –0.1Private –2.4 16.0 –1.4 –0.2 1.0 –0.1
Changes in Inventories –7.0 3.0 0.6 –2.5 1.0 0.2External Demand 13.7 20.6 11.0 9.7 15.5 8.5
1 For inventories, this refers instead to change as a percentage of GDP in the previous year. Source: Singapore Department of Statistics
ECONOMIC SURVEY OF SINGAPORE 2005
21
OUTPUT, EXPENDITURE ANDNATIONAL INCOME
Domestic Demand
Domestic demand growth slowed in 2005…
Total domestic demand grew by 3.9 per centin the fourth quarter, up from 2.5 per cent in thethird quarter. Full year growth was 2.6 per cent,down sharply from 11 per cent in 2004.
Consumption Expenditure(Table A1.6)
Consumption expenditure growth eased…
Total consumption expenditure grew at a fasterrate of 5.1 per cent in the fourth quarter, upfrom a gain of 1.8 per cent a quarter earlier.2005 growth reached 3.3 per cent, comparedwith 4.5 per cent in 2004. The moderation couldbe attributable to lower expenditure on vehiclepurchase, audio-visual & photographic equipmentas well as residents’ expenditure abroad.
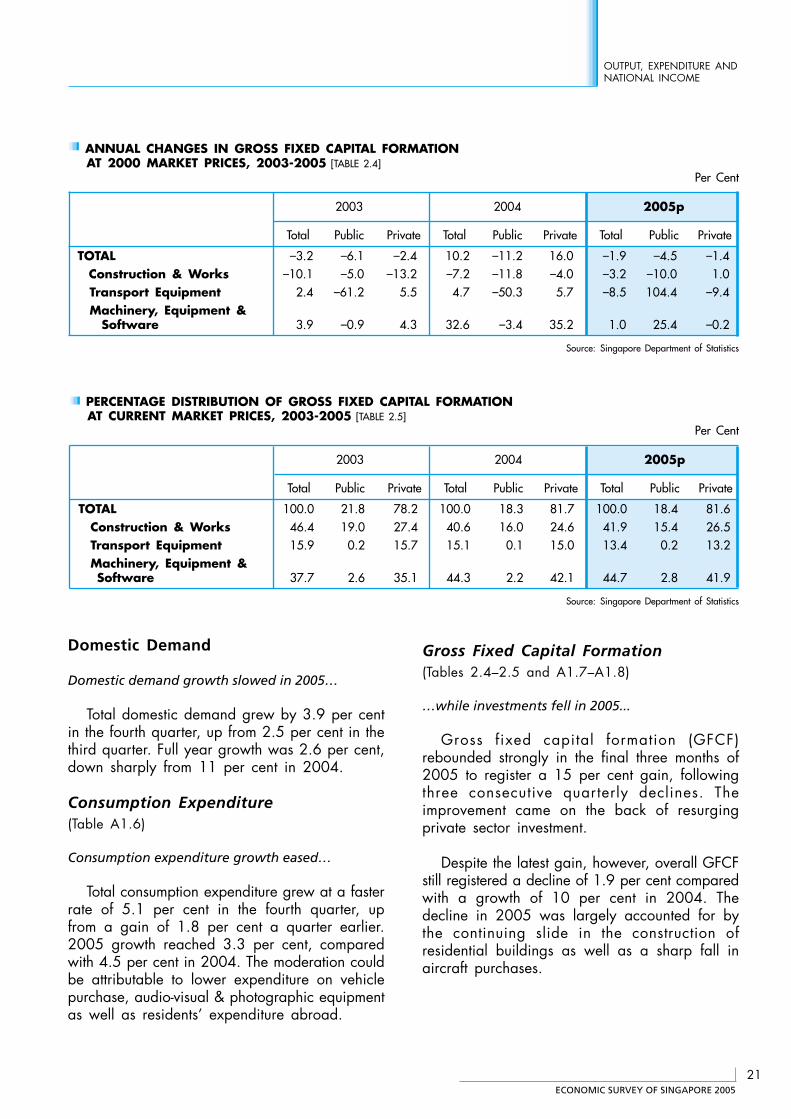
ANNUAL CHANGES IN GROSS FIXED CAPITAL FORMATIONAT 2000 MARKET PRICES, 2003-2005 [TABLE 2.4]
Per Cent
2003 2004 2005p
Total Public Private Total Public Private Total Public Private
TOTAL –3.2 –6.1 –2.4 10.2 –11.2 16.0 –1.9 –4.5 –1.4Construction & Works –10.1 –5.0 –13.2 –7.2 –11.8 –4.0 –3.2 –10.0 1.0Transport Equipment 2.4 –61.2 5.5 4.7 –50.3 5.7 –8.5 104.4 –9.4Machinery, Equipment &
Software 3.9 –0.9 4.3 32.6 –3.4 35.2 1.0 25.4 –0.2
Source: Singapore Department of Statistics
PERCENTAGE DISTRIBUTION OF GROSS FIXED CAPITAL FORMATIONAT CURRENT MARKET PRICES, 2003-2005 [TABLE 2.5]
Per Cent
2003 2004 2005p
Total Public Private Total Public Private Total Public Private
TOTAL 100.0 21.8 78.2 100.0 18.3 81.7 100.0 18.4 81.6Construction & Works 46.4 19.0 27.4 40.6 16.0 24.6 41.9 15.4 26.5Transport Equipment 15.9 0.2 15.7 15.1 0.1 15.0 13.4 0.2 13.2Machinery, Equipment &
Software 37.7 2.6 35.1 44.3 2.2 42.1 44.7 2.8 41.9
Source: Singapore Department of Statistics
Gross Fixed Capital Formation(Tables 2.4–2.5 and A1.7–A1.8)
…while investments fell in 2005...
Gross fixed capital formation (GFCF)rebounded strongly in the final three months of2005 to register a 15 per cent gain, followingthree consecutive quarterly declines. Theimprovement came on the back of resurgingprivate sector investment.
Despite the latest gain, however, overall GFCFstill registered a decline of 1.9 per cent comparedwith a growth of 10 per cent in 2004. Thedecline in 2005 was largely accounted for bythe continuing slide in the construction ofresidential buildings as well as a sharp fall inaircraft purchases.
ECONOMIC SURVEY OF SINGAPORE 2005
22
Chapter 2
OUTPUT, EXPENDITURE AND NATIONAL INCOME
NATIONAL SAVINGS(Table A1.10)
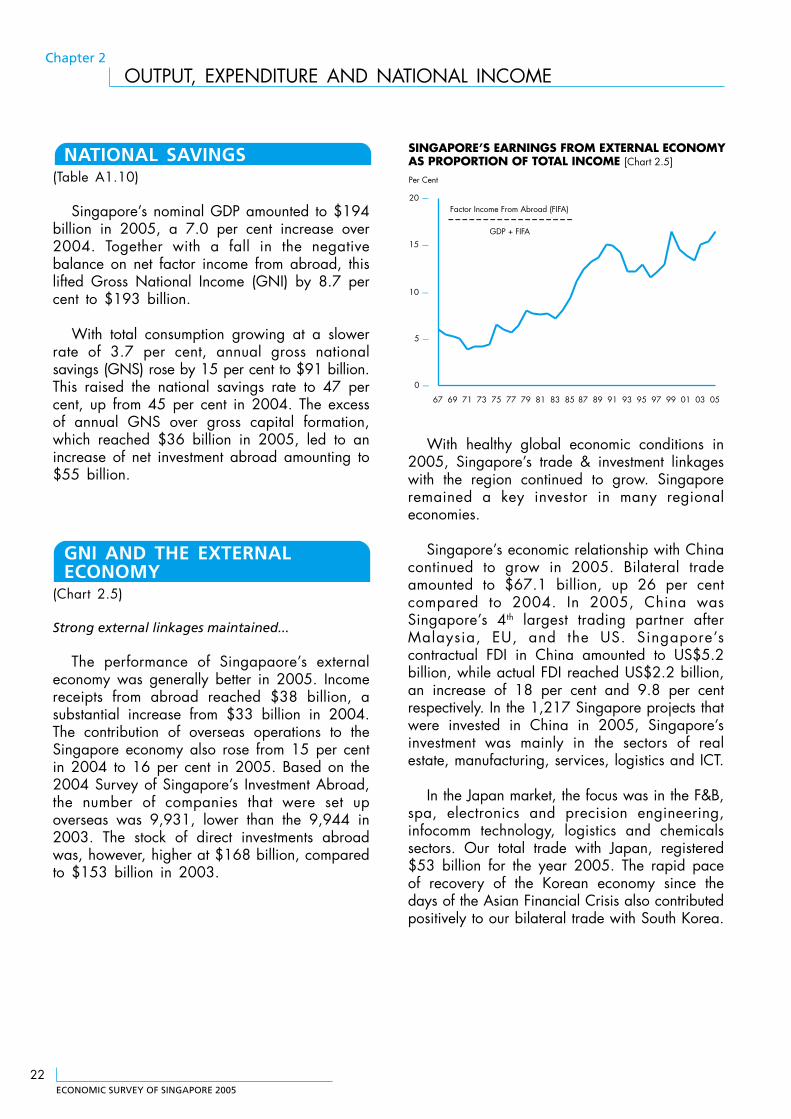
Singapore’s nominal GDP amounted to $194billion in 2005, a 7.0 per cent increase over2004. Together with a fall in the negativebalance on net factor income from abroad, thislifted Gross National Income (GNI) by 8.7 percent to $193 billion.
With total consumption growing at a slowerrate of 3.7 per cent, annual gross nationalsavings (GNS) rose by 15 per cent to $91 billion.This raised the national savings rate to 47 percent, up from 45 per cent in 2004. The excessof annual GNS over gross capital formation,which reached $36 billion in 2005, led to anincrease of net investment abroad amounting to$55 billion.
SINGAPORE’S EARNINGS FROM EXTERNAL ECONOMYAS PROPORTION OF TOTAL INCOME [Chart 2.5]
0 —
5 —
10 —
15 —
20 —
67 69 71 73 75 77 79 81 83 85 87 89 91 93 95 97 99 01 03 05
Per Cent
Factor Income From Abroad (FIFA)
GDP + FIFA
With healthy global economic conditions in2005, Singapore’s trade & investment linkageswith the region continued to grow. Singaporeremained a key investor in many regionaleconomies.
Singapore’s economic relationship with Chinacontinued to grow in 2005. Bilateral tradeamounted to $67.1 billion, up 26 per centcompared to 2004. In 2005, China wasSingapore’s 4th largest trading partner afterMalaysia, EU, and the US. Singapore’scontractual FDI in China amounted to US$5.2billion, while actual FDI reached US$2.2 billion,an increase of 18 per cent and 9.8 per centrespectively. In the 1,217 Singapore projects thatwere invested in China in 2005, Singapore’sinvestment was mainly in the sectors of realestate, manufacturing, services, logistics and ICT.
In the Japan market, the focus was in the F&B,spa, electronics and precision engineering,infocomm technology, logistics and chemicalssectors. Our total trade with Japan, registered$53 billion for the year 2005. The rapid paceof recovery of the Korean economy since thedays of the Asian Financial Crisis also contributedpositively to our bilateral trade with South Korea.
GNI AND THE EXTERNALECONOMY
(Chart 2.5)
Strong external linkages maintained...
The performance of Singapaore’s externaleconomy was generally better in 2005. Incomereceipts from abroad reached $38 billion, asubstantial increase from $33 billion in 2004.The contribution of overseas operations to theSingapore economy also rose from 15 per centin 2004 to 16 per cent in 2005. Based on the2004 Survey of Singapore’s Investment Abroad,the number of companies that were set upoverseas was 9,931, lower than the 9,944 in2003. The stock of direct investments abroadwas, however, higher at $168 billion, comparedto $153 billion in 2003.
ECONOMIC SURVEY OF SINGAPORE 2005
23
OUTPUT, EXPENDITURE ANDNATIONAL INCOME
In the Middle East, there was a markedincrease in the number of Singapore companieskeen to explore business opportunities in thebooming infrastructure sector. Seven infrastructure-related business missions to the Middle East wereorganised in 2005, with particular focus on realestate & construction services, oil & gassupporting infrastructure services, andtransportation & logistics services.
There was increased interest in Russia in2005. Opportunities for Singapore companieswere in the F&B, hospitality and automotivesectors.
In Western Europe, the focus was on tappingthe wave of European outsourcing opportunities.In particular, efforts were made to address theprocurement needs of small and mediumenterprises through an SME survey and marketingplan in Germany. Business linkages with the USand Latin America were also deepened over theyear.
Contributed by:
Tan Kim EngSenior EconomistEconomics and Strategy DivisionMinistry of Trade and Industry
Ms Grace ChuaSenior OfficerResearch and Statistics DivisionInternational Enterprise Singapore
ECONOMIC SURVEY OF SINGAPORE 2005
24
Chapter 3
EMPLOYMENT, WAGES AND PRODUCTIVITY
EMPLOYMENT,WAGES ANDPRODUCTIVITY
OVERVIEW
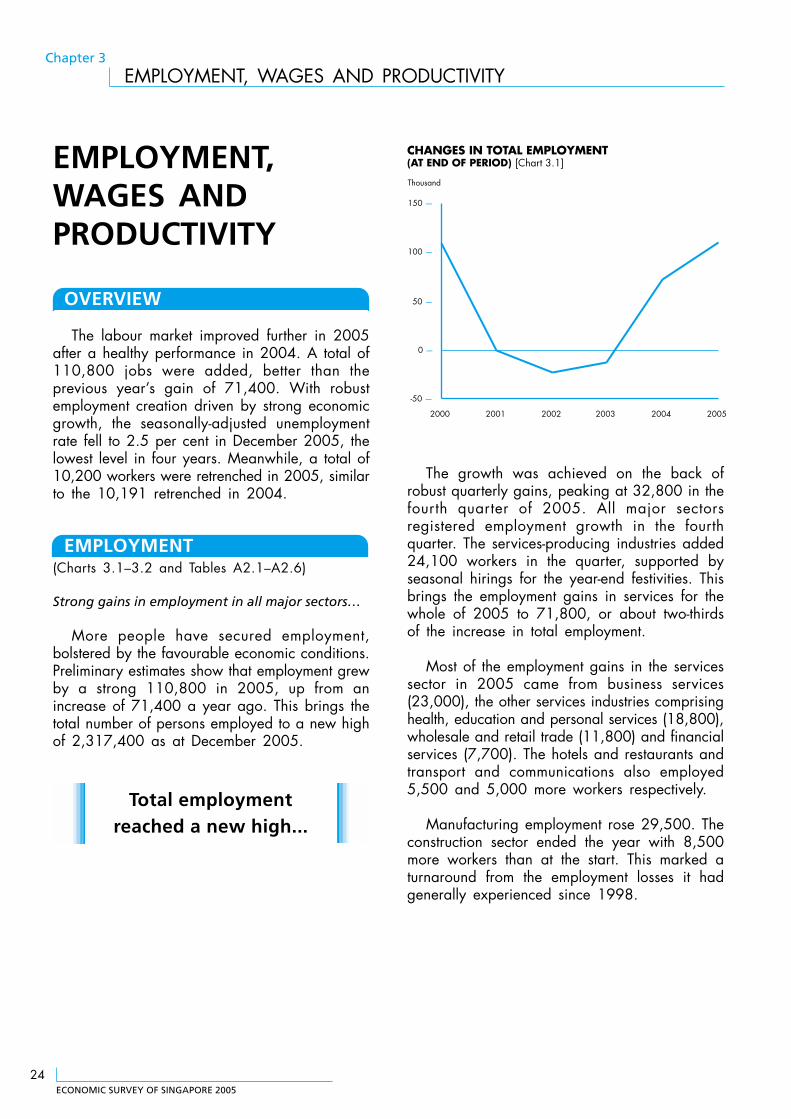
The labour market improved further in 2005after a healthy performance in 2004. A total of110,800 jobs were added, better than theprevious year’s gain of 71,400. With robustemployment creation driven by strong economicgrowth, the seasonally-adjusted unemploymentrate fell to 2.5 per cent in December 2005, thelowest level in four years. Meanwhile, a total of10,200 workers were retrenched in 2005, similarto the 10,191 retrenched in 2004.
EMPLOYMENT(Charts 3.1–3.2 and Tables A2.1–A2.6)
Strong gains in employment in all major sectors…
More people have secured employment,bolstered by the favourable economic conditions.Preliminary estimates show that employment grewby a strong 110,800 in 2005, up from anincrease of 71,400 a year ago. This brings thetotal number of persons employed to a new highof 2,317,400 as at December 2005.
-50 —
0 —
50 —
100 —
150 —
2000 2001 2002 2003 2004 2005
Thousand
CHANGES IN TOTAL EMPLOYMENT (AT END OF PERIOD) [Chart 3.1]
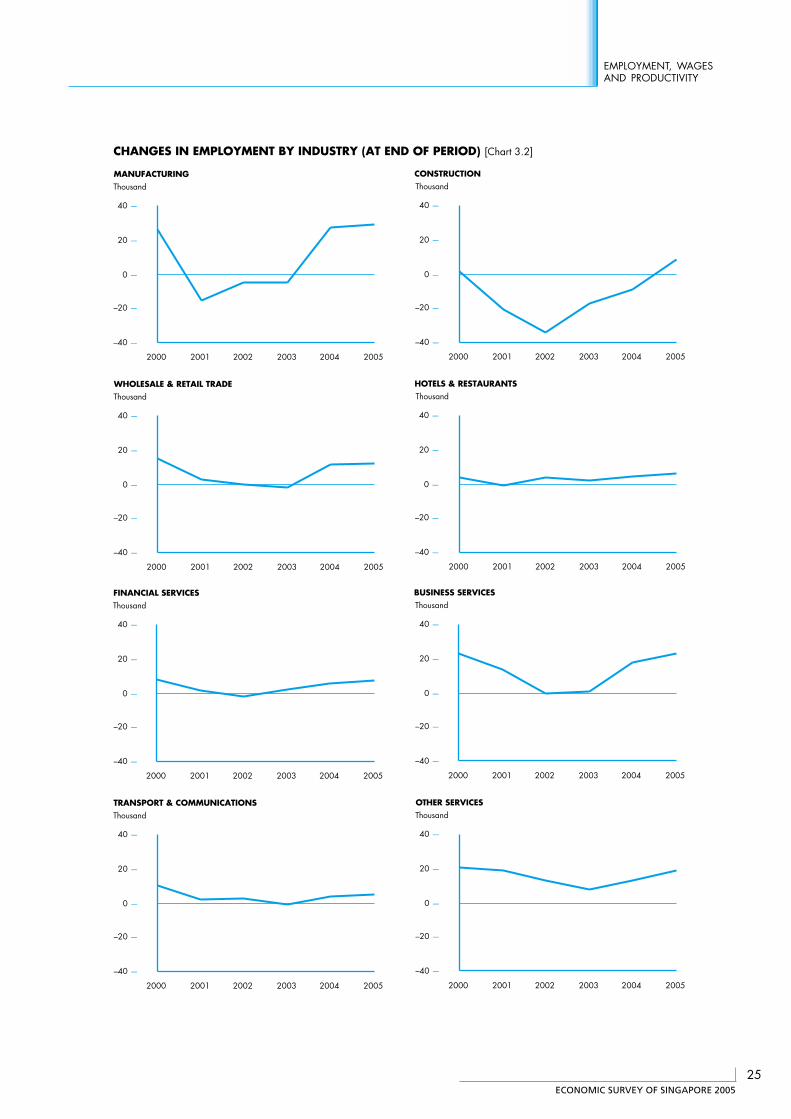
The growth was achieved on the back ofrobust quarterly gains, peaking at 32,800 in thefourth quarter of 2005. All major sectorsregistered employment growth in the fourthquarter. The services-producing industries added24,100 workers in the quarter, supported byseasonal hirings for the year-end festivities. Thisbrings the employment gains in services for thewhole of 2005 to 71,800, or about two-thirdsof the increase in total employment.
Most of the employment gains in the servicessector in 2005 came from business services(23,000), the other services industries comprisinghealth, education and personal services (18,800),wholesale and retail trade (11,800) and financialservices (7,700). The hotels and restaurants andtransport and communications also employed5,500 and 5,000 more workers respectively.
Manufacturing employment rose 29,500. Theconstruction sector ended the year with 8,500more workers than at the start. This marked aturnaround from the employment losses it hadgenerally experienced since 1998.
Total employmentreached a new high...
ECONOMIC SURVEY OF SINGAPORE 2005
25
EMPLOYMENT, WAGESAND PRODUCTIVITY
CHANGES IN EMPLOYMENT BY INDUSTRY (AT END OF PERIOD) [Chart 3.2]
–40 —
–20 —
0 —
20 —
40 —
2000 2001 2002 2003 2004 2005
ThousandMANUFACTURING
–40 —
–20 —
0 —
20 —
40 —
2000 2001 2002 2003 2004 2005
ThousandWHOLESALE & RETAIL TRADE
–40 —
–20 —
0 —
20 —
40 —
2000 2001 2002 2003 2004 2005
ThousandFINANCIAL SERVICES
–40 —
–20 —
0 —
20 —
40 —
2000 2001 2002 2003 2004 2005
ThousandTRANSPORT & COMMUNICATIONS
–40 —
–20 —
0 —
20 —
40 —
2000 2001 2002 2003 2004 2005
ThousandCONSTRUCTION
–40 —
–20 —
0 —
20 —
40 —
2000 2001 2002 2003 2004 2005
ThousandHOTELS & RESTAURANTS
–40 —
–20 —
0 —
20 —
40 —
2000 2001 2002 2003 2004 2005
ThousandBUSINESS SERVICES
–40 —
–20 —
0 —
20 —
40 —
2000 2001 2002 2003 2004 2005
ThousandOTHER SERVICES
ECONOMIC SURVEY OF SINGAPORE 2005
26
Chapter 3
EMPLOYMENT, WAGES AND PRODUCTIVITY
UNEMPLOYMENT(Chart 3.3)
Unemployment rates headed south…
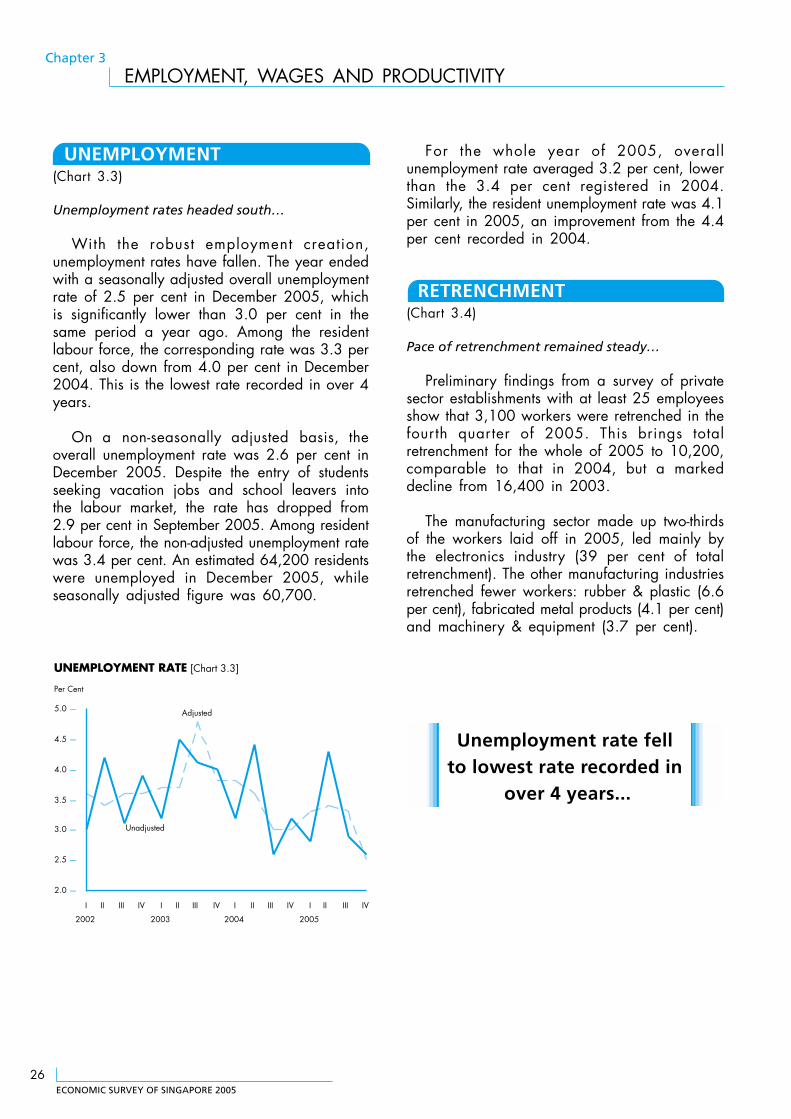
With the robust employment creation,unemployment rates have fallen. The year endedwith a seasonally adjusted overall unemploymentrate of 2.5 per cent in December 2005, whichis significantly lower than 3.0 per cent in thesame period a year ago. Among the residentlabour force, the corresponding rate was 3.3 percent, also down from 4.0 per cent in December2004. This is the lowest rate recorded in over 4years.
On a non-seasonally adjusted basis, theoverall unemployment rate was 2.6 per cent inDecember 2005. Despite the entry of studentsseeking vacation jobs and school leavers intothe labour market, the rate has dropped from2.9 per cent in September 2005. Among residentlabour force, the non-adjusted unemployment ratewas 3.4 per cent. An estimated 64,200 residentswere unemployed in December 2005, whileseasonally adjusted figure was 60,700.
For the whole year of 2005, overallunemployment rate averaged 3.2 per cent, lowerthan the 3.4 per cent registered in 2004.Similarly, the resident unemployment rate was 4.1per cent in 2005, an improvement from the 4.4per cent recorded in 2004.
RETRENCHMENT(Chart 3.4)
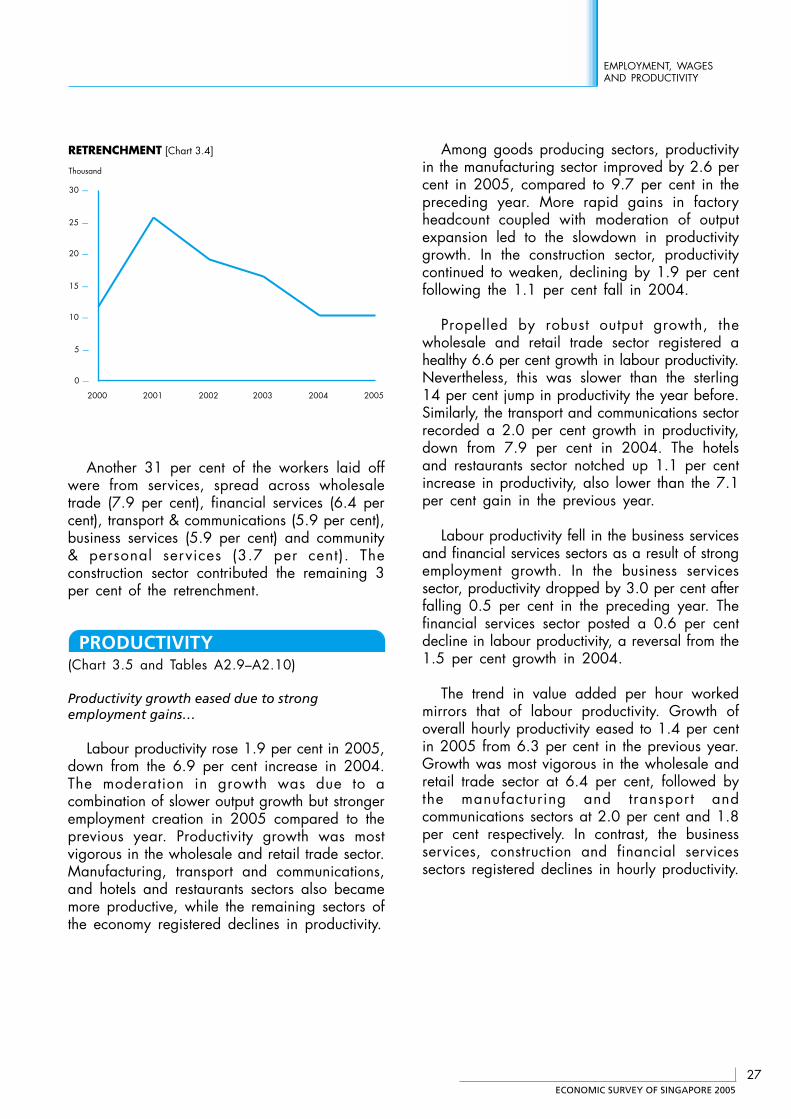
Pace of retrenchment remained steady…
Preliminary findings from a survey of privatesector establishments with at least 25 employeesshow that 3,100 workers were retrenched in thefourth quarter of 2005. This brings totalretrenchment for the whole of 2005 to 10,200,comparable to that in 2004, but a markeddecline from 16,400 in 2003.
The manufacturing sector made up two-thirdsof the workers laid off in 2005, led mainly bythe electronics industry (39 per cent of totalretrenchment). The other manufacturing industriesretrenched fewer workers: rubber & plastic (6.6per cent), fabricated metal products (4.1 per cent)and machinery & equipment (3.7 per cent).
2.0 —
2.5 —
3.0 —
3.5 —
4.0 —
4.5 —
5.0 —
I
2002
II III IV I
2003
II III IV I
2004
II III IV I
2005
II III IV
Unadjusted
Adjusted
Per Cent
UNEMPLOYMENT RATE [Chart 3.3]
Unemployment rate fellto lowest rate recorded in
over 4 years...
ECONOMIC SURVEY OF SINGAPORE 2005
27
EMPLOYMENT, WAGESAND PRODUCTIVITY
Another 31 per cent of the workers laid offwere from services, spread across wholesaletrade (7.9 per cent), financial services (6.4 percent), transport & communications (5.9 per cent),business services (5.9 per cent) and community& personal services (3.7 per cent). Theconstruction sector contributed the remaining 3per cent of the retrenchment.
PRODUCTIVITY(Chart 3.5 and Tables A2.9–A2.10)
Productivity growth eased due to strongemployment gains…
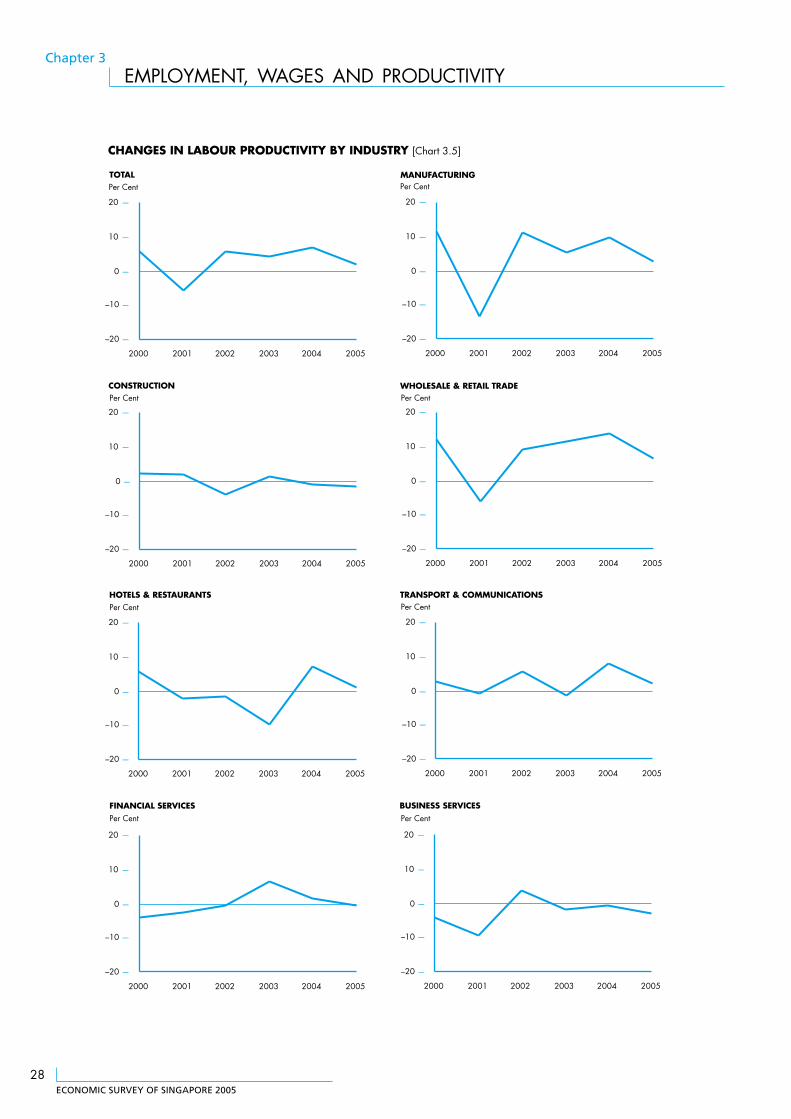
Labour productivity rose 1.9 per cent in 2005,down from the 6.9 per cent increase in 2004.The moderation in growth was due to acombination of slower output growth but strongeremployment creation in 2005 compared to theprevious year. Productivity growth was mostvigorous in the wholesale and retail trade sector.Manufacturing, transport and communications,and hotels and restaurants sectors also becamemore productive, while the remaining sectors ofthe economy registered declines in productivity.
Among goods producing sectors, productivityin the manufacturing sector improved by 2.6 percent in 2005, compared to 9.7 per cent in thepreceding year. More rapid gains in factoryheadcount coupled with moderation of outputexpansion led to the slowdown in productivitygrowth. In the construction sector, productivitycontinued to weaken, declining by 1.9 per centfollowing the 1.1 per cent fall in 2004.
Propelled by robust output growth, thewholesale and retail trade sector registered ahealthy 6.6 per cent growth in labour productivity.Nevertheless, this was slower than the sterling14 per cent jump in productivity the year before.Similarly, the transport and communications sectorrecorded a 2.0 per cent growth in productivity,down from 7.9 per cent in 2004. The hotelsand restaurants sector notched up 1.1 per centincrease in productivity, also lower than the 7.1per cent gain in the previous year.
Labour productivity fell in the business servicesand financial services sectors as a result of strongemployment growth. In the business servicessector, productivity dropped by 3.0 per cent afterfalling 0.5 per cent in the preceding year. Thefinancial services sector posted a 0.6 per centdecline in labour productivity, a reversal from the1.5 per cent growth in 2004.
The trend in value added per hour workedmirrors that of labour productivity. Growth ofoverall hourly productivity eased to 1.4 per centin 2005 from 6.3 per cent in the previous year.Growth was most vigorous in the wholesale andretail trade sector at 6.4 per cent, followed bythe manufacturing and transport andcommunications sectors at 2.0 per cent and 1.8per cent respectively. In contrast, the businessservices, construction and financial servicessectors registered declines in hourly productivity.
0 —
5 —
10 —
15 —
20 —
25 —
30 —
2000 2001 2002 2003 2004 2005
Thousand
RETRENCHMENT [Chart 3.4]
ECONOMIC SURVEY OF SINGAPORE 2005
28
Chapter 3
EMPLOYMENT, WAGES AND PRODUCTIVITY
–20 —
–10 —
0 —
10 —
20 —
2000 2001 2002 2003 2004 2005
–20 —
–10 —
0 —
10 —
20 —
2000 2001 2002 2003 2004 2005
–20 —
–10 —
0 —
10 —
20 —
2000 2001 2002 2003 2004 2005
–20 —
–10 —
0 —
10 —
20 —
2000 2001 2002 2003 2004 2005
–20 —
–10 —
0 —
10 —
20 —
2000 2001 2002 2003 2004 2005
–20 —
–10 —
0 —
10 —
20 —
2000 2001 2002 2003 2004 2005
–20 —
–10 —
0 —
10 —
20 —
2000 2001 2002 2003 2004 2005
–20 —
–10 —
0 —
10 —
20 —
2000 2001 2002 2003 2004 2005
Per CentTOTAL
CHANGES IN LABOUR PRODUCTIVITY BY INDUSTRY [Chart 3.5]
Per CentMANUFACTURING
Per CentCONSTRUCTION
Per CentWHOLESALE & RETAIL TRADE
Per CentHOTELS & RESTAURANTS
Per CentTRANSPORT & COMMUNICATIONS
Per CentFINANCIAL SERVICES
Per CentBUSINESS SERVICES
ECONOMIC SURVEY OF SINGAPORE 2005
29
EMPLOYMENT, WAGESAND PRODUCTIVITY
COSTS(Charts 3.6–3.9 and Tables A2.7–A2.8)
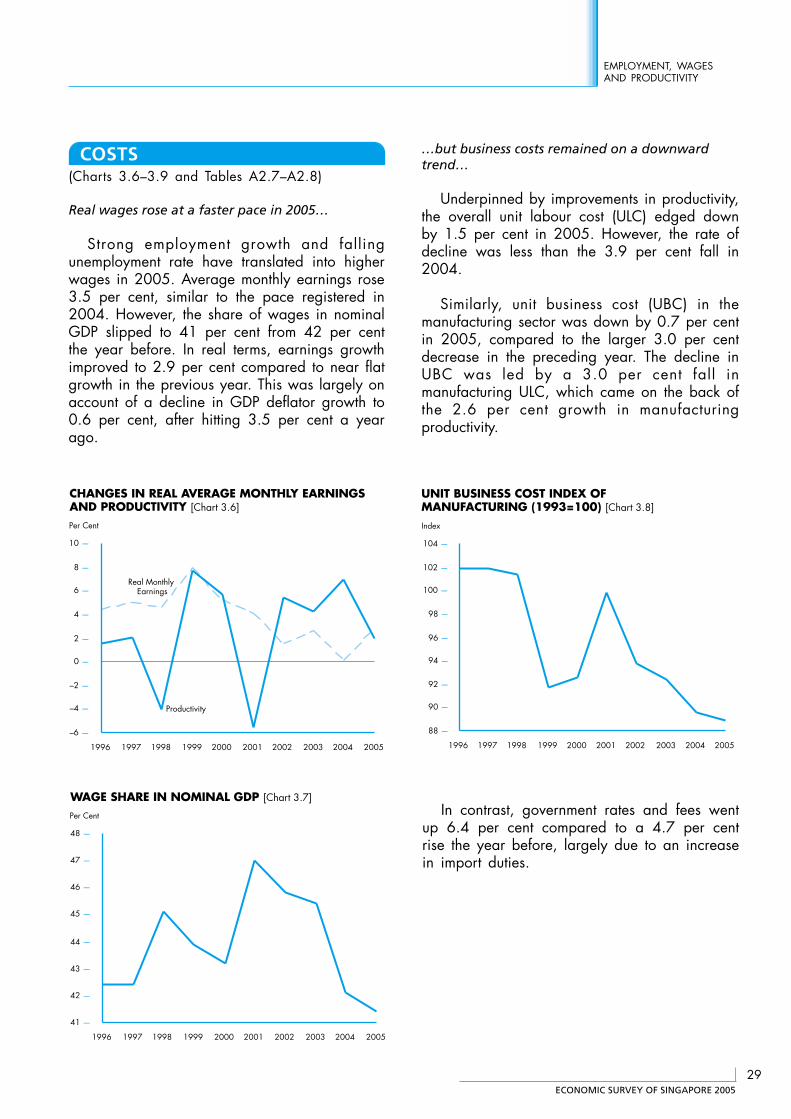
Real wages rose at a faster pace in 2005…
Strong employment growth and fallingunemployment rate have translated into higherwages in 2005. Average monthly earnings rose3.5 per cent, similar to the pace registered in2004. However, the share of wages in nominalGDP slipped to 41 per cent from 42 per centthe year before. In real terms, earnings growthimproved to 2.9 per cent compared to near flatgrowth in the previous year. This was largely onaccount of a decline in GDP deflator growth to0.6 per cent, after hitting 3.5 per cent a yearago.
…but business costs remained on a downwardtrend…
Underpinned by improvements in productivity,the overall unit labour cost (ULC) edged downby 1.5 per cent in 2005. However, the rate ofdecline was less than the 3.9 per cent fall in2004.
Similarly, unit business cost (UBC) in themanufacturing sector was down by 0.7 per centin 2005, compared to the larger 3.0 per centdecrease in the preceding year. The decline inUBC was led by a 3.0 per cent fall inmanufacturing ULC, which came on the back ofthe 2.6 per cent growth in manufacturingproductivity.
CHANGES IN REAL AVERAGE MONTHLY EARNINGSAND PRODUCTIVITY [Chart 3.6]
–6 —
–4 —
–2 —
0 —
2 —
4 —
6 —
8 —
10 —
1996 1997 1998 1999 2000 2001 2002 2003 2004 2005
Per Cent
Productivity
Real Monthly Earnings
WAGE SHARE IN NOMINAL GDP [Chart 3.7]
41 —
42 —
43 —
44 —
45 —
46 —
47 —
48 —
1996 1997 1998 1999 2000 2001 2002 2003 2004 2005
Per Cent
UNIT BUSINESS COST INDEX OFMANUFACTURING (1993=100) [Chart 3.8]
88 —
90 —
92 —
94 —
96 —
98 —
100 —
102 —
104 —
1996 1997 1998 1999 2000 2001 2002 2003 2004 2005
Index
In contrast, government rates and fees wentup 6.4 per cent compared to a 4.7 per centrise the year before, largely due to an increasein import duties.
ECONOMIC SURVEY OF SINGAPORE 2005
30
Chapter 3
EMPLOYMENT, WAGES AND PRODUCTIVITY
Higher oil prices and recovery in the domesticproperty market have led to increases in utilitiesand rental costs. As a result, services cost wasalso higher, rising by 0.5 per cent compared tothe 0.1 per cent decrease in 2004. Costs oftrade and transportation, interest and financialservices and telecommunications remainedgenerally unchanged from the previous year.
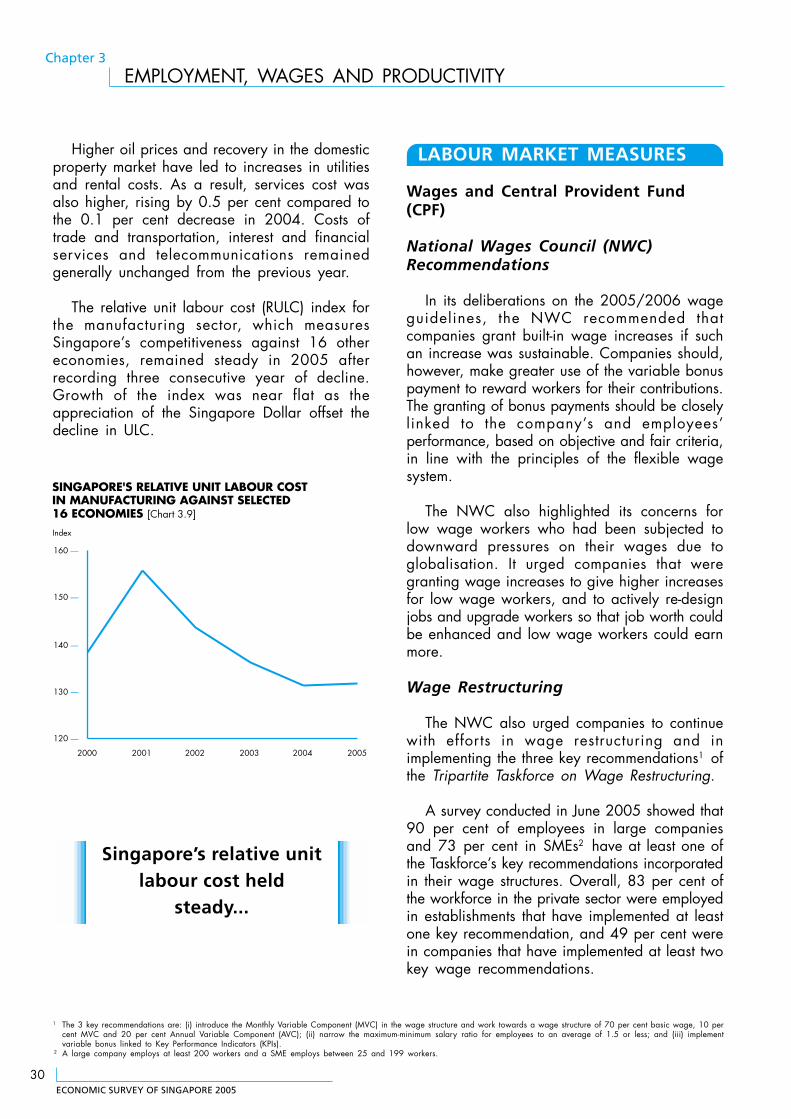
The relative unit labour cost (RULC) index forthe manufacturing sector, which measuresSingapore’s competitiveness against 16 othereconomies, remained steady in 2005 afterrecording three consecutive year of decline.Growth of the index was near flat as theappreciation of the Singapore Dollar offset thedecline in ULC.
LABOUR MARKET MEASURES
Wages and Central Provident Fund(CPF)
National Wages Council (NWC)Recommendations
In its deliberations on the 2005/2006 wageguidelines, the NWC recommended thatcompanies grant built-in wage increases if suchan increase was sustainable. Companies should,however, make greater use of the variable bonuspayment to reward workers for their contributions.The granting of bonus payments should be closelylinked to the company’s and employees’performance, based on objective and fair criteria,in line with the principles of the flexible wagesystem.
The NWC also highlighted its concerns forlow wage workers who had been subjected todownward pressures on their wages due toglobalisation. It urged companies that weregranting wage increases to give higher increasesfor low wage workers, and to actively re-designjobs and upgrade workers so that job worth couldbe enhanced and low wage workers could earnmore.
Wage Restructuring
The NWC also urged companies to continuewith efforts in wage restructuring and inimplementing the three key recommendations1 ofthe Tripartite Taskforce on Wage Restructuring.
A survey conducted in June 2005 showed that90 per cent of employees in large companiesand 73 per cent in SMEs2 have at least one ofthe Taskforce’s key recommendations incorporatedin their wage structures. Overall, 83 per cent ofthe workforce in the private sector were employedin establishments that have implemented at leastone key recommendation, and 49 per cent werein companies that have implemented at least twokey wage recommendations.
SINGAPORE'S RELATIVE UNIT LABOUR COST IN MANUFACTURING AGAINST SELECTED 16 ECONOMIES [Chart 3.9]
120 —
130 —
140 —
150 —
160 —
2000 2001 2002 2003 2004 2005
Index
1 The 3 key recommendations are: (i) introduce the Monthly Variable Component (MVC) in the wage structure and work towards a wage structure of 70 per cent basic wage, 10 percent MVC and 20 per cent Annual Variable Component (AVC); (ii) narrow the maximum-minimum salary ratio for employees to an average of 1.5 or less; and (iii) implementvariable bonus linked to Key Performance Indicators (KPIs).
2 A large company employs at least 200 workers and a SME employs between 25 and 199 workers.
Singapore’s relative unitlabour cost held
steady...
ECONOMIC SURVEY OF SINGAPORE 2005
31
EMPLOYMENT, WAGESAND PRODUCTIVITY
CPF Changes
In 2003, the Government announced changesto the CPF salary ceiling and contribution rates,to be implemented over a 2-year period – 2005to 2006.
The salary ceiling for contributions fromemployees and employers was lowered from$5,500 to $5,000 with effect from 1 January2005. It was further lowered to $4,500 on 1January 2006, bringing the salary ceiling to thetargeted level of income earners at the 80th
percentile.
To help the employability of older workers,the CPF contribution rate for workers agedbetween 50 and 55 was also reduced from 33to 30 per cent on 1 January 2005, and to 27per cent on 1 January 2006.
Labour Market Developments
Workforce Skills Qualifications System(WSQ)
The Workforce Skills Qualifications (WSQ)system was launched in October 2005. It is anational skills and qualifications framework forworkers to upgrade their skills to remainemployable and competitive. The system sets outthe training and certification pathways for workersto enhance their skills. It will also help companiesto plan for the upgrading of their workers.
With WSQ, workers will benefit from betterstructured and competency-based training,industry recognised qualifications and accreditedtraining providers. This will help our workersprogress better in their jobs or to switch to newjobs.
Low Wage Workers
Even as Singapore’s economy continues togrow and provide enough jobs for Singaporeans,workers who do not upgrade their skills will facesignificant challenges. They are vulnerable tostructural unemployment and downward wagepressures from lower-cost workers in emergingeconomies like China, India and Eastern Europe.
The Ministerial Committee on Low WageWorkers was set up in July 2005 to identifysustainable solutions to help low wageSingaporean workers adjust to these challenges.The Committee proposed a $1 billion Workfarepackage to help low wage workers findmeaningful jobs, earn adequate wages to supportthemselves and their families so that they canown their own homes, educate their children andprepare for their medical and retirement needs.The Workfare package included broad measuresin the following areas:
(i) Providing incentives to reward workthrough a Workfare Bonus;
(ii) Providing needy families with enhancedcare-giving assistance and casemanagement;
(iii) Increasing opportunities for low-wageworkers to upgrade their skills for betterpaying jobs;
(iv) Creating more job opportunities byaccelerating job re-creation efforts anddeveloping more employment opportunitiesin the informal sector for low wageworkers to supplement their income;
(v) Providing support to children from lowerincome families to complete theireducation, learn employable skills andmaximise their potential; and
(vi) Continue the Government’s efforts insurplus sharing to the low income whenthe economy is doing well.
ECONOMIC SURVEY OF SINGAPORE 2005
32
Chapter 3
EMPLOYMENT, WAGES AND PRODUCTIVITY
Employability of Older Workers
With falling birth rates and rising lifeexpectancy, Singapore’s population andworkforce will grow older. Older workers willneed to stay in the labour force longer. Theyalso need to work longer and save more toensure that they can continue to supportthemselves in their old age.
The Tripartite Committee on Employability ofOlder Workers comprising representatives fromthe employers, unions and the Government wasformed in March 2005 to forge a tripartiteconsensus on how the employability and costcompetitiveness of our older workers could beenhanced. The Committee released its interimreport on 26 January 2006.
A key recommendation is the ADVANTAGE!scheme, a comprehensive package of incentivesof up to $300,000 per company to motivateand enable employers to hire older workers andto re-employ them beyond the age of 62 years.ADVANTAGE! comprises four components ofassistance: (i) Job Redesign Grant; (ii) Traininggrants; (iii) Placement Services; and (iv) Retentionincentives.
Foreign Manpower
Changes in Skilled Foreign WorkerLevy
The skilled foreign worker levy was reducedin 1998 and again in 1999 to help companiestide over the economic downturn. With arecovering economy, the Ministry of Manpower(MOM) has progressively raised the skilledforeign worker levy, from $50 to $80 with effectfrom 1 July 2005, and to $100 with effect from1 January 2006. The increases applied to skilledforeign workers across all sectors. The increasewas staggered over 2 stages to give companiestime to make the necessary adjustments.
Greater Flexibility in Manufacturingand Services Sectors
Business cycles have become less predictable,and companies need greater flexibility to takeadvantage of new opportunities quickly. Somemay need more foreign workers whenSingaporeans cannot be immediately found to fillvacancies.
From 1 July 2005, MOM has allowedcompanies in the manufacturing and servicessectors greater access to work permit holders,up to 10 per cent above their prevailingDependency Ceilings (DC). To ensure judicioususage, a higher levy of $500 applies for everyadditional foreign worker (skilled or unskilled)above the prevailing 50 per cent DC orDependency Ratio (DR) of 1 local worker: 1 workpermit holder for manufacturing and 30 per centDC or DR of 7:3 for services.
Raising Skills Standard and Easing ofRules in Construction Sector
To further raise the productivity and enhancesafety in the construction sector, MOM has from1 December 2005 required every Non-TraditionalSource (NTS) construction worker to obtain atleast a Skills Evaluation Certificate (SEC) or SEC(Knowledge) before they are allowed to work inSingapore. These skills tests ensure that foreignworkers in the construction industry meet aminimum standard.
To help the construction sector retainexperienced workers and facilitate the efficientallocation of foreign workers within the industry,MOM has from 1 April 2005 allowed theindustry to renew work permits of experiencedforeign workers and to change employers for theremaining permit validity periods without meetingthe Man Year Entitlement (MYE) requirement. Italso extended the expiry date of the MYEs tothe end of a project and allowed temporary cross-deployment of foreign workers betweencontractors.
ECONOMIC SURVEY OF SINGAPORE 2005
33
EMPLOYMENT, WAGESAND PRODUCTIVITY
Reduction in Foreign Domestic Worker(FDW) Levy Rate
The monthly foreign domestic worker (FDW)levy was reduced by $50 with effect from 1 April2005. Families which previously paid either thestandard FDW levy rate of $345 or theconcessionary rate of $250 now pay a lowermonthly levy of $295 or $200 respectively. Toattract better quality workers, employers shouldbe prepared to pay higher salaries and the FDWlevy reduction would help them do so. Thiscomplemented other recent measures3 to raisethe quality of FDWs in Singapore.
Contributed by:
Puah Kok KeongEconomistEconomics and Strategy DivisionMinistry of Trade and Industry
Tan Yih BinDeputy DirectorManpower Research and Statistics DepartmentMinistry of Manpower
Manpower Planning and Policy DivisionMinistry of Manpower
3 Effective 1 April 2005, all new FDWs (i.e. those who have not worked in Singapore before) must be at least 23 years of age, have a minimum 8 years of formaleducation and pass a written entry test before they are allowed to work in Singapore.
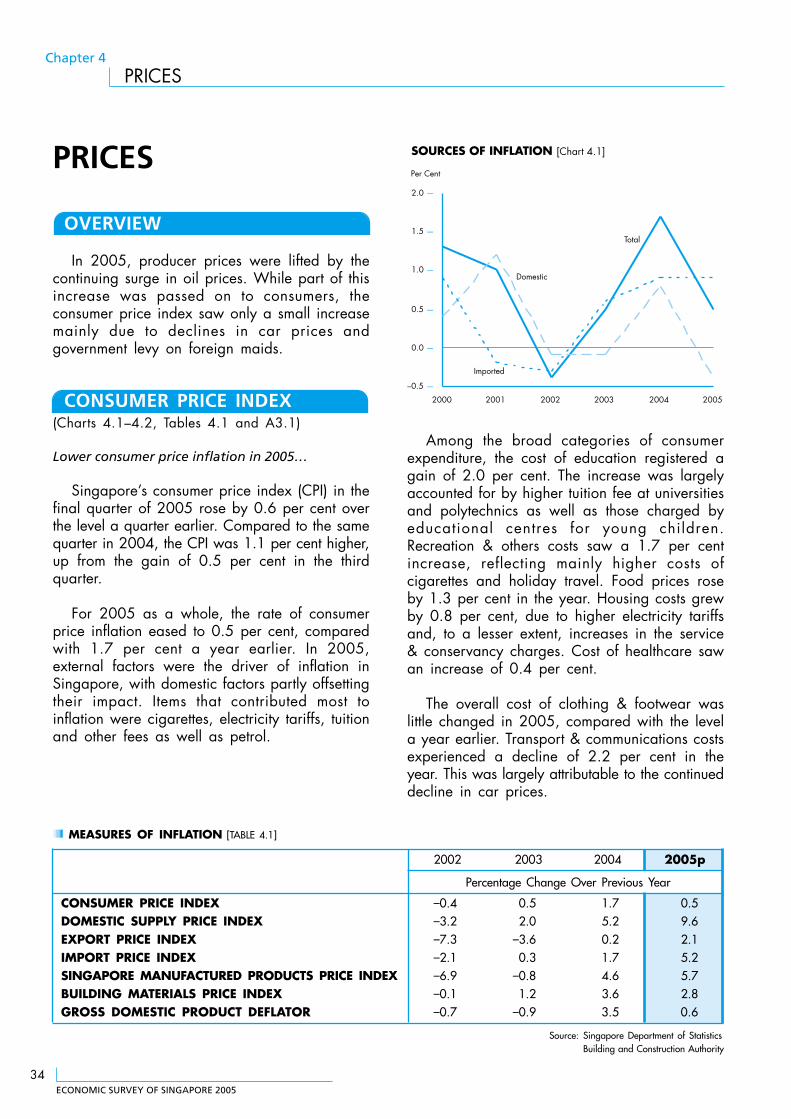
ECONOMIC SURVEY OF SINGAPORE 2005
34
Chapter 4
PRICES
PRICES
OVERVIEW
In 2005, producer prices were lifted by thecontinuing surge in oil prices. While part of thisincrease was passed on to consumers, theconsumer price index saw only a small increasemainly due to declines in car prices andgovernment levy on foreign maids.
CONSUMER PRICE INDEX(Charts 4.1–4.2, Tables 4.1 and A3.1)
Lower consumer price inflation in 2005…
Singapore’s consumer price index (CPI) in thefinal quarter of 2005 rose by 0.6 per cent overthe level a quarter earlier. Compared to the samequarter in 2004, the CPI was 1.1 per cent higher,up from the gain of 0.5 per cent in the thirdquarter.
For 2005 as a whole, the rate of consumerprice inflation eased to 0.5 per cent, comparedwith 1.7 per cent a year earlier. In 2005,external factors were the driver of inflation inSingapore, with domestic factors partly offsettingtheir impact. Items that contributed most toinflation were cigarettes, electricity tariffs, tuitionand other fees as well as petrol.
MEASURES OF INFLATION [TABLE 4.1]
2002 2003 2004 2005p
Percentage Change Over Previous Year
CONSUMER PRICE INDEX –0.4 0.5 1.7 0.5DOMESTIC SUPPLY PRICE INDEX –3.2 2.0 5.2 9.6EXPORT PRICE INDEX –7.3 –3.6 0.2 2.1IMPORT PRICE INDEX –2.1 0.3 1.7 5.2SINGAPORE MANUFACTURED PRODUCTS PRICE INDEX –6.9 –0.8 4.6 5.7BUILDING MATERIALS PRICE INDEX –0.1 1.2 3.6 2.8GROSS DOMESTIC PRODUCT DEFLATOR –0.7 –0.9 3.5 0.6
Source: Singapore Department of StatisticsBuilding and Construction Authority
Among the broad categories of consumerexpenditure, the cost of education registered again of 2.0 per cent. The increase was largelyaccounted for by higher tuition fee at universitiesand polytechnics as well as those charged byeducational centres for young children.Recreation & others costs saw a 1.7 per centincrease, reflecting mainly higher costs ofcigarettes and holiday travel. Food prices roseby 1.3 per cent in the year. Housing costs grewby 0.8 per cent, due to higher electricity tariffsand, to a lesser extent, increases in the service& conservancy charges. Cost of healthcare sawan increase of 0.4 per cent.
The overall cost of clothing & footwear waslittle changed in 2005, compared with the levela year earlier. Transport & communications costsexperienced a decline of 2.2 per cent in theyear. This was largely attributable to the continueddecline in car prices.
–0.5 —
0.0 —
0.5 —
1.0 —
1.5 —
2.0 —
2000 2001 2002 2003 2004 2005
Domestic
Total
Imported
Per Cent
SOURCES OF INFLATION [Chart 4.1]
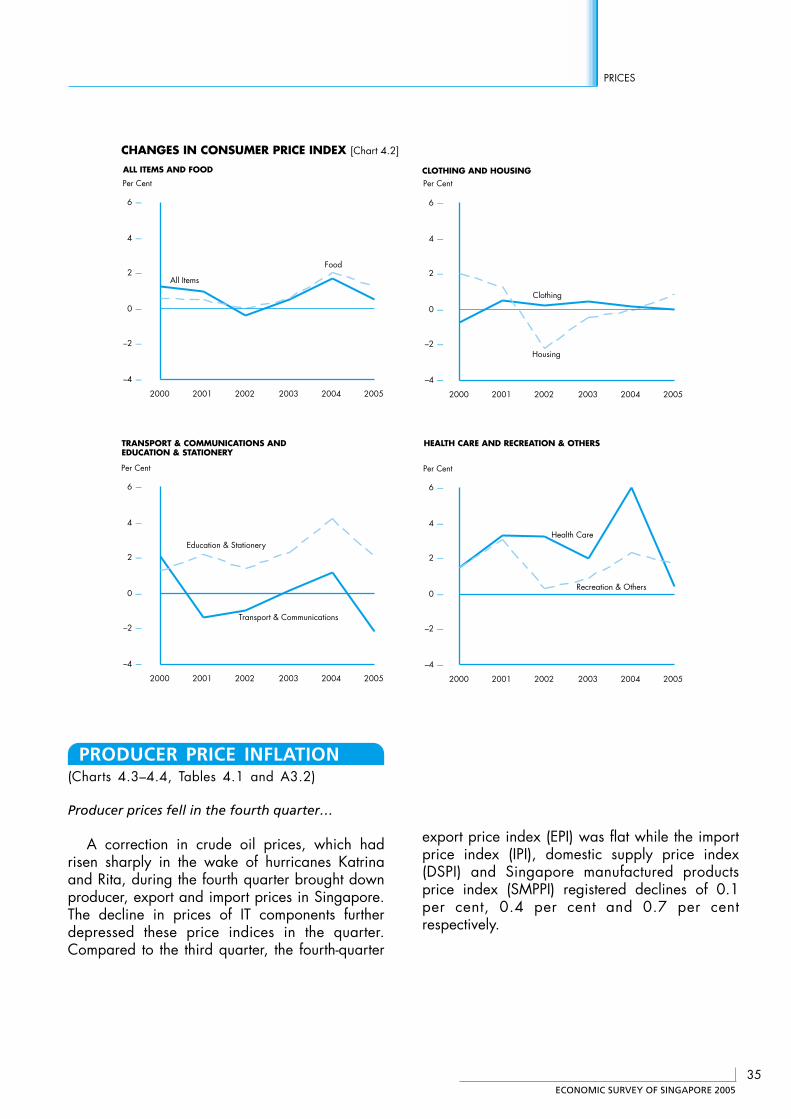
ECONOMIC SURVEY OF SINGAPORE 2005
35
PRICES
PRODUCER PRICE INFLATION(Charts 4.3–4.4, Tables 4.1 and A3.2)
Producer prices fell in the fourth quarter…
A correction in crude oil prices, which hadrisen sharply in the wake of hurricanes Katrinaand Rita, during the fourth quarter brought downproducer, export and import prices in Singapore.The decline in prices of IT components furtherdepressed these price indices in the quarter.Compared to the third quarter, the fourth-quarter
export price index (EPI) was flat while the importprice index (IPI), domestic supply price index(DSPI) and Singapore manufactured productsprice index (SMPPI) registered declines of 0.1per cent, 0.4 per cent and 0.7 per centrespectively.
CHANGES IN CONSUMER PRICE INDEX [Chart 4.2]
Per CentCLOTHING AND HOUSING
–4 —
–2 —
0 —
2 —
4 —
6 —
2000 2001 2002 2003 2004 2005
Per Cent
ALL ITEMS AND FOOD
Food
All Items
–4 —
–2 —
0 —
2 —
4 —
6 —
2000 2001 2002 2003 2004 2005
Per Cent
TRANSPORT & COMMUNICATIONS AND EDUCATION & STATIONERY
Education & Stationery
Transport & Communications
–4 —
–2 —
0 —
2 —
4 —
6 —
2000 2001 2002 2003 2004 2005
Housing
Clothing
–4 —
–2 —
0 —
2 —
4 —
6 —
2000 2001 2002 2003 2004 2005
Per Cent
HEALTH CARE AND RECREATION & OTHERS
Health Care
Recreation & Others
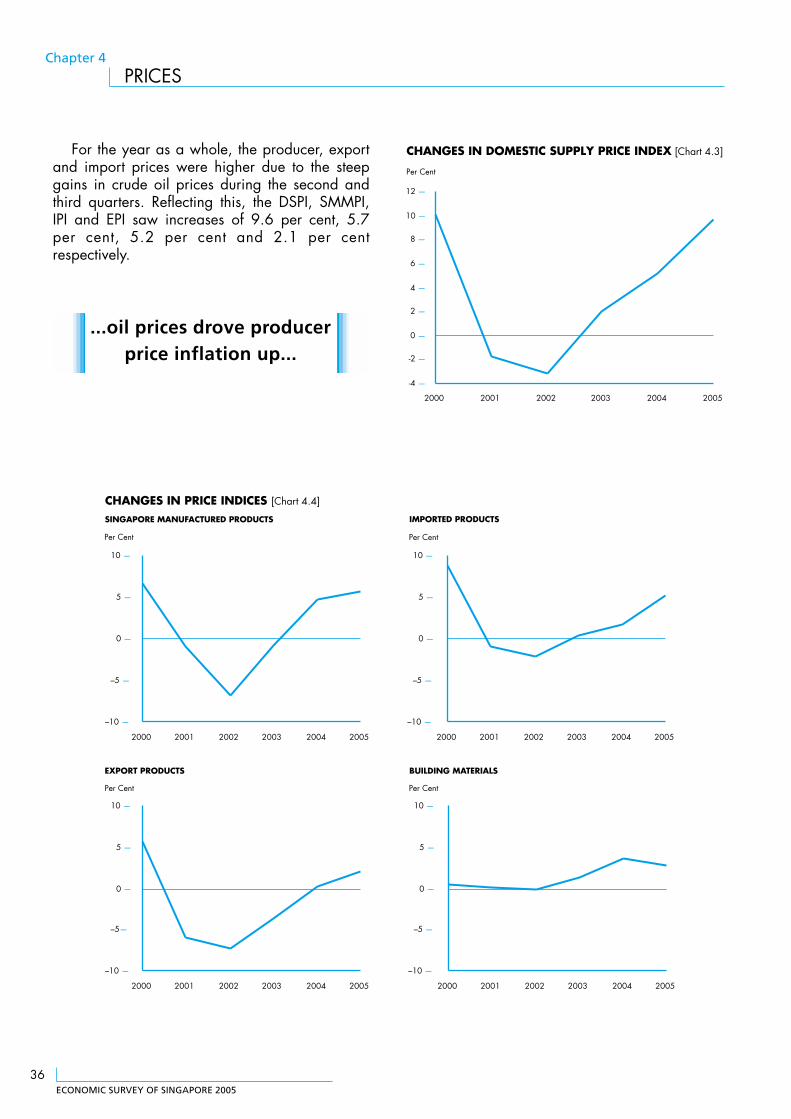
ECONOMIC SURVEY OF SINGAPORE 2005
36
Chapter 4
PRICES
For the year as a whole, the producer, exportand import prices were higher due to the steepgains in crude oil prices during the second andthird quarters. Reflecting this, the DSPI, SMMPI,IPI and EPI saw increases of 9.6 per cent, 5.7per cent, 5.2 per cent and 2.1 per centrespectively.
-4 —
-2 —
0 —
2 —
4 —
6 —
8 —
10 —
12 —
2000 2001 2002 2003 2004 2005
CHANGES IN DOMESTIC SUPPLY PRICE INDEX [Chart 4.3]
Per Cent
...oil prices drove producerprice inflation up...
–10 —
–5—
0 —
5 —
10 —
2000 2001 2002 2003 2004 2005
CHANGES IN PRICE INDICES [Chart 4.4]
Per Cent
IMPORTED PRODUCTS
–10 —
–5 —
0 —
5 —
10 —
2000 2001 2002 2003 2004 2005
Per Cent
SINGAPORE MANUFACTURED PRODUCTS
Per Cent
EXPORT PRODUCTS
Per Cent
BUILDING MATERIALS
–10 —
–5 —
0 —
5 —
10 —
2000 2001 2002 2003 2004 2005
–10 —
–5 —
0 —
5 —
10 —
2000 2001 2002 2003 2004 2005
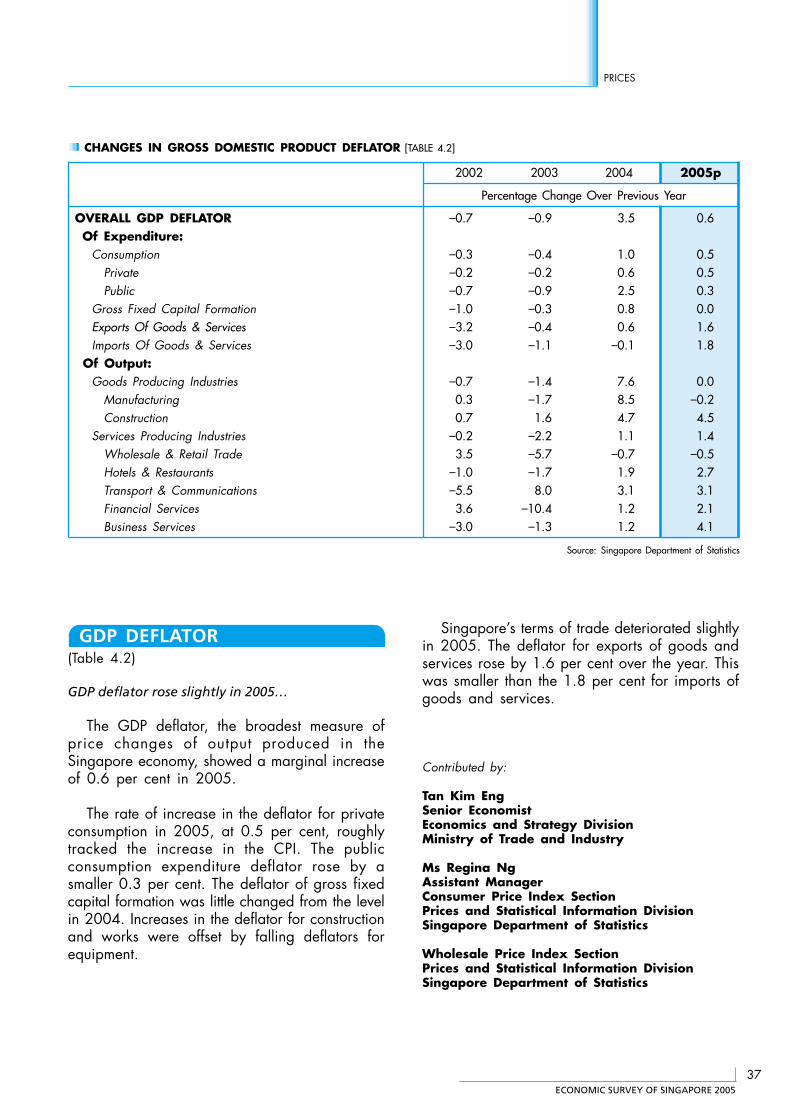
ECONOMIC SURVEY OF SINGAPORE 2005
37
PRICES
GDP DEFLATOR(Table 4.2)
GDP deflator rose slightly in 2005…
The GDP deflator, the broadest measure ofprice changes of output produced in theSingapore economy, showed a marginal increaseof 0.6 per cent in 2005.
The rate of increase in the deflator for privateconsumption in 2005, at 0.5 per cent, roughlytracked the increase in the CPI. The publicconsumption expenditure deflator rose by asmaller 0.3 per cent. The deflator of gross fixedcapital formation was little changed from the levelin 2004. Increases in the deflator for constructionand works were offset by falling deflators forequipment.
Singapore’s terms of trade deteriorated slightlyin 2005. The deflator for exports of goods andservices rose by 1.6 per cent over the year. Thiswas smaller than the 1.8 per cent for imports ofgoods and services.
Contributed by:
Tan Kim EngSenior EconomistEconomics and Strategy DivisionMinistry of Trade and Industry
Ms Regina NgAssistant ManagerConsumer Price Index SectionPrices and Statistical Information DivisionSingapore Department of Statistics
Wholesale Price Index SectionPrices and Statistical Information DivisionSingapore Department of Statistics
CHANGES IN GROSS DOMESTIC PRODUCT DEFLATOR [TABLE 4.2]
2002 2003 2004 2005p
Percentage Change Over Previous Year
OVERALL GDP DEFLATOR –0.7 –0.9 3.5 0.6Of Expenditure:
Consumption –0.3 –0.4 1.0 0.5Private –0.2 –0.2 0.6 0.5Public –0.7 –0.9 2.5 0.3
Gross Fixed Capital Formation –1.0 –0.3 0.8 0.0Exports Of Goods & Services –3.2 –0.4 0.6 1.6Imports Of Goods & Services –3.0 –1.1 –0.1 1.8
Of Output:Goods Producing Industries –0.7 –1.4 7.6 0.0
Manufacturing 0.3 –1.7 8.5 –0.2Construction 0.7 1.6 4.7 4.5
Services Producing Industries –0.2 –2.2 1.1 1.4Wholesale & Retail Trade 3.5 –5.7 –0.7 –0.5Hotels & Restaurants –1.0 –1.7 1.9 2.7Transport & Communications –5.5 8.0 3.1 3.1Financial Services 3.6 –10.4 1.2 2.1Business Services –3.0 –1.3 1.2 4.1
Source: Singapore Department of Statistics
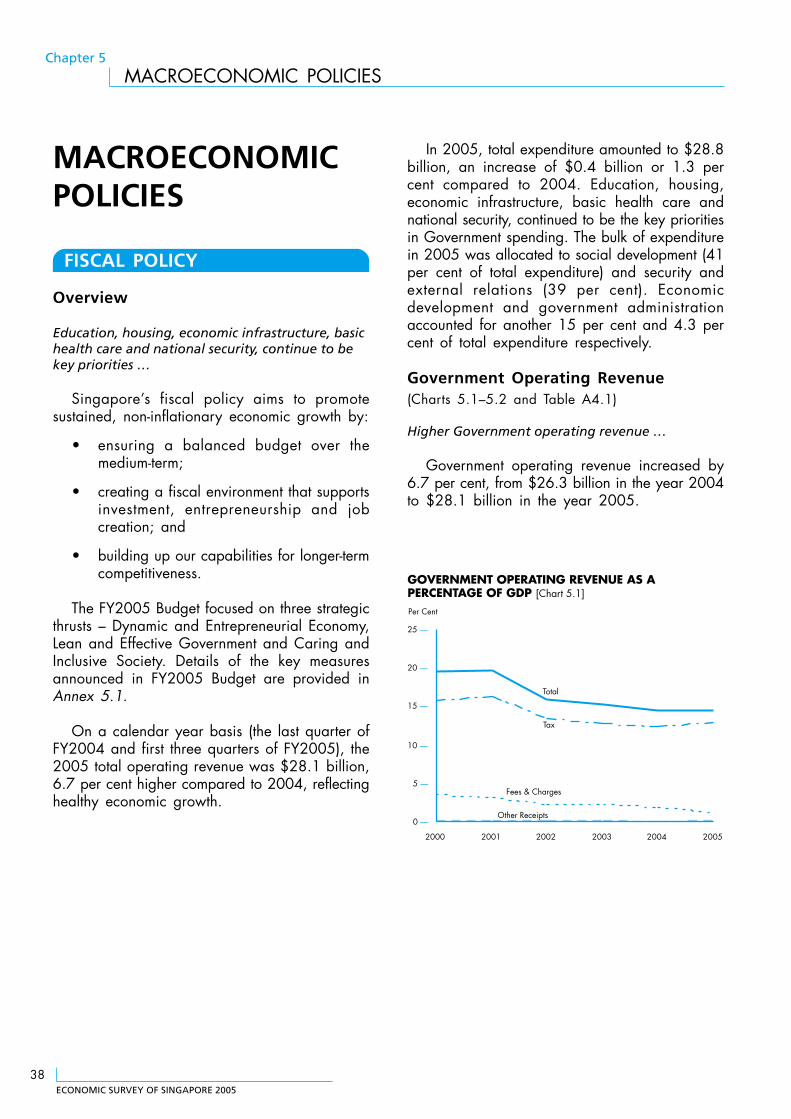
ECONOMIC SURVEY OF SINGAPORE 2005
38
Chapter 5
MACROECONOMIC POLICIES
MACROECONOMICPOLICIES
FISCAL POLICY
Overview
Education, housing, economic infrastructure, basichealth care and national security, continue to bekey priorities …
Singapore’s fiscal policy aims to promotesustained, non-inflationary economic growth by:
• ensuring a balanced budget over themedium-term;
• creating a fiscal environment that supportsinvestment, entrepreneurship and jobcreation; and
• building up our capabilities for longer-termcompetitiveness.
The FY2005 Budget focused on three strategicthrusts – Dynamic and Entrepreneurial Economy,Lean and Effective Government and Caring andInclusive Society. Details of the key measuresannounced in FY2005 Budget are provided inAnnex 5.1.
On a calendar year basis (the last quarter ofFY2004 and first three quarters of FY2005), the2005 total operating revenue was $28.1 billion,6.7 per cent higher compared to 2004, reflectinghealthy economic growth.
In 2005, total expenditure amounted to $28.8billion, an increase of $0.4 billion or 1.3 percent compared to 2004. Education, housing,economic infrastructure, basic health care andnational security, continued to be the key prioritiesin Government spending. The bulk of expenditurein 2005 was allocated to social development (41per cent of total expenditure) and security andexternal relations (39 per cent). Economicdevelopment and government administrationaccounted for another 15 per cent and 4.3 percent of total expenditure respectively.
Government Operating Revenue(Charts 5.1–5.2 and Table A4.1)
Higher Government operating revenue …
Government operating revenue increased by6.7 per cent, from $26.3 billion in the year 2004to $28.1 billion in the year 2005.
0 —
5 —
10 —
15 —
20 —
25 —
2000 2001 2002 2003 2004 2005
GOVERNMENT OPERATING REVENUE AS APERCENTAGE OF GDP [Chart 5.1]
Per Cent
Other Receipts
Fees & Charges
Total
Tax
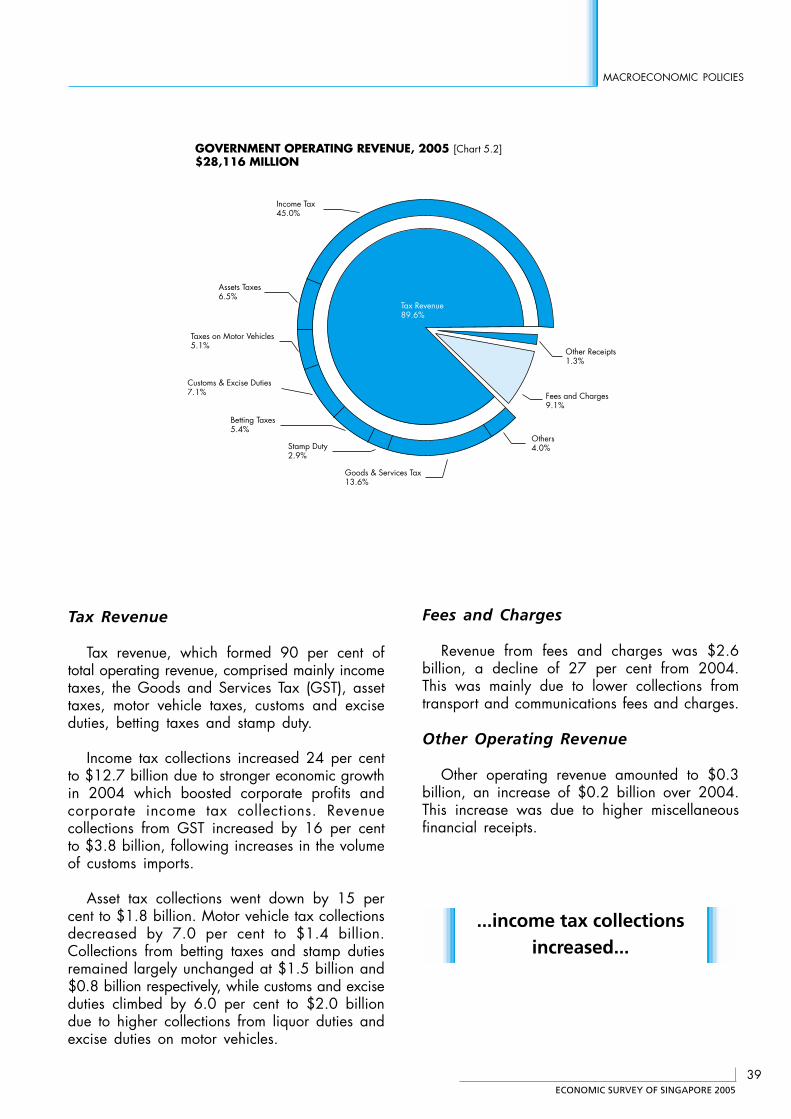
ECONOMIC SURVEY OF SINGAPORE 2005
39
MACROECONOMIC POLICIES
Tax Revenue
Tax revenue, which formed 90 per cent oftotal operating revenue, comprised mainly incometaxes, the Goods and Services Tax (GST), assettaxes, motor vehicle taxes, customs and exciseduties, betting taxes and stamp duty.
Income tax collections increased 24 per centto $12.7 billion due to stronger economic growthin 2004 which boosted corporate profits andcorporate income tax collections. Revenuecollections from GST increased by 16 per centto $3.8 billion, following increases in the volumeof customs imports.
Asset tax collections went down by 15 percent to $1.8 billion. Motor vehicle tax collectionsdecreased by 7.0 per cent to $1.4 billion.Collections from betting taxes and stamp dutiesremained largely unchanged at $1.5 billion and$0.8 billion respectively, while customs and exciseduties climbed by 6.0 per cent to $2.0 billiondue to higher collections from liquor duties andexcise duties on motor vehicles.
Fees and Charges
Revenue from fees and charges was $2.6billion, a decline of 27 per cent from 2004.This was mainly due to lower collections fromtransport and communications fees and charges.
Other Operating Revenue
Other operating revenue amounted to $0.3billion, an increase of $0.2 billion over 2004.This increase was due to higher miscellaneousfinancial receipts.
GOVERNMENT OPERATING REVENUE, 2005 [Chart 5.2]$28,116 MILLION
Assets Taxes6.5%
Taxes on Motor Vehicles 5.1%
Customs & Excise Duties7.1%
Betting Taxes5.4%
Stamp Duty2.9%
Others4.0%
Goods & Services Tax13.6%
Income Tax 45.0%
Other Receipts1.3%
Tax Revenue89.6%
Fees and Charges9.1%
...income tax collectionsincreased...
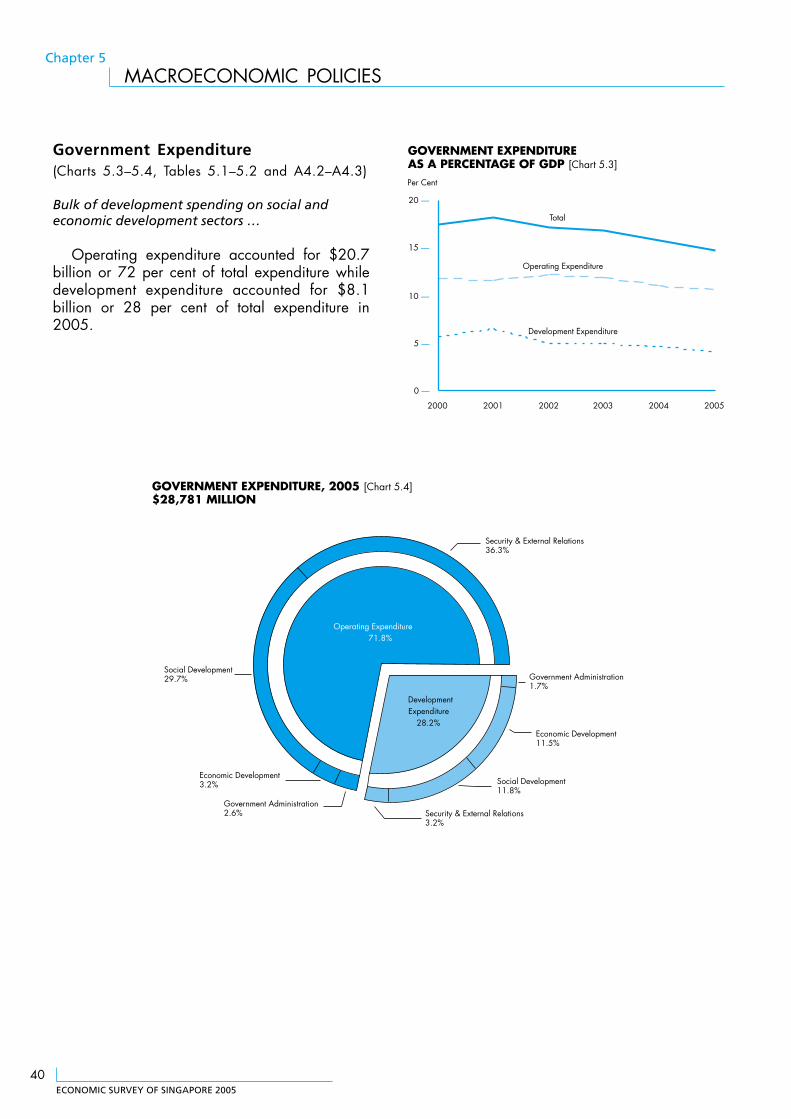
ECONOMIC SURVEY OF SINGAPORE 2005
40
Chapter 5
MACROECONOMIC POLICIES
Government Expenditure(Charts 5.3–5.4, Tables 5.1–5.2 and A4.2–A4.3)
Bulk of development spending on social andeconomic development sectors …
Operating expenditure accounted for $20.7billion or 72 per cent of total expenditure whiledevelopment expenditure accounted for $8.1billion or 28 per cent of total expenditure in2005.
GOVERNMENT EXPENDITURE, 2005 [Chart 5.4]$28,781 MILLION
Social Development29.7%
Economic Development3.2%
Government Administration2.6% Security & External Relations
3.2%
Social Development11.8%
Economic Development11.5%
Government Administration1.7%
Security & External Relations36.3%
Operating Expenditure71.8%
DevelopmentExpenditure
28.2%
0 —
5 —
10 —
15 —
20 —
2000 2001 2002 2003 2004 2005
GOVERNMENT EXPENDITUREAS A PERCENTAGE OF GDP [Chart 5.3]
Per Cent
Development Expenditure
Total
Operating Expenditure
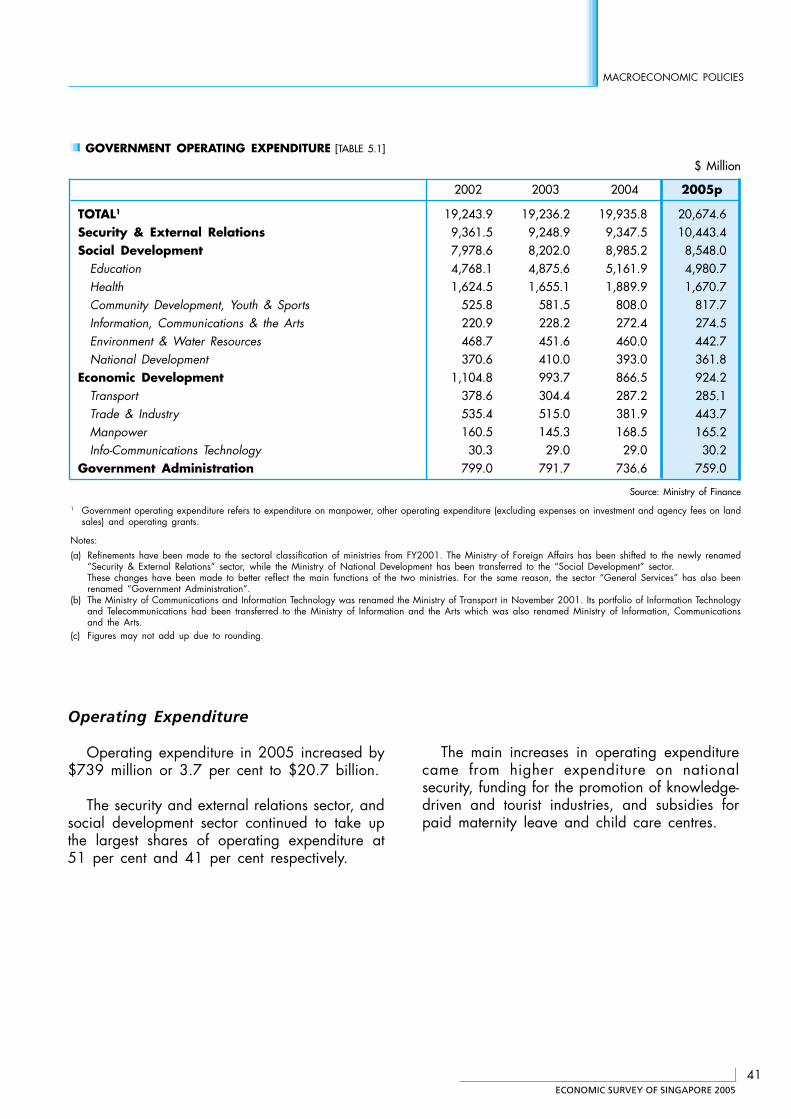
ECONOMIC SURVEY OF SINGAPORE 2005
41
MACROECONOMIC POLICIES
GOVERNMENT OPERATING EXPENDITURE [TABLE 5.1]
$ Million
2002 2003 2004 2005p
TOTAL1 19,243.9 19,236.2 19,935.8 20,674.6Security & External Relations 9,361.5 9,248.9 9,347.5 10,443.4Social Development 7,978.6 8,202.0 8,985.2 8,548.0
Education 4,768.1 4,875.6 5,161.9 4,980.7Health 1,624.5 1,655.1 1,889.9 1,670.7Community Development, Youth & Sports 525.8 581.5 808.0 817.7Information, Communications & the Arts 220.9 228.2 272.4 274.5Environment & Water Resources 468.7 451.6 460.0 442.7National Development 370.6 410.0 393.0 361.8
Economic Development 1,104.8 993.7 866.5 924.2Transport 378.6 304.4 287.2 285.1Trade & Industry 535.4 515.0 381.9 443.7Manpower 160.5 145.3 168.5 165.2Info-Communications Technology 30.3 29.0 29.0 30.2
Government Administration 799.0 791.7 736.6 759.0
Source: Ministry of Finance
1 Government operating expenditure refers to expenditure on manpower, other operating expenditure (excluding expenses on investment and agency fees on landsales) and operating grants.
Notes:(a) Refinements have been made to the sectoral classification of ministries from FY2001. The Ministry of Foreign Affairs has been shifted to the newly renamed
“Security & External Relations” sector, while the Ministry of National Development has been transferred to the “Social Development” sector.These changes have been made to better reflect the main functions of the two ministries. For the same reason, the sector “General Services” has also beenrenamed “Government Administration”.
(b) The Ministry of Communications and Information Technology was renamed the Ministry of Transport in November 2001. Its portfolio of Information Technologyand Telecommunications had been transferred to the Ministry of Information and the Arts which was also renamed Ministry of Information, Communicationsand the Arts.
(c) Figures may not add up due to rounding.
Operating Expenditure
Operating expenditure in 2005 increased by$739 million or 3.7 per cent to $20.7 billion.
The security and external relations sector, andsocial development sector continued to take upthe largest shares of operating expenditure at51 per cent and 41 per cent respectively.
The main increases in operating expenditurecame from higher expenditure on nationalsecurity, funding for the promotion of knowledge-driven and tourist industries, and subsidies forpaid maternity leave and child care centres.
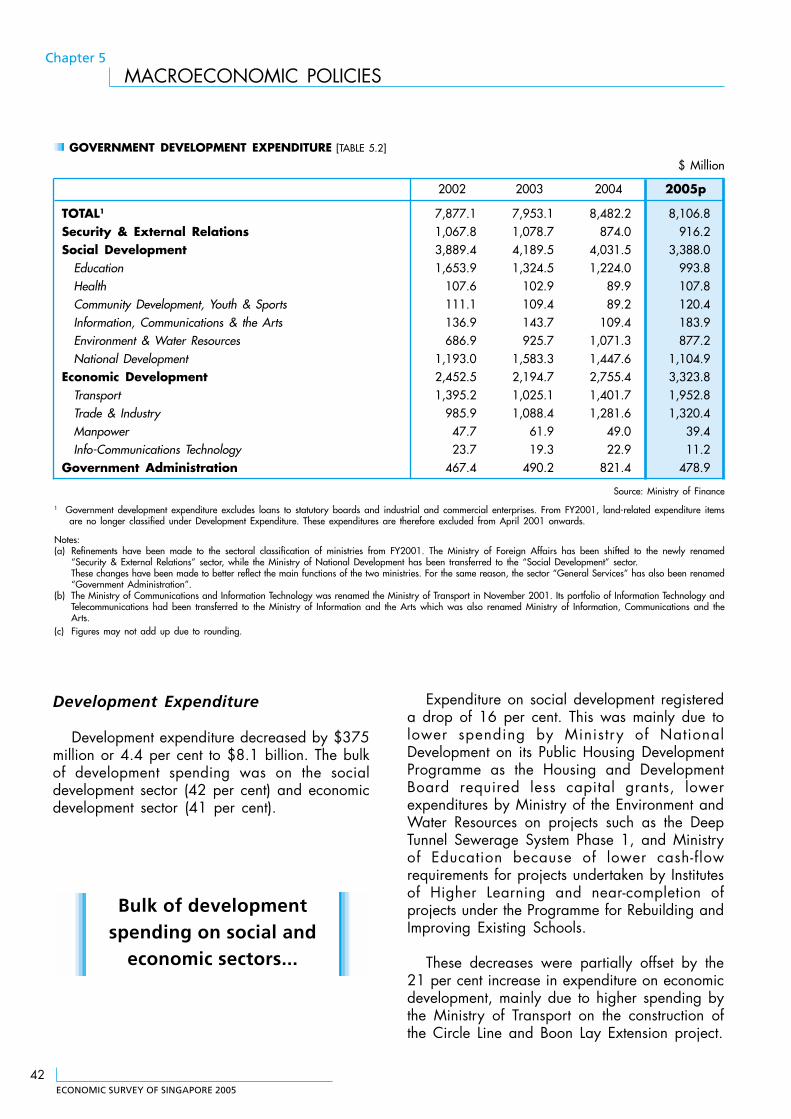
ECONOMIC SURVEY OF SINGAPORE 2005
42
Chapter 5
MACROECONOMIC POLICIES
GOVERNMENT DEVELOPMENT EXPENDITURE [TABLE 5.2]
$ Million
2002 2003 2004 2005p
TOTAL1 7,877.1 7,953.1 8,482.2 8,106.8Security & External Relations 1,067.8 1,078.7 874.0 916.2Social Development 3,889.4 4,189.5 4,031.5 3,388.0
Education 1,653.9 1,324.5 1,224.0 993.8Health 107.6 102.9 89.9 107.8Community Development, Youth & Sports 111.1 109.4 89.2 120.4Information, Communications & the Arts 136.9 143.7 109.4 183.9Environment & Water Resources 686.9 925.7 1,071.3 877.2National Development 1,193.0 1,583.3 1,447.6 1,104.9
Economic Development 2,452.5 2,194.7 2,755.4 3,323.8Transport 1,395.2 1,025.1 1,401.7 1,952.8Trade & Industry 985.9 1,088.4 1,281.6 1,320.4Manpower 47.7 61.9 49.0 39.4Info-Communications Technology 23.7 19.3 22.9 11.2
Government Administration 467.4 490.2 821.4 478.9
Source: Ministry of Finance
1 Government development expenditure excludes loans to statutory boards and industrial and commercial enterprises. From FY2001, land-related expenditure itemsare no longer classified under Development Expenditure. These expenditures are therefore excluded from April 2001 onwards.
Notes:(a) Refinements have been made to the sectoral classification of ministries from FY2001. The Ministry of Foreign Affairs has been shifted to the newly renamed
“Security & External Relations” sector, while the Ministry of National Development has been transferred to the “Social Development” sector.These changes have been made to better reflect the main functions of the two ministries. For the same reason, the sector “General Services” has also been renamed“Government Administration”.
(b) The Ministry of Communications and Information Technology was renamed the Ministry of Transport in November 2001. Its portfolio of Information Technology andTelecommunications had been transferred to the Ministry of Information and the Arts which was also renamed Ministry of Information, Communications and theArts.
(c) Figures may not add up due to rounding.
Bulk of developmentspending on social and
economic sectors...
Development Expenditure
Development expenditure decreased by $375million or 4.4 per cent to $8.1 billion. The bulkof development spending was on the socialdevelopment sector (42 per cent) and economicdevelopment sector (41 per cent).
Expenditure on social development registereda drop of 16 per cent. This was mainly due tolower spending by Ministry of NationalDevelopment on its Public Housing DevelopmentProgramme as the Housing and DevelopmentBoard required less capital grants, lowerexpenditures by Ministry of the Environment andWater Resources on projects such as the DeepTunnel Sewerage System Phase 1, and Ministryof Education because of lower cash-flowrequirements for projects undertaken by Institutesof Higher Learning and near-completion ofprojects under the Programme for Rebuilding andImproving Existing Schools.
These decreases were partially offset by the21 per cent increase in expenditure on economicdevelopment, mainly due to higher spending bythe Ministry of Transport on the construction ofthe Circle Line and Boon Lay Extension project.
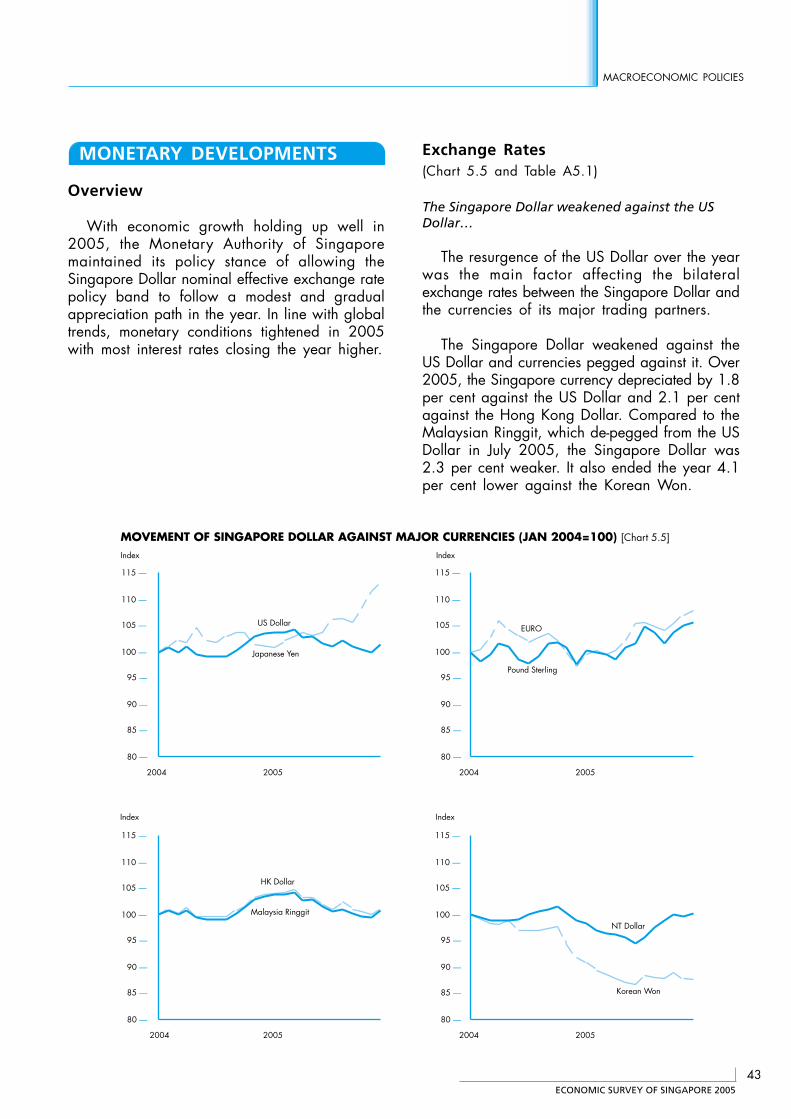
ECONOMIC SURVEY OF SINGAPORE 2005
43
MACROECONOMIC POLICIES
MONETARY DEVELOPMENTS
Overview
With economic growth holding up well in2005, the Monetary Authority of Singaporemaintained its policy stance of allowing theSingapore Dollar nominal effective exchange ratepolicy band to follow a modest and gradualappreciation path in the year. In line with globaltrends, monetary conditions tightened in 2005with most interest rates closing the year higher.
Exchange Rates(Chart 5.5 and Table A5.1)
The Singapore Dollar weakened against the USDollar…
The resurgence of the US Dollar over the yearwas the main factor affecting the bilateralexchange rates between the Singapore Dollar andthe currencies of its major trading partners.
The Singapore Dollar weakened against theUS Dollar and currencies pegged against it. Over2005, the Singapore currency depreciated by 1.8per cent against the US Dollar and 2.1 per centagainst the Hong Kong Dollar. Compared to theMalaysian Ringgit, which de-pegged from the USDollar in July 2005, the Singapore Dollar was2.3 per cent weaker. It also ended the year 4.1per cent lower against the Korean Won.
80 —
85 —
90 —
95 —
100 —
105 —
110 —
115 —
2004 2005
MOVEMENT OF SINGAPORE DOLLAR AGAINST MAJOR CURRENCIES (JAN 2004=100) [Chart 5.5]
80 —
85 —
90 —
95 —
100 —
105 —
110 —
115 —
2004 2005
Index
Index
80 —
85 —
90 —
95 —
100 —
105 —
110 —
115 —
2004 2005
80 —
85 —
90 —
95 —
100 —
105 —
110 —
115 —
2004 2005
US Dollar
Japanese Yen
Pound Sterling
EURO
Malaysia Ringgit
HK Dollar
NT Dollar
Korean Won
Index
Index
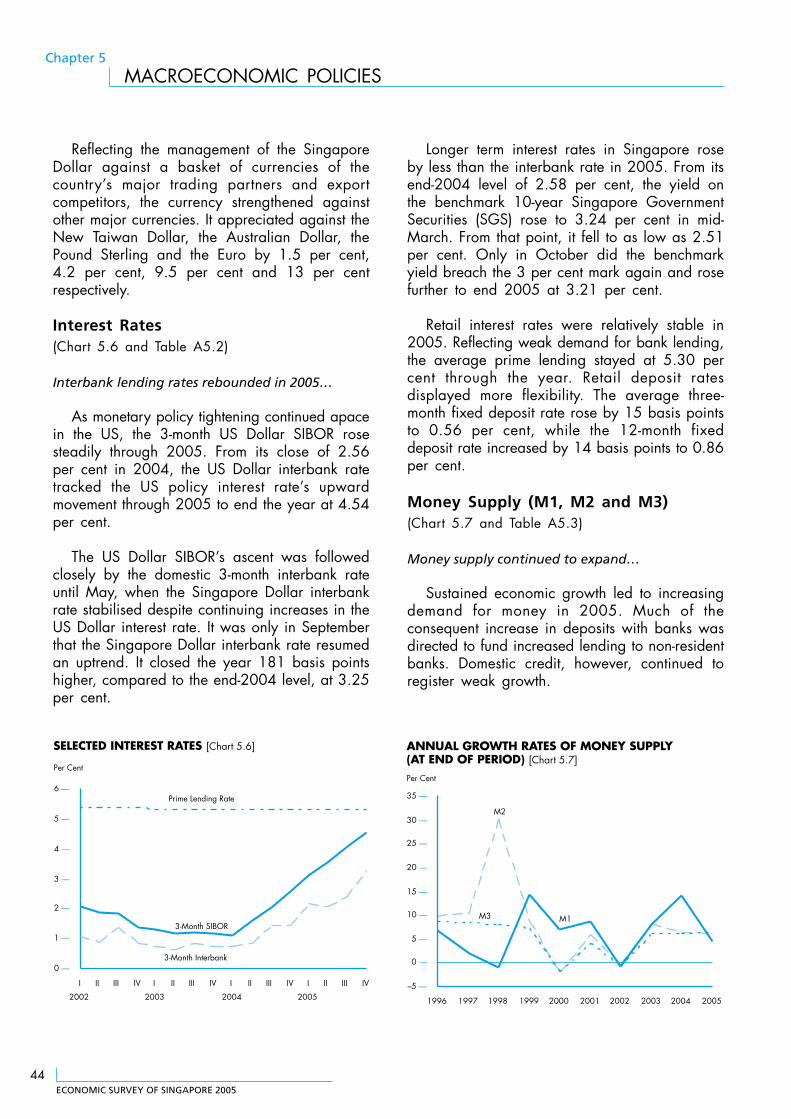
ECONOMIC SURVEY OF SINGAPORE 2005
44
Chapter 5
MACROECONOMIC POLICIES
Reflecting the management of the SingaporeDollar against a basket of currencies of thecountry’s major trading partners and exportcompetitors, the currency strengthened againstother major currencies. It appreciated against theNew Taiwan Dollar, the Australian Dollar, thePound Sterling and the Euro by 1.5 per cent,4.2 per cent, 9.5 per cent and 13 per centrespectively.
Interest Rates(Chart 5.6 and Table A5.2)
Interbank lending rates rebounded in 2005…
As monetary policy tightening continued apacein the US, the 3-month US Dollar SIBOR rosesteadily through 2005. From its close of 2.56per cent in 2004, the US Dollar interbank ratetracked the US policy interest rate’s upwardmovement through 2005 to end the year at 4.54per cent.
The US Dollar SIBOR’s ascent was followedclosely by the domestic 3-month interbank rateuntil May, when the Singapore Dollar interbankrate stabilised despite continuing increases in theUS Dollar interest rate. It was only in Septemberthat the Singapore Dollar interbank rate resumedan uptrend. It closed the year 181 basis pointshigher, compared to the end-2004 level, at 3.25per cent.
Longer term interest rates in Singapore roseby less than the interbank rate in 2005. From itsend-2004 level of 2.58 per cent, the yield onthe benchmark 10-year Singapore GovernmentSecurities (SGS) rose to 3.24 per cent in mid-March. From that point, it fell to as low as 2.51per cent. Only in October did the benchmarkyield breach the 3 per cent mark again and rosefurther to end 2005 at 3.21 per cent.
Retail interest rates were relatively stable in2005. Reflecting weak demand for bank lending,the average prime lending stayed at 5.30 percent through the year. Retail deposit ratesdisplayed more flexibility. The average three-month fixed deposit rate rose by 15 basis pointsto 0.56 per cent, while the 12-month fixeddeposit rate increased by 14 basis points to 0.86per cent.
Money Supply (M1, M2 and M3)(Chart 5.7 and Table A5.3)
Money supply continued to expand…
Sustained economic growth led to increasingdemand for money in 2005. Much of theconsequent increase in deposits with banks wasdirected to fund increased lending to non-residentbanks. Domestic credit, however, continued toregister weak growth.
SELECTED INTEREST RATES [Chart 5.6]
0 —
1 —
2 —
3 —
4 —
5 —
6 —
I
2002
II III IV I
2003
II III IV I
2004
II III IV I
2005
II III IV
Per Cent
3-Month SIBOR
3-Month Interbank
Prime Lending Rate
ANNUAL GROWTH RATES OF MONEY SUPPLY(AT END OF PERIOD) [Chart 5.7]
–5 —
0 —
5 —
10 —
15 —
20 —
25 —
30 —
35 —
1996 1997 1998 1999 2000 2001 2002 2003 2004 2005
Per Cent
M2
M1M3
ECONOMIC SURVEY OF SINGAPORE 2005
45
MACROECONOMIC POLICIES
Average growth of narrow money M1 easedto 8.2 per cent, from 12 per cent in 2004. Broadmoney M3 also saw a lower increase of 5.2per cent, down from 7.7 per cent a year earlier.Within broad money, there was a significant shiftin funds from savings deposits to fixed deposits,reflecting the faster pickup in fixed deposit interestrates.
Contributed by:
Ministry of Finance
Tan Kim Eng, Senior EconomistBenedict Chia, EconomistEconomics and Strategy DivisionMinistry of Trade and Industry
ECONOMIC SURVEY OF SINGAPORE 2005
46
Chapter 5
MACROECONOMIC POLICIES
MAJOR TAX MEASURES ANNOUNCEDIN FISCAL YEAR 2005
FOR INDIVIDUALS
(1) Personal Income Tax Reductions
Top personal income tax rate lowered from22 per cent to 21 per cent with effect fromYA2006, and further reduced to 20 percent in YA2007. Marginal tax rates of allother brackets also reduced.
(2) Encouraging Savings for Retirement
CPF voluntary contribution cap increasedand aligned to the mandatory contributioncap. Tax relief cap for CPF contributionsby the self-employed increased to the taxrelief cap for CPF contributions byemployees. The contribution caps for theSupplementary Retirement Scheme (SRS)have been changed to one common cap,set at 17 months of the CPF salary ceiling.
(3) Discourage Smoking
Increase in excise duty on cigarettes from$293 to $352 per 1,000 sticks withimmediate effect.
(4) Reduce Illegal Horse-BettingActivities
Horse betting duty changed from 12 percent of gross stakes to 25 per cent of grossprofits.
(5) Give Relief from Stamp Duties
Remission of stamp duties extended toaborted transactions.
ANNEX 5.1
(6) Encourage Philanthropy andCommunity Involvement ($23million)
Double tax deduction for donationsextended to donations with namingopportunities. Computer Donation Schemeextended to include computer hardwareand software donated to Institutions of aPublic Character (IPCs).
(7) Reduce Foreign Domestic WorkerLevy
The monthly foreign maid levy for allemployers lowered by $50 with effect from1 April 2005.
(8) New Estate Duty Relief for Deathsin Quick Succession
For deaths occurring in quick successionfrom 1 January 2006, there is a relief forestate duty paid on the earlier death,starting at 100 per cent if the two deathsoccur within six months of each other,graduating to the full estate duty payableif the deaths are more than two yearsapart.
FOR COMPANIES
(9) Develop Singapore as a PremierWealth Management Centre
Start-up fund managers are given a 12-month grace period to meet the requirementthat 80 per cent of the value of their fundsmust come from foreign investors. Foreigncharitable trusts given tax exemption onforeign income earned, without beingsubjected to expenditure and fund usagerequirements.
ECONOMIC SURVEY OF SINGAPORE 2005
47
MACROECONOMIC POLICIES
(10) Deepen and Broaden CapitalMarkets
10 per cent tax rate extended to incomeearned by approved companies in securitiesborrowing and lending, includingintermediaries. Removal of double stampduties for real estate mortgage financingstructured in accordance with Islamicpractices and concessionary tax treatmentextended to payouts from “Islamic” bonds.Payouts from sukuks are also accorded thesame concessionary treatment provided forinterest income from debt securities underthe Qualifying Debt Securities scheme. NewCommodity Derivatives Trading incentiveoffering concessionary tax rate onqualifying income from trading exchange-traded commodity derivatives.
(11) Encourage Real Estate InvestmentTrusts (REITs) to List in Singapore
Stamp duty for transfer of Singaporeproperties into listed REITs or REITs to belisted, are waived for five years.Withholding tax on trust distributions to non-resident non-individuals reduced from 20per cent to 10 per cent for five years.
(12) Strengthen Singapore as LogisticsHub
The GST-Bonded Warehouse Schemeexpanded by lifting the 80 per cent exportrequirement for qualifying operators.Approved International Shipping Enterprise(AIS) incentive extended to ship leasingcompanies. Global Trader Programme (GTP)widened to allow companies to use theSingapore dollar as their transactingcurrency.
(13) Rejuvenate Tourism and RetailSectors
Investment allowance incentive extended toflagship concept projects in retail, F&B andentertainment. Concessionary tax rate of 10per cent extended to event companieswhich bring in approved tourism events.
(14) Help Small Businesses
One-year loss carry-back of losses forcompanies, subject to a cap of $100,000in losses carried back.
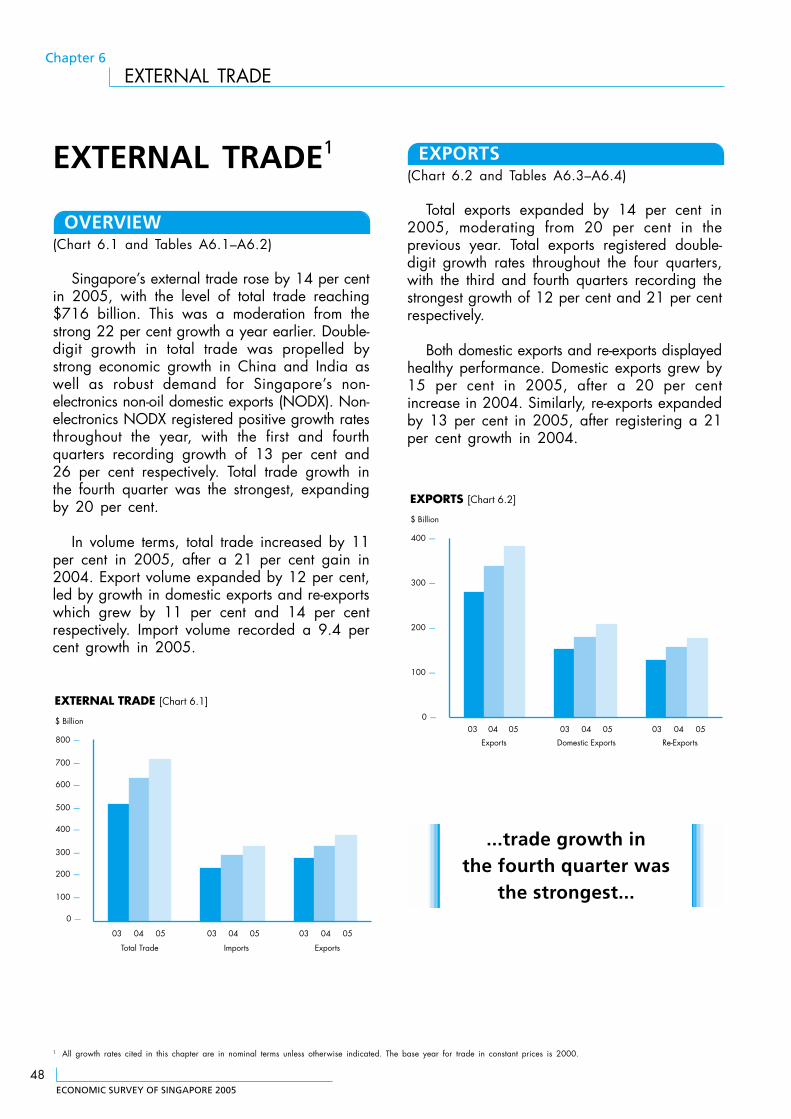
ECONOMIC SURVEY OF SINGAPORE 2005
48
Chapter 6
EXTERNAL TRADE
EXTERNAL TRADE1
OVERVIEW(Chart 6.1 and Tables A6.1–A6.2)
Singapore’s external trade rose by 14 per centin 2005, with the level of total trade reaching$716 billion. This was a moderation from thestrong 22 per cent growth a year earlier. Double-digit growth in total trade was propelled bystrong economic growth in China and India aswell as robust demand for Singapore’s non-electronics non-oil domestic exports (NODX). Non-electronics NODX registered positive growth ratesthroughout the year, with the first and fourthquarters recording growth of 13 per cent and26 per cent respectively. Total trade growth inthe fourth quarter was the strongest, expandingby 20 per cent.
In volume terms, total trade increased by 11per cent in 2005, after a 21 per cent gain in2004. Export volume expanded by 12 per cent,led by growth in domestic exports and re-exportswhich grew by 11 per cent and 14 per centrespectively. Import volume recorded a 9.4 percent growth in 2005.
1 All growth rates cited in this chapter are in nominal terms unless otherwise indicated. The base year for trade in constant prices is 2000.
EXPORTS(Chart 6.2 and Tables A6.3–A6.4)
Total exports expanded by 14 per cent in2005, moderating from 20 per cent in theprevious year. Total exports registered double-digit growth rates throughout the four quarters,with the third and fourth quarters recording thestrongest growth of 12 per cent and 21 per centrespectively.
Both domestic exports and re-exports displayedhealthy performance. Domestic exports grew by15 per cent in 2005, after a 20 per centincrease in 2004. Similarly, re-exports expandedby 13 per cent in 2005, after registering a 21per cent growth in 2004.
EXTERNAL TRADE [Chart 6.1]
0 —
100 —
200 —
300 —
400 —
500 —
600 —
700 —
800 —
03
Total Trade
03
Imports
03
Exports
$ Billion
04 05 04 05 04 05
EXPORTS [Chart 6.2]
0 —
100 —
200 —
300 —
400 —
Exports Domestic Exports Re-Exports
$ Billion
03 03 0304 05 04 05 04 05
...trade growth inthe fourth quarter was
the strongest...
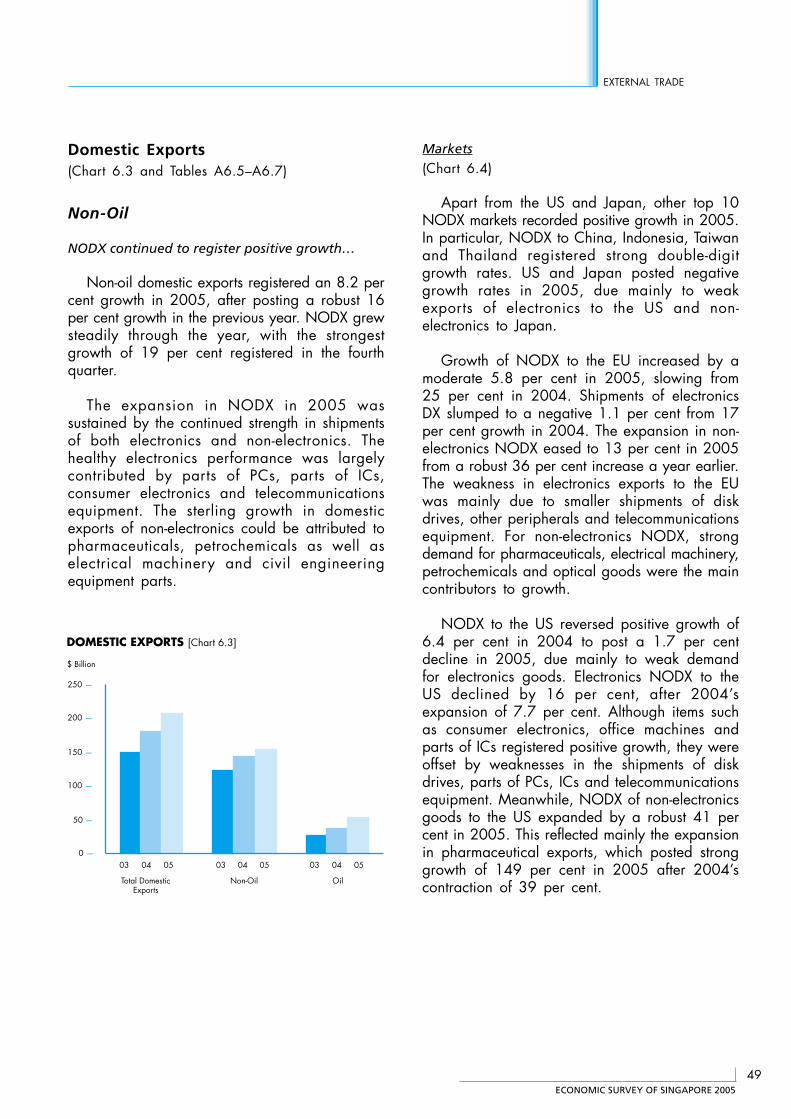
ECONOMIC SURVEY OF SINGAPORE 2005
49
EXTERNAL TRADE
Domestic Exports(Chart 6.3 and Tables A6.5–A6.7)
Non-Oil
NODX continued to register positive growth…
Non-oil domestic exports registered an 8.2 percent growth in 2005, after posting a robust 16per cent growth in the previous year. NODX grewsteadily through the year, with the strongestgrowth of 19 per cent registered in the fourthquarter.
The expansion in NODX in 2005 wassustained by the continued strength in shipmentsof both electronics and non-electronics. Thehealthy electronics performance was largelycontributed by parts of PCs, parts of ICs,consumer electronics and telecommunicationsequipment. The sterling growth in domesticexports of non-electronics could be attributed topharmaceuticals, petrochemicals as well aselectrical machinery and civil engineeringequipment parts.
Markets
(Chart 6.4)
Apart from the US and Japan, other top 10NODX markets recorded positive growth in 2005.In particular, NODX to China, Indonesia, Taiwanand Thailand registered strong double-digitgrowth rates. US and Japan posted negativegrowth rates in 2005, due mainly to weakexports of electronics to the US and non-electronics to Japan.
Growth of NODX to the EU increased by amoderate 5.8 per cent in 2005, slowing from25 per cent in 2004. Shipments of electronicsDX slumped to a negative 1.1 per cent from 17per cent growth in 2004. The expansion in non-electronics NODX eased to 13 per cent in 2005from a robust 36 per cent increase a year earlier.The weakness in electronics exports to the EUwas mainly due to smaller shipments of diskdrives, other peripherals and telecommunicationsequipment. For non-electronics NODX, strongdemand for pharmaceuticals, electrical machinery,petrochemicals and optical goods were the maincontributors to growth.
NODX to the US reversed positive growth of6.4 per cent in 2004 to post a 1.7 per centdecline in 2005, due mainly to weak demandfor electronics goods. Electronics NODX to theUS declined by 16 per cent, after 2004’sexpansion of 7.7 per cent. Although items suchas consumer electronics, office machines andparts of ICs registered positive growth, they wereoffset by weaknesses in the shipments of diskdrives, parts of PCs, ICs and telecommunicationsequipment. Meanwhile, NODX of non-electronicsgoods to the US expanded by a robust 41 percent in 2005. This reflected mainly the expansionin pharmaceutical exports, which posted stronggrowth of 149 per cent in 2005 after 2004’scontraction of 39 per cent.
DOMESTIC EXPORTS [Chart 6.3]
0 —
50 —
100 —
150 —
200 —
250 —
Total DomesticExports
Non-Oil Oil
$ Billion
03 03 0304 05 04 05 04 05
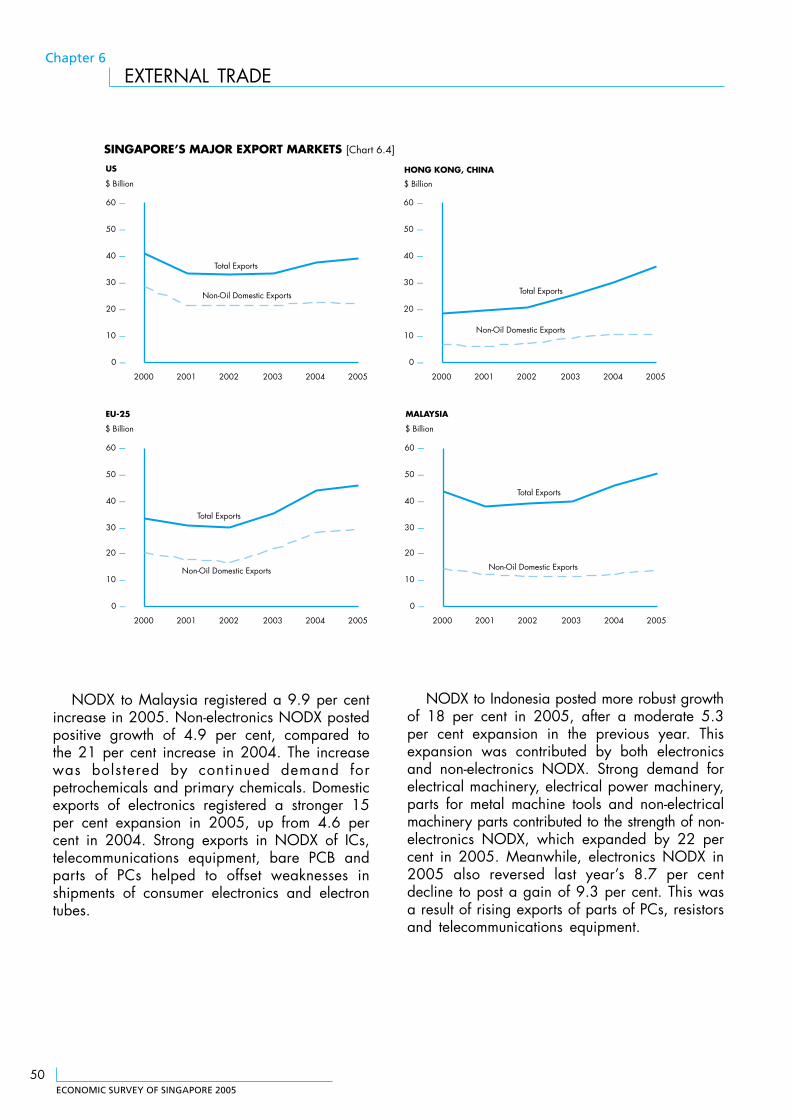
ECONOMIC SURVEY OF SINGAPORE 2005
50
Chapter 6
EXTERNAL TRADE
NODX to Malaysia registered a 9.9 per centincrease in 2005. Non-electronics NODX postedpositive growth of 4.9 per cent, compared tothe 21 per cent increase in 2004. The increasewas bolstered by continued demand forpetrochemicals and primary chemicals. Domesticexports of electronics registered a stronger 15per cent expansion in 2005, up from 4.6 percent in 2004. Strong exports in NODX of ICs,telecommunications equipment, bare PCB andparts of PCs helped to offset weaknesses inshipments of consumer electronics and electrontubes.
NODX to Indonesia posted more robust growthof 18 per cent in 2005, after a moderate 5.3per cent expansion in the previous year. Thisexpansion was contributed by both electronicsand non-electronics NODX. Strong demand forelectrical machinery, electrical power machinery,parts for metal machine tools and non-electricalmachinery parts contributed to the strength of non-electronics NODX, which expanded by 22 percent in 2005. Meanwhile, electronics NODX in2005 also reversed last year’s 8.7 per centdecline to post a gain of 9.3 per cent. This wasa result of rising exports of parts of PCs, resistorsand telecommunications equipment.
0 —
10 —
20 —
30 —
40 —
50 —
60 —
2000 2001 2002 2003 2004 2005
0 —
10 —
20 —
30 —
40 —
50 —
60 —
2000 2001 2002 2003 2004 2005
SINGAPORE’S MAJOR EXPORT MARKETS [Chart 6.4]
HONG KONG, CHINA
0 —
10 —
20 —
30 —
40 —
50 —
60 —
2000 2001 2002 2003 2004 2005
$ Billion
US
$ Billion
EU-25
$ Billion
MALAYSIA
0 —
10 —
20 —
30 —
40 —
50 —
60 —
2000 2001 2002 2003 2004 2005
$ Billion
Total Exports
Non-Oil Domestic Exports Total Exports
Non-Oil Domestic Exports
Total Exports
Non-Oil Domestic Exports
Total Exports
Non-Oil Domestic Exports
ECONOMIC SURVEY OF SINGAPORE 2005
51
EXTERNAL TRADE
NODX to Japan contracted by a marginal 1.2per cent in 2005, after growth of 7.7 per centin the previous year. The contraction was due toweaker shipments of non-electronics, which fellby 3.2 per cent after growth of 3.2 per cent in2004. More specifically, performance was helddown by soft demand for other chemicals, opticalapparatus and heating and cooling equipment.In contrast, demand for electronics NODX sawa recovery. NODX growth in PCs and parts, diskdrives and parts of ICs pushed overall electronicsdomestic exports to Japan up by 1.1 per centfor the year.
NODX to the other top 10 markets (China,Hong Kong, Taiwan, Thailand and South Korea)registered gains in 2005. NODX to Chinacontinued to register strong double-digit gains of27 per cent in 2005, due to robust performancesof both electronics and non-electronics NODX.NODX to Taiwan displayed higher growth of 17per cent in 2005. NODX to Thailand, Hong Kongand South Korea grew 23 per cent, 0.9 per centand 9.7 per cent respectively.
NODX to the emerging markets rose by 11per cent in 2005, lifted mainly by the strongersecond half of the year. Healthy gains wererecorded in NODX to the Middle East, LatinAmerica Central Asia and South Africa.
Products
Growth of electronics domestic exports in2005 reached 3.9 per cent. This was amoderation compared to the 13 per cent rate ofgrowth recorded in the previous year. Strongerdemand for parts of PCs, parts of ICs, consumerelectronics and telecommunications equipmentoffset weaknesses in other computer peripheralsand disk drives.
Domestic exports of non-electronics continuedto post healthy growth in 2005. It expanded by13 per cent, following the 19 per cent growthin 2004. The robust performance was the resultof higher shipments of pharmaceuticals to the EUand US as well as increased shipments ofpetrochemicals to regional countries (China,Malaysia, Thailand and Hong Kong). Other non-electronics items – such as electrical machinery,civil engineering equipment parts and disk mediaproducts – also supported the overall growth innon-electronics NODX.
Oil
Domestic exports of oil recorded strong growth…
Oil domestic exports surged by 42 per centin 2005 on the back of higher oil prices, after a36 per cent gain in 2004. In volume terms, italso posted a positive growth of 5.1 per cent,due to higher demand in Australia and HongKong.
NODX to China continuedto register strong
double-digit gains...
ECONOMIC SURVEY OF SINGAPORE 2005
52
Chapter 6
EXTERNAL TRADE
Re-exports(Table A6.10)
Strong demand for both electronics and non-electronics re-exports…
Non-oil re-exports (NORX) registered a 13 percent growth over 2005, after a 21 per centincrease in 2004. Both NORX of electronics andnon-electronics products recorded robust growthof 12 per cent and 14 per cent in 2005respectively. Re-exports of ICs, parts of PCs,telecommunications equipment, and parts of ICssupported the growth in electronics re-exports.Strong demand for precious stone and pearl, civilengineering equipment parts and electrical circuitapparatus contributed to the gains in the re-exportof non-electronics goods.
Except for Taiwan and the EU, NORX to thetop-10 markets registered robust growth. Re-exports to China and Hong Kong continued tomaintain the strong double-digit growth pacesince 2003, reflecting healthy electronics NORXgrowth. NORX to the US, Japan and Thailandalso experienced double-digit expansions of 12per cent, 13 per cent and 15 per centrespectively. On the other hand, NORX to Taiwanposted a mild 2.7 per cent decline in 2005,reversing the 21 per cent growth attained in theprevious year. This was mainly due to the weakperformance of electronics NORX to Taiwan,which declined by 4.2 per cent. NORX to theEU also registered a mild 0.1 per cent declinein 2005.
IMPORTS(Tables A6.8–A6.9)
Higher import demand for electronics intermedi-ate inputs…
Total imports expanded by 14 per cent in2005 to reach $333 billion. This was slowerthan the 24 per cent growth in 2004. Theincrease was due to higher demand forelectronics intermediate inputs such as ICs, PCsand parts and printers.
INTERNATIONALISATION EFFORTS
There was further increase in efforts to catalysethe internationalisation of Singapore-basedcompanies in 2005. The connectivity ofSingapore-based companies was enhancedthrough the facilitating of increased marketaccess, fostering of strong industry linkages inkey services sectors, and strengthening ofSingapore’s position as an international tradehub. Continued efforts were also made to boostthe capability of Singapore’s home-growncompanies.
Increased Market Access
Singapore continued to extend our globalreach and strengthen our economic ties with keytrading partners, in pursuit of greater marketaccess for our exports throughout 2005.
NORX of electronics andnon-electronics productsrecorded robust growth...
ECONOMIC SURVEY OF SINGAPORE 2005
53
EXTERNAL TRADE
FTAs
The entry into force of the ComprehensiveEconomic Cooperation Agreement (CECA)between India and Singapore on 1 August 2005marked another milestone in Singapore’s freetrade efforts. The agreement was India’s first everCECA and the first comprehensive economic pactbetween Singapore and a South Asian country.In addition, the Singapore-Jordan Free TradeAgreement (FTA) – the first between a MiddleEastern country and an Asia-Pacific country –came into force on 22 August 2005.
The CECA and the Singapore-Jordan FTAbrought the total number of FTAs in force to eight.The others are the ASEAN Free Trade Agreement,Agreement between New Zealand and Singaporeon Closer Economic Partnership, Japan-SingaporeEconomic Partnership Agreement, European FreeTrade Association–Singapore FTA, Singapore-Australia FTA and US-Singapore FTA.
The year also saw the conclusion and signingof the Korea-Singapore FTA and Trans-PacificStrategic Economic Partnership (consisting of NewZealand, Chile, Brunei and Singapore). They arelikely to enter into force in the first half of 2006.Our FTAs with Panama and Qatar wereconcluded in 2005 as well and are currentlyawaiting signing.
As part of the ASEAN regional grouping,Singapore has been deeply involved in FTAnegotiations throughout 2005 with China, Japan,India, Korea, Australia and New Zealand. On20 July 2005, Singapore, together with China,Brunei, Malaysia, Thailand, Myanmar andIndonesia, implemented the Trade in GoodsAgreement under the ASEAN-China FTAframework.
ASEAN Leaders, at the 11th ASEAN Summitin December 2005, signed the ASEAN-KoreaFramework Agreement on ComprehensiveEconomic Cooperation. This document sets thekey parameters for the ongoing negotiations forthe ASEAN-Korea Free Trade Agreement (AKFTA),and lays out areas for future economiccooperation. The ASEAN Economic Ministerssigned the Trade-in-Goods (TIG) Agreement of theAKFTA, which sets in place a schedule for tariffelimination that will come into effect on 1 July2006, with the aim of substantially concludingthe AKFTA by 2010.
In 2005, Singapore intensified its FTA outreachefforts to enable the business community to takeadvantage of our expanding FTA network. TheGovernment worked with business associationsand business chambers to build greaterawareness and maximise the utilisation of ourFTAs.
WTO
On the multilateral front, the 6th World TradeOrganisation (WTO) Ministerial Conference inHong Kong adopted a declaration that wouldprovide further directions and necessary impetusto the ongoing Doha Development Agenda (DDA)negotiations, in areas such as agriculture,industrial tariffs and services. Singapore playedan active role both in the negotiations in Genevaas well as during the conference in Hong Kongtowards the adoption of the declaration.
ASEAN
On the ASEAN front, member countries haveagreed to accelerate their progress towardsrealising an ASEAN Economic Community (AEC),by increasing momentum in the integration of the11 priority sectors within ASEAN and by bringingforward the date for achieving liberalisation intrade in services to 2015. ASEAN Leaders, atthe 11th ASEAN Summit also discussed thepossibility of advancing the target date forrealising the AEC from 2020 to 2015, with someflexibility for the new Member Countries.
ECONOMIC SURVEY OF SINGAPORE 2005
54
Chapter 6
EXTERNAL TRADE
During the 11th ASEAN Summit in KualaLumpur in December 2005, ASEAN EconomicMinisters signed the Agreement to Establish andImplement the ASEAN Single Window; theASEAN Mutual Recognition Arrangement onEngineering Services; and the Agreement on theASEAN Harmonised Electrical and ElectronicEquipment (EEE) Regulatory Regime. Theserespective agreements seek to strengthencooperation among ASEAN Member Countriesin the facilitation of their customs procedures,facilitate the mobility of professional services inthe region, and harmonise standards andregulatory regimes of electronics products acrossASEAN. The signing of such agreements is anessential step in ASEAN’s journey towardsintegration, and effectively signals ASEAN’scommitment towards achieving an AEC.
APEC
The Asia-Pacific Economic Co-operation(APEC), under the Chairmanship of Korea in2005, continued its work in reducing tariffs andother barriers to trade and investment across theAsia-Pacific region.
At the 17th APEC Ministerial Meeting in Busanin November 2005, Ministers endorsed APEC’sMid-term Stocktake of Progress Towards the BogorGoals. Singapore worked with other membersof the Mid-term Stocktake Steering Committee todevelop the report, which found that barriers totrade and investment have fallen significantlysince the inception of APEC in 1989. The reportalso set a roadmap for further progress towardsAPEC’s vision of free and open trade andinvestment in the region. In implementing theBusan Roadmap, APEC will develop acomprehensive business facilitation program, theBusan Business Agenda, which will reducebusiness and transaction costs through tradefacilitation, strengthening of intellectual propertyrights (IPR) protection, and greater collaborationwithin APEC in the area of supply chain security.
At the 13th APEC Economic Leaders’ Meeting,APEC Leaders gave a strong impetus to themultilateral process through a standalonestatement calling for an ambitious and balancedoutcome in WTO Doha Development Agendanegotiations. Recognising the potential economicimpact of pandemic influenza, APEC Leaders alsoendorsed the APEC Initiative on Preparing forand Mitigating an Influenza Pandemic.
Stronger Industry Linkages
Business Services
2005 saw several projects in the healthcare,education and financial sectors successfully takingoff. In the healthcare sector, the InternationalHealthcare Facilities Exhibition and Conference(IHFEC) – the first healthcare event in the regionto focus on the development and delivery ofmodern integrated healthcare facilities - attracted57 international exhibitors and more than 2,000healthcare professionals from Asia, Africa andMiddle East. IHFEC also provided an opportunityto profile Singapore’s healthcare companiesinternationally.
In the education sector, the focus for 2005was on strategic profiling of capabilities to securesignificant projects funded by OverseasDevelopment Agencies.
Infrastructure Services
The key growth areas for residential andindustrial development continued to be in China.The “Go-West” strategy and “Rejuvenation ofNorth-East” policy of China offered attractiveinvestment incentives which drove foreign directinvestment (FDI), leading to many industrial andresidential developments.
ECONOMIC SURVEY OF SINGAPORE 2005
55
EXTERNAL TRADE
2005 was an activity-charged year with 11outgoing missions covering India, China, Russia,Turkey, Saudi Arabia, Iran, Qatar, Abu Dhabi,Kuwait, Oman and Cambodia. Turkey, Russia andOman were new markets introduced tocompanies.
The infrastructure sector saw the formation of3 strategic alliances under the iPartnersprogramme. These alliances include theSingapore Builders and Infrastructure Consortium,Teamworks Consortium for China, Land TransportConsortium. This helped Singapore companies toovercome size and scale constraints whencompeting overseas.
Electronics and Precision Engineering
The second-run of the Global Asia TradeExchange (GATE05) was conducted on October2005. Over the two-day event, 32 global buyersfrom Automotive, Aerospace, Medical, ConsumerElectronics and Communications industries metone-to-one with 119 local and regional suppliersin over 400 pre-qualified meetings to discusspotential deals worth a total value of US$3.5billion. The procurement forum also featured topspeakers from Siemens Communications,Flextronics, Daimler Chrysler and Accord Express.
Info Communications Technology (ICT)
Following efforts a year earlier, 2005 saw acontinuation of concerted effor ts by theinformation & communications technology industryto leverage on Singapore’s strong internationalbranding, track record and experience as theregional financial and transport hub to showcaseof Singapore companies, especially in the areasof Intelligent Transport Systems (ITS), financialtechnology solutions and e-government. In total,nine overseas branding seminars, missions cumexhibitions were organized in key overseasmarkets including China, India and Germany aswell as in emerging markets such as Vietnam.
Lifestyle Services
Lifestyle services sector witnessed a year ofincreased market access facilitation and fosteredbusiness linkages globally. In Northeast Asia, thespa industry enjoyed strong growth. A multi-yearfranchising and trademark licensing agreementwas signed between a leading Singapore spacompany and a consortium in Japan withexpected sales worth over $150 million.
In Southeast Asia, our food and beveragecompanies continued to deepen their presencein these popular markets, while in Europe andAmerica, there was continued efforts in seekingmore commercial opportunities for our foodmanufacturers by reaching out to key businessplayers through road shows and leadingexhibitions in both regions.
In America, beyond the food and beveragesector, our textile and garment companies alsocontinued to fare well, facilitated in part by ourFTA with the US. In 2005, Singapore’s domesticexports of garments to the US amounted to over$240 million of which 62 per cent utilised theterms of the USSFTA for preferential tariff rates.
Singapore Fashion Week (SFW) 2005, for thefirst time ever, saw an integrated sourcing eventfor the fashion industry, with events thataddressed every part of the value chain fromtextile machinery, yarns and fabrics, apparelmanufacturing to high fashion.
Attention was also focused on SMEs in theLifestyle services sector, where various governmentagencies and industry associations worked closelyto develop the Local Enterprise and AssociationDevelopment (LEAD) Programme for thedevelopment and benefit of Singapore companiesin the food, textile and furniture industries.
ECONOMIC SURVEY OF SINGAPORE 2005
56
Chapter 6
EXTERNAL TRADE
Strengthening Position as anInternational Trade Hub
In order to position Singapore as aninternational trade hub, continuous efforts weremade to improve key services in the internationaltrading and trade logistics sectors.
International Trading
In 2005, a total of 25 new companies wereawarded the Global Trader Programme status.These companies are expected to generate over$500 million in local business spending over thenext 5 years. There are currently more than 170global trading companies under the GlobalTrader Programme, employing more than 1,000professional traders and incurring more than $4million in local business spending annually.
Trade Logistics
2005 saw a deepening of key clusters suchas aviation, marine and offshore logistics. It wasan activity-charged year for the Transport andLogistics sector with over 15 outgoing missionsand 10 incoming missions organized, which sawthe Singapore companies reinforcing theirpresence in key markets such as China, India,Thailand and Indonesia. They were alsointroduced into new ones like South Korea,Middle East and Latin America.
Capability Development
Capital Enabling
As companies venture overseas, they becomeexposed to greater risks and their need forfinancing also increases exponentially. To assistSingapore-based companies seize globalopportunities while managing financial riskssuccessfully, a series of initiatives andprogrammes have been developed to help themaccess capital and develop their internationalfinancial strategies.
In April 2005, the SME ACCESS Loan waslaunched to address the difficulties faced by SMEsin securing financing, in particular companies thathave limited track record, little collateral andthose seeking loans for internationalisationpurposes.
The Trade Credit Insurance (TCI) Programmewas launched in October 2005. It offers tradecredit insurance at premium rates that arenormally available only to companies withsignificant trade volumes by pooling demandamong Singapore-based companies for tradecredit insurance and thereby generatingeconomies of scale.
In January 2006, a new financing initiative,the Enterprise Fund was launched to helpinternationalising companies finance their globalexpansion. The Enterprise Fund will investprimarily in traditional and asset-light Singapore-based companies who are often unable toincrease traditional banking lines due toinadequacy of collateral or to tap on conventionalventure capital funding due to the non-technologynature of the businesses.
ECONOMIC SURVEY OF SINGAPORE 2005
57
EXTERNAL TRADE
Business Capability
Singapore has stepped up its initiatives in thearea of alliance formation, branding, design andintellectual property to help companies enhancetheir competencies. For example, since its launchin October 2003, the iPartners Programme hassupported and provided financial assistance to18 alliances comprising 96 companies fromvarious industries such as info-comms technology,food services, airport services, exhibition andconference, logistics, and building andinfrastructure sectors.
In recognising the importance of intellectualproperty (IP) strategy to companies’internationalisation efforts in building brands,product designs, technologies, franchises andlicenses, the ‘IP for Internationalisation’ has beendeveloped.
2005 also saw the launch of BrandPact, amulti-agency brand development initiative, whichprovides companies of all sizes with the criticaltools for transforming their businesses intopowerful brands. Over a period of 3 years, anestimated $20 million will be spent to help about5,000 companies kick-start their understandingon branding, the value of branding andencourage them to build up their own brandingcapabilities.
Trade Promotion
International Partnerships
In 2005, five new IE Hubs were established,namely Vietnam House, Suzhou Centre, Swiss-Asean Hub, Heilongjiang Centre and WenzhouDistribution Centre, bringing the total number ofIE Hubs to 11. More than 100 companies havebeen established under the IE Hub Initiative whichled to successful partnerships between local andforeign enterprises.
The “Real Estate, Infrastructure in Ho ChinMinh Conference” was held in October 2005.100 Vietnamese delegates participated in theevent and over 70 township, residential andindustrial park projects were generated.
Under the Representative Office Scheme, 207new foreign representative offices were registered,bringing the total number of representative officesin Singapore to 962.
Business Information Services
To help companies make fact-based decisionsand find partners, business matching events wereheld in 2005 to facilitate networking betweenSingapore based companies and theircounterparts from Sweden, Japan and Malaysia.
Contributed by:
Ms Grace ChuaSenior OfficerResearch and Statistics DivisionInternational Enterprise Singapore
Seah Kwang WeeEconomistEconomics and Strategy DivisionMinistry of Trade and Industry
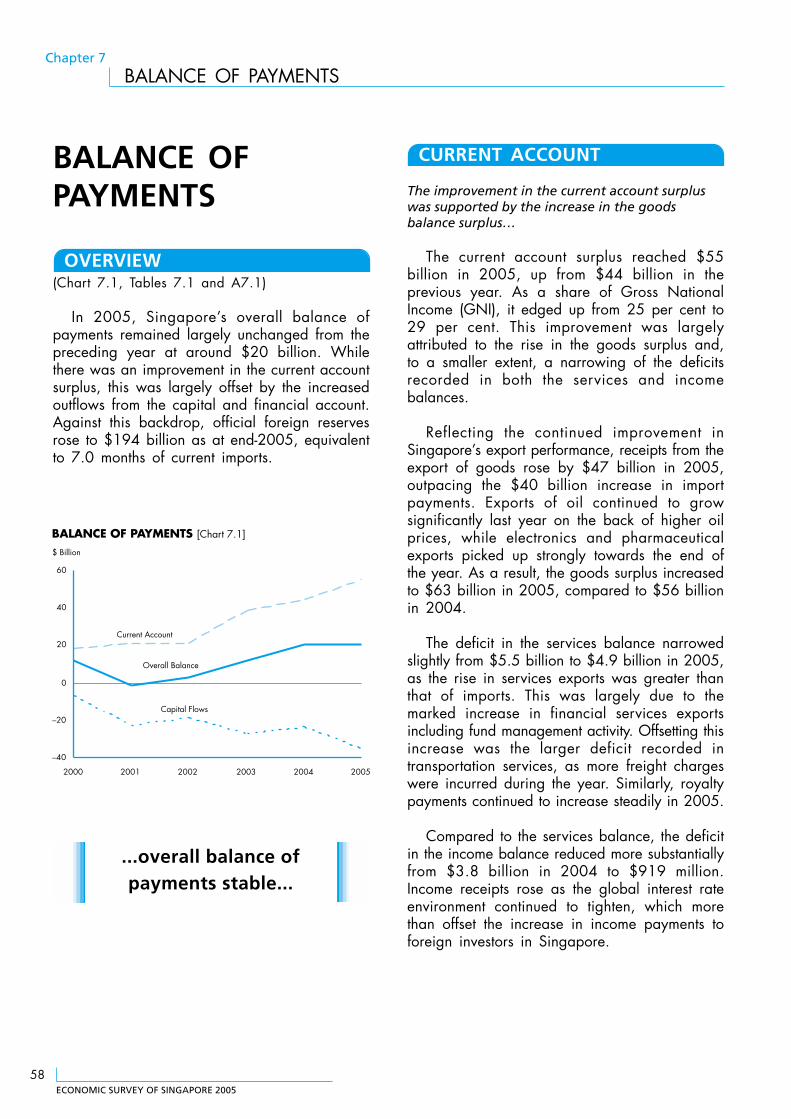
ECONOMIC SURVEY OF SINGAPORE 2005
58
Chapter 7
BALANCE OF PAYMENTS
BALANCE OFPAYMENTS
OVERVIEW(Chart 7.1, Tables 7.1 and A7.1)
In 2005, Singapore’s overall balance ofpayments remained largely unchanged from thepreceding year at around $20 billion. Whilethere was an improvement in the current accountsurplus, this was largely offset by the increasedoutflows from the capital and financial account.Against this backdrop, official foreign reservesrose to $194 billion as at end-2005, equivalentto 7.0 months of current imports.
...overall balance ofpayments stable...
CURRENT ACCOUNT
The improvement in the current account surpluswas supported by the increase in the goodsbalance surplus…
The current account surplus reached $55billion in 2005, up from $44 billion in theprevious year. As a share of Gross NationalIncome (GNI), it edged up from 25 per cent to29 per cent. This improvement was largelyattributed to the rise in the goods surplus and,to a smaller extent, a narrowing of the deficitsrecorded in both the services and incomebalances.
Reflecting the continued improvement inSingapore’s export performance, receipts from theexport of goods rose by $47 billion in 2005,outpacing the $40 billion increase in importpayments. Exports of oil continued to growsignificantly last year on the back of higher oilprices, while electronics and pharmaceuticalexports picked up strongly towards the end ofthe year. As a result, the goods surplus increasedto $63 billion in 2005, compared to $56 billionin 2004.
The deficit in the services balance narrowedslightly from $5.5 billion to $4.9 billion in 2005,as the rise in services exports was greater thanthat of imports. This was largely due to themarked increase in financial services exportsincluding fund management activity. Offsetting thisincrease was the larger deficit recorded intransportation services, as more freight chargeswere incurred during the year. Similarly, royaltypayments continued to increase steadily in 2005.
Compared to the services balance, the deficitin the income balance reduced more substantiallyfrom $3.8 billion in 2004 to $919 million.Income receipts rose as the global interest rateenvironment continued to tighten, which morethan offset the increase in income payments toforeign investors in Singapore.
BALANCE OF PAYMENTS [Chart 7.1]
–40
–20
0
20
40
60
2000 2001 2002 2003 2004 2005
$ Billion
Capital Flows
Overall Balance
Current Account
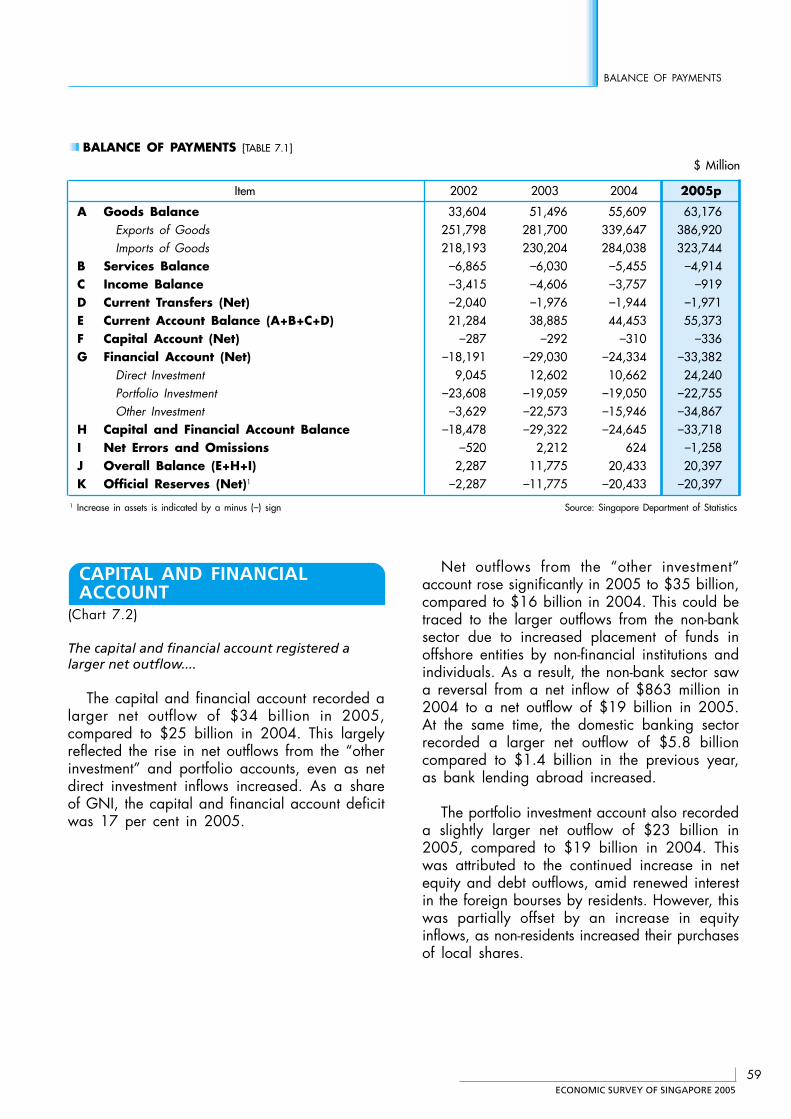
ECONOMIC SURVEY OF SINGAPORE 2005
59
BALANCE OF PAYMENTS
CAPITAL AND FINANCIALACCOUNT
(Chart 7.2)
The capital and financial account registered alarger net outflow....
The capital and financial account recorded alarger net outflow of $34 billion in 2005,compared to $25 billion in 2004. This largelyreflected the rise in net outflows from the “otherinvestment” and portfolio accounts, even as netdirect investment inflows increased. As a shareof GNI, the capital and financial account deficitwas 17 per cent in 2005.
BALANCE OF PAYMENTS [TABLE 7.1]
$ Million
Item 2002 2003 2004 2005p
A Goods Balance 33,604 51,496 55,609 63,176Exports of Goods 251,798 281,700 339,647 386,920Imports of Goods 218,193 230,204 284,038 323,744
B Services Balance –6,865 –6,030 –5,455 –4,914C Income Balance –3,415 –4,606 –3,757 –919D Current Transfers (Net) –2,040 –1,976 –1,944 –1,971E Current Account Balance (A+B+C+D) 21,284 38,885 44,453 55,373F Capital Account (Net) –287 –292 –310 –336G Financial Account (Net) –18,191 –29,030 –24,334 –33,382
Direct Investment 9,045 12,602 10,662 24,240Portfolio Investment –23,608 –19,059 –19,050 –22,755Other Investment –3,629 –22,573 –15,946 –34,867
H Capital and Financial Account Balance –18,478 –29,322 –24,645 –33,718I Net Errors and Omissions –520 2,212 624 –1,258J Overall Balance (E+H+I) 2,287 11,775 20,433 20,397K Official Reserves (Net)1 –2,287 –11,775 –20,433 –20,397
1 Increase in assets is indicated by a minus (–) sign Source: Singapore Department of Statistics
Net outflows from the “other investment”account rose significantly in 2005 to $35 billion,compared to $16 billion in 2004. This could betraced to the larger outflows from the non-banksector due to increased placement of funds inoffshore entities by non-financial institutions andindividuals. As a result, the non-bank sector sawa reversal from a net inflow of $863 million in2004 to a net outflow of $19 billion in 2005.At the same time, the domestic banking sectorrecorded a larger net outflow of $5.8 billioncompared to $1.4 billion in the previous year,as bank lending abroad increased.
The portfolio investment account also recordeda slightly larger net outflow of $23 billion in2005, compared to $19 billion in 2004. Thiswas attributed to the continued increase in netequity and debt outflows, amid renewed interestin the foreign bourses by residents. However, thiswas partially offset by an increase in equityinflows, as non-residents increased their purchasesof local shares.
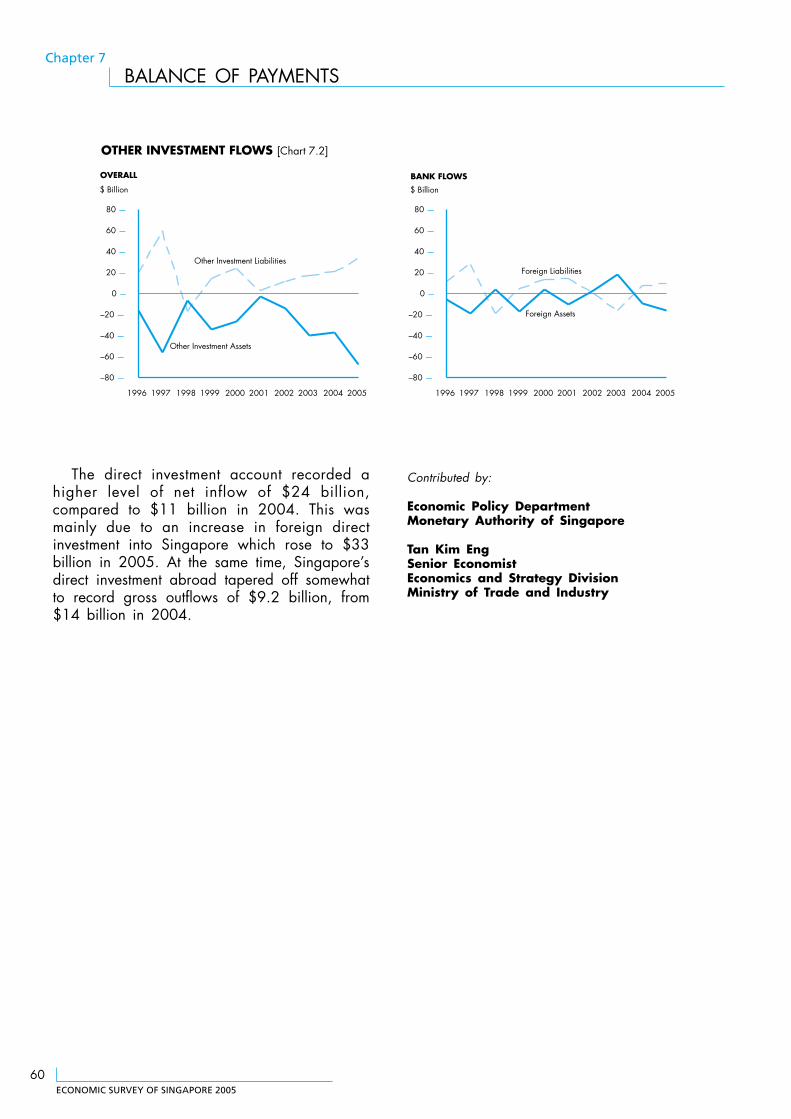
ECONOMIC SURVEY OF SINGAPORE 2005
60
Chapter 7
BALANCE OF PAYMENTS
The direct investment account recorded ahigher level of net inflow of $24 billion,compared to $11 billion in 2004. This wasmainly due to an increase in foreign directinvestment into Singapore which rose to $33billion in 2005. At the same time, Singapore’sdirect investment abroad tapered off somewhatto record gross outflows of $9.2 billion, from$14 billion in 2004.
OTHER INVESTMENT FLOWS [Chart 7.2]
BANK FLOWS
–80 —
–60 —
–40 —
–20 —
0 —
20 —
40 —
60 —
80 —
1996 1997 1998 1999 2000 2001 2002 2003 2004 2005
$ Billion
OVERALL
–80 —
–60 —
–40 —
–20 —
0 —
20 —
40 —
60 —
80 —
1996 1997 1998 1999 2000 2001 2002 2003 2004 2005
$ Billion
Other Investment Liabilities
Other Investment Assets
Foreign Liabilities
Foreign Assets
Contributed by:
Economic Policy DepartmentMonetary Authority of Singapore
Tan Kim EngSenior EconomistEconomics and Strategy DivisionMinistry of Trade and Industry
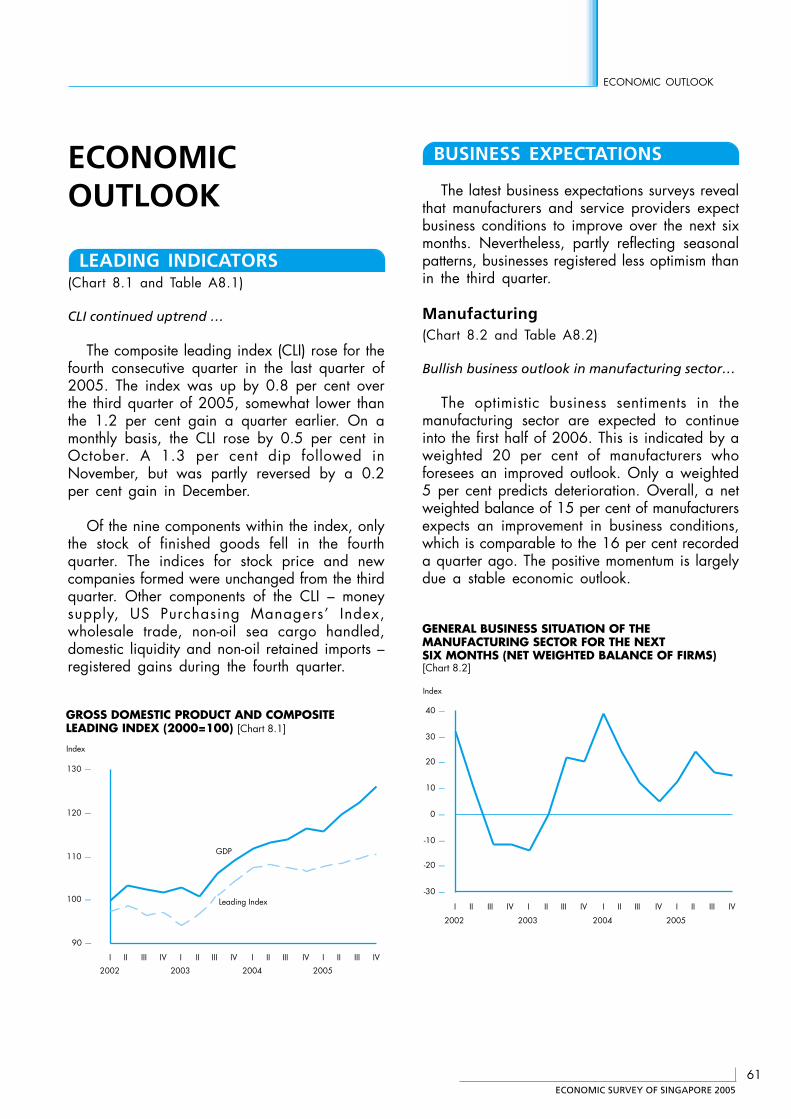
ECONOMIC SURVEY OF SINGAPORE 2005
61
ECONOMIC OUTLOOK
ECONOMICOUTLOOK
LEADING INDICATORS(Chart 8.1 and Table A8.1)
CLI continued uptrend …
The composite leading index (CLI) rose for thefourth consecutive quarter in the last quarter of2005. The index was up by 0.8 per cent overthe third quarter of 2005, somewhat lower thanthe 1.2 per cent gain a quarter earlier. On amonthly basis, the CLI rose by 0.5 per cent inOctober. A 1.3 per cent dip followed inNovember, but was partly reversed by a 0.2per cent gain in December.
Of the nine components within the index, onlythe stock of finished goods fell in the fourthquarter. The indices for stock price and newcompanies formed were unchanged from the thirdquarter. Other components of the CLI – moneysupply, US Purchasing Managers’ Index,wholesale trade, non-oil sea cargo handled,domestic liquidity and non-oil retained imports –registered gains during the fourth quarter.
BUSINESS EXPECTATIONS
The latest business expectations surveys revealthat manufacturers and service providers expectbusiness conditions to improve over the next sixmonths. Nevertheless, partly reflecting seasonalpatterns, businesses registered less optimism thanin the third quarter.
Manufacturing(Chart 8.2 and Table A8.2)
Bullish business outlook in manufacturing sector…
The optimistic business sentiments in themanufacturing sector are expected to continueinto the first half of 2006. This is indicated by aweighted 20 per cent of manufacturers whoforesees an improved outlook. Only a weighted5 per cent predicts deterioration. Overall, a netweighted balance of 15 per cent of manufacturersexpects an improvement in business conditions,which is comparable to the 16 per cent recordeda quarter ago. The positive momentum is largelydue a stable economic outlook.
GROSS DOMESTIC PRODUCT AND COMPOSITELEADING INDEX (2000=100) [Chart 8.1]
90 —
100 —
110 —
120 —
130 —
I
2002
II III IV I
2003
II III IV I
2004
II III IV I
2005
II III IV
Index
Leading Index
GDP
-30 —
-20 —
-10 —
0 —
10 —
20 —
30 —
40 —
I
2002
II III IV I
2003
II III IV I
2004
II III IV I
2005
II III IV
Index
GENERAL BUSINESS SITUATION OF THE MANUFACTURING SECTOR FOR THE NEXT SIX MONTHS (NET WEIGHTED BALANCE OF FIRMS) [Chart 8.2]
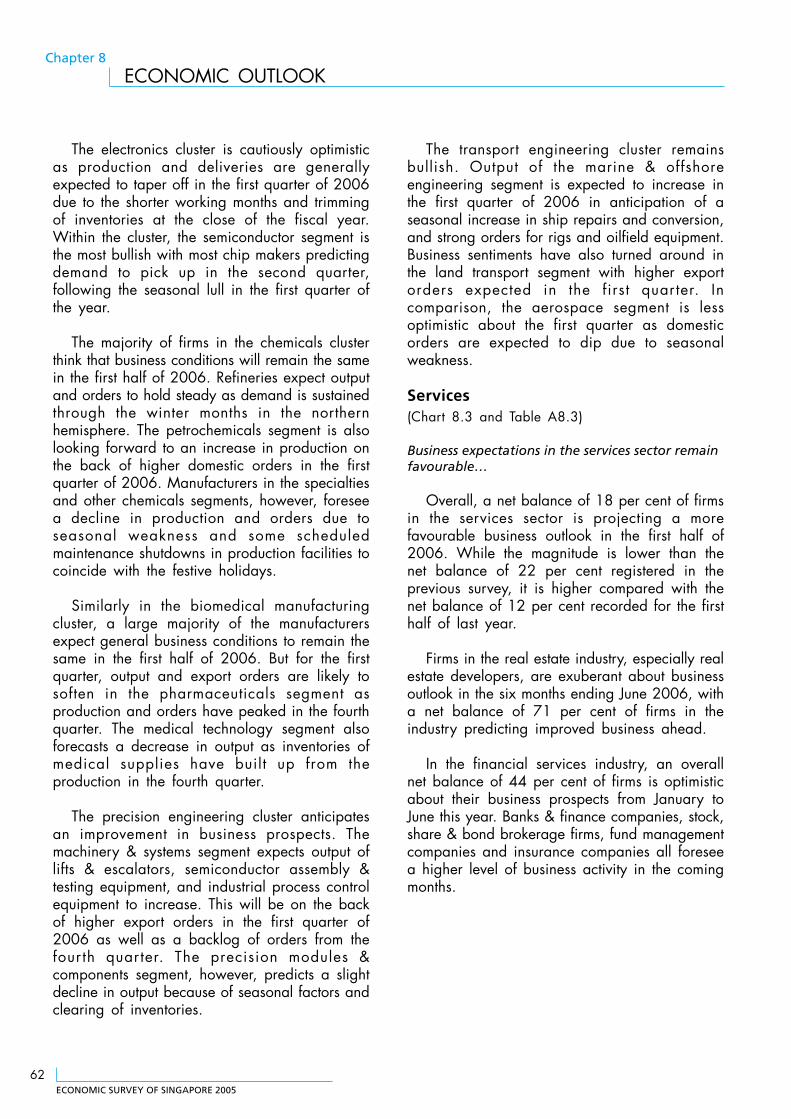
ECONOMIC SURVEY OF SINGAPORE 2005
62
Chapter 8
ECONOMIC OUTLOOK
The electronics cluster is cautiously optimisticas production and deliveries are generallyexpected to taper off in the first quarter of 2006due to the shorter working months and trimmingof inventories at the close of the fiscal year.Within the cluster, the semiconductor segment isthe most bullish with most chip makers predictingdemand to pick up in the second quarter,following the seasonal lull in the first quarter ofthe year.
The majority of firms in the chemicals clusterthink that business conditions will remain the samein the first half of 2006. Refineries expect outputand orders to hold steady as demand is sustainedthrough the winter months in the northernhemisphere. The petrochemicals segment is alsolooking forward to an increase in production onthe back of higher domestic orders in the firstquarter of 2006. Manufacturers in the specialtiesand other chemicals segments, however, foreseea decline in production and orders due toseasonal weakness and some scheduledmaintenance shutdowns in production facilities tocoincide with the festive holidays.
Similarly in the biomedical manufacturingcluster, a large majority of the manufacturersexpect general business conditions to remain thesame in the first half of 2006. But for the firstquarter, output and export orders are likely tosoften in the pharmaceuticals segment asproduction and orders have peaked in the fourthquarter. The medical technology segment alsoforecasts a decrease in output as inventories ofmedical supplies have built up from theproduction in the fourth quarter.
The precision engineering cluster anticipatesan improvement in business prospects. Themachinery & systems segment expects output oflifts & escalators, semiconductor assembly &testing equipment, and industrial process controlequipment to increase. This will be on the backof higher export orders in the first quarter of2006 as well as a backlog of orders from thefour th quarter. The precision modules &components segment, however, predicts a slightdecline in output because of seasonal factors andclearing of inventories.
The transport engineering cluster remainsbullish. Output of the marine & offshoreengineering segment is expected to increase inthe first quarter of 2006 in anticipation of aseasonal increase in ship repairs and conversion,and strong orders for rigs and oilfield equipment.Business sentiments have also turned around inthe land transport segment with higher exportorders expected in the first quarter. Incomparison, the aerospace segment is lessoptimistic about the first quarter as domesticorders are expected to dip due to seasonalweakness.
Services(Chart 8.3 and Table A8.3)
Business expectations in the services sector remainfavourable…
Overall, a net balance of 18 per cent of firmsin the services sector is projecting a morefavourable business outlook in the first half of2006. While the magnitude is lower than thenet balance of 22 per cent registered in theprevious survey, it is higher compared with thenet balance of 12 per cent recorded for the firsthalf of last year.
Firms in the real estate industry, especially realestate developers, are exuberant about businessoutlook in the six months ending June 2006, witha net balance of 71 per cent of firms in theindustry predicting improved business ahead.
In the financial services industry, an overallnet balance of 44 per cent of firms is optimisticabout their business prospects from January toJune this year. Banks & finance companies, stock,share & bond brokerage firms, fund managementcompanies and insurance companies all foreseea higher level of business activity in the comingmonths.
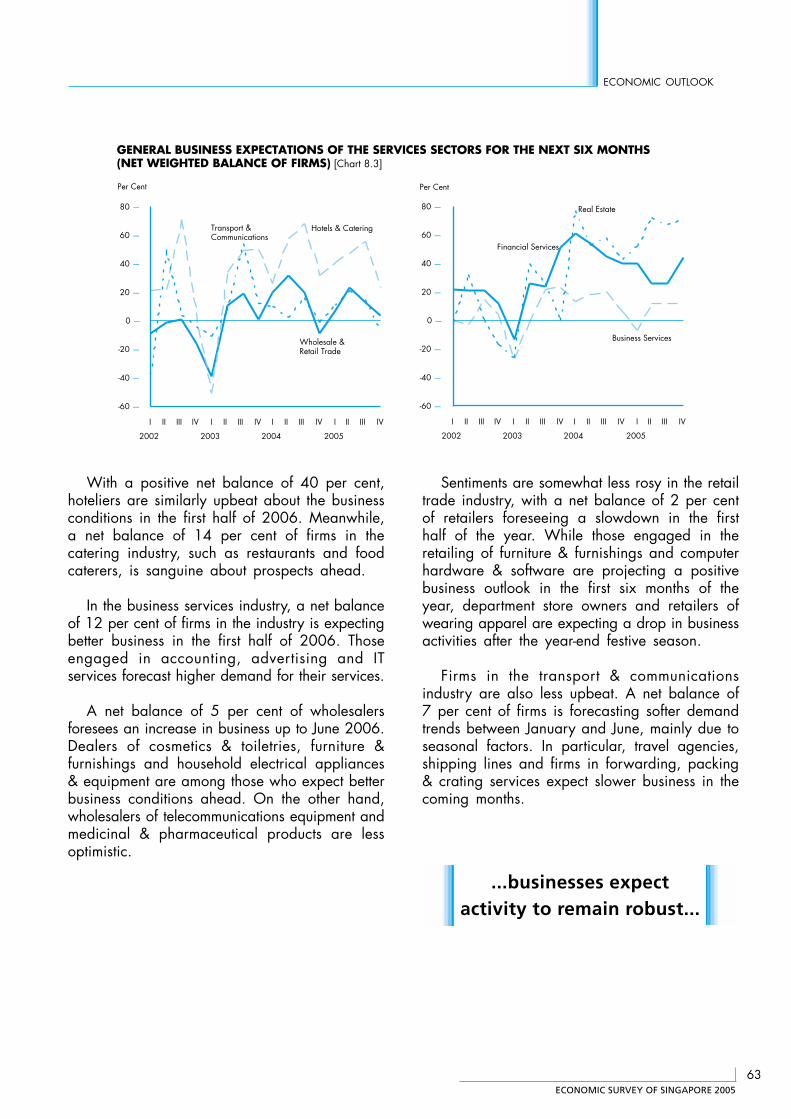
ECONOMIC SURVEY OF SINGAPORE 2005
63
ECONOMIC OUTLOOK
With a positive net balance of 40 per cent,hoteliers are similarly upbeat about the businessconditions in the first half of 2006. Meanwhile,a net balance of 14 per cent of firms in thecatering industry, such as restaurants and foodcaterers, is sanguine about prospects ahead.
In the business services industry, a net balanceof 12 per cent of firms in the industry is expectingbetter business in the first half of 2006. Thoseengaged in accounting, advertising and ITservices forecast higher demand for their services.
A net balance of 5 per cent of wholesalersforesees an increase in business up to June 2006.Dealers of cosmetics & toiletries, furniture &furnishings and household electrical appliances& equipment are among those who expect betterbusiness conditions ahead. On the other hand,wholesalers of telecommunications equipment andmedicinal & pharmaceutical products are lessoptimistic.
Sentiments are somewhat less rosy in the retailtrade industry, with a net balance of 2 per centof retailers foreseeing a slowdown in the firsthalf of the year. While those engaged in theretailing of furniture & furnishings and computerhardware & software are projecting a positivebusiness outlook in the first six months of theyear, department store owners and retailers ofwearing apparel are expecting a drop in businessactivities after the year-end festive season.
Firms in the transport & communicationsindustry are also less upbeat. A net balance of7 per cent of firms is forecasting softer demandtrends between January and June, mainly due toseasonal factors. In particular, travel agencies,shipping lines and firms in forwarding, packing& crating services expect slower business in thecoming months.
-60 —
-40 —
-20 —
0 —
20 —
40 —
60 —
80 —
I
2002
II III IV I
2003
II III IV I
2004
II III IV I
2005
II III IV
-60 —
-40 —
-20 —
0 —
20 —
40 —
60 —
80 —
I
2002
II III IV I
2003
II III IV I
2004
II III IV I
2005
II III IV
Hotels & Catering
Real Estate
GENERAL BUSINESS EXPECTATIONS OF THE SERVICES SECTORS FOR THE NEXT SIX MONTHS (NET WEIGHTED BALANCE OF FIRMS) [Chart 8.3]
Per Cent Per Cent
Transport &Communications
Wholesale &Retail Trade
Financial Services
Business Services
...businesses expectactivity to remain robust...
ECONOMIC SURVEY OF SINGAPORE 2005
64
Chapter 8
ECONOMIC OUTLOOK
Contributed by:
Economics and Strategy DivisionMinistry of Trade and Industry
CONCLUSION
Outlook in 2006 has improved…
The Singapore economy grew by a healthy6.4 per cent in 2005 after a strong 8.7 percent growth in the previous year. Forward-lookingindicators point to continued growth in the nextfew quarters. The CLI rose for the fourthconsecutive quarter in the fourth quarter. The latestsurveys of business expectations show thatbusinesses in both manufacturing and servicesare optimistic about business conditions in thenext 6 months.
These reflect the general optimism concerningthe global economic environment in 2006. TheWorld Bank projected the world economy tomaintain its growth at 3.2 per cent this year,same as in 2005 in which it continued to registerhealthy performance despite the impediments ofhigher oil prices and natural calamities.
Growth in the US economy is expected toremain healthy this year despite some concernsover higher interest rates and its twin deficits.There are also growing optimism in the Japaneseand EU economies. China and India are expectedto turn in another year of strong growth. Theregional economies, too, are likely to registersteady gains this year.
Global electronics demand is expected tomaintain its growth momentum this year, on theback of continuing gains in consumer electronicssales. The problem of excess inventory in somesegments of the IT industry appeared to havecleared over the course of 2005, which shouldgive production a further boost. Research houseGartner has projected global semiconductor salesto grow by 7.6 per cent, following a 6.8 percent increase in 2005.
On the domestic front, the improvement in theunemployment rate to 2.5 per cent at the end of2005 will improve consumer sentiments. This andcontinued robust external demand couldencourage businesses to increase capitalspending, boosting domestic demand.
While the general economic outlook is benign,some downside risks persist. Most notable is thecontinuing tightness of the supply-demand situationin the oil industry. Recent developments inimportant oil producing countries highlighted thatsupply disruptions could lead to spikes in oilprices. Other uncertainties include an abruptunwinding of current international imbalances,threats of terrorism and an outbreak of Avian fluamong humans.
In view of the positive developments in theexternal economic environment and domesticdemand, the Ministry of Trade and Industry hasraised the 2006 GDP growth forecast to between4 per cent and 6 per cent, from the previousforecast of between 3 per cent and 5 per cent.
...2006 growth forecastrevised to 4 – 6 per cent...
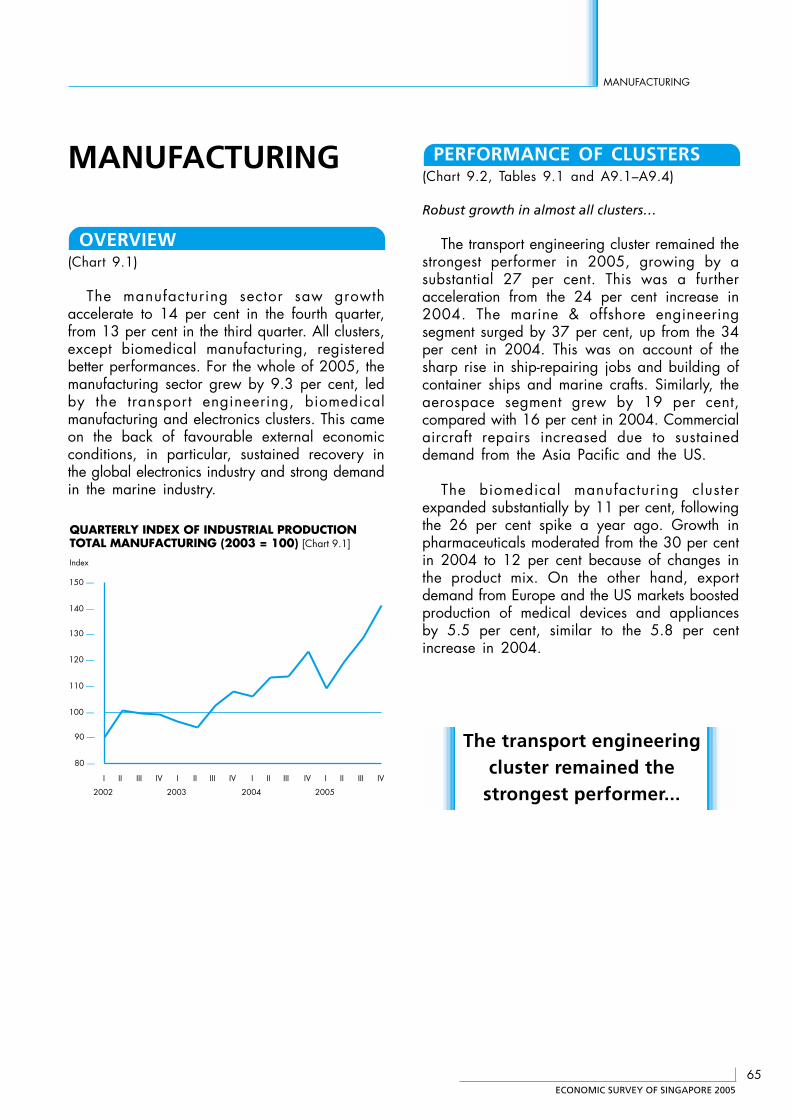
ECONOMIC SURVEY OF SINGAPORE 2005
65
MANUFACTURING
MANUFACTURING
OVERVIEW(Chart 9.1)
The manufacturing sector saw growthaccelerate to 14 per cent in the fourth quarter,from 13 per cent in the third quarter. All clusters,except biomedical manufacturing, registeredbetter performances. For the whole of 2005, themanufacturing sector grew by 9.3 per cent, ledby the transport engineering, biomedicalmanufacturing and electronics clusters. This cameon the back of favourable external economicconditions, in particular, sustained recovery inthe global electronics industry and strong demandin the marine industry.
PERFORMANCE OF CLUSTERS(Chart 9.2, Tables 9.1 and A9.1–A9.4)
Robust growth in almost all clusters…
The transport engineering cluster remained thestrongest performer in 2005, growing by asubstantial 27 per cent. This was a furtheracceleration from the 24 per cent increase in2004. The marine & offshore engineeringsegment surged by 37 per cent, up from the 34per cent in 2004. This was on account of thesharp rise in ship-repairing jobs and building ofcontainer ships and marine crafts. Similarly, theaerospace segment grew by 19 per cent,compared with 16 per cent in 2004. Commercialaircraft repairs increased due to sustaineddemand from the Asia Pacific and the US.
The biomedical manufacturing clusterexpanded substantially by 11 per cent, followingthe 26 per cent spike a year ago. Growth inpharmaceuticals moderated from the 30 per centin 2004 to 12 per cent because of changes inthe product mix. On the other hand, exportdemand from Europe and the US markets boostedproduction of medical devices and appliancesby 5.5 per cent, similar to the 5.8 per centincrease in 2004.
80 —
90 —
100 —
110 —
120 —
130 —
140 —
150 —
I
2002
II III IV I
2003
II III IV I
2004
II III IV I
2005
II III IV
QUARTERLY INDEX OF INDUSTRIAL PRODUCTION TOTAL MANUFACTURING (2003 = 100) [Chart 9.1]
Index
The transport engineeringcluster remained the
strongest performer...
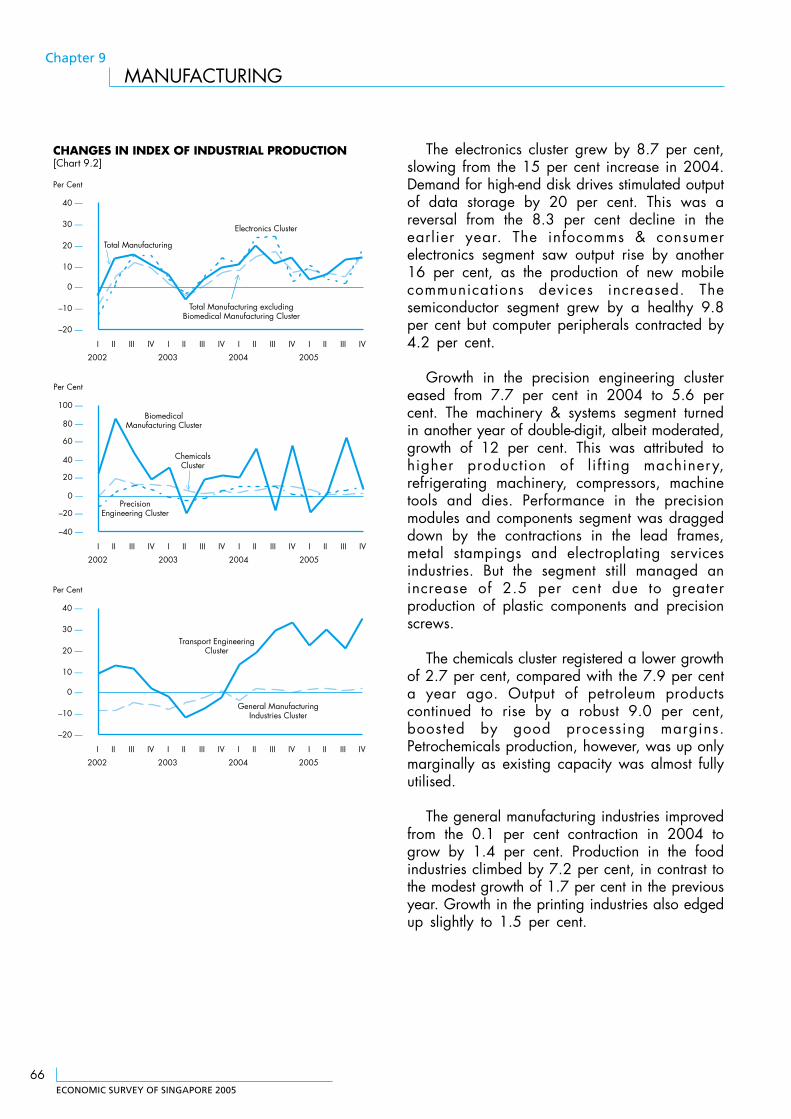
ECONOMIC SURVEY OF SINGAPORE 2005
66
Chapter 9
MANUFACTURING
The electronics cluster grew by 8.7 per cent,slowing from the 15 per cent increase in 2004.Demand for high-end disk drives stimulated outputof data storage by 20 per cent. This was areversal from the 8.3 per cent decline in theearlier year. The infocomms & consumerelectronics segment saw output rise by another16 per cent, as the production of new mobilecommunications devices increased. Thesemiconductor segment grew by a healthy 9.8per cent but computer peripherals contracted by4.2 per cent.
Growth in the precision engineering clustereased from 7.7 per cent in 2004 to 5.6 percent. The machinery & systems segment turnedin another year of double-digit, albeit moderated,growth of 12 per cent. This was attributed tohigher production of lif t ing machinery,refrigerating machinery, compressors, machinetools and dies. Performance in the precisionmodules and components segment was draggeddown by the contractions in the lead frames,metal stampings and electroplating servicesindustries. But the segment still managed anincrease of 2.5 per cent due to greaterproduction of plastic components and precisionscrews.
The chemicals cluster registered a lower growthof 2.7 per cent, compared with the 7.9 per centa year ago. Output of petroleum productscontinued to rise by a robust 9.0 per cent,boosted by good processing margins.Petrochemicals production, however, was up onlymarginally as existing capacity was almost fullyutilised.
The general manufacturing industries improvedfrom the 0.1 per cent contraction in 2004 togrow by 1.4 per cent. Production in the foodindustries climbed by 7.2 per cent, in contrast tothe modest growth of 1.7 per cent in the previousyear. Growth in the printing industries also edgedup slightly to 1.5 per cent.
I
2002
II III IV I
2003
II III IV I
2004
II III IV I
2005
II III IV
CHANGES IN INDEX OF INDUSTRIAL PRODUCTION[Chart 9.2]
Per Cent
2002 2003 2004 2005
Total Manufacturing
PrecisionEngineering Cluster
Electronics Cluster
Per Cent
ChemicalsCluster
BiomedicalManufacturing Cluster
Per Cent
I
2002
II III IV I
2003
II III IV I
2004
II III IV I
2005
II III IV
General ManufacturingIndustries Cluster
Transport EngineeringCluster
Total Manufacturing excludingBiomedical Manufacturing Cluster
–20 —
–10 —
0 —
10 —
20 —
30 —
40 —
I II III IV I II III IV I II III IV I II III IV
–40 —
–20 —
0 —
20 —
40 —
60 —
80 —
100 —
–20 —
–10 —
0 —
10 —
20 —
30 —
40 —
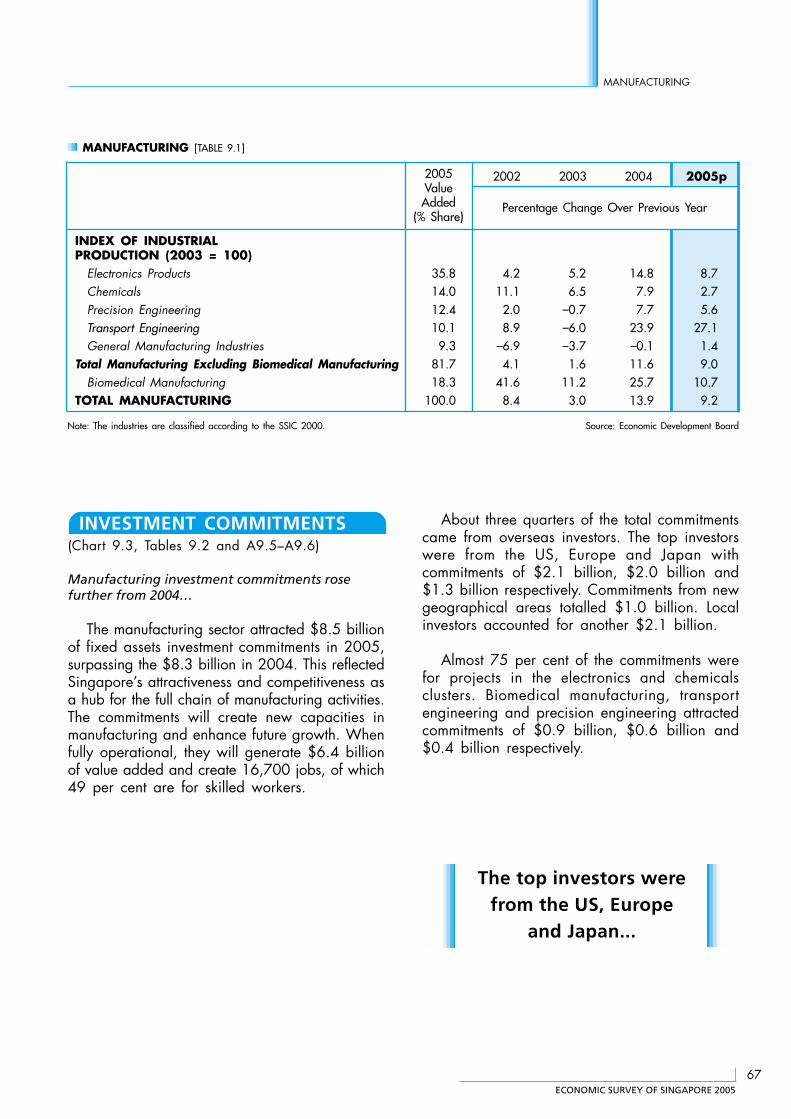
ECONOMIC SURVEY OF SINGAPORE 2005
67
MANUFACTURING
INVESTMENT COMMITMENTS(Chart 9.3, Tables 9.2 and A9.5–A9.6)
Manufacturing investment commitments rosefurther from 2004…
The manufacturing sector attracted $8.5 billionof fixed assets investment commitments in 2005,surpassing the $8.3 billion in 2004. This reflectedSingapore’s attractiveness and competitiveness asa hub for the full chain of manufacturing activities.The commitments will create new capacities inmanufacturing and enhance future growth. Whenfully operational, they will generate $6.4 billionof value added and create 16,700 jobs, of which49 per cent are for skilled workers.
About three quarters of the total commitmentscame from overseas investors. The top investorswere from the US, Europe and Japan withcommitments of $2.1 billion, $2.0 billion and$1.3 billion respectively. Commitments from newgeographical areas totalled $1.0 billion. Localinvestors accounted for another $2.1 billion.
Almost 75 per cent of the commitments werefor projects in the electronics and chemicalsclusters. Biomedical manufacturing, transportengineering and precision engineering attractedcommitments of $0.9 billion, $0.6 billion and$0.4 billion respectively.
MANUFACTURING [TABLE 9.1]
2002 2003 2004 2005p
Percentage Change Over Previous Year
INDEX OF INDUSTRIALPRODUCTION (2003 = 100)
Electronics Products 35.8 4.2 5.2 14.8 8.7Chemicals 14.0 11.1 6.5 7.9 2.7Precision Engineering 12.4 2.0 –0.7 7.7 5.6Transport Engineering 10.1 8.9 –6.0 23.9 27.1General Manufacturing Industries 9.3 –6.9 –3.7 –0.1 1.4
Total Manufacturing Excluding Biomedical Manufacturing 81.7 4.1 1.6 11.6 9.0Biomedical Manufacturing 18.3 41.6 11.2 25.7 10.7
TOTAL MANUFACTURING 100.0 8.4 3.0 13.9 9.2
Note: The industries are classified according to the SSIC 2000. Source: Economic Development Board
2005ValueAdded
(% Share)
The top investors werefrom the US, Europe
and Japan...
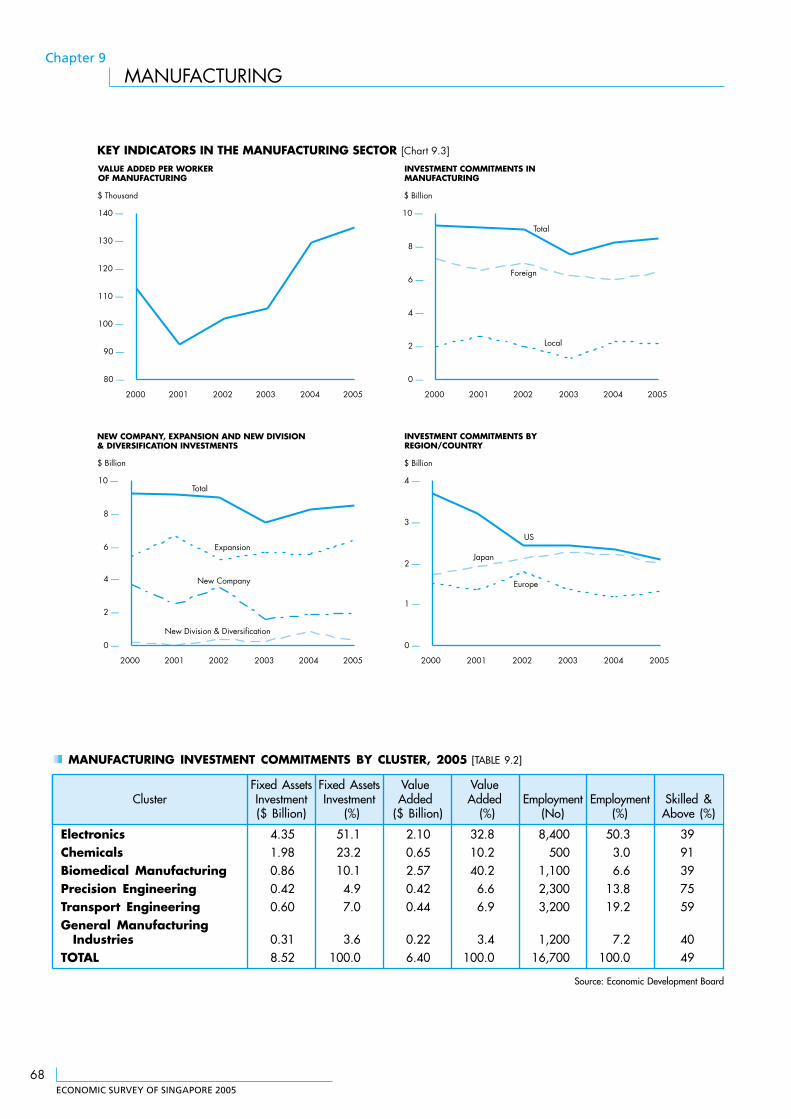
ECONOMIC SURVEY OF SINGAPORE 2005
68
Chapter 9
MANUFACTURING
0 —
1 —
2 —
3 —
4 —
2000 2001 2002 2003 2004 2005
0 —
2 —
4 —
6 —
8 —
10 —
2000 2001 2002 2003 2004 2005
KEY INDICATORS IN THE MANUFACTURING SECTOR [Chart 9.3]
INVESTMENT COMMITMENTS INMANUFACTURING
80 —
90 —
100 —
110 —
120 —
130 —
140 —
2000 2001 2002 2003 2004 2005
$ Thousand
VALUE ADDED PER WORKEROF MANUFACTURING
$ Billion
NEW COMPANY, EXPANSION AND NEW DIVISION & DIVERSIFICATION INVESTMENTS
$ Billion
INVESTMENT COMMITMENTS BYREGION/COUNTRY
0 —
2 —
4 —
6 —
8 —
10 —
2000 2001 2002 2003 2004 2005
$ Billion
Total
Total
ExpansionUS
Japan
Foreign
Local
New Division & Diversification
EuropeNew Company
MANUFACTURING INVESTMENT COMMITMENTS BY CLUSTER, 2005 [TABLE 9.2]
Fixed Assets Fixed Assets Value ValueCluster Investment Investment Added Added Employment Employment Skilled &
($ Billion) (%) ($ Billion) (%) (No) (%) Above (%)
Electronics 4.35 51.1 2.10 32.8 8,400 50.3 39Chemicals 1.98 23.2 0.65 10.2 500 3.0 91Biomedical Manufacturing 0.86 10.1 2.57 40.2 1,100 6.6 39Precision Engineering 0.42 4.9 0.42 6.6 2,300 13.8 75Transport Engineering 0.60 7.0 0.44 6.9 3,200 19.2 59General Manufacturing
Industries 0.31 3.6 0.22 3.4 1,200 7.2 40TOTAL 8.52 100.0 6.40 100.0 16,700 100.0 49
Source: Economic Development Board
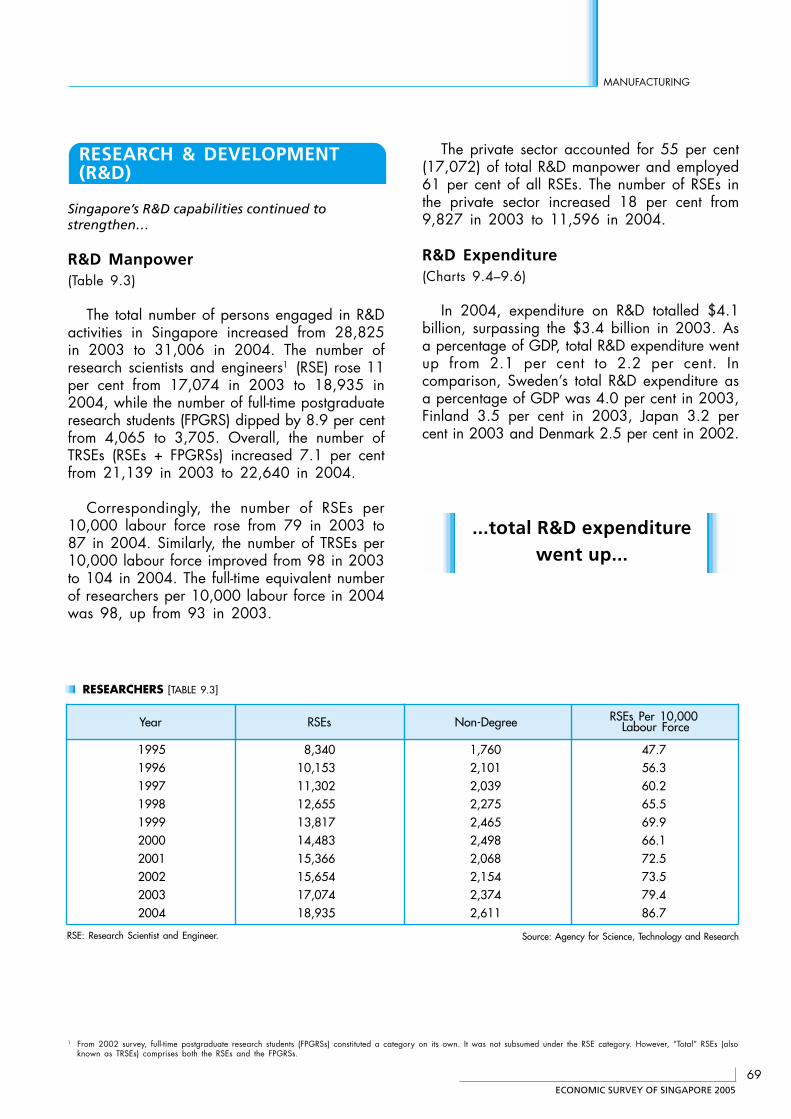
ECONOMIC SURVEY OF SINGAPORE 2005
69
MANUFACTURING
RESEARCH & DEVELOPMENT(R&D)
Singapore’s R&D capabilities continued tostrengthen…
R&D Manpower(Table 9.3)
The total number of persons engaged in R&Dactivities in Singapore increased from 28,825in 2003 to 31,006 in 2004. The number ofresearch scientists and engineers1 (RSE) rose 11per cent from 17,074 in 2003 to 18,935 in2004, while the number of full-time postgraduateresearch students (FPGRS) dipped by 8.9 per centfrom 4,065 to 3,705. Overall, the number ofTRSEs (RSEs + FPGRSs) increased 7.1 per centfrom 21,139 in 2003 to 22,640 in 2004.
Correspondingly, the number of RSEs per10,000 labour force rose from 79 in 2003 to87 in 2004. Similarly, the number of TRSEs per10,000 labour force improved from 98 in 2003to 104 in 2004. The full-time equivalent numberof researchers per 10,000 labour force in 2004was 98, up from 93 in 2003.
The private sector accounted for 55 per cent(17,072) of total R&D manpower and employed61 per cent of all RSEs. The number of RSEs inthe private sector increased 18 per cent from9,827 in 2003 to 11,596 in 2004.
R&D Expenditure(Charts 9.4–9.6)
In 2004, expenditure on R&D totalled $4.1billion, surpassing the $3.4 billion in 2003. Asa percentage of GDP, total R&D expenditure wentup from 2.1 per cent to 2.2 per cent. Incomparison, Sweden’s total R&D expenditure asa percentage of GDP was 4.0 per cent in 2003,Finland 3.5 per cent in 2003, Japan 3.2 percent in 2003 and Denmark 2.5 per cent in 2002.
Source: Agency for Science, Technology and ResearchRSE: Research Scientist and Engineer.
RESEARCHERS [TABLE 9.3]
RSEs Per 10,000Year RSEs Non-Degree Labour Force
1995 8,340 1,760 47.71996 10,153 2,101 56.31997 11,302 2,039 60.21998 12,655 2,275 65.51999 13,817 2,465 69.92000 14,483 2,498 66.12001 15,366 2,068 72.52002 15,654 2,154 73.52003 17,074 2,374 79.42004 18,935 2,611 86.7
1 From 2002 survey, full-time postgraduate research students (FPGRSs) constituted a category on its own. It was not subsumed under the RSE category. However, “Total” RSEs (alsoknown as TRSEs) comprises both the RSEs and the FPGRSs.
...total R&D expenditurewent up...
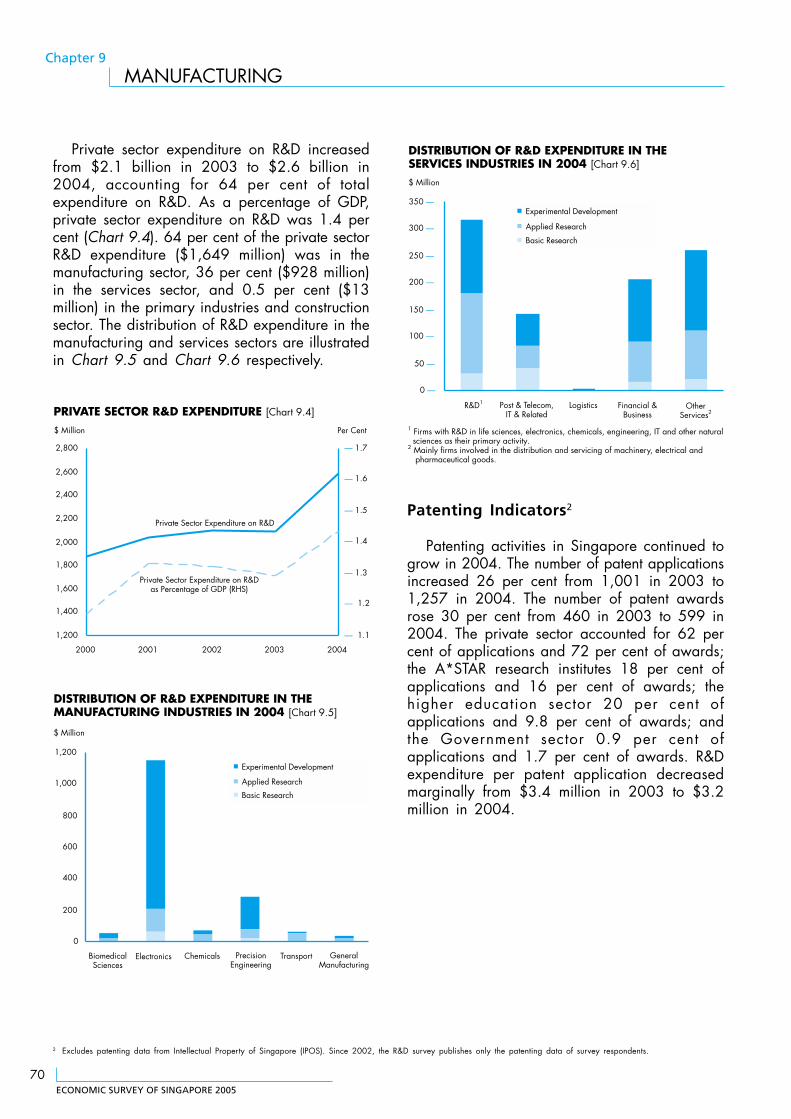
ECONOMIC SURVEY OF SINGAPORE 2005
70
Chapter 9
MANUFACTURING
Private sector expenditure on R&D increasedfrom $2.1 billion in 2003 to $2.6 billion in2004, accounting for 64 per cent of totalexpenditure on R&D. As a percentage of GDP,private sector expenditure on R&D was 1.4 percent (Chart 9.4). 64 per cent of the private sectorR&D expenditure ($1,649 million) was in themanufacturing sector, 36 per cent ($928 million)in the services sector, and 0.5 per cent ($13million) in the primary industries and constructionsector. The distribution of R&D expenditure in themanufacturing and services sectors are illustratedin Chart 9.5 and Chart 9.6 respectively.
PRIVATE SECTOR R&D EXPENDITURE [Chart 9.4]
1,200
1,400
1,600
1,800
2,000
2,200
2,400
2,600
2,800
2000 2001 2002 2003 2004
— 1.1
— 1.2
— 1.3
— 1.4
— 1.5
— 1.6
— 1.7
$ Million
Private Sector Expenditure on R&D
Per Cent
Private Sector Expenditure on R&Das Percentage of GDP (RHS)
0
200
400
600
800
1,000
1,200
Electronics Chemicals Transport GeneralManufacturing
Experimental Development
Applied Research
Basic Research
$ Million
DISTRIBUTION OF R&D EXPENDITURE IN THE MANUFACTURING INDUSTRIES IN 2004 [Chart 9.5]
BiomedicalSciences
PrecisionEngineering
2 Excludes patenting data from Intellectual Property of Singapore (IPOS). Since 2002, the R&D survey publishes only the patenting data of survey respondents.
0 —
50 —
100 —
150 —
200 —
250 —
300 —
350 —
Logistics
Experimental Development
Applied Research
Basic Research
$ Million
R&D1 Post & Telecom,IT & Related
Financial &Business
OtherServices2
1 Firms with R&D in life sciences, electronics, chemicals, engineering, IT and other natural sciences as their primary activity.2 Mainly firms involved in the distribution and servicing of machinery, electrical and pharmaceutical goods.
DISTRIBUTION OF R&D EXPENDITURE IN THE SERVICES INDUSTRIES IN 2004 [Chart 9.6]
Patenting Indicators2
Patenting activities in Singapore continued togrow in 2004. The number of patent applicationsincreased 26 per cent from 1,001 in 2003 to1,257 in 2004. The number of patent awardsrose 30 per cent from 460 in 2003 to 599 in2004. The private sector accounted for 62 percent of applications and 72 per cent of awards;the A*STAR research institutes 18 per cent ofapplications and 16 per cent of awards; thehigher education sector 20 per cent ofapplications and 9.8 per cent of awards; andthe Government sector 0.9 per cent ofapplications and 1.7 per cent of awards. R&Dexpenditure per patent application decreasedmarginally from $3.4 million in 2003 to $3.2million in 2004.
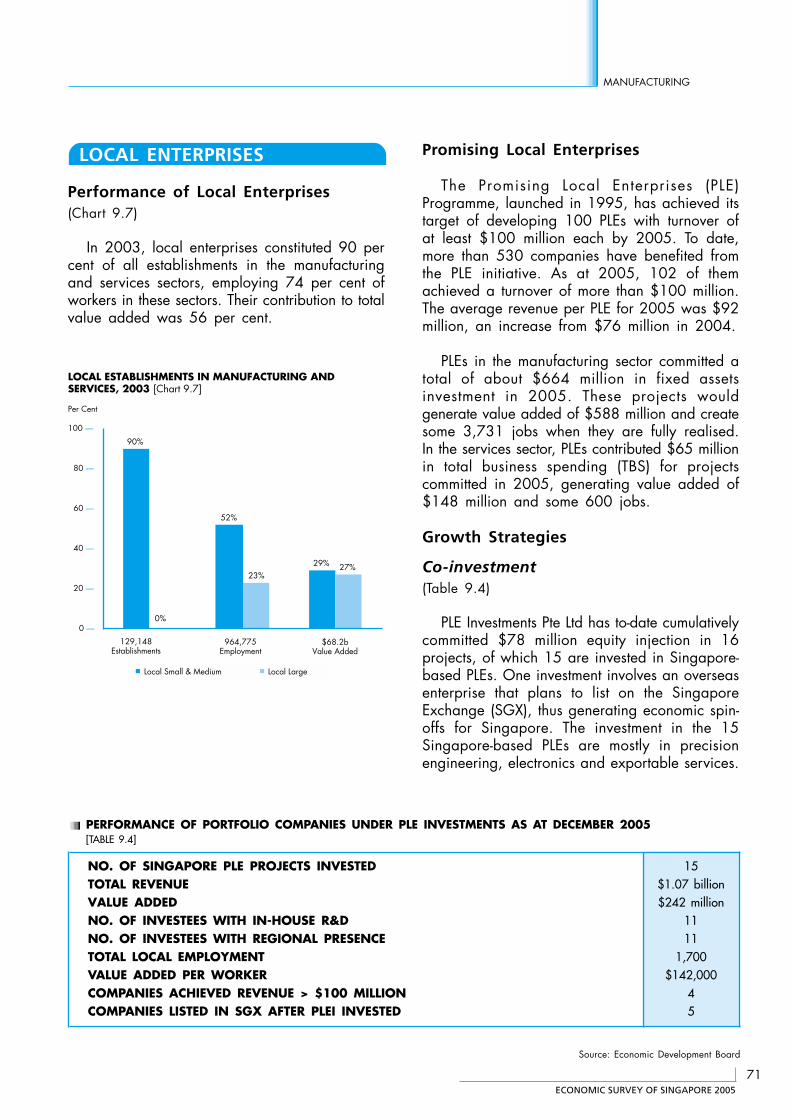
ECONOMIC SURVEY OF SINGAPORE 2005
71
MANUFACTURING
LOCAL ENTERPRISES
Performance of Local Enterprises(Chart 9.7)
In 2003, local enterprises constituted 90 percent of all establishments in the manufacturingand services sectors, employing 74 per cent ofworkers in these sectors. Their contribution to totalvalue added was 56 per cent.
Promising Local Enterprises
The Promising Local Enterprises (PLE)Programme, launched in 1995, has achieved itstarget of developing 100 PLEs with turnover ofat least $100 million each by 2005. To date,more than 530 companies have benefited fromthe PLE initiative. As at 2005, 102 of themachieved a turnover of more than $100 million.The average revenue per PLE for 2005 was $92million, an increase from $76 million in 2004.
PLEs in the manufacturing sector committed atotal of about $664 million in fixed assetsinvestment in 2005. These projects wouldgenerate value added of $588 million and createsome 3,731 jobs when they are fully realised.In the services sector, PLEs contributed $65 millionin total business spending (TBS) for projectscommitted in 2005, generating value added of$148 million and some 600 jobs.
Growth Strategies
Co-investment(Table 9.4)
PLE Investments Pte Ltd has to-date cumulativelycommitted $78 million equity injection in 16projects, of which 15 are invested in Singapore-based PLEs. One investment involves an overseasenterprise that plans to list on the SingaporeExchange (SGX), thus generating economic spin-offs for Singapore. The investment in the 15Singapore-based PLEs are mostly in precisionengineering, electronics and exportable services.
90%
52%
29%
0%
23%27%
0 —
20 —
40 —
60 —
80 —
100 —
Local Small & Medium Local Large
Per Cent
LOCAL ESTABLISHMENTS IN MANUFACTURING AND SERVICES, 2003 [Chart 9.7]
129,148Establishments
964,775Employment
$68.2bValue Added
PERFORMANCE OF PORTFOLIO COMPANIES UNDER PLE INVESTMENTS AS AT DECEMBER 2005[TABLE 9.4]
NO. OF SINGAPORE PLE PROJECTS INVESTED 15TOTAL REVENUE $1.07 billionVALUE ADDED $242 millionNO. OF INVESTEES WITH IN-HOUSE R&D 11NO. OF INVESTEES WITH REGIONAL PRESENCE 11TOTAL LOCAL EMPLOYMENT 1,700VALUE ADDED PER WORKER $142,000COMPANIES ACHIEVED REVENUE > $100 MILLION 4COMPANIES LISTED IN SGX AFTER PLEI INVESTED 5
Source: Economic Development Board
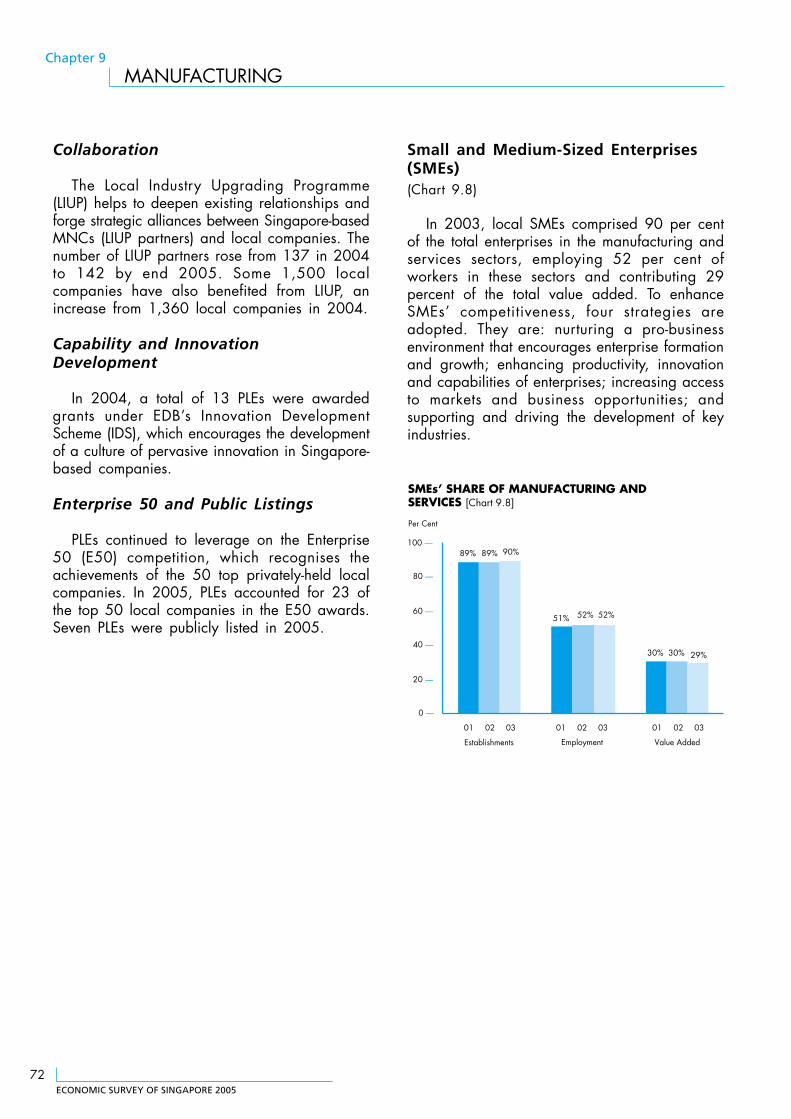
ECONOMIC SURVEY OF SINGAPORE 2005
72
Chapter 9
MANUFACTURING
Collaboration
The Local Industry Upgrading Programme(LIUP) helps to deepen existing relationships andforge strategic alliances between Singapore-basedMNCs (LIUP partners) and local companies. Thenumber of LIUP partners rose from 137 in 2004to 142 by end 2005. Some 1,500 localcompanies have also benefited from LIUP, anincrease from 1,360 local companies in 2004.
Capability and InnovationDevelopment
In 2004, a total of 13 PLEs were awardedgrants under EDB’s Innovation DevelopmentScheme (IDS), which encourages the developmentof a culture of pervasive innovation in Singapore-based companies.
Enterprise 50 and Public Listings
PLEs continued to leverage on the Enterprise50 (E50) competition, which recognises theachievements of the 50 top privately-held localcompanies. In 2005, PLEs accounted for 23 ofthe top 50 local companies in the E50 awards.Seven PLEs were publicly listed in 2005.
Small and Medium-Sized Enterprises(SMEs)(Chart 9.8)
In 2003, local SMEs comprised 90 per centof the total enterprises in the manufacturing andservices sectors, employing 52 per cent ofworkers in these sectors and contributing 29percent of the total value added. To enhanceSMEs’ competitiveness, four strategies areadopted. They are: nurturing a pro-businessenvironment that encourages enterprise formationand growth; enhancing productivity, innovationand capabilities of enterprises; increasing accessto markets and business opportunities; andsupporting and driving the development of keyindustries.
89% 89%
51%
30% 30%
52%
90%
52%
29%
0 —
20 —
40 —
60 —
80 —
100 —
01 02 03 01 02 03 01 02 03
Establishments Employment
SMEs’ SHARE OF MANUFACTURING AND SERVICES [Chart 9.8]
Per Cent
Value Added
ECONOMIC SURVEY OF SINGAPORE 2005
73
MANUFACTURING
(1) Nurturing a Pro-BusinessEnvironment
Broad-Based Assistance
SME First Stop
The SME First Stop was set up in 1998 toserve as a convenient first point of contact forSMEs to access information on Governmentassistance and regulations governing theirbusiness. In 2005, it facilitated some 7,700 casesof enquiries, bringing a total of 61,450 since itslaunch.
Enterprise Development Centres
To widen the reach to SMEs, EnterpriseDevelopment Centres (EDCs) have been set up.The EDCs provide first-level advisory anddiagnostic services and second-level consultancyservices for SMEs requiring in-depth consultancyfor more complex process and system changes.Two such centres, EDC@ASME and EDC@SMawere launched in 2005, at the Associations ofSmall and Medium Enterprises (ASME) andSingapore Manufacturers’ Federation (SMa),respectively.
Access to Finance
Deal Flow Connection
Deal Flow Connection (www.dealflow.org.sg)is a platform that links SMEs seeking funds withfinanciers and investors through the help offinancial intermediaries. In 2005, more than 250matches were facilitated. Besides matchingservices, the portal also offers entrepreneursaccess to information and advice on finance-related issues.
SME Credit Bureau
SME Credit Bureau is Singapore’s first centraldatabase on credit-related information on SMEs.It aims to enhance the credit transparency ofSMEs and lessen the challenges they face inobtaining financing. It was launched in March2005, together with the Association of Small andMedium Enterprises, Singapore BusinessFederation and Infocredit D&B (Singapore) PteLtd.
SME ACCESS Loan
A new SME financing scheme, SME ACCESSLoan, which taps funds from the capital marketwas launched in April 2005. The new scheme isspecially designed for SMEs with limited trackrecord, constrained by lack of collateral or faceddifficulty in getting loans for internationalisation.
Loan Financing Schemes
Local Enterprise Finance Scheme (LEFS) offersfixed interest rate loans to help enterprisesupgrade and expand their operations. LoanInsurance Scheme (LIS) provides an alternativeaccess to financing through the use of loaninsurance. Under LIS, Participating FinancialInstitutions (PFIs) have the added flexibility ofusing their own funds to package attractive loanfacilities for the enterprises based on their riskprofile. A portion of the loans will be insuredagainst default risks. A total of 5,919 LEFS/LISapplications, amounting to $699 million wereapproved in 2005. Some 3,207 enterprises tookup LEFS/LIS for the first time in 2005.
ECONOMIC SURVEY OF SINGAPORE 2005
74
Chapter 9
MANUFACTURING
Entrepreneurship Promotion
BlueSky Exchange, BlueSky Evening & BlueSkyFestival
The Action Community for Entrepreneurship(ACE) organises activities regularly to promotedialogue and networking among entrepreneurs.The BlueSky Exchange is a roundtable discussionbetween entrepreneurs and ACE members wherethey can bring up issues, suggest ideas and seekhelp and advice for their business. The BlueSkyEvening is an informal networking session forentrepreneurs and aspiring entrepreneurs to buildcontacts, and share and learn from one another.In 2005, some 640 entrepreneurs attended thedialogue and networking sessions organised byACE. The second BlueSky Festival to celebrateand showcase the spirit of entrepreneurship,organised in July 2005, attracted some 1,200participants and 8,500 visitors.
Entrepreneurial Talent Development Fund
The $25 million Entrepreneurial TalentDevelopment Fund was set up in June 2004 todevelop entrepreneurial talent by encouraging“learning by doing”. A total of 300 students fromeight institutes of higher learning are expectedto participate in 70 business ventures over thenext five years. As at end 2005, 22 studentbusiness ventures worth $900,000 were funded.
(2) Enhancing Productivity, Innovationand Capabilities of Enterprises
Local Enterprise Technical Assistance Scheme
The Local Enterprise Technical AssistanceScheme (LETAS) provides assistance to SMEs todefray the cost of engaging consultants toupgrade and modernise their business operationsin the areas of IT and quality managementsystems. A total of 1,264 LETAS applications,amounting to $7.6 million, were approved in2005. 962 companies took up LETAS for thefirst time in 2005.
BrandPact™
The $20 million capability developmentinitiative – BrandPact™ – was launched in April2005. It includes brand training workshops,brand diagnostics, online resources as well asfinancial support for local enterprises as theygrow and expand within Singapore and into theglobal markets. The aim is to raise awarenessand understanding of branding amongenterprises, develop brand-savvy executives andcatalyse the adoption of branding as a strategyfor business competitiveness.
(3) Increasing Access to Markets andBusiness Opportunities
Access to Government Procurement Opportunities
The rules and regulations of GovernmentProcurement were eased in 2004 to give SMEsgreater access to Government projects. A seminarwas organised in June 2005 to brief some 500SMEs on the new Government procurement rules.A new guidebook, “The Government ProcurementGuide for SMEs”, was also launched at theseminar to help SMEs access information onGovernment Procurement procedures and guidethem on how to participate in Governmentprojects.
Access to Business Opportunities in FTA-PartnerMarkets
Awareness among SMEs on trading in goodsand services under the Free Trade Agreements(FTAs) framework was created throughguidebooks, seminars and news alert. This hashelped SMEs leverage on the FTAs Singaporehas concluded with key trading partners such asthe US, European Free Trade Area, Japan,Australia and New Zealand. In 2005, some 670SMEs were reached through the variousawareness programmes.
ECONOMIC SURVEY OF SINGAPORE 2005
75
MANUFACTURING
(4) Supporting and Driving theDevelopment of Key Industries
Partnering Industry to Develop KeySectors
Local Enterprise and Association DevelopmentProgramme
The Local Enterprise and AssociationDevelopment (LEAD) programme was launchedin May 2005. A total of $50 million has beenset aside to develop industry capabilities andgrow SMEs in key industries. The programme alsoaims to strengthen the leadership of the industryassociations so that they play an instrumental rolein the improvement and upgrading of theirindustries.
Retail
Warehouse Retail Scheme
A new Warehouse Retail Scheme (WRS) waspiloted in 2005 with three retailers - Ikea, Courtsand Giant. The projects are expected to generatea capital investment of about $200 million and1,700 jobs. The retailers will house their regionalactivities and flagship stores in a land area of9.3 ha at Tampines.
Customer Centric Initiative
A Customer Centric Initiative (CCI) for theRetail Sector was launched in August 2005. It isa nation-wide programme aimed at transformingSingapore’s service standards in the retailindustry, and encouraging companies to becommitted to service excellence. As at 2005, 20retailers with some 900 outlets and 20,000service staff in Singapore had participated in thisinitiative.
Food Manufacturing
HACCP System
Two food safety certification initiatives wereintroduced to encourage food manufacturers toadopt the Hazard Analysis and Critical ControlPoint (HACCP) system. The HACCP Toolkit, a self-help tool for HACCP implementation, was pilot-tested with ten food manufacturers and launchedin December 2004. An Accreditation Scheme forHACCP Certification Bodies was introduced in2005. As HACCP is recognised by food safetyprofessionals and regulators worldwide, theseinitiatives will help HACCP-certified foodmanufacturers gain greater access to overseasmarkets.
Singapore Premium Food Gifts Programme
The Singapore Premium Food Gifts (SPFG)programme was launched in 2002 to upgradethe capabilities of food companies so that theycan create higher value products for the touristand export market. More than 50 popular localdishes have been developed and packaged asfood gifts. The latest collection of food gifts waslaunched in May 2005. At the same time, ahybrid retail-cum-food & beverage concept wasset up to market the food gifts. The S.P.F.G.Boutique Café at Singapore Changi AirportTerminal 1 is the first such shop dedicated toselling a comprehensive range of SingaporePremium Food Gifts.
ECONOMIC SURVEY OF SINGAPORE 2005
76
Chapter 9
MANUFACTURING
Transport Engineering
Auto-Ignite
A multi-agency initiative, known as “Auto-Ignite”, was launched in October 2005, with theaim to double the revenue of automotivesupporting industry from about $457 million ayear to $1 billion over the next three years. Auto-Ignite will focus on market and capabilitydevelopment for the automotive industry and willprovide technical and financial assistance toaspiring and existing automotive players.
Contributed by:
Ms Kok Yit HoeSenior OfficerResearch and Statistics UnitEconomic Development Board
Jonathan KhooSenior OfficerPolicy Planning DepartmentAgency for Science, Technology and Research
Lim Yoon FooPrincipal ConsultantCorporate Planning DepartmentSPRING Singapore
Ms Lee Li YingSenior OfficerEnterprise Ecosystem DevelopmentEconomic Development Board
Ms Soo Cheng GheeSenior EconomistEconomic and Strategy DivisionMinistry of Trade and Industry
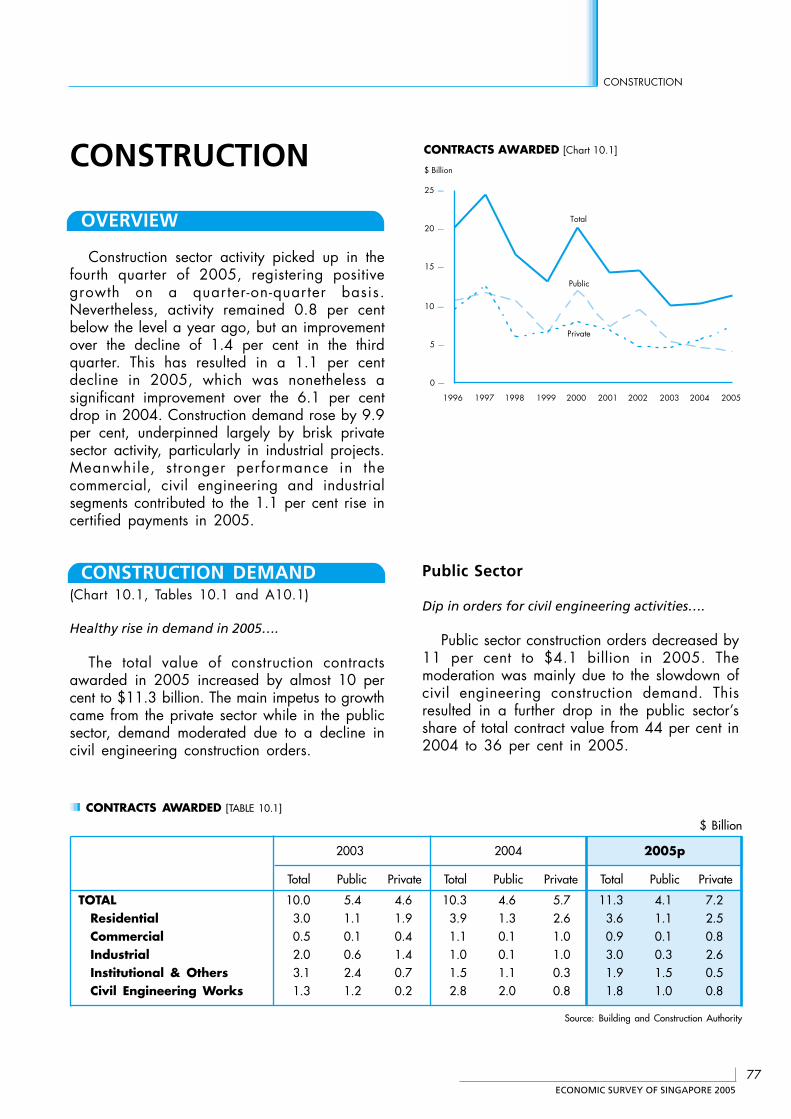
ECONOMIC SURVEY OF SINGAPORE 2005
77
CONSTRUCTION
CONSTRUCTION
OVERVIEW
Construction sector activity picked up in thefourth quarter of 2005, registering positivegrowth on a quarter-on-quarter basis.Nevertheless, activity remained 0.8 per centbelow the level a year ago, but an improvementover the decline of 1.4 per cent in the thirdquarter. This has resulted in a 1.1 per centdecline in 2005, which was nonetheless asignificant improvement over the 6.1 per centdrop in 2004. Construction demand rose by 9.9per cent, underpinned largely by brisk privatesector activity, particularly in industrial projects.Meanwhile, stronger performance in thecommercial, civil engineering and industrialsegments contributed to the 1.1 per cent rise incertified payments in 2005.
CONSTRUCTION DEMAND(Chart 10.1, Tables 10.1 and A10.1)
Healthy rise in demand in 2005….
The total value of construction contractsawarded in 2005 increased by almost 10 percent to $11.3 billion. The main impetus to growthcame from the private sector while in the publicsector, demand moderated due to a decline incivil engineering construction orders.
Public Sector
Dip in orders for civil engineering activities….
Public sector construction orders decreased by11 per cent to $4.1 billion in 2005. Themoderation was mainly due to the slowdown ofcivil engineering construction demand. Thisresulted in a further drop in the public sector’sshare of total contract value from 44 per cent in2004 to 36 per cent in 2005.
CONTRACTS AWARDED [TABLE 10.1]
$ Billion
2003 2004 2005p
Total Public Private Total Public Private Total Public Private
TOTAL 10.0 5.4 4.6 10.3 4.6 5.7 11.3 4.1 7.2Residential 3.0 1.1 1.9 3.9 1.3 2.6 3.6 1.1 2.5Commercial 0.5 0.1 0.4 1.1 0.1 1.0 0.9 0.1 0.8Industrial 2.0 0.6 1.4 1.0 0.1 1.0 3.0 0.3 2.6Institutional & Others 3.1 2.4 0.7 1.5 1.1 0.3 1.9 1.5 0.5Civil Engineering Works 1.3 1.2 0.2 2.8 2.0 0.8 1.8 1.0 0.8
Source: Building and Construction Authority
0 —
5 —
10 —
15 —
20 —
25 —
1996 1997 1998 1999 2000 2001 2002 2003 2004 2005
$ Billion
Private
CONTRACTS AWARDED [Chart 10.1]
Total
Public
ECONOMIC SURVEY OF SINGAPORE 2005
78
Chapter 10
CONSTRUCTION
Total public housing construction ordersdropped slightly to $1.1 billion. HDB awardedabout $655 million worth of new andredevelopment housing projects in 2005, and thehighlight was the award of Pinnacle@Duxton. Theupgrading projects for public housing stabilisedat about 30 per cent of the total public residentialconstruction demand.
Commercial construction orders continued tolanguish at $0.1 billion in the last three years.Its support came primarily from various food andmarket centres upgrading projects.
In contrast, industrial building constructiondemand posted a strong expansion. Despiteminimal development for conventional industrialproperties due to the supply glut in factory space,this category was boosted by the award ofFusionpolis by JTC at One-North.
Likewise, institutional & other buildingconstruction demand also improved over 2004,supported by the award of Changi PrisonComplex Cluster B and various educationaldevelopments by MOE, NTU and NUS.
In contrast to building construction, public civilengineering works was halved to about $1 billionin 2005 after posting a strong year-on-yearexpansion a year ago. Nevertheless, 2005 sawsome notable projects awarded, such as CommonServices Tunnel Phases 1B & 2, Boon Lay MRTextension and its associated mechanical andelectrical works.
Private Sector
Industrial construction orders up sharply…
Private sector construction orders expanded by26 per cent to $7.2 billion in 2005, the highestin the past five years. The surge in demand wasunderpinned by a rebound in industrialconstruction orders in response to strong foreigninvestments in petrochemical and pharmaceuticalfacilities in Singapore.
Residential construction orders moderatedslightly by 3.5 per cent from its 2004 level to$2.5 billion in 2005. Condominium projectsconstituted about 70 per cent of this categorywhile the rest of the demand was mainly madeup of various landed properties developments.Some of the major projects awarded includedCity Square Residences at Kitchener Road, TheSeaview at Amber Road, and Park Infinia at WeeNam Road.
Commercial construction orders slowed downto $834 million, after a robust rebound in 2004.Nevertheless, two prominent projects wereawarded, namely, Singapore Flyer at MarinaPromontory and NTUC’s retail mixed developmentat Ang Mo Kio.
As our economy moves up the technologyladder, demand for complex and highlyspecialised industrial facilities also increases. Thiswas reflected in last year’s industrial constructiondemand, which was the star performer with thehighest value of construction orders inked in2005. The $2.6 billion demand was attributedto several significant projects including KeppelMerlimau Cogen’s cogeneration plant andSumitomo Chemical’s Monomer Plant at JurongIsland.
Institutional construction demand also grewover the year, bolstered by projects such asLasalle-SIA College at Albert Street, TrinityChristian Centre at Paya Lebar Road and BuddhaTooth Relic Temple at South Bridge Road.
Civil engineering construction demandremained strong at $0.8 billion, underpinned byvarious SP Powergrid’s cabling projects, PSACorporation’s berthing and stacking yards, andinfrastructure works for oil tankage expansion byHorizon, Oiltanking Singapore and VopakTerminal.
ECONOMIC SURVEY OF SINGAPORE 2005
79
CONSTRUCTION
CONSTRUCTION ACTIVITIES(Table A10.1)
Progress payments have risen in tandem with thebuildup of orders….
In tandem with the higher constructiondemand, construction output, in terms of certifiedprogress payments, is estimated to improve to$11.7 billion in 2005. The growth was mainlyattributed to the recovery of private sectorconstruction output, which reversed the negativegrowth in 2004. However, public sectorconstruction output growth remained in negativeterritory. Going forward, the higher constructiondemand will strengthen output volume in the nearterm.
Public Sector
Payments continue to decline…
Public sector construction activity shrank by 5.9per cent to $6.1 billion in 2005. Due to the lowbase in 2004 and underpinned by the ongoingconstruction of Singapore Expo’s exhibition hallextension, commercial construction output was theonly segment that saw a positive gain of 17 percent. Construction activities for all otherdevelopment types slowed down, ranging from–0.2 per cent for civil engineering works to –11per cent for institutional & other building projects.
Private Sector
Higher activity levels in the private sector…
Private sector construction activity picked upby 9.8 per cent to $5.7 billion in 2005. Exceptfor residential construction activity whichcontracted by 4.8 per cent, activities in all othersegments recorded positive gains. Civilengineering works registered the highest gain,with total payments more than doubled that in2004. This was largely contributed by cablingprojects, infrastructure works and the constructionof jetties and stacking yards. The commercialsegment posted the second highest growth of 31per cent, supported by new retail developmentsand refurbishment projects.
CONSTRUCTION MATERIALS
Materials costs have risen in world markets ….
Demand for cement, granite, ready-mixedconcrete and steel reinforcement bars contractedby between 2 per cent to 8 per cent in 2005,while bricks saw an increase of 11 per cent indemand. The current market prices of cement,bricks, ready-mixed concrete and graniteescalated by between 11 per cent to 30 percent over the year, driven mainly by rising importand production costs.
CONSTRUCTION COSTS
…translating into higher building costs in 2005 ….
The increases in most basic constructionmaterial costs pushed up the corresponding tenderprices in 2005. Total construction cost, measuredby the Tender Price Index (All Buildings), edgedup 1.4 per cent. The increase was felt acrossthe board for all building types, in the range of0.6 per cent to 1.4 per cent.
Cost of buildingmaterials higher in 2005...
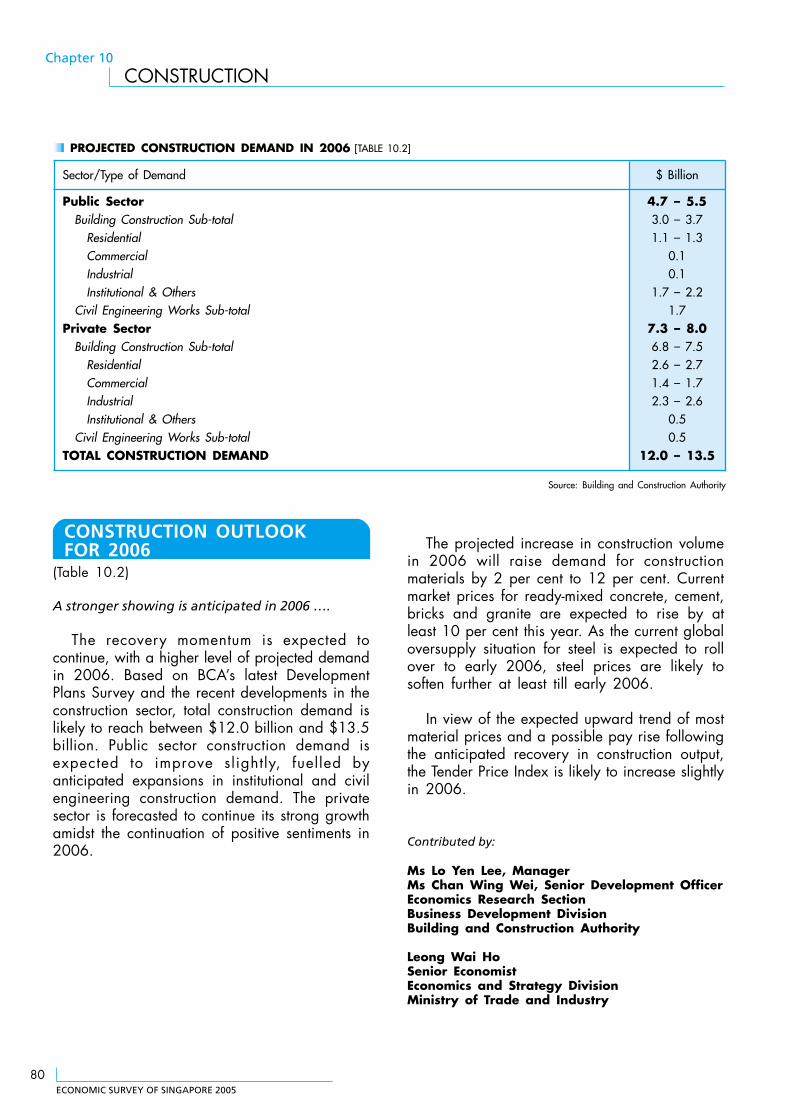
ECONOMIC SURVEY OF SINGAPORE 2005
80
Chapter 10
CONSTRUCTION
CONSTRUCTION OUTLOOKFOR 2006
(Table 10.2)
A stronger showing is anticipated in 2006 ….
The recovery momentum is expected tocontinue, with a higher level of projected demandin 2006. Based on BCA’s latest DevelopmentPlans Survey and the recent developments in theconstruction sector, total construction demand islikely to reach between $12.0 billion and $13.5billion. Public sector construction demand isexpected to improve slightly, fuelled byanticipated expansions in institutional and civilengineering construction demand. The privatesector is forecasted to continue its strong growthamidst the continuation of positive sentiments in2006.
The projected increase in construction volumein 2006 will raise demand for constructionmaterials by 2 per cent to 12 per cent. Currentmarket prices for ready-mixed concrete, cement,bricks and granite are expected to rise by atleast 10 per cent this year. As the current globaloversupply situation for steel is expected to rollover to early 2006, steel prices are likely tosoften further at least till early 2006.
In view of the expected upward trend of mostmaterial prices and a possible pay rise followingthe anticipated recovery in construction output,the Tender Price Index is likely to increase slightlyin 2006.
Contributed by:
Ms Lo Yen Lee, ManagerMs Chan Wing Wei, Senior Development OfficerEconomics Research SectionBusiness Development DivisionBuilding and Construction Authority
Leong Wai HoSenior EconomistEconomics and Strategy DivisionMinistry of Trade and Industry
PROJECTED CONSTRUCTION DEMAND IN 2006 [TABLE 10.2]
Sector/Type of Demand $ Billion
Public Sector 4.7 – 5.5Building Construction Sub-total 3.0 – 3.7
Residential 1.1 – 1.3Commercial 0.1Industrial 0.1Institutional & Others 1.7 – 2.2
Civil Engineering Works Sub-total 1.7Private Sector 7.3 – 8.0
Building Construction Sub-total 6.8 – 7.5Residential 2.6 – 2.7Commercial 1.4 – 1.7Industrial 2.3 – 2.6Institutional & Others 0.5
Civil Engineering Works Sub-total 0.5TOTAL CONSTRUCTION DEMAND 12.0 – 13.5
Source: Building and Construction Authority
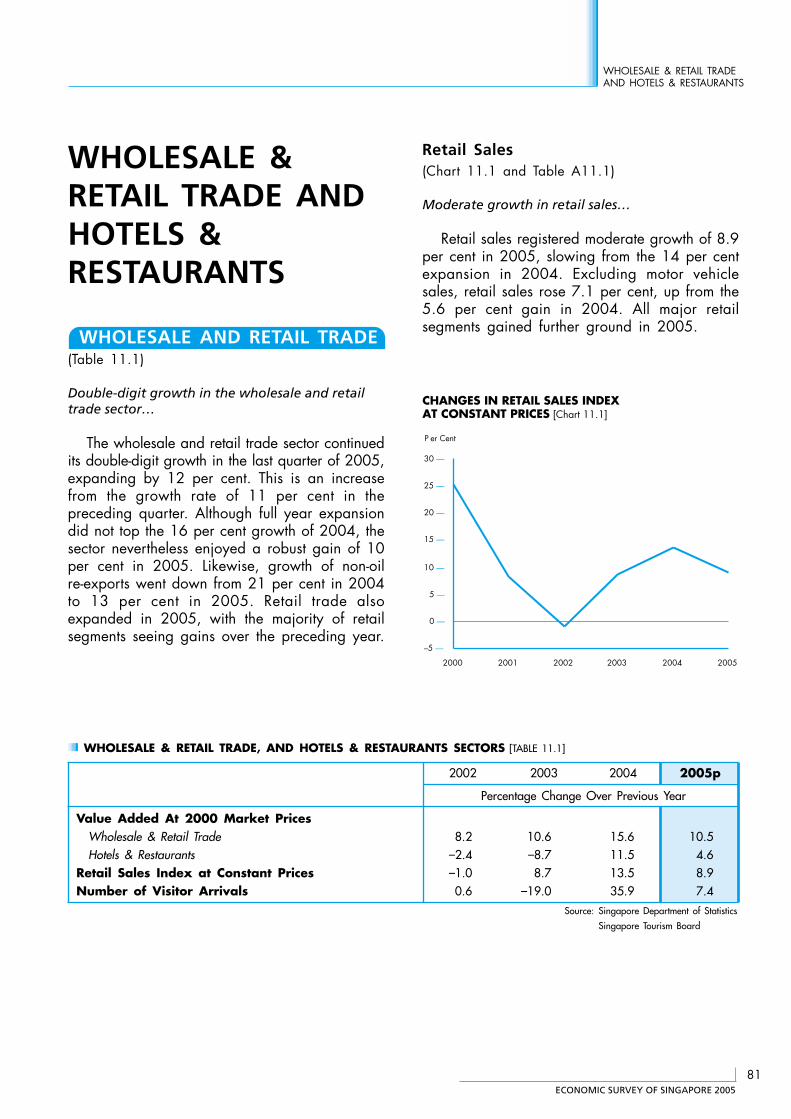
ECONOMIC SURVEY OF SINGAPORE 2005
81
WHOLESALE & RETAIL TRADEAND HOTELS & RESTAURANTS
WHOLESALE &RETAIL TRADE ANDHOTELS &RESTAURANTS
WHOLESALE AND RETAIL TRADE(Table 11.1)
Double-digit growth in the wholesale and retailtrade sector…
The wholesale and retail trade sector continuedits double-digit growth in the last quarter of 2005,expanding by 12 per cent. This is an increasefrom the growth rate of 11 per cent in thepreceding quarter. Although full year expansiondid not top the 16 per cent growth of 2004, thesector nevertheless enjoyed a robust gain of 10per cent in 2005. Likewise, growth of non-oilre-exports went down from 21 per cent in 2004to 13 per cent in 2005. Retail trade alsoexpanded in 2005, with the majority of retailsegments seeing gains over the preceding year.
Retail Sales(Chart 11.1 and Table A11.1)
Moderate growth in retail sales…
Retail sales registered moderate growth of 8.9per cent in 2005, slowing from the 14 per centexpansion in 2004. Excluding motor vehiclesales, retail sales rose 7.1 per cent, up from the5.6 per cent gain in 2004. All major retailsegments gained further ground in 2005.
WHOLESALE & RETAIL TRADE, AND HOTELS & RESTAURANTS SECTORS [TABLE 11.1]
2002 2003 2004 2005p
Percentage Change Over Previous Year
Value Added At 2000 Market PricesWholesale & Retail Trade 8.2 10.6 15.6 10.5Hotels & Restaurants –2.4 –8.7 11.5 4.6
Retail Sales Index at Constant Prices –1.0 8.7 13.5 8.9Number of Visitor Arrivals 0.6 –19.0 35.9 7.4
Source: Singapore Department of Statistics
Singapore Tourism Board
–5 —
0 —
5 —
10 —
15 —
20 —
25 —
30 —
2000 2001 2002 2003 2004 2005
P er Cent
CHANGES IN RETAIL SALES INDEX AT CONSTANT PRICES [Chart 11.1]
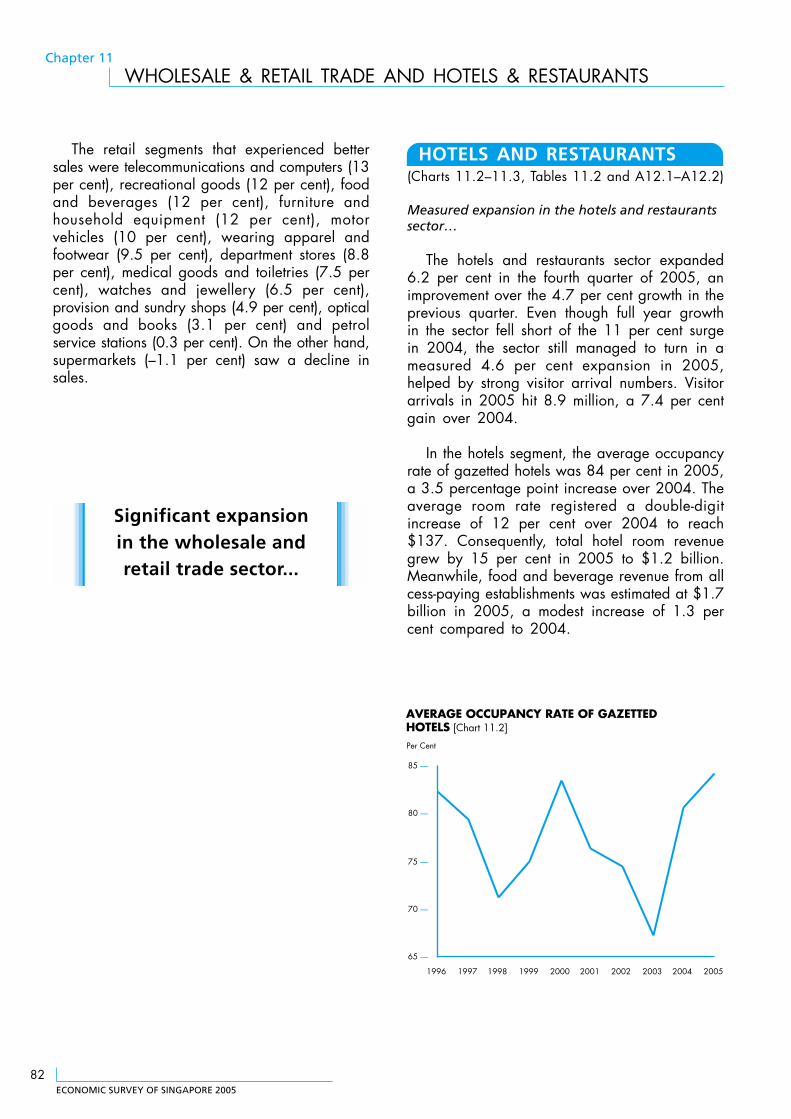
ECONOMIC SURVEY OF SINGAPORE 2005
82
Chapter 11
WHOLESALE & RETAIL TRADE AND HOTELS & RESTAURANTS
The retail segments that experienced bettersales were telecommunications and computers (13per cent), recreational goods (12 per cent), foodand beverages (12 per cent), furniture andhousehold equipment (12 per cent), motorvehicles (10 per cent), wearing apparel andfootwear (9.5 per cent), department stores (8.8per cent), medical goods and toiletries (7.5 percent), watches and jewellery (6.5 per cent),provision and sundry shops (4.9 per cent), opticalgoods and books (3.1 per cent) and petrolservice stations (0.3 per cent). On the other hand,supermarkets (–1.1 per cent) saw a decline insales.
HOTELS AND RESTAURANTS(Charts 11.2–11.3, Tables 11.2 and A12.1–A12.2)
Measured expansion in the hotels and restaurantssector…
The hotels and restaurants sector expanded6.2 per cent in the fourth quarter of 2005, animprovement over the 4.7 per cent growth in theprevious quarter. Even though full year growthin the sector fell short of the 11 per cent surgein 2004, the sector still managed to turn in ameasured 4.6 per cent expansion in 2005,helped by strong visitor arrival numbers. Visitorarrivals in 2005 hit 8.9 million, a 7.4 per centgain over 2004.
In the hotels segment, the average occupancyrate of gazetted hotels was 84 per cent in 2005,a 3.5 percentage point increase over 2004. Theaverage room rate registered a double-digitincrease of 12 per cent over 2004 to reach$137. Consequently, total hotel room revenuegrew by 15 per cent in 2005 to $1.2 billion.Meanwhile, food and beverage revenue from allcess-paying establishments was estimated at $1.7billion in 2005, a modest increase of 1.3 percent compared to 2004.
Significant expansionin the wholesale andretail trade sector...
65 —
70 —
75 —
80 —
85 —
1996 1997 1998 1999 2000 2001 2002 2003 2004 2005
Per Cent
AVERAGE OCCUPANCY RATE OF GAZETTED HOTELS [Chart 11.2]
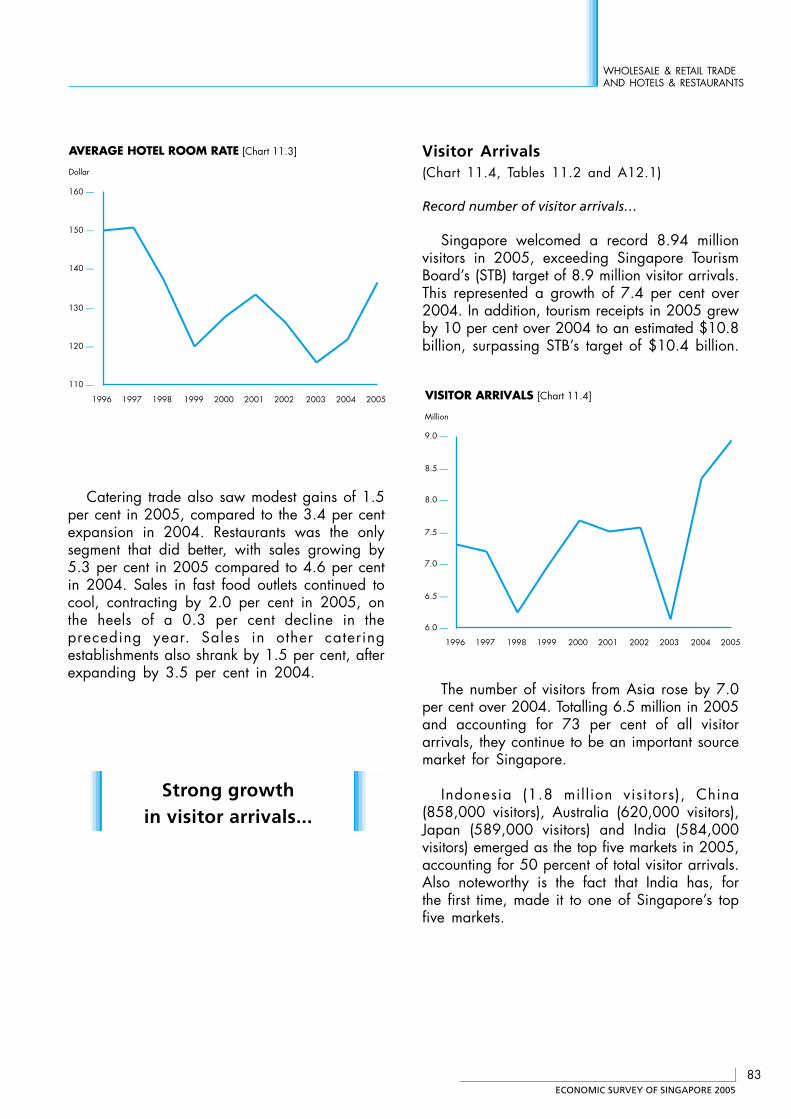
ECONOMIC SURVEY OF SINGAPORE 2005
83
WHOLESALE & RETAIL TRADEAND HOTELS & RESTAURANTS
Catering trade also saw modest gains of 1.5per cent in 2005, compared to the 3.4 per centexpansion in 2004. Restaurants was the onlysegment that did better, with sales growing by5.3 per cent in 2005 compared to 4.6 per centin 2004. Sales in fast food outlets continued tocool, contracting by 2.0 per cent in 2005, onthe heels of a 0.3 per cent decline in thepreceding year. Sales in other cateringestablishments also shrank by 1.5 per cent, afterexpanding by 3.5 per cent in 2004.
Visitor Arrivals(Chart 11.4, Tables 11.2 and A12.1)
Record number of visitor arrivals…
Singapore welcomed a record 8.94 millionvisitors in 2005, exceeding Singapore TourismBoard’s (STB) target of 8.9 million visitor arrivals.This represented a growth of 7.4 per cent over2004. In addition, tourism receipts in 2005 grewby 10 per cent over 2004 to an estimated $10.8billion, surpassing STB’s target of $10.4 billion.
110 —
120 —
130 —
140 —
150 —
160 —
1996 1997 1998 1999 2000 2001 2002 2003 2004 2005
Dollar
AVERAGE HOTEL ROOM RATE [Chart 11.3]
6.0 —
6.5 —
7.0 —
7.5 —
8.0 —
8.5 —
9.0 —
1996 1997 1998 1999 2000 2001 2002 2003 2004 2005
Million
VISITOR ARRIVALS [Chart 11.4]
Strong growthin visitor arrivals...
The number of visitors from Asia rose by 7.0per cent over 2004. Totalling 6.5 million in 2005and accounting for 73 per cent of all visitorarrivals, they continue to be an important sourcemarket for Singapore.
Indonesia (1.8 million visitors), China(858,000 visitors), Australia (620,000 visitors),Japan (589,000 visitors) and India (584,000visitors) emerged as the top five markets in 2005,accounting for 50 percent of total visitor arrivals.Also noteworthy is the fact that India has, forthe first time, made it to one of Singapore’s topfive markets.
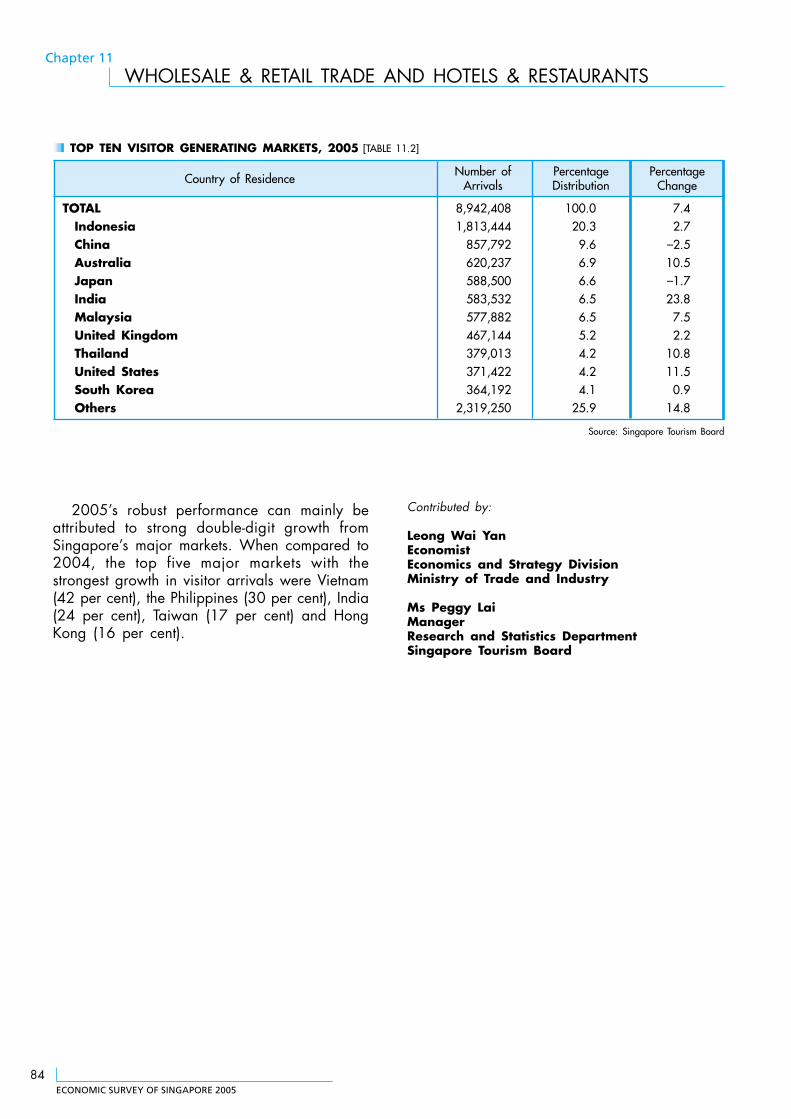
ECONOMIC SURVEY OF SINGAPORE 2005
84
Chapter 11
WHOLESALE & RETAIL TRADE AND HOTELS & RESTAURANTS
2005’s robust performance can mainly beattributed to strong double-digit growth fromSingapore’s major markets. When compared to2004, the top five major markets with thestrongest growth in visitor arrivals were Vietnam(42 per cent), the Philippines (30 per cent), India(24 per cent), Taiwan (17 per cent) and HongKong (16 per cent).
TOP TEN VISITOR GENERATING MARKETS, 2005 [TABLE 11.2]
Country of Residence Number of Percentage PercentageArrivals Distribution Change
TOTAL 8,942,408 100.0 7.4Indonesia 1,813,444 20.3 2.7China 857,792 9.6 –2.5Australia 620,237 6.9 10.5Japan 588,500 6.6 –1.7India 583,532 6.5 23.8Malaysia 577,882 6.5 7.5United Kingdom 467,144 5.2 2.2Thailand 379,013 4.2 10.8United States 371,422 4.2 11.5South Korea 364,192 4.1 0.9Others 2,319,250 25.9 14.8
Source: Singapore Tourism Board
Contributed by:
Leong Wai YanEconomistEconomics and Strategy DivisionMinistry of Trade and Industry
Ms Peggy LaiManagerResearch and Statistics DepartmentSingapore Tourism Board
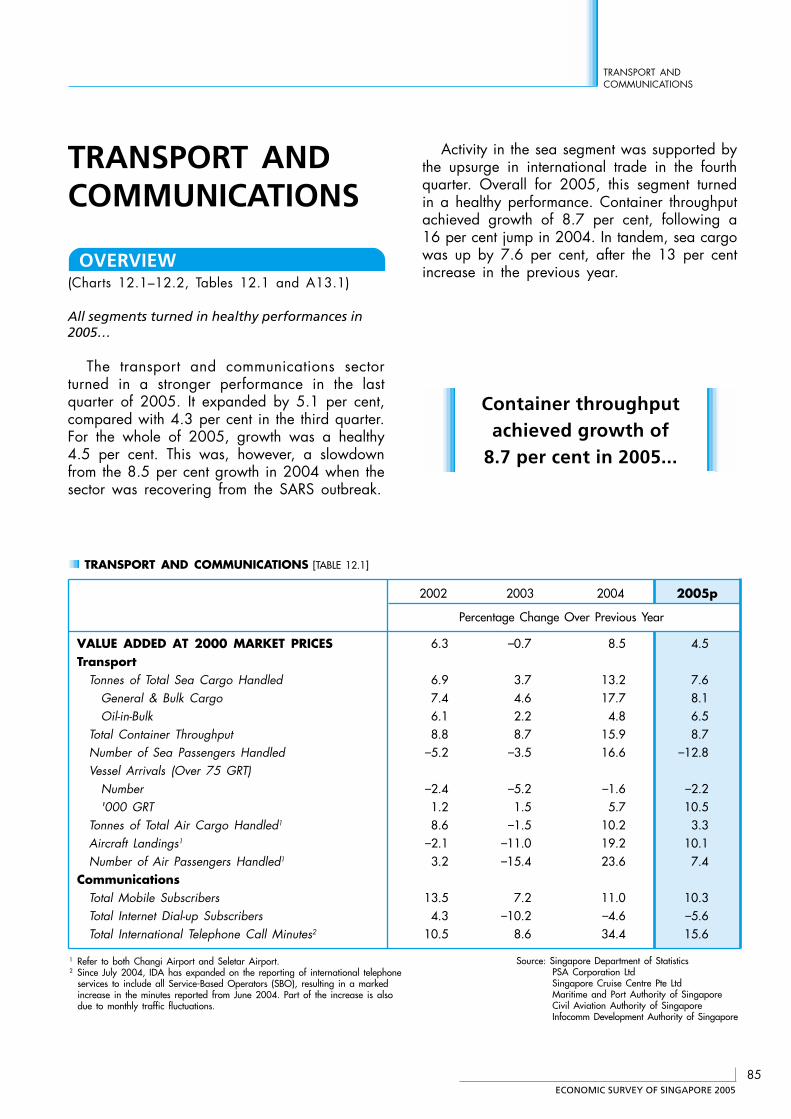
ECONOMIC SURVEY OF SINGAPORE 2005
85
TRANSPORT ANDCOMMUNICATIONS
TRANSPORT ANDCOMMUNICATIONS
OVERVIEW(Charts 12.1–12.2, Tables 12.1 and A13.1)
All segments turned in healthy performances in2005…
The transport and communications sectorturned in a stronger performance in the lastquarter of 2005. It expanded by 5.1 per cent,compared with 4.3 per cent in the third quarter.For the whole of 2005, growth was a healthy4.5 per cent. This was, however, a slowdownfrom the 8.5 per cent growth in 2004 when thesector was recovering from the SARS outbreak.
Container throughputachieved growth of
8.7 per cent in 2005...
Activity in the sea segment was supported bythe upsurge in international trade in the fourthquarter. Overall for 2005, this segment turnedin a healthy performance. Container throughputachieved growth of 8.7 per cent, following a16 per cent jump in 2004. In tandem, sea cargowas up by 7.6 per cent, after the 13 per centincrease in the previous year.
TRANSPORT AND COMMUNICATIONS [TABLE 12.1]
2002 2003 2004 2005p
Percentage Change Over Previous Year
VALUE ADDED AT 2000 MARKET PRICES 6.3 –0.7 8.5 4.5Transport
Tonnes of Total Sea Cargo Handled 6.9 3.7 13.2 7.6General & Bulk Cargo 7.4 4.6 17.7 8.1Oil-in-Bulk 6.1 2.2 4.8 6.5
Total Container Throughput 8.8 8.7 15.9 8.7Number of Sea Passengers Handled –5.2 –3.5 16.6 –12.8Vessel Arrivals (Over 75 GRT)
Number –2.4 –5.2 –1.6 –2.2'000 GRT 1.2 1.5 5.7 10.5
Tonnes of Total Air Cargo Handled1 8.6 –1.5 10.2 3.3Aircraft Landings1 –2.1 –11.0 19.2 10.1Number of Air Passengers Handled1 3.2 –15.4 23.6 7.4
CommunicationsTotal Mobile Subscribers 13.5 7.2 11.0 10.3Total Internet Dial-up Subscribers 4.3 –10.2 –4.6 –5.6Total International Telephone Call Minutes2 10.5 8.6 34.4 15.6
1 Refer to both Changi Airport and Seletar Airport.2 Since July 2004, IDA has expanded on the reporting of international telephone services to include all Service-Based Operators (SBO), resulting in a marked increase in the minutes reported from June 2004. Part of the increase is also due to monthly traffic fluctuations.
Source: Singapore Department of StatisticsPSA Corporation LtdSingapore Cruise Centre Pte LtdMaritime and Port Authority of SingaporeCivil Aviation Authority of SingaporeInfocomm Development Authority of Singapore
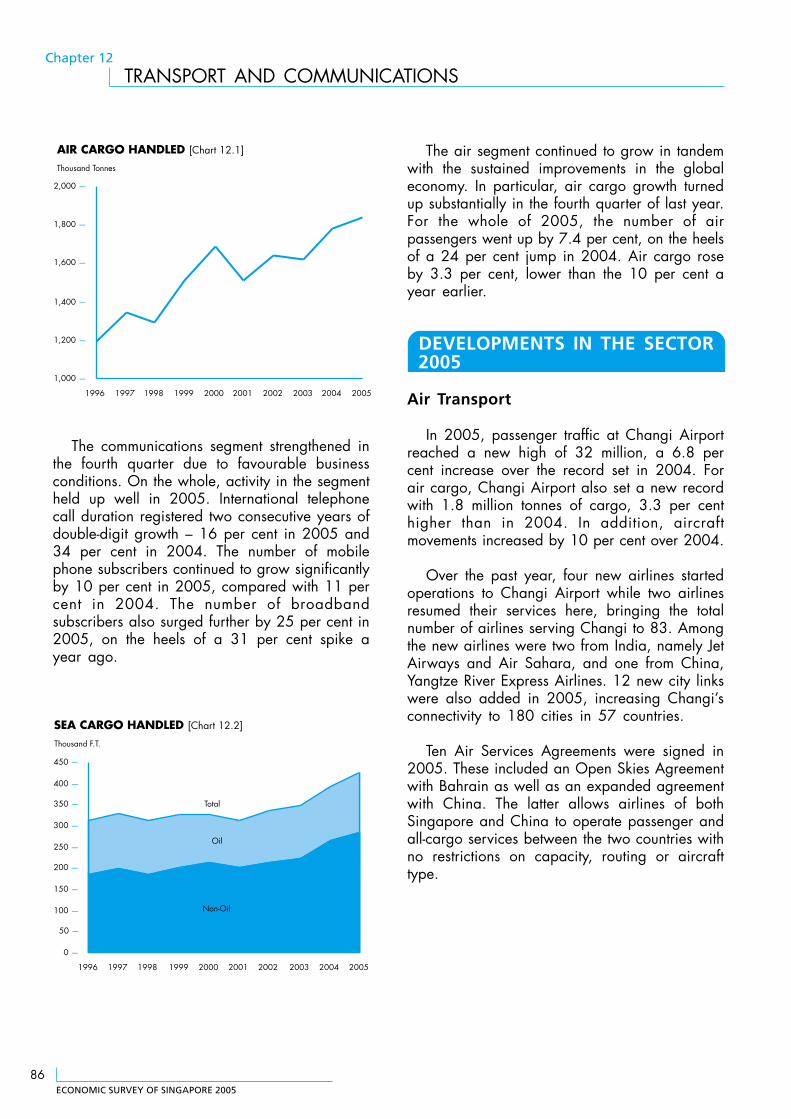
ECONOMIC SURVEY OF SINGAPORE 2005
86
Chapter 12
TRANSPORT AND COMMUNICATIONS
The communications segment strengthened inthe fourth quarter due to favourable businessconditions. On the whole, activity in the segmentheld up well in 2005. International telephonecall duration registered two consecutive years ofdouble-digit growth – 16 per cent in 2005 and34 per cent in 2004. The number of mobilephone subscribers continued to grow significantlyby 10 per cent in 2005, compared with 11 percent in 2004. The number of broadbandsubscribers also surged further by 25 per cent in2005, on the heels of a 31 per cent spike ayear ago.
The air segment continued to grow in tandemwith the sustained improvements in the globaleconomy. In particular, air cargo growth turnedup substantially in the fourth quarter of last year.For the whole of 2005, the number of airpassengers went up by 7.4 per cent, on the heelsof a 24 per cent jump in 2004. Air cargo roseby 3.3 per cent, lower than the 10 per cent ayear earlier.
DEVELOPMENTS IN THE SECTOR2005
Air Transport
In 2005, passenger traffic at Changi Airportreached a new high of 32 million, a 6.8 percent increase over the record set in 2004. Forair cargo, Changi Airport also set a new recordwith 1.8 million tonnes of cargo, 3.3 per centhigher than in 2004. In addition, aircraftmovements increased by 10 per cent over 2004.
Over the past year, four new airlines startedoperations to Changi Airport while two airlinesresumed their services here, bringing the totalnumber of airlines serving Changi to 83. Amongthe new airlines were two from India, namely JetAirways and Air Sahara, and one from China,Yangtze River Express Airlines. 12 new city linkswere also added in 2005, increasing Changi’sconnectivity to 180 cities in 57 countries.
Ten Air Services Agreements were signed in2005. These included an Open Skies Agreementwith Bahrain as well as an expanded agreementwith China. The latter allows airlines of bothSingapore and China to operate passenger andall-cargo services between the two countries withno restrictions on capacity, routing or aircrafttype.
AIR CARGO HANDLED [Chart 12.1]
1,000 —
1,200 —
1,400 —
1,600 —
1,800 —
2,000 —
1996 1997 1998 1999 2000 2001 2002 2003 2004 2005
Thousand Tonnes
SEA CARGO HANDLED [Chart 12.2]
0 —
50 —
100 —
150 —
200 —
250 —
300 —
350 —
400 —
450 —
1996 1997 1998 1999 2000 2001 2002 2003 2004 2005
Thousand F.T.
Total
Oil
Non-Oil
ECONOMIC SURVEY OF SINGAPORE 2005
87
TRANSPORT ANDCOMMUNICATIONS
The three-year $210 million Air HubDevelopment Fund (introduced on 1 January2003) and two-year $40 million Growth IncentiveScheme (introduced on 1 January 2004) havebeen extended for another three years to 2008.It will be under a new $300 million Air HubDevelopment Fund 2, aimed at encouragingfurther growth in air services, as well aspassenger and air cargo traffic through Changi.
Infrastructure Upgrade and NewServices
Refurbishment works at Terminal 2 were startedin 2005 and will be completed in June 2006.The $240 million project will not only increasecapacity in the departure/transit lounge but alsoprovide upgraded facilities in the terminal andoffer passengers a wider range of retail and food& beverage (F&B) options.
In the meantime, the construction of Terminal3 is on track for completion in 2008. The terminalwill increase Changi Airport’s handling capacityby about 20 million passengers, to a totalcapacity of 64 million passengers annually.
Aside from works to the main terminals, thenew $45 million Budget Terminal is also nearingcompletion and will be ready for operation on26 March 2006 with Tiger Airways as its firstairline customer. It will initially be able to handleup to about 2.7 million passengers per annum,with scope for future expansion to handle 5million passengers per annum.
Changi Airport was the first airport outsideEurope to welcome the Airbus A380, when theaircraft arrived for airport compatibili tyverification tests on 11 November 2005.Modification works are being carried out to theexisting Changi airport infrastructure inpreparation for the commencement of A380’scommercial operations in late 2006. $62 millionhas been set aside for modifications to therunways and taxiways, gate hold rooms,aerobridges and baggage belts to accommodatethe new large aircraft. Two new freighter aircraftstands and two remote aircraft parking standswere also constructed to handle the A380.
Land Transport
Public Transport
Providing effective and quality public transportat affordable fares continues to be the cornerstoneof Singapore’s land transport policy. The PunggolLight Rail Transit (LRT) (East Loop) and SengkangLRT (West Loop) were opened on 29 January2005, boosting Singapore’s rail network by 10km (8.1 per cent) to 138 km. Average daily railridership numbers increased from 1.3 million inFY2004 to 1.4 million over April to November2005.
The construction of the Circle Line (CCL)resumed after works were disrupted by thecollapse of a section of the excavation site nearthe Nicoll Highway Mass Rapid Transit (MRT)Station. The CCL, when completed by 2010, willadd another 33 km to our rail network. It willlink all radial rapid transit lines running into thecity, thereby reducing journey time for commutersconsiderably.
All major civil and electrical and mechanical(E&M) contracts for the Boon Lay Extension (BLE)scheduled for completion in 2009 were awardedin 2005. The decision to build the DowntownExtension (DTE), which will serve the Marina Bayarea, was also announced in June 2005. The3.4 km DTE will have five stations, and will becompleted in 2012. This project which is currentlyin the design stage will extend our rail networkto a total of 179 km.
Following a review led by the GovernmentParliamentary Committee (GPC) on the FareReview Mechanism, a new price index formulahas been adopted by the Government in earlyMarch 2005 to guide the fare change quantumthat the Public Transport Council will approveeach year. The new formula ensures thatcommuters’ interests are protected by extractinga productivity component, while compensating thepublic transport operators for structural costincreases in their operating environment. It alsoprovides greater clarity, and is more responsiveto the actual economic conditions faced by
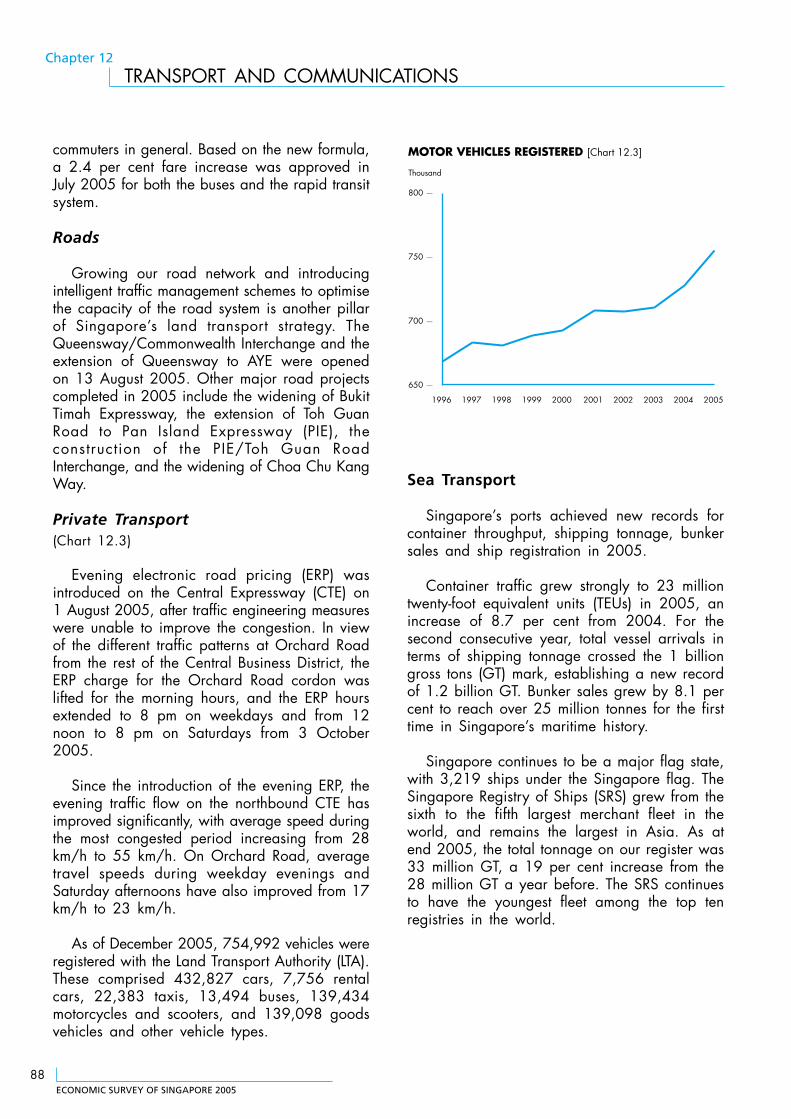
ECONOMIC SURVEY OF SINGAPORE 2005
88
Chapter 12
TRANSPORT AND COMMUNICATIONS
commuters in general. Based on the new formula,a 2.4 per cent fare increase was approved inJuly 2005 for both the buses and the rapid transitsystem.
Roads
Growing our road network and introducingintelligent traffic management schemes to optimisethe capacity of the road system is another pillarof Singapore’s land transport strategy. TheQueensway/Commonwealth Interchange and theextension of Queensway to AYE were openedon 13 August 2005. Other major road projectscompleted in 2005 include the widening of BukitTimah Expressway, the extension of Toh GuanRoad to Pan Island Expressway (PIE), theconstruction of the PIE/Toh Guan RoadInterchange, and the widening of Choa Chu KangWay.
Private Transport(Chart 12.3)
Evening electronic road pricing (ERP) wasintroduced on the Central Expressway (CTE) on1 August 2005, after traffic engineering measureswere unable to improve the congestion. In viewof the different traffic patterns at Orchard Roadfrom the rest of the Central Business District, theERP charge for the Orchard Road cordon waslifted for the morning hours, and the ERP hoursextended to 8 pm on weekdays and from 12noon to 8 pm on Saturdays from 3 October2005.
Since the introduction of the evening ERP, theevening traffic flow on the northbound CTE hasimproved significantly, with average speed duringthe most congested period increasing from 28km/h to 55 km/h. On Orchard Road, averagetravel speeds during weekday evenings andSaturday afternoons have also improved from 17km/h to 23 km/h.
As of December 2005, 754,992 vehicles wereregistered with the Land Transport Authority (LTA).These comprised 432,827 cars, 7,756 rentalcars, 22,383 taxis, 13,494 buses, 139,434motorcycles and scooters, and 139,098 goodsvehicles and other vehicle types.
Sea Transport
Singapore’s ports achieved new records forcontainer throughput, shipping tonnage, bunkersales and ship registration in 2005.
Container traffic grew strongly to 23 milliontwenty-foot equivalent units (TEUs) in 2005, anincrease of 8.7 per cent from 2004. For thesecond consecutive year, total vessel arrivals interms of shipping tonnage crossed the 1 billiongross tons (GT) mark, establishing a new recordof 1.2 billion GT. Bunker sales grew by 8.1 percent to reach over 25 million tonnes for the firsttime in Singapore’s maritime history.
Singapore continues to be a major flag state,with 3,219 ships under the Singapore flag. TheSingapore Registry of Ships (SRS) grew from thesixth to the fifth largest merchant fleet in theworld, and remains the largest in Asia. As atend 2005, the total tonnage on our register was33 million GT, a 19 per cent increase from the28 million GT a year before. The SRS continuesto have the youngest fleet among the top tenregistries in the world.
650 —
700 —
750 —
800 —
1996 1997 1998 1999 2000 2001 2002 2003 2004 2005
Thousand
MOTOR VEHICLES REGISTERED [Chart 12.3]
ECONOMIC SURVEY OF SINGAPORE 2005
89
TRANSPORT ANDCOMMUNICATIONS
Enhancing Port Competitiveness
Several initiatives were introduced to furtherraise the service standards of the bunker industryin 2005. In March 2005, a five-year waiver forport dues was given for new double-hulled bunkertankers first licensed between 15 March 2005and 31 March 2008. The aim is to encouragebunker tanker owners to renew their fleet earlywith more environmentally friendly and efficientdouble-hulled tankers. The A Bunker QualityAdvisory Panel (BQAP) was established,comprising representatives from across the bunkerindustry. The BQAP promotes a systematicapproach towards bunker testing andinterpretation of test results which will helpminimise discrepancies in test results and enhancethe quality of bunkers supplied in Singapore.
Strengthening Singapore’s MaritimeClusters
As part of Singapore’s aim to be anInternational Maritime Centre, a new Centre forMaritime Studies was launched at the NationalUniversity of Singapore (NUS) in June 2005. TheCentre caters to the information and researchneeds of Singapore’s maritime sector. It alsoprovides a platform where the industry, the publicsector and the academia can actively collaborateand contribute to maritime research anddevelopment. A total of more than $3.6 millionhas been pledged by maritime companies todate. In addition, the Maritime and Port Authorityof Singapore (MPA) will provide funding of upto $1 million for research projects.
The Approved International Shipping (AIS)Enterprise status was awarded to 20 newcompanies in September while another fourcompanies had their AIS status renewed, bringingthe total of shipping groups under the scheme tosome 60. The AIS companies generate over $2.5billion in business spending in Singaporeannually.
Info-Communications
Overview
Singapore’s info-communications (Infocomm)industry continued to keep pace with the changesin the global technology scene. Singapore wasranked first in the World Economic Forum (WEF)’sGlobal IT Report and third in Accenture’s Annuale-Government Ranking, 2005. Mobile penetrationin Singapore is one of the highest in the worldat 98 per cent and household broadbandpenetration was 52 per cent as at December2005. Operators offering internationaltelecommunications (telecom) services have accessto over 28 Tbps (Tera bits per second) ofsubmarine cable capacity.
Singapore also has more than 20 Gbps (Gigabits per second) of direct Internet connectivity toover 20 countries such as the US and many Asiancountries. Six Wireless Broadband Access (WBA)spectrum rights in the 2.3 GHz and 2.5 GHzfrequency bands were issued in early 2005 toincrease competition in the local broadbandmarket and widen the choice of high-speedInternet services for businesses and consumers.There are now over 170,000 subscriptions to3G services since the roll-out at the end of 2004.
Planning for the Future
Singapore has embarked on a national effortto formulate a ten-year masterplan, iN2015(Intelligent Nation 2015), to grow the Infocommindustry and build a well-connected society. Viewsand perspectives are sought from Infocommindustry players locally and internationally.Businesses in key economic sectors, researchinstitutes and civic organisations are alsoconsulted in identifying new areas of opportunitywhere Infocomm technologies can create newvalue propositions and innovative services.
ECONOMIC SURVEY OF SINGAPORE 2005
90
Chapter 12
TRANSPORT AND COMMUNICATIONS
Talent is critical to Singapore’s continuedleadership as the location of choice for Infocommbusiness and innovation. In view of this, a five-year Infocomm Manpower Development Roadmapwas announced in November 2005. It is a jointeffort between the Government and industry andthe goal is the development of an innovative,entrepreneurial, globally-competitive andInfocomm-savvy workforce to drive the creationand exploitation of Infocomm technologies.
Growing the Local Infocomm Industry
The Infocomm Local Industry UpgradingProgramme (iLIUP) is one programme whereMNCs partner local enterprises and help themdevelop through transfer of technology. Since thestart of this programme, local companies havegenerated more than 300 products, amountingto $100 million worth of commercial projects overthe last ten years.
Business Process Outsourcing (BPO) hasbecome an essential part of business strategiesfor both private and public sector organisations.Besides cost savings, BPO redirects resources andmanagement attention to more valuable activities.Singapore was found to be among the topdestinations for off-shoring1. A 2004 report bythe US Department of Commerce also rankedSingapore as the second fastest-growing hub foroutsourcing among US businesses2 .
To help facilitate market access for localcompanies, the Infocomm Development Authorityof Singapore (IDA) has offices in China, Indiaand the US. An office will also be set up in theMiddle East to help local companies gain afoothold in this emerging market. In addition, anOverseas Development Programme was put inplace to facilitate opportunities for partnershipbetween MNCs and local companies to tap intooverseas markets.
Local companies have done well overseas.Some of the notable successes include a $10million deal to design and build IntelligentBuilding Solution for Bahrain’s first World Trade
Centre, and a $40 million project to build oneof the world’s largest e-Government gateways forthe Turkish Government.
Harnessing Infocomm Technologies
Logistics
A three-year $10 million plan was launchedin May 2004 to further develop the use of RadioFrequency Identification (RFID) technology inSingapore. Its goal is to build five RFID-enabledsupply chain clusters by 2006 by bringingtogether manufacturers, logistics service providers,retailers, infrastructure providers and solutionsproviders. To date, RFID implementation projectsworth $30 million have been secured forinvestments in the manufacturing, retail andlogistics sectors.
There are signs of a budding world-class RFIDecosystem developing in Singapore - from chipsin the RFID tags to RFID solutions.STMicroelectronics announced in March 2005that it will shift its entire global production ofRFID chips to Singapore. In the same year, NOLand Sun Microsystems collaborated to open SouthEast Asia’s first RFID test and compliance centrehere.
Education
IDA and Microsoft launched BackPack.NET inOctober 2003 which seeks to enhance theeducation experience for teachers and studentsthrough the use of innovative infocommtechnologies. Since the launch, four secondaryschools in Singapore have successfully trialledtablet PC-based education software applicationsdeveloped by local IT companies. TheBackPack.NET Centre which demonstrates howvarious technologies can impact the future oflearning was opened in March 2005. The centrealso acts as a focal point for industry partnersto exchange ideas with academics and developsoftware and digital content innovation for usein education.
1 Offshoring in the Financial Services Industry: Risks and Rewards, September 2005, PWC and EIU. Making Off-shore Decision: 2004 Off-shoring Location Attractiveness Index,2004, AT Kearney
2 US International Services, October 2004
ECONOMIC SURVEY OF SINGAPORE 2005
91
TRANSPORT ANDCOMMUNICATIONS
Serving Citizens Better
e-Government Services
Today, more than 98 per cent of all publicservices that can be delivered electronically areavailable online. Convenient access to the Internetis a pre-requisite for the public to transact onlinewith the Government. Those without access to acomputer or the Internet can go to public librariesand e-clubs at community centres to get online.Government agencies have also set up self-serviceterminals for the public to transact online. Morethan 1,200 self-service Internet terminals havebeen installed across 150 public service locationssince March 2005. This is part of the strategy togradually ‘migrate’ users from service countersto online channels.
Addressing Community Needs
In February 2005, Connecting the Community,an initiative which aimed to address a range ofneeds of the family and the general communitystarted its first public trial. It involved 2,500 userswho tested solutions developed by four consortiaconsisting of 23 organisations ranging from ITsolutions providers to Citizen’s ConsultativeCommittees (CCCs) and healthcare equipmentproviders. Some of the solutions include alertsactivated using wireless technology for the agedand real-time information alerts via electronicnotice boards at void decks.
Contributed by:
Ms Soo Cheng GheeSenior EconomistEconomics and Strategy DivisionMinistry of Trade and Industry
Ministry of Transport
Infocomm Development Authority of Singapore
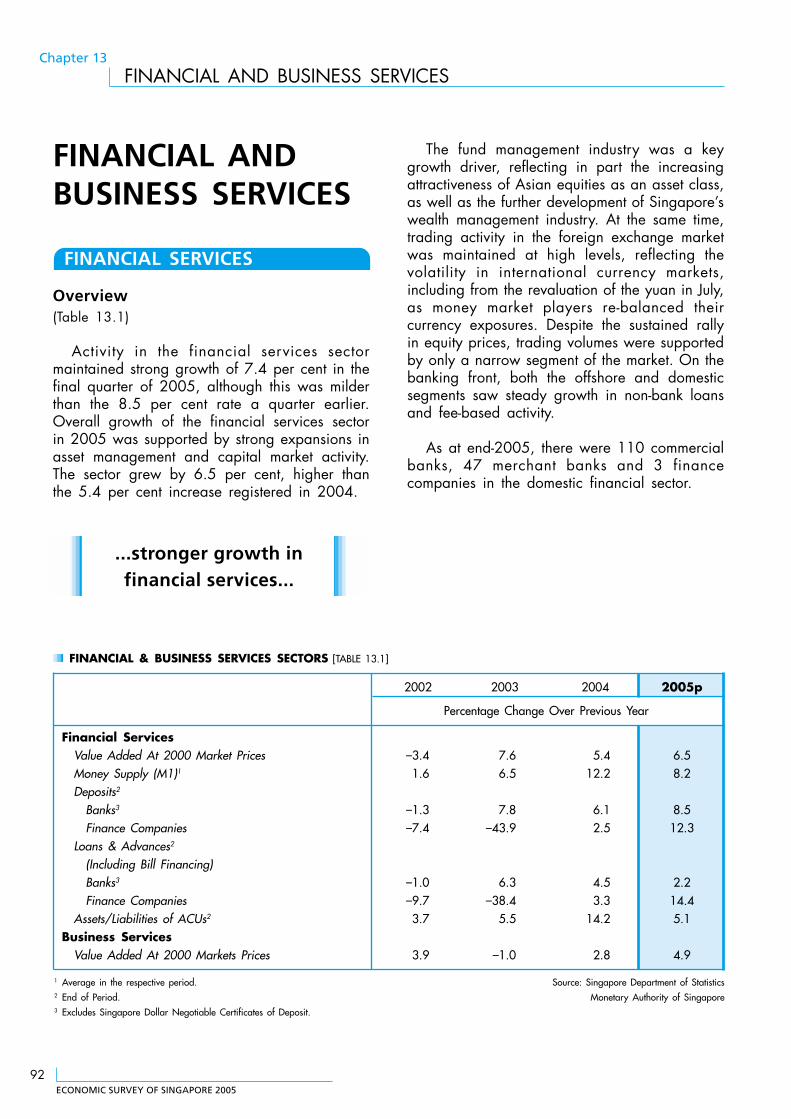
ECONOMIC SURVEY OF SINGAPORE 2005
92
Chapter 13
FINANCIAL AND BUSINESS SERVICES
FINANCIAL ANDBUSINESS SERVICES
FINANCIAL SERVICES
Overview(Table 13.1)
Activity in the financial services sectormaintained strong growth of 7.4 per cent in thefinal quarter of 2005, although this was milderthan the 8.5 per cent rate a quarter earlier.Overall growth of the financial services sectorin 2005 was supported by strong expansions inasset management and capital market activity.The sector grew by 6.5 per cent, higher thanthe 5.4 per cent increase registered in 2004.
...stronger growth infinancial services...
The fund management industry was a keygrowth driver, reflecting in part the increasingattractiveness of Asian equities as an asset class,as well as the further development of Singapore’swealth management industry. At the same time,trading activity in the foreign exchange marketwas maintained at high levels, reflecting thevolatility in international currency markets,including from the revaluation of the yuan in July,as money market players re-balanced theircurrency exposures. Despite the sustained rallyin equity prices, trading volumes were supportedby only a narrow segment of the market. On thebanking front, both the offshore and domesticsegments saw steady growth in non-bank loansand fee-based activity.
As at end-2005, there were 110 commercialbanks, 47 merchant banks and 3 financecompanies in the domestic financial sector.
FINANCIAL & BUSINESS SERVICES SECTORS [TABLE 13.1]
2002 2003 2004 2005p
Percentage Change Over Previous Year
Financial ServicesValue Added At 2000 Market Prices –3.4 7.6 5.4 6.5Money Supply (M1)1 1.6 6.5 12.2 8.2Deposits2
Banks3 –1.3 7.8 6.1 8.5Finance Companies –7.4 –43.9 2.5 12.3
Loans & Advances2
(Including Bill Financing)Banks3 –1.0 6.3 4.5 2.2Finance Companies –9.7 –38.4 3.3 14.4
Assets/Liabilities of ACUs2 3.7 5.5 14.2 5.1Business Services
Value Added At 2000 Markets Prices 3.9 –1.0 2.8 4.9
1 Average in the respective period. Source: Singapore Department of Statistics2 End of Period. Monetary Authority of Singapore3 Excludes Singapore Dollar Negotiable Certificates of Deposit.
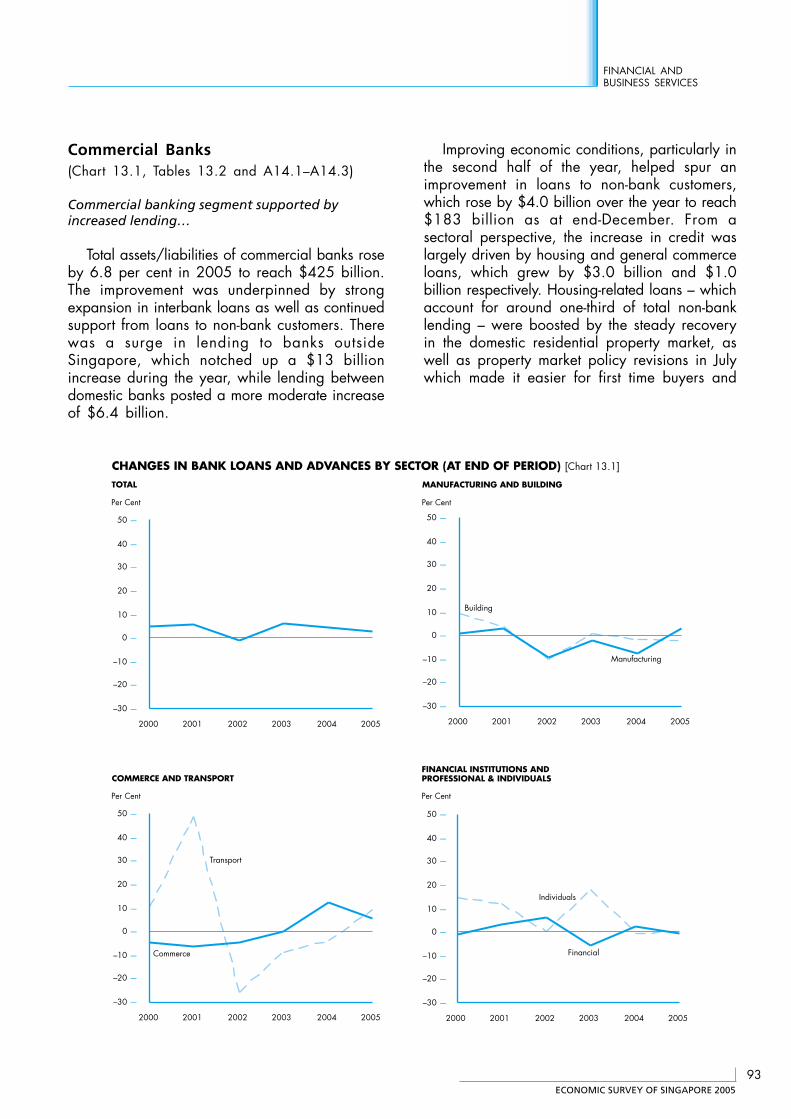
ECONOMIC SURVEY OF SINGAPORE 2005
93
FINANCIAL ANDBUSINESS SERVICES
Commercial Banks(Chart 13.1, Tables 13.2 and A14.1–A14.3)
Commercial banking segment supported byincreased lending…
Total assets/liabilities of commercial banks roseby 6.8 per cent in 2005 to reach $425 billion.The improvement was underpinned by strongexpansion in interbank loans as well as continuedsupport from loans to non-bank customers. Therewas a surge in lending to banks outsideSingapore, which notched up a $13 billionincrease during the year, while lending betweendomestic banks posted a more moderate increaseof $6.4 billion.
CHANGES IN BANK LOANS AND ADVANCES BY SECTOR (AT END OF PERIOD) [Chart 13.1]
Per Cent
MANUFACTURING AND BUILDING
–30 —
–20 —
–10 —
0 —
10 —
20 —
30 —
40 —
50 —
2000 2001 2002 2003 2004 2005
Per Cent
TOTAL
–30 —
–20 —
–10 —
0 —
10 —
20 —
30 —
40 —
50 —
2000 2001 2002 2003 2004 2005
Per Cent
COMMERCE AND TRANSPORT
Transport
Commerce
–30 —
–20 —
–10 —
0 —
10 —
20 —
30 —
40 —
50 —
2000 2001 2002 2003 2004 2005
Building
Manufacturing
–30 —
–20 —
–10 —
0 —
10 —
20 —
30 —
40 —
50 —
2000 2001 2002 2003 2004 2005
Per Cent
FINANCIAL INSTITUTIONS ANDPROFESSIONAL & INDIVIDUALS
Individuals
Financial
Improving economic conditions, particularly inthe second half of the year, helped spur animprovement in loans to non-bank customers,which rose by $4.0 billion over the year to reach$183 billion as at end-December. From asectoral perspective, the increase in credit waslargely driven by housing and general commerceloans, which grew by $3.0 billion and $1.0billion respectively. Housing-related loans – whichaccount for around one-third of total non-banklending – were boosted by the steady recoveryin the domestic residential property market, aswell as property market policy revisions in Julywhich made it easier for first time buyers and
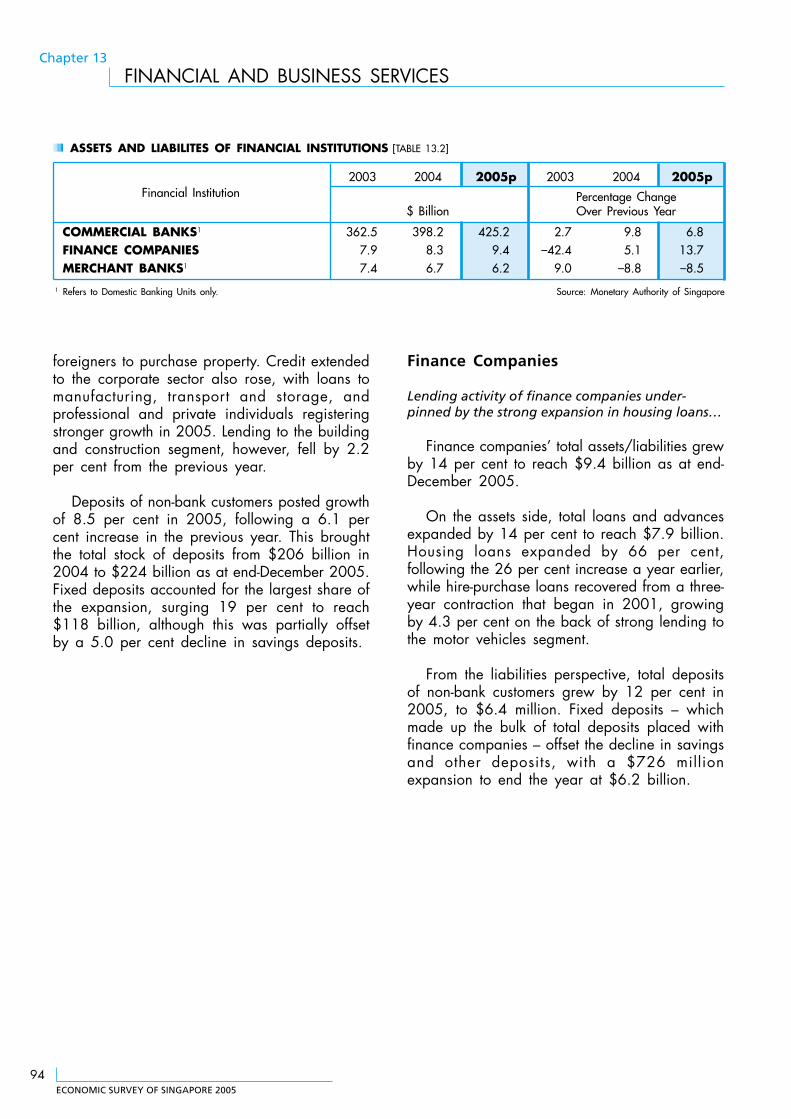
ECONOMIC SURVEY OF SINGAPORE 2005
94
Chapter 13
FINANCIAL AND BUSINESS SERVICES
foreigners to purchase property. Credit extendedto the corporate sector also rose, with loans tomanufacturing, transport and storage, andprofessional and private individuals registeringstronger growth in 2005. Lending to the buildingand construction segment, however, fell by 2.2per cent from the previous year.
Deposits of non-bank customers posted growthof 8.5 per cent in 2005, following a 6.1 percent increase in the previous year. This broughtthe total stock of deposits from $206 billion in2004 to $224 billion as at end-December 2005.Fixed deposits accounted for the largest share ofthe expansion, surging 19 per cent to reach$118 billion, although this was partially offsetby a 5.0 per cent decline in savings deposits.
ASSETS AND LIABILITES OF FINANCIAL INSTITUTIONS [TABLE 13.2]
Financial Institution2003 2004 2005p 2003 2004 2005p
Percentage Change$ Billion Over Previous Year
COMMERCIAL BANKS1 362.5 398.2 425.2 2.7 9.8 6.8FINANCE COMPANIES 7.9 8.3 9.4 –42.4 5.1 13.7MERCHANT BANKS1 7.4 6.7 6.2 9.0 –8.8 –8.5
1 Refers to Domestic Banking Units only. Source: Monetary Authority of Singapore
Finance Companies
Lending activity of finance companies under-pinned by the strong expansion in housing loans…
Finance companies’ total assets/liabilities grewby 14 per cent to reach $9.4 billion as at end-December 2005.
On the assets side, total loans and advancesexpanded by 14 per cent to reach $7.9 billion.Housing loans expanded by 66 per cent,following the 26 per cent increase a year earlier,while hire-purchase loans recovered from a three-year contraction that began in 2001, growingby 4.3 per cent on the back of strong lending tothe motor vehicles segment.
From the liabilities perspective, total depositsof non-bank customers grew by 12 per cent in2005, to $6.4 million. Fixed deposits – whichmade up the bulk of total deposits placed withfinance companies – offset the decline in savingsand other deposits, with a $726 millionexpansion to end the year at $6.2 billion.
ECONOMIC SURVEY OF SINGAPORE 2005
95
FINANCIAL ANDBUSINESS SERVICES
Merchant Banks
The merchant banking segment strengthened onaccount of stronger loans and advances of AsianCurrency Units…
Total assets/liabilities of merchant banksnotched up growth of 9.5 per cent in 2005,compared to 1.8 per cent a year earlier. Thestronger performance came on the back of a 10per cent increase in the assets/liabilities ofmerchant banks’ Asian Currency Units (ACU)operations, even as that of domestic operationsfell 8.5 per cent during the year.
The deterioration in merchant banks’ domesticoperations was due in large part to the 19 percent fall in interbank lending activity, while loansand advances to non-bank customers contractedby a smaller 0.5 per cent.
In comparison, the 10 per cent rise in assets/liabilities of the merchant banks’ ACU operationsin 2005 could be traced to stronger loans andadvances to non-bank customers, which postedrobust growth of 43 per cent. This more thanoffset the 1.1 per cent contraction in interbanklending after its strong expansion in the previousyear.
Asian Dollar Market
Offshore banking business supported by stronggrowth in loans and advances to non-bank cus-tomers …
Total assets/liabilities of the Asian DollarMarket (ADM) rose sharply by US$30 billion toreach US$611 billion in 2005. Loans andadvances to non-bank customers expandedstrongly, with that to non-residents registering anincrease of 25 per cent. Meanwhile, interbanklending grew by 3.7 per cent in 2005, comparedwith 13 per cent a year ago. This reflected theweakness in domestic lending, which contractedby 7.4 per cent, even as overseas lending toregions such as the Americas and East Asiacontinued to gather momentum against thebackdrop of continuing improvement inmacroeconomic conditions.
On the liabilities side, non-bank depositssurged by US$12 billion, on strong inflow offunds from non-residents, while interbank lendingalso increased by some US$14 billion.
...total Asian DollarMarket assets reached
a new high...
ECONOMIC SURVEY OF SINGAPORE 2005
96
Chapter 13
FINANCIAL AND BUSINESS SERVICES
Insurance Industry
The life insurance premiums declined marginally in2005 while general insurance premiums remainedunchanged….
Total new business premiums in the direct lifeinsurance industry fell by 5.7 per cent to $6.4billion in 2005. The decline was largely attributedto the fall in single premium business sales to$5.4 billion, a decrease of 12 per cent comparedto 2004. This could be due to an increase inshort term interest rates and flattening of the yieldcurve which made single premium insurance1
products, which are typically priced based onthe yield of medium and long term interest rates,less attractive than short term deposits and othershorter term financial products. The regularpremium business, however, saw a significantgrowth in sales of 65 per cent to $788 million.The life annuity business also registered anincrease of 11 per cent to $263 million.
Premiums in the general insurance industryremained at $4.9 billion in 2005, comprising$2.2 billion in domestic business and $2.7 billionin offshore business. However, profitability almostdoubled with underwriting results improving to$515 million and operating results rising 53 percent to $847 million. Notably, the industry’sefforts towards better underwriting discipline andclaims control measures for motor insuranceappear to be bearing results with a furtherreduction in its motor loss ratio2 from 71 percent in 2004, to 65 per cent in 2005.
Central Provident Fund Board
Members’ CPF contributions and withdrawals forhousing and investment increased in 2005…
Members’ contributions to the CPF increasedby 5.1 per cent in 2005, following a 3.5 percent decline in the previous year. Totalwithdrawals recorded an increase of 14 per centto $12 billion, after a 13 per cent reduction in2004. This resulted in a net contribution of $4.2billion in 2005 compared with the netcontribution of $5.0 billion in the previous year.
Withdrawals for investment increased by 4.4per cent to $0.9 billion in 2005, from $0.8billion the year before. Withdrawals for housingpurposes increased by 13 per cent, from $6.5billion in 2004 to $7.4 billion in 2005.
Outstanding CPF balances due to membersgrew by 7.1 per cent, from $112 billion in 2004to $120 billion in 2005.
Stock Market
Local stock trading activity rebounded strongly insecond half of 2005 …
The domestic stock market began the year ona positive note, with the benchmark Straits TimesIndex (STI) continuing on its upward trend whichbegan in the second half of 2004. Investorsentiment was boosted by the buoyantperformance of the economy in 2004 as well ashealthy corporate earnings. Reflecting this, theSTI climbed steadily in the first quarter of 2005to reach 2,184 in March 2005, the highest levelin five years.
1 Excludes single premium life annuity business.2 The loss ratio is the ratio of the annual claims incurred by an insurance company to the premiums earned.
ECONOMIC SURVEY OF SINGAPORE 2005
97
FINANCIAL ANDBUSINESS SERVICES
Investor confidence waned somewhat in Aprilamid news that economic growth in the firstquarter was weaker than expected. Havingdecelerated from the cyclical high in 2004, therewere concerns that the economy would slip intoa technical recession. In the event, such fearsproved to be unfounded, with investors’enthusiasm for equities recovering in May, partlyon account of strong employment gains in thefirst quarter of the year, as well as growingevidence that the global electronics industry wasnot headed for a severe correction. Consequently,domestic stock prices continued their ascent inthe second quarter of the year, climbing to 2,213as at end-June.
The upward momentum in domestic equityprices continued unabated in the second half of2005, as the STI shrugged off lingering concernsover high oil prices. At the same time, equitytrading also benefited from the continuedtightening in the global interest rate environment,which induced investors to shift their portfoliosaway from fixed income securities. Investorsentiment strengthened further in the third quarter,on account of policy revisions in the residentialproperty market in July, which provided atemporary boost to bank and property stocks.Despite some moderation in the fourth quarter,the STI ended the year at 2,347 points, 13 percent higher than at the start of the year.
Securities Market
Turnover registered strong growth in 2005…
In 2005, turnover of the Singapore ExchangeSecurities Trading (SGX-ST) rose in value termsby 12 per cent to $205 billion, and in volumeterms by 14 per cent to 204 billion shares. Theincrease in turnover by value was driven bystrong trading interest in blue chip stocks, foreignstocks and structured warrants. In line with thestrong trading interest, general equity pricesexperienced strong gains, as reflected in the 277point rise of the bellwether STI. As at the end of2005, the combined market capitalisation of theMainboard and SESDAQ was $4283 billion.
New listings on the Mainboard and SESDAQtotalled 52 in 2005, a decline of 37 per centfrom the 82 new listings in 2004. There were10 delistings in 2005, a decrease from 12 in2004. At the end of 2005, 513 companies werelisted on the Mainboard and 171 companieswere listed on SESDAQ, up from 462 and 163respectively. The overall increase in the numberof listed companies and an increase in bondissuances contributed to a 20 per cent increasein the funds raised through SGX-ST. Through thevarious channels of initial public offerings, rightsissues, placements and bond issuances, a totalof $72 billion was raised in 2005.
Financial Futures Market
Derivative trading moderated from the previousyear …
In 2005, the number of derivative contractstraded on the Singapore Exchange DerivativesTrading (SGX-DT) declined 8.2 per cent to 26million, from 28 million in 2004. The decreasein volume was mainly attributable to a decreasein trading of the Eurodollar interest rate futurescontract, which fell from 8.2 million contracts in2004 to 88,000 contracts in 2005.
Strong trading interest in the Nikkei 225 stockindex futures contract and MSCI Taiwan indexfutures contracts continued in 2005, with avolume of 20 million contracts, or 77 per centof total volumes on SGX-DT. Other high volumecontracts such as the Euroyen interest rate futuresand the 10-year Mini Japanese government bondfutures also saw growth in 2005. Turnover ofthe Euroyen interest rate futures grew by 11 percent to reach close to 2.8 million contracts, whileturnover of the 10-year Mini Japanese governmentbond futures grew 33 per cent to reach morethan 1.2 million contracts.
3 With effect in May 2005, SGX-ST changed the methodology of computing its market capitalization by excluding inactive secondary foreign listings. This is to provide a moreaccurate reflection of its market capitalization. Had SGX-ST used the same methodology it had applied in 2004, the market capitalization of the SGX Mainboard and the SESDAQwould have been $526 billion, an increase of 23 per cent, from 2004’s $452 billion. This is due to a general increase in equity prices and the number of companies listed onSGX-ST.
ECONOMIC SURVEY OF SINGAPORE 2005
98
Chapter 13
FINANCIAL AND BUSINESS SERVICES
Foreign Exchange Market
Foreign exchange trading activity rose in 2005 …
The Singapore foreign exchange marketposted an average daily turnover of US$170billion in 2005, an increase of almost 10 percent compared to the previous year.
Trading in the major currencies continued todominate the Singapore foreign exchange market,with the US Dollar, Euro and Yen forming thebulk of foreign exchange trading. Trading in USDollar/Singapore Dollar as a percentage of totalvolume increased over the previous year,contributing almost 12 per cent of total turnoverin 2005.
The year saw a rebound in the US Dollarwhich rose almost 14 per cent against the Euroand about 15 per cent against the Yen. The USDollar was supported by higher US interest ratesand hence a widening yield differential againstthe other major currencies. It also benefited fromfavourable corporate repatriations to the US andpetrodollar recycling. The Euro fell in 2005 afterits rapid appreciation over 2002–2004, whilethe Yen weakened against the US Dollar amidgrowing investment outflows from Japan.
BUSINESS SERVICES(Table 13.1)
Property market improved, coupled with briskactivity in the business representative office andprofessional services segments…
In line with the strong momentum built up inthe key sectors of the economy, the businessservices sector expanded by 6.3 per cent in thefourth quarter, just a shade below the 6.6 percent clip the previous quarter. This lifted full yeargrowth to a five-year high of 4.9 per cent,compared to 2.8 per cent in 2004.
Underpinned by Singapore’s continuedattractiveness as a vibrant location for business,the business representative offices and IT &related services segments grew 13 per cent and9.5 per cent respectively in 2005. Consequently,professional services such as the legal, accountingand architectural & engineering services segmentsalso expanded at a stronger pace compared to2004.
The real estate segment, which accounts for38 per cent of the business services sector,managed a full year growth of 1.5 per cent.Performance in the private residential marketcontinued to improve, as the number oftransactions in the primary market surged 55 percent. Renewed buying interest, particularly forluxury homes, lifted private housing prices by 3.9per cent, an improvement over the 0.9 per centclocked in 2004.
Meanwhile, the office market alsostrengthened, as corporate expansion andpremise upgrading lowered the vacancy rate by3.3 percentage points to 13 per cent. Demandfor office space was particularly strong in theCentral Region, where rents jumped 13 per centin 2005, after climbing 3.9 per cent in 2004.Improving consumer sentiment, coupled with abuoyant tourism outlook, pushed up rents for shopspace in the Central Region by 4.2 per cent andreduced the vacancy rate from 10 per cent in2004 to 8.7 per cent. Similarly, the rental indexof industrial space also gained 5.2 per cent in2005, after rising 1.6 per cent in 2004. Thisreduced the vacancy rate from 12 per cent to11 per cent, which was the lowest level since2001.
The business servicessector continued to ride
on the strong momentumbuilt up in key sectors of
the economy...
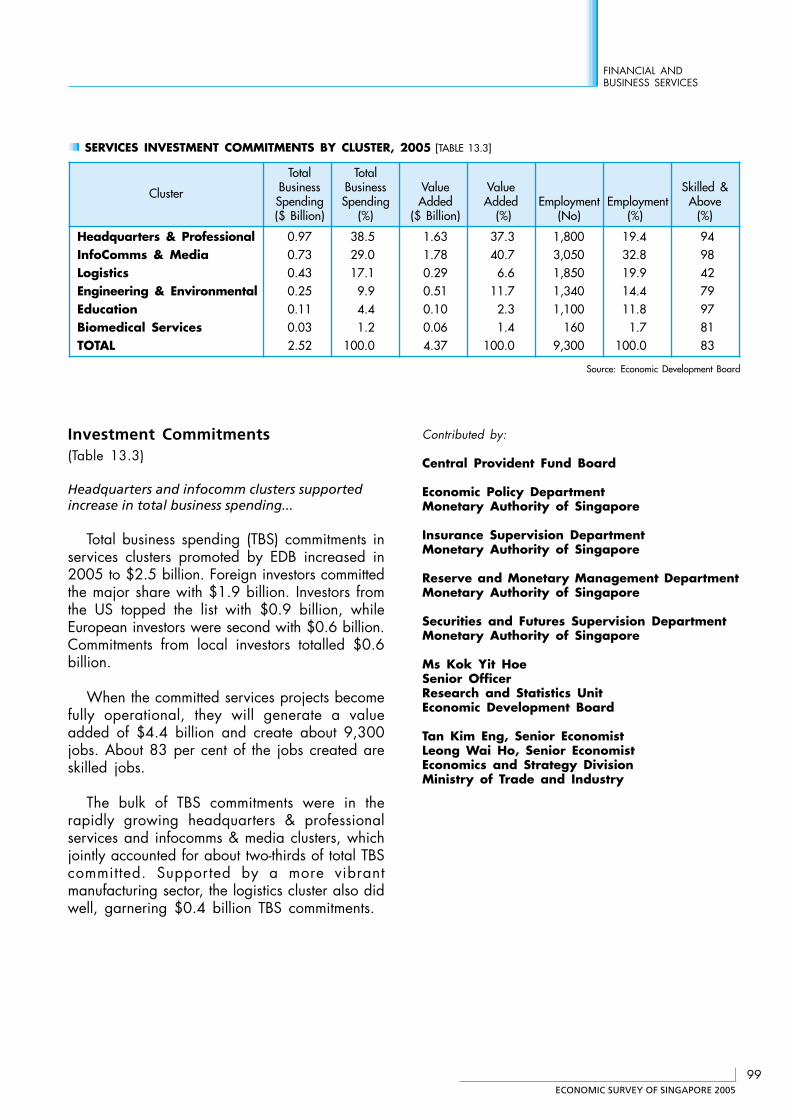
ECONOMIC SURVEY OF SINGAPORE 2005
99
FINANCIAL ANDBUSINESS SERVICES
Investment Commitments(Table 13.3)
Headquarters and infocomm clusters supportedincrease in total business spending...
Total business spending (TBS) commitments inservices clusters promoted by EDB increased in2005 to $2.5 billion. Foreign investors committedthe major share with $1.9 billion. Investors fromthe US topped the list with $0.9 billion, whileEuropean investors were second with $0.6 billion.Commitments from local investors totalled $0.6billion.
When the committed services projects becomefully operational, they will generate a valueadded of $4.4 billion and create about 9,300jobs. About 83 per cent of the jobs created areskilled jobs.
The bulk of TBS commitments were in therapidly growing headquarters & professionalservices and infocomms & media clusters, whichjointly accounted for about two-thirds of total TBScommitted. Supported by a more vibrantmanufacturing sector, the logistics cluster also didwell, garnering $0.4 billion TBS commitments.
Contributed by:
Central Provident Fund Board
Economic Policy DepartmentMonetary Authority of Singapore
Insurance Supervision DepartmentMonetary Authority of Singapore
Reserve and Monetary Management DepartmentMonetary Authority of Singapore
Securities and Futures Supervision DepartmentMonetary Authority of Singapore
Ms Kok Yit HoeSenior OfficerResearch and Statistics UnitEconomic Development Board
Tan Kim Eng, Senior EconomistLeong Wai Ho, Senior EconomistEconomics and Strategy DivisionMinistry of Trade and Industry
SERVICES INVESTMENT COMMITMENTS BY CLUSTER, 2005 [TABLE 13.3]
Total Total
Cluster Business Business Value Value Skilled &Spending Spending Added Added Employment Employment Above($ Billion) (%) ($ Billion) (%) (No) (%) (%)
Headquarters & Professional 0.97 38.5 1.63 37.3 1,800 19.4 94InfoComms & Media 0.73 29.0 1.78 40.7 3,050 32.8 98Logistics 0.43 17.1 0.29 6.6 1,850 19.9 42Engineering & Environmental 0.25 9.9 0.51 11.7 1,340 14.4 79Education 0.11 4.4 0.10 2.3 1,100 11.8 97Biomedical Services 0.03 1.2 0.06 1.4 160 1.7 81TOTAL 2.52 100.0 4.37 100.0 9,300 100.0 83
Source: Economic Development Board
STATISTICALAPPENDIX
STATISTICAL APPENDIX
Output, Expenditure and National Income
Table A1.1 – Gross Domestic Product by Industry 117
Table A1.2 – Gross Domestic Product by Industry, Seasonally Adjusted 119
Table A1.3 – Gross Domestic Product Deflators by Industry 120
Table A1.4 – Expenditure on Gross Domestic Product 121
Table A1.5 – Deflators of Expenditure on Gross Domestic Product 122
Table A1.6 – Private Consumption Expenditure 123
Table A1.7 – Gross Fixed Capital Formation 124
Table A1.8 – Gross Fixed Capital Formation by Public and Private Sector 125
Table A1.9 – Income Components of Gross Domestic Product 126
Table A1.10 – Output, Saving and Investment 127
Employment, Wages and Productivity
Table A2.1 – Changes in Employment by Sector 128
Table A2.2 – Economically Active Persons Aged 15 and Over by Age Group,Activity Status and Sex, June 2005 129
Table A2.3 – Persons Employed Aged 15 and Over by Industry, Age Groupand Sex, June 2005 130
Table A2.4 – Persons Employed Aged 15 and Over by Occupation, AgeGroup and Sex, June 2005 131
Table A2.5 – Persons Employed Aged 15 and Over by Industry andOccupation, June 2005 132
Table A2.6 – Age-Sex Specific Labour Force Participation Rates 133
Table A2.7 – Changes in Average Monthly Earnings 134
Table A2.8 – Indices of Unit Business Cost and Unit Labour Cost 135
Table A2.9 – Labour Productivity by Industry 136
Table A2.10 – Value Added Per Hour Worked by Industry 137
Prices
Table A3.1 – Consumer Price Index 138
Table A3.2 – Price Indices 139
Table A3.3 – Domestic Supply Price Index 140
Public Finance
Table A4.1 – Government Operating Revenue 141
Table A4.2 – Government Operating Expenditure 142
Table A4.3 – Government Development Expenditure 143
Table A4.4 – Government Debt 144
Monetary Indicators
Table A5.1 – Exchange Rates 145
Table A5.2 – Interest Rates 147
Table A5.3 – Money Supply 148
STATISTICAL APPENDIX (CONT’D)
External Trade
Table A6.1 – External Trade 149
Table A6.2 – Total Trade by Selected Market 150
Table A6.3 – Exports by Selected Market of Destination 154
Table A6.4 – Exports by Major Commodity 158
Table A6.5 – Domestic Exports by Major Commodity 160
Table A6.6 – Non-Oil Domestic Exports by Major Markets 162
Table A6.7 – Non-Oil Domestic Exports by Major Products 163
Table A6.8 – Imports by Selected Market of Origin 164
Table A6.9 – Imports by Major Commodity 168
Table A6.10 – Re-Exports by Major Commodity 170
Balance of Payments
Table A7.1 – Balance of Payments 172
Economic Outlook
Table A8.1 – Quarterly Composite Leading Index 174
Table A8.2 – Business Expectations for the Manufacturing Sector 175
Table A8.3 – Business Expectations for the Services Sectors 176
Manufacturing
Table A9.1 – Principal Statistics of Manufacturing 177
Table A9.2 – Principal Statistics of Manufacturing by Industry Cluster, 2004 178
Table A9.3 – Principal Statistics of Manufacturing by Industry Cluster, 2005 179
Table A9.4 – Index of Industrial Production 180
Table A9.5 – Investments Commitments in Manufacturing by IndustryCluster 182
Table A9.6 – Investments Commitments in Manufacturing by Countryof Origin 183
Construction
Table A10.1 – Building and Construction Activities 184
Retail Sales
Table A11.1 – Retail Sales Index 185
187
Tourism
Table A12.1 – Visitor Arrivals by Inbound Tourism Markets
Table A12.2 – Hotel Statistics and Food & Beverage
Revenue
189
STATISTICAL APPENDIX (CONT’D)
Transport and Communications
Table A13.1 – Transport and Communications 190
Banking
Table A14.1 – Assets of Banks 191
Table A14.2 – Liabilities of Banks 192
Table A14.3 – Bank Loans and Advances to Non-bank Customers by Industry 193
Table A14.4 – Assets and Liabilities of Asian Currency Units 194
NOTATIONSna not applicable or not availablenie not included elsewhereNB: The data for the current quarter are preliminary.

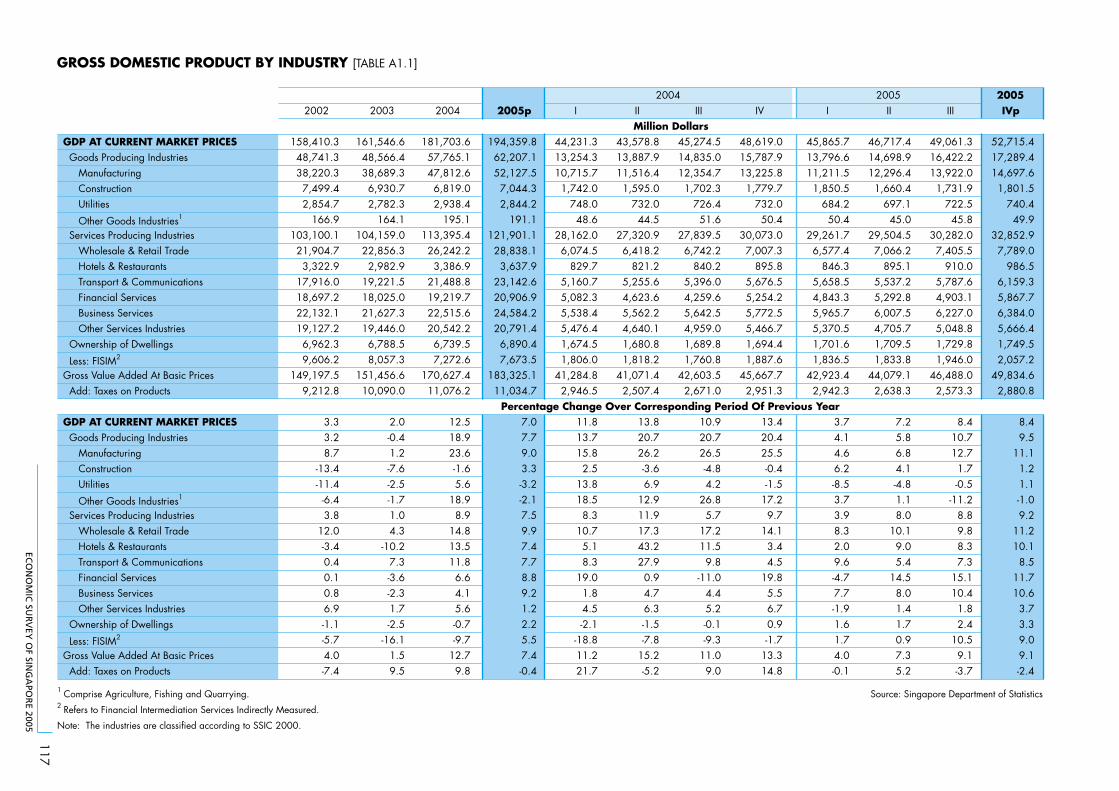
ECO
NO
MIC
SUR
VEY
OF SIN
GA
POR
E 2005
117
GROSS DOMESTIC PRODUCT BY INDUSTRY [TABLE A1.1]
20052002 2003 2004 2005p I II III IV I II III IVp
GDP AT CURRENT MARKET PRICES Goods Producing Industries Manufacturing Construction Utilities
Other Goods Industries1
Services Producing Industries Wholesale & Retail Trade Hotels & Restaurants Transport & Communications Financial Services Business Services Other Services Industries Ownership of Dwellings
Less: FISIM2
Gross Value Added At Basic Prices Add: Taxes on Products
158,410.348,741.338,220.37,499.42,854.7
166.9103,100.121,904.73,322.9
17,916.018,697.222,132.119,127.26,962.39,606.2
149,197.59,212.8
3.33.28.7
-13.4-11.4-6.43.8
12.0-3.40.40.10.86.9-1.1-5.74.0-7.4
161,546.648,566.438,689.36,930.72,782.3
164.1104,159.022,856.32,982.9
19,221.518,025.021,627.319,446.06,788.58,057.3
151,456.610,090.0
2.0-0.41.2-7.6-2.5-1.71.04.3
-10.27.3-3.6-2.31.7-2.5
-16.11.59.5
181,703.657,765.147,812.66,819.02,938.4
195.1113,395.426,242.23,386.9
21,488.819,219.722,515.620,542.26,739.57,272.6
170,627.411,076.2
12.518.923.6-1.65.6
18.98.9
14.813.511.86.64.15.6-0.7-9.7
12.79.8
194,359.862,207.152,127.57,044.32,844.2
191.1121,901.128,838.13,637.9
23,142.620,906.924,584.220,791.46,890.47,673.5
183,325.111,034.7
7.07.79.03.3-3.2-2.17.59.97.47.78.89.21.22.25.57.4-0.4
44,231.313,254.310,715.71,742.0
748.048.6
28,162.06,074.5
829.75,160.75,082.35,538.45,476.41,674.51,806.0
41,284.82,946.5
11.813.715.82.5
13.818.58.3
10.75.18.3
19.01.84.5-2.1
-18.811.221.7
43,578.813,887.911,516.41,595.0
732.044.5
27,320.96,418.2
821.25,255.64,623.65,562.24,640.11,680.81,818.2
41,071.42,507.4
13.820.726.2-3.66.9
12.911.917.343.227.90.94.76.3-1.5-7.8
15.2-5.2
45,274.514,835.012,354.71,702.3
726.451.6
27,839.56,742.2
840.25,396.04,259.65,642.54,959.01,689.81,760.8
42,603.52,671.0
10.920.726.5-4.84.2
26.85.7
17.211.59.8
-11.04.45.2-0.1-9.3
11.09.0
48,619.015,787.913,225.81,779.7
732.050.4
30,073.07,007.3
895.85,676.55,254.25,772.55,466.71,694.41,887.6
45,667.72,951.3
13.420.425.5-0.4-1.5
17.29.7
14.13.44.5
19.85.56.70.9-1.7
13.314.8
45,865.713,796.611,211.51,850.5
684.250.4
29,261.76,577.4
846.35,658.54,843.35,965.75,370.51,701.61,836.5
42,923.42,942.3
3.74.14.66.2-8.53.73.98.32.09.6-4.77.7-1.91.61.74.0-0.1
46,717.414,698.912,296.41,660.4
697.145.0
29,504.57,066.2
895.15,537.25,292.86,007.54,705.71,709.51,833.8
44,079.12,638.3
7.25.86.84.1-4.81.18.0
10.19.05.4
14.58.01.41.70.97.35.2
49,061.316,422.213,922.01,731.9
722.545.8
30,282.07,405.5
910.05,787.64,903.16,227.05,048.81,729.81,946.0
46,488.02,573.3
8.410.712.71.7-0.5
-11.28.89.88.37.3
15.110.41.82.4
10.59.1-3.7
52,715.417,289.414,697.61,801.5
740.449.9
32,852.97,789.0
986.56,159.35,867.76,384.05,666.41,749.52,057.2
49,834.62,880.8
8.49.5
11.11.21.1-1.09.2
11.210.18.5
11.710.63.73.39.09.1-2.4
1 Comprise Agriculture, Fishing and Quarrying. Source: Singapore Department of Statistics2 Refers to Financial Intermediation Services Indirectly Measured.
Note: The industries are classified according to SSIC 2000.
2004
Million Dollars
Percentage Change Over Corresponding Period Of Previous Year
2005
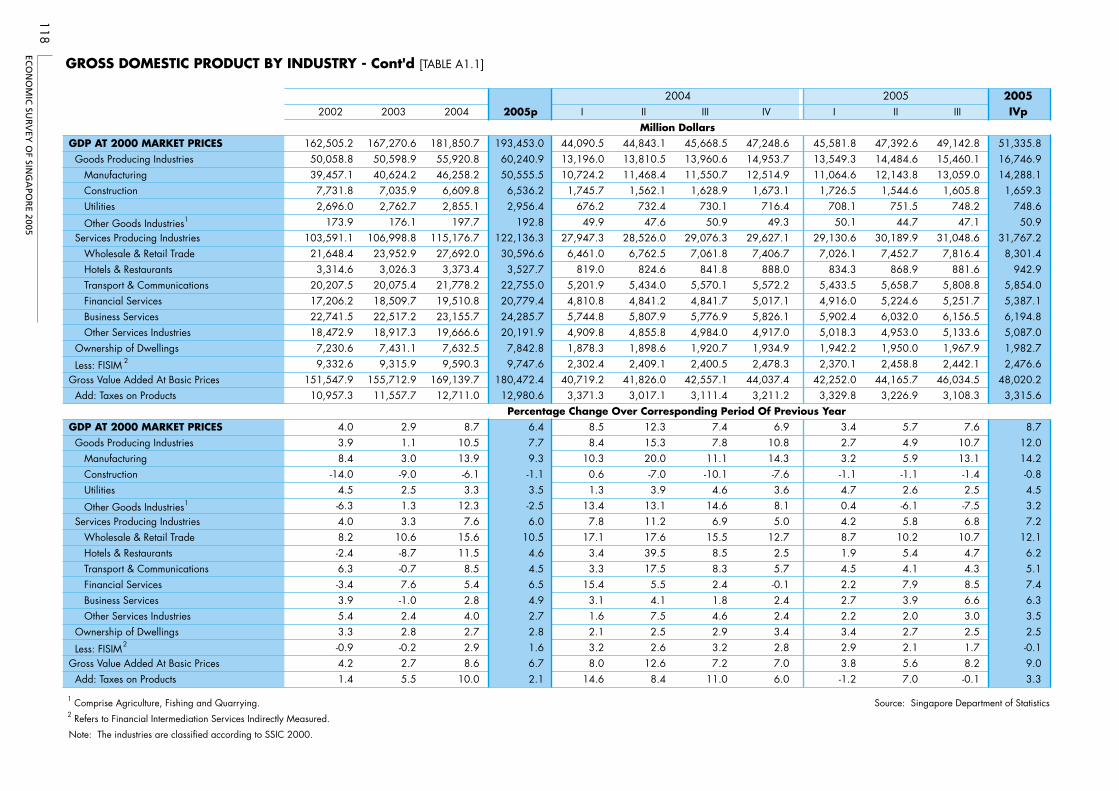
ECO
NO
MIC
SUR
VEY
OF SIN
GA
POR
E 2005
118
GROSS DOMESTIC PRODUCT BY INDUSTRY - Cont'd [TABLE A1.1]
20052002 2003 2004 2005p I II III IV I II III IVp
GDP AT 2000 MARKET PRICES Goods Producing Industries Manufacturing Construction Utilities
Other Goods Industries1
Services Producing Industries Wholesale & Retail Trade Hotels & Restaurants Transport & Communications Financial Services Business Services Other Services Industries Ownership of Dwellings
Less: FISIMGross Value Added At Basic Prices Add: Taxes on Products
162,505.250,058.839,457.1
7,731.82,696.0
173.9103,591.1
21,648.43,314.6
20,207.517,206.222,741.518,472.9
7,230.69,332.6
151,547.910,957.3
4.03.98.4
-14.04.5-6.34.08.2-2.46.3-3.43.95.43.3-0.94.21.4
167,270.650,598.940,624.2
7,035.92,762.7
176.1106,998.8
23,952.93,026.3
20,075.418,509.722,517.218,917.3
7,431.19,315.9
155,712.911,557.7
2.91.13.0-9.02.51.33.3
10.6-8.7-0.77.6-1.02.42.8-0.22.75.5
181,850.755,920.846,258.2
6,609.82,855.1
197.7115,176.7
27,692.03,373.4
21,778.219,510.823,155.719,666.6
7,632.59,590.3
169,139.712,711.0
8.710.513.9-6.13.3
12.37.6
15.611.5
8.55.42.84.02.72.98.6
10.0
193,453.060,240.950,555.5
6,536.22,956.4
192.8122,136.3
30,596.63,527.7
22,755.020,779.424,285.720,191.9
7,842.89,747.6
180,472.412,980.6
6.47.79.3-1.13.5-2.56.0
10.54.64.56.54.92.72.81.66.72.1
44,090.513,196.010,724.2
1,745.7676.2
49.927,947.3
6,461.0819.0
5,201.94,810.85,744.84,909.81,878.32,302.4
40,719.23,371.3
8.58.4
10.30.61.3
13.47.8
17.13.43.3
15.43.11.62.13.28.0
14.6
44,843.113,810.511,468.4
1,562.1732.4
47.628,526.0
6,762.5824.6
5,434.04,841.25,807.94,855.81,898.62,409.1
41,826.03,017.1
12.315.320.0-7.03.9
13.111.217.639.517.5
5.54.17.52.52.6
12.68.4
45,668.513,960.611,550.7
1,628.9730.150.9
29,076.37,061.8
841.85,570.14,841.75,776.94,984.01,920.72,400.5
42,557.13,111.4
7.47.8
11.1-10.1
4.614.6
6.915.5
8.58.32.41.84.62.93.27.2
11.0
47,248.614,953.712,514.91,673.1
716.449.3
29,627.17,406.7
888.05,572.25,017.15,826.14,917.01,934.92,478.3
44,037.43,211.2
6.910.814.3-7.63.68.15.0
12.72.55.7-0.12.42.43.42.87.06.0
45,581.813,549.311,064.6
1,726.5708.1
50.129,130.6
7,026.1834.3
5,433.54,916.05,902.45,018.31,942.22,370.1
42,252.03,329.8
3.42.73.2-1.14.70.44.28.71.94.52.22.72.23.42.93.8-1.2
47,392.614,484.612,143.81,544.6
751.544.7
30,189.97,452.7
868.95,658.75,224.66,032.04,953.01,950.02,458.8
44,165.73,226.9
5.74.95.9-1.12.6-6.15.8
10.25.44.17.93.92.02.72.15.67.0
49,142.815,460.113,059.0
1,605.8748.2
47.131,048.6
7,816.4881.6
5,808.85,251.76,156.55,133.61,967.92,442.1
46,034.53,108.3
7.610.713.1-1.42.5-7.56.8
10.74.74.38.56.63.02.51.78.2-0.1
51,335.816,746.914,288.1
1,659.3748.6
50.931,767.2
8,301.4942.9
5,854.05,387.16,194.85,087.01,982.72,476.6
48,020.23,315.6
8.712.014.2-0.84.53.27.2
12.16.25.17.46.33.52.5-0.19.03.3
1 Comprise Agriculture, Fishing and Quarrying. Source: Singapore Department of Statistics2 Refers to Financial Intermediation Services Indirectly Measured.
Note: The industries are classified according to SSIC 2000.
2004 2005
Million Dollars
Percentage Change Over Corresponding Period Of Previous Year
2
2
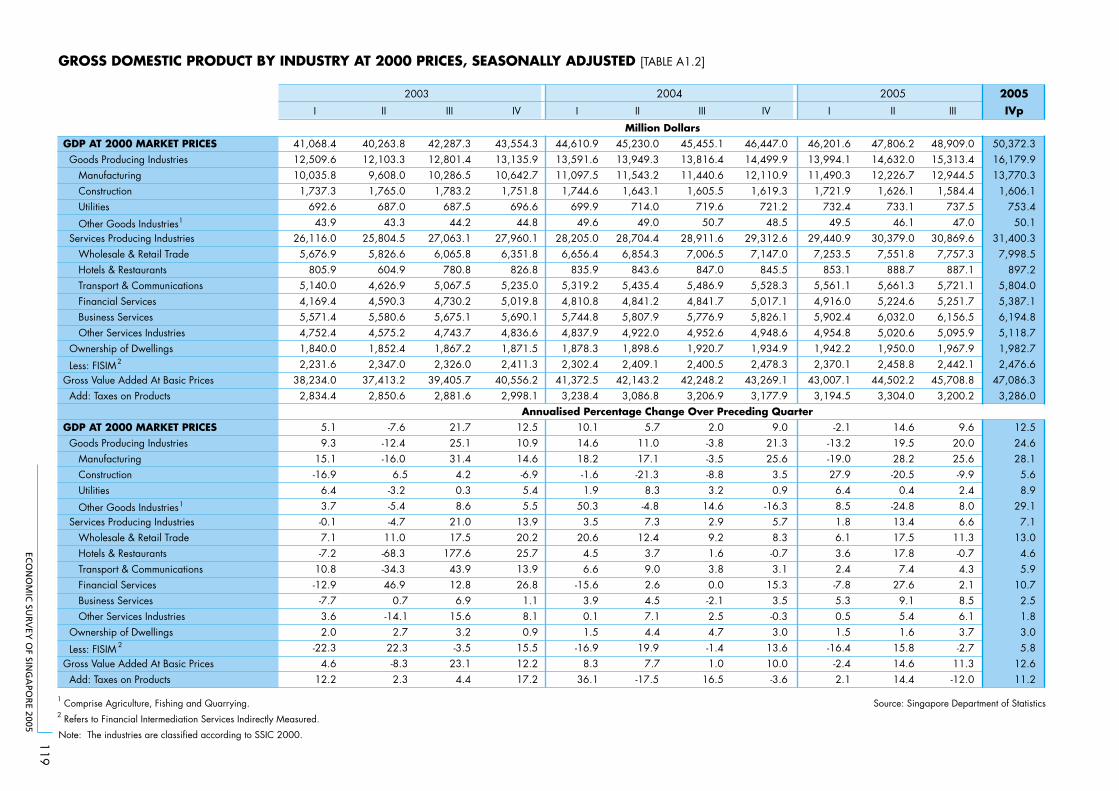
ECO
NO
MIC
SUR
VEY
OF SIN
GA
POR
E 2005
119
GROSS DOMESTIC PRODUCT BY INDUSTRY AT 2000 PRICES, SEASONALLY ADJUSTED [TABLE A1.2]
2005II III IV II III IV I III IVp
GDP AT 2000 MARKET PRICES 40,263.8 42,287.3 43,554.3 46,201.6 Goods Producing Industries 12,103.3 12,801.4 13,135.9 13,994.1 Manufacturing 9,608.0 10,286.5 10,642.7 11,490.3 Construction 1,765.0 1,783.2 1,751.8 1,721.9 Utilities 687.0 687.5 696.6 732.4
Other Goods Industries1 43.3 44.2 44.8 49.5 Services Producing Industries 25,804.5 27,063.1 27,960.1 29,440.9 Wholesale & Retail Trade 5,826.6 6,065.8 6,351.8 7,253.5 Hotels & Restaurants 604.9 780.8 826.8 853.1 Transport & Communications 4,626.9 5,067.5 5,235.0 5,561.1 Financial Services 4,590.3 4,730.2 5,019.8 4,916.0 Business Services 5,580.6 5,675.1 5,690.1 5,902.4 Other Services Industries 4,575.2 4,743.7 4,836.6 4,954.8 Ownership of Dwellings 1,852.4 1,867.2 1,871.5 1,942.2
Less: FISIM2 2,347.0 2,326.0 2,411.3 2,370.1Gross Value Added At Basic Prices 37,413.2 39,405.7 40,556.2 43,007.1 Add: Taxes on Products 2,850.6 2,881.6 2,998.1 3,194.5
GDP AT 2000 MARKET PRICES -7.6 21.7 12.5 5.7 -2.1 Goods Producing Industries -12.4 25.1 10.9 -13.2 Manufacturing -16.0 31.4 14.6 -19.0 Construction 6.5 4.2 -6.9 27.9 Utilities -3.2 0.3 5.4 8.3 6.4
Other Goods Industries1 -5.4 8.6 5.5 8.5 Services Producing Industries -4.7 21.0 13.9 7.3 1.8 Wholesale & Retail Trade 11.0 17.5 20.2 6.1 Hotels & Restaurants -68.3 177.6 25.7 3.7 3.6 Transport & Communications -34.3 43.9 13.9 9.0 2.4 Financial Services 46.9 12.8 26.8 2.6 -7.8 Business Services 0.7 6.9 1.1 4.5 5.3 Other Services Industries -14.1 15.6 8.1 7.1 0.5 Ownership of Dwellings 2.7 3.2 0.9 4.4 1.5
Less: FISIM 2 22.3 -3.5 15.5 -16.4Gross Value Added At Basic Prices -8.3 23.1 12.2 7.7 -2.4 Add: Taxes on Products
I
41,068.412,509.610,035.8
1,737.3692.6
43.926,116.0
5,676.9805.9
5,140.04,169.45,571.44,752.41,840.02,231.6
38,234.02,834.4
5.19.3
15.1-16.9
6.43.7-0.17.1-7.2
10.8-12.9
-7.73.62.0
-22.34.6
12.2 2.3 4.4 17.2
I
44,610.913,591.611,097.5
1,744.6699.9
49.628,205.0
6,656.4835.9
5,319.24,810.85,744.84,837.91,878.32,302.4
41,372.53,238.4
10.114.618.2-1.61.9
50.33.5
20.64.56.6
-15.63.90.11.5
-16.98.3
36.1
45,230.013,949.311,543.2
1,643.1714.0
49.028,704.4
6,854.3843.6
5,435.44,841.25,807.94,922.01,898.62,409.1
42,143.23,086.8
11.017.1-21.3
-4.8
12.4
19.9
-17.5
45,455.113,816.411,440.6
1,605.5719.6
50.728,911.6
7,006.5847.0
5,486.94,841.75,776.94,952.61,920.72,400.5
42,248.23,206.9
2.0-3.8-3.5-8.83.2
14.62.99.21.63.80.0-2.12.54.7-1.41.0
16.5
46,447.014,499.912,110.9
1,619.3721.2
48.529,312.6
7,147.0845.5
5,528.35,017.15,826.14,948.61,934.92,478.3
43,269.13,177.9
9.021.325.6
3.50.9
-16.35.78.3-0.73.1
15.33.5-0.33.0
13.610.0-3.6 2.1
47,806.214,632.012,226.71,626.1
733.146.1
30,379.07,551.8
888.75,661.35,224.66,032.05,020.61,950.02,458.8
44,502.23,304.0
14.619.528.2-20.5
0.4-24.813.417.517.8
7.427.6
9.15.41.6
15.814.614.4
48,909.015,313.412,944.5
1,584.4737.5
47.030,869.6
7,757.3887.1
5,721.15,251.76,156.55,095.91,967.92,442.1
45,708.83,200.2
9.620.025.6-9.92.48.06.6
11.3-0.74.32.18.56.13.7-2.7
11.3-12.0
50,372.316,179.913,770.3
1,606.1753.4
50.131,400.3
7,998.5897.2
5,804.05,387.16,194.85,118.71,982.72,476.6
47,086.33,286.0
12.524.628.1
5.68.9
29.17.1
13.04.65.9
10.72.51.83.05.8
12.611.2
1 Comprise Agriculture, Fishing and Quarrying. Source: Singapore Department of Statistics2 Refers to Financial Intermediation Services Indirectly Measured.
Note: The industries are classified according to SSIC 2000.
2003 2004
II
2005
Annualised Percentage Change Over Preceding Quarter
Million Dollars
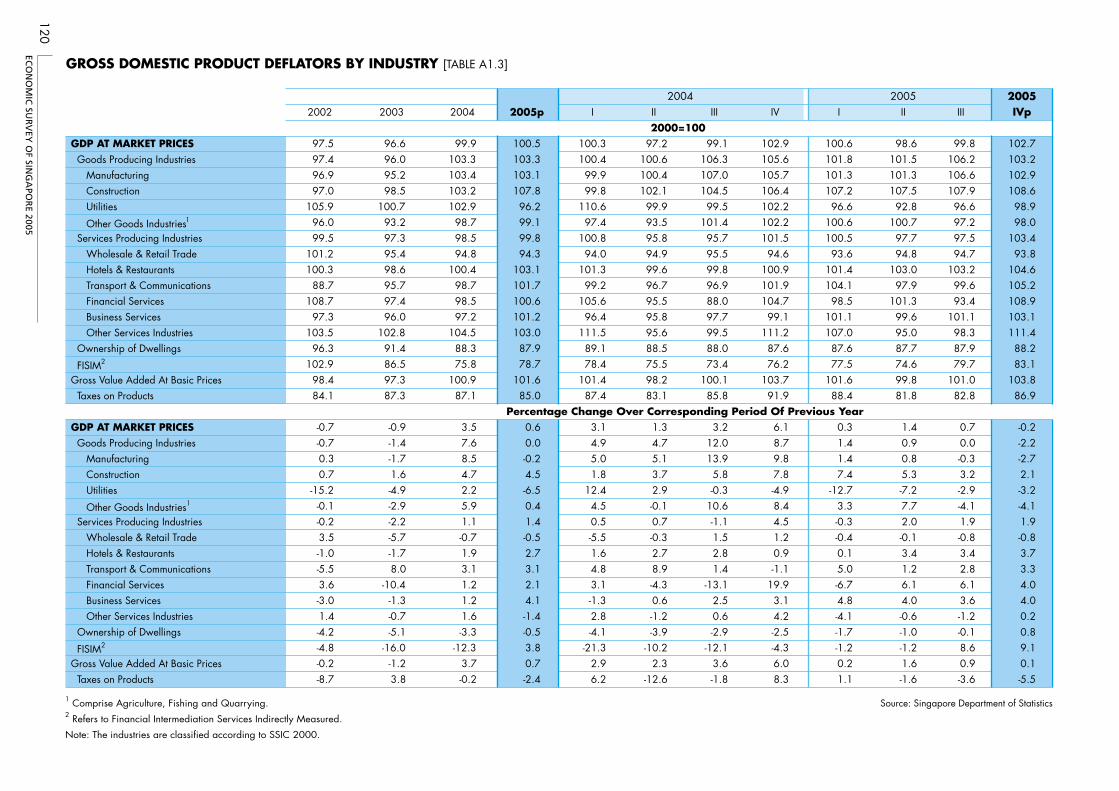
ECO
NO
MIC
SUR
VEY
OF SIN
GA
POR
E 2005
120
GROSS DOMESTIC PRODUCT DEFLATORS BY INDUSTRY [TABLE A1.3]
20052002 2003 2004 2005p I II III IV I II III IVp
GDP AT MARKET PRICES 99.8 102.7 Goods Producing Industries 106.2 103.2 Manufacturing 106.6 102.9 Construction 107.9 108.6 Utilities 96.6 98.9
Other Goods Industries1 97.2 98.0 Services Producing Industries 97.5 103.4 Wholesale & Retail Trade 94.7 93.8 Hotels & Restaurants 103.2 104.6 Transport & Communications 99.6 105.2 Financial Services 93.4 108.9 Business Services 101.1 103.1 Other Services Industries 98.3 111.4 Ownership of Dwellings 87.9 88.2
FISIM2 79.7 83.1Gross Value Added At Basic Prices 101.0 103.8 Taxes on Products 82.8 86.9
GDP AT MARKET PRICES 0.7 -0.2 Goods Producing Industries 0.0 -2.2 Manufacturing -0.3 -2.7 Construction 3.2 2.1 Utilities -2.9 -3.2
Other Goods Industries1 -4.1 -4.1 Services Producing Industries 1.9 1.9 Wholesale & Retail Trade -0.8 -0.8 Hotels & Restaurants 3.4 3.7 Transport & Communications 2.8 3.3 Financial Services 6.1 4.0 Business Services 3.6 4.0 Other Services Industries -1.2 0.2 Ownership of Dwellings -0.1 0.8
FISIM2 8.6 9.1Gross Value Added At Basic Prices 0.9 0.1 Taxes on Products
97.597.496.997.0
105.996.099.5
101.2100.3
88.7108.7
97.3103.5
96.3102.9
98.484.1
-0.7-0.70.30.7
-15.2-0.1-0.23.5-1.0-5.53.6-3.01.4-4.2-4.8-0.2-8.7
96.696.095.298.5
100.793.297.395.498.695.797.496.0
102.891.486.597.387.3
-0.9-1.4-1.71.6-4.9-2.9-2.2-5.7-1.78.0
-10.4-1.3-0.7-5.1
-16.0-1.23.8
99.9103.3103.4103.2102.9
98.798.594.8
100.498.798.597.2
104.588.375.8
100.987.1
3.57.68.54.72.25.91.1-0.71.93.11.21.21.6-3.3
-12.33.7-0.2
100.5103.3103.1107.8
96.299.199.894.3
103.1101.7100.6101.2103.0
87.978.7
101.685.0
0.60.0-0.24.5-6.50.41.4-0.52.73.12.14.1-1.4-0.53.80.7-2.4
100.3100.4
99.999.8
110.697.4
100.894.0
101.399.2
105.696.4
111.589.178.4
101.487.4
3.14.95.01.8
12.44.50.5-5.51.64.83.1-1.32.8-4.1
-21.32.96.2
97.2100.6100.4102.1
99.993.595.894.999.696.795.595.895.688.575.598.283.1
1.34.75.13.72.9-0.10.7-0.32.78.9-4.30.6-1.2-3.9
-10.22.3
-12.6
99.1106.3107.0104.5
99.5101.4
95.795.599.896.988.097.799.588.073.4
100.185.8
3.212.013.9
5.8-0.3
10.6-1.11.52.81.4
-13.12.50.6-2.9
-12.13.6-1.8
102.9105.6105.7106.4102.2102.2101.5
94.6100.9101.9104.7
99.1111.2
87.676.2
103.791.9
6.18.79.87.8-4.98.44.51.20.9-1.1
19.93.14.2-2.5-4.36.08.3
100.6101.8101.3107.2
96.6100.6100.5
93.6101.4104.1
98.5101.1107.0
87.677.5
101.688.4
0.31.41.47.4
-12.73.3-0.3-0.40.15.0-6.74.8-4.1-1.7-1.20.21.1
98.6101.5101.3107.5
92.8100.7
97.794.8
103.097.9
101.399.695.087.774.699.881.8
1.40.90.85.3-7.27.72.0-0.13.41.26.14.0-0.6-1.0-1.21.6-1.6 -3.6 -5.5
1 Comprise Agriculture, Fishing and Quarrying. Source: Singapore Department of Statistics2 Refers to Financial Intermediation Services Indirectly Measured.
Note: The industries are classified according to SSIC 2000.
2004
2000=100
Percentage Change Over Corresponding Period Of Previous Year
2005
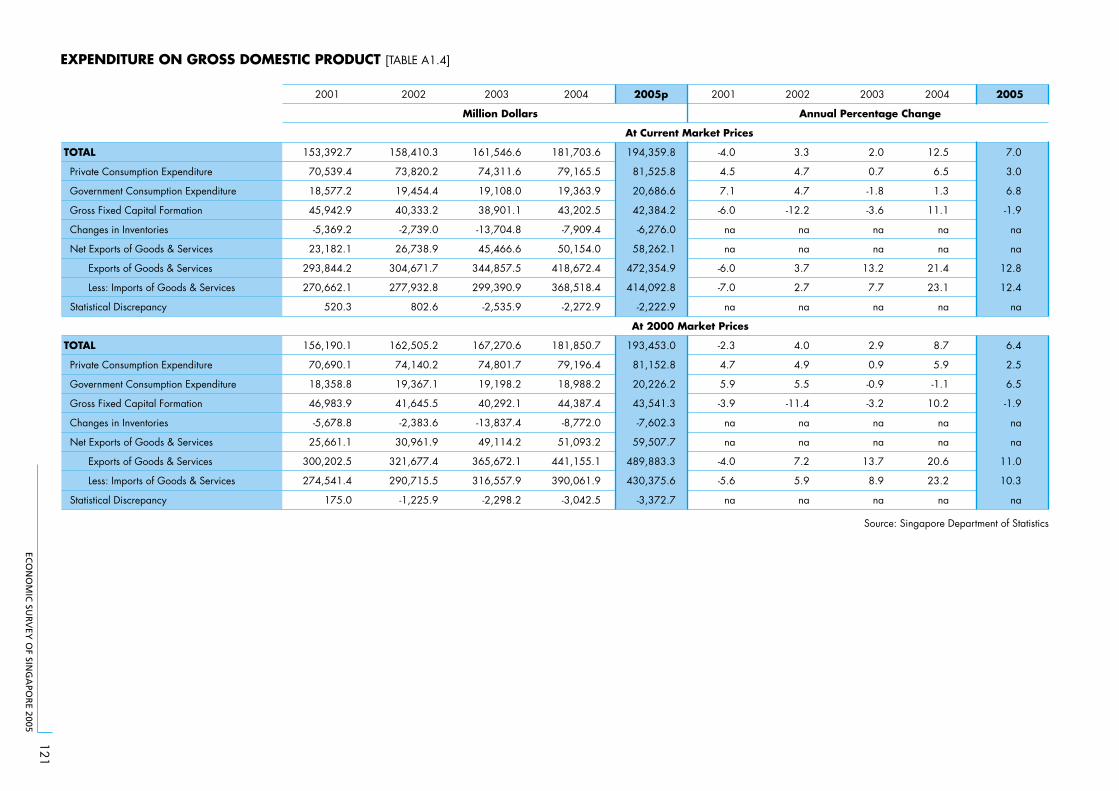
ECO
NO
MIC
SUR
VEY
OF SIN
GA
POR
E 2005
121
EXPENDITURE ON GROSS DOMESTIC PRODUCT [TABLE A1.4]
2001 2002 2003 2004 2005p 2001 2002
Annual Percentage Change
TOTAL 158,410.3 161,546.6 181,703.6 3.3
Private Consumption Expenditure 73,820.2 74,311.6 79,165.5 4.7
Government Consumption Expenditure 19,454.4 19,108.0 19,363.9 4.7
Gross Fixed Capital Formation 40,333.2 38,901.1 43,202.5 -12.2
Changes in Inventories -2,739.0 -13,704.8 -7,909.4 na
Net Exports of Goods & Services 26,738.9 45,466.6 50,154.0 na
Exports of Goods & Services 304,671.7 344,857.5 418,672.4 3.7
Less: Imports of Goods & Services 277,932.8 299,390.9 368,518.4 2.7
Statistical Discrepancy 802.6 -2,535.9 -2,272.9 na
TOTAL 162,505.2 167,270.6 181,850.7 4.0
Private Consumption Expenditure 74,140.2 74,801.7 79,196.4 4.9
Government Consumption Expenditure 19,367.1 19,198.2 18,988.2 5.5
Gross Fixed Capital Formation 41,645.5 40,292.1 44,387.4 -11.4
Changes in Inventories -2,383.6 -13,837.4 -8,772.0 na
Net Exports of Goods & Services 30,961.9 49,114.2 51,093.2 na
Exports of Goods & Services 321,677.4 365,672.1 441,155.1 7.2
Less: Imports of Goods & Services 290,715.5 316,557.9 390,061.9 5.9
Statistical Discrepancy
153,392.7
70,539.4
18,577.2
45,942.9
-5,369.2
23,182.1
293,844.2
270,662.1
520.3
156,190.1
70,690.1
18,358.8
46,983.9
-5,678.8
25,661.1
300,202.5
274,541.4
175.0 -1,225.9 -2,298.2 -3,042.5
194,359.8
81,525.8
20,686.6
42,384.2
-6,276.0
58,262.1
472,354.9
414,092.8
-2,222.9
193,453.0
81,152.8
20,226.2
43,541.3
-7,602.3
59,507.7
489,883.3
430,375.6
-3,372.7
-4.0
4.5
7.1
-6.0
na
na
-6.0
-7.0
na
-2.3
4.7
5.9
-3.9
na
na
-4.0
-5.6
na na
2003
2.0
0.7
-1.8
-3.6
na
na
13.2
7.7
na
2.9
0.9
-0.9
-3.2
na
na
13.7
8.9
na
2004
12.5
6.5
1.3
11.1
na
na
21.4
23.1
na
8.7
5.9
-1.1
10.2
na
na
20.6
23.2
na
2005
7.0
3.0
6.8
-1.9
na
na
12.8
12.4
na
6.4
2.5
6.5
-1.9
na
na
11.0
10.3
na
Source: Singapore Department of Statistics
At 2000 Market Prices
At Current Market Prices
Million Dollars
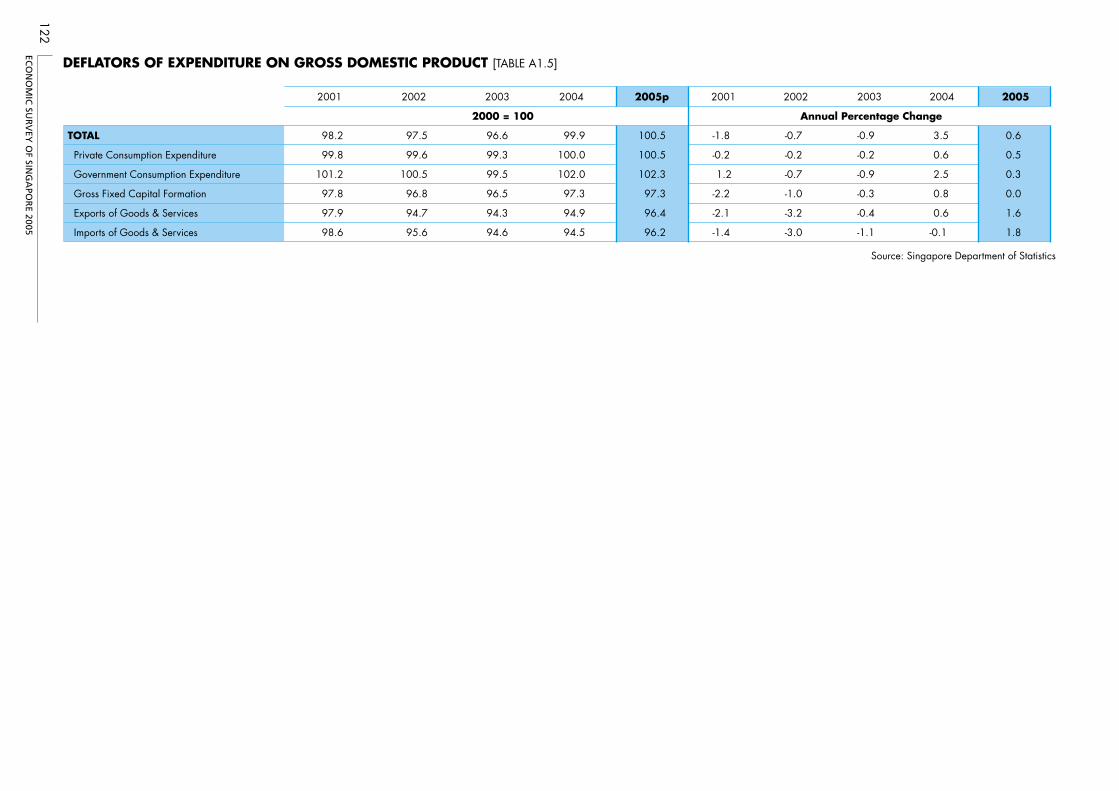
ECO
NO
MIC
SUR
VEY
OF SIN
GA
POR
E 2005
122
DEFLATORS OF EXPENDITURE ON GROSS DOMESTIC PRODUCT [TABLE A1.5]
2001 2002 2003 2004 2005p 2001 2002 2003 2004 2005
TOTAL 96.6 99.9 -1.8 -0.7 -0.9 3.5 0.6
Private Consumption Expenditure 99.3 100.0 -0.2 -0.2 -0.2 0.6 0.5
Government Consumption Expenditure 99.5 102.0 1.2 -0.7 -0.9 2.5 0.3
Gross Fixed Capital Formation 96.5 97.3 -2.2 -1.0 -0.3 0.8 0.0
Exports of Goods & Services 94.3 94.9 -2.1 -3.2 -0.4 0.6 1.6
Imports of Goods & Services
98.2
99.8
101.2
97.8
97.9
98.6
97.5
99.6
100.5
96.8
94.7
95.6 94.6 94.5
100.5
100.5
102.3
97.3
96.4
96.2 -1.4 -3.0 -1.1 -0.1 1.8
Source: Singapore Department of Statistics
2000 = 100 Annual Percentage Change
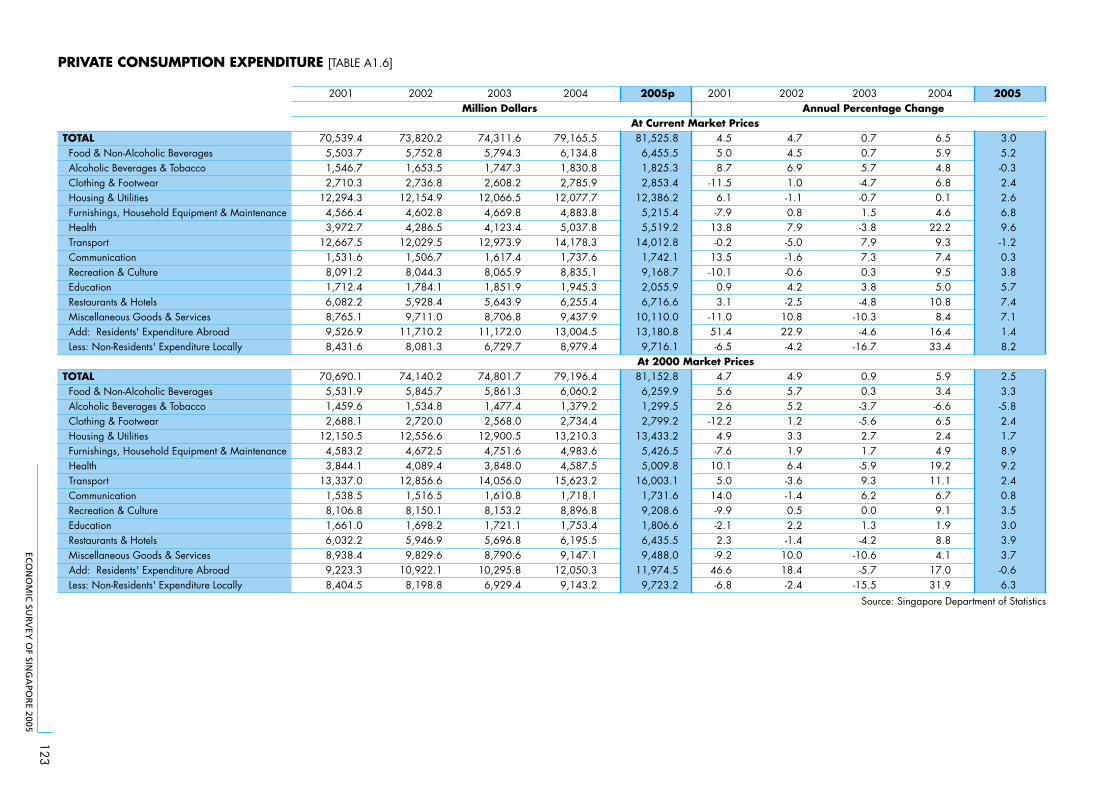
ECO
NO
MIC
SUR
VEY
OF SIN
GA
POR
E 2005
123
2005p 2001 2002 2003
TOTAL 81,525.8 4.5 4.7 0.7 Food & Non-Alcoholic Beverages 6,455.5 5.0 4.5 0.7 Alcoholic Beverages & Tobacco 1,825.3 8.7 6.9 5.7 Clothing & Footwear 2,853.4 -11.5 1.0 -4.7 Housing & Utilities 12,386.2 6.1 -1.1 -0.7 Furnishings, Household Equipment & Maintenance 5,215.4 -7.9 0.8 1.5 Health 5,519.2 13.8 7.9 -3.8 Transport 14,012.8 -0.2 -5.0 7.9 Communication 1,742.1 13.5 -1.6 7.3 Recreation & Culture 9,168.7 -10.1 -0.6 0.3 Education 2,055.9 0.9 4.2 3.8 Restaurants & Hotels 6,716.6 3.1 -2.5 -4.8 Miscellaneous Goods & Services 10,110.0 -11.0 10.8 -10.3 Add: Residents' Expenditure Abroad 13,180.8 51.4 22.9 -4.6 Less: Non-Residents' Expenditure Locally 9,716.1 -6.5 -4.2 -16.7
TOTAL 81,152.8 4.7 4.9 0.9 Food & Non-Alcoholic Beverages 6,259.9 5.6 5.7 0.3 Alcoholic Beverages & Tobacco 1,299.5 2.6 5.2 -3.7 Clothing & Footwear 2,799.2 -12.2 1.2 -5.6 Housing & Utilities 13,433.2 4.9 3.3 2.7 Furnishings, Household Equipment & Maintenance 5,426.5 -7.6 1.9 1.7 Health 5,009.8 10.1 6.4 -5.9 Transport 16,003.1 5.0 -3.6 9.3 Communication 1,731.6 14.0 -1.4 6.2 Recreation & Culture 9,208.6 -9.9 0.5 0.0 Education 1,806.6 -2.1 2.2 1.3 Restaurants & Hotels 6,435.5 2.3 -1.4 -4.2 Miscellaneous Goods & Services 9,488.0 -9.2 10.0 -10.6 Add: Residents' Expenditure Abroad 11,974.5 46.6 18.4 -5.7 Less: Non-Residents' Expenditure Locally
2001
70,539.45,503.71,546.72,710.3
12,294.34,566.43,972.7
12,667.51,531.68,091.21,712.46,082.28,765.19,526.98,431.6
70,690.15,531.91,459.62,688.1
12,150.54,583.23,844.1
13,337.01,538.58,106.81,661.06,032.28,938.49,223.38,404.5
2002
73,820.25,752.81,653.52,736.8
12,154.94,602.84,286.5
12,029.51,506.78,044.31,784.15,928.49,711.0
11,710.28,081.3
74,140.25,845.71,534.82,720.0
12,556.64,672.54,089.4
12,856.61,516.58,150.11,698.25,946.99,829.6
10,922.18,198.8
2004
79,165.56,134.81,830.82,785.9
12,077.74,883.85,037.8
14,178.31,737.68,835.11,945.36,255.49,437.9
13,004.58,979.4
79,196.46,060.21,379.22,734.4
13,210.34,983.64,587.5
15,623.21,718.18,896.81,753.46,195.59,147.1
12,050.39,143.2 9,723.2 -6.8 -2.4 -15.5
2004
6.55.94.86.80.14.6
22.29.37.49.55.0
10.88.4
16.433.4
5.93.4-6.66.52.44.9
19.211.1
6.79.11.98.84.1
17.031.9
2005
3.05.2-0.32.42.66.89.6-1.20.33.85.77.47.11.48.2
2.53.3-5.82.41.78.99.22.40.83.53.03.93.7-0.66.3
Source: Singapore Department of Statistics
At 2000 Market Prices
PRIVATE CONSUMPTION EXPENDITURE [TABLE A1.6]
2003
74,311.65,794.31,747.32,608.2
12,066.54,669.84,123.4
12,973.91,617.48,065.91,851.95,643.98,706.8
11,172.06,729.7
74,801.75,861.31,477.42,568.0
12,900.54,751.63,848.0
14,056.01,610.88,153.21,721.15,696.88,790.6
10,295.86,929.4
Million Dollars Annual Percentage ChangeAt Current Market Prices
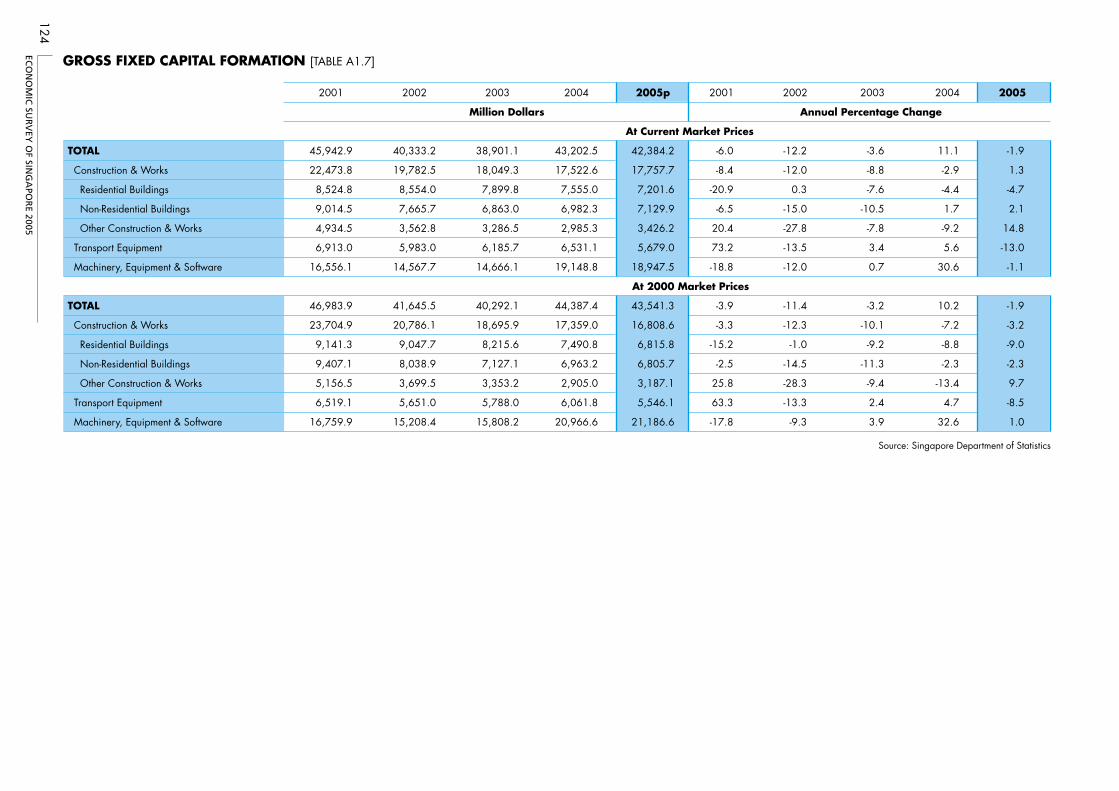
ECO
NO
MIC
SUR
VEY
OF SIN
GA
POR
E 2005
124
GROSS FIXED CAPITAL FORMATION [TABLE A1.7]
Annual Percentage Change
TOTAL
Construction & Works
Residential Buildings
Non-Residential Buildings
Other Construction & Works
Transport Equipment
Machinery, Equipment & Software
TOTAL
Construction & Works
Residential Buildings
Non-Residential Buildings
Other Construction & Works
Transport Equipment
Machinery, Equipment & Software
2001
45,942.9
22,473.8
8,524.8
9,014.5
4,934.5
6,913.0
16,556.1
46,983.9
23,704.9
9,141.3
9,407.1
5,156.5
6,519.1
16,759.9
2002
40,333.2
19,782.5
8,554.0
7,665.7
3,562.8
5,983.0
14,567.7
41,645.5
20,786.1
9,047.7
8,038.9
3,699.5
5,651.0
15,208.4
2003
38,901.1
18,049.3
7,899.8
6,863.0
3,286.5
6,185.7
14,666.1
40,292.1
18,695.9
8,215.6
7,127.1
3,353.2
5,788.0
15,808.2
2004
43,202.5
17,522.6
7,555.0
6,982.3
2,985.3
6,531.1
19,148.8
44,387.4
17,359.0
7,490.8
6,963.2
2,905.0
6,061.8
20,966.6
2005p
42,384.2
17,757.7
7,201.6
7,129.9
3,426.2
5,679.0
18,947.5
43,541.3
16,808.6
6,815.8
6,805.7
3,187.1
5,546.1
21,186.6
2001
-6.0
-8.4
-20.9
-6.5
20.4
73.2
-18.8
-3.9
-3.3
-15.2
-2.5
25.8
63.3
-17.8
2002
-12.2
-12.0
0.3
-15.0
-27.8
-13.5
-12.0
-11.4
-12.3
-1.0
-14.5
-28.3
-13.3
-9.3
2003
-3.6
-8.8
-7.6
-10.5
-7.8
3.4
0.7
-3.2
-10.1
-9.2
-11.3
-9.4
2.4
3.9
2004
11.1
-2.9
-4.4
1.7
-9.2
5.6
30.6
10.2
-7.2
-8.8
-2.3
-13.4
4.7
32.6
2005
-1.9
1.3
-4.7
2.1
14.8
-13.0
-1.1
-1.9
-3.2
-9.0
-2.3
9.7
-8.5
1.0
Source: Singapore Department of Statistics
Million Dollars
At Current Market Prices
At 2000 Market Prices
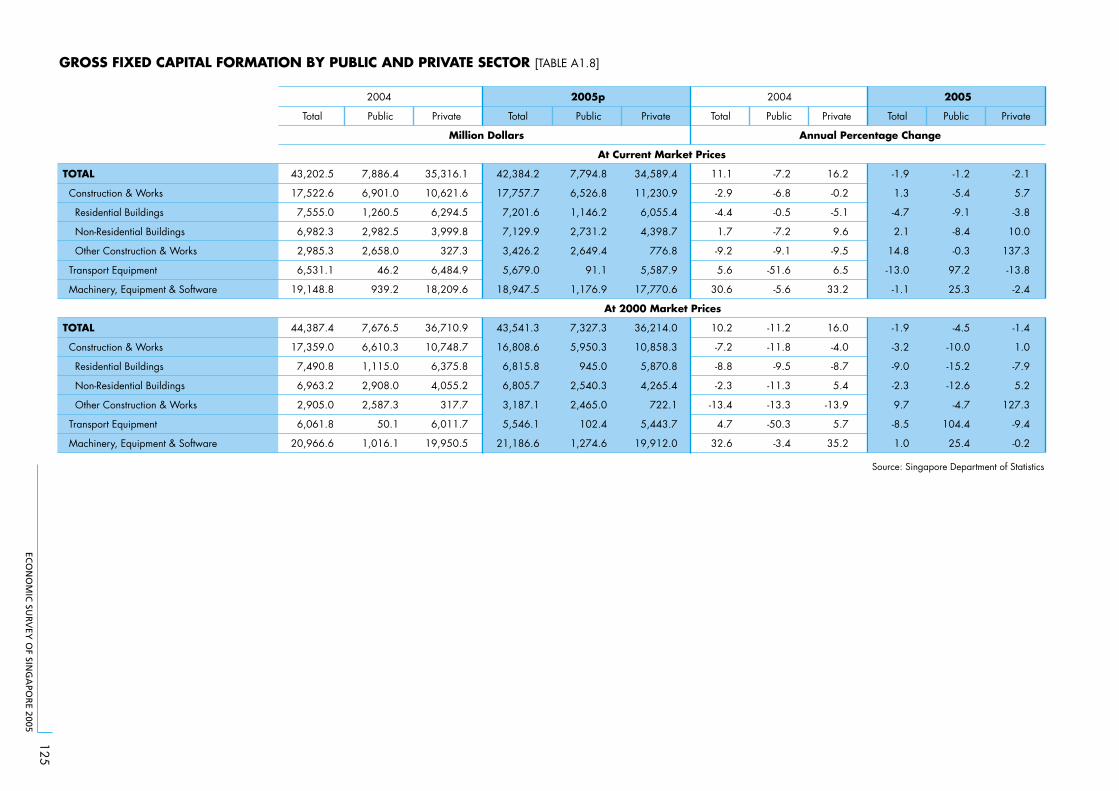
ECO
NO
MIC
SUR
VEY
OF SIN
GA
POR
E 2005
125
GROSS FIXED CAPITAL FORMATION BY PUBLIC AND PRIVATE SECTOR [TABLE A1.8]
2004 2005p 2005
Total Public Private Total Public Private Total Public Private Total Public Private
Million Dollars Annual Percentage Change
TOTAL
Construction & Works
Residential Buildings
Non-Residential Buildings
Other Construction & Works
Transport Equipment
Machinery, Equipment & Software
TOTAL
Construction & Works
Residential Buildings
Non-Residential Buildings
Other Construction & Works
Transport Equipment
Machinery, Equipment & Software
43,202.5
17,522.6
7,555.0
6,982.3
2,985.3
6,531.1
19,148.8
44,387.4
17,359.0
7,490.8
6,963.2
2,905.0
6,061.8
20,966.6
7,886.4
6,901.0
1,260.5
2,982.5
2,658.0
46.2
939.2
7,676.5
6,610.3
1,115.0
2,908.0
2,587.3
50.1
1,016.1
35,316.1
10,621.6
6,294.5
3,999.8
327.3
6,484.9
18,209.6
36,710.9
10,748.7
6,375.8
4,055.2
317.7
6,011.7
19,950.5
42,384.2
17,757.7
7,201.6
7,129.9
3,426.2
5,679.0
18,947.5
43,541.3
16,808.6
6,815.8
6,805.7
3,187.1
5,546.1
21,186.6
7,794.8
6,526.8
1,146.2
2,731.2
2,649.4
91.1
1,176.9
7,327.3
5,950.3
945.0
2,540.3
2,465.0
102.4
1,274.6
34,589.4
11,230.9
6,055.4
4,398.7
776.8
5,587.9
17,770.6
36,214.0
10,858.3
5,870.8
4,265.4
722.1
5,443.7
19,912.0
11.1
-2.9
-4.4
1.7
-9.2
5.6
30.6
10.2
-7.2
-8.8
-2.3
-13.4
4.7
32.6
-7.2
-6.8
-0.5
-7.2
-9.1
-51.6
-5.6
-11.2
-11.8
-9.5
-11.3
-13.3
-50.3
-3.4
16.2
-0.2
-5.1
9.6
-9.5
6.5
33.2
16.0
-4.0
-8.7
5.4
-13.9
5.7
35.2
-1.9
1.3
-4.7
2.1
14.8
-13.0
-1.1
-1.9
-3.2
-9.0
-2.3
9.7
-8.5
1.0
-1.2
-5.4
-9.1
-8.4
-0.3
97.2
25.3
-4.5
-10.0
-15.2
-12.6
-4.7
104.4
25.4
-2.1
5.7
-3.8
10.0
137.3
-13.8
-2.4
-1.4
1.0
-7.9
5.2
127.3
-9.4
-0.2
Source: Singapore Department of Statistics
2004
At Current Market Prices
At 2000 Market Prices
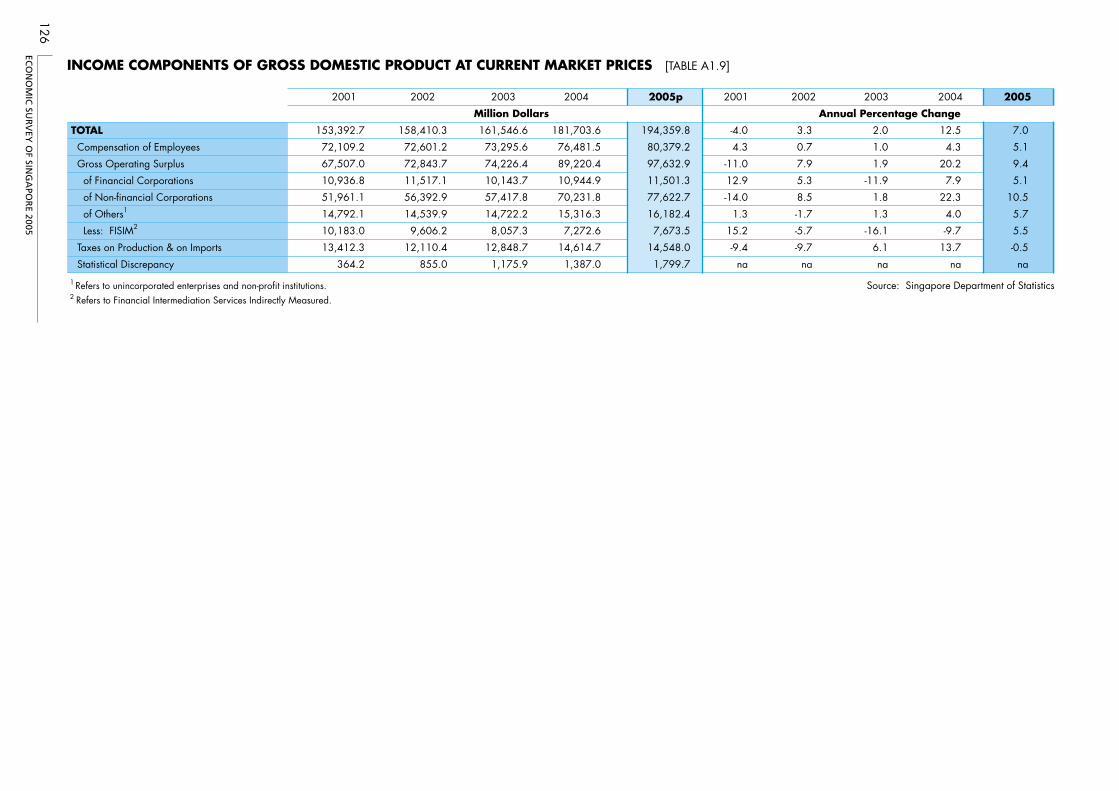
ECO
NO
MIC
SUR
VEY
OF SIN
GA
POR
E 2005
126
2001 2002 2003 2004 2005p 2001 2002 2003 2004 2005
TOTAL 153,392.7 158,410.3 161,546.6 181,703.6 194,359.8 -4.0 3.3 2.0 12.5 7.0
Compensation of Employees 72,109.2 72,601.2 73,295.6 76,481.5 80,379.2 4.3 0.7 1.0 4.3 5.1
Gross Operating Surplus 67,507.0 72,843.7 74,226.4 89,220.4 97,632.9 -11.0 7.9 1.9 20.2 9.4
of Financial Corporations 10,936.8 11,517.1 10,143.7 10,944.9 11,501.3 12.9 5.3 -11.9 7.9 5.1
of Non-financial Corporations 51,961.1 56,392.9 57,417.8 70,231.8 77,622.7 -14.0 8.5 1.8 22.3 10.5
of Others1 14,792.1 14,539.9 14,722.2 15,316.3 16,182.4 1.3 -1.7 1.3 4.0 5.7
Less: FISIM2 10,183.0 9,606.2 8,057.3 7,272.6 7,673.5 15.2 -5.7 -16.1 -9.7 5.5
Taxes on Production & on Imports 13,412.3 12,110.4 12,848.7 14,614.7 14,548.0 -9.4 -9.7 6.1 13.7 -0.5
Statistical Discrepancy 364.2 855.0 1,175.9 1,387.0 1,799.7 na na na na na
1 Refers to unincorporated enterprises and non-profit institutions. Source: Singapore Department of Statistics2 Refers to Financial Intermediation Services Indirectly Measured.
INCOME COMPONENTS OF GROSS DOMESTIC PRODUCT AT CURRENT MARKET PRICES [TABLE A1.9]
Annual Percentage ChangeMillion Dollars
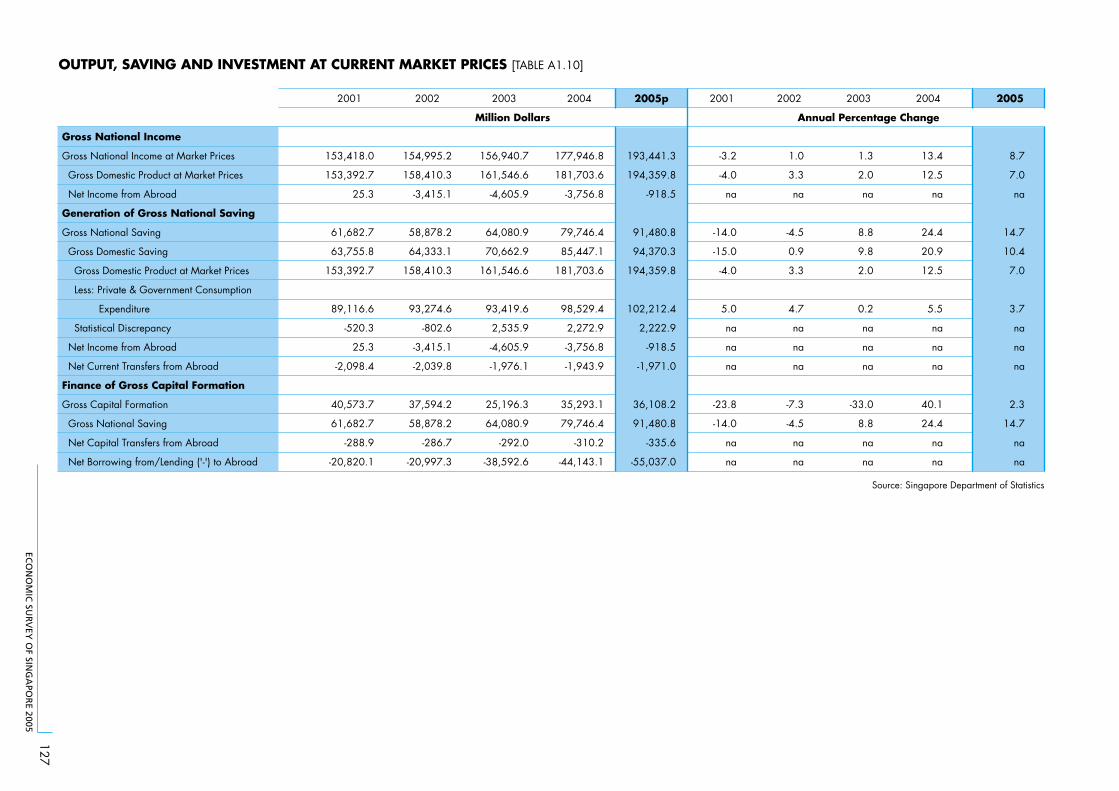
ECO
NO
MIC
SUR
VEY
OF SIN
GA
POR
E 2005
127
OUTPUT, SAVING AND INVESTMENT AT CURRENT MARKET PRICES [TABLE A1.10]
2001 2002 2003 2004 2005p 2001 2002 2003 2004 2005
Gross National Income
Gross National Income at Market Prices
Gross Domestic Product at Market Prices
Net Income from Abroad
Generation of Gross National Saving
Gross National Saving
Gross Domestic Saving
Gross Domestic Product at Market Prices
Less: Private & Government Consumption
Expenditure
Statistical Discrepancy
Net Income from Abroad
Net Current Transfers from Abroad
Finance of Gross Capital Formation
Gross Capital Formation
Gross National Saving
Net Capital Transfers from Abroad
Net Borrowing from/Lending ('-') to Abroad
153,418.0
153,392.7
25.3
61,682.7
63,755.8
153,392.7
89,116.6
-520.3
25.3
-2,098.4
40,573.7
61,682.7
-288.9
-20,820.1
154,995.2
158,410.3
-3,415.1
58,878.2
64,333.1
158,410.3
93,274.6
-802.6
-3,415.1
-2,039.8
37,594.2
58,878.2
-286.7
-20,997.3
156,940.7
161,546.6
-4,605.9
64,080.9
70,662.9
161,546.6
93,419.6
2,535.9
-4,605.9
-1,976.1
25,196.3
64,080.9
-292.0
-38,592.6
177,946.8
181,703.6
-3,756.8
79,746.4
85,447.1
181,703.6
98,529.4
2,272.9
-3,756.8
-1,943.9
35,293.1
79,746.4
-310.2
-44,143.1
193,441.3
194,359.8
-918.5
91,480.8
94,370.3
194,359.8
102,212.4
2,222.9
-918.5
-1,971.0
36,108.2
91,480.8
-335.6
-55,037.0
-3.2
-4.0
na
-14.0
-15.0
-4.0
5.0
na
na
na
-23.8
-14.0
na
na
1.0
3.3
na
-4.5
0.9
3.3
4.7
na
na
na
-7.3
-4.5
na
na
1.3
2.0
na
8.8
9.8
2.0
0.2
na
na
na
-33.0
8.8
na
na
12.5
13.4
na
24.4
20.9
12.5
5.5
na
na
na
40.1
24.4
na
na
3.7
8.7
7.0
na
14.7
10.4
7.0
na
na
na
2.3
14.7
na
na
Source: Singapore Department of Statistics
Annual Percentage ChangeMillion Dollars
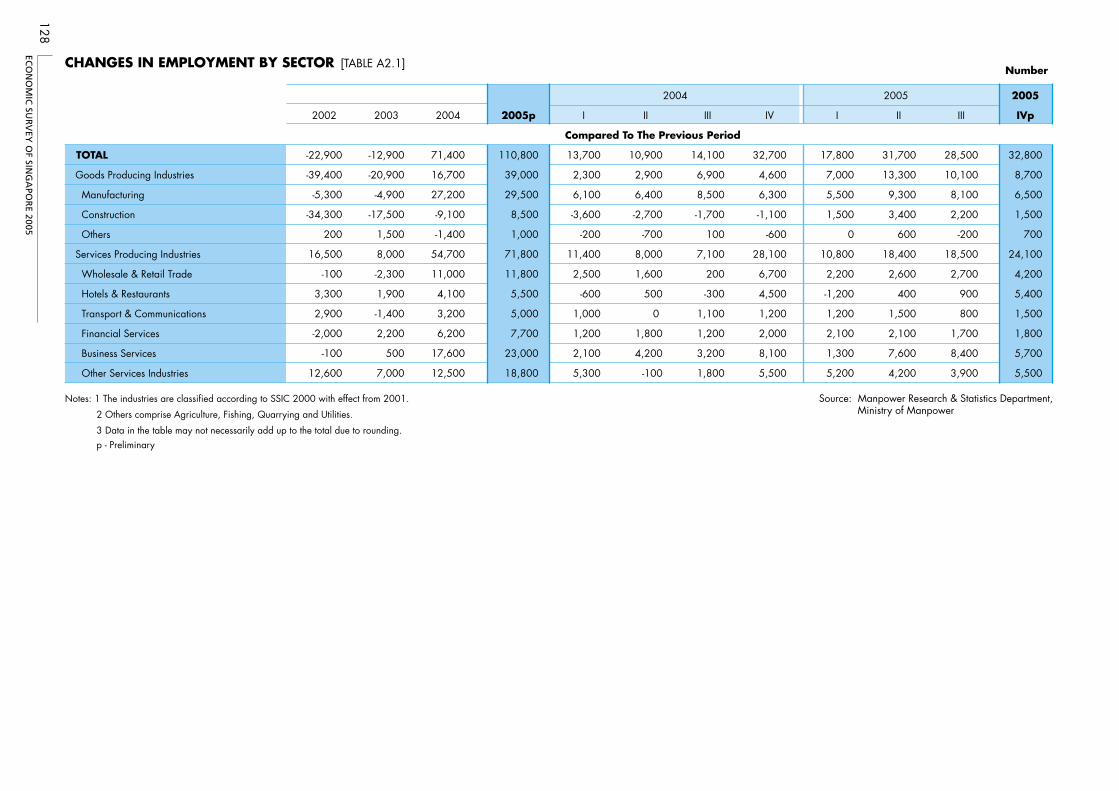
ECO
NO
MIC
SUR
VEY
OF SIN
GA
POR
E 2005
128
Number
2005
2002 2003 2004 2005p IVp
TOTAL -22,900 -12,900 71,400 110,800
Goods Producing Industries -39,400 -20,900 16,700 39,000
Manufacturing -5,300 -4,900 27,200 29,500
Construction -34,300 -17,500 -9,100 8,500
Others 200 1,500 -1,400 1,000
Services Producing Industries 16,500 8,000 54,700 71,800
Wholesale & Retail Trade -100 -2,300 11,000 11,800
Hotels & Restaurants 3,300 1,900 4,100 5,500
Transport & Communications 2,900 -1,400 3,200 5,000
Financial Services -2,000 2,200 6,200 7,700
Business Services -100 500 17,600 23,000
Other Services Industries 12,600 7,000 12,500 18,800
I
13,700
2,300
6,100
-3,600
-200
11,400
2,500
-600
1,000
1,200
2,100
5,300
II
10,900
2,900
6,400
-2,700
-700
8,000
1,600
500
0
1,800
4,200
-100
III
14,100
6,900
8,500
-1,700
100
7,100
200
-300
1,100
1,200
3,200
1,800
IV
32,700
4,600
6,300
-1,100
-600
28,100
6,700
4,500
1,200
2,000
8,100
5,500
I
17,800
7,000
5,500
1,500
0
10,800
2,200
-1,200
1,200
2,100
1,300
5,200
II
31,700
13,300
9,300
3,400
600
18,400
2,600
400
1,500
2,100
7,600
4,200
III
28,500
10,100
8,100
2,200
-200
18,500
2,700
900
800
1,700
8,400
3,900
32,800
8,700
6,500
1,500
700
24,100
4,200
5,400
1,500
1,800
5,700
5,500
Notes: 1 The industries are classified according to SSIC 2000 with effect from 2001. Source: Manpower Research & Statistics Department,Ministry of Manpower 2 Others comprise Agriculture, Fishing, Quarrying and Utilities.
3 Data in the table may not necessarily add up to the total due to rounding. p - Preliminary
Compared To The Previous Period
CHANGES IN EMPLOYMENT BY SECTOR [TABLE A2.1]
2004 2005
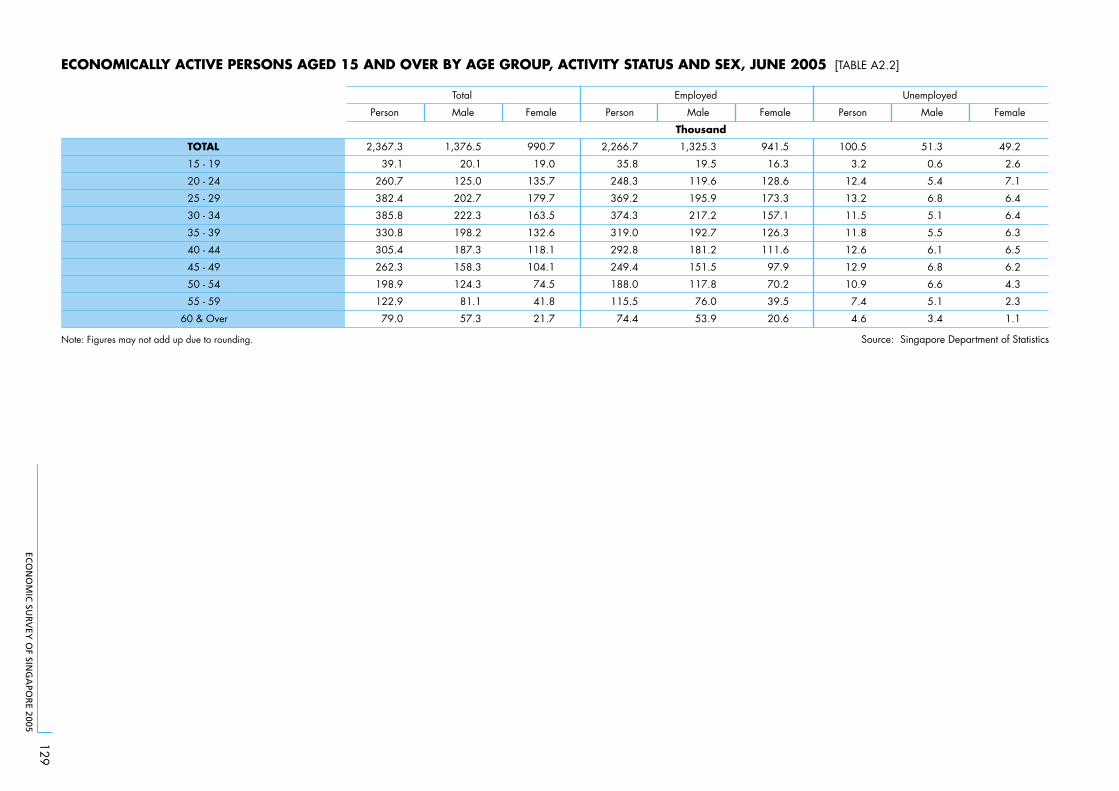
ECO
NO
MIC
SUR
VEY
OF SIN
GA
POR
E 2005
129
ECONOMICALLY ACTIVE PERSONS AGED 15 AND OVER BY AGE GROUP, ACTIVITY STATUS AND SEX, JUNE 2005 [TABLE A2.2]
Total Employed Unemployed
Person Person
TOTAL 2,367.3 100.5
15 - 19 39.1 3.2
20 - 24 260.7 12.4
25 - 29 382.4 13.2
30 - 34 385.8 11.5
35 - 39 330.8 11.8
40 - 44 305.4 12.6
45 - 49 262.3 12.9
50 - 54 198.9 10.9
55 - 59 122.9 7.4
60 & Over 79.0
Male
1,376.5
20.1
125.0
202.7
222.3
198.2
187.3
158.3
124.3
81.1
57.3
Female
990.7
19.0
135.7
179.7
163.5
132.6
118.1
104.1
74.5
41.8
21.7
Person
2,266.7
35.8
248.3
369.2
374.3
319.0
292.8
249.4
188.0
115.5
74.4
Male
1,325.3
19.5
119.6
195.9
217.2
192.7
181.2
151.5
117.8
76.0
53.9
Female
941.5
16.3
128.6
173.3
157.1
126.3
111.6
97.9
70.2
39.5
20.6 4.6
Male
51.3
0.6
5.4
6.8
5.1
5.5
6.1
6.8
6.6
5.1
3.4
Female
49.2
2.6
7.1
6.4
6.4
6.3
6.5
6.2
4.3
2.3
1.1
Note: Figures may not add up due to rounding. Source: Singapore Department of Statistics
Thousand
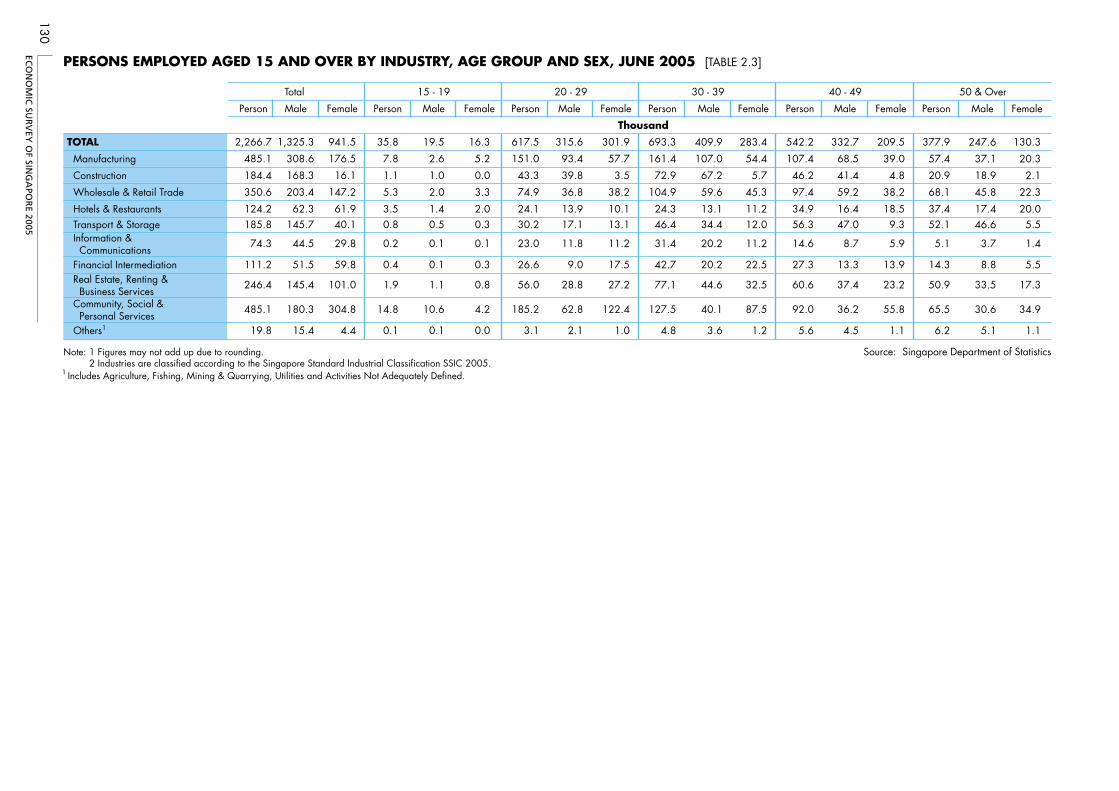
ECO
NO
MIC
SUR
VEY
OF SIN
GA
POR
E 2005
130
PERSONS EMPLOYED AGED 15 AND OVER BY INDUSTRY, AGE GROUP AND SEX, JUNE 2005 [TABLE 2.3]
Total 15 - 19 20 - 29 30 - 39 40 - 49 50 & Over
TOTAL
Manufacturing
Construction
Wholesale & Retail Trade
Hotels & Restaurants Transport & Storage Information & Communications Financial Intermediation Real Estate, Renting & Business Services Community, Social & Personal Services Others1
Person
2,266.7
485.1
184.4
350.6
124.2185.8
74.3
111.2
246.4
485.1
19.8
Male
1,325.3
308.6
168.3
203.4
62.3145.7
44.5
51.5
145.4
180.3
15.4
Female
941.5
176.5
16.1
147.2
61.940.1
29.8
59.8
101.0
304.8
4.4
Person
35.8
7.8
1.1
5.3
3.50.8
0.2
0.4
1.9
14.8
0.1
Male
19.5
2.6
1.0
2.0
1.40.5
0.1
0.1
1.1
10.6
0.1
Female
16.3
5.2
0.0
3.3
2.00.3
0.1
0.3
0.8
4.2
0.0
Person
617.5
151.0
43.3
74.9
24.130.2
23.0
26.6
56.0
185.2
3.1
Male
315.6
93.4
39.8
36.8
13.917.1
11.8
9.0
28.8
62.8
2.1
Female
301.9
57.7
3.5
38.2
10.113.1
11.2
17.5
27.2
122.4
1.0
Person
693.3
161.4
72.9
104.9
24.346.4
31.4
42.7
77.1
127.5
4.8
Male
409.9
107.0
67.2
59.6
13.134.4
20.2
20.2
44.6
40.1
3.6
Female
283.4
54.4
5.7
45.3
11.212.0
11.2
22.5
32.5
87.5
1.2
Person
542.2
107.4
46.2
97.4
34.956.3
14.6
27.3
60.6
92.0
5.6
Male
332.7
68.5
41.4
59.2
16.447.0
8.7
13.3
37.4
36.2
4.5
Female
209.5
39.0
4.8
38.2
18.59.3
5.9
13.9
23.2
55.8
1.1
Person
377.9
57.4
20.9
68.1
37.452.1
5.1
14.3
50.9
65.5
6.2
Male
247.6
37.1
18.9
45.8
17.446.6
3.7
8.8
33.5
30.6
5.1
Female
130.3
20.3
2.1
22.3
20.05.5
1.4
5.5
17.3
34.9
1.1
Note: 1 Figures may not add up due to rounding. 2 Industries are classified according to the Singapore Standard Industrial Classification SSIC 2005.
Source: Singapore Department of Statistics
1 Includes Agriculture, Fishing, Mining & Quarrying, Utilities and Activities Not Adequately Defined.
Thousand
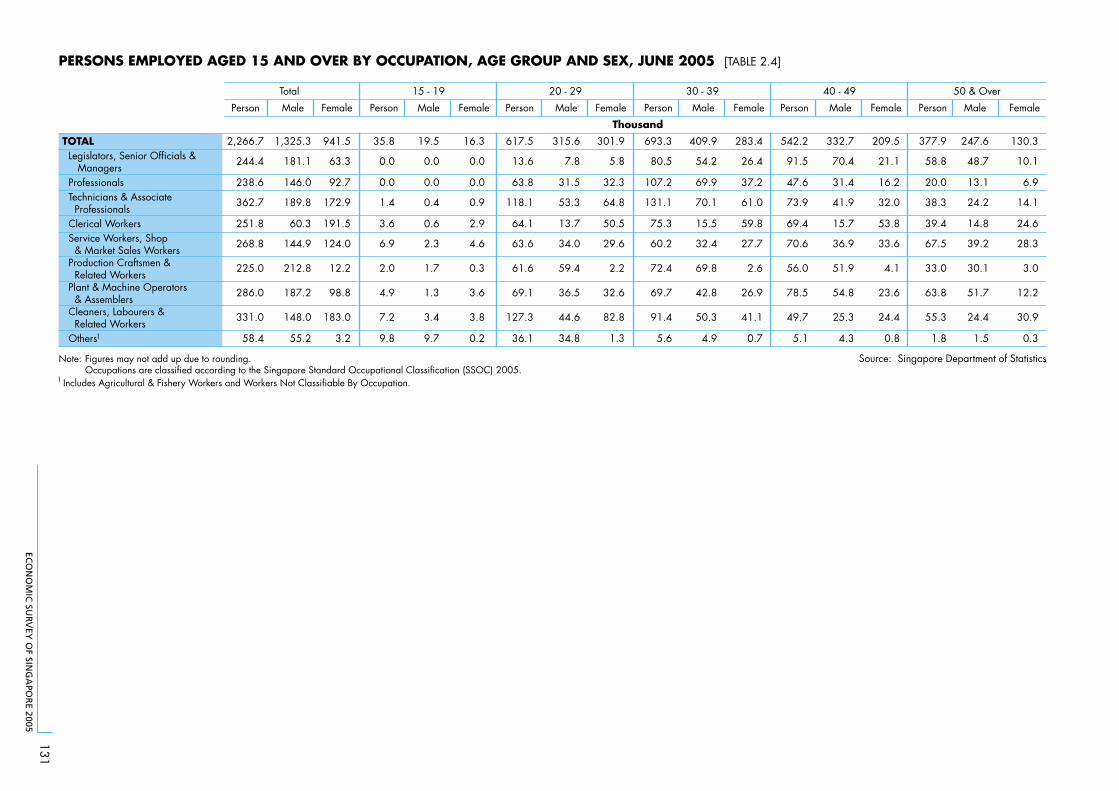
ECO
NO
MIC
SUR
VEY
OF SIN
GA
POR
E 2005
131
PERSONS EMPLOYED AGED 15 AND OVER BY OCCUPATION, AGE GROUP AND SEX, JUNE 2005 [TABLE 2.4]
Total 15 - 19 20 - 29 30 - 39 40 - 49 50 & Over
TOTAL Legislators, Senior Officials & Managers Professionals Technicians & Associate Professionals Clerical Workers Service Workers, Shop & Market Sales Workers Production Craftsmen & Related Workers Plant & Machine Operators & Assemblers Cleaners, Labourers & Related Workers Others1
Person
2,266.7
244.4
238.6
362.7
251.8
268.8
225.0
286.0
331.0
58.4
Male
1,325.3
181.1
146.0
189.8
60.3
144.9
212.8
187.2
148.0
55.2
Female
941.5
63.3
92.7
172.9
191.5
124.0
12.2
98.8
183.0
3.2
Person
35.8
0.0
0.0
1.4
3.6
6.9
2.0
4.9
7.2
9.8
Male
19.5
0.0
0.0
0.4
0.6
2.3
1.7
1.3
3.4
9.7
Female
16.3
0.0
0.0
0.9
2.9
4.6
0.3
3.6
3.8
0.2
Person
617.5
13.6
63.8
118.1
64.1
63.6
61.6
69.1
127.3
36.1
Male
315.6
7.8
31.5
53.3
13.7
34.0
59.4
36.5
44.6
34.8
Female
301.9
5.8
32.3
64.8
50.5
29.6
2.2
32.6
82.8
1.3
Person
693.3
80.5
107.2
131.1
75.3
60.2
72.4
69.7
91.4
5.6
Male
409.9
54.2
69.9
70.1
15.5
32.4
69.8
42.8
50.3
4.9
Female
283.4
26.4
37.2
61.0
59.8
27.7
2.6
26.9
41.1
0.7
Person
542.2
91.5
47.6
73.9
69.4
70.6
56.0
78.5
49.7
5.1
Male
332.7
70.4
31.4
41.9
15.7
36.9
51.9
54.8
25.3
4.3
Female
209.5
21.1
16.2
32.0
53.8
33.6
4.1
23.6
24.4
0.8
Person
377.9
58.8
20.0
38.3
39.4
67.5
33.0
63.8
55.3
1.8
Male
247.6
48.7
13.1
24.2
14.8
39.2
30.1
51.7
24.4
1.5
Female
130.3
10.1
6.9
14.1
24.6
28.3
3.0
12.2
30.9
0.3
Note: Figures may not add up due to rounding.Occupations are classified according to the Singapore Standard Occupational Classification (SSOC) 2005.
Source: Singapore Department of Statistics
1 Includes Agricultural & Fishery Workers and Workers Not Classifiable By Occupation.
Thousand
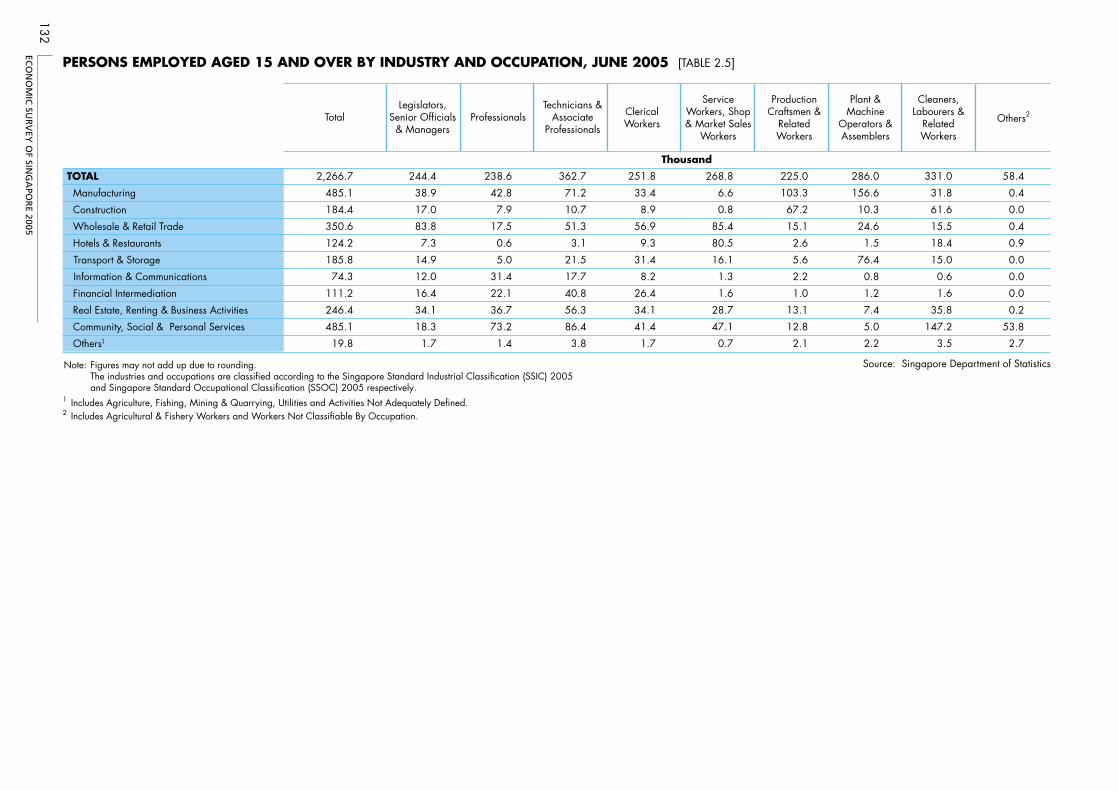
ECO
NO
MIC
SUR
VEY
OF SIN
GA
POR
E 2005
132
PERSONS EMPLOYED AGED 15 AND OVER BY INDUSTRY AND OCCUPATION, JUNE 2005 [TABLE 2.5]
TOTAL
Manufacturing
Construction
Wholesale & Retail Trade
Hotels & Restaurants
Transport & Storage
Information & Communications
Financial Intermediation
Real Estate, Renting & Business Activities
Community, Social & Personal Services
Others1
Total
2,266.7
485.1
184.4
350.6
124.2
185.8
74.3
111.2
246.4
485.1
19.8
Legislators,Senior Officials
& Managers
244.4
38.9
17.0
83.8
7.3
14.9
12.0
16.4
34.1
18.3
1.7
Professionals
238.6
42.8
7.9
17.5
0.6
5.0
31.4
22.1
36.7
73.2
1.4
362.7
71.2
Technicians &Associate
Professionals
10.7
51.3
3.1
21.5
17.7
40.8
56.3
86.4
3.8
ClericalWorkers
251.8
33.4
8.9
56.9
9.3
31.4
8.2
26.4
34.1
41.4
1.7
ServiceWorkers, Shop& Market Sales
Workers
268.8
6.6
0.8
85.4
80.5
16.1
1.3
1.6
28.7
47.1
0.7
ProductionCraftsmen &
RelatedWorkers
225.0
103.3
67.2
15.1
2.6
5.6
2.2
1.0
13.1
12.8
2.1
Plant &Machine
Operators &Assemblers
286.0
156.6
10.3
24.6
1.5
76.4
0.8
1.2
7.4
5.0
2.2
Cleaners,Labourers &
RelatedWorkers
331.0
31.8
61.6
15.5
18.4
15.0
0.6
1.6
35.8
147.2
3.5
Others2
58.4
0.4
0.0
0.4
0.9
0.0
0.0
0.0
0.2
53.8
2.7
Source: Singapore Department of Statistics
1 Includes Agriculture, Fishing, Mining & Quarrying, Utilities and Activities Not Adequately Defined.2 Includes Agricultural & Fishery Workers and Workers Not Classifiable By Occupation.
Note: Figures may not add up due to rounding. The industries and occupations are classified according to the Singapore Standard Industrial Classification (SSIC) 2005
and Singapore Standard Occupational Classification (SSOC) 2005 respectively.
Thousand
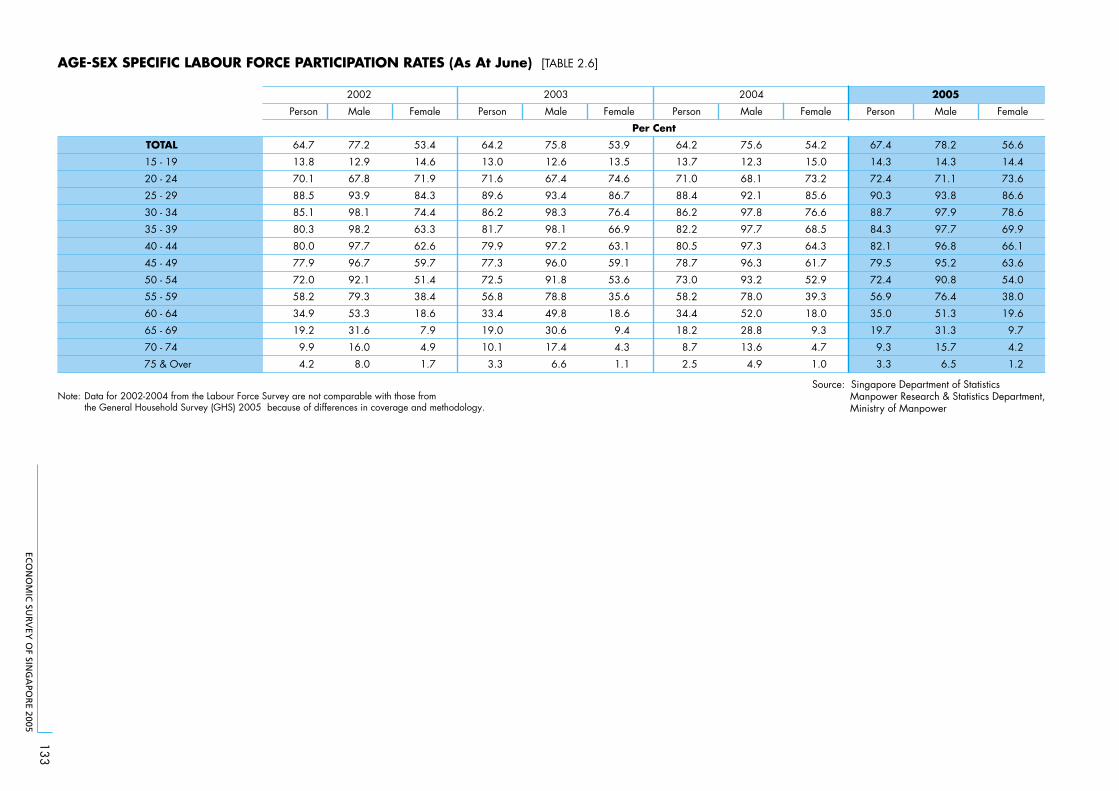
ECO
NO
MIC
SUR
VEY
OF SIN
GA
POR
E 2005
133
AGE-SEX SPECIFIC LABOUR FORCE PARTICIPATION RATES (As At June) [TABLE 2.6]
2002 2004 2005
TOTAL
15 - 19
20 - 24
25 - 29
30 - 34
35 - 39
40 - 44
45 - 49
50 - 54
55 - 59
60 - 64
65 - 69
70 - 74
75 & Over
Person
64.7
13.8
70.1
88.5
85.1
80.3
80.0
77.9
72.0
58.2
34.9
19.2
9.9
4.2
Male
77.2
12.9
67.8
93.9
98.1
98.2
97.7
96.7
92.1
79.3
53.3
31.6
16.0
8.0
Female
53.4
14.6
71.9
84.3
74.4
63.3
62.6
59.7
51.4
38.4
18.6
7.9
4.9
1.7
Person
64.2
13.0
71.6
89.6
86.2
81.7
79.9
77.3
72.5
56.8
33.4
19.0
10.1
3.3
2003
Male
75.8
12.6
67.4
93.4
98.3
98.1
97.2
96.0
91.8
78.8
49.8
30.6
17.4
6.6
Female
53.9
13.5
74.6
86.7
76.4
66.9
63.1
59.1
53.6
35.6
18.6
9.4
4.3
1.1
Person
64.2
13.7
71.0
88.4
86.2
82.2
80.5
78.7
73.0
58.2
34.4
18.2
8.7
2.5
Male
75.6
12.3
68.1
92.1
97.8
97.7
97.3
96.3
93.2
78.0
52.0
28.8
13.6
4.9
Female
54.2
15.0
73.2
85.6
76.6
68.5
64.3
61.7
52.9
39.3
18.0
9.3
4.7
1.0
Person
67.4
14.3
72.4
90.3
88.7
84.3
82.1
79.5
72.4
56.9
35.0
19.7
9.3
3.3
Male
78.2
14.3
71.1
93.8
97.9
97.7
96.8
95.2
90.8
76.4
51.3
31.3
15.7
6.5
Female
56.6
14.4
73.6
86.6
78.6
69.9
66.1
63.6
54.0
38.0
19.6
9.7
4.2
1.2
Source: Singapore Department of StatisticsManpower Research & Statistics Department, Ministry of Manpower
Per Cent
Note: Data for 2002-2004 from the Labour Force Survey are not comparable with those from the General Household Survey (GHS) 2005 because of differences in coverage and methodology.
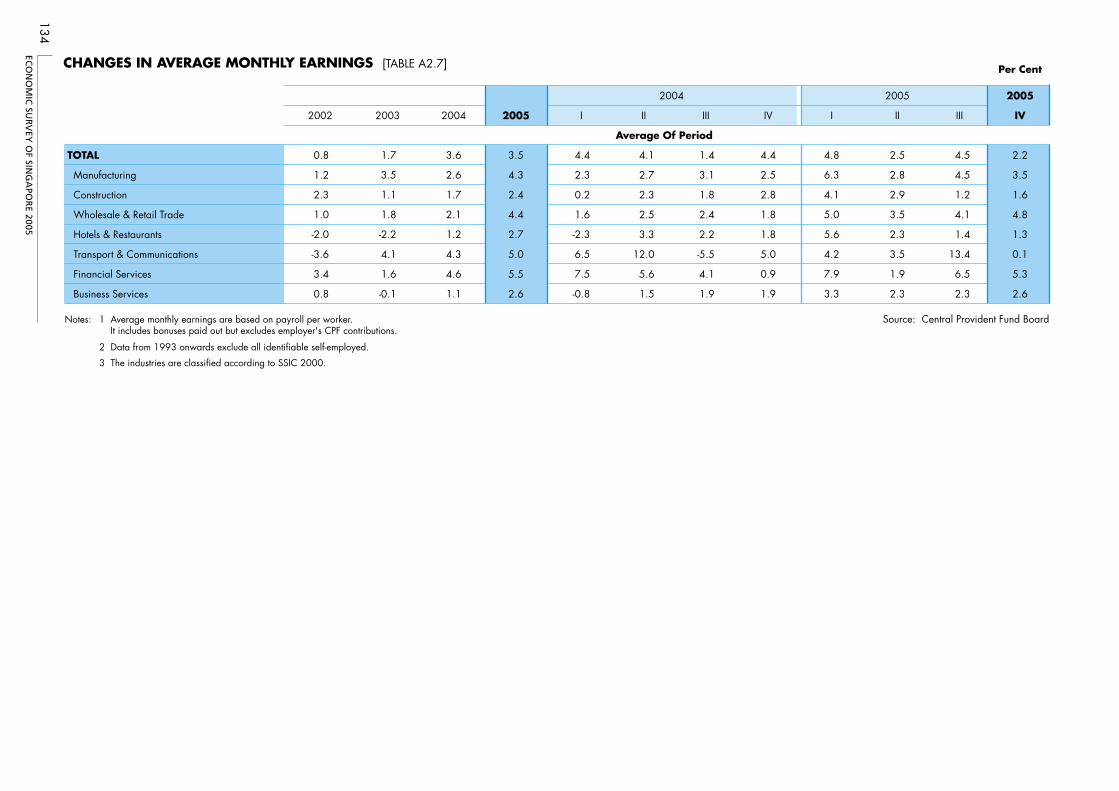
ECO
NO
MIC
SUR
VEY
OF SIN
GA
POR
E 2005
134
CHANGES IN AVERAGE MONTHLY EARNINGS [TABLE A2.7] Per Cent
2005
2002 2003 2004 2005 I II III IV I II III IV
TOTAL 0.8 1.7 3.6 3.5 4.4 4.1 1.4 4.4 4.8 2.5 4.5 2.2
Manufacturing 1.2 3.5 2.6 4.3 2.3 2.7 3.1 2.5 6.3 2.8 4.5 3.5
Construction 2.3 1.1 1.7 2.4 0.2 2.3 1.8 2.8 4.1 2.9 1.2 1.6
Wholesale & Retail Trade 1.0 1.8 2.1 4.4 1.6 2.5 2.4 1.8 5.0 3.5 4.1 4.8
Hotels & Restaurants -2.0 -2.2 1.2 2.7 -2.3 3.3 2.2 1.8 5.6 2.3 1.4 1.3
Transport & Communications -3.6 4.1 4.3 5.0 6.5 12.0 -5.5 5.0 4.2 3.5 13.4 0.1
Financial Services 3.4 1.6 4.6 5.5 7.5 5.6 4.1 0.9 7.9 1.9 6.5 5.3
Business Services 0.8 -0.1 1.1 2.6 -0.8 1.5 1.9 1.9 3.3 2.3 2.3 2.6
Notes: 1 Average monthly earnings are based on payroll per worker. It includes bonuses paid out but excludes employer's CPF contributions.
Source: Central Provident Fund Board
2 Data from 1993 onwards exclude all identifiable self-employed.
3 The industries are classified according to SSIC 2000.
Average Of Period
2004 2005
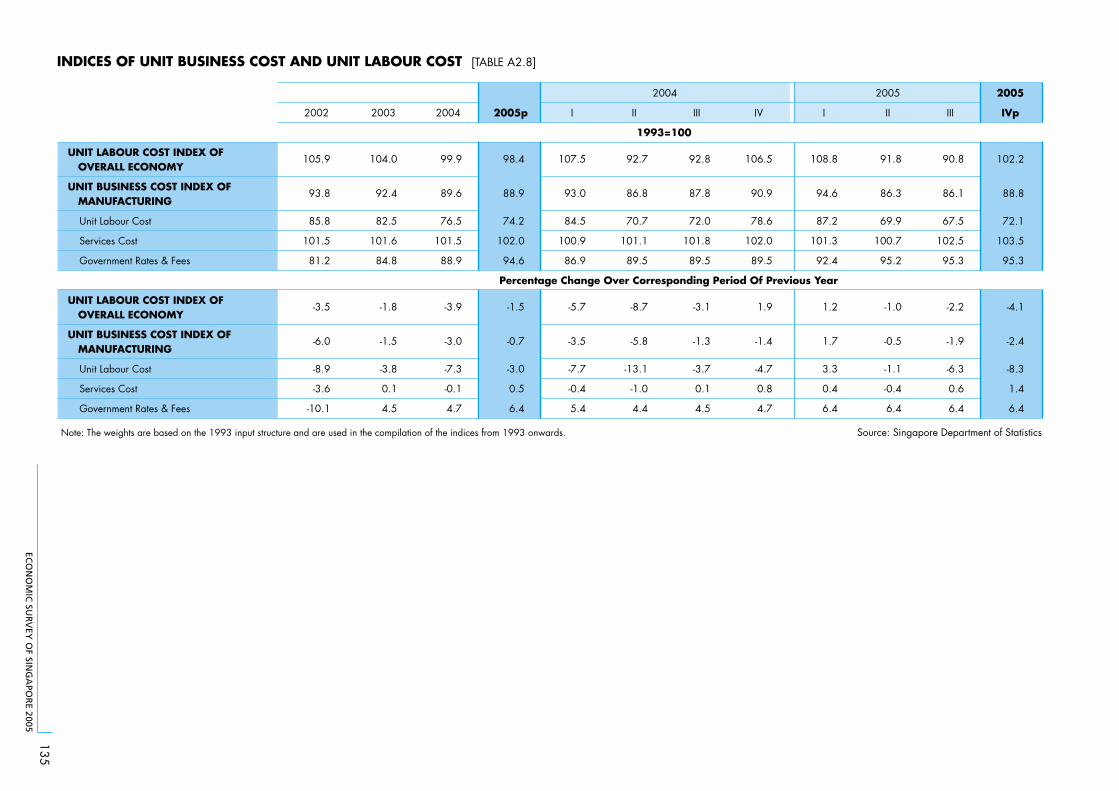
ECO
NO
MIC
SUR
VEY
OF SIN
GA
POR
E 2005
135
INDICES OF UNIT BUSINESS COST AND UNIT LABOUR COST [TABLE A2.8]
2005
2002 2003 2004 2005p I II III IV I II III IVp
UNIT LABOUR COST INDEX OF OVERALL ECONOMY
105.9 104.0 99.9 98.4 107.5 92.7 92.8 106.5 108.8 91.8 90.8 102.2
UNIT BUSINESS COST INDEX OF MANUFACTURING
93.8 92.4 89.6 88.9 93.0 86.8 87.8 90.9 94.6 86.3 86.1 88.8
Unit Labour Cost 85.8 82.5 76.5 74.2 84.5 70.7 72.0 78.6 87.2 69.9 67.5 72.1
Services Cost 101.5 101.6 101.5 102.0 100.9 101.1 101.8 102.0 101.3 100.7 102.5 103.5
Government Rates & Fees 81.2 84.8 88.9 94.6 86.9 89.5 89.5 89.5 92.4 95.2 95.3 95.3
UNIT LABOUR COST INDEX OF OVERALL ECONOMY
-3.5 -1.8 -3.9 -1.5 -5.7 -8.7 -3.1 1.9 1.2 -1.0 -2.2 -4.1
UNIT BUSINESS COST INDEX OF MANUFACTURING
-6.0 -1.5 -3.0 -0.7 -3.5 -5.8 -1.3 -1.4 1.7 -0.5 -1.9 -2.4
Unit Labour Cost -8.9 -3.8 -7.3 -3.0 -7.7 -13.1 -3.7 -4.7 3.3 -1.1 -6.3 -8.3
Services Cost -3.6 0.1 -0.1 0.5 -0.4 -1.0 0.1 0.8 0.4 -0.4 0.6 1.4
Government Rates & Fees -10.1 4.5 4.7 6.4 5.4 4.4 4.5 4.7 6.4 6.4 6.4 6.4
Note: The weights are based on the 1993 input structure and are used in the compilation of the indices from 1993 onwards. Source: Singapore Department of Statistics
2004
1993=100
Percentage Change Over Corresponding Period Of Previous Year
2005
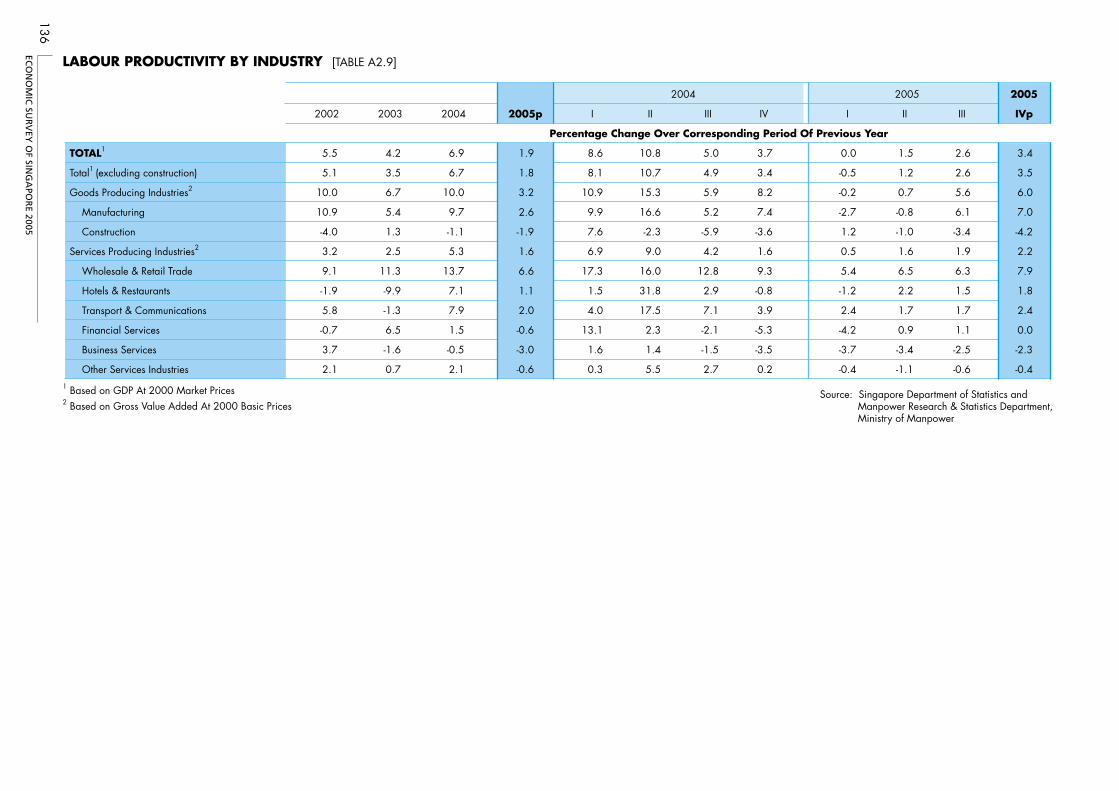
ECO
NO
MIC
SUR
VEY
OF SIN
GA
POR
E 2005
136
TOTAL1
Total1 (excluding construction)
Goods Producing Industries2
Manufacturing
Construction
Services Producing Industries2
Wholesale & Retail Trade
Hotels & Restaurants
Transport & Communications
Financial Services
Business Services
Other Services Industries
2002
5.5
5.1
10.0
10.9
-4.0
3.2
9.1
-1.9
5.8
-0.7
3.7
2.1
2003
4.2
3.5
6.7
5.4
1.3
2.5
11.3
-9.9
-1.3
6.5
-1.6
0.7
-1.1
-0.5
2004
6.9
6.7
10.0
9.7
5.3
13.7
7.1
7.9
1.5
2.1
2005p
1.9
1.8
3.2
2.6
-1.9
1.6
6.6
1.1
2.0
-0.6
-3.0
-0.6
I
8.6
8.1
10.9
9.9
7.6
6.9
17.3
1.5
4.0
13.1
1.6
0.3
II
10.8
10.7
15.3
16.6
-2.3
9.0
16.0
31.8
17.5
2.3
1.4
5.5
III
5.0
4.9
5.9
5.2
-5.9
4.2
12.8
2.9
7.1
-2.1
-1.5
2.7
IV
3.7
3.4
8.2
7.4
-3.6
1.6
9.3
-0.8
3.9
-5.3
-3.5
0.2
I
0.0
-0.5
-0.2
-2.7
1.2
0.5
5.4
-1.2
2.4
-4.2
-3.7
-0.4
II
1.5
1.2
0.7
-0.8
-1.0
1.6
6.5
2.2
1.7
0.9
-3.4
-1.1
III
2.6
2.6
5.6
6.1
-3.4
1.9
6.3
1.5
1.7
1.1
-2.5
-0.6
2005
IVp
3.4
3.5
6.0
7.0
-4.2
2.2
7.9
1.8
2.4
0.0
-2.3
-0.41 Based on GDP At 2000 Market Prices Source: Singapore Department of Statistics and
Manpower Research & Statistics Department, Ministry of Manpower
2 Based on Gross Value Added At 2000 Basic Prices
Percentage Change Over Corresponding Period Of Previous Year
LABOUR PRODUCTIVITY BY INDUSTRY [TABLE A2.9]
2004 2005
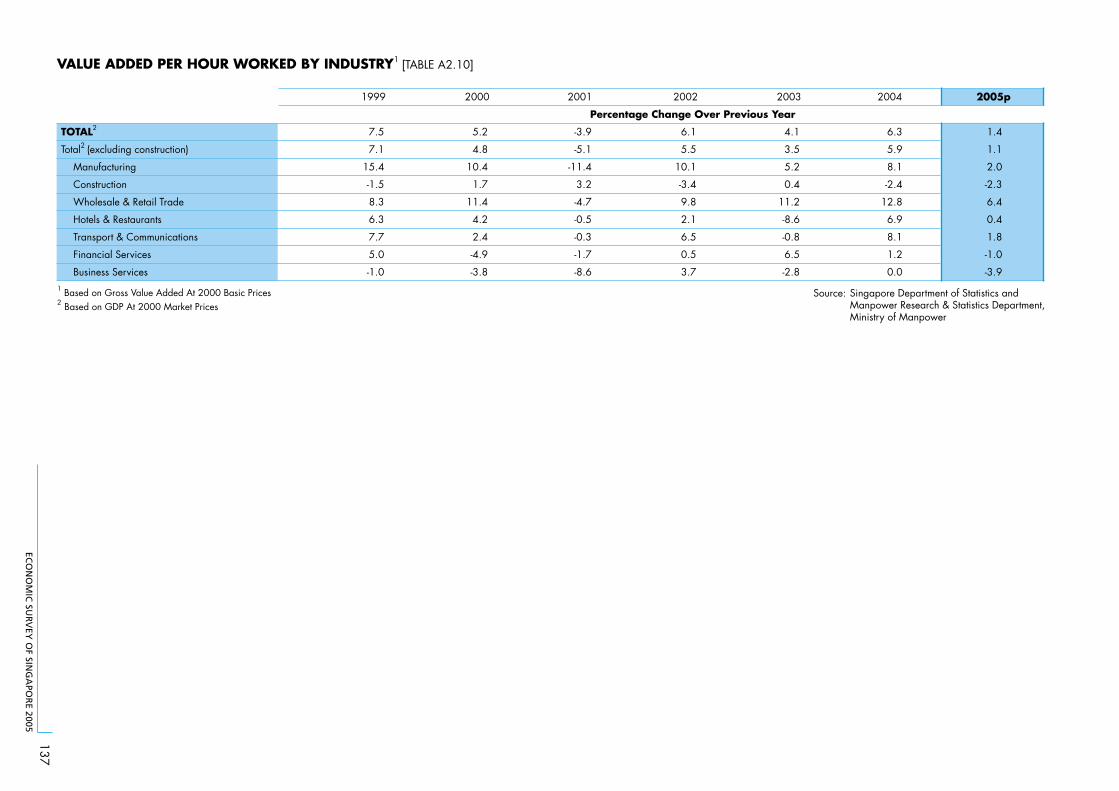
ECO
NO
MIC
SUR
VEY
OF SIN
GA
POR
E 2005
137
TOTAL2
Total2 (excluding construction)
Manufacturing
Construction
Wholesale & Retail Trade
Hotels & Restaurants
Transport & Communications
Financial Services
Business Services
1999
7.5
7.1
15.4
-1.5
8.3
6.3
7.7
5.0
-1.0
2000
5.2
4.8
10.4
1.7
11.4
4.2
2.4
-4.9
-3.8
2001
-3.9
-5.1
-11.4
3.2
-4.7
-0.5
-0.3
-1.7
-8.6
2002
6.1
5.5
10.1
-3.4
9.8
2.1
6.5
0.5
3.7
2003
4.1
3.5
5.2
0.4
11.2
-8.6
-0.8
6.5
-2.8
2004
6.3
5.9
8.1
-2.4
12.8
6.9
8.1
1.2
0.0
2005p
1.4
1.1
2.0
-2.3
6.4
0.4
1.8
-1.0
-3.91 Based on Gross Value Added At 2000 Basic Prices Source: Singapore Department of Statistics and
Manpower Research & Statistics Department,Ministry of Manpower
2 Based on GDP At 2000 Market Prices
VALUE ADDED PER HOUR WORKED BY INDUSTRY1 [TABLE A2.10]
Percentage Change Over Previous Year
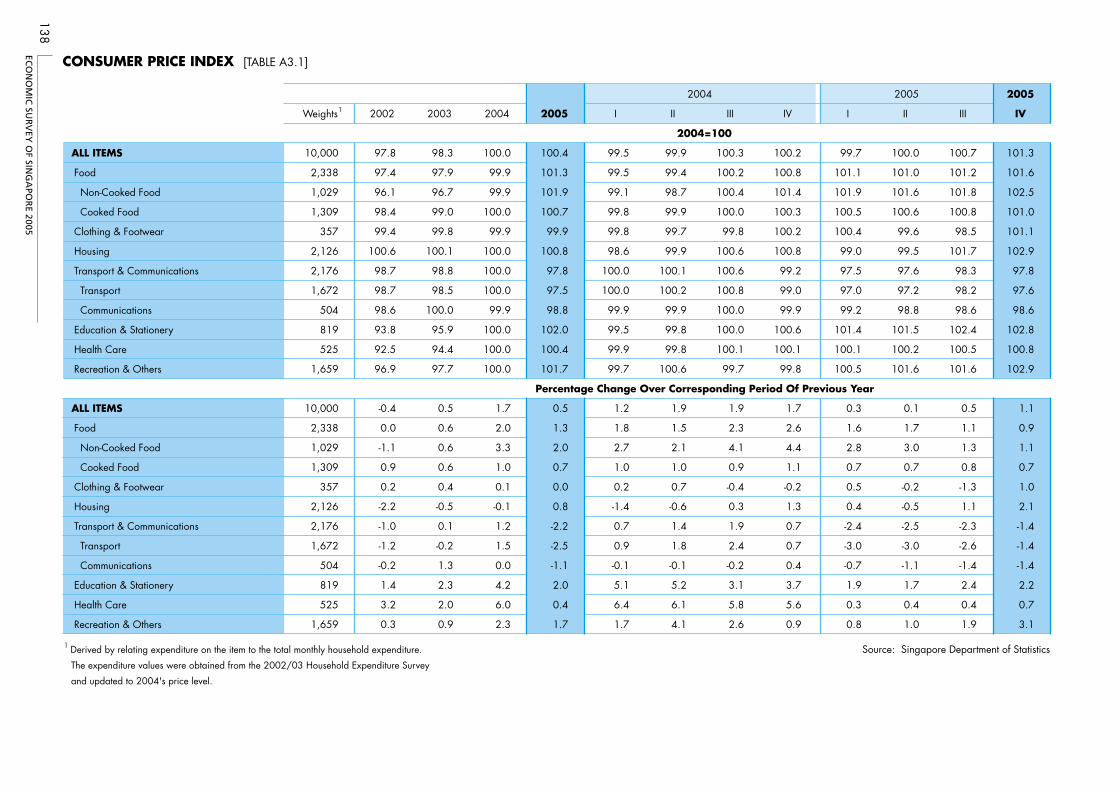
ECO
NO
MIC
SUR
VEY
OF SIN
GA
POR
E 2005
138
CONSUMER PRICE INDEX [TABLE A3.1]
ALL ITEMS
Food
Non-Cooked Food
Cooked Food
Clothing & Footwear
Housing
Transport & Communications
Transport
Communications
Education & Stationery
Health Care
Recreation & Others
ALL ITEMS
Food
Non-Cooked Food
Cooked Food
Clothing & Footwear
Housing
Transport & Communications
Transport
Communications
Education & Stationery
Health Care
Recreation & Others
1Weights
10,000
2,338
1,029
1,309
357
2,126
2,176
1,672
504
819
525
1,659
10,000
2,338
1,029
1,309
357
2,126
2,176
1,672
504
819
525
1,659
2002
97.8
97.4
96.1
98.4
99.4
100.6
98.7
98.7
98.6
93.8
92.5
96.9
-0.4
0.0
-1.1
0.9
0.2
-2.2
-1.0
-1.2
-0.2
1.4
3.2
0.3
2003
98.3
97.9
96.7
99.0
99.8
100.1
98.8
98.5
100.0
95.9
94.4
97.7
0.5
0.6
0.6
0.6
0.4
-0.5
0.1
-0.2
1.3
2.3
2.0
0.9
2004
100.0
99.9
99.9
100.0
99.9
100.0
100.0
100.0
99.9
100.0
100.0
100.0
1.7
2.0
3.3
1.0
0.1
-0.1
1.2
1.5
0.0
4.2
6.0
2.3
2005
100.4
101.3
101.9
100.7
99.9
100.8
97.8
97.5
98.8
102.0
100.4
101.7
0.5
1.3
2.0
0.7
0.0
0.8
-2.2
-2.5
-1.1
2.0
0.4
1.7
I
99.5
99.5
99.1
99.8
99.8
98.6
100.0
100.0
99.9
99.5
99.9
99.7
1.2
1.8
2.7
1.0
0.2
-1.4
0.7
0.9
-0.1
5.1
6.4
1.7
II
99.9
99.4
98.7
99.9
99.7
99.9
100.1
100.2
99.9
99.8
99.8
100.6
1.9
1.5
2.1
1.0
0.7
-0.6
1.4
1.8
-0.1
5.2
6.1
4.1
III
100.3
100.2
100.4
100.0
99.8
100.6
100.6
100.8
100.0
100.0
100.1
99.7
1.9
2.3
4.1
0.9
-0.4
0.3
1.9
2.4
-0.2
3.1
5.8
2.6
IV
100.2
100.8
101.4
100.3
100.2
100.8
99.2
99.0
99.9
100.6
100.1
99.8
1.7
2.6
4.4
1.1
-0.2
1.3
0.7
0.7
0.4
3.7
5.6
0.9
I
99.7
101.1
101.9
100.5
100.4
99.0
97.5
97.0
99.2
101.4
100.1
100.5
0.3
1.6
2.8
0.7
0.5
0.4
-2.4
-3.0
-0.7
1.9
0.3
0.8
II
100.0
101.0
101.6
100.6
99.6
99.5
97.6
97.2
98.8
101.5
100.2
101.6
0.1
1.7
3.0
0.7
-0.2
-0.5
-2.5
-3.0
-1.1
1.7
0.4
1.0
III
100.7
101.2
101.8
100.8
98.5
101.7
98.3
98.2
98.6
102.4
100.5
101.6
0.5
1.1
1.3
0.8
-1.3
1.1
-2.3
-2.6
-1.4
2.4
0.4
1.9
2005
IV
101.3
101.6
102.5
101.0
101.1
102.9
97.8
97.6
98.6
102.8
100.8
102.9
1.1
0.9
1.1
0.7
1.0
2.1
-1.4
-1.4
-1.4
2.2
0.7
3.1
1 Derived by relating expenditure on the item to the total monthly household expenditure. Source: Singapore Department of Statistics The expenditure values were obtained from the 2002/03 Household Expenditure Survey
and updated to 2004's price level.
Percentage Change Over Corresponding Period Of Previous Year
2004
2004=100
2005
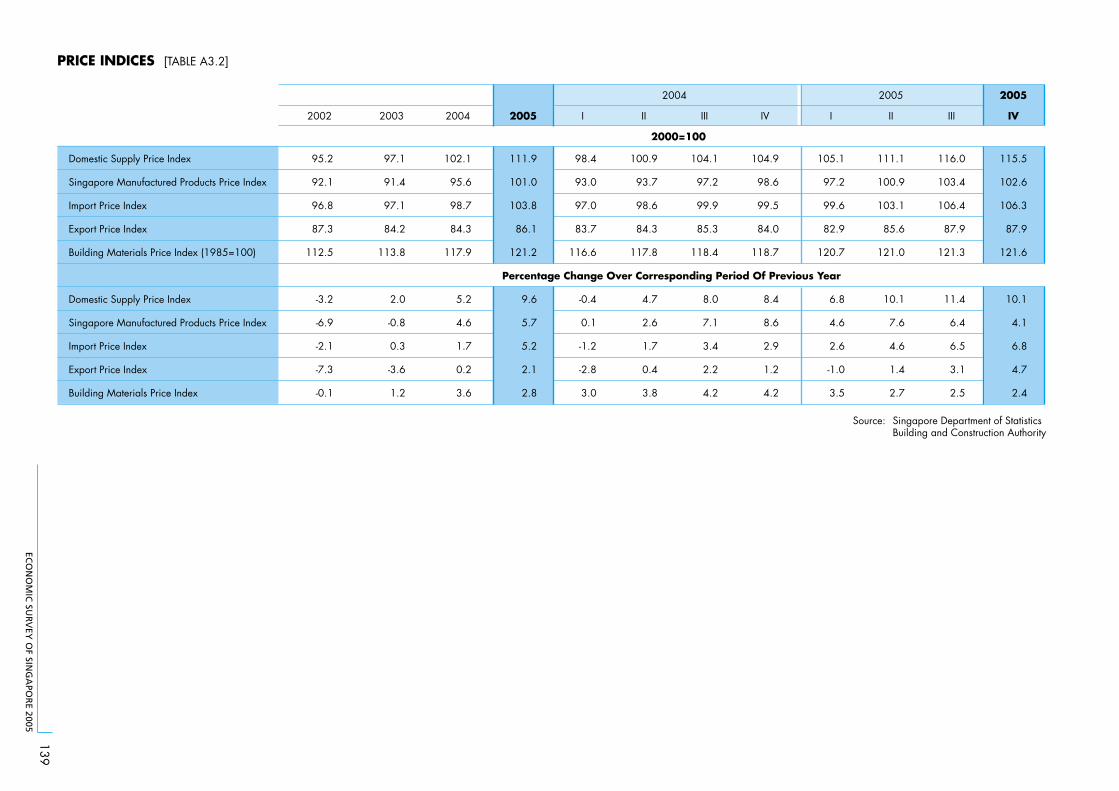
ECO
NO
MIC
SUR
VEY
OF SIN
GA
POR
E 2005
139
PRICE INDICES [TABLE A3.2]
2005
2002 2003 2004 2005 I II III IV I II III IV
Domestic Supply Price Index 95.2 97.1 102.1 111.9 98.4 100.9 104.1 104.9 105.1 111.1 116.0 115.5
Singapore Manufactured Products Price Index 92.1 91.4 95.6 101.0 93.0 93.7 97.2 98.6 97.2 100.9 103.4 102.6
Import Price Index 96.8 97.1 98.7 103.8 97.0 98.6 99.9 99.5 99.6 103.1 106.4 106.3
Export Price Index 87.3 84.2 84.3 86.1 83.7 84.3 85.3 84.0 82.9 85.6 87.9 87.9
Building Materials Price Index (1985=100) 112.5 113.8 117.9 121.2 116.6 117.8 118.4 118.7 120.7 121.0 121.3 121.6
Domestic Supply Price Index -3.2 2.0 5.2 9.6 -0.4 4.7 8.0 8.4 6.8 10.1 11.4 10.1
Singapore Manufactured Products Price Index -6.9 -0.8 4.6 5.7 0.1 2.6 7.1 8.6 4.6 7.6 6.4 4.1
Import Price Index -2.1 0.3 1.7 5.2 -1.2 1.7 3.4 2.9 2.6 4.6 6.5 6.8
Export Price Index -7.3 -3.6 0.2 2.1 -2.8 0.4 2.2 1.2 -1.0 1.4 3.1 4.7
Building Materials Price Index -0.1 1.2 3.6 2.8 3.0 3.8 4.2 4.2 3.5 2.7 2.5 2.4
Source: Singapore Department of StatisticsBuilding and Construction Authority
2005
2000=100
Percentage Change Over Corresponding Period Of Previous Year
2004
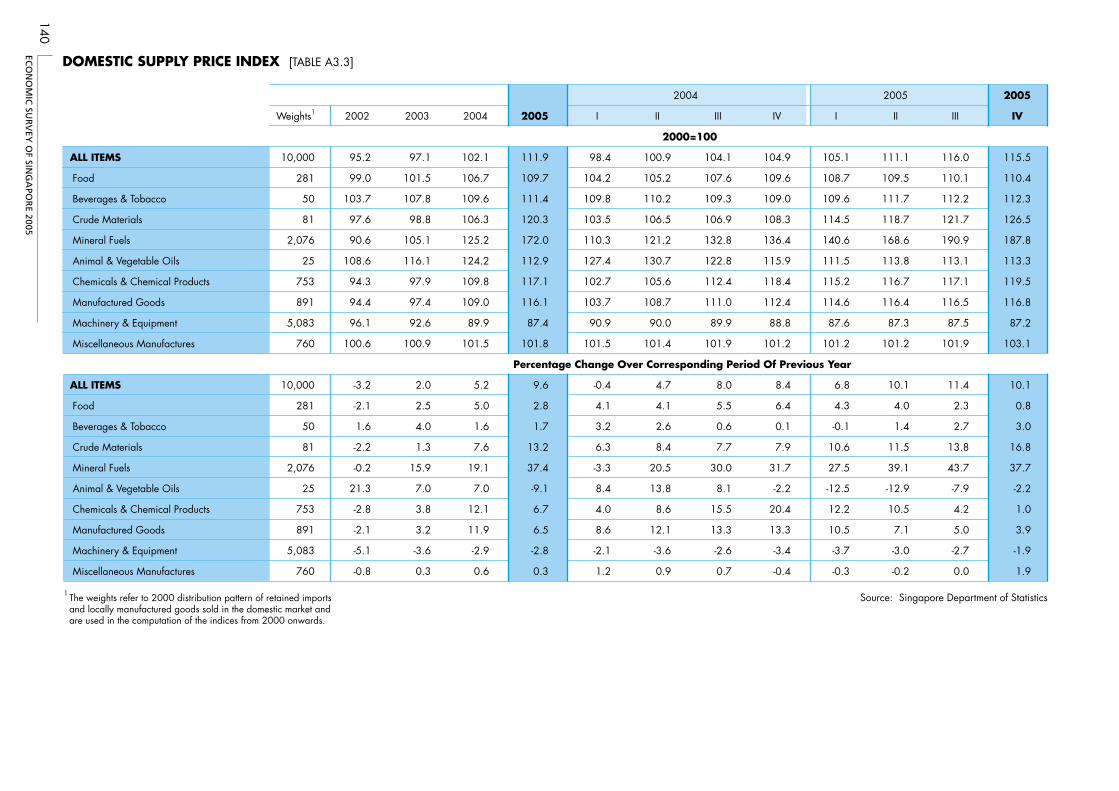
ECO
NO
MIC
SUR
VEY
OF SIN
GA
POR
E 2005
140
DOMESTIC SUPPLY PRICE INDEX [TABLE A3.3]
2005
Weights1 2002 2003 2004 2005 I II III IV I II III IV
ALL ITEMS 10,000 95.2 97.1 102.1 111.9 98.4 100.9 104.1 104.9 105.1 111.1 116.0 115.5
Food 281 99.0 101.5 106.7 109.7 104.2 105.2 107.6 109.6 108.7 109.5 110.1 110.4
Beverages & Tobacco 50 103.7 107.8 109.6 111.4 109.8 110.2 109.3 109.0 109.6 111.7 112.2 112.3
Crude Materials 81 97.6 98.8 106.3 120.3 103.5 106.5 106.9 108.3 114.5 118.7 121.7 126.5
Mineral Fuels 2,076 90.6 105.1 125.2 172.0 110.3 121.2 132.8 136.4 140.6 168.6 190.9 187.8
Animal & Vegetable Oils 25 108.6 116.1 124.2 112.9 127.4 130.7 122.8 115.9 111.5 113.8 113.1 113.3
Chemicals & Chemical Products 753 94.3 97.9 109.8 117.1 102.7 105.6 112.4 118.4 115.2 116.7 117.1 119.5
Manufactured Goods 891 94.4 97.4 109.0 116.1 103.7 108.7 111.0 112.4 114.6 116.4 116.5 116.8
Machinery & Equipment 5,083 96.1 92.6 89.9 87.4 90.9 90.0 89.9 88.8 87.6 87.3 87.5 87.2
Miscellaneous Manufactures 760 100.6 100.9 101.5 101.8 101.5 101.4 101.9 101.2 101.2 101.2 101.9 103.1
ALL ITEMS 10,000 -3.2 2.0 5.2 9.6 -0.4 4.7 8.0 8.4 6.8 10.1 11.4 10.1
Food 281 -2.1 2.5 5.0 2.8 4.1 4.1 5.5 6.4 4.3 4.0 2.3 0.8
Beverages & Tobacco 50 1.6 4.0 1.6 1.7 3.2 2.6 0.6 0.1 -0.1 1.4 2.7 3.0
Crude Materials 81 -2.2 1.3 7.6 13.2 6.3 8.4 7.7 7.9 10.6 11.5 13.8 16.8
Mineral Fuels 2,076 -0.2 15.9 19.1 37.4 -3.3 20.5 30.0 31.7 27.5 39.1 43.7 37.7
Animal & Vegetable Oils 25 21.3 7.0 7.0 -9.1 8.4 13.8 8.1 -2.2 -12.5 -12.9 -7.9 -2.2
Chemicals & Chemical Products 753 -2.8 3.8 12.1 6.7 4.0 8.6 15.5 20.4 12.2 10.5 4.2 1.0
Manufactured Goods 891 -2.1 3.2 11.9 6.5 8.6 12.1 13.3 13.3 10.5 7.1 5.0 3.9
Machinery & Equipment 5,083 -5.1 -3.6 -2.9 -2.8 -2.1 -3.6 -2.6 -3.4 -3.7 -3.0 -2.7 -1.9
Miscellaneous Manufactures 760 -0.8 0.3 0.6 0.3 1.2 0.9 0.7 -0.4 -0.3 -0.2 0.0 1.9
1 The weights refer to 2000 distribution pattern of retained importsand locally manufactured goods sold in the domestic market andare used in the computation of the indices from 2000 onwards.
Source: Singapore Department of Statistics
2004 2005
2000=100
Percentage Change Over Corresponding Period Of Previous Year
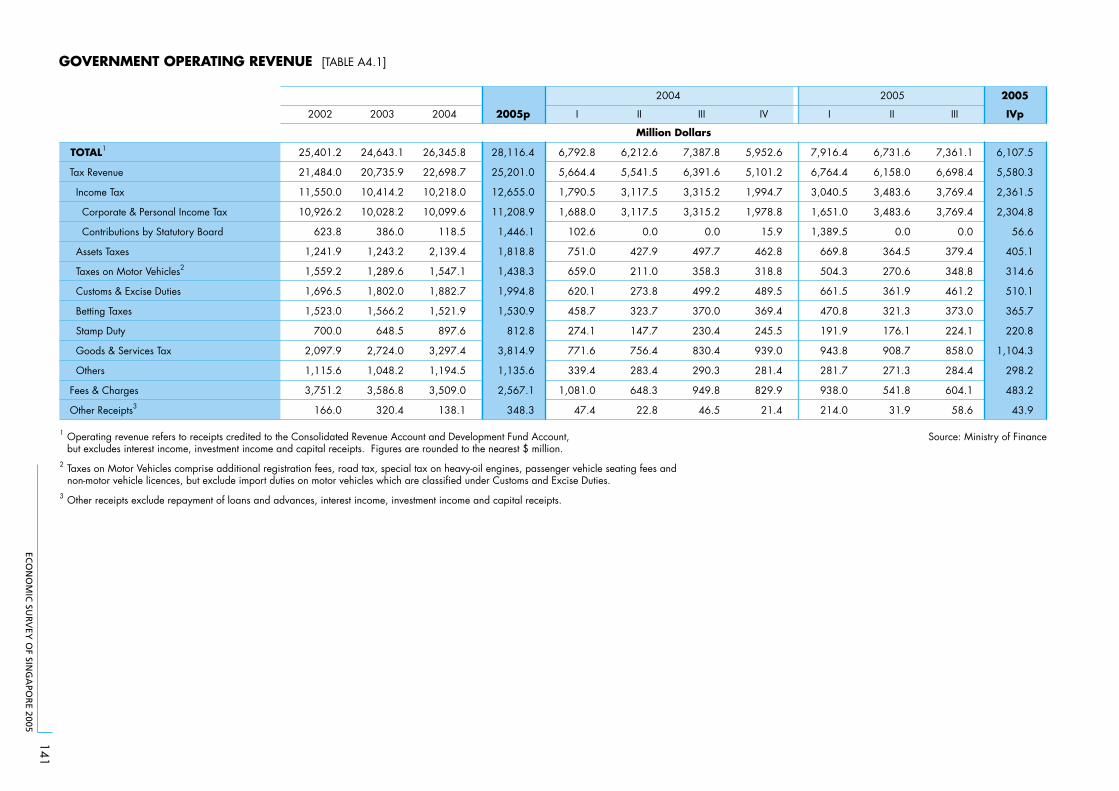
ECO
NO
MIC
SUR
VEY
OF SIN
GA
POR
E 2005
141
GOVERNMENT OPERATING REVENUE [TABLE A4.1]
TOTAL1
Tax Revenue
Income Tax
Corporate & Personal Income Tax
Contributions by Statutory Board
Assets Taxes
Taxes on Motor Vehicles2
Customs & Excise Duties
Betting Taxes
Stamp Duty
Goods & Services Tax
Others
Fees & Charges
Other Receipts3
2002
25,401.2
21,484.0
11,550.0
10,926.2
623.8
1,241.9
1,559.2
1,696.5
1,523.0
700.0
2,097.9
1,115.6
3,751.2
166.0
2003
24,643.1
20,735.9
10,414.2
10,028.2
386.0
1,243.2
1,289.6
1,802.0
1,566.2
648.5
2,724.0
1,048.2
3,586.8
320.4
2004
26,345.8
22,698.7
10,218.0
10,099.6
118.5
2,139.4
1,547.1
1,882.7
1,521.9
897.6
3,297.4
1,194.5
3,509.0
138.1
2005p
28,116.4
25,201.0
12,655.0
11,208.9
1,446.1
1,818.8
1,438.3
1,994.8
1,530.9
812.8
3,814.9
1,135.6
2,567.1
348.3
I
6,792.8
5,664.4
1,790.5
1,688.0
102.6
751.0
659.0
620.1
458.7
274.1
771.6
339.4
1,081.0
47.4
II
6,212.6
5,541.5
3,117.5
3,117.5
0.0
427.9
211.0
273.8
323.7
147.7
756.4
283.4
648.3
22.8
III
7,387.8
6,391.6
3,315.2
3,315.2
0.0
497.7
358.3
499.2
370.0
230.4
830.4
290.3
949.8
46.5
IV
5,952.6
5,101.2
1,994.7
1,978.8
15.9
462.8
318.8
489.5
369.4
245.5
939.0
281.4
829.9
21.4
I
7,916.4
6,764.4
3,040.5
1,651.0
1,389.5
669.8
504.3
661.5
470.8
191.9
943.8
281.7
938.0
214.0
II
6,731.6
6,158.0
3,483.6
3,483.6
0.0
364.5
270.6
361.9
321.3
176.1
908.7
271.3
541.8
31.9
III
7,361.1
6,698.4
3,769.4
3,769.4
0.0
379.4
348.8
461.2
373.0
224.1
858.0
284.4
604.1
58.6
2005
IVp
6,107.5
5,580.3
2,361.5
2,304.8
56.6
405.1
314.6
510.1
365.7
220.8
1,104.3
298.2
483.2
43.9
1 Operating revenue refers to receipts credited to the Consolidated Revenue Account and Development Fund Account, but excludes interest income, investment income and capital receipts. Figures are rounded to the nearest $ million.
Source: Ministry of Finance
2 Taxes on Motor Vehicles comprise additional registration fees, road tax, special tax on heavy-oil engines, passenger vehicle seating fees and non-motor vehicle licences, but exclude import duties on motor vehicles which are classified under Customs and Excise Duties.3 Other receipts exclude repayment of loans and advances, interest income, investment income and capital receipts.
Million Dollars
2004 2005
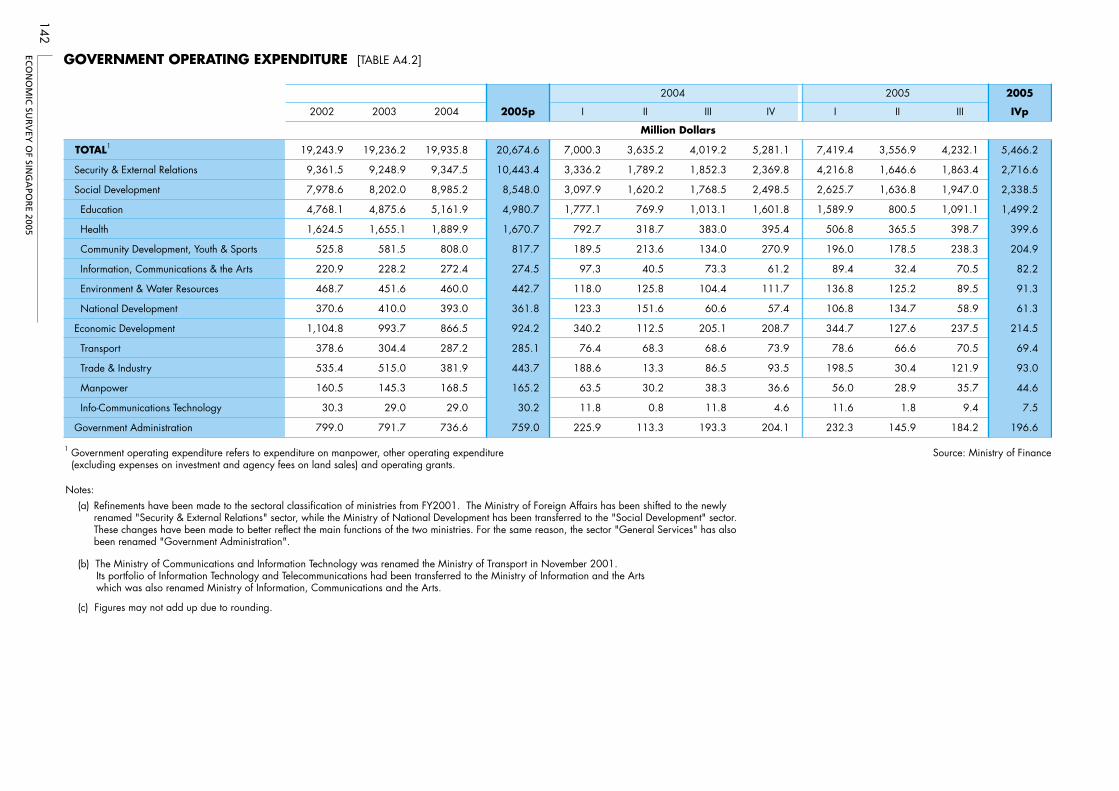
ECO
NO
MIC
SUR
VEY
OF SIN
GA
POR
E 2005
142
GOVERNMENT OPERATING EXPENDITURE [TABLE A4.2]
TOTAL1
Security & External Relations
Social Development
Education
Health
Community Development, Youth & Sports
Information, Communications & the Arts
Environment & Water Resources
National Development
Economic Development
Transport
Trade & Industry
Manpower
Info-Communications Technology
Government Administration
2002
19,243.9
9,361.5
7,978.6
4,768.1
1,624.5
525.8
220.9
468.7
370.6
1,104.8
378.6
535.4
160.5
30.3
799.0
2003
19,236.2
9,248.9
8,202.0
4,875.6
1,655.1
581.5
228.2
451.6
410.0
993.7
304.4
515.0
145.3
29.0
791.7
2004
19,935.8
9,347.5
8,985.2
5,161.9
1,889.9
808.0
272.4
460.0
393.0
866.5
287.2
381.9
168.5
29.0
736.6
2005p
20,674.6
10,443.4
8,548.0
4,980.7
1,670.7
817.7
274.5
442.7
361.8
924.2
285.1
443.7
165.2
30.2
759.0
I
7,000.3
3,336.2
3,097.9
1,777.1
792.7
189.5
97.3
118.0
123.3
340.2
76.4
188.6
63.5
11.8
225.9
II
3,635.2
1,789.2
1,620.2
769.9
318.7
213.6
40.5
125.8
151.6
112.5
68.3
13.3
30.2
0.8
113.3
III
4,019.2
1,852.3
1,768.5
1,013.1
383.0
134.0
73.3
104.4
60.6
205.1
68.6
86.5
38.3
11.8
193.3
4.6
IV
5,281.1
2,369.8
2,498.5
1,601.8
395.4
270.9
61.2
111.7
57.4
208.7
73.9
93.5
36.6
204.1
I
7,419.4
4,216.8
2,625.7
1,589.9
506.8
196.0
89.4
136.8
106.8
344.7
78.6
198.5
56.0
11.6
232.3
II
3,556.9
1,646.6
1,636.8
800.5
365.5
178.5
32.4
125.2
134.7
127.6
66.6
30.4
28.9
1.8
145.9
III
4,232.1
1,863.4
1,947.0
1,091.1
398.7
238.3
70.5
89.5
58.9
237.5
70.5
121.9
35.7
9.4
184.2
2005
IVp
5,466.2
2,716.6
2,338.5
1,499.2
399.6
204.9
82.2
91.3
61.3
214.5
69.4
93.0
44.6
7.5
196.6
1 Government operating expenditure refers to expenditure on manpower, other operating expenditure (excluding expenses on investment and agency fees on land sales) and operating grants.
Source: Ministry of Finance
Notes: (a) Refinements have been made to the sectoral classification of ministries from FY2001. The Ministry of Foreign Affairs has been shifted to the newly renamed "Security & External Relations" sector, while the Ministry of National Development has been transferred to the "Social Development" sector.
These changes have been made to better reflect the main functions of the two ministries. For the same reason, the sector "General Services" has also been renamed "Government Administration".
(b) The Ministry of Communications and Information Technology was renamed the Ministry of Transport in November 2001. Its portfolio of Information Technology and Telecommunications had been transferred to the Ministry of Information and the Arts which was also renamed Ministry of Information, Communications and the Arts.
(c) Figures may not add up due to rounding.
Million Dollars
2004 2005
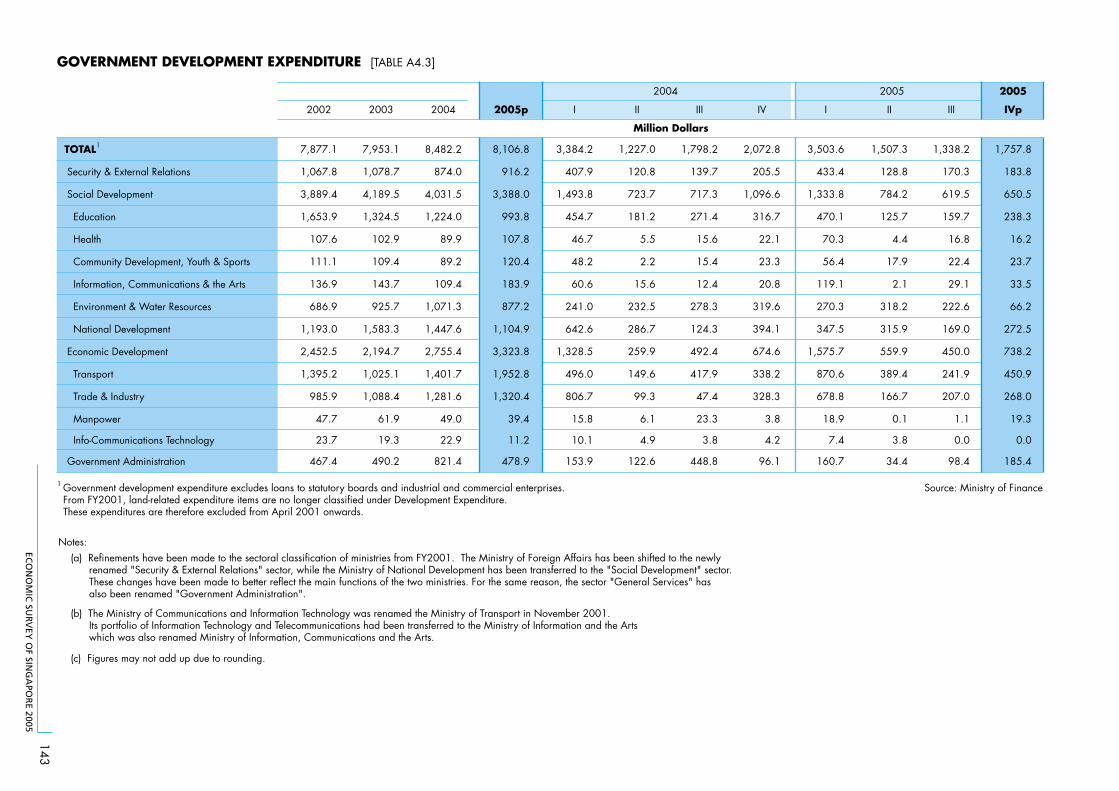
ECO
NO
MIC
SUR
VEY
OF SIN
GA
POR
E 2005
143
GOVERNMENT DEVELOPMENT EXPENDITURE [TABLE A4.3]
TOTAL1
Security & External Relations
Social Development
Education
Health
Community Development, Youth & Sports
Information, Communications & the Arts
Environment & Water Resources
National Development
Economic Development
Transport
Trade & Industry
Manpower
Info-Communications Technology
Government Administration
2002
7,877.1
1,067.8
3,889.4
1,653.9
107.6
111.1
136.9
686.9
1,193.0
2,452.5
1,395.2
985.9
47.7
23.7
467.4
2003
7,953.1
1,078.7
4,189.5
1,324.5
102.9
109.4
143.7
925.7
1,583.3
2,194.7
1,025.1
1,088.4
61.9
19.3
490.2
2004
8,482.2
874.0
4,031.5
1,224.0
89.9
89.2
109.4
1,071.3
1,447.6
2,755.4
1,401.7
1,281.6
49.0
22.9
821.4
2005p
8,106.8
916.2
3,388.0
993.8
107.8
120.4
183.9
877.2
1,104.9
3,323.8
1,952.8
1,320.4
39.4
11.2
478.9
I
3,384.2
407.9
1,493.8
454.7
46.7
48.2
60.6
241.0
642.6
1,328.5
496.0
806.7
15.8
10.1
153.9
II
1,227.0
120.8
723.7
181.2
5.5
2.2
15.6
232.5
286.7
259.9
149.6
99.3
6.1
4.9
122.6
III
1,798.2
139.7
717.3
271.4
15.6
15.4
12.4
278.3
124.3
492.4
417.9
47.4
23.3
3.8
448.8
IV
2,072.8
205.5
1,096.6
316.7
22.1
23.3
20.8
319.6
394.1
674.6
338.2
328.3
3.8
4.2
96.1
I
3,503.6
433.4
1,333.8
470.1
70.3
56.4
119.1
270.3
347.5
1,575.7
870.6
678.8
18.9
7.4
160.7
II
1,507.3
128.8
784.2
125.7
4.4
17.9
2.1
318.2
315.9
559.9
389.4
166.7
0.1
3.8
34.4
III
1,338.2
170.3
619.5
159.7
16.8
22.4
29.1
222.6
169.0
450.0
241.9
207.0
1.1
0.0
98.4
2005
IVp
1,757.8
183.8
650.5
238.3
16.2
23.7
33.5
66.2
272.5
738.2
450.9
268.0
19.3
0.0
185.4
1 Government development expenditure excludes loans to statutory boards and industrial and commercial enterprises. From FY2001, land-related expenditure items are no longer classified under Development Expenditure. These expenditures are therefore excluded from April 2001 onwards.
Source: Ministry of Finance
Notes: (a) Refinements have been made to the sectoral classification of ministries from FY2001. The Ministry of Foreign Affairs has been shifted to the newly renamed "Security & External Relations" sector, while the Ministry of National Development has been transferred to the "Social Development" sector. These changes have been made to better reflect the main functions of the two ministries. For the same reason, the sector "General Services" has also been renamed "Government Administration".
(b) The Ministry of Communications and Information Technology was renamed the Ministry of Transport in November 2001. Its portfolio of Information Technology and Telecommunications had been transferred to the Ministry of Information and the Arts which was also renamed Ministry of Information, Communications and the Arts.
(c) Figures may not add up due to rounding.
Million Dollars
2004 2005
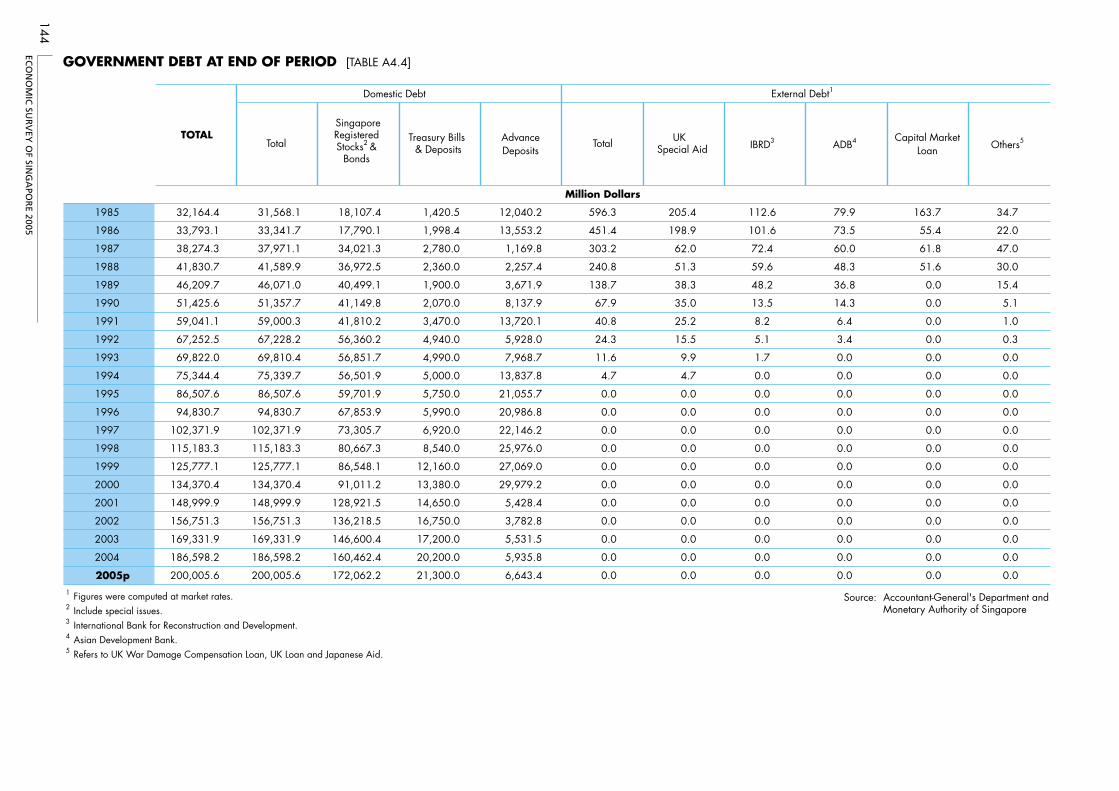
ECO
NO
MIC
SUR
VEY
OF SIN
GA
POR
E 2005
144
Domestic Debt External Debt1
Total
SingaporeRegisteredStocks2 &
Bonds
Treasury Bills & Deposits
AdvanceDeposits
Total UK Special Aid IBRD3 ADB4 Capital Market
Loan Others5
1985 32,164.4 31,568.1 18,107.4 1,420.5 12,040.2 596.3 205.4 112.6 79.9 163.7 34.7
1986 33,793.1 33,341.7 17,790.1 1,998.4 13,553.2 451.4 198.9 101.6 73.5 55.4 22.0
1987 38,274.3 37,971.1 34,021.3 2,780.0 1,169.8 303.2 62.0 72.4 60.0 61.8 47.0
1988 41,830.7 41,589.9 36,972.5 2,360.0 2,257.4 240.8 51.3 59.6 48.3 51.6 30.0
1989 46,209.7 46,071.0 40,499.1 1,900.0 3,671.9 138.7 38.3 48.2 36.8 0.0 15.4
1990 51,425.6 51,357.7 41,149.8 2,070.0 8,137.9 67.9 35.0 13.5 14.3 0.0 5.1
1991 59,041.1 59,000.3 41,810.2 3,470.0 13,720.1 40.8 25.2 8.2 6.4 0.0 1.0
1992 67,252.5 67,228.2 56,360.2 4,940.0 5,928.0 24.3 15.5 5.1 3.4 0.0 0.3
1993 69,822.0 69,810.4 56,851.7 4,990.0 7,968.7 11.6 9.9 1.7 0.0 0.0 0.0
1994 75,344.4 75,339.7 56,501.9 5,000.0 13,837.8 4.7 4.7 0.0 0.0 0.0 0.0
1995 86,507.6 86,507.6 59,701.9 5,750.0 21,055.7 0.0 0.0 0.0 0.0 0.0 0.0
1996 94,830.7 94,830.7 67,853.9 5,990.0 20,986.8 0.0 0.0 0.0 0.0 0.0 0.0
1997 102,371.9 102,371.9 73,305.7 6,920.0 22,146.2 0.0 0.0 0.0 0.0 0.0 0.0
1998 115,183.3 115,183.3 80,667.3 8,540.0 25,976.0 0.0 0.0 0.0 0.0 0.0 0.0
1999 125,777.1 125,777.1 86,548.1 12,160.0 27,069.0 0.0 0.0 0.0 0.0 0.0 0.0
2000 134,370.4 134,370.4 91,011.2 13,380.0 29,979.2 0.0 0.0 0.0 0.0 0.0 0.0
2001 148,999.9 148,999.9 128,921.5 14,650.0 5,428.4 0.0 0.0 0.0 0.0 0.0 0.0
2002 156,751.3 156,751.3 136,218.5 16,750.0 3,782.8 0.0 0.0 0.0 0.0 0.0 0.0
2003 169,331.9 169,331.9 146,600.4 17,200.0 5,531.5 0.0 0.0 0.0 0.0 0.0 0.0
2004 186,598.2 186,598.2 160,462.4 20,200.0 5,935.8 0.0 0.0 0.0 0.0 0.0 0.0
2005p 200,005.6 200,005.6 172,062.2 21,300.0 6,643.4 0.0 0.0 0.0 0.0 0.0 0.01 Figures were computed at market rates. Source: Accountant-General's Department and
Monetary Authority of Singapore2 Include special issues.3 International Bank for Reconstruction and Development.4 Asian Development Bank.5 Refers to UK War Damage Compensation Loan, UK Loan and Japanese Aid.
GOVERNMENT DEBT AT END OF PERIOD [TABLE A4.4]
TOTAL
Million Dollars
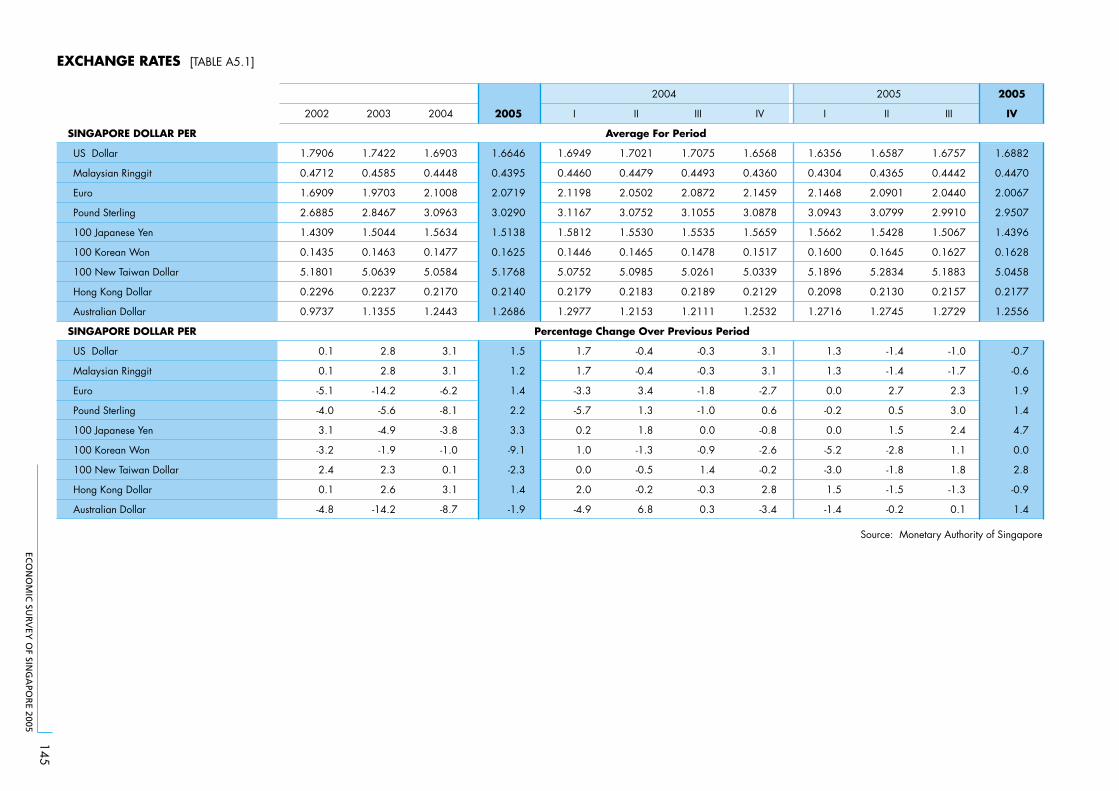
ECO
NO
MIC
SUR
VEY
OF SIN
GA
POR
E 2005
145
EXCHANGE RATES [TABLE A5.1]
SINGAPORE DOLLAR PER
US Dollar
Malaysian Ringgit
Euro
Pound Sterling
100 Japanese Yen
100 Korean Won
100 New Taiwan Dollar
Hong Kong Dollar
Australian Dollar
SINGAPORE DOLLAR PER
US Dollar
Malaysian Ringgit
Euro
Pound Sterling
100 Japanese Yen
100 Korean Won
100 New Taiwan Dollar
Hong Kong Dollar
Australian Dollar
2002
1.7906
0.4712
1.6909
2.6885
1.4309
0.1435
5.1801
0.2296
0.9737
0.1
0.1
-5.1
-4.0
3.1
-3.2
2.4
0.1
-4.8
2003
1.7422
0.4585
1.9703
2.8467
1.5044
0.1463
5.0639
0.2237
1.1355
2.8
2.8
-14.2
-5.6
-4.9
-1.9
2.3
2.6
-14.2
2004
1.6903
0.4448
2.1008
3.0963
1.5634
0.1477
5.0584
0.2170
1.2443
3.1
3.1
-6.2
-8.1
-3.8
-1.0
0.1
3.1
-8.7
2005
1.6646
0.4395
2.0719
3.0290
1.5138
0.1625
5.1768
0.2140
1.2686
1.5
1.2
1.4
2.2
3.3
-9.1
-2.3
1.4
-1.9
I
1.6949
0.4460
2.1198
3.1167
1.5812
0.1446
5.0752
0.2179
1.2977
1.7
1.7
-3.3
-5.7
0.2
1.0
0.0
2.0
-4.9
II
1.7021
0.4479
2.0502
3.0752
1.5530
0.1465
5.0985
0.2183
1.2153
-0.4
-0.4
3.4
1.3
1.8
-1.3
-0.5
-0.2
6.8
III
1.7075
0.4493
2.0872
3.1055
1.5535
0.1478
5.0261
0.2189
1.2111
-0.3
-0.3
-1.8
-1.0
0.0
-0.9
1.4
-0.3
0.3
IV
1.6568
0.4360
2.1459
3.0878
1.5659
0.1517
5.0339
0.2129
1.2532
3.1
3.1
-2.7
0.6
-0.8
-2.6
-0.2
2.8
-3.4
I
1.6356
0.4304
2.1468
3.0943
1.5662
0.1600
5.1896
0.2098
1.2716
1.3
1.3
0.0
-0.2
0.0
-5.2
-3.0
1.5
-1.4
II
1.6587
0.4365
2.0901
3.0799
1.5428
0.1645
5.2834
0.2130
1.2745
-1.4
-1.4
2.7
0.5
1.5
-2.8
-1.8
-1.5
-0.2
III
1.6757
0.4442
2.0440
2.9910
1.5067
0.1627
5.1883
0.2157
1.2729
-1.0
-1.7
2.3
3.0
2.4
1.1
1.8
-1.3
0.1
2005
IV
1.6882
0.4470
2.0067
2.9507
1.4396
0.1628
5.0458
0.2177
1.2556
-0.7
-0.6
1.9
1.4
4.7
0.0
2.8
-0.9
1.4
Source: Monetary Authority of Singapore
Percentage Change Over Previous Period
2004
Average For Period
2005
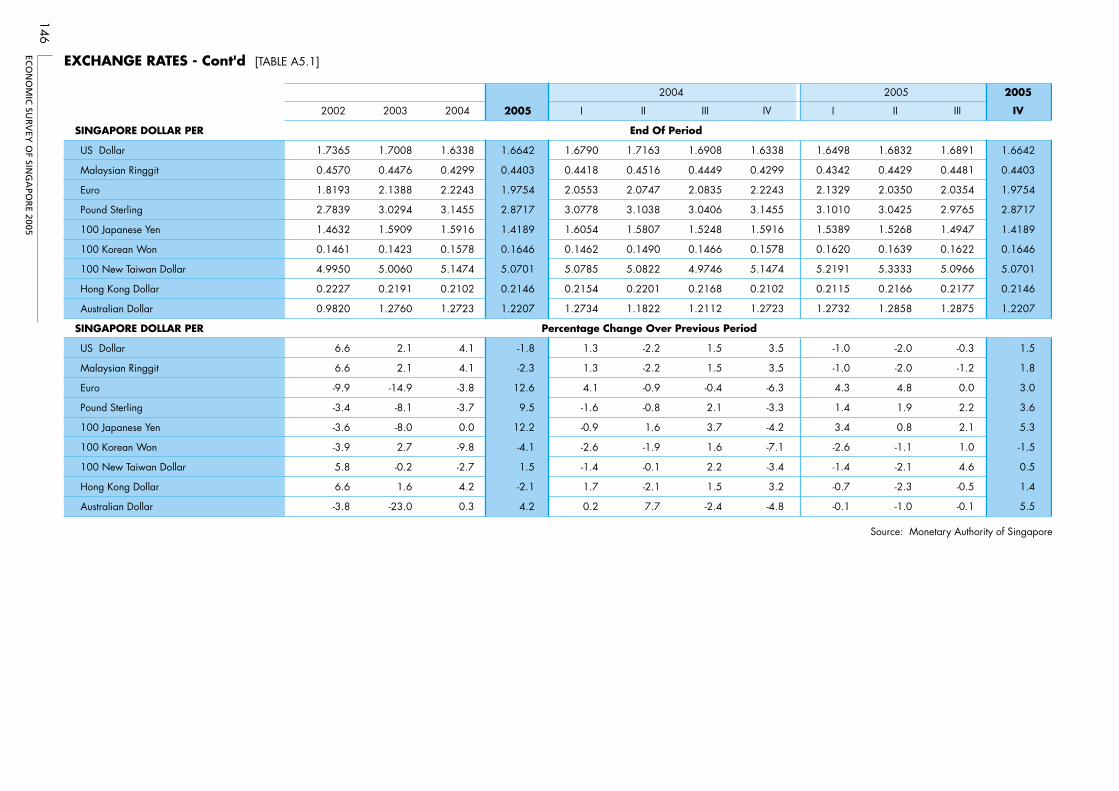
ECO
NO
MIC
SUR
VEY
OF SIN
GA
POR
E 2005
146
EXCHANGE RATES - Cont'd [TABLE A5.1]
SINGAPORE DOLLAR PER
US Dollar
Malaysian Ringgit
Euro
Pound Sterling
100 Japanese Yen
100 Korean Won
100 New Taiwan Dollar
Hong Kong Dollar
Australian Dollar
SINGAPORE DOLLAR PER
US Dollar
Malaysian Ringgit
Euro
Pound Sterling
100 Japanese Yen
100 Korean Won
100 New Taiwan Dollar
Hong Kong Dollar
Australian Dollar
2002
1.7365
0.4570
1.8193
2.7839
1.4632
0.1461
4.9950
0.2227
0.9820
6.6
6.6
-9.9
-3.4
-3.6
-3.9
5.8
6.6
-3.8
2003
1.7008
0.4476
2.1388
3.0294
1.5909
0.1423
5.0060
0.2191
1.2760
2.1
2.1
-14.9
-8.1
-8.0
2.7
-0.2
1.6
-23.0
2004
1.6338
0.4299
2.2243
3.1455
1.5916
0.1578
5.1474
0.2102
1.2723
4.1
4.1
-3.8
-3.7
0.0
-9.8
-2.7
4.2
0.3
2005
1.6642
0.4403
1.9754
2.8717
1.4189
0.1646
5.0701
0.2146
1.2207
-1.8
-2.3
12.6
9.5
12.2
-4.1
1.5
-2.1
4.2
I
1.6790
0.4418
2.0553
3.0778
1.6054
0.1462
5.0785
0.2154
1.2734
1.3
1.3
4.1
-1.6
-0.9
-2.6
-1.4
1.7
0.2
II
1.7163
0.4516
2.0747
3.1038
1.5807
0.1490
5.0822
0.2201
1.1822
-2.2
-2.2
-0.9
-0.8
1.6
-1.9
-0.1
-2.1
7.7
III
1.6908
0.4449
2.0835
3.0406
1.5248
0.1466
4.9746
0.2168
1.2112
1.5
1.5
-0.4
2.1
3.7
1.6
2.2
1.5
-2.4
IV
1.6338
0.4299
2.2243
3.1455
1.5916
0.1578
5.1474
0.2102
1.2723
3.5
3.5
-6.3
-3.3
-4.2
-7.1
-3.4
3.2
-4.8
I
1.6498
0.4342
2.1329
3.1010
1.5389
0.1620
5.2191
0.2115
1.2732
-1.0
-1.0
4.3
1.4
3.4
-2.6
-1.4
-0.7
-0.1
II
1.6832
0.4429
2.0350
3.0425
1.5268
0.1639
5.3333
0.2166
1.2858
-2.0
-2.0
4.8
1.9
0.8
-1.1
-2.1
-2.3
-1.0
III
1.6891
0.4481
2.0354
2.9765
1.4947
0.1622
5.0966
0.2177
1.2875
-0.3
-1.2
0.0
2.2
2.1
1.0
4.6
-0.5
-0.1
2005
IV
1.6642
0.4403
1.9754
2.8717
1.4189
0.1646
5.0701
0.2146
1.2207
1.5
1.8
3.0
3.6
5.3
-1.5
0.5
1.4
5.5
Source: Monetary Authority of Singapore
2004
End Of Period
Percentage Change Over Previous Period
2005
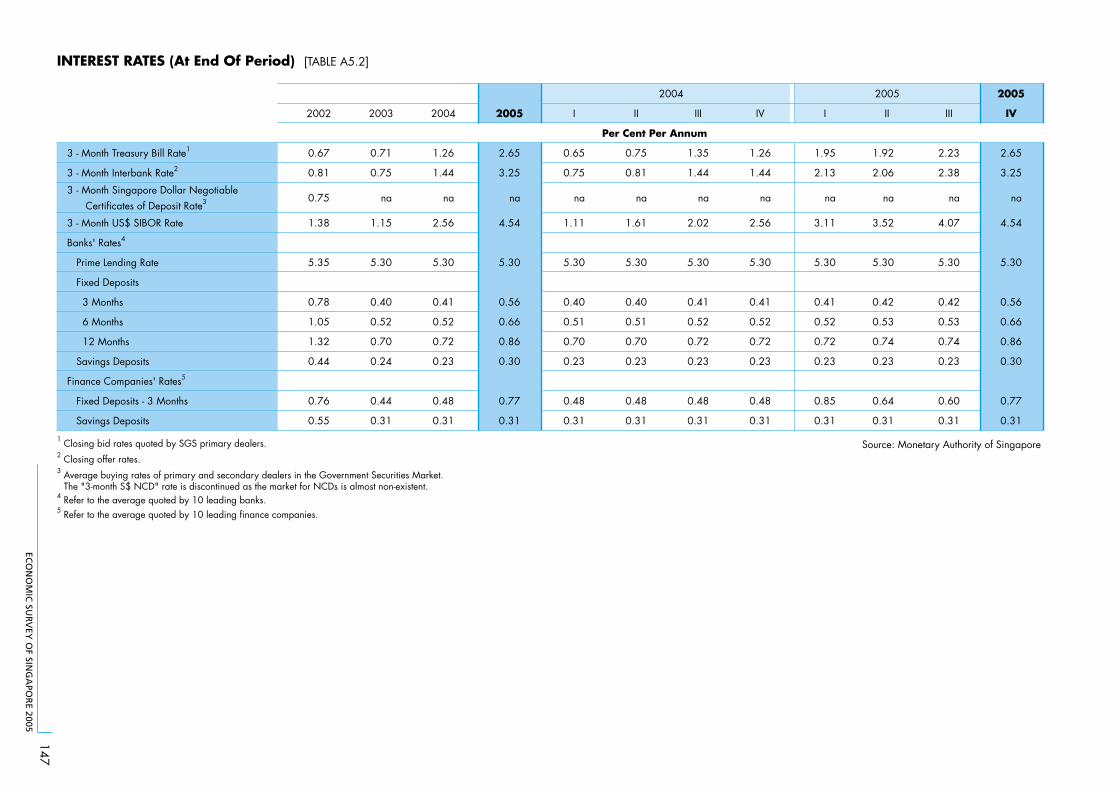
ECO
NO
MIC
SUR
VEY
OF SIN
GA
POR
E 2005
147
INTEREST RATES (At End Of Period) [TABLE A5.2]
II
3 - Month Treasury Bill Rate1 1.92
3 - Month Interbank Rate2 2.06
3 - Month Singapore Dollar Negotiable Certificates of Deposit Rate3 na
3 - Month US$ SIBOR Rate 3.52
Banks' Rates4
Prime Lending Rate 5.30
Fixed Deposits
3 Months 0.42
6 Months 0.53
12 Months 0.74
Savings Deposits 0.23
Finance Companies' Rates5
Fixed Deposits - 3 Months 0.64
Savings Deposits
2002
0.67
0.81
0.75
1.38
5.35
0.78
1.05
1.32
0.44
0.76
0.55
2003
0.71
0.75
na
1.15
5.30
0.40
0.52
0.70
0.24
0.44
0.31
2004
1.26
1.44
na
2.56
5.30
0.41
0.52
0.72
0.23
0.48
0.31
2005
2.65
3.25
na
4.54
5.30
0.56
0.66
0.86
0.30
0.77
0.31
I
0.65
0.75
na
1.11
5.30
0.40
0.51
0.70
0.23
0.48
0.31
II
0.75
0.81
na
1.61
5.30
0.40
0.51
0.70
0.23
0.48
0.31
III
1.35
1.44
na
2.02
5.30
0.41
0.52
0.72
0.23
0.48
0.31
IV
1.26
1.44
na
2.56
5.30
0.41
0.52
0.72
0.23
0.48
0.31
I
1.95
2.13
na
3.11
5.30
0.41
0.52
0.72
0.23
0.85
0.31 0.31
III
2.23
2.38
na
4.07
5.30
0.42
0.53
0.74
0.23
0.60
0.31
2005
IV
2.65
3.25
na
4.54
5.30
0.56
0.66
0.86
0.30
0.77
0.31
1 Closing bid rates quoted by SGS primary dealers. Source: Monetary Authority of Singapore2 Closing offer rates.3 Average buying rates of primary and secondary dealers in the Government Securities Market. The "3-month S$ NCD" rate is discontinued as the market for NCDs is almost non-existent.
4 Refer to the average quoted by 10 leading banks.5 Refer to the average quoted by 10 leading finance companies.
Per Cent Per Annum
2004 2005

ECO
NO
MIC
SUR
VEY
OF SIN
GA
POR
E 2005
148
MONEY SUPPLY (At End Of Period) [TABLE A5.3]
2005
2002 2003 2004 2005p I II III IV I II III IVp
Money Supply (M2)
Money Supply (M1)
Currency in Active Circulation
Demand Deposits of Private Sector
Quasi-Money
Fixed Deposits
Singapore Dollar Negotiable Certificates of Deposit Held
Savings & Other Deposits
Money Supply (M2)
Money Supply (M1)
Currency in Active Circulation
Demand Deposits of Private Sector
Quasi-Money
Fixed Deposits
Singapore Dollar Negotiable Certificates of Deposit Held
Savings & Other Deposits
180,308.1
35,828.2
12,360.3
23,467.9
144,479.9
81,597.5
225.6
62,656.8
-0.3
-0.7
4.1
-3.1
-0.2
-2.1
10.6
2.2
194,828.5
38,722.6
12,838.4
25,884.2
156,105.9
89,706.3
288.3
66,111.3
8.1
8.1
3.9
10.3
8.0
9.9
27.8
5.5
206,977.8
44,162.2
13,693.9
30,468.3
162,815.6
93,360.2
515.0
68,940.4
6.2
14.0
6.7
17.7
4.3
4.1
78.6
4.3
219,790.1
46,077.7
14,576.3
31,501.4
173,712.4
107,714.3
409.2
65,588.9
6.2
4.3
6.4
3.4
6.7
15.4
-20.5
-4.9
201,702.9
41,418.6
13,094.5
28,324.1
160,284.3
92,662.5
324.0
67,297.8
9.9
12.3
4.3
16.5
9.3
12.4
37.3
5.2
204,370.5
41,118.9
13,229.9
27,889.0
163,251.6
95,543.6
384.0
67,324.0
10.7
12.0
5.5
15.4
10.3
14.9
106.3
4.3
200,748.9
41,891.9
13,253.2
28,638.7
158,857.0
91,091.9
454.8
67,310.3
8.4
10.2
5.4
12.5
8.0
11.6
57.3
3.2
206,977.8
44,162.2
13,693.9
30,468.3
162,815.6
93,360.2
515.0
68,940.4
6.2
14.0
6.7
17.7
4.3
4.1
78.6
4.3
210,430.4
45,020.9
13,923.2
31,097.7
165,409.5
95,967.7
450.2
68,991.6
4.3
8.7
6.3
9.8
3.2
3.6
39.0
2.5
213,697.9
45,779.9
13,973.9
31,806.0
167,918.0
100,071.4
412.5
67,434.1
4.6
11.3
5.6
14.0
2.9
4.7
7.4
0.2
217,196.9
45,565.9
13,996.7
31,569.2
171,631.0
104,030.0
453.8
67,147.2
8.2
8.8
5.6
10.2
8.0
14.2
-0.2
-0.2
219,790.1
46,077.7
14,576.3
31,501.4
173,712.4
107,714.3
409.2
65,588.9
6.2
4.3
6.4
3.4
6.7
15.4
-20.5
-4.9
Source: Monetary Authority of Singapore
2004 2005
Million Dollars
Percentage Change Over Corresponding Period Of Previous Year
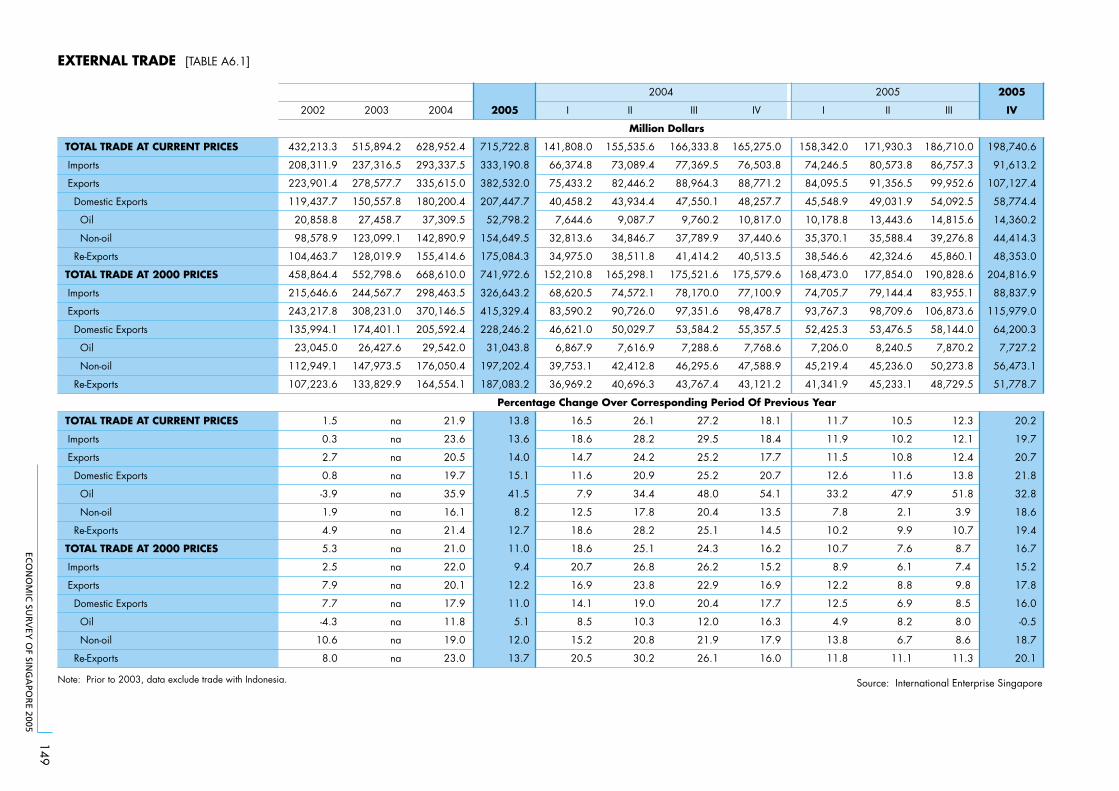
ECO
NO
MIC
SUR
VEY
OF SIN
GA
POR
E 2005
149
EXTERNAL TRADE [TABLE A6.1]
2005
2002 2003 2004 2005 I II III IV I II III IV
TOTAL TRADE AT CURRENT PRICES 432,213.3 515,894.2 628,952.4 715,722.8 141,808.0 155,535.6 166,333.8 165,275.0 158,342.0 171,930.3 186,710.0 198,740.6
Imports 208,311.9 237,316.5 293,337.5 333,190.8 66,374.8 73,089.4 77,369.5 76,503.8 74,246.5 80,573.8 86,757.3 91,613.2
Exports 223,901.4 278,577.7 335,615.0 382,532.0 75,433.2 82,446.2 88,964.3 88,771.2 84,095.5 91,356.5 99,952.6 107,127.4
Domestic Exports 119,437.7 150,557.8 180,200.4 207,447.7 40,458.2 43,934.4 47,550.1 48,257.7 45,548.9 49,031.9 54,092.5 58,774.4
Oil 20,858.8 27,458.7 37,309.5 52,798.2 7,644.6 9,087.7 9,760.2 10,817.0 10,178.8 13,443.6 14,815.6 14,360.2
Non-oil 98,578.9 123,099.1 142,890.9 154,649.5 32,813.6 34,846.7 37,789.9 37,440.6 35,370.1 35,588.4 39,276.8 44,414.3
Re-Exports 104,463.7 128,019.9 155,414.6 175,084.3 34,975.0 38,511.8 41,414.2 40,513.5 38,546.6 42,324.6 45,860.1 48,353.0
TOTAL TRADE AT 2000 PRICES 458,864.4 552,798.6 668,610.0 741,972.6 152,210.8 165,298.1 175,521.6 175,579.6 168,473.0 177,854.0 190,828.6 204,816.9
Imports 215,646.6 244,567.7 298,463.5 326,643.2 68,620.5 74,572.1 78,170.0 77,100.9 74,705.7 79,144.4 83,955.1 88,837.9
Exports 243,217.8 308,231.0 370,146.5 415,329.4 83,590.2 90,726.0 97,351.6 98,478.7 93,767.3 98,709.6 106,873.6 115,979.0
Domestic Exports 135,994.1 174,401.1 205,592.4 228,246.2 46,621.0 50,029.7 53,584.2 55,357.5 52,425.3 53,476.5 58,144.0 64,200.3
Oil 23,045.0 26,427.6 29,542.0 31,043.8 6,867.9 7,616.9 7,288.6 7,768.6 7,206.0 8,240.5 7,870.2 7,727.2
Non-oil 112,949.1 147,973.5 176,050.4 197,202.4 39,753.1 42,412.8 46,295.6 47,588.9 45,219.4 45,236.0 50,273.8 56,473.1
Re-Exports 107,223.6 133,829.9 164,554.1 187,083.2 36,969.2 40,696.3 43,767.4 43,121.2 41,341.9 45,233.1 48,729.5 51,778.7
TOTAL TRADE AT CURRENT PRICES 1.5 na 21.9 13.8 16.5 26.1 27.2 18.1 11.7 10.5 12.3 20.2
Imports 0.3 na 23.6 13.6 18.6 28.2 29.5 18.4 11.9 10.2 12.1 19.7
Exports 2.7 na 20.5 14.0 14.7 24.2 25.2 17.7 11.5 10.8 12.4 20.7
Domestic Exports 0.8 na 19.7 15.1 11.6 20.9 25.2 20.7 12.6 11.6 13.8 21.8
Oil -3.9 na 35.9 41.5 7.9 34.4 48.0 54.1 33.2 47.9 51.8 32.8
Non-oil 1.9 na 16.1 8.2 12.5 17.8 20.4 13.5 7.8 2.1 3.9 18.6
Re-Exports 4.9 na 21.4 12.7 18.6 28.2 25.1 14.5 10.2 9.9 10.7 19.4
TOTAL TRADE AT 2000 PRICES 5.3 na 21.0 11.0 18.6 25.1 24.3 16.2 10.7 7.6 8.7 16.7
Imports 2.5 na 22.0 9.4 20.7 26.8 26.2 15.2 8.9 6.1 7.4 15.2
Exports 7.9 na 20.1 12.2 16.9 23.8 22.9 16.9 12.2 8.8 9.8 17.8
Domestic Exports 7.7 na 17.9 11.0 14.1 19.0 20.4 17.7 12.5 6.9 8.5 16.0
Oil -4.3 na 11.8 5.1 8.5 10.3 12.0 16.3 4.9 8.2 8.0 -0.5
Non-oil 10.6 na 19.0 12.0 15.2 20.8 21.9 17.9 13.8 6.7 8.6 18.7
Re-Exports 8.0 na 23.0 13.7 20.5 30.2 26.1 16.0 11.8 11.1 11.3 20.1
Note: Prior to 2003, data exclude trade with Indonesia. Source: International Enterprise Singapore
2004 2005
Million Dollars
Percentage Change Over Corresponding Period Of Previous Year
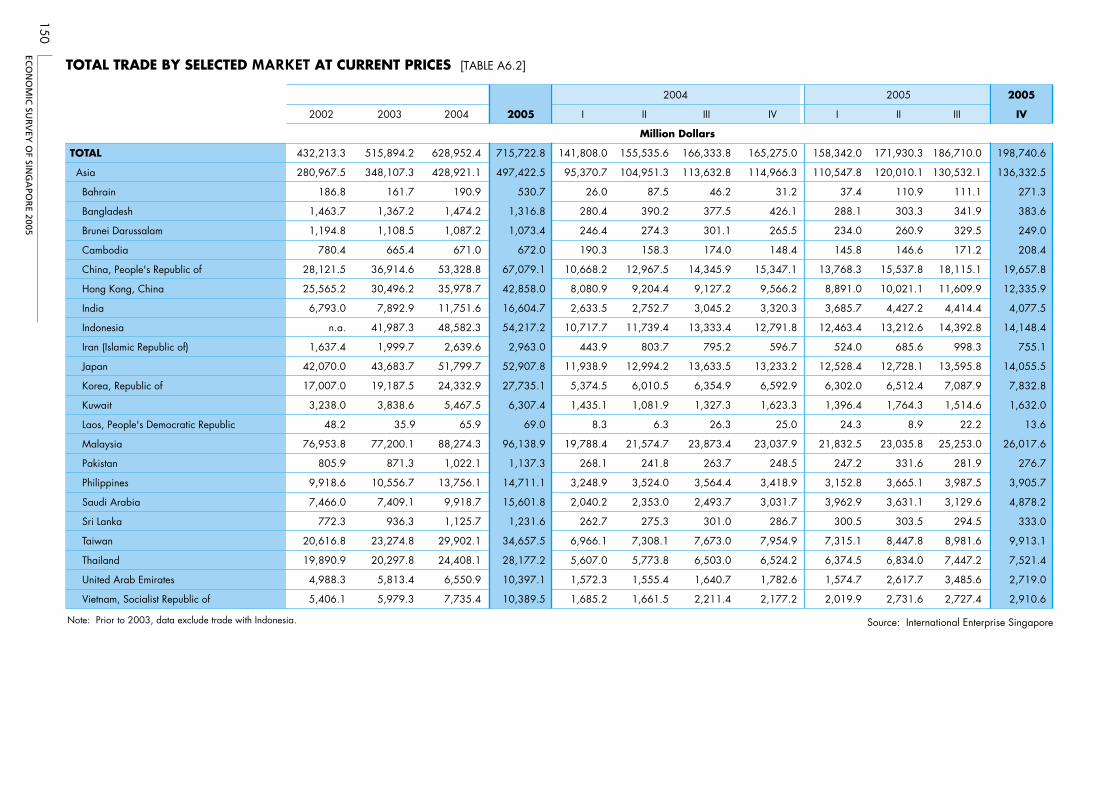
ECO
NO
MIC
SUR
VEY
OF SIN
GA
POR
E 2005
150
TOTAL TRADE BY SELECTED MARKET AT CURRENT PRICES [TABLE A6.2]
2005
2002 2003 2004 2005 I II III IV I II III IV
TOTAL 432,213.3 515,894.2 628,952.4 715,722.8 141,808.0 166,333.8 165,275.0 158,342.0 171,930.3 186,710.0 198,740.6
Asia 280,967.5 348,107.3 428,921.1 497,422.5 95,370.7 113,632.8 114,966.3 110,547.8 120,010.1 130,532.1 136,332.5
Bahrain 186.8 161.7 190.9 530.7 26.0 46.2 31.2 37.4 110.9 111.1 271.3
Bangladesh 1,463.7 1,367.2 1,474.2 1,316.8 280.4 377.5 426.1 288.1 303.3 341.9 383.6
Brunei Darussalam 1,194.8 1,108.5 1,087.2 1,073.4 246.4 301.1 265.5 234.0 260.9 329.5 249.0
Cambodia 780.4 665.4 671.0 672.0 190.3 174.0 148.4 145.8 146.6 171.2 208.4
China, People's Republic of 28,121.5 36,914.6 53,328.8 67,079.1 10,668.2 14,345.9 15,347.1 13,768.3 15,537.8 18,115.1 19,657.8
Hong Kong, China 25,565.2 30,496.2 35,978.7 42,858.0 8,080.9 9,127.2 9,566.2 8,891.0 10,021.1 11,609.9 12,335.9
India 6,793.0 7,892.9 11,751.6 16,604.7 2,633.5 3,045.2 3,320.3 3,685.7 4,427.2 4,414.4 4,077.5
Indonesia n.a. 41,987.3 48,582.3 54,217.2 10,717.7 13,333.4 12,791.8 12,463.4 13,212.6 14,392.8 14,148.4
Iran (Islamic Republic of) 1,637.4 1,999.7 2,639.6 2,963.0 443.9 795.2 596.7 524.0 685.6 998.3 755.1
Japan 42,070.0 43,683.7 51,799.7 52,907.8 11,938.9 13,633.5 13,233.2 12,528.4 12,728.1 13,595.8 14,055.5
Korea, Republic of 17,007.0 19,187.5 24,332.9 27,735.1 5,374.5 6,354.9 6,592.9 6,302.0 6,512.4 7,087.9 7,832.8
Kuwait 3,238.0 3,838.6 5,467.5 6,307.4 1,435.1 1,327.3 1,623.3 1,396.4 1,764.3 1,514.6 1,632.0
Laos, People's Democratic Republic 48.2 35.9 65.9 69.0 8.3 26.3 25.0 24.3 8.9 22.2 13.6
Malaysia 76,953.8 77,200.1 88,274.3 96,138.9 19,788.4 23,873.4 23,037.9 21,832.5 23,035.8 25,253.0 26,017.6
Pakistan 805.9 871.3 1,022.1 1,137.3 268.1 263.7 248.5 247.2 331.6 281.9 276.7
Philippines 9,918.6 10,556.7 13,756.1 14,711.1 3,248.9 3,564.4 3,418.9 3,152.8 3,665.1 3,987.5 3,905.7
Saudi Arabia 7,466.0 7,409.1 9,918.7 15,601.8 2,040.2 2,493.7 3,031.7 3,962.9 3,631.1 3,129.6 4,878.2
Sri Lanka 772.3 936.3 1,125.7 1,231.6 262.7 301.0 286.7 300.5 303.5 294.5 333.0
Taiwan 20,616.8 23,274.8 29,902.1 34,657.5 6,966.1 7,673.0 7,954.9 7,315.1 8,447.8 8,981.6 9,913.1
Thailand 19,890.9 20,297.8 24,408.1 28,177.2 5,607.0 6,503.0 6,524.2 6,374.5 6,834.0 7,447.2 7,521.4
United Arab Emirates 4,988.3 5,813.4 6,550.9 10,397.1 1,572.3 1,640.7 1,782.6 1,574.7 2,617.7 3,485.6 2,719.0
Vietnam, Socialist Republic of 5,406.1 5,979.3 7,735.4 10,389.5 1,685.2
155,535.6
104,951.3
87.5
390.2
274.3
158.3
12,967.5
9,204.4
2,752.7
11,739.4
803.7
12,994.2
6,010.5
1,081.9
6.3
21,574.7
241.8
3,524.0
2,353.0
275.3
7,308.1
5,773.8
1,555.4
1,661.5 2,211.4 2,177.2 2,019.9 2,731.6 2,727.4 2,910.6
Note: Prior to 2003, data exclude trade with Indonesia. Source: International Enterprise Singapore
Million Dollars
2004 2005
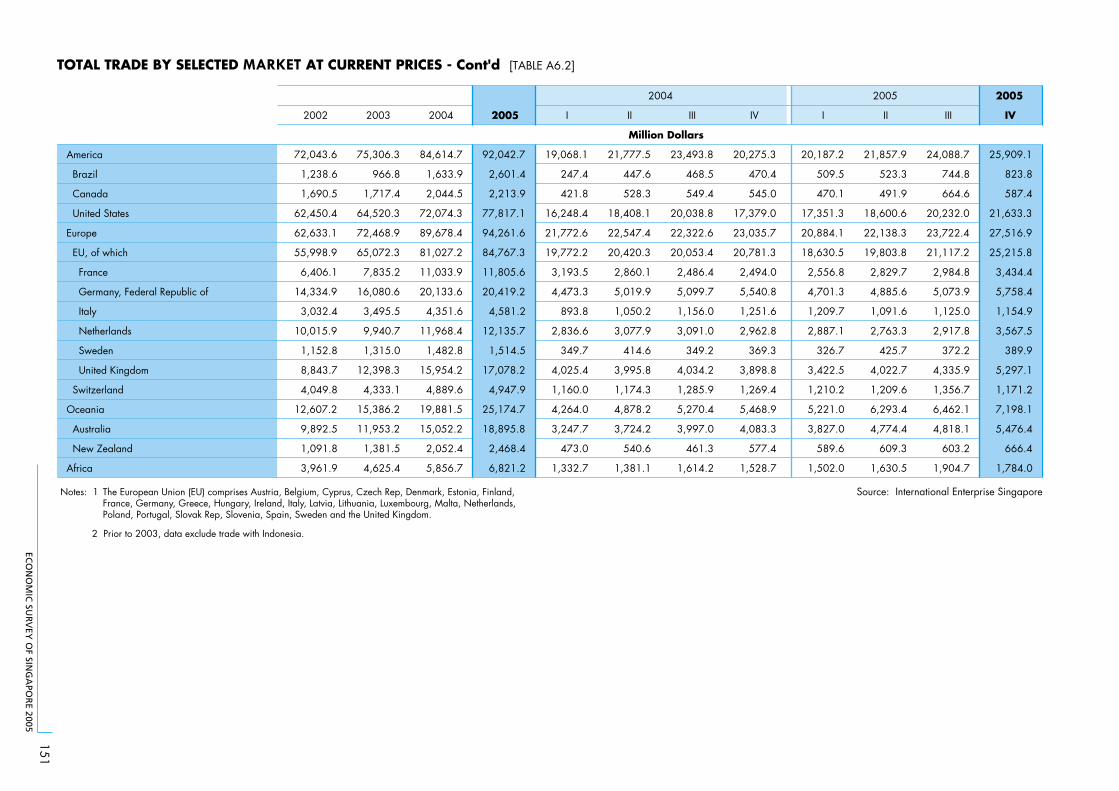
ECO
NO
MIC
SUR
VEY
OF SIN
GA
POR
E 2005
151
2005
2002 2003 2004 2005 I II III IV I II III IV
America 72,043.6 75,306.3 84,614.7 92,042.7 19,068.1 21,777.5 23,493.8 20,275.3 20,187.2 21,857.9 24,088.7 25,909.1
Brazil 1,238.6 966.8 1,633.9 2,601.4 247.4 447.6 468.5 470.4 509.5 523.3 744.8 823.8
Canada 1,690.5 1,717.4 2,044.5 2,213.9 421.8 528.3 549.4 545.0 470.1 491.9 664.6 587.4
United States 62,450.4 64,520.3 72,074.3 77,817.1 16,248.4 18,408.1 20,038.8 17,379.0 17,351.3 18,600.6 20,232.0 21,633.3
Europe 62,633.1 72,468.9 89,678.4 94,261.6 21,772.6 22,547.4 22,322.6 23,035.7 20,884.1 22,138.3 23,722.4 27,516.9
EU, of which 55,998.9 65,072.3 81,027.2 84,767.3 19,772.2 20,420.3 20,053.4 20,781.3 18,630.5 19,803.8 21,117.2 25,215.8
France 6,406.1 7,835.2 11,033.9 11,805.6 3,193.5 2,860.1 2,486.4 2,494.0 2,556.8 2,829.7 2,984.8 3,434.4
Germany, Federal Republic of 14,334.9 16,080.6 20,133.6 20,419.2 4,473.3 5,019.9 5,099.7 5,540.8 4,701.3 4,885.6 5,073.9 5,758.4
Italy 3,032.4 3,495.5 4,351.6 4,581.2 893.8 1,050.2 1,156.0 1,251.6 1,209.7 1,091.6 1,125.0 1,154.9
Netherlands 10,015.9 9,940.7 11,968.4 12,135.7 2,836.6 3,077.9 3,091.0 2,962.8 2,887.1 2,763.3 2,917.8 3,567.5
Sweden 1,152.8 1,315.0 1,482.8 1,514.5 349.7 414.6 349.2 369.3 326.7 425.7 372.2 389.9
United Kingdom 8,843.7 12,398.3 15,954.2 17,078.2 4,025.4 3,995.8 4,034.2 3,898.8 3,422.5 4,022.7 4,335.9 5,297.1
Switzerland 4,049.8 4,333.1 4,889.6 4,947.9 1,160.0 1,174.3 1,285.9 1,269.4 1,210.2 1,209.6 1,356.7 1,171.2
Oceania 12,607.2 15,386.2 19,881.5 25,174.7 4,264.0 4,878.2 5,270.4 5,468.9 5,221.0 6,293.4 6,462.1 7,198.1
Australia 9,892.5 11,953.2 15,052.2 18,895.8 3,247.7 3,724.2 3,997.0 4,083.3 3,827.0 4,774.4 4,818.1 5,476.4
New Zealand 1,091.8 1,381.5 2,052.4 2,468.4 473.0 540.6 461.3 577.4 589.6 609.3 603.2 666.4
Africa 3,961.9 4,625.4 5,856.7 6,821.2 1,332.7 1,381.1 1,614.2 1,528.7 1,502.0 1,630.5 1,904.7 1,784.0
Notes: 1 The European Union (EU) comprises Austria, Belgium, Cyprus, Czech Rep, Denmark, Estonia, Finland,France, Germany, Greece, Hungary, Ireland, Italy, Latvia, Lithuania, Luxembourg, Malta, Netherlands,Poland, Portugal, Slovak Rep, Slovenia, Spain, Sweden and the United Kingdom.
Source: International Enterprise Singapore
2 Prior to 2003, data exclude trade with Indonesia.
Million Dollars
TOTAL TRADE BY SELECTED MARKET AT CURRENT PRICES - Cont'd [TABLE A6.2]
2004 2005
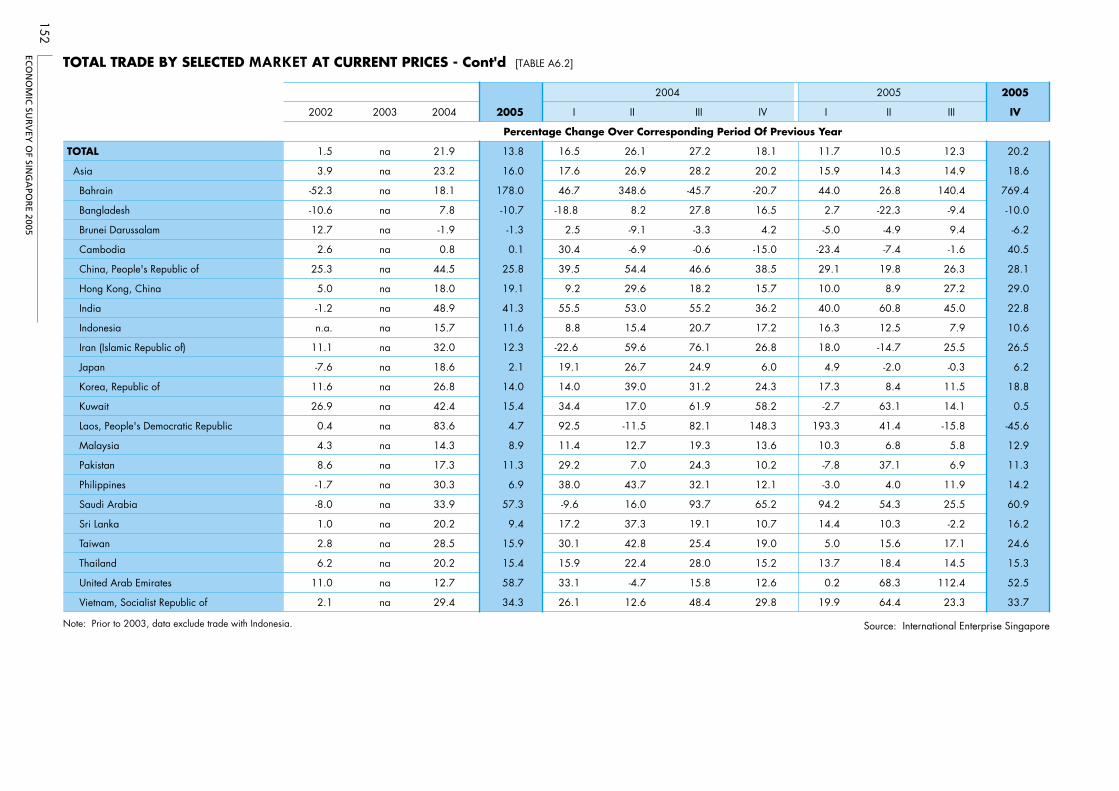
ECO
NO
MIC
SUR
VEY
OF SIN
GA
POR
E 2005
152
2005
2002 2003 2004 2005 I II III IV I II III IV
TOTAL 1.5 na 21.9 13.8 16.5 26.1 27.2 18.1 11.7 10.5 12.3 20.2
Asia 3.9 na 23.2 16.0 17.6 26.9 28.2 20.2 15.9 14.3 14.9 18.6
Bahrain -52.3 na 18.1 178.0 46.7 348.6 -45.7 -20.7 44.0 26.8 140.4 769.4
Bangladesh -10.6 na 7.8 -10.7 -18.8 8.2 27.8 16.5 2.7 -22.3 -9.4 -10.0
Brunei Darussalam 12.7 na -1.9 -1.3 2.5 -9.1 -3.3 4.2 -5.0 -4.9 9.4 -6.2
Cambodia 2.6 na 0.8 0.1 30.4 -6.9 -0.6 -15.0 -23.4 -7.4 -1.6 40.5
China, People's Republic of 25.3 na 44.5 25.8 39.5 54.4 46.6 38.5 29.1 19.8 26.3 28.1
Hong Kong, China 5.0 na 18.0 19.1 9.2 29.6 18.2 15.7 10.0 8.9 27.2 29.0
India -1.2 na 48.9 41.3 55.5 53.0 55.2 36.2 40.0 60.8 45.0 22.8
Indonesia n.a. na 15.7 11.6 8.8 15.4 20.7 17.2 16.3 12.5 7.9 10.6
Iran (Islamic Republic of) 11.1 na 32.0 12.3 -22.6 59.6 76.1 26.8 18.0 -14.7 25.5 26.5
Japan -7.6 na 18.6 2.1 19.1 26.7 24.9 6.0 4.9 -2.0 -0.3 6.2
Korea, Republic of 11.6 na 26.8 14.0 14.0 39.0 31.2 24.3 17.3 8.4 11.5 18.8
Kuwait 26.9 na 42.4 15.4 34.4 17.0 61.9 58.2 -2.7 63.1 14.1 0.5
Laos, People's Democratic Republic 0.4 na 83.6 4.7 92.5 -11.5 82.1 148.3 193.3 41.4 -15.8 -45.6
Malaysia 4.3 na 14.3 8.9 11.4 12.7 19.3 13.6 10.3 6.8 5.8 12.9
Pakistan 8.6 na 17.3 11.3 29.2 7.0 24.3 10.2 -7.8 37.1 6.9 11.3
Philippines -1.7 na 30.3 6.9 38.0 43.7 32.1 12.1 -3.0 4.0 11.9 14.2
Saudi Arabia -8.0 na 33.9 57.3 -9.6 16.0 93.7 65.2 94.2 54.3 25.5 60.9
Sri Lanka 1.0 na 20.2 9.4 17.2 37.3 19.1 10.7 14.4 10.3 -2.2 16.2
Taiwan 2.8 na 28.5 15.9 30.1 42.8 25.4 19.0 5.0 15.6 17.1 24.6
Thailand 6.2 na 20.2 15.4 15.9 22.4 28.0 15.2 13.7 18.4 14.5 15.3
United Arab Emirates 11.0 na 12.7 58.7 33.1 -4.7 15.8 12.6 0.2 68.3 112.4 52.5
Vietnam, Socialist Republic of 2.1 na 29.4 34.3 26.1 12.6 48.4 29.8 19.9 64.4 23.3 33.7
Note: Prior to 2003, data exclude trade with Indonesia. Source: International Enterprise Singapore
Percentage Change Over Corresponding Period Of Previous Year
TOTAL TRADE BY SELECTED MARKET AT CURRENT PRICES - Cont'd [TABLE A6.2]
2004 2005

ECO
NO
MIC
SUR
VEY
OF SIN
GA
POR
E 2005
153
2005
2002 2003 2004 2005 I II III IV I II III IV
America -4.9 na 12.4 8.8 2.7 17.6 24.5 4.8 5.9 0.4 2.5 27.8
Brazil 28.6 na 69.0 59.2 5.4 99.6 99.4 72.4 106.0 16.9 59.0 75.1
Canada 15.2 na 19.0 8.3 17.9 33.6 3.5 25.8 11.5 -6.9 21.0 7.8
United States -7.7 na 11.7 8.0 2.4 16.2 23.3 4.9 6.8 1.0 1.0 24.5
Europe -1.1 na 23.7 5.1 28.0 29.0 21.4 17.6 -4.1 -1.8 6.3 19.5
EU, of which -1.8 na 24.5 4.6 30.3 30.9 20.6 17.6 -5.8 -3.0 5.3 21.3
France -2.5 na 40.8 7.0 89.6 34.9 31.2 16.7 -19.9 -1.1 20.0 37.7
Germany, Federal Republic of -1.5 na 25.2 1.4 16.1 32.0 28.4 24.4 5.1 -2.7 -0.5 3.9
Italy -2.5 na 24.5 5.3 -1.2 14.7 41.7 45.6 35.3 3.9 -2.7 -7.7
Netherlands 8.0 na 20.4 1.4 11.4 44.0 15.9 14.4 1.8 -10.2 -5.6 20.4
Sweden 7.9 na 12.8 2.1 34.1 27.7 -0.5 -2.5 -6.6 2.7 6.6 5.6
United Kingdom -6.7 na 28.7 7.0 57.4 32.5 19.9 12.7 -15.0 0.7 7.5 35.9
Switzerland -12.3 na 12.8 1.2 12.8 11.4 21.3 6.6 4.3 3.0 5.5 -7.7
Oceania 1.2 na 29.2 26.6 8.0 37.1 40.3 32.6 22.4 29.0 22.6 31.6
Australia -0.7 na 25.9 25.5 3.1 38.2 37.8 27.3 17.8 28.2 20.5 34.1
New Zealand 4.5 na 48.6 20.3 60.8 61.4 29.6 45.7 24.6 12.7 30.7 15.4
Africa 7.6 na 26.6 16.5 23.8 25.3 40.5 17.8 12.7 18.1 18.0 16.7
Notes: 1 The European Union (EU) comprises Austria, Belgium, Cyprus, Czech Rep, Denmark, Estonia, Finland,France, Germany, Greece, Hungary, Ireland, Italy, Latvia, Lithuania, Luxembourg, Malta, Netherlands,Poland, Portugal, Slovak Rep, Slovenia, Spain, Sweden and the United Kingdom.
Source: International Enterprise Singapore
2 Prior to 2003, data exclude trade with Indonesia.
Percentage Change Over Corresponding Period Of Previous Year
2004 2005
TOTAL TRADE BY SELECTED MARKET AT CURRENT PRICES - Cont'd [TABLE A6.2]
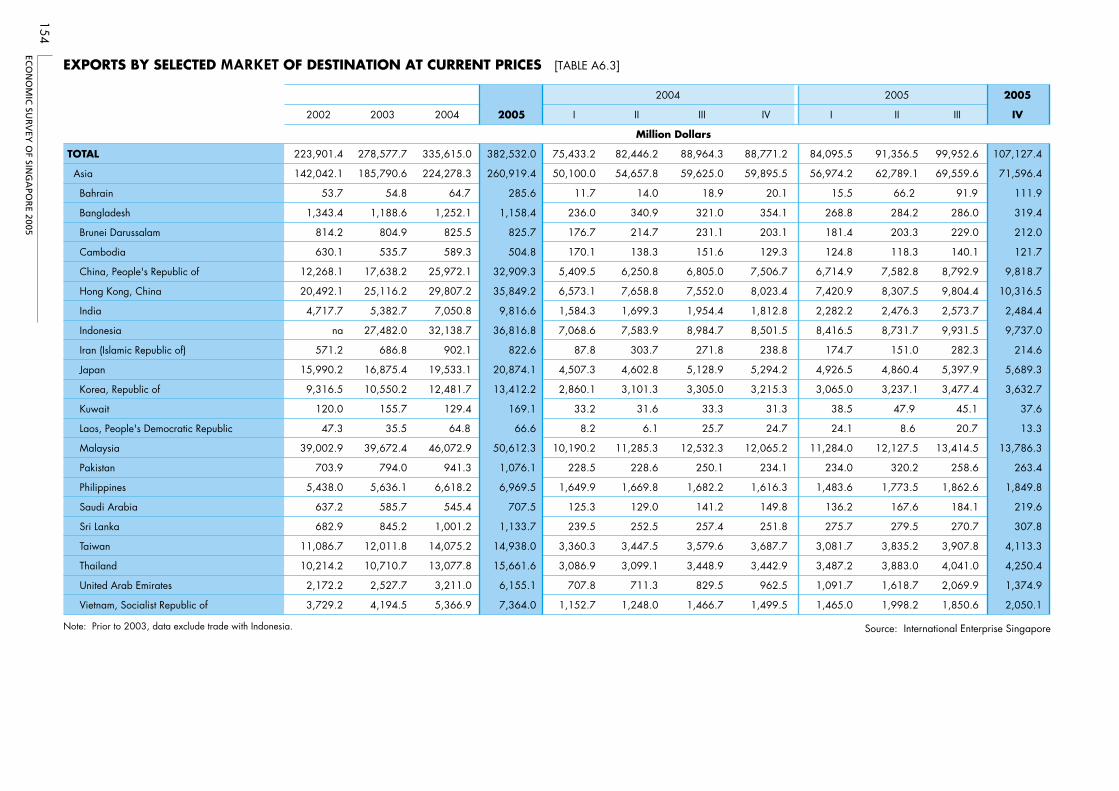
ECO
NO
MIC
SUR
VEY
OF SIN
GA
POR
E 2005
154
2005
2002 2003 2004 2005 I II III IV I II III IV
TOTAL 223,901.4 278,577.7 335,615.0 382,532.0 75,433.2 82,446.2 88,964.3 88,771.2 84,095.5 91,356.5 99,952.6 107,127.4
Asia 142,042.1 185,790.6 224,278.3 260,919.4 50,100.0 54,657.8 59,625.0 59,895.5 56,974.2 62,789.1 69,559.6 71,596.4
Bahrain 53.7 54.8 64.7 285.6 11.7 14.0 18.9 20.1 15.5 66.2 91.9 111.9
Bangladesh 1,343.4 1,188.6 1,252.1 1,158.4 236.0 340.9 321.0 354.1 268.8 284.2 286.0 319.4
Brunei Darussalam 814.2 804.9 825.5 825.7 176.7 214.7 231.1 203.1 181.4 203.3 229.0 212.0
Cambodia 630.1 535.7 589.3 504.8 170.1 138.3 151.6 129.3 124.8 118.3 140.1 121.7
China, People's Republic of 12,268.1 17,638.2 25,972.1 32,909.3 5,409.5 6,250.8 6,805.0 7,506.7 6,714.9 7,582.8 8,792.9 9,818.7
Hong Kong, China 20,492.1 25,116.2 29,807.2 35,849.2 6,573.1 7,658.8 7,552.0 8,023.4 7,420.9 8,307.5 9,804.4 10,316.5
India 4,717.7 5,382.7 7,050.8 9,816.6 1,584.3 1,699.3 1,954.4 1,812.8 2,282.2 2,476.3 2,573.7 2,484.4
Indonesia na 27,482.0 32,138.7 36,816.8 7,068.6 7,583.9 8,984.7 8,501.5 8,416.5 8,731.7 9,931.5 9,737.0
Iran (Islamic Republic of) 571.2 686.8 902.1 822.6 87.8 303.7 271.8 238.8 174.7 151.0 282.3 214.6
Japan 15,990.2 16,875.4 19,533.1 20,874.1 4,507.3 4,602.8 5,128.9 5,294.2 4,926.5 4,860.4 5,397.9 5,689.3
Korea, Republic of 9,316.5 10,550.2 12,481.7 13,412.2 2,860.1 3,101.3 3,305.0 3,215.3 3,065.0 3,237.1 3,477.4 3,632.7
Kuwait 120.0 155.7 129.4 169.1 33.2 31.6 33.3 31.3 38.5 47.9 45.1 37.6
Laos, People's Democratic Republic 47.3 35.5 64.8 66.6 8.2 6.1 25.7 24.7 24.1 8.6 20.7 13.3
Malaysia 39,002.9 39,672.4 46,072.9 50,612.3 10,190.2 11,285.3 12,532.3 12,065.2 11,284.0 12,127.5 13,414.5 13,786.3
Pakistan 703.9 794.0 941.3 1,076.1 228.5 228.6 250.1 234.1 234.0 320.2 258.6 263.4
Philippines 5,438.0 5,636.1 6,618.2 6,969.5 1,649.9 1,669.8 1,682.2 1,616.3 1,483.6 1,773.5 1,862.6 1,849.8
Saudi Arabia 637.2 585.7 545.4 707.5 125.3 129.0 141.2 149.8 136.2 167.6 184.1 219.6
Sri Lanka 682.9 845.2 1,001.2 1,133.7 239.5 252.5 257.4 251.8 275.7 279.5 270.7 307.8
Taiwan 11,086.7 12,011.8 14,075.2 14,938.0 3,360.3 3,447.5 3,579.6 3,687.7 3,081.7 3,835.2 3,907.8 4,113.3
Thailand 10,214.2 10,710.7 13,077.8 15,661.6 3,086.9 3,099.1 3,448.9 3,442.9 3,487.2 3,883.0 4,041.0 4,250.4
United Arab Emirates 2,172.2 2,527.7 3,211.0 6,155.1 707.8 711.3 829.5 962.5 1,091.7 1,618.7 2,069.9 1,374.9
Vietnam, Socialist Republic of 3,729.2 4,194.5 5,366.9 7,364.0 1,152.7 1,248.0 1,466.7 1,499.5 1,465.0 1,998.2 1,850.6 2,050.1
Note: Prior to 2003, data exclude trade with Indonesia. Source: International Enterprise Singapore
Million Dollars
EXPORTS BY SELECTED MARKET OF DESTINATION AT CURRENT PRICES [TABLE A6.3]
2004 2005
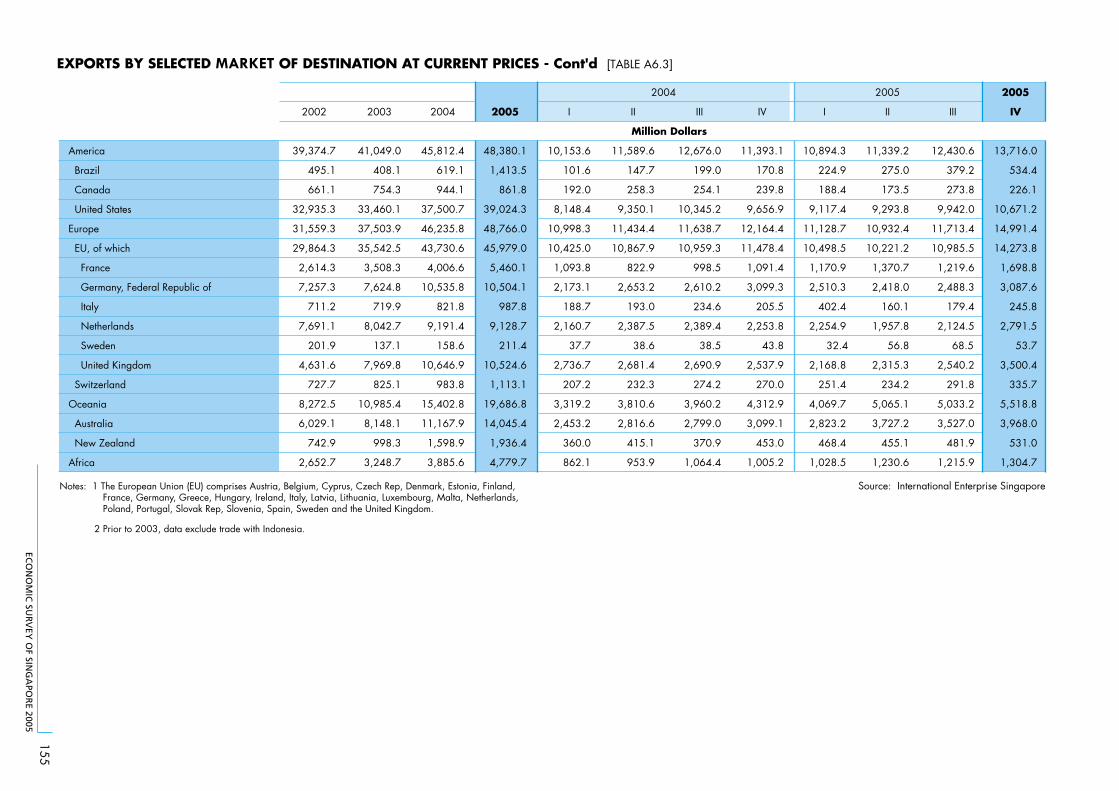
ECO
NO
MIC
SUR
VEY
OF SIN
GA
POR
E 2005
155
2005
2002 2003 2004 2005 I II III IV I II III IV
America 39,374.7 41,049.0 45,812.4 48,380.1 10,153.6 11,589.6 12,676.0 11,393.1 10,894.3 11,339.2 12,430.6 13,716.0
Brazil 495.1 408.1 619.1 1,413.5 101.6 147.7 199.0 170.8 224.9 275.0 379.2 534.4
Canada 661.1 754.3 944.1 861.8 192.0 258.3 254.1 239.8 188.4 173.5 273.8 226.1
United States 32,935.3 33,460.1 37,500.7 39,024.3 8,148.4 9,350.1 10,345.2 9,656.9 9,117.4 9,293.8 9,942.0 10,671.2
Europe 31,559.3 37,503.9 46,235.8 48,766.0 10,998.3 11,434.4 11,638.7 12,164.4 11,128.7 10,932.4 11,713.4 14,991.4
EU, of which 29,864.3 35,542.5 43,730.6 45,979.0 10,425.0 10,867.9 10,959.3 11,478.4 10,498.5 10,221.2 10,985.5 14,273.8
France 2,614.3 3,508.3 4,006.6 5,460.1 1,093.8 822.9 998.5 1,091.4 1,170.9 1,370.7 1,219.6 1,698.8
Germany, Federal Republic of 7,257.3 7,624.8 10,535.8 10,504.1 2,173.1 2,653.2 2,610.2 3,099.3 2,510.3 2,418.0 2,488.3 3,087.6
Italy 711.2 719.9 821.8 987.8 188.7 193.0 234.6 205.5 402.4 160.1 179.4 245.8
Netherlands 7,691.1 8,042.7 9,191.4 9,128.7 2,160.7 2,387.5 2,389.4 2,253.8 2,254.9 1,957.8 2,124.5 2,791.5
Sweden 201.9 137.1 158.6 211.4 37.7 38.6 38.5 43.8 32.4 56.8 68.5 53.7
United Kingdom 4,631.6 7,969.8 10,646.9 10,524.6 2,736.7 2,681.4 2,690.9 2,537.9 2,168.8 2,315.3 2,540.2 3,500.4
Switzerland 727.7 825.1 983.8 1,113.1 207.2 232.3 274.2 270.0 251.4 234.2 291.8 335.7
Oceania 8,272.5 10,985.4 15,402.8 19,686.8 3,319.2 3,810.6 3,960.2 4,312.9 4,069.7 5,065.1 5,033.2 5,518.8
Australia 6,029.1 8,148.1 11,167.9 14,045.4 2,453.2 2,816.6 2,799.0 3,099.1 2,823.2 3,727.2 3,527.0 3,968.0
New Zealand 742.9 998.3 1,598.9 1,936.4 360.0 415.1 370.9 453.0 468.4 455.1 481.9 531.0
Africa 2,652.7 3,248.7 3,885.6 4,779.7 862.1 953.9 1,064.4 1,005.2 1,028.5 1,230.6 1,215.9 1,304.7
Notes: 1 The European Union (EU) comprises Austria, Belgium, Cyprus, Czech Rep, Denmark, Estonia, Finland,France, Germany, Greece, Hungary, Ireland, Italy, Latvia, Lithuania, Luxembourg, Malta, Netherlands,Poland, Portugal, Slovak Rep, Slovenia, Spain, Sweden and the United Kingdom.
Source: International Enterprise Singapore
2 Prior to 2003, data exclude trade with Indonesia.
Million Dollars
EXPORTS BY SELECTED MARKET OF DESTINATION AT CURRENT PRICES - Cont'd [TABLE A6.3]
2004 2005
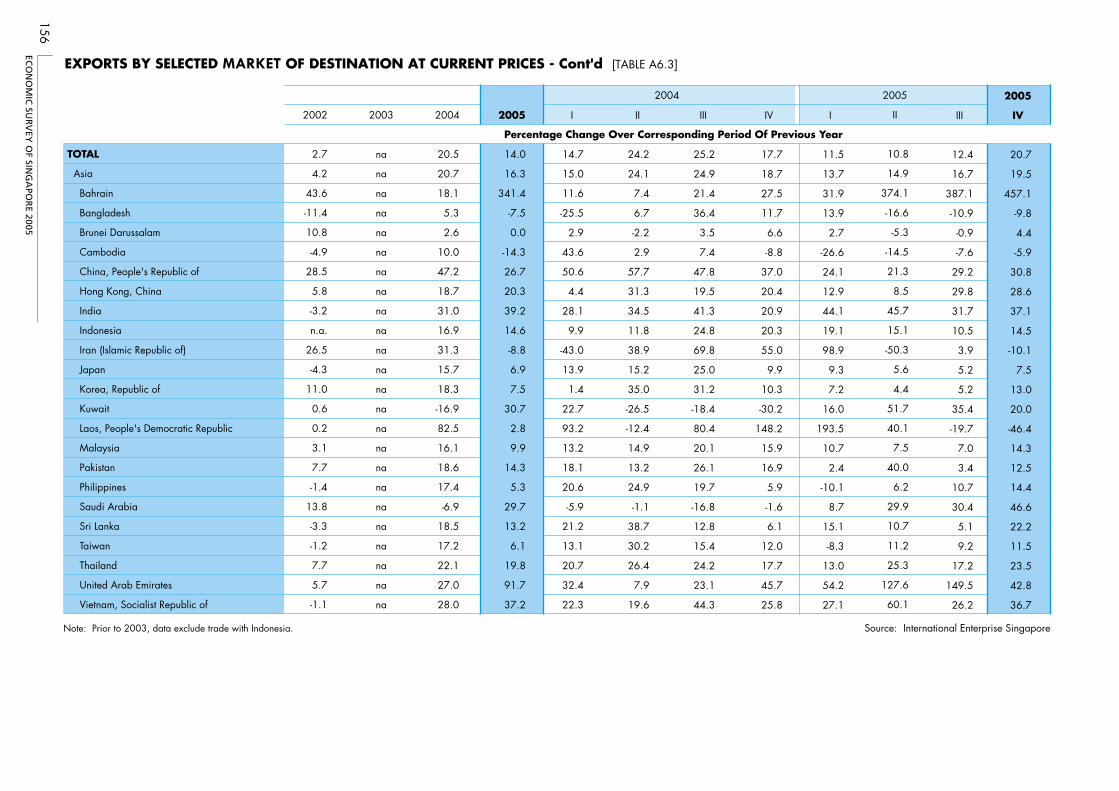
ECO
NO
MIC
SUR
VEY
OF SIN
GA
POR
E 2005
156
TOTAL
Asia
Bahrain
Bangladesh
Brunei Darussalam
Cambodia
China, People's Republic of
Hong Kong, China
India
Indonesia
Iran (Islamic Republic of)
Japan
Korea, Republic of
Kuwait
Laos, People's Democratic Republic
Malaysia
Pakistan
Philippines
Saudi Arabia
Sri Lanka
Taiwan
Thailand
United Arab Emirates
Vietnam, Socialist Republic of
2002
2.7
4.2
43.6
-11.4
10.8
-4.9
28.5
5.8
-3.2
n.a.
26.5
-4.3
11.0
0.6
0.2
3.1
7.7
-1.4
13.8
-3.3
-1.2
7.7
5.7
-1.1
2003
na
na
na
na
na
na
na
na
na
na
na
na
na
na
na
na
na
na
na
na
na
na
na
na
2004
20.5
20.7
18.1
5.3
2.6
10.0
47.2
18.7
31.0
16.9
31.3
15.7
18.3
-16.9
82.5
16.1
18.6
17.4
-6.9
18.5
17.2
22.1
27.0
28.0
2005
14.0
16.3
341.4
-7.5
0.0
-14.3
26.7
20.3
39.2
14.6
-8.8
6.9
7.5
30.7
2.8
9.9
14.3
5.3
29.7
13.2
6.1
19.8
91.7
37.2
I
14.7
15.0
11.6
-25.5
2.9
43.6
50.6
4.4
28.1
9.9
-43.0
13.9
1.4
22.7
93.2
13.2
18.1
20.6
-5.9
21.2
13.1
20.7
32.4
22.3
II
24.2
24.1
7.4
6.7
-2.2
2.9
57.7
31.3
34.5
11.8
38.9
15.2
35.0
-26.5
-12.4
14.9
13.2
24.9
-1.1
38.7
30.2
26.4
7.9
19.6
III
25.2
24.9
21.4
36.4
3.5
7.4
47.8
19.5
41.3
24.8
69.8
25.0
31.2
-18.4
80.4
20.1
26.1
19.7
-16.8
12.8
15.4
24.2
23.1
44.3
IV
17.7
18.7
27.5
11.7
6.6
-8.8
37.0
20.4
20.9
20.3
55.0
9.9
10.3
-30.2
148.2
15.9
16.9
5.9
-1.6
6.1
12.0
17.7
45.7
25.8
I
11.5
13.7
31.9
13.9
2.7
-26.6
24.1
12.9
44.1
19.1
98.9
9.3
7.2
16.0
193.5
10.7
2.4
-10.1
8.7
15.1
-8.3
13.0
54.2
27.1
III
12.4
16.7
387.1
-10.9
-0.9
-7.6
29.2
29.8
31.7
10.5
3.9
5.2
5.2
35.4
-19.7
7.0
3.4
10.7
30.4
5.1
9.2
17.2
149.5
26.2
2005
IV
20.7
19.5
457.1
-9.8
4.4
-5.9
30.8
28.6
37.1
14.5
-10.1
7.5
13.0
20.0
-46.4
14.3
12.5
14.4
46.6
22.2
11.5
23.5
42.8
36.7
Note: Prior to 2003, data exclude trade with Indonesia. Source: International Enterprise Singapore
Percentage Change Over Corresponding Period Of Previous Year
EXPORTS BY SELECTED MARKET OF DESTINATION AT CURRENT PRICES - Cont'd [TABLE A6.3]
2004
II
10.8
14.9
374.1
-16.6
-5.3
-14.5
21.3
8.5
45.7
15.1
-50.3
5.6
4.4
51.7
40.1
7.5
40.0
6.2
29.9
10.7
11.2
25.3
127.6
60.1
2005
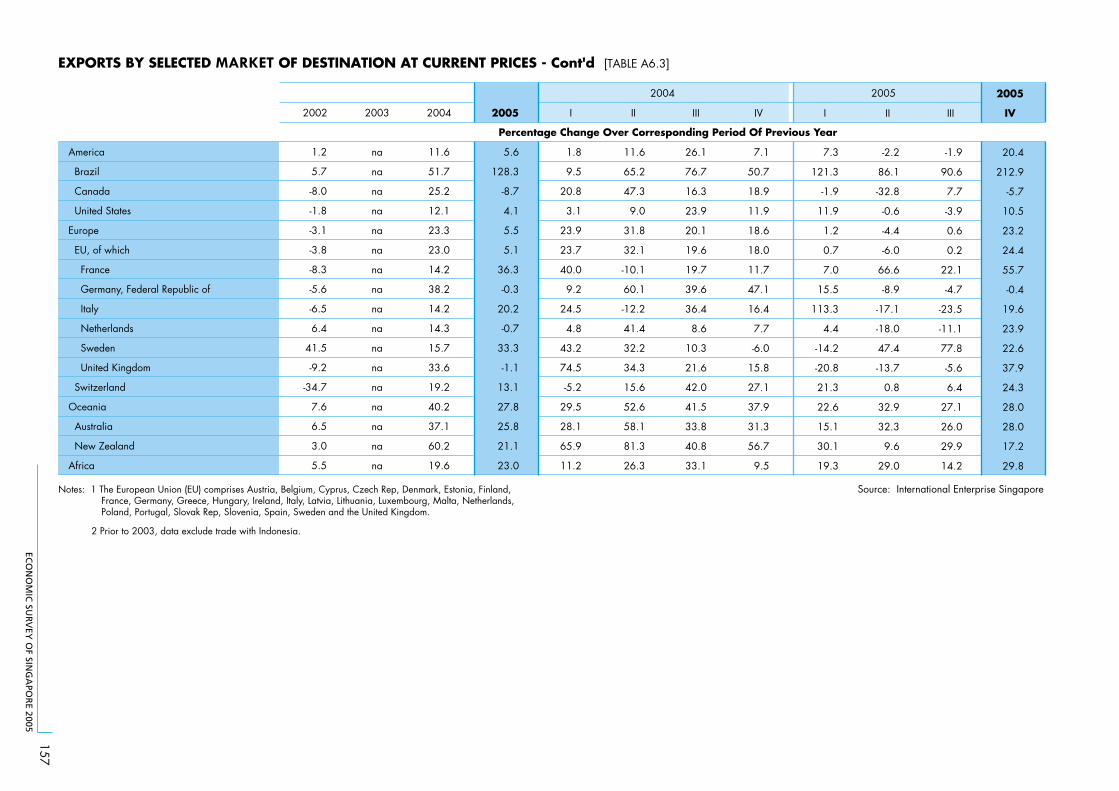
ECO
NO
MIC
SUR
VEY
OF SIN
GA
POR
E 2005
157
America
Brazil
Canada
United States
Europe
EU, of which
France
Germany, Federal Republic of
Italy
Netherlands
Sweden
United Kingdom
Switzerland
Oceania
Australia
New Zealand
Africa
2002
1.2
5.7
-8.0
-1.8
-3.1
-3.8
-8.3
-5.6
-6.5
6.4
41.5
-9.2
-34.7
7.6
6.5
3.0
5.5
2003
na
na
na
na
na
na
na
na
na
na
na
na
na
na
na
na
na
2004
11.6
51.7
25.2
12.1
23.3
23.0
14.2
38.2
14.2
14.3
15.7
33.6
19.2
40.2
37.1
60.2
19.6
2005
5.6
128.3
-8.7
4.1
5.5
5.1
36.3
-0.3
20.2
-0.7
33.3
-1.1
13.1
27.8
25.8
21.1
23.0
I
1.8
9.5
20.8
3.1
23.9
23.7
40.0
9.2
24.5
4.8
43.2
74.5
-5.2
29.5
28.1
65.9
11.2
II
11.6
65.2
47.3
9.0
31.8
32.1
-10.1
60.1
-12.2
41.4
32.2
34.3
15.6
52.6
58.1
81.3
26.3
III
26.1
76.7
16.3
23.9
20.1
19.6
19.7
39.6
36.4
8.6
10.3
21.6
42.0
41.5
33.8
40.8
33.1
IV
7.1
50.7
18.9
11.9
18.6
18.0
11.7
47.1
16.4
7.7
-6.0
15.8
27.1
37.9
31.3
56.7
9.5
I
7.3
121.3
-1.9
11.9
1.2
0.7
7.0
15.5
113.3
4.4
-14.2
-20.8
21.3
22.6
15.1
30.1
19.3
II
-2.2
86.1
-32.8
-0.6
-4.4
-6.0
66.6
-8.9
-17.1
-18.0
47.4
-13.7
0.8
32.9
32.3
9.6
29.0
III
-1.9
90.6
7.7
-3.9
0.6
0.2
22.1
-4.7
-23.5
-11.1
77.8
-5.6
6.4
27.1
26.0
29.9
14.2
2005
IV
20.4
212.9
-5.7
10.5
23.2
24.4
55.7
-0.4
19.6
23.9
22.6
37.9
24.3
28.0
28.0
17.2
29.8
Notes: 1 The European Union (EU) comprises Austria, Belgium, Cyprus, Czech Rep, Denmark, Estonia, Finland,France, Germany, Greece, Hungary, Ireland, Italy, Latvia, Lithuania, Luxembourg, Malta, Netherlands,Poland, Portugal, Slovak Rep, Slovenia, Spain, Sweden and the United Kingdom.
Source: International Enterprise Singapore
2 Prior to 2003, data exclude trade with Indonesia.
Percentage Change Over Corresponding Period Of Previous Year
EXPORTS BY SELECTED MARKET OF DESTINATION AT CURRENT PRICES - Cont'd [TABLE A6.3]
2004 2005
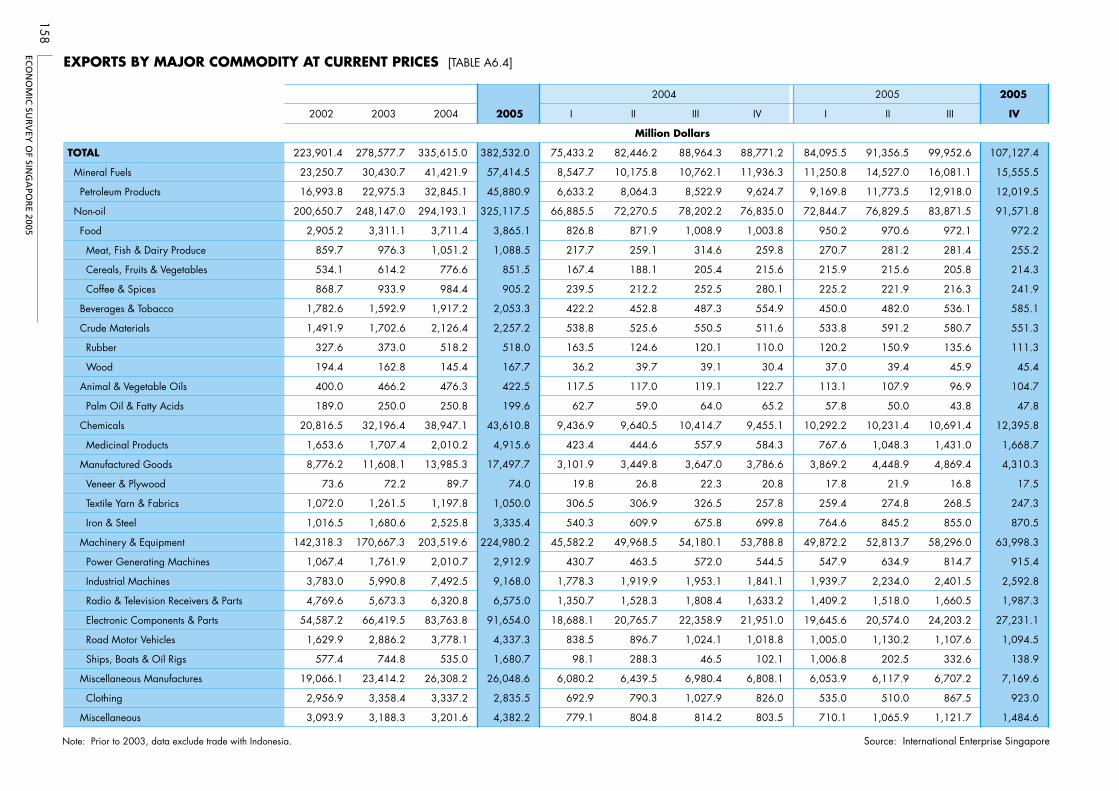
ECO
NO
MIC
SUR
VEY
OF SIN
GA
POR
E 2005
158
2005
2002 2003 2004 2005 I II III IV I II III IV
TOTAL 223,901.4 278,577.7 335,615.0 382,532.0 84,095.5 91,356.5 99,952.6 107,127.4
Mineral Fuels 23,250.7 30,430.7 41,421.9 57,414.5 11,250.8 14,527.0 16,081.1 15,555.5
Petroleum Products 16,993.8 22,975.3 32,845.1 45,880.9 9,169.8 11,773.5 12,918.0 12,019.5
Non-oil 200,650.7 248,147.0 294,193.1 325,117.5 72,844.7 76,829.5 83,871.5 91,571.8
Food 2,905.2 3,311.1 3,711.4 3,865.1 950.2 970.6 972.1 972.2
Meat, Fish & Dairy Produce 859.7 976.3 1,051.2 1,088.5 270.7 281.2 281.4 255.2
Cereals, Fruits & Vegetables 534.1 614.2 776.6 851.5 215.9 215.6 205.8 214.3
Coffee & Spices 868.7 933.9 984.4 905.2 225.2 221.9 216.3 241.9
Beverages & Tobacco 1,782.6 1,592.9 1,917.2 2,053.3 450.0 482.0 536.1 585.1
Crude Materials 1,491.9 1,702.6 2,126.4 2,257.2 533.8 591.2 580.7 551.3
Rubber 327.6 373.0 518.2 518.0 120.2 150.9 135.6 111.3
Wood 194.4 162.8 145.4 167.7 37.0 39.4 45.9 45.4
Animal & Vegetable Oils 400.0 466.2 476.3 422.5 113.1 107.9 96.9 104.7
Palm Oil & Fatty Acids 189.0 250.0 250.8 199.6 57.8 50.0 43.8 47.8
Chemicals 20,816.5 32,196.4 38,947.1 43,610.8 10,292.2 10,231.4 10,691.4 12,395.8
Medicinal Products 1,653.6 1,707.4 2,010.2 4,915.6 767.6 1,048.3 1,431.0 1,668.7
Manufactured Goods 8,776.2 11,608.1 13,985.3 17,497.7 3,869.2 4,448.9 4,869.4 4,310.3
Veneer & Plywood 73.6 72.2 89.7 74.0 17.8 21.9 16.8 17.5
Textile Yarn & Fabrics 1,072.0 1,261.5 1,197.8 1,050.0 259.4 274.8 268.5 247.3
Iron & Steel 1,016.5 1,680.6 2,525.8 3,335.4 764.6 845.2 855.0 870.5
Machinery & Equipment 142,318.3 170,667.3 203,519.6 224,980.2 49,872.2 52,813.7 58,296.0 63,998.3
Power Generating Machines 1,067.4 1,761.9 2,010.7 2,912.9 547.9 634.9 814.7 915.4
Industrial Machines 3,783.0 5,990.8 7,492.5 9,168.0 1,939.7 2,234.0 2,401.5 2,592.8
Radio & Television Receivers & Parts 4,769.6 5,673.3 6,320.8 6,575.0 1,409.2 1,518.0 1,660.5 1,987.3
Electronic Components & Parts 54,587.2 66,419.5 83,763.8 91,654.0 19,645.6 20,574.0 24,203.2 27,231.1
Road Motor Vehicles 1,629.9 2,886.2 3,778.1 4,337.3 1,005.0 1,130.2 1,107.6 1,094.5
Ships, Boats & Oil Rigs 577.4 744.8 535.0 1,680.7 1,006.8 202.5 332.6 138.9
Miscellaneous Manufactures 19,066.1 23,414.2 26,308.2 26,048.6 6,053.9 6,117.9 6,707.2 7,169.6
Clothing 2,956.9 3,358.4 3,337.2 2,835.5 535.0 510.0 867.5 923.0
Miscellaneous 3,093.9 3,188.3 3,201.6 4,382.2
75,433.2
8,547.7
6,633.2
66,885.5
826.8
217.7
167.4
239.5
422.2
538.8
163.5
36.2
117.5
62.7
9,436.9
423.4
3,101.9
19.8
306.5
540.3
45,582.2
430.7
1,778.3
1,350.7
18,688.1
838.5
98.1
6,080.2
692.9
779.1
82,446.2
10,175.8
8,064.3
72,270.5
871.9
259.1
188.1
212.2
452.8
525.6
124.6
39.7
117.0
59.0
9,640.5
444.6
3,449.8
26.8
306.9
609.9
49,968.5
463.5
1,919.9
1,528.3
20,765.7
896.7
288.3
6,439.5
790.3
804.8
88,964.3
10,762.1
8,522.9
78,202.2
1,008.9
314.6
205.4
252.5
487.3
550.5
120.1
39.1
119.1
64.0
10,414.7
557.9
3,647.0
22.3
326.5
675.8
54,180.1
572.0
1,953.1
1,808.4
22,358.9
1,024.1
46.5
6,980.4
1,027.9
814.2
88,771.2
11,936.3
9,624.7
76,835.0
1,003.8
259.8
215.6
280.1
554.9
511.6
110.0
30.4
122.7
65.2
9,455.1
584.3
3,786.6
20.8
257.8
699.8
53,788.8
544.5
1,841.1
1,633.2
21,951.0
1,018.8
102.1
6,808.1
826.0
803.5 710.1 1,065.9 1,121.7 1,484.6
Note: Prior to 2003, data exclude trade with Indonesia. Source: International Enterprise Singapore
Million Dollars
2004 2005
EXPORTS BY MAJOR COMMODITY AT CURRENT PRICES [TABLE A6.4]
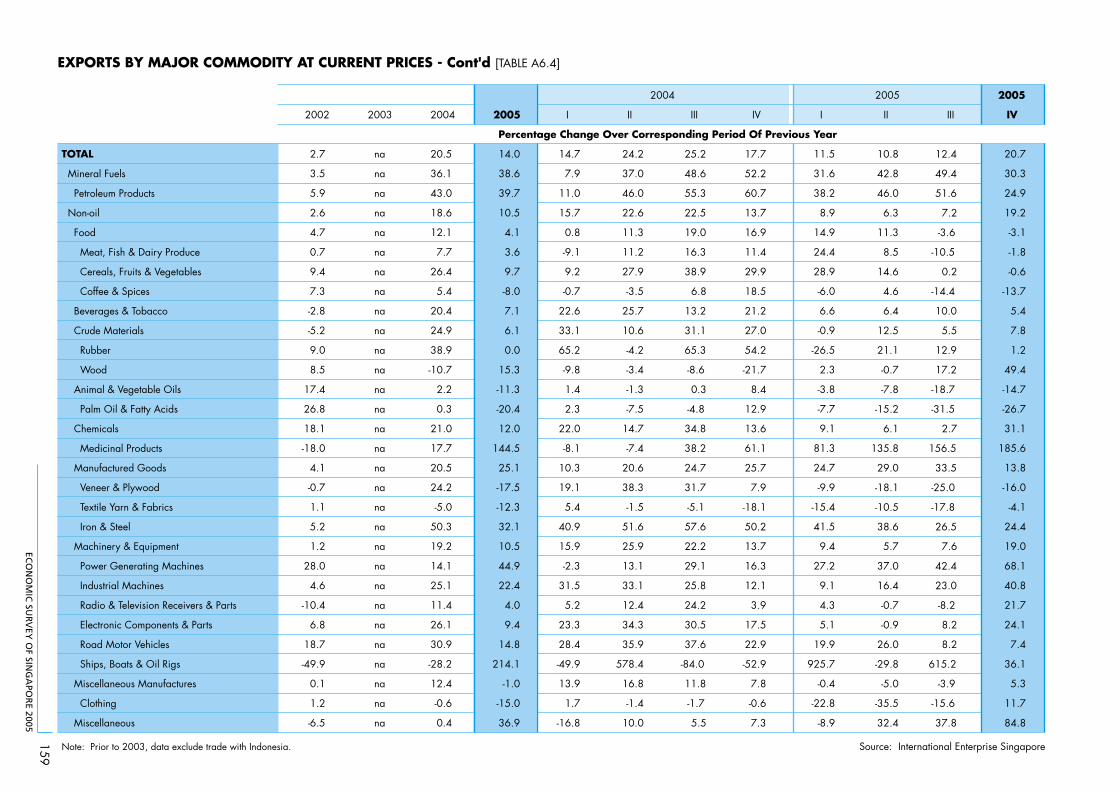
ECO
NO
MIC
SUR
VEY
OF SIN
GA
POR
E 2005
159
2005
2002 2003 2004 2005 I II III IV I II III IV
TOTAL na 11.5 20.7
Mineral Fuels na 31.6 30.3
Petroleum Products na 38.2 24.9
Non-oil na 8.9 19.2
Food na 14.9 -3.1
Meat, Fish & Dairy Produce na 24.4 -1.8
Cereals, Fruits & Vegetables na 28.9 -0.6
Coffee & Spices na -6.0 -13.7
Beverages & Tobacco na 6.6 5.4
Crude Materials na -0.9 7.8
Rubber na -26.5 1.2
Wood na 2.3 49.4
Animal & Vegetable Oils na -3.8 -14.7
Palm Oil & Fatty Acids na -7.7 -26.7
Chemicals na 9.1 31.1
Medicinal Products na 81.3 185.6
Manufactured Goods na 24.7 13.8
Veneer & Plywood na -9.9 -16.0
Textile Yarn & Fabrics na -15.4 -4.1
Iron & Steel na 41.5 24.4
Machinery & Equipment na 9.4 19.0
Power Generating Machines na 27.2 68.1
Industrial Machines na 9.1 40.8
Radio & Television Receivers & Parts na 4.3 21.7
Electronic Components & Parts na 5.1 24.1
Road Motor Vehicles na 19.9 7.4
Ships, Boats & Oil Rigs na 925.7 36.1
Miscellaneous Manufactures na -0.4 5.3
Clothing na -22.8 11.7
Miscellaneous
2.7
3.5
5.9
2.6
4.7
0.7
9.4
7.3
-2.8
-5.2
9.0
8.5
17.4
26.8
18.1
-18.0
4.1
-0.7
1.1
5.2
1.2
28.0
4.6
-10.4
6.8
18.7
-49.9
0.1
1.2
-6.5 na
20.5
36.1
43.0
18.6
12.1
7.7
26.4
5.4
20.4
24.9
38.9
-10.7
2.2
0.3
21.0
17.7
20.5
24.2
-5.0
50.3
19.2
14.1
25.1
11.4
26.1
30.9
-28.2
12.4
-0.6
0.4
14.0
38.6
39.7
10.5
4.1
3.6
9.7
-8.0
7.1
6.1
0.0
15.3
-11.3
-20.4
12.0
144.5
25.1
-17.5
-12.3
32.1
10.5
44.9
22.4
4.0
9.4
14.8
214.1
-1.0
-15.0
36.9
14.7
7.9
11.0
15.7
0.8
-9.1
9.2
-0.7
22.6
33.1
65.2
-9.8
1.4
2.3
22.0
-8.1
10.3
19.1
5.4
40.9
15.9
-2.3
31.5
5.2
23.3
28.4
-49.9
13.9
1.7
-16.8
24.2
37.0
46.0
22.6
11.3
11.2
27.9
-3.5
25.7
10.6
-4.2
-3.4
-1.3
-7.5
14.7
-7.4
20.6
38.3
-1.5
51.6
25.9
13.1
33.1
12.4
34.3
35.9
578.4
16.8
-1.4
10.0
25.2
48.6
55.3
22.5
19.0
16.3
38.9
6.8
13.2
31.1
65.3
-8.6
0.3
-4.8
34.8
38.2
24.7
31.7
-5.1
57.6
22.2
29.1
25.8
24.2
30.5
37.6
-84.0
11.8
-1.7
5.5
17.7
52.2
60.7
13.7
16.9
11.4
29.9
18.5
21.2
27.0
54.2
-21.7
8.4
12.9
13.6
61.1
25.7
7.9
-18.1
50.2
13.7
16.3
12.1
3.9
17.5
22.9
-52.9
7.8
-0.6
7.3 -8.9
10.8
42.8
46.0
6.3
11.3
8.5
14.6
4.6
6.4
12.5
21.1
-0.7
-7.8
-15.2
6.1
135.8
29.0
-18.1
-10.5
38.6
5.7
37.0
16.4
-0.7
-0.9
26.0
-29.8
-5.0
-35.5
32.4
12.4
49.4
51.6
7.2
-3.6
-10.5
0.2
-14.4
10.0
5.5
12.9
17.2
-18.7
-31.5
2.7
156.5
33.5
-25.0
-17.8
26.5
7.6
42.4
23.0
-8.2
8.2
8.2
615.2
-3.9
-15.6
37.8 84.8
Note: Prior to 2003, data exclude trade with Indonesia. Source: International Enterprise Singapore
Percentage Change Over Corresponding Period Of Previous Year
2004 2005
EXPORTS BY MAJOR COMMODITY AT CURRENT PRICES - Cont'd [TABLE A6.4]
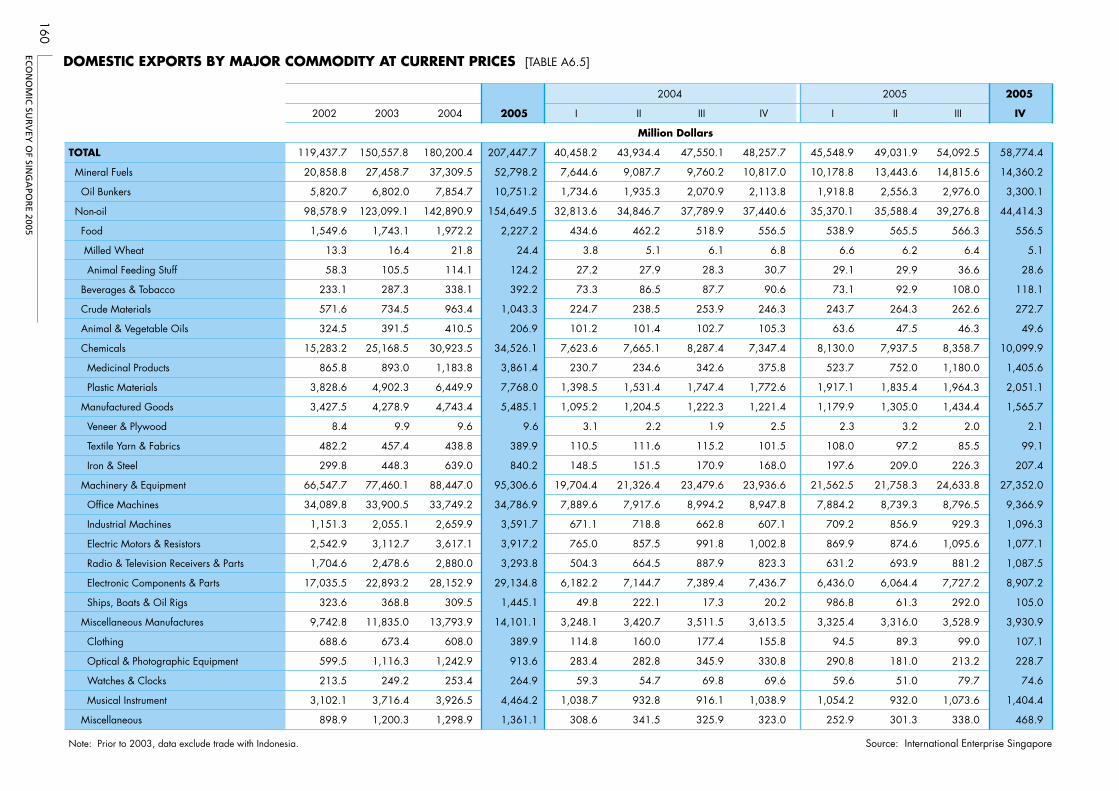
ECO
NO
MIC
SUR
VEY
OF SIN
GA
POR
E 2005
160
2005
2002 2003 2004 2005 I II III IV I II III IV
TOTAL 49,031.9 54,092.5
Mineral Fuels 13,443.6 14,815.6
Oil Bunkers 2,556.3 2,976.0
Non-oil 35,588.4 39,276.8
Food 565.5 566.3
Milled Wheat 6.2 6.4
Animal Feeding Stuff 29.9 36.6
Beverages & Tobacco 92.9 108.0
Crude Materials 264.3 262.6
Animal & Vegetable Oils 47.5 46.3
Chemicals 7,937.5 8,358.7
Medicinal Products 752.0 1,180.0
Plastic Materials 1,835.4 1,964.3
Manufactured Goods 1,305.0 1,434.4
Veneer & Plywood 3.2 2.0
Textile Yarn & Fabrics 97.2 85.5
Iron & Steel 209.0 226.3
Machinery & Equipment 21,758.3 24,633.8
Office Machines 8,739.3 8,796.5
Industrial Machines 856.9 929.3
Electric Motors & Resistors 874.6 1,095.6
Radio & Television Receivers & Parts 693.9 881.2
Electronic Components & Parts 6,064.4 7,727.2
Ships, Boats & Oil Rigs 61.3 292.0
Miscellaneous Manufactures 3,316.0 3,528.9
Clothing 89.3 99.0
Optical & Photographic Equipment 181.0 213.2
Watches & Clocks 51.0 79.7
Musical Instrument 932.0 1,073.6
Miscellaneous
119,437.7
20,858.8
5,820.7
98,578.9
1,549.6
13.3
58.3
233.1
571.6
324.5
15,283.2
865.8
3,828.6
3,427.5
8.4
482.2
299.8
66,547.7
34,089.8
1,151.3
2,542.9
1,704.6
17,035.5
323.6
9,742.8
688.6
599.5
213.5
3,102.1
898.9
150,557.8
27,458.7
6,802.0
123,099.1
1,743.1
16.4
105.5
287.3
734.5
391.5
25,168.5
893.0
4,902.3
4,278.9
9.9
457.4
448.3
77,460.1
33,900.5
2,055.1
3,112.7
2,478.6
22,893.2
368.8
11,835.0
673.4
1,116.3
249.2
3,716.4
1,200.3
180,200.4
37,309.5
7,854.7
142,890.9
1,972.2
21.8
114.1
338.1
963.4
410.5
30,923.5
1,183.8
6,449.9
4,743.4
9.6
438.8
639.0
88,447.0
33,749.2
2,659.9
3,617.1
2,880.0
28,152.9
309.5
13,793.9
608.0
1,242.9
253.4
3,926.5
1,298.9
207,447.7
52,798.2
10,751.2
154,649.5
2,227.2
24.4
124.2
392.2
1,043.3
206.9
34,526.1
3,861.4
7,768.0
5,485.1
9.6
389.9
840.2
95,306.6
34,786.9
3,591.7
3,917.2
3,293.8
29,134.8
1,445.1
14,101.1
389.9
913.6
264.9
4,464.2
1,361.1
40,458.2
7,644.6
1,734.6
32,813.6
434.6
3.8
27.2
73.3
224.7
101.2
7,623.6
230.7
1,398.5
1,095.2
3.1
110.5
148.5
19,704.4
7,889.6
671.1
765.0
504.3
6,182.2
49.8
3,248.1
114.8
283.4
59.3
1,038.7
308.6
43,934.4
9,087.7
1,935.3
34,846.7
462.2
5.1
27.9
86.5
238.5
101.4
7,665.1
234.6
1,531.4
1,204.5
2.2
111.6
151.5
21,326.4
7,917.6
718.8
857.5
664.5
7,144.7
222.1
3,420.7
160.0
282.8
54.7
932.8
341.5
47,550.1
9,760.2
2,070.9
37,789.9
518.9
6.1
28.3
87.7
253.9
102.7
8,287.4
342.6
1,747.4
1,222.3
1.9
115.2
170.9
23,479.6
8,994.2
662.8
991.8
887.9
7,389.4
17.3
3,511.5
177.4
345.9
69.8
916.1
325.9
48,257.7
10,817.0
2,113.8
37,440.6
556.5
6.8
30.7
90.6
246.3
105.3
7,347.4
375.8
1,772.6
1,221.4
2.5
101.5
168.0
23,936.6
8,947.8
607.1
1,002.8
823.3
7,436.7
20.2
3,613.5
155.8
330.8
69.6
1,038.9
323.0
45,548.9
10,178.8
1,918.8
35,370.1
538.9
6.6
29.1
73.1
243.7
63.6
8,130.0
523.7
1,917.1
1,179.9
2.3
108.0
197.6
21,562.5
7,884.2
709.2
869.9
631.2
6,436.0
986.8
3,325.4
94.5
290.8
59.6
1,054.2
252.9 301.3 338.0
58,774.4
14,360.2
3,300.1
44,414.3
556.5
5.1
28.6
118.1
272.7
49.6
10,099.9
1,405.6
2,051.1
1,565.7
2.1
99.1
207.4
27,352.0
9,366.9
1,096.3
1,077.1
1,087.5
8,907.2
105.0
3,930.9
107.1
228.7
74.6
1,404.4
468.9
Note: Prior to 2003, data exclude trade with Indonesia. Source: International Enterprise Singapore
Million Dollars
DOMESTIC EXPORTS BY MAJOR COMMODITY AT CURRENT PRICES [TABLE A6.5]
2004 2005
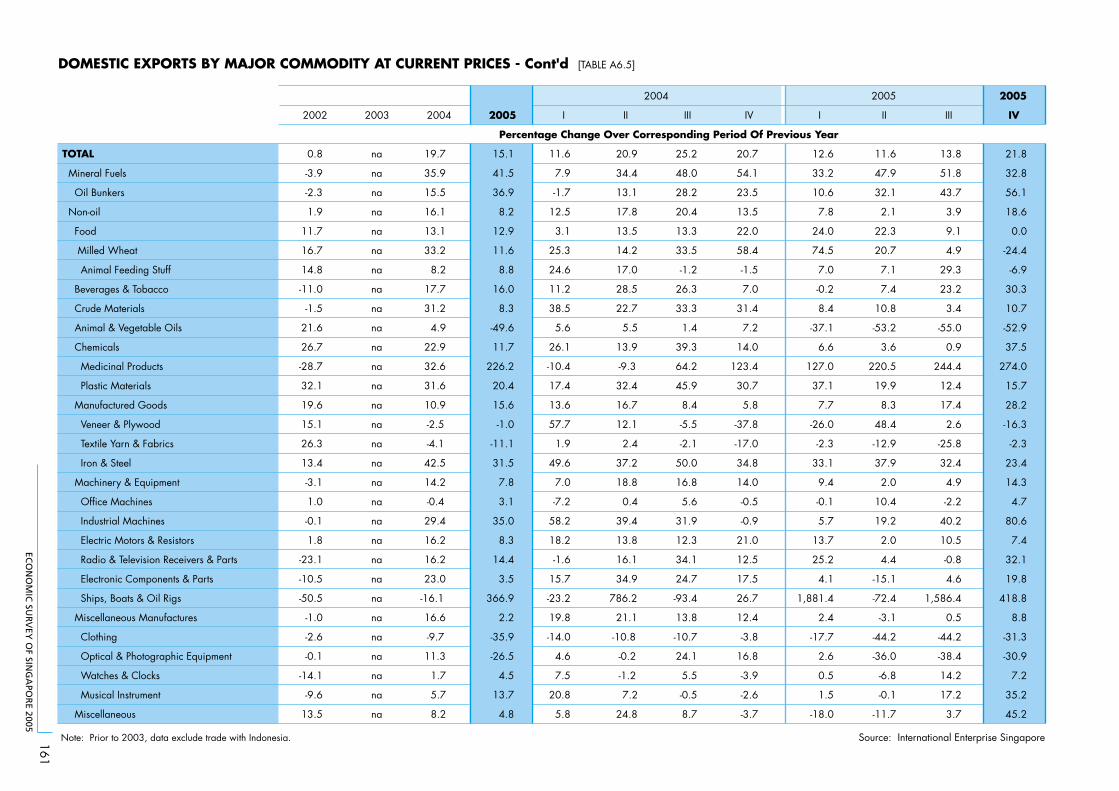
ECO
NO
MIC
SUR
VEY
OF SIN
GA
POR
E 2005
161
DOMESTIC EXPORTS BY MAJOR COMMODITY AT CURRENT PRICES - Cont'd [TABLE A6.5]
2005
2002 2003 2004 2005 I II III IV I II III IV
TOTAL na
Mineral Fuels na
Oil Bunkers na
Non-oil na
Food na
Milled Wheat na
Animal Feeding Stuff na
Beverages & Tobacco na
Crude Materials na
Animal & Vegetable Oils na
Chemicals na
Medicinal Products na
Plastic Materials na
Manufactured Goods na
Veneer & Plywood na
Textile Yarn & Fabrics na
Iron & Steel na
Machinery & Equipment na
Office Machines na
Industrial Machines na
Electric Motors & Resistors na
Radio & Television Receivers & Parts na
Electronic Components & Parts na
Ships, Boats & Oil Rigs na
Miscellaneous Manufactures na
Clothing na
Optical & Photographic Equipment na
Watches & Clocks na
Musical Instrument na
Miscellaneous
0.8
-3.9
-2.3
1.9
11.7
16.7
14.8
-11.0
-1.5
21.6
26.7
-28.7
32.1
19.6
15.1
26.3
13.4
-3.1
1.0
-0.1
1.8
-23.1
-10.5
-50.5
-1.0
-2.6
-0.1
-14.1
-9.6
13.5 na
19.7
35.9
15.5
16.1
13.1
33.2
8.2
17.7
31.2
4.9
22.9
32.6
31.6
10.9
-2.5
-4.1
42.5
14.2
-0.4
29.4
16.2
16.2
23.0
-16.1
16.6
-9.7
11.3
1.7
5.7
8.2
15.1
41.5
36.9
8.2
12.9
11.6
8.8
16.0
8.3
-49.6
11.7
226.2
20.4
15.6
-1.0
-11.1
31.5
7.8
3.1
35.0
8.3
14.4
3.5
366.9
2.2
-35.9
-26.5
4.5
13.7
4.8
11.6
7.9
-1.7
12.5
3.1
25.3
24.6
11.2
38.5
5.6
26.1
-10.4
17.4
13.6
57.7
1.9
49.6
7.0
-7.2
58.2
18.2
-1.6
15.7
-23.2
19.8
-14.0
4.6
7.5
20.8
5.8
20.9
34.4
13.1
17.8
13.5
14.2
17.0
28.5
22.7
5.5
13.9
-9.3
32.4
16.7
12.1
2.4
37.2
18.8
0.4
39.4
13.8
16.1
34.9
786.2
21.1
-10.8
-0.2
-1.2
7.2
24.8
25.2
48.0
28.2
20.4
13.3
33.5
-1.2
26.3
33.3
1.4
39.3
64.2
45.9
8.4
-5.5
-2.1
50.0
16.8
5.6
31.9
12.3
34.1
24.7
-93.4
13.8
-10.7
24.1
5.5
-0.5
8.7
20.7
54.1
23.5
13.5
22.0
58.4
-1.5
7.0
31.4
7.2
14.0
123.4
30.7
5.8
-37.8
-17.0
34.8
14.0
-0.5
-0.9
21.0
12.5
17.5
26.7
12.4
-3.8
16.8
-3.9
-2.6
-3.7
12.6
33.2
10.6
7.8
24.0
74.5
7.0
-0.2
8.4
-37.1
6.6
127.0
37.1
7.7
-26.0
-2.3
33.1
9.4
-0.1
5.7
13.7
25.2
4.1
1,881.4
2.4
-17.7
2.6
0.5
1.5
-18.0
11.6
47.9
32.1
2.1
22.3
20.7
7.1
7.4
10.8
-53.2
3.6
220.5
19.9
8.3
48.4
-12.9
37.9
2.0
10.4
19.2
2.0
4.4
-15.1
-72.4
-3.1
-44.2
-36.0
-6.8
-0.1
-11.7
13.8
51.8
43.7
3.9
9.1
4.9
29.3
23.2
3.4
-55.0
0.9
244.4
12.4
17.4
2.6
-25.8
32.4
4.9
-2.2
40.2
10.5
-0.8
4.6
1,586.4
0.5
-44.2
-38.4
14.2
17.2
3.7
21.8
32.8
56.1
18.6
0.0
-24.4
-6.9
30.3
10.7
-52.9
37.5
274.0
15.7
28.2
-16.3
-2.3
23.4
14.3
4.7
80.6
7.4
32.1
19.8
418.8
8.8
-31.3
-30.9
7.2
35.2
45.2
Note: Prior to 2003, data exclude trade with Indonesia. Source: International Enterprise Singapore
Percentage Change Over Corresponding Period Of Previous Year
2004 2005
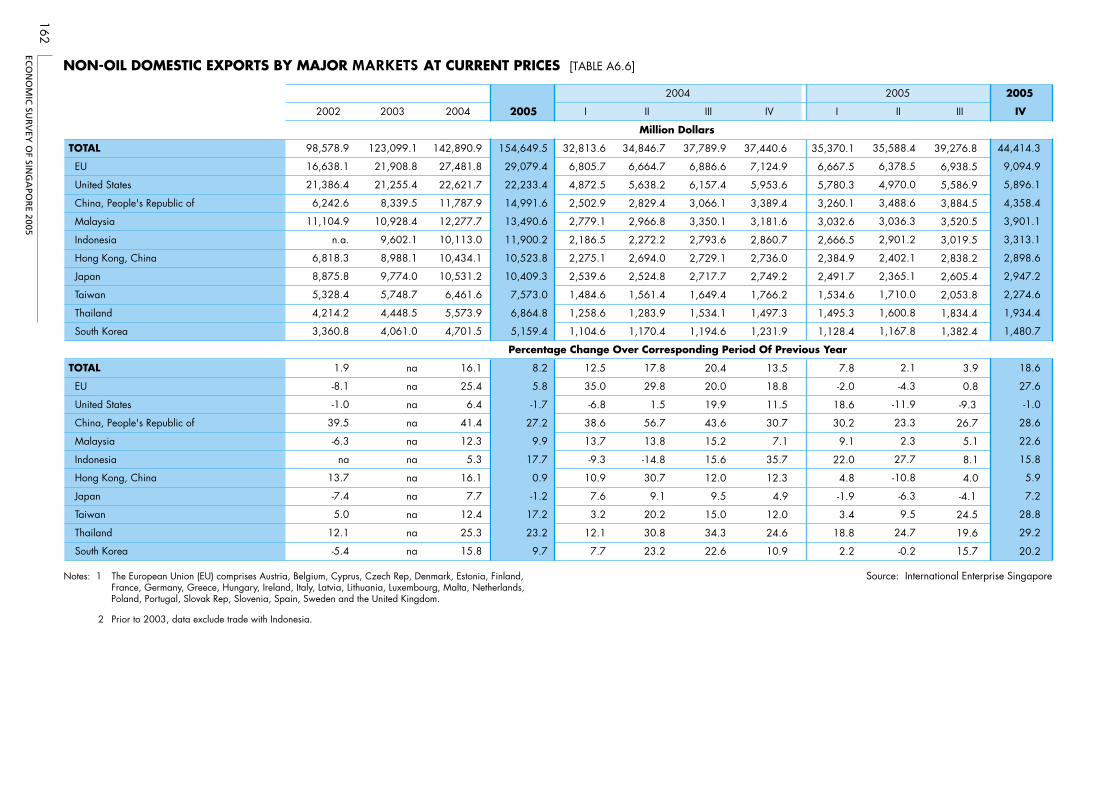
ECO
NO
MIC
SUR
VEY
OF SIN
GA
POR
E 2005
162
2005
2002 2003 2004 2005 I II III IV I II III IV
TOTAL 98,578.9 35,588.4 44,414.3
EU 16,638.1 6,378.5 9,094.9
United States 21,386.4 4,970.0 5,896.1
China, People's Republic of 6,242.6 3,488.6 4,358.4
Malaysia 11,104.9 3,036.3 3,901.1
Indonesia n.a. 2,901.2 3,313.1
Hong Kong, China 6,818.3 2,402.1 2,898.6
Japan 8,875.8 2,365.1 2,947.2
Taiwan 5,328.4 1,710.0 2,274.6
Thailand 4,214.2 1,600.8 1,934.4
South Korea 3,360.8 1,167.8 1,480.7
TOTAL 1.9 2.1 18.6
EU -8.1 -4.3 27.6
United States -1.0 -11.9 -1.0
China, People's Republic of 39.5 23.3 28.6
Malaysia -6.3 2.3 22.6
Indonesia na 27.7 15.8
Hong Kong, China 13.7 -10.8 5.9
Japan -7.4 -6.3 7.2
Taiwan 5.0 9.5 28.8
Thailand 12.1 24.7 29.2
South Korea -5.4
123,099.1
21,908.8
21,255.4
8,339.5
10,928.4
9,602.1
8,988.1
9,774.0
5,748.7
4,448.5
4,061.0
na
na
na
na
na
na
na
na
na
na
na
142,890.9
27,481.8
22,621.7
11,787.9
12,277.7
10,113.0
10,434.1
10,531.2
6,461.6
5,573.9
4,701.5
16.1
25.4
6.4
41.4
12.3
5.3
16.1
7.7
12.4
25.3
15.8
154,649.5
29,079.4
22,233.4
14,991.6
13,490.6
11,900.2
10,523.8
10,409.3
7,573.0
6,864.8
5,159.4
8.2
5.8
-1.7
27.2
9.9
17.7
0.9
-1.2
17.2
23.2
9.7
32,813.6
6,805.7
4,872.5
2,502.9
2,779.1
2,186.5
2,275.1
2,539.6
1,484.6
1,258.6
1,104.6
12.5
35.0
-6.8
38.6
13.7
-9.3
10.9
7.6
3.2
12.1
7.7
34,846.7
6,664.7
5,638.2
2,829.4
2,966.8
2,272.2
2,694.0
2,524.8
1,561.4
1,283.9
1,170.4
17.8
29.8
1.5
56.7
13.8
-14.8
30.7
9.1
20.2
30.8
23.2
37,789.9
6,886.6
6,157.4
3,066.1
3,350.1
2,793.6
2,729.1
2,717.7
1,649.4
1,534.1
1,194.6
20.4
20.0
19.9
43.6
15.2
15.6
12.0
9.5
15.0
34.3
22.6
37,440.6
7,124.9
5,953.6
3,389.4
3,181.6
2,860.7
2,736.0
2,749.2
1,766.2
1,497.3
1,231.9
13.5
18.8
11.5
30.7
7.1
35.7
12.3
4.9
12.0
24.6
10.9
35,370.1
6,667.5
5,780.3
3,260.1
3,032.6
2,666.5
2,384.9
2,491.7
1,534.6
1,495.3
1,128.4
7.8
-2.0
18.6
30.2
9.1
22.0
4.8
-1.9
3.4
18.8
2.2 -0.2
39,276.8
6,938.5
5,586.9
3,884.5
3,520.5
3,019.5
2,838.2
2,605.4
2,053.8
1,834.4
1,382.4
3.9
0.8
-9.3
26.7
5.1
8.1
4.0
-4.1
24.5
19.6
15.7 20.2
Notes: 1 The European Union (EU) comprises Austria, Belgium, Cyprus, Czech Rep, Denmark, Estonia, Finland,France, Germany, Greece, Hungary, Ireland, Italy, Latvia, Lithuania, Luxembourg, Malta, Netherlands,Poland, Portugal, Slovak Rep, Slovenia, Spain, Sweden and the United Kingdom.
Source: International Enterprise Singapore
2 Prior to 2003, data exclude trade with Indonesia.
NON-OIL DOMESTIC EXPORTS BY MAJOR MARKETS AT CURRENT PRICES [TABLE A6.6]
Percentage Change Over Corresponding Period Of Previous Year
2004 2005
Million Dollars
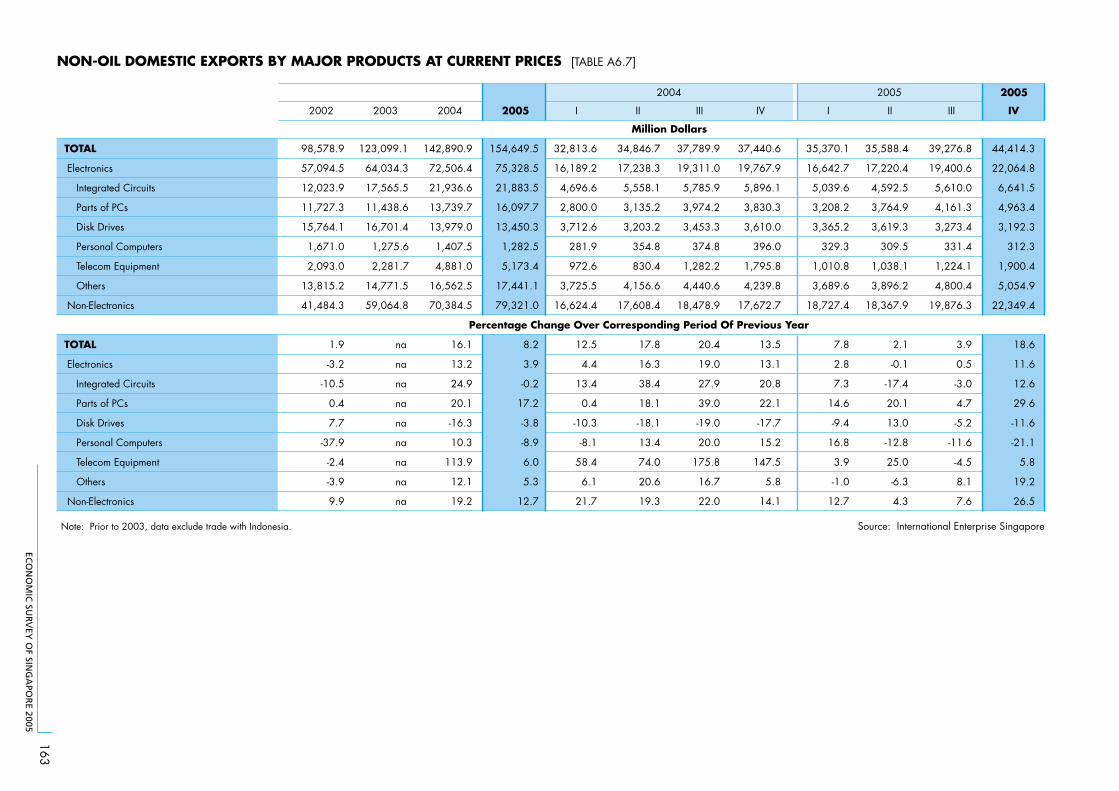
ECO
NO
MIC
SUR
VEY
OF SIN
GA
POR
E 2005
163
NON-OIL DOMESTIC EXPORTS BY MAJOR PRODUCTS AT CURRENT PRICES [TABLE A6.7]
2005
2002 2003 2004 2005 I II III IV I II III IV
TOTAL 37,440.6 35,370.1 35,588.4 44,414.3
Electronics 19,767.9 16,642.7 17,220.4 22,064.8
Integrated Circuits 5,896.1 5,039.6 4,592.5 6,641.5
Parts of PCs 3,830.3 3,208.2 3,764.9 4,963.4
Disk Drives 3,610.0 3,365.2 3,619.3 3,192.3
Personal Computers 396.0 329.3 309.5 312.3
Telecom Equipment 1,795.8 1,010.8 1,038.1 1,900.4
Others 4,239.8 3,689.6 3,896.2 5,054.9
Non-Electronics 17,672.7 18,727.4 18,367.9 22,349.4
TOTAL 13.5 7.8 2.1 18.6
Electronics 13.1 2.8 -0.1 11.6
Integrated Circuits 20.8 7.3 -17.4 12.6
Parts of PCs 22.1 14.6 20.1 29.6
Disk Drives -17.7 -9.4 13.0 -11.6
Personal Computers 15.2 16.8 -12.8 -21.1
Telecom Equipment 147.5 3.9 25.0 5.8
Others 5.8 -1.0 -6.3 19.2
Non-Electronics
98,578.9
57,094.5
12,023.9
11,727.3
15,764.1
1,671.0
2,093.0
13,815.2
41,484.3
1.9
-3.2
-10.5
0.4
7.7
-37.9
-2.4
-3.9
9.9
123,099.1
64,034.3
17,565.5
11,438.6
16,701.4
1,275.6
2,281.7
14,771.5
59,064.8
na
na
na
na
na
na
na
na
na
142,890.9
72,506.4
21,936.6
13,739.7
13,979.0
1,407.5
4,881.0
16,562.5
70,384.5
16.1
13.2
24.9
20.1
-16.3
10.3
113.9
12.1
19.2
154,649.5
75,328.5
21,883.5
16,097.7
13,450.3
1,282.5
5,173.4
17,441.1
79,321.0
8.2
3.9
-0.2
17.2
-3.8
-8.9
6.0
5.3
12.7
32,813.6
16,189.2
4,696.6
2,800.0
3,712.6
281.9
972.6
3,725.5
16,624.4
12.5
4.4
13.4
0.4
-10.3
-8.1
58.4
6.1
21.7
34,846.7
17,238.3
5,558.1
3,135.2
3,203.2
354.8
830.4
4,156.6
17,608.4
17.8
16.3
38.4
18.1
-18.1
13.4
74.0
20.6
19.3
37,789.9
19,311.0
5,785.9
3,974.2
3,453.3
374.8
1,282.2
4,440.6
18,478.9
20.4
19.0
27.9
39.0
-19.0
20.0
175.8
16.7
22.0 14.1 12.7 4.3
39,276.8
19,400.6
5,610.0
4,161.3
3,273.4
331.4
1,224.1
4,800.4
19,876.3
3.9
0.5
-3.0
4.7
-5.2
-11.6
-4.5
8.1
7.6 26.5
Note: Prior to 2003, data exclude trade with Indonesia. Source: International Enterprise Singapore
Percentage Change Over Corresponding Period Of Previous Year
2004 2005
Million Dollars
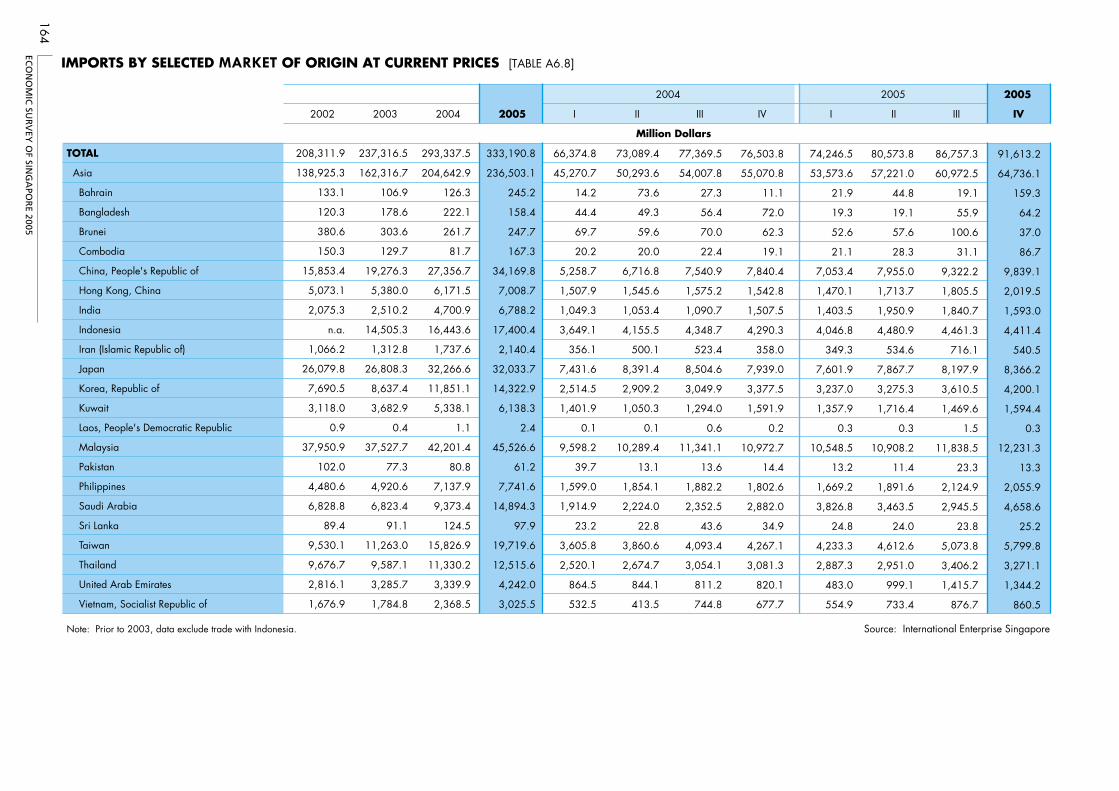
ECO
NO
MIC
SUR
VEY
OF SIN
GA
POR
E 2005
164
2005
2002 2003 2004 2005 I II III IV I II III IV
TOTAL
Asia
Bahrain
Bangladesh
Brunei
Combodia
China, People's Republic of
Hong Kong, China
India
Indonesia
Iran (Islamic Republic of)
Japan
Korea, Republic of
Kuwait
Laos, People's Democratic Republic
Malaysia
Pakistan
Philippines
Saudi Arabia
Sri Lanka
Taiwan
Thailand
United Arab Emirates
Vietnam, Socialist Republic of
208,311.9
138,925.3
133.1
120.3
380.6
150.3
15,853.4
5,073.1
2,075.3
n.a.
1,066.2
26,079.8
7,690.5
3,118.0
0.9
37,950.9
102.0
4,480.6
6,828.8
89.4
9,530.1
9,676.7
2,816.1
1,676.9
237,316.5
162,316.7
106.9
178.6
303.6
129.7
19,276.3
5,380.0
2,510.2
14,505.3
1,312.8
26,808.3
8,637.4
3,682.9
0.4
37,527.7
77.3
4,920.6
6,823.4
91.1
11,263.0
9,587.1
3,285.7
1,784.8
293,337.5
204,642.9
126.3
222.1
261.7
81.7
27,356.7
6,171.5
4,700.9
16,443.6
1,737.6
32,266.6
11,851.1
5,338.1
1.1
42,201.4
80.8
7,137.9
9,373.4
124.5
15,826.9
11,330.2
3,339.9
2,368.5
333,190.8
236,503.1
245.2
158.4
247.7
167.3
34,169.8
7,008.7
6,788.2
17,400.4
2,140.4
32,033.7
14,322.9
6,138.3
2.4
45,526.6
61.2
7,741.6
14,894.3
97.9
19,719.6
12,515.6
4,242.0
3,025.5
66,374.8
45,270.7
14.2
44.4
69.7
20.2
5,258.7
1,507.9
1,049.3
3,649.1
356.1
7,431.6
2,514.5
1,401.9
0.1
9,598.2
39.7
1,599.0
1,914.9
23.2
3,605.8
2,520.1
864.5
532.5
73,089.4
50,293.6
73.6
49.3
59.6
20.0
6,716.8
1,545.6
1,053.4
4,155.5
500.1
8,391.4
2,909.2
1,050.3
0.1
10,289.4
13.1
1,854.1
2,224.0
22.8
3,860.6
2,674.7
844.1
413.5
77,369.5
54,007.8
27.3
56.4
70.0
22.4
7,540.9
1,575.2
1,090.7
4,348.7
523.4
8,504.6
3,049.9
1,294.0
0.6
11,341.1
13.6
1,882.2
2,352.5
43.6
4,093.4
3,054.1
811.2
744.8
76,503.8
55,070.8
11.1
72.0
62.3
19.1
7,840.4
1,542.8
1,507.5
4,290.3
358.0
7,939.0
3,377.5
1,591.9
0.2
10,972.7
14.4
1,802.6
2,882.0
34.9
4,267.1
3,081.3
820.1
677.7
74,246.5
53,573.6
21.9
19.3
52.6
21.1
7,053.4
1,470.1
1,403.5
4,046.8
349.3
7,601.9
3,237.0
1,357.9
0.3
10,548.5
13.2
1,669.2
3,826.8
24.8
4,233.3
2,887.3
483.0
554.9
80,573.8
57,221.0
44.8
19.1
57.6
28.3
7,955.0
1,713.7
1,950.9
4,480.9
534.6
7,867.7
3,275.3
1,716.4
0.3
10,908.2
11.4
1,891.6
3,463.5
24.0
4,612.6
2,951.0
999.1
733.4
86,757.3
60,972.5
19.1
55.9
100.6
31.1
9,322.2
1,805.5
1,840.7
4,461.3
716.1
8,197.9
3,610.5
1,469.6
1.5
11,838.5
23.3
2,124.9
2,945.5
23.8
5,073.8
3,406.2
1,415.7
876.7
91,613.2
64,736.1
159.3
64.2
37.0
86.7
9,839.1
2,019.5
1,593.0
4,411.4
540.5
8,366.2
4,200.1
1,594.4
0.3
12,231.3
13.3
2,055.9
4,658.6
25.2
5,799.8
3,271.1
1,344.2
860.5
Note: Prior to 2003, data exclude trade with Indonesia. Source: International Enterprise Singapore
Million Dollars
IMPORTS BY SELECTED MARKET OF ORIGIN AT CURRENT PRICES [TABLE A6.8]
2004 2005
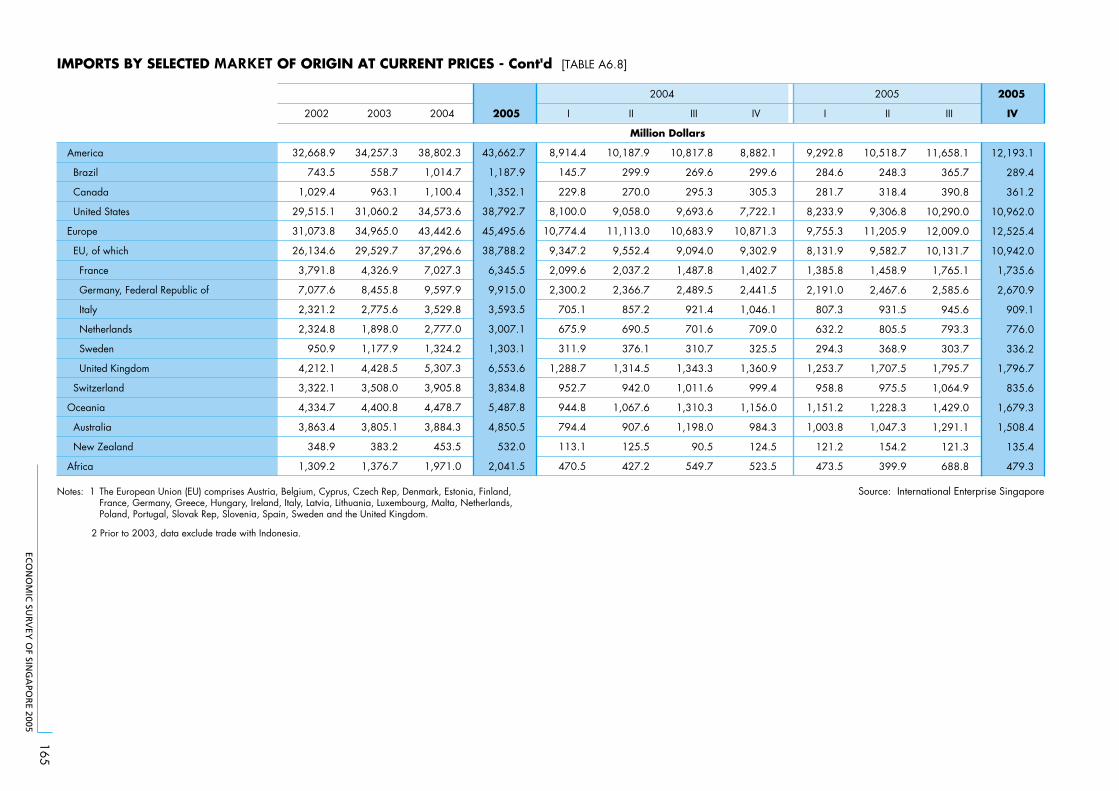
ECO
NO
MIC
SUR
VEY
OF SIN
GA
POR
E 2005
165
2005
2002 2003 2004 2005 I II III IV I II III IV
America
Brazil
Canada
United States
Europe
EU, of which
France
Germany, Federal Republic of
Italy
Netherlands
Sweden
United Kingdom
Switzerland
Oceania
Australia
New Zealand
Africa
32,668.9
743.5
1,029.4
29,515.1
31,073.8
26,134.6
3,791.8
7,077.6
2,321.2
2,324.8
950.9
4,212.1
3,322.1
4,334.7
3,863.4
348.9
1,309.2
34,257.3
558.7
963.1
31,060.2
34,965.0
29,529.7
4,326.9
8,455.8
2,775.6
1,898.0
1,177.9
4,428.5
3,508.0
4,400.8
3,805.1
383.2
1,376.7
38,802.3
1,014.7
1,100.4
34,573.6
43,442.6
37,296.6
7,027.3
9,597.9
3,529.8
2,777.0
1,324.2
5,307.3
3,905.8
4,478.7
3,884.3
453.5
1,971.0
43,662.7
1,187.9
1,352.1
38,792.7
45,495.6
38,788.2
6,345.5
9,915.0
3,593.5
3,007.1
1,303.1
6,553.6
3,834.8
5,487.8
4,850.5
532.0
2,041.5
8,914.4
145.7
229.8
8,100.0
10,774.4
9,347.2
2,099.6
2,300.2
705.1
675.9
311.9
1,288.7
952.7
944.8
794.4
113.1
470.5
10,187.9
299.9
270.0
9,058.0
11,113.0
9,552.4
2,037.2
2,366.7
857.2
690.5
376.1
1,314.5
942.0
1,067.6
907.6
125.5
427.2
10,817.8
269.6
295.3
9,693.6
10,683.9
9,094.0
1,487.8
2,489.5
921.4
701.6
310.7
1,343.3
1,011.6
1,310.3
1,198.0
90.5
549.7
8,882.1
299.6
305.3
7,722.1
10,871.3
9,302.9
1,402.7
2,441.5
1,046.1
709.0
325.5
1,360.9
999.4
1,156.0
984.3
124.5
523.5
9,292.8
284.6
281.7
8,233.9
9,755.3
8,131.9
1,385.8
2,191.0
807.3
632.2
294.3
1,253.7
958.8
1,151.2
1,003.8
121.2
473.5
10,518.7
248.3
318.4
9,306.8
11,205.9
9,582.7
1,458.9
2,467.6
931.5
805.5
368.9
1,707.5
975.5
1,228.3
1,047.3
154.2
399.9
11,658.1
365.7
390.8
10,290.0
12,009.0
10,131.7
1,765.1
2,585.6
945.6
793.3
303.7
1,795.7
1,064.9
1,429.0
1,291.1
121.3
688.8
12,193.1
289.4
361.2
10,962.0
12,525.4
10,942.0
1,735.6
2,670.9
909.1
776.0
336.2
1,796.7
835.6
1,679.3
1,508.4
135.4
479.3
Notes: 1 The European Union (EU) comprises Austria, Belgium, Cyprus, Czech Rep, Denmark, Estonia, Finland,France, Germany, Greece, Hungary, Ireland, Italy, Latvia, Lithuania, Luxembourg, Malta, Netherlands,Poland, Portugal, Slovak Rep, Slovenia, Spain, Sweden and the United Kingdom.
Source: International Enterprise Singapore
2 Prior to 2003, data exclude trade with Indonesia.
Million Dollars
IMPORTS BY SELECTED MARKET OF ORIGIN AT CURRENT PRICES - Cont'd [TABLE A6.8]
2004 2005
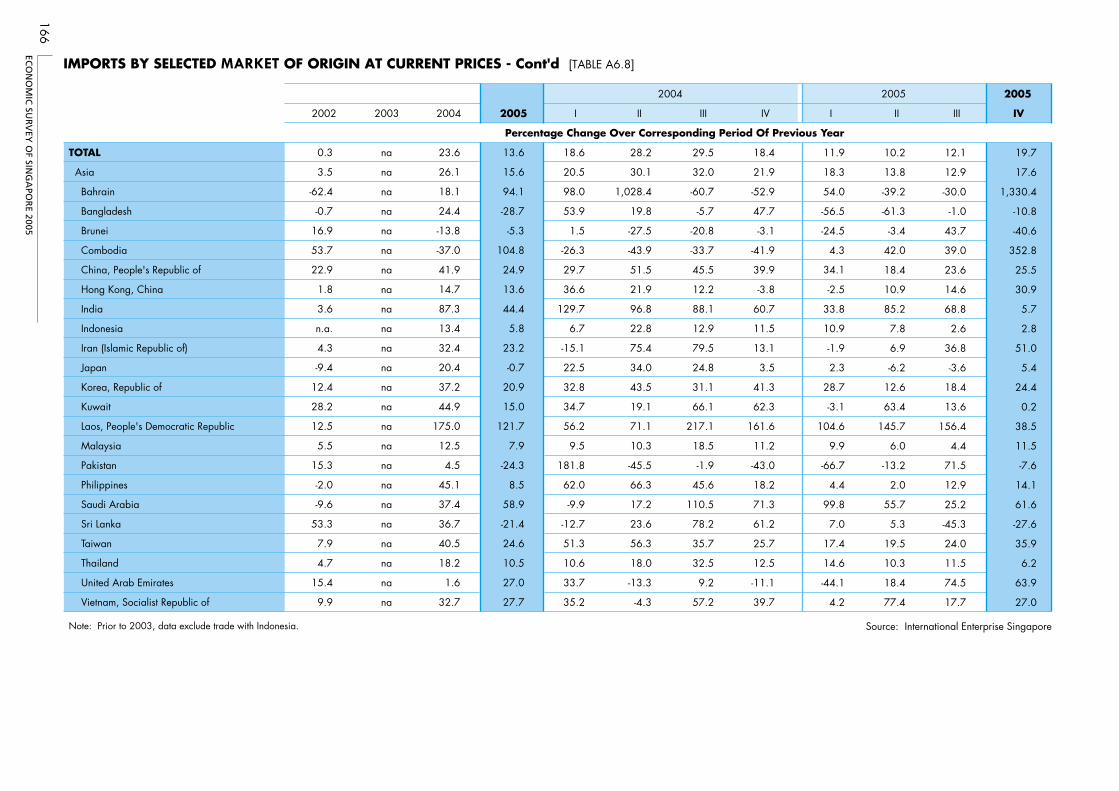
ECO
NO
MIC
SUR
VEY
OF SIN
GA
POR
E 2005
166
2005
2002 2003 2004 2005 I II III IV I II III IV
TOTAL na
Asia na
Bahrain na
Bangladesh na
Brunei na
Combodia na
China, People's Republic of na 34.1
Hong Kong, China na
India na
Indonesia na
Iran (Islamic Republic of) na
Japan na
Korea, Republic of na
Kuwait na
Laos, People's Democratic Republic na
Malaysia na
Pakistan na
Philippines na
Saudi Arabia na
Sri Lanka na
Taiwan na
Thailand na
United Arab Emirates na
Vietnam, Socialist Republic of
0.3
3.5
-62.4
-0.7
16.9
53.7
22.9
1.8
3.6
n.a.
4.3
-9.4
12.4
28.2
12.5
5.5
15.3
-2.0
-9.6
53.3
7.9
4.7
15.4
9.9 na
23.6
26.1
18.1
24.4
-13.8
-37.0
41.9
14.7
87.3
13.4
32.4
20.4
37.2
44.9
175.0
12.5
4.5
45.1
37.4
36.7
40.5
18.2
1.6
32.7
13.6
15.6
94.1
-28.7
-5.3
104.8
24.9
13.6
44.4
5.8
23.2
-0.7
20.9
15.0
121.7
7.9
-24.3
8.5
58.9
-21.4
24.6
10.5
27.0
27.7
18.6
20.5
98.0
53.9
1.5
-26.3
29.7
36.6
129.7
6.7
-15.1
22.5
32.8
34.7
56.2
9.5
181.8
62.0
-9.9
-12.7
51.3
10.6
33.7
35.2
28.2
30.1
1,028.4
19.8
-27.5
-43.9
51.5
21.9
96.8
22.8
75.4
34.0
43.5
19.1
71.1
10.3
-45.5
66.3
17.2
23.6
56.3
18.0
-13.3
-4.3
29.5
32.0
-60.7
-5.7
-20.8
-33.7
45.5
12.2
88.1
12.9
79.5
24.8
31.1
66.1
217.1
18.5
-1.9
45.6
110.5
78.2
35.7
32.5
9.2
57.2
18.4
21.9
-52.9
47.7
-3.1
-41.9
39.9
-3.8
60.7
11.5
13.1
3.5
41.3
62.3
161.6
11.2
-43.0
18.2
71.3
61.2
25.7
12.5
-11.1
39.7
11.9
18.3
54.0
-56.5
-24.5
4.3
-2.5
33.8
10.9
-1.9
2.3
28.7
-3.1
104.6
9.9
-66.7
4.4
99.8
7.0
17.4
14.6
-44.1
4.2
10.2
13.8
-39.2
-61.3
-3.4
42.0
18.4
10.9
85.2
7.8
6.9
-6.2
12.6
63.4
145.7
6.0
-13.2
2.0
55.7
5.3
19.5
10.3
18.4
77.4
12.1
12.9
-30.0
-1.0
43.7
39.0
23.6
14.6
68.8
2.6
36.8
-3.6
18.4
13.6
156.4
4.4
71.5
12.9
25.2
-45.3
24.0
11.5
74.5
17.7
19.7
17.6
1,330.4
-10.8
-40.6
352.8
25.5
30.9
5.7
2.8
51.0
5.4
24.4
0.2
38.5
11.5
-7.6
14.1
61.6
-27.6
35.9
6.2
63.9
27.0
Note: Prior to 2003, data exclude trade with Indonesia.
Percentage Change Over Corresponding Period Of Previous Year
2004 2005
IMPORTS BY SELECTED MARKET OF ORIGIN AT CURRENT PRICES - Cont'd [TABLE A6.8]
Source: International Enterprise Singapore

ECO
NO
MIC
SUR
VEY
OF SIN
GA
POR
E 2005
167
IMPORTS BY SELECTED MARKET OF ORIGIN AT CURRENT PRICES - Cont'd [TABLE A6.8]
2005
2002 2003 2004 2005 I II III IV I II III IV
America na
Brazil na
Canada na
United States na
Europe na
EU, of which na
France na
Germany, Federal Republic of na
Italy na
Netherlands na
Sweden na
United Kingdom na
Switzerland na
Oceania na
Australia na
New Zealand na
Africa
-11.4
50.3
37.5
-13.5
1.2
0.6
1.9
3.1
-1.2
13.6
2.7
-3.7
-5.1
-9.2
-10.3
8.0
12.3 na
13.3
81.6
14.3
11.3
24.2
26.3
62.4
13.5
27.2
46.3
12.4
19.8
11.3
1.8
2.1
18.3
43.2
12.5
17.1
22.9
12.2
4.7
4.0
-9.7
3.3
1.8
8.3
-1.6
23.5
-1.8
22.5
24.9
17.3
3.6
3.7
2.7
15.6
1.8
32.4
38.5
132.7
23.6
-6.3
39.3
33.1
30.2
17.7
-31.8
-35.8
46.5
56.2
25.2
122.4
22.7
24.7
26.3
29.5
69.2
10.3
23.2
53.9
27.3
29.0
10.5
0.7
-0.5
18.4
23.0
22.7
120.3
-5.5
22.6
22.9
21.8
40.2
18.5
43.1
50.2
-1.6
16.6
16.7
36.8
48.1
-2.4
57.7
2.0
87.7
31.8
-2.7
16.5
17.2
21.0
4.0
53.1
42.6
-2.0
7.3
2.1
16.0
16.1
15.9
37.9
4.2
95.3
22.6
1.7
-9.5
-13.0
-34.0
-4.7
14.5
-6.5
-5.7
-2.7
0.6
21.9
26.4
7.2
0.6
3.2
-17.2
17.9
2.7
0.8
0.3
-28.4
4.3
8.7
16.7
-1.9
29.9
3.6
15.1
15.4
22.8
-6.4
7.8
35.6
32.3
6.2
12.4
11.4
18.6
3.9
2.6
13.1
-2.3
33.7
5.3
9.1
7.8
34.1
25.3
37.3
-3.4
18.3
42.0
15.2
17.6
23.7
9.4
-13.1
9.5
3.3
32.0
-16.4
45.3
53.2
8.8
-8.4
Notes: 1 The European Union (EU) comprises Austria, Belgium, Cyprus, Czech Rep, Denmark, Estonia, Finland,France, Germany, Greece, Hungary, Ireland, Italy, Latvia, Lithuania, Luxembourg, Malta, Netherlands,Poland, Portugal, Slovak Rep, Slovenia, Spain, Sweden and the United Kingdom.
Source: International Enterprise Singapore
2 Prior to 2003, data exclude trade with Indonesia.
Percentage Change Over Corresponding Period Of Previous Year
2004 2005
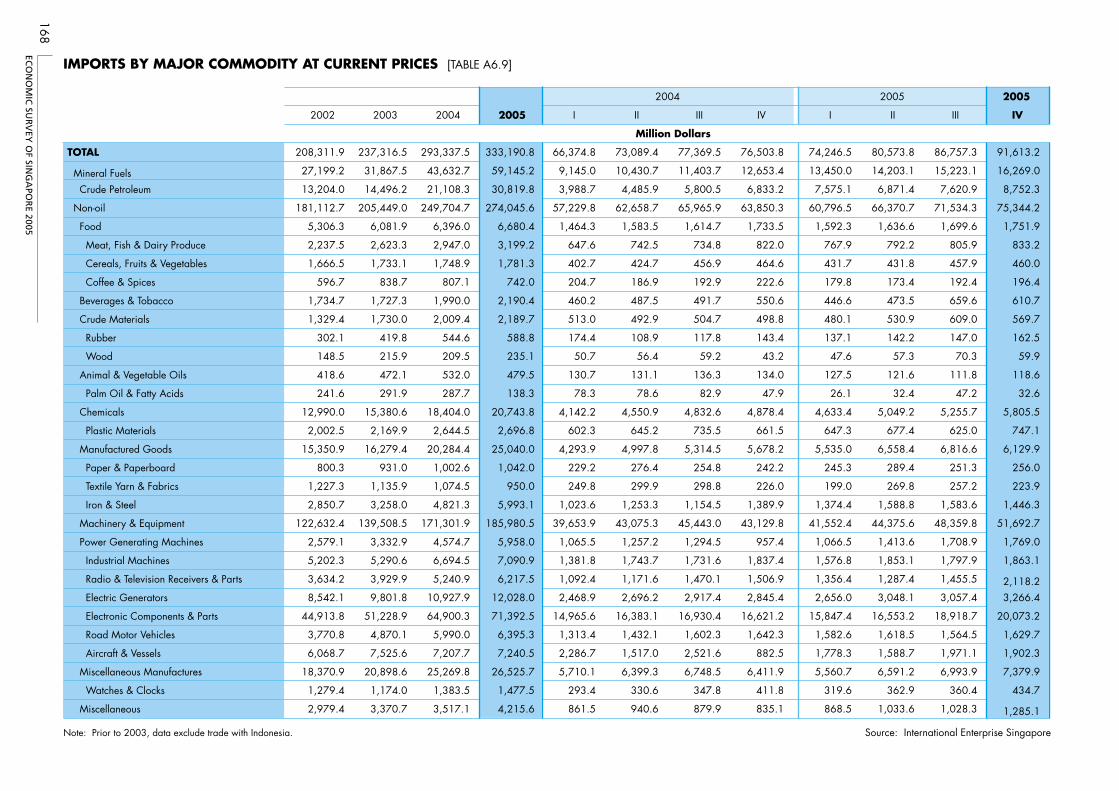
ECO
NO
MIC
SUR
VEY
OF SIN
GA
POR
E 2005
168
2005
2002 2003 2004 2005 I II III IV I II III IV
TOTAL
Mineral Fuels Crude Petroleum
Non-oil
Food
Meat, Fish & Dairy Produce
Cereals, Fruits & Vegetables
Coffee & Spices
Beverages & Tobacco
Crude Materials
Rubber
Wood
Animal & Vegetable Oils
Palm Oil & Fatty Acids
Chemicals
Plastic Materials
Manufactured Goods
Paper & Paperboard
Textile Yarn & Fabrics
Iron & Steel
Machinery & Equipment
Power Generating Machines
Industrial Machines
Radio & Television Receivers & Parts
Electric Generators
Electronic Components & Parts
Road Motor Vehicles
Aircraft & Vessels
Miscellaneous Manufactures
Watches & Clocks
Miscellaneous
208,311.9
27,199.2
13,204.0
181,112.7
5,306.3
2,237.5
1,666.5
596.7
1,734.7
1,329.4
302.1
148.5
418.6
241.6
12,990.0
2,002.5
15,350.9
800.3
1,227.3
2,850.7
122,632.4
2,579.1
5,202.3
3,634.2
8,542.1
44,913.8
3,770.8
6,068.7
18,370.9
1,279.4
2,979.4
237,316.5
31,867.5
14,496.2
205,449.0
6,081.9
2,623.3
1,733.1
838.7
1,727.3
1,730.0
419.8
215.9
472.1
291.9
15,380.6
2,169.9
16,279.4
931.0
1,135.9
3,258.0
139,508.5
3,332.9
5,290.6
3,929.9
9,801.8
51,228.9
4,870.1
7,525.6
20,898.6
1,174.0
3,370.7
293,337.5
43,632.7
21,108.3
249,704.7
6,396.0
2,947.0
1,748.9
807.1
1,990.0
2,009.4
544.6
209.5
532.0
287.7
18,404.0
2,644.5
20,284.4
1,002.6
1,074.5
4,821.3
171,301.9
4,574.7
6,694.5
5,240.9
10,927.9
64,900.3
5,990.0
7,207.7
25,269.8
1,383.5
3,517.1
333,190.8
59,145.2
30,819.8
274,045.6
6,680.4
3,199.2
1,781.3
742.0
2,190.4
2,189.7
588.8
235.1
479.5
138.3
20,743.8
2,696.8
25,040.0
1,042.0
950.0
5,993.1
185,980.5
5,958.0
7,090.9
6,217.5
12,028.0
71,392.5
6,395.3
7,240.5
26,525.7
1,477.5
4,215.6
66,374.8
9,145.0
3,988.7
57,229.8
1,464.3
647.6
402.7
204.7
460.2
513.0
174.4
50.7
130.7
78.3
4,142.2
602.3
4,293.9
229.2
249.8
1,023.6
39,653.9
1,065.5
1,381.8
1,092.4
2,468.9
14,965.6
1,313.4
2,286.7
5,710.1
293.4
861.5
73,089.4
10,430.7
4,485.9
62,658.7
1,583.5
742.5
424.7
186.9
487.5
492.9
108.9
56.4
131.1
78.6
4,550.9
645.2
4,997.8
276.4
299.9
1,253.3
43,075.3
1,257.2
1,743.7
1,171.6
2,696.2
16,383.1
1,432.1
1,517.0
6,399.3
330.6
940.6
77,369.5
11,403.7
5,800.5
65,965.9
1,614.7
734.8
456.9
192.9
491.7
504.7
117.8
59.2
136.3
82.9
4,832.6
735.5
5,314.5
254.8
298.8
1,154.5
45,443.0
1,294.5
1,731.6
1,470.1
2,917.4
16,930.4
1,602.3
2,521.6
6,748.5
347.8
879.9
76,503.8
12,653.4
6,833.2
63,850.3
1,733.5
822.0
464.6
222.6
550.6
498.8
143.4
43.2
134.0
47.9
4,878.4
661.5
5,678.2
242.2
226.0
1,389.9
43,129.8
957.4
1,837.4
1,506.9
2,845.4
16,621.2
1,642.3
882.5
6,411.9
411.8
835.1
74,246.5
13,450.0
7,575.1
60,796.5
1,592.3
767.9
431.7
179.8
446.6
480.1
137.1
47.6
127.5
26.1
4,633.4
647.3
5,535.0
245.3
199.0
1,374.4
41,552.4
1,066.5
1,576.8
1,356.4
2,656.0
15,847.4
1,582.6
1,778.3
5,560.7
319.6
868.5
80,573.8
14,203.1
6,871.4
66,370.7
1,636.6
792.2
431.8
173.4
473.5
530.9
142.2
57.3
121.6
32.4
5,049.2
677.4
6,558.4
289.4
269.8
1,588.8
44,375.6
1,413.6
1,853.1
1,287.4
3,048.1
16,553.2
1,618.5
1,588.7
6,591.2
362.9
1,033.6
86,757.3
15,223.1
7,620.9
71,534.3
1,699.6
805.9
457.9
192.4
659.6
609.0
147.0
70.3
111.8
47.2
5,255.7
625.0
6,816.6
251.3
257.2
1,583.6
48,359.8
1,708.9
1,797.9
1,455.5
3,057.4
18,918.7
1,564.5
1,971.1
6,993.9
360.4
1,028.3
91,613.2
16,269.0
8,752.3
75,344.2
1,751.9
833.2
460.0
196.4
610.7
569.7
162.5
59.9
118.6
32.6
5,805.5
747.1
6,129.9
256.0
223.9
1,446.3
51,692.7
1,769.0
1,863.1
2,118.23,266.4
20,073.2
1,629.7
1,902.3
7,379.9
434.7
1,285.1
Note: Prior to 2003, data exclude trade with Indonesia. Source: International Enterprise Singapore
Million Dollars
IMPORTS BY MAJOR COMMODITY AT CURRENT PRICES [TABLE A6.9]
2004 2005
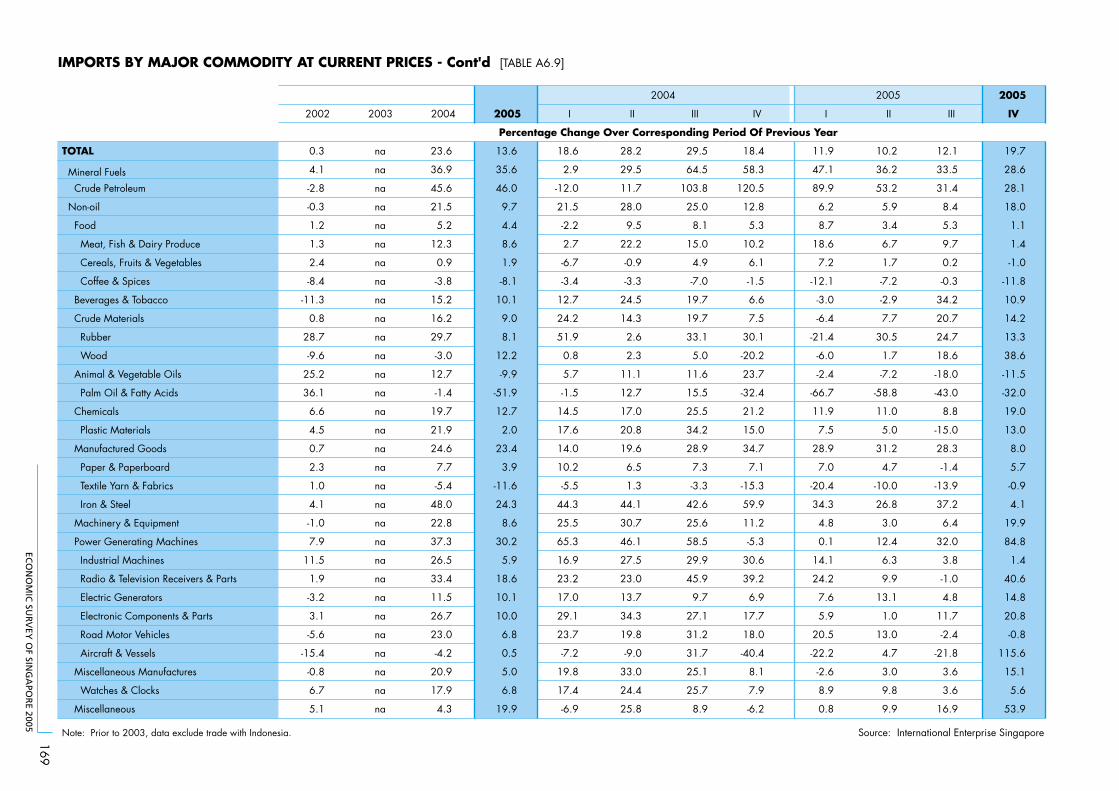
ECO
NO
MIC
SUR
VEY
OF SIN
GA
POR
E 2005
169
2005
2002 2003 2004 2005 I II III IV I II III IV
TOTAL na 13.6 28.2 18.4 10.2
Mineral Fuels na 35.6 29.5 58.3 36.2
Crude Petroleum na 46.0 11.7 120.5 53.2
Non-oil na 9.7 28.0 12.8 5.9
Food na 4.4 9.5 5.3 3.4
Meat, Fish & Dairy Produce na 8.6 22.2 10.2 6.7
Cereals, Fruits & Vegetables na 1.9 -0.9 6.1 1.7
Coffee & Spices na -8.1 -3.3 -1.5 -7.2
Beverages & Tobacco na 10.1 24.5 6.6 -2.9
Crude Materials na 9.0 14.3 7.5 7.7
Rubber na 8.1 2.6 30.1 30.5
Wood na 12.2 2.3 -20.2 1.7
Animal & Vegetable Oils na -9.9 11.1 23.7 -7.2
Palm Oil & Fatty Acids na -51.9 12.7 -32.4 -58.8
Chemicals na 12.7 17.0 21.2 11.0
Plastic Materials na 2.0 20.8 15.0 5.0
Manufactured Goods na 23.4 19.6 34.7 31.2
Paper & Paperboard na 3.9 6.5 7.1 4.7
Textile Yarn & Fabrics na -11.6 1.3 -15.3 -10.0
Iron & Steel na 24.3 44.1 59.9 26.8
Machinery & Equipment na 8.6 30.7 11.2 3.0
Power Generating Machines na 30.2 46.1 -5.3 12.4
Industrial Machines na 5.9 27.5 30.6 6.3
Radio & Television Receivers & Parts na 18.6 23.0 39.2 9.9
Electric Generators na 10.1 13.7 6.9 13.1
Electronic Components & Parts na 10.0 34.3 17.7 1.0
Road Motor Vehicles na 6.8 19.8 18.0 13.0
Aircraft & Vessels na 0.5 -9.0 -40.4 4.7
Miscellaneous Manufactures na 5.0 33.0 8.1 3.0
Watches & Clocks na 6.8 24.4 7.9 9.8
Miscellaneous
0.3
4.1
-2.8
-0.3
1.2
1.3
2.4
-8.4
-11.3
0.8
28.7
-9.6
25.2
36.1
6.6
4.5
0.7
2.3
1.0
4.1
-1.0
7.9
11.5
1.9
-3.2
3.1
-5.6
-15.4
-0.8
6.7
5.1 na
23.6
36.9
45.6
21.5
5.2
12.3
0.9
-3.8
15.2
16.2
29.7
-3.0
12.7
-1.4
19.7
21.9
24.6
7.7
-5.4
48.0
22.8
37.3
26.5
33.4
11.5
26.7
23.0
-4.2
20.9
17.9
4.3 19.9
18.6
2.9
-12.0
21.5
-2.2
2.7
-6.7
-3.4
12.7
24.2
51.9
0.8
5.7
-1.5
14.5
17.6
14.0
10.2
-5.5
44.3
25.5
65.3
16.9
23.2
17.0
29.1
23.7
-7.2
19.8
17.4
-6.9 25.8
29.5
64.5
103.8
25.0
8.1
15.0
4.9
-7.0
19.7
19.7
33.1
5.0
11.6
15.5
25.5
34.2
28.9
7.3
-3.3
42.6
25.6
58.5
29.9
45.9
9.7
27.1
31.2
31.7
25.1
25.7
8.9 -6.2
11.9
47.1
89.9
6.2
8.7
18.6
7.2
-12.1
-3.0
-6.4
-21.4
-6.0
-2.4
-66.7
11.9
7.5
28.9
7.0
-20.4
34.3
4.8
0.1
14.1
24.2
7.6
5.9
20.5
-22.2
-2.6
8.9
0.8 9.9
12.1
33.5
31.4
8.4
5.3
9.7
0.2
-0.3
34.2
20.7
24.7
18.6
-18.0
-43.0
8.8
-15.0
28.3
-1.4
-13.9
37.2
6.4
32.0
3.8
-1.0
4.8
11.7
-2.4
-21.8
3.6
3.6
16.9
19.7
28.6
28.1
18.0
1.1
1.4
-1.0
-11.8
10.9
14.2
13.3
38.6
-11.5
-32.0
19.0
13.0
8.0
5.7
-0.9
4.1
19.9
84.8
1.4
40.6
14.8
20.8
-0.8
115.6
15.1
5.6
53.9
Note: Prior to 2003, data exclude trade with Indonesia. Source: International Enterprise Singapore
Percentage Change Over Corresponding Period Of Previous Year
2004 2005
IMPORTS BY MAJOR COMMODITY AT CURRENT PRICES - Cont'd [TABLE A6.9]
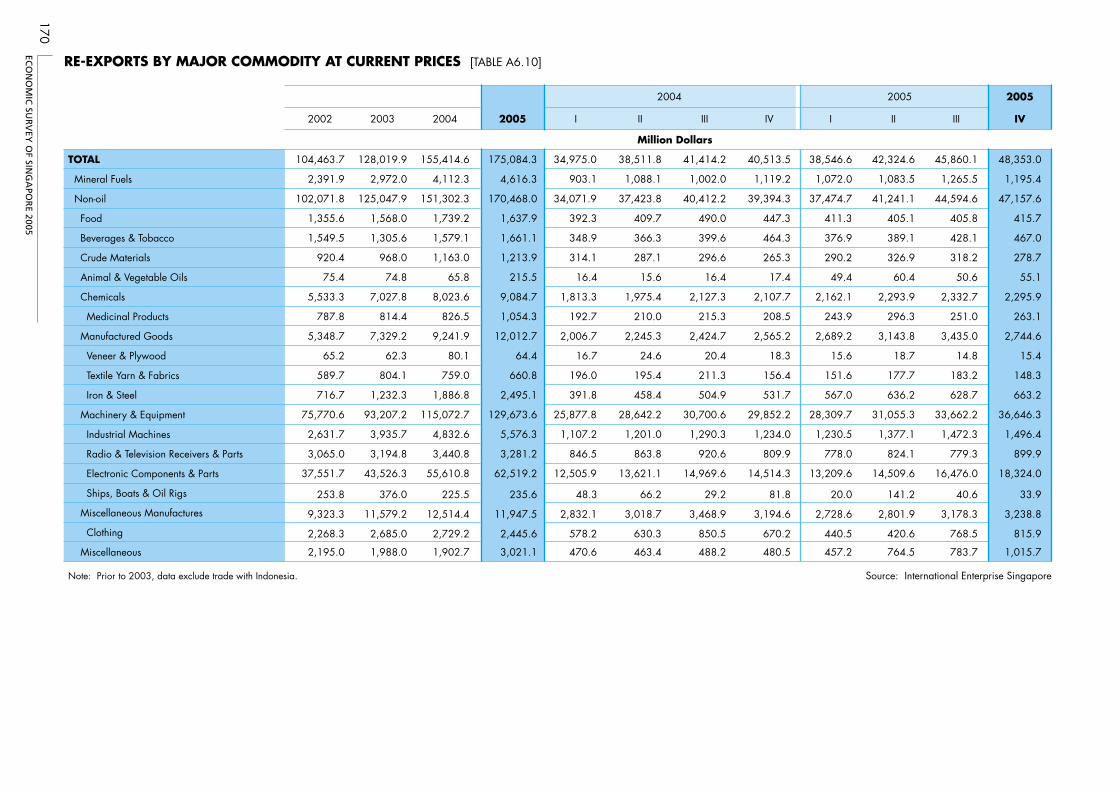
ECO
NO
MIC
SUR
VEY
OF SIN
GA
POR
E 2005
170
TOTAL
Mineral Fuels
Non-oil
Food
Beverages & Tobacco
Crude Materials
Animal & Vegetable Oils
Chemicals
Medicinal Products
Manufactured Goods
Veneer & Plywood
Textile Yarn & Fabrics
Iron & Steel
Machinery & Equipment
Industrial Machines
Radio & Television Receivers & Parts
Electronic Components & Parts
Ships, Boats & Oil Rigs
Miscellaneous Manufactures
Clothing
Miscellaneous
2002
104,463.7
2,391.9
102,071.8
1,355.6
1,549.5
920.4
75.4
5,533.3
787.8
5,348.7
65.2
589.7
716.7
75,770.6
2,631.7
3,065.0
37,551.7
253.8
9,323.3
2,268.3
2,195.0
2003
128,019.9
2,972.0
125,047.9
1,568.0
1,305.6
968.0
74.8
7,027.8
814.4
7,329.2
62.3
804.1
1,232.3
93,207.2
3,935.7
3,194.8
43,526.3
376.0
11,579.2
2,685.0
1,988.0
2004
155,414.6
4,112.3
151,302.3
1,739.2
1,579.1
1,163.0
65.8
8,023.6
826.5
9,241.9
80.1
759.0
1,886.8
115,072.7
4,832.6
3,440.8
55,610.8
225.5
12,514.4
2,729.2
1,902.7
2005
175,084.3
4,616.3
170,468.0
1,637.9
1,661.1
1,213.9
215.5
9,084.7
1,054.3
12,012.7
64.4
660.8
2,495.1
129,673.6
5,576.3
3,281.2
62,519.2
235.6
11,947.5
2,445.6
3,021.1
I
34,975.0
903.1
34,071.9
392.3
348.9
314.1
16.4
1,813.3
192.7
2,006.7
16.7
196.0
391.8
25,877.8
1,107.2
846.5
12,505.9
48.3
2,832.1
578.2
470.6
II
38,511.8
1,088.1
37,423.8
409.7
366.3
287.1
15.6
1,975.4
210.0
2,245.3
24.6
195.4
458.4
28,642.2
1,201.0
863.8
13,621.1
66.2
3,018.7
630.3
463.4
III
41,414.2
1,002.0
40,412.2
490.0
399.6
296.6
16.4
2,127.3
215.3
2,424.7
20.4
211.3
504.9
30,700.6
1,290.3
920.6
14,969.6
29.2
3,468.9
850.5
488.2
IV
40,513.5
1,119.2
39,394.3
447.3
464.3
265.3
17.4
2,107.7
208.5
2,565.2
18.3
156.4
531.7
29,852.2
1,234.0
809.9
14,514.3
81.8
3,194.6
670.2
480.5
I
38,546.6
1,072.0
37,474.7
411.3
376.9
290.2
49.4
2,162.1
243.9
2,689.2
15.6
151.6
567.0
28,309.7
1,230.5
778.0
13,209.6
20.0
2,728.6
440.5
457.2
II
42,324.6
1,083.5
41,241.1
405.1
389.1
326.9
60.4
2,293.9
296.3
3,143.8
18.7
177.7
636.2
31,055.3
1,377.1
824.1
14,509.6
141.2
2,801.9
420.6
764.5
III
45,860.1
1,265.5
44,594.6
405.8
428.1
318.2
50.6
2,332.7
251.0
3,435.0
14.8
183.2
628.7
33,662.2
1,472.3
779.3
16,476.0
40.6
3,178.3
768.5
783.7
2005
IV
48,353.0
1,195.4
47,157.6
415.7
467.0
278.7
55.1
2,295.9
263.1
2,744.6
15.4
148.3
663.2
36,646.3
1,496.4
899.9
18,324.0
33.9
3,238.8
815.9
1,015.7
Note: Prior to 2003, data exclude trade with Indonesia. Source: International Enterprise Singapore
Million Dollars
RE-EXPORTS BY MAJOR COMMODITY AT CURRENT PRICES [TABLE A6.10]
2004 2005
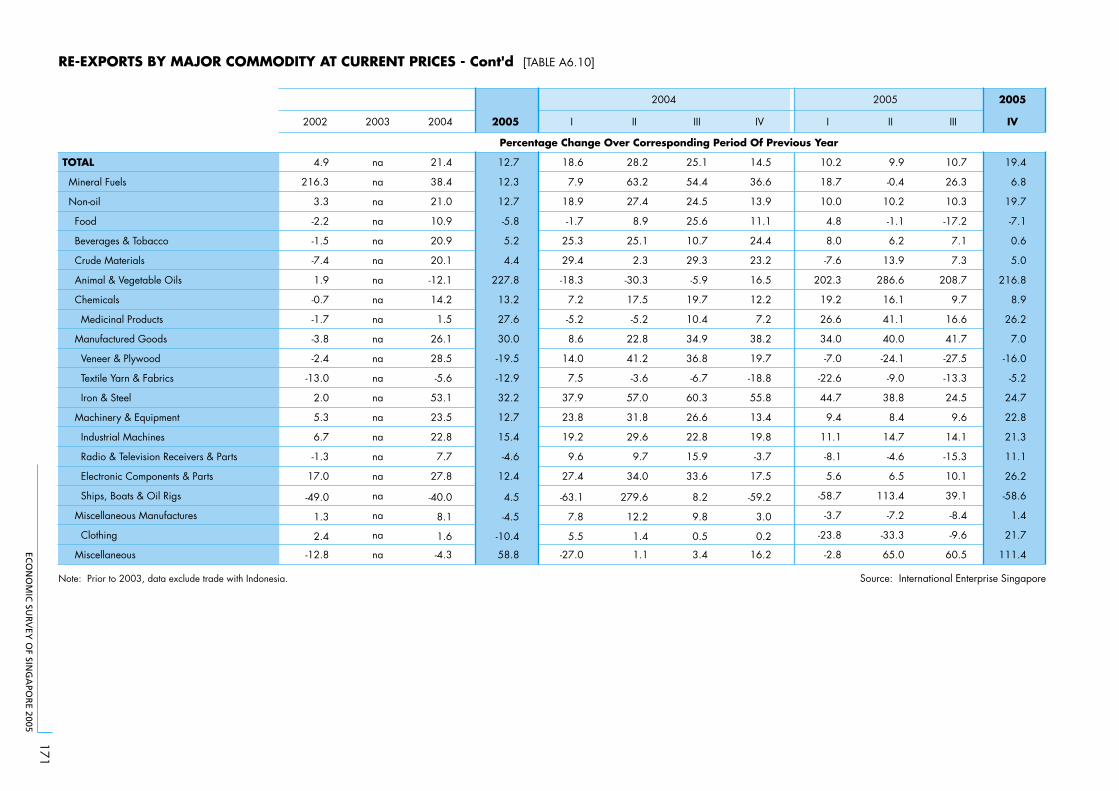
ECO
NO
MIC
SUR
VEY
OF SIN
GA
POR
E 2005
171
TOTAL
Mineral Fuels
Non-oil
Food
Beverages & Tobacco
Crude Materials
Animal & Vegetable Oils
Chemicals
Medicinal Products
Manufactured Goods
Veneer & Plywood
Textile Yarn & Fabrics
Iron & Steel
Machinery & Equipment
Industrial Machines
Radio & Television Receivers & Parts
Electronic Components & Parts
Ships, Boats & Oil Rigs
Miscellaneous Manufactures
Clothing
Miscellaneous
2002
4.9
216.3
3.3
-2.2
-1.5
-7.4
1.9
-0.7
-1.7
-3.8
-2.4
-13.0
2.0
5.3
6.7
-1.3
17.0
-49.0
1.3
2.4
-12.8
2003
na
na
na
na
na
na
na
na
na
na
na
na
na
na
na
na
na
na
na
na
na
2004
21.4
38.4
21.0
10.9
20.9
20.1
-12.1
14.2
1.5
26.1
28.5
-5.6
53.1
23.5
22.8
7.7
27.8
-40.0
8.1
1.6
-4.3
2005
12.7
12.3
12.7
-5.8
5.2
4.4
227.8
13.2
27.6
30.0
-19.5
-12.9
32.2
12.7
15.4
-4.6
12.4
4.5
-4.5
-10.4
58.8
I
18.6
7.9
18.9
-1.7
25.3
29.4
-18.3
7.2
-5.2
8.6
14.0
7.5
37.9
23.8
19.2
9.6
27.4
-63.1
7.8
5.5
-27.0
II
28.2
63.2
27.4
8.9
25.1
2.3
-30.3
17.5
-5.2
22.8
41.2
-3.6
57.0
31.8
29.6
9.7
34.0
279.6
12.2
1.4
1.1
III
25.1
54.4
24.5
25.6
10.7
29.3
-5.9
19.7
10.4
34.9
36.8
-6.7
60.3
26.6
22.8
15.9
33.6
8.2
9.8
0.5
3.4
IV
14.5
36.6
13.9
11.1
24.4
23.2
16.5
12.2
7.2
38.2
19.7
-18.8
55.8
13.4
19.8
-3.7
17.5
-59.2
3.0
0.2
16.2
I
10.2
18.7
10.0
4.8
8.0
-7.6
202.3
19.2
26.6
34.0
-7.0
-22.6
44.7
9.4
11.1
-8.1
5.6
-58.7
-3.7
-23.8
-2.8
II
9.9
-0.4
10.2
-1.1
6.2
13.9
286.6
16.1
41.1
40.0
-24.1
-9.0
38.8
8.4
14.7
-4.6
6.5
113.4
-7.2
-33.3
65.0
III
10.7
26.3
10.3
-17.2
7.1
7.3
208.7
9.7
16.6
41.7
-27.5
-13.3
24.5
9.6
14.1
-15.3
10.1
39.1
-8.4
-9.6
60.5
2005
IV
19.4
6.8
19.7
-7.1
0.6
5.0
216.8
8.9
26.2
7.0
-16.0
-5.2
24.7
22.8
21.3
11.1
26.2
-58.6
1.4
21.7
111.4
Note: Prior to 2003, data exclude trade with Indonesia. Source: International Enterprise Singapore
RE-EXPORTS BY MAJOR COMMODITY AT CURRENT PRICES - Cont'd [TABLE A6.10]
Percentage Change Over Corresponding Period Of Previous Year
2004 2005
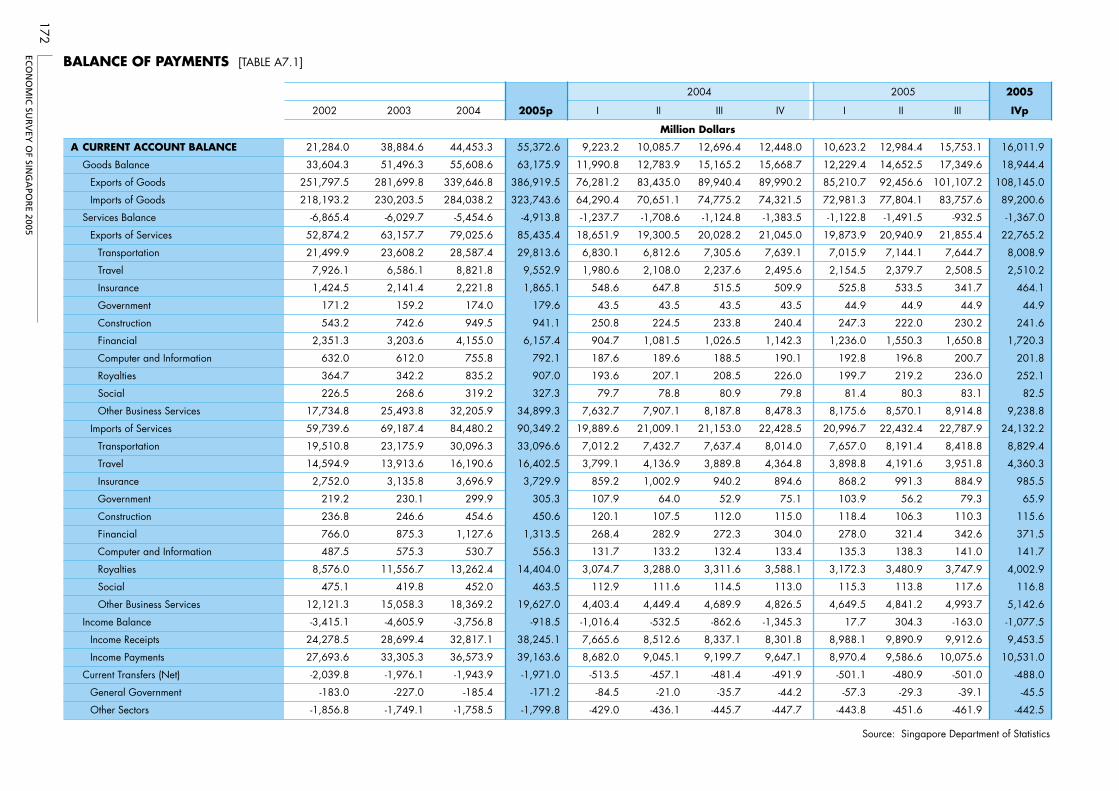
ECO
NO
MIC
SUR
VEY
OF SIN
GA
POR
E 2005
172
BALANCE OF PAYMENTS [TABLE A7.1]
A CURRENT ACCOUNT BALANCE
Goods Balance
Exports of Goods
Imports of Goods
Services Balance
Exports of Services
Transportation
Travel
Insurance
Government
Construction
Financial
Computer and Information
Royalties
Social
Other Business Services
Imports of Services
Transportation
Travel
Insurance
Government
Construction
Financial
Computer and Information
Royalties
Social
Other Business Services
Income Balance
Income Receipts
Income Payments
Current Transfers (Net)
General Government
Other Sectors
2002
21,284.0
33,604.3
251,797.5
218,193.2
-6,865.4
52,874.2
21,499.9
7,926.1
1,424.5
171.2
543.2
2,351.3
632.0
364.7
226.5
17,734.8
59,739.6
19,510.8
14,594.9
2,752.0
219.2
236.8
766.0
487.5
8,576.0
475.1
12,121.3
-3,415.1
24,278.5
27,693.6
-2,039.8
-183.0
-1,856.8
2003
38,884.6
51,496.3
281,699.8
230,203.5
-6,029.7
63,157.7
23,608.2
6,586.1
2,141.4
159.2
742.6
3,203.6
612.0
342.2
268.6
25,493.8
69,187.4
23,175.9
13,913.6
3,135.8
230.1
246.6
875.3
575.3
11,556.7
419.8
15,058.3
-4,605.9
28,699.4
33,305.3
-1,976.1
-227.0
-1,749.1
2004
44,453.3
55,608.6
339,646.8
284,038.2
-5,454.6
79,025.6
28,587.4
8,821.8
2,221.8
174.0
949.5
4,155.0
755.8
835.2
319.2
32,205.9
84,480.2
30,096.3
16,190.6
3,696.9
299.9
454.6
1,127.6
530.7
13,262.4
452.0
18,369.2
-3,756.8
32,817.1
36,573.9
-1,943.9
-185.4
-1,758.5
2005p
55,372.6
63,175.9
386,919.5
323,743.6
-4,913.8
85,435.4
29,813.6
9,552.9
1,865.1
179.6
941.1
6,157.4
792.1
907.0
327.3
34,899.3
90,349.2
33,096.6
16,402.5
3,729.9
305.3
450.6
1,313.5
556.3
14,404.0
463.5
19,627.0
-918.5
38,245.1
39,163.6
-1,971.0
-171.2
-1,799.8
I
9,223.2
11,990.8
76,281.2
64,290.4
-1,237.7
18,651.9
6,830.1
1,980.6
548.6
43.5
250.8
904.7
187.6
193.6
79.7
7,632.7
19,889.6
7,012.2
3,799.1
859.2
107.9
120.1
268.4
131.7
3,074.7
112.9
4,403.4
-1,016.4
7,665.6
8,682.0
-513.5
-84.5
-429.0
II
10,085.7
12,783.9
83,435.0
70,651.1
-1,708.6
19,300.5
6,812.6
2,108.0
647.8
43.5
224.5
1,081.5
189.6
207.1
78.8
7,907.1
21,009.1
7,432.7
4,136.9
1,002.9
64.0
107.5
282.9
133.2
3,288.0
111.6
4,449.4
-532.5
8,512.6
9,045.1
-457.1
-21.0
-436.1
III
12,696.4
15,165.2
89,940.4
74,775.2
-1,124.8
20,028.2
7,305.6
2,237.6
515.5
43.5
233.8
1,026.5
188.5
208.5
80.9
8,187.8
21,153.0
7,637.4
3,889.8
940.2
52.9
112.0
272.3
132.4
3,311.6
114.5
4,689.9
-862.6
8,337.1
9,199.7
-481.4
-35.7
-445.7
IV
12,448.0
15,668.7
89,990.2
74,321.5
-1,383.5
21,045.0
7,639.1
2,495.6
509.9
43.5
240.4
1,142.3
190.1
226.0
79.8
8,478.3
22,428.5
8,014.0
4,364.8
894.6
75.1
115.0
304.0
133.4
3,588.1
113.0
4,826.5
-1,345.3
8,301.8
9,647.1
-491.9
-44.2
-447.7
I
10,623.2
12,229.4
85,210.7
72,981.3
-1,122.8
19,873.9
7,015.9
2,154.5
525.8
44.9
247.3
1,236.0
192.8
199.7
81.4
8,175.6
20,996.7
7,657.0
3,898.8
868.2
103.9
118.4
278.0
135.3
3,172.3
115.3
4,649.5
17.7
8,988.1
8,970.4
-501.1
-57.3
-443.8
II
12,984.4
14,652.5
92,456.6
77,804.1
-1,491.5
20,940.9
7,144.1
2,379.7
533.5
44.9
222.0
1,550.3
196.8
219.2
80.3
8,570.1
22,432.4
8,191.4
4,191.6
991.3
56.2
106.3
321.4
138.3
3,480.9
113.8
4,841.2
304.3
9,890.9
9,586.6
-480.9
-29.3
-451.6
III
15,753.1
17,349.6
101,107.2
83,757.6
-932.5
21,855.4
7,644.7
2,508.5
341.7
44.9
230.2
1,650.8
200.7
236.0
83.1
8,914.8
22,787.9
8,418.8
3,951.8
884.9
79.3
110.3
342.6
141.0
3,747.9
117.6
4,993.7
-163.0
9,912.6
10,075.6
-501.0
-39.1
-461.9
2005
IVp
16,011.9
18,944.4
108,145.0
89,200.6
-1,367.0
22,765.2
8,008.9
2,510.2
464.1
44.9
241.6
1,720.3
201.8
252.1
82.5
9,238.8
24,132.2
8,829.4
4,360.3
985.5
65.9
115.6
371.5
141.7
4,002.9
116.8
5,142.6
-1,077.5
9,453.5
10,531.0
-488.0
-45.5
-442.5
Source: Singapore Department of Statistics
Million Dollars
2004 2005
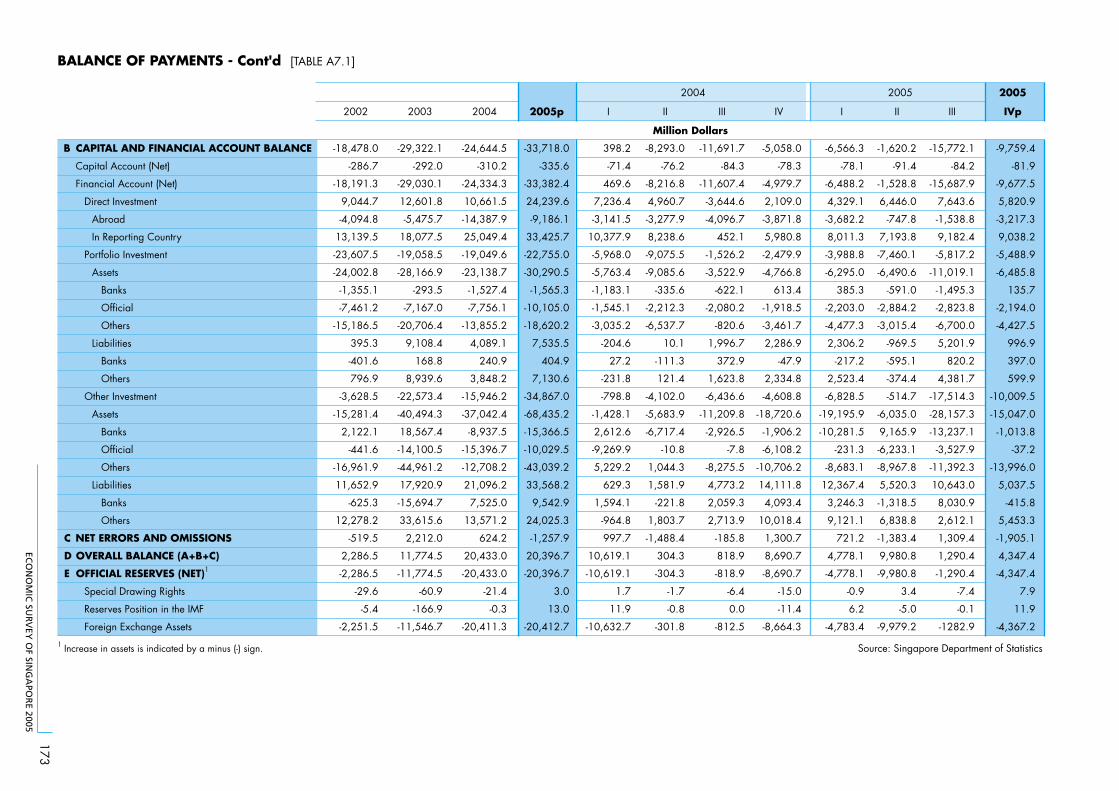
ECO
NO
MIC
SUR
VEY
OF SIN
GA
POR
E 2005
173
BALANCE OF PAYMENTS - Cont'd [TABLE A7.1]
B CAPITAL AND FINANCIAL ACCOUNT BALANCE
Capital Account (Net)
Financial Account (Net)
Direct Investment
Abroad
In Reporting Country
Portfolio Investment
Assets
Banks
Official
Others
Liabilities
Banks
Others
Other Investment
Assets
Banks
Official
Others
Liabilities
Banks
Others
C NET ERRORS AND OMISSIONS
D OVERALL BALANCE (A+B+C)
E OFFICIAL RESERVES (NET)1
Special Drawing Rights
Reserves Position in the IMF
Foreign Exchange Assets
2002
-18,478.0
-286.7
-18,191.3
9,044.7
-4,094.8
13,139.5
-23,607.5
-24,002.8
-1,355.1
-7,461.2
-15,186.5
395.3
-401.6
796.9
-3,628.5
-15,281.4
2,122.1
-441.6
-16,961.9
11,652.9
-625.3
12,278.2
-519.5
2,286.5
-2,286.5
-29.6
-5.4
-2,251.5
2003
-29,322.1
-292.0
-29,030.1
12,601.8
-5,475.7
18,077.5
-19,058.5
-28,166.9
-293.5
-7,167.0
-20,706.4
9,108.4
168.8
8,939.6
-22,573.4
-40,494.3
18,567.4
-14,100.5
-44,961.2
17,920.9
-15,694.7
33,615.6
2,212.0
11,774.5
-11,774.5
-60.9
-166.9
-11,546.7
2004
-24,644.5
-310.2
-24,334.3
10,661.5
-14,387.9
25,049.4
-19,049.6
-23,138.7
-1,527.4
-7,756.1
-13,855.2
4,089.1
240.9
3,848.2
-15,946.2
-37,042.4
-8,937.5
-15,396.7
-12,708.2
21,096.2
7,525.0
13,571.2
624.2
20,433.0
-20,433.0
-21.4
-0.3
-20,411.3
2005p
-33,718.0
-335.6
-33,382.4
24,239.6
-9,186.1
33,425.7
-22,755.0
-30,290.5
-1,565.3
-10,105.0
-18,620.2
7,535.5
404.9
7,130.6
-34,867.0
-68,435.2
-15,366.5
-10,029.5
-43,039.2
33,568.2
9,542.9
24,025.3
-1,257.9
20,396.7
-20,396.7
3.0
13.0
-20,412.7
I
398.2
-71.4
469.6
7,236.4
-3,141.5
10,377.9
-5,968.0
-5,763.4
-1,183.1
-1,545.1
-3,035.2
-204.6
27.2
-231.8
-798.8
-1,428.1
2,612.6
-9,269.9
5,229.2
629.3
1,594.1
-964.8
997.7
10,619.1
-10,619.1
1.7
11.9
-10,632.7
II
-8,293.0
-76.2
-8,216.8
4,960.7
-3,277.9
8,238.6
-9,075.5
-9,085.6
-335.6
-2,212.3
-6,537.7
10.1
-111.3
121.4
-4,102.0
-5,683.9
-6,717.4
-10.8
1,044.3
1,581.9
-221.8
1,803.7
-1,488.4
304.3
-304.3
-1.7
-0.8
-301.8
III
-11,691.7
-84.3
-11,607.4
-3,644.6
-4,096.7
452.1
-1,526.2
-3,522.9
-622.1
-2,080.2
-820.6
1,996.7
372.9
1,623.8
-6,436.6
-11,209.8
-2,926.5
-7.8
-8,275.5
4,773.2
2,059.3
2,713.9
-185.8
818.9
-818.9
-6.4
0.0
-812.5
IV
-5,058.0
-78.3
-4,979.7
2,109.0
-3,871.8
5,980.8
-2,479.9
-4,766.8
613.4
-1,918.5
-3,461.7
2,286.9
-47.9
2,334.8
-4,608.8
-18,720.6
-1,906.2
-6,108.2
-10,706.2
14,111.8
4,093.4
10,018.4
1,300.7
8,690.7
-8,690.7
-15.0
-11.4
-8,664.3
I
-6,566.3
-78.1
-6,488.2
4,329.1
-3,682.2
8,011.3
-3,988.8
-6,295.0
385.3
-2,203.0
-4,477.3
2,306.2
-217.2
2,523.4
-6,828.5
-19,195.9
-10,281.5
-231.3
-8,683.1
12,367.4
3,246.3
9,121.1
721.2
4,778.1
-4,778.1
-0.9
6.2
-4,783.4
II
-1,620.2
-91.4
-1,528.8
6,446.0
-747.8
7,193.8
-7,460.1
-6,490.6
-591.0
-2,884.2
-3,015.4
-969.5
-595.1
-374.4
-514.7
-6,035.0
9,165.9
-6,233.1
-8,967.8
5,520.3
-1,318.5
6,838.8
-1,383.4
9,980.8
-9,980.8
3.4
-5.0
-9,979.2
III
-15,772.1
-84.2
-15,687.9
7,643.6
-1,538.8
9,182.4
-5,817.2
-11,019.1
-1,495.3
-2,823.8
-6,700.0
5,201.9
820.2
4,381.7
-17,514.3
-28,157.3
-13,237.1
-3,527.9
-11,392.3
10,643.0
8,030.9
2,612.1
1,309.4
1,290.4
-1,290.4
-7.4
-0.1
-1282.9
2005
IVp
-9,759.4
-81.9
-9,677.5
5,820.9
-3,217.3
9,038.2
-5,488.9
-6,485.8
135.7
-2,194.0
-4,427.5
996.9
397.0
599.9
-10,009.5
-15,047.0
-1,013.8
-37.2
-13,996.0
5,037.5
-415.8
5,453.3
-1,905.1
4,347.4
-4,347.4
7.9
11.9
-4,367.2
1 Increase in assets is indicated by a minus (-) sign. Source: Singapore Department of Statistics
2004
Million Dollars
2005
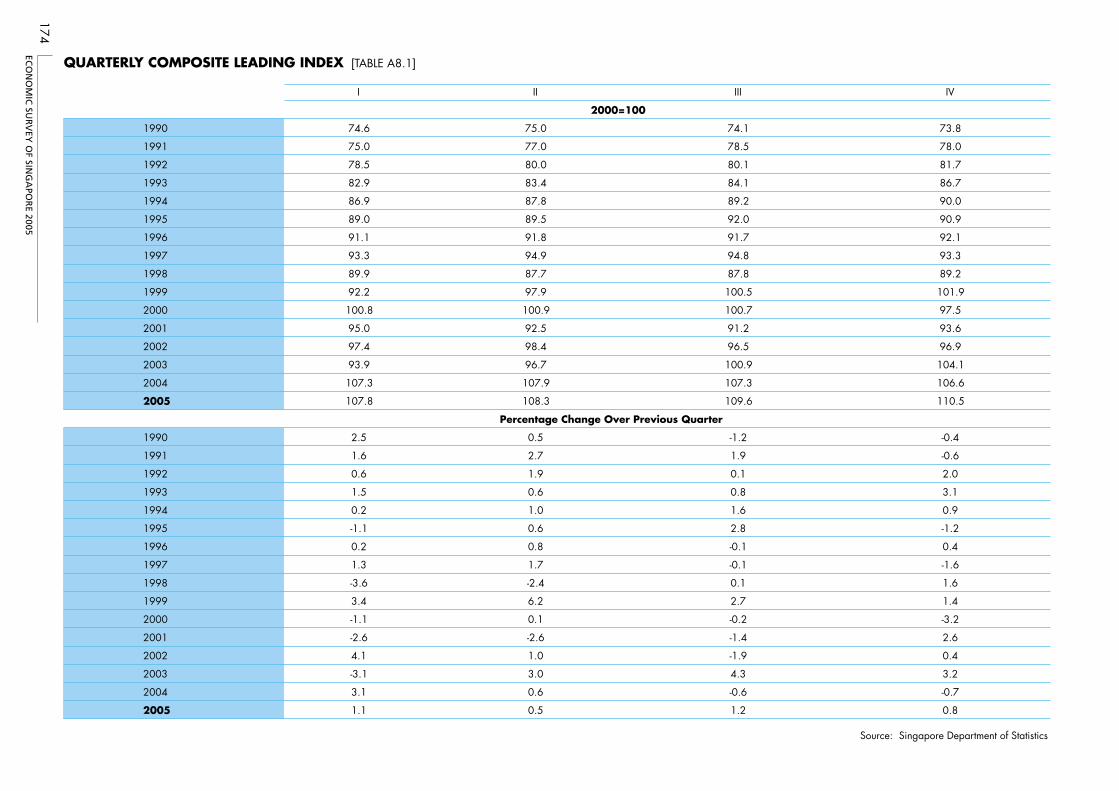
ECO
NO
MIC
SUR
VEY
OF SIN
GA
POR
E 2005
174
QUARTERLY COMPOSITE LEADING INDEX [TABLE A8.1]
I II III IV
1990 74.6 75.0 74.1 73.8
1991 75.0 77.0 78.5 78.0
1992 78.5 80.0 80.1 81.7
1993 82.9 83.4 84.1 86.7
1994 86.9 87.8 89.2 90.0
1995 89.0 89.5 92.0 90.9
1996 91.1 91.8 91.7 92.1
1997 93.3 94.9 94.8 93.3
1998 89.9 87.7 87.8 89.2
1999 92.2 97.9 100.5 101.9
2000 100.8 100.9 100.7 97.5
2001 95.0 92.5 91.2 93.6
2002 97.4 98.4 96.5 96.9
2003 93.9 96.7 100.9 104.1
2004 107.3 107.9 107.3 106.6
2005 107.8 108.3 109.6 110.5
1990 2.5 0.5 -1.2 -0.4
1991 1.6 2.7 1.9 -0.6
1992 0.6 1.9 0.1 2.0
1993 1.5 0.6 0.8 3.1
1994 0.2 1.0 1.6 0.9
1995 -1.1 0.6 2.8 -1.2
1996 0.2 0.8 -0.1 0.4
1997 1.3 1.7 -0.1 -1.6
1998 -3.6 -2.4 0.1 1.6
1999 3.4 6.2 2.7 1.4
2000 -1.1 0.1 -0.2 -3.2
2001 -2.6 -2.6 -1.4 2.6
2002 4.1 1.0 -1.9 0.4
2003 -3.1 3.0 4.3 3.2
2004 3.1 0.6 -0.6 -0.7
2005 1.1 0.5 1.2 0.8
Source: Singapore Department of Statistics
Percentage Change Over Previous Quarter
2000=100
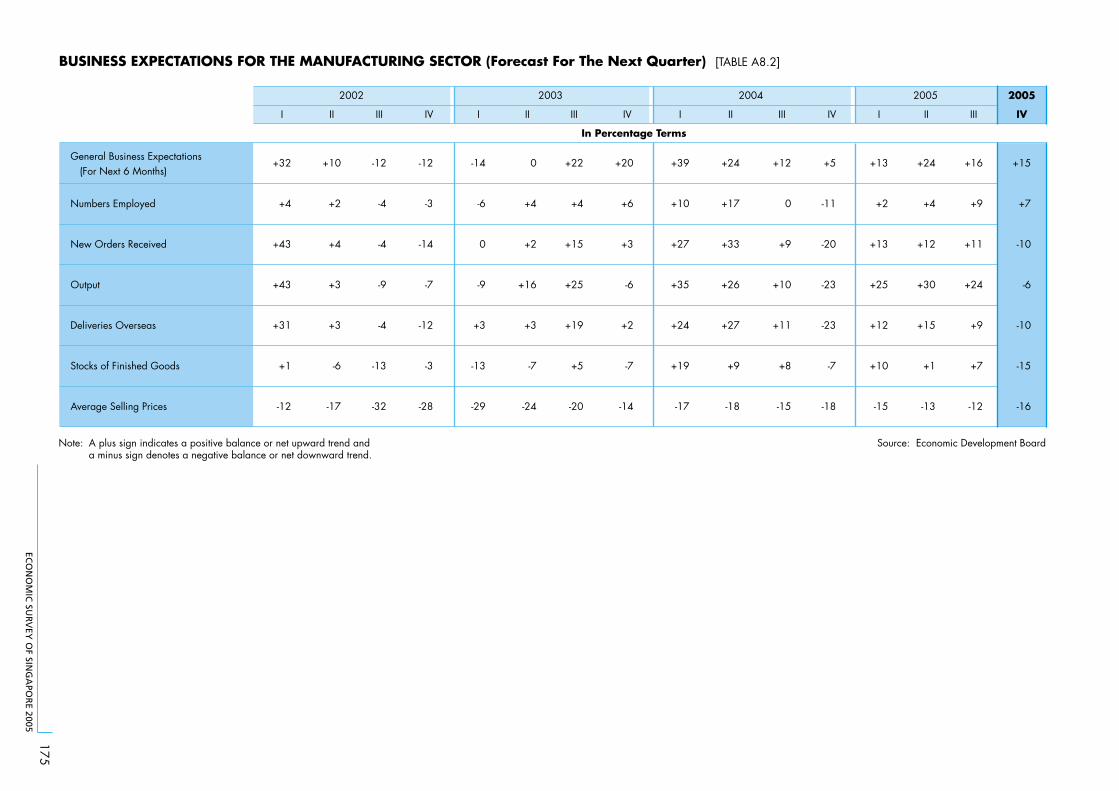
ECO
NO
MIC
SUR
VEY
OF SIN
GA
POR
E 2005
175
BUSINESS EXPECTATIONS FOR THE MANUFACTURING SECTOR (Forecast For The Next Quarter) [TABLE A8.2]
General Business Expectations (For Next 6 Months)
Numbers Employed
New Orders Received
Output
Deliveries Overseas
Stocks of Finished Goods
Average Selling Prices
I
+32
+4
+43
+43
+31
+1
-12
II
+10
+2
+4
+3
+3
-6
-17
III
-12
-4
-4
-9
-4
-13
-32
IV
-12
-3
-14
-7
-12
-3
-28
I
-14
-6
0
-9
+3
-13
-29
II
0
+4
+2
+16
+3
-7
-24
III
+22
+4
+15
+25
+19
+5
-20
IV
+20
+6
+3
-6
+2
-7
-14
I
+39
+10
+27
+35
+24
+19
-17
II
+24
+17
+33
+26
+27
+9
-18
III
+12
0
+9
+10
+11
+8
-15
IV
+5
-11
-20
-23
-23
-7
-18
I
+13
+2
+13
+25
+12
+10
-15
II
+24
+4
+12
+30
+15
+1
-13
III
+16
+9
+11
+24
+9
+7
-12
2005
IV
+15
+7
-10
-6
-10
-15
-16
Note: A plus sign indicates a positive balance or net upward trend anda minus sign denotes a negative balance or net downward trend.
Source: Economic Development Board
2005
In Percentage Terms
2002 2003 2004
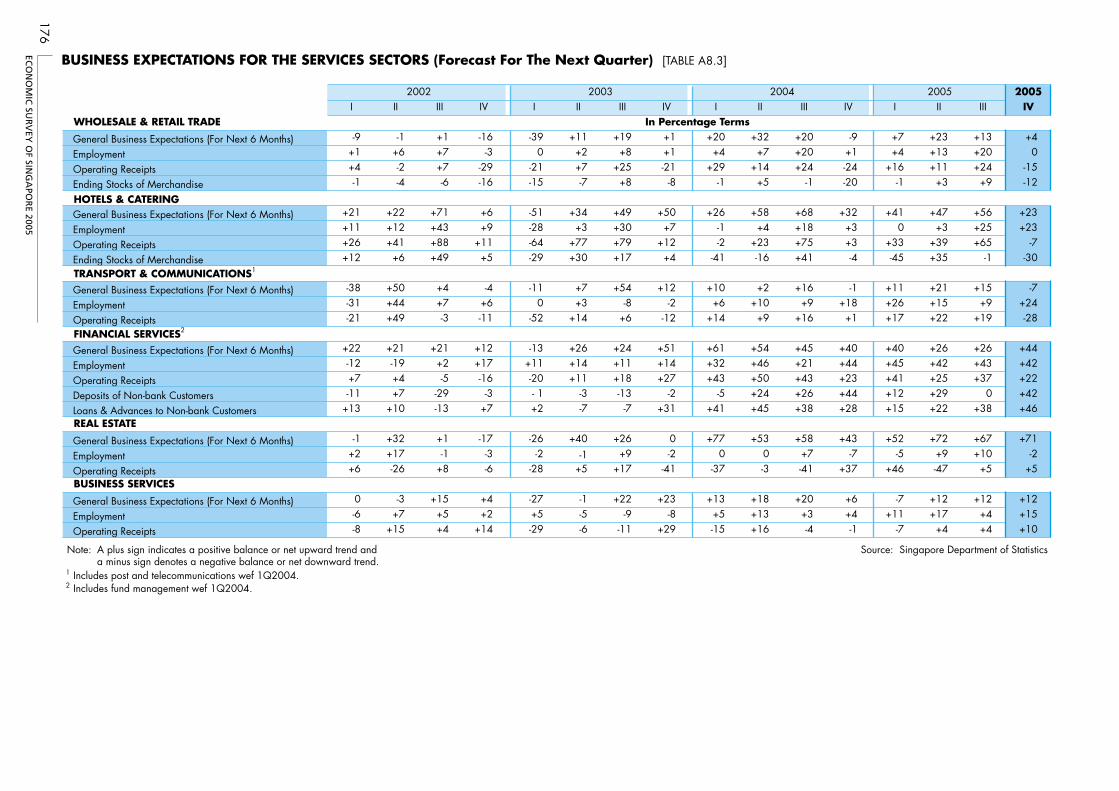
ECO
NO
MIC
SUR
VEY
OF SIN
GA
POR
E 2005
176
BUSINESS EXPECTATIONS FOR THE SERVICES SECTORS (Forecast For The Next Quarter) [TABLE A8.3]
WHOLESALE & RETAIL TRADE
General Business Expectations (For Next 6 Months) Employment Operating Receipts Ending Stocks of Merchandise HOTELS & CATERING General Business Expectations (For Next 6 Months) Employment Operating Receipts Ending Stocks of Merchandise TRANSPORT & COMMUNICATIONS1
General Business Expectations (For Next 6 Months) Employment Operating Receipts FINANCIAL SERVICES2
General Business Expectations (For Next 6 Months) Employment Operating Receipts Deposits of Non-bank Customers Loans & Advances to Non-bank Customers REAL ESTATE
General Business Expectations (For Next 6 Months) Employment Operating Receipts BUSINESS SERVICES
General Business Expectations (For Next 6 Months) Employment Operating Receipts
I
-9+1+4-1
+21+11+26+12
-38-31-21
+22-12+7-11
+13
-1+2+6
0-6-8
II
-1+6-2-4
+22+12+41
+6
+50+44+49
+21-19+4+7
+10
+32+17-26
-3+7
+15
III
+1+7+7-6
+71+43+88+49
+4+7-3
+21+2-5
-29-13
+1-1
+8
+15+5+4
IV
-16-3
-29-16
+6+9
+11+5
-4+6-11
+12+17-16
-3+7
-17-3-6
+4+2
+14
I
-390
-21-15
-51-28-64-29
-110
-52
-13+11-20 - 1
+2
-26 -2-28
-27+5-29
II
+11+2+7-7
+34+3
+77+30
+7+3
+14
+26+14+11
-3-7
+40-1
+5
-1-5-6
III
+19+8
+25+8
+49+30+79+17
+54-8
+6
+24+11+18-13-7
+26+9
+17
+22-9
-11
IV
+1+1-21-8
+50+7
+12+4
+12-2
-12
+51+14+27
-2+31
0-2
-41
+23-8
+29
I
+20+4
+29-1
+26-1-2
-41
+10+6
+14
+61+32+43
-5+41
+770
-37
+13+5-15
II
+32+7
+14+5
+58+4
+23-16
+2+10
+9
+54+46+50+24+45
+530-3
+18+13+16
III
+20+20+24
-1
+68+18+75+41
+16+9
+16
+45+21+43+26+38
+58+7-41
+20+3-4
IV
-9+1-24-20
+32+3+3-4
-1+18
+1
+40+44+23+44+28
+43-7
+37
+6+4-1
I
+7+4
+16-1
+410
+33-45
+11+26+17
+40+45+41+12+15
+52-5
+46
-7+11
-7
II
+23+13+11
+3
+47+3
+39+35
+21+15+22
+26+42+25+29+22
+72+9-47
+12+17
+4
III
+13+20+24
+9
+56+25+65
-1
+15+9
+19
+26+43+37
0+38
+67+10
+5
+12+4+4
2005IV
+40
-15-12
+23+23
-7-30
-7+24-28
+44+42+22+42+46
+71-2
+5
+12+15+10
Note: A plus sign indicates a positive balance or net upward trend anda minus sign denotes a negative balance or net downward trend.
Source: Singapore Department of Statistics
1 Includes post and telecommunications wef 1Q2004.2 Includes fund management wef 1Q2004.
In Percentage Terms
2002 2003 2004 2005
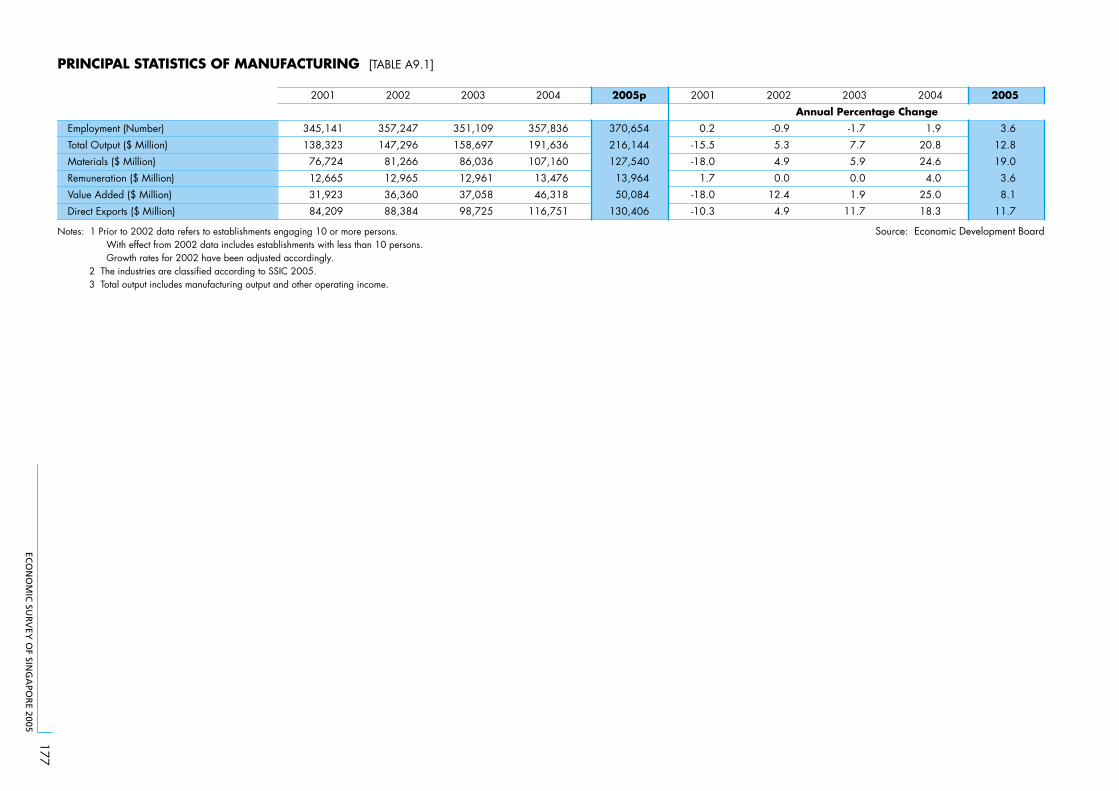
ECO
NO
MIC
SUR
VEY
OF SIN
GA
POR
E 2005
177
Employment (Number)
Total Output ($ Million)
Materials ($ Million)
Remuneration ($ Million)
Value Added ($ Million)
Direct Exports ($ Million)
2001
345,141
138,323
76,724
12,665
31,923
84,209
2002
357,247
147,296
81,266
12,965
36,360
88,384
2003
351,109
158,697
86,036
12,961
37,058
98,725
2004
357,836
191,636
107,160
13,476
46,318
116,751
2005p
370,654
216,144
127,540
13,964
50,084
130,406
2001
0.2
-15.5
-18.0
1.7
-18.0
-10.3
2002
-0.9
5.3
4.9
0.0
12.4
4.9
2003
-1.7
7.7
5.9
0.0
1.9
11.7
2004
1.9
20.8
24.6
4.0
25.0
18.3
2005
3.6
12.8
19.0
3.6
8.1
11.7
Notes: 1 Prior to 2002 data refers to establishments engaging 10 or more persons. Source: Economic Development Board With effect from 2002 data includes establishments with less than 10 persons. Growth rates for 2002 have been adjusted accordingly. 2 The industries are classified according to SSIC 2005. 3 Total output includes manufacturing output and other operating income.
Annual Percentage Change
PRINCIPAL STATISTICS OF MANUFACTURING [TABLE A9.1]
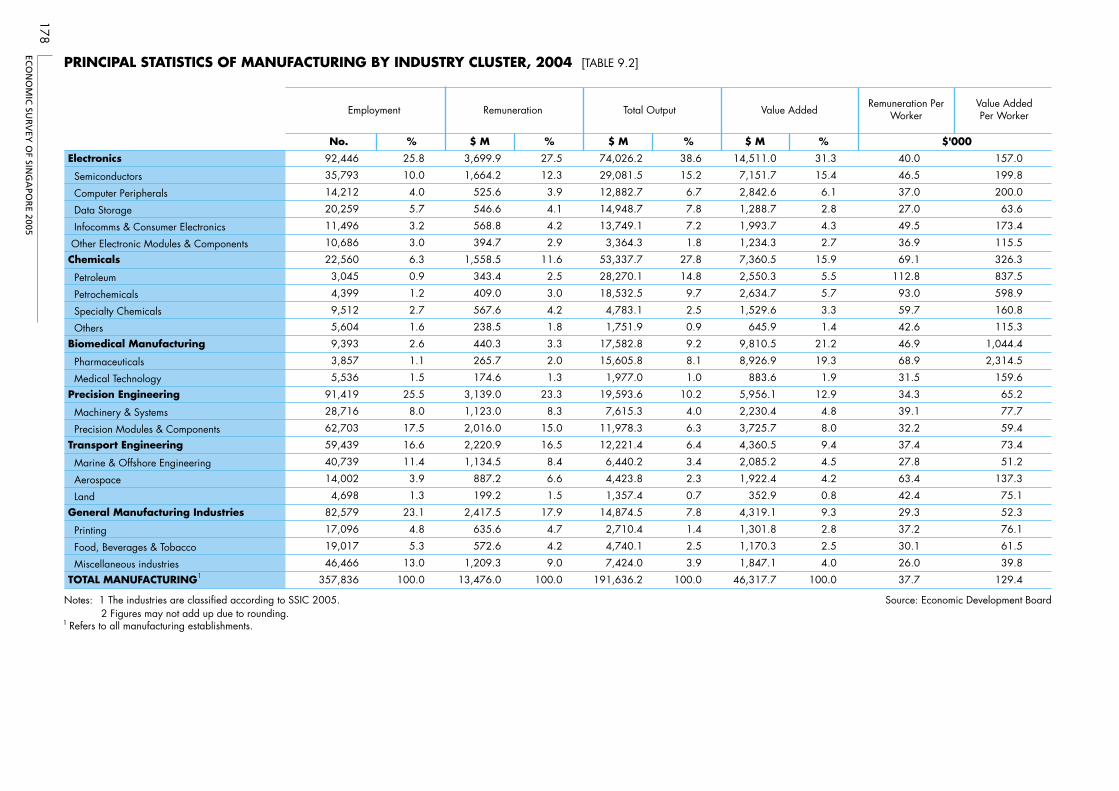
ECO
NO
MIC
SUR
VEY
OF SIN
GA
POR
E 2005
178
Employment Remuneration Total Output Value AddedRemuneration Per
Worker
No. % %
Electronics 92,446 38.6 31.3 40.0
Semiconductors 35,793 15.2 15.4 46.5
Computer Peripherals 14,212 6.7 6.1 37.0
Data Storage 20,259 7.8 2.8 27.0
Infocomms & Consumer Electronics 11,496 7.2 4.3 49.5
Other Electronic Modules & Components 10,686 1.8 2.7 36.9
Chemicals 22,560 27.8 15.9 69.1
Petroleum 3,045 14.8 5.5 112.8
Petrochemicals 4,399 9.7 5.7 93.0
Specialty Chemicals 9,512 2.5 3.3 59.7
Others 5,604 0.9 1.4 42.6
Biomedical Manufacturing 9,393 9.2 21.2 46.9
Pharmaceuticals 3,857 8.1 19.3 68.9
Medical Technology 5,536 1.0 1.9 31.5
Precision Engineering 91,419 10.2 12.9 34.3
Machinery & Systems 28,716 4.0 4.8 39.1
Precision Modules & Components 62,703 6.3 8.0 32.2
Transport Engineering 59,439 6.4 9.4 37.4
Marine & Offshore Engineering 40,739 3.4 4.5 27.8
Aerospace 14,002 2.3 4.2 63.4
Land 4,698 0.7 0.8 42.4
General Manufacturing Industries 82,579 7.8 9.3 29.3
Printing 17,096 1.4 2.8 37.2
Food, Beverages & Tobacco 19,017 2.5 2.5 30.1
Miscellaneous industries 46,466 3.9 4.0 26.0
TOTAL MANUFACTURING1 357,836
%
25.8
10.0
4.0
5.7
3.2
3.0
6.3
0.9
1.2
2.7
1.6
2.6
1.1
1.5
25.5
8.0
17.5
16.6
11.4
3.9
1.3
23.1
4.8
5.3
13.0
100.0
$ M
3,699.9
1,664.2
525.6
546.6
568.8
394.7
1,558.5
343.4
409.0
567.6
238.5
440.3
265.7
174.6
3,139.0
1,123.0
2,016.0
2,220.9
1,134.5
887.2
199.2
2,417.5
635.6
572.6
1,209.3
13,476.0
%
27.5
12.3
3.9
4.1
4.2
2.9
11.6
2.5
3.0
4.2
1.8
3.3
2.0
1.3
23.3
8.3
15.0
16.5
8.4
6.6
1.5
17.9
4.7
4.2
9.0
100.0
$ M
74,026.2
29,081.5
12,882.7
14,948.7
13,749.1
3,364.3
53,337.7
28,270.1
18,532.5
4,783.1
1,751.9
17,582.8
15,605.8
1,977.0
19,593.6
7,615.3
11,978.3
12,221.4
6,440.2
4,423.8
1,357.4
14,874.5
2,710.4
4,740.1
7,424.0
191,636.2 100.0
$ M
14,511.0
7,151.7
2,842.6
1,288.7
1,993.7
1,234.3
7,360.5
2,550.3
2,634.7
1,529.6
645.9
9,810.5
8,926.9
883.6
5,956.1
2,230.4
3,725.7
4,360.5
2,085.2
1,922.4
352.9
4,319.1
1,301.8
1,170.3
1,847.1
46,317.7 100.0 37.7
Value AddedPer Worker
157.0
199.8
200.0
63.6
173.4
115.5
326.3
837.5
598.9
160.8
115.3
1,044.4
2,314.5
159.6
65.2
77.7
59.4
73.4
51.2
137.3
75.1
52.3
76.1
61.5
39.8
129.4
Notes: 1 The industries are classified according to SSIC 2005. Source: Economic Development Board 2 Figures may not add up due to rounding.1 Refers to all manufacturing establishments.
$'000
PRINCIPAL STATISTICS OF MANUFACTURING BY INDUSTRY CLUSTER, 2004 [TABLE 9.2]
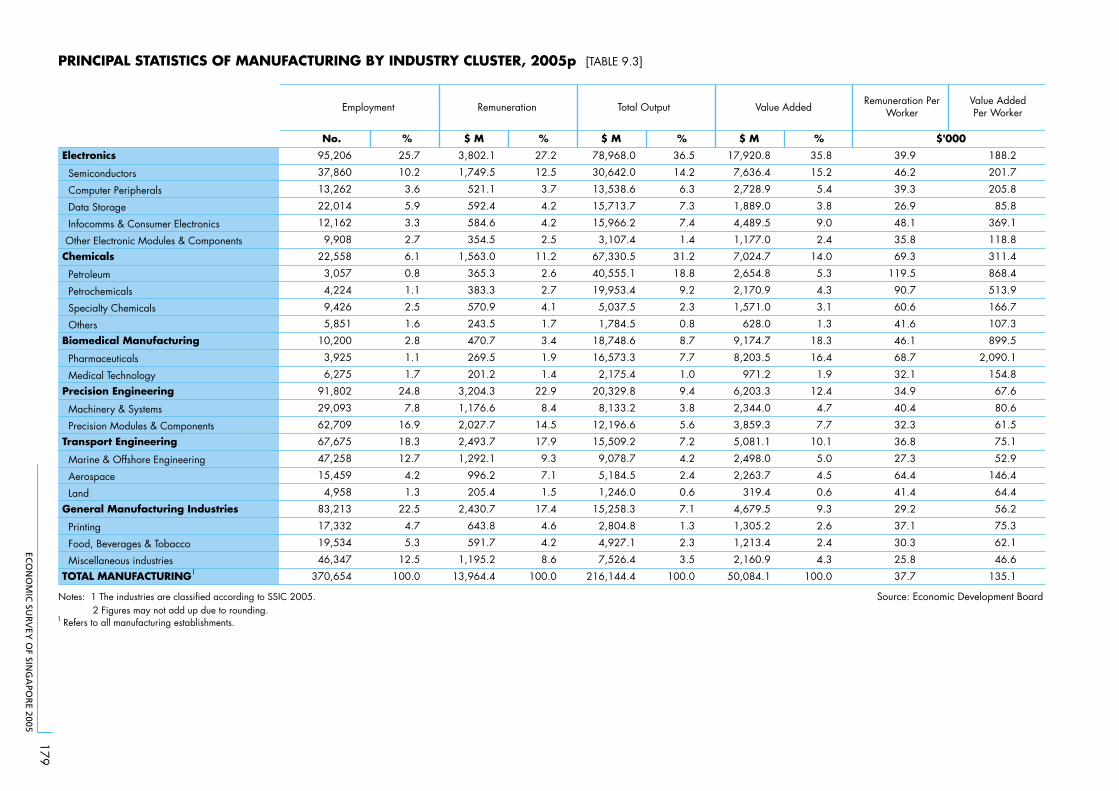
ECO
NO
MIC
SUR
VEY
OF SIN
GA
POR
E 2005
179
Employment Remuneration Total Output Value AddedValue AddedPer Worker
Electronics 188.2
Semiconductors 201.7
Computer Peripherals 205.8
Data Storage 85.8
Infocomms & Consumer Electronics 369.1
Other Electronic Modules & Components 118.8
Chemicals 311.4
Petroleum 868.4
Petrochemicals 513.9
Specialty Chemicals 166.7
Others 107.3
Biomedical Manufacturing 899.5
Pharmaceuticals 2,090.1
Medical Technology 154.8
Precision Engineering 67.6
Machinery & Systems 80.6
Precision Modules & Components 61.5
Transport Engineering 75.1
Marine & Offshore Engineering 52.9
Aerospace 146.4
Land 64.4
General Manufacturing Industries 56.2
Printing 75.3
Food, Beverages & Tobacco 62.1
Miscellaneous industries 46.6
TOTAL MANUFACTURING1
No.
95,206
37,860
13,262
22,014
12,162
9,908
22,558
3,057
4,224
9,426
5,851
10,200
3,925
6,275
91,802
29,093
62,709
67,675
47,258
15,459
4,958
83,213
17,332
19,534
46,347
370,654
%
25.7
10.2
3.6
5.9
3.3
2.7
6.1
0.8
1.1
2.5
1.6
2.8
1.1
1.7
24.8
7.8
16.9
18.3
12.7
4.2
1.3
22.5
4.7
5.3
12.5
100.0
$ M
3,802.1
1,749.5
521.1
592.4
584.6
354.5
1,563.0
365.3
383.3
570.9
243.5
470.7
269.5
201.2
3,204.3
1,176.6
2,027.7
2,493.7
1,292.1
996.2
205.4
2,430.7
643.8
591.7
1,195.2
13,964.4
%
27.2
12.5
3.7
4.2
4.2
2.5
11.2
2.6
2.7
4.1
1.7
3.4
1.9
1.4
22.9
8.4
14.5
17.9
9.3
7.1
1.5
17.4
4.6
4.2
8.6
100.0
$ M
78,968.0
30,642.0
13,538.6
15,713.7
15,966.2
3,107.4
67,330.5
40,555.1
19,953.4
5,037.5
1,784.5
18,748.6
16,573.3
2,175.4
20,329.8
8,133.2
12,196.6
15,509.2
9,078.7
5,184.5
1,246.0
15,258.3
2,804.8
4,927.1
7,526.4
216,144.4
%
36.5
14.2
6.3
7.3
7.4
1.4
31.2
18.8
9.2
2.3
0.8
8.7
7.7
1.0
9.4
3.8
5.6
7.2
4.2
2.4
0.6
7.1
1.3
2.3
3.5
100.0
$ M
17,920.8
7,636.4
2,728.9
1,889.0
4,489.5
1,177.0
7,024.7
2,654.8
2,170.9
1,571.0
628.0
9,174.7
8,203.5
971.2
6,203.3
2,344.0
3,859.3
5,081.1
2,498.0
2,263.7
319.4
4,679.5
1,305.2
1,213.4
2,160.9
50,084.1
%
35.8
15.2
5.4
3.8
9.0
2.4
14.0
5.3
4.3
3.1
1.3
18.3
16.4
1.9
12.4
4.7
7.7
10.1
5.0
4.5
0.6
9.3
2.6
2.4
4.3
100.0
Remuneration PerWorker
39.9
46.2
39.3
26.9
48.1
35.8
69.3
119.5
90.7
60.6
41.6
46.1
68.7
32.1
34.9
40.4
32.3
36.8
27.3
64.4
41.4
29.2
37.1
30.3
25.8
37.7 135.1
Notes: 1 The industries are classified according to SSIC 2005. Source: Economic Development Board 2 Figures may not add up due to rounding.1 Refers to all manufacturing establishments.
$'000
PRINCIPAL STATISTICS OF MANUFACTURING BY INDUSTRY CLUSTER, 2005p [TABLE 9.3]
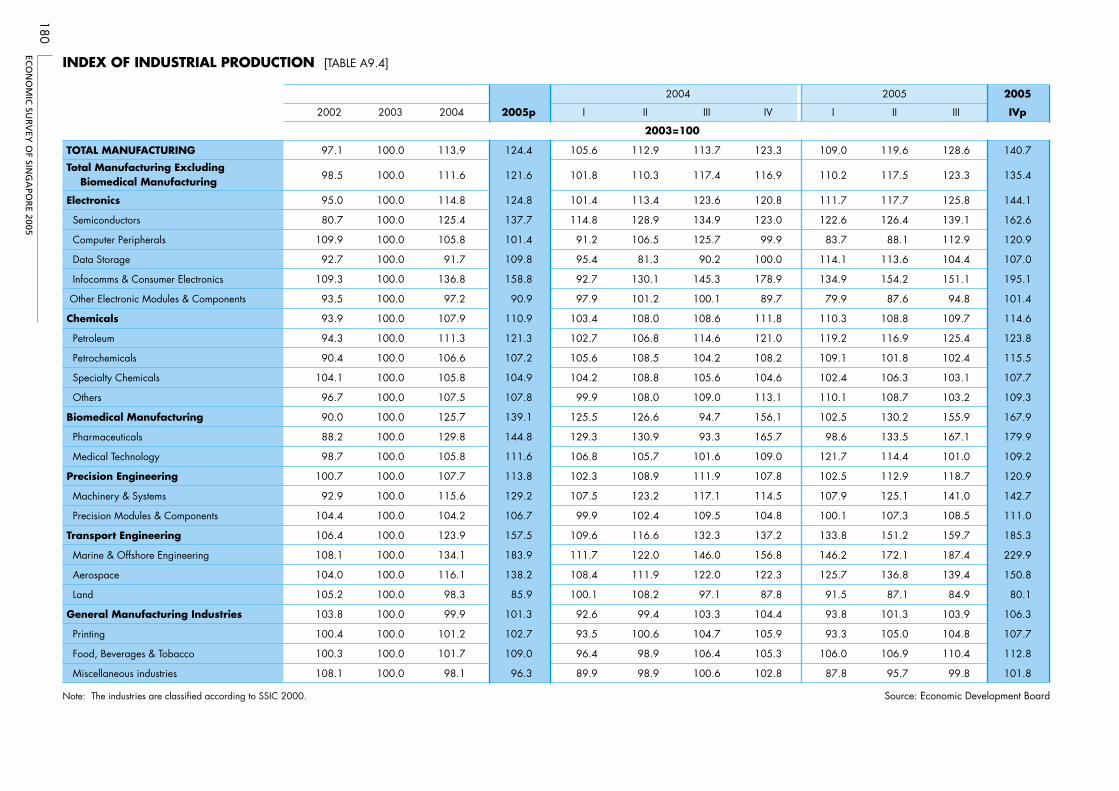
ECO
NO
MIC
SUR
VEY
OF SIN
GA
POR
E 2005
180
TOTAL MANUFACTURING
Total Manufacturing Excluding Biomedical Manufacturing
Electronics
Semiconductors
Computer Peripherals
Data Storage
Infocomms & Consumer Electronics
Other Electronic Modules & Components
Chemicals
Petroleum
Petrochemicals
Specialty Chemicals
Others
Biomedical Manufacturing
Pharmaceuticals
Medical Technology
Precision Engineering
Machinery & Systems
Precision Modules & Components
Transport Engineering
Marine & Offshore Engineering
Aerospace
Land
General Manufacturing Industries
Printing
Food, Beverages & Tobacco
Miscellaneous industries
2002
97.1
98.5
95.0
80.7
109.9
92.7
109.3
93.5
93.9
94.3
90.4
104.1
96.7
90.0
88.2
98.7
100.7
92.9
104.4
106.4
108.1
104.0
105.2
103.8
100.4
100.3
108.1
2003
100.0
100.0
100.0
100.0
100.0
100.0
100.0
100.0
100.0
100.0
100.0
100.0
100.0
100.0
100.0
100.0
100.0
100.0
100.0
100.0
100.0
100.0
100.0
100.0
100.0
100.0
100.0
2004
113.9
111.6
114.8
125.4
105.8
91.7
136.8
97.2
107.9
111.3
106.6
105.8
107.5
125.7
129.8
105.8
107.7
115.6
104.2
123.9
134.1
116.1
98.3
99.9
101.2
101.7
98.1
2005p
124.4
121.6
124.8
137.7
101.4
109.8
158.8
90.9
110.9
121.3
107.2
104.9
107.8
139.1
144.8
111.6
113.8
129.2
106.7
157.5
183.9
138.2
85.9
101.3
102.7
109.0
96.3
I
105.6
101.8
101.4
114.8
91.2
95.4
92.7
97.9
103.4
102.7
105.6
104.2
99.9
125.5
129.3
106.8
102.3
107.5
99.9
109.6
111.7
108.4
100.1
92.6
93.5
96.4
89.9
II
112.9
110.3
113.4
128.9
106.5
81.3
130.1
101.2
108.0
106.8
108.5
108.8
108.0
126.6
130.9
105.7
108.9
123.2
102.4
116.6
122.0
111.9
108.2
99.4
100.6
98.9
98.9
III
113.7
117.4
123.6
134.9
125.7
90.2
145.3
100.1
108.6
114.6
104.2
105.6
109.0
94.7
93.3
101.6
111.9
117.1
109.5
132.3
146.0
122.0
97.1
103.3
104.7
106.4
100.6
IV
123.3
116.9
120.8
123.0
99.9
100.0
178.9
89.7
111.8
121.0
108.2
104.6
113.1
156.1
165.7
109.0
107.8
114.5
104.8
137.2
156.8
122.3
87.8
104.4
105.9
105.3
102.8
I
109.0
110.2
111.7
122.6
83.7
114.1
134.9
79.9
110.3
119.2
109.1
102.4
110.1
102.5
98.6
121.7
102.5
107.9
100.1
133.8
146.2
125.7
91.5
93.8
93.3
106.0
87.8
II
119.6
117.5
117.7
126.4
88.1
113.6
154.2
87.6
108.8
116.9
101.8
106.3
108.7
130.2
133.5
114.4
112.9
125.1
107.3
151.2
172.1
136.8
87.1
101.3
105.0
106.9
95.7
III
128.6
123.3
125.8
139.1
112.9
104.4
151.1
94.8
109.7
125.4
102.4
103.1
103.2
155.9
167.1
101.0
118.7
141.0
108.5
159.7
187.4
139.4
84.9
103.9
104.8
110.4
99.8
2005
IVp
140.7
135.4
144.1
162.6
120.9
107.0
195.1
101.4
114.6
123.8
115.5
107.7
109.3
167.9
179.9
109.2
120.9
142.7
111.0
185.3
229.9
150.8
80.1
106.3
107.7
112.8
101.8
Note: The industries are classified according to SSIC 2000. Source: Economic Development Board
INDEX OF INDUSTRIAL PRODUCTION [TABLE A9.4]
2003=100
2004 2005
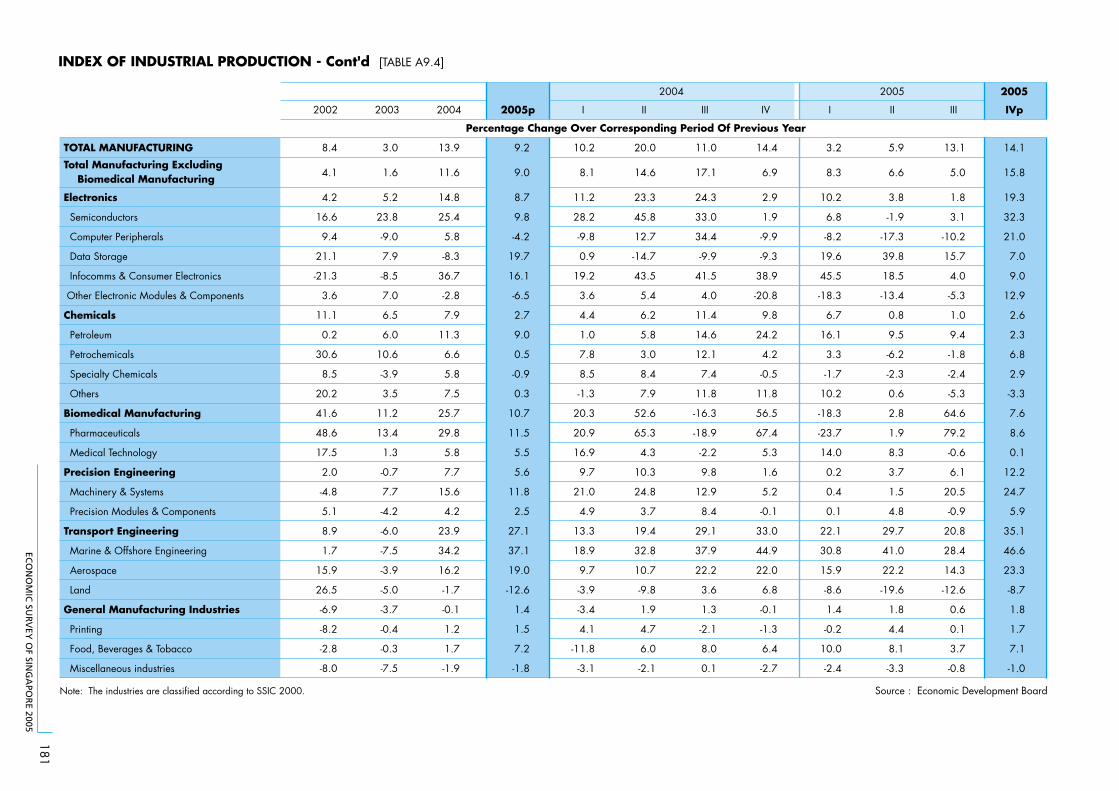
ECO
NO
MIC
SUR
VEY
OF SIN
GA
POR
E 2005
181
INDEX OF INDUSTRIAL PRODUCTION - Cont'd [TABLE A9.4]
TOTAL MANUFACTURING
Total Manufacturing Excluding Biomedical Manufacturing
Electronics
Semiconductors
Computer Peripherals
Data Storage
Infocomms & Consumer Electronics
Other Electronic Modules & Components
Chemicals
Petroleum
Petrochemicals
Specialty Chemicals
Others
Biomedical Manufacturing
Pharmaceuticals
Medical Technology
Precision Engineering
Machinery & Systems
Precision Modules & Components
Transport Engineering
Marine & Offshore Engineering
Aerospace
Land
General Manufacturing Industries
Printing
Food, Beverages & Tobacco
Miscellaneous industries
2002
8.4
4.1
4.2
16.6
9.4
21.1
-21.3
3.6
11.1
0.2
30.6
8.5
20.2
41.6
48.6
17.5
2.0
-4.8
5.1
8.9
1.7
15.9
26.5
-6.9
-8.2
-2.8
-8.0
2003
3.0
1.6
5.2
23.8
-9.0
7.9
-8.5
7.0
6.5
6.0
10.6
-3.9
3.5
11.2
13.4
1.3
-0.7
7.7
-4.2
-6.0
-7.5
-3.9
-5.0
-3.7
-0.4
-0.3
-7.5
2004
13.9
11.6
14.8
25.4
5.8
-8.3
36.7
-2.8
7.9
11.3
6.6
5.8
7.5
25.7
29.8
5.8
7.7
15.6
4.2
23.9
34.2
16.2
-1.7
-0.1
1.2
1.7
-1.9
2005p
9.2
9.0
8.7
9.8
-4.2
19.7
16.1
-6.5
2.7
9.0
0.5
-0.9
0.3
10.7
11.5
5.5
5.6
11.8
2.5
27.1
37.1
19.0
-12.6
1.4
1.5
7.2
-1.8
I
10.2
8.1
11.2
28.2
-9.8
0.9
19.2
3.6
4.4
1.0
7.8
8.5
-1.3
20.3
20.9
16.9
9.7
21.0
4.9
13.3
18.9
9.7
-3.9
-3.4
4.1
-11.8
-3.1
II
20.0
14.6
23.3
45.8
12.7
-14.7
43.5
5.4
6.2
5.8
3.0
8.4
7.9
52.6
65.3
4.3
10.3
24.8
3.7
19.4
32.8
10.7
-9.8
1.9
4.7
6.0
-2.1
III
11.0
17.1
24.3
33.0
34.4
-9.9
41.5
4.0
11.4
14.6
12.1
7.4
11.8
-16.3
-18.9
-2.2
9.8
12.9
8.4
29.1
37.9
22.2
3.6
1.3
-2.1
8.0
0.1
IV
14.4
6.9
2.9
1.9
-9.9
-9.3
38.9
-20.8
9.8
24.2
4.2
-0.5
11.8
56.5
67.4
5.3
1.6
5.2
-0.1
33.0
44.9
22.0
6.8
-0.1
-1.3
6.4
-2.7
I
3.2
8.3
10.2
6.8
-8.2
19.6
45.5
-18.3
6.7
16.1
3.3
-1.7
10.2
-18.3
-23.7
14.0
0.2
0.4
0.1
22.1
30.8
15.9
-8.6
1.4
-0.2
10.0
-2.4
III
13.1
5.0
1.8
3.1
-10.2
15.7
4.0
-5.3
1.0
9.4
-1.8
-2.4
-5.3
64.6
79.2
-0.6
6.1
20.5
-0.9
20.8
28.4
14.3
-12.6
0.6
0.1
3.7
-0.8
2005
IVp
14.1
15.8
19.3
32.3
21.0
7.0
9.0
12.9
2.6
2.3
6.8
2.9
-3.3
7.6
8.6
0.1
12.2
24.7
5.9
35.1
46.6
23.3
-8.7
1.8
1.7
7.1
-1.0
Note: The industries are classified according to SSIC 2000. Source : Economic Development Board
2004
II
5.9
6.6
3.8
-1.9
-17.3
39.8
18.5
-13.4
0.8
9.5
-6.2
-2.3
0.6
2.8
1.9
8.3
3.7
1.5
4.8
29.7
41.0
22.2
-19.6
1.8
4.4
8.1
-3.3
2005
Percentage Change Over Corresponding Period Of Previous Year
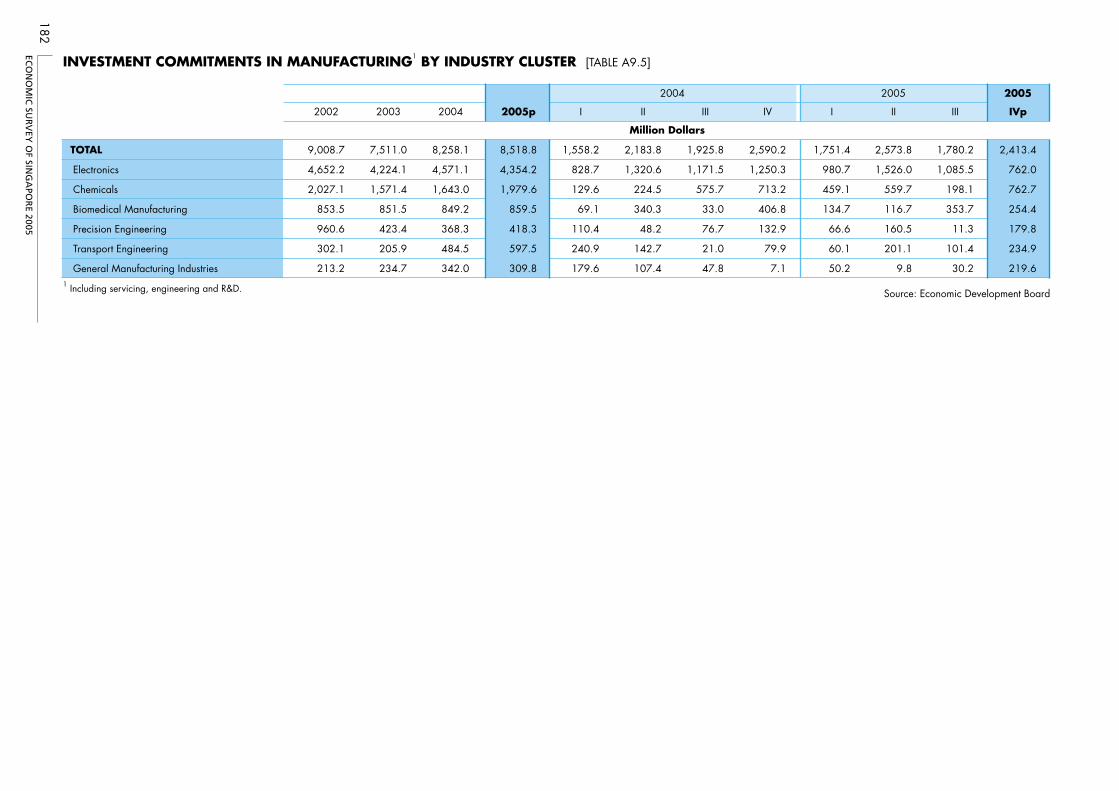
ECO
NO
MIC
SUR
VEY
OF SIN
GA
POR
E 2005
182
TOTAL
Electronics
Chemicals
Biomedical Manufacturing
Precision Engineering
Transport Engineering
General Manufacturing Industries
2002
9,008.7
4,652.2
2,027.1
853.5
960.6
302.1
213.2
2003
7,511.0
4,224.1
1,571.4
851.5
423.4
205.9
234.7
2004
8,258.1
4,571.1
1,643.0
849.2
368.3
484.5
342.0
2005p
8,518.8
4,354.2
1,979.6
859.5
418.3
597.5
309.8
I
1,558.2
828.7
129.6
69.1
110.4
240.9
179.6
II
2,183.8
1,320.6
224.5
340.3
48.2
142.7
107.4
III
1,925.8
1,171.5
575.7
33.0
76.7
21.0
47.8
IV
2,590.2
1,250.3
713.2
406.8
132.9
79.9
7.1
I
1,751.4
980.7
459.1
134.7
66.6
60.1
50.2
II
2,573.8
1,526.0
559.7
116.7
160.5
201.1
9.8
III
1,780.2
1,085.5
198.1
353.7
11.3
101.4
30.2
2005
IVp
2,413.4
762.0
762.7
254.4
179.8
234.9
219.61 Including servicing, engineering and R&D. Source: Economic Development Board
INVESTMENT COMMITMENTS IN MANUFACTURING1 BY INDUSTRY CLUSTER [TABLE A9.5]
2004
Million Dollars
2005
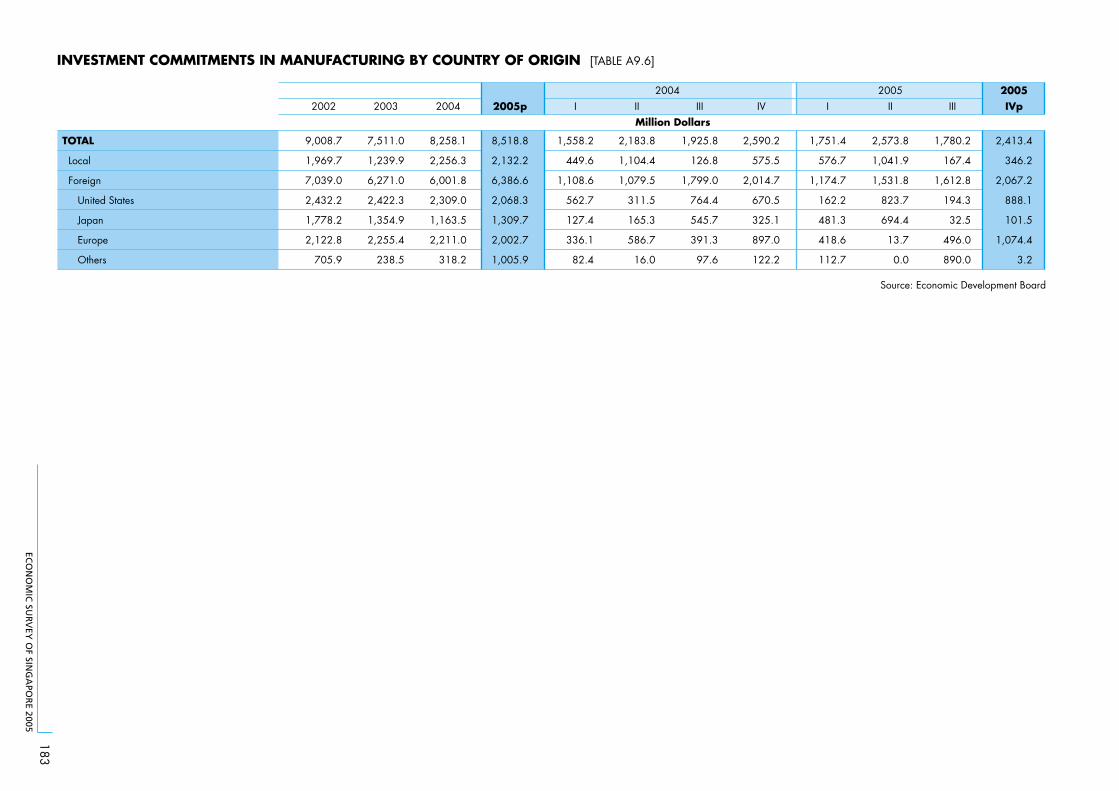
ECO
NO
MIC
SUR
VEY
OF SIN
GA
POR
E 2005
183
TOTAL
Local
Foreign
United States
Japan
Europe
Others
2002
9,008.7
1,969.7
7,039.0
2,432.2
1,778.2
2,122.8
705.9
2003
7,511.0
1,239.9
6,271.0
2,422.3
1,354.9
2,255.4
238.5
2004
8,258.1
2,256.3
6,001.8
2,309.0
1,163.5
2,211.0
318.2
2005p
8,518.8
2,132.2
6,386.6
2,068.3
1,309.7
2,002.7
1,005.9
I
1,558.2
449.6
1,108.6
562.7
127.4
336.1
82.4
II
2,183.8
1,104.4
1,079.5
311.5
165.3
586.7
16.0
III
1,925.8
126.8
1,799.0
764.4
545.7
391.3
97.6
IV
2,590.2
575.5
2,014.7
670.5
325.1
897.0
122.2
I
1,751.4
576.7
1,174.7
162.2
481.3
418.6
112.7
II
2,573.8
1,041.9
1,531.8
823.7
694.4
13.7
0.0
III
1,780.2
167.4
1,612.8
194.3
32.5
496.0
890.0
2005IVp
2,413.4
346.2
2,067.2
888.1
101.5
1,074.4
3.2
Source: Economic Development Board
INVESTMENT COMMITMENTS IN MANUFACTURING BY COUNTRY OF ORIGIN [TABLE A9.6]
Million Dollars
2004 2005
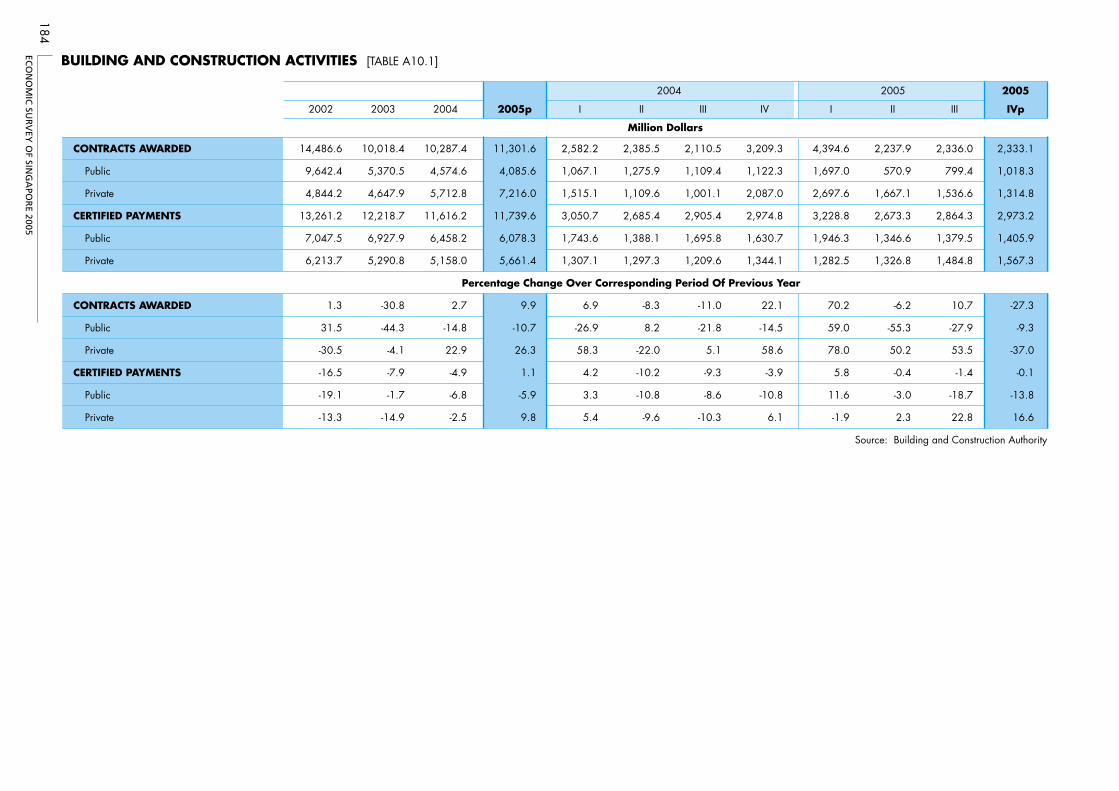
ECO
NO
MIC
SUR
VEY
OF SIN
GA
POR
E 2005
184
CONTRACTS AWARDED
Public
Private
CERTIFIED PAYMENTS
Public
Private
CONTRACTS AWARDED
Public 8.2
Private
CERTIFIED PAYMENTS
Public
Private
2002
14,486.6
9,642.4
4,844.2
13,261.2
7,047.5
6,213.7
1.3
31.5
-30.5
-16.5
-19.1
-13.3
2003
10,018.4
5,370.5
4,647.9
12,218.7
6,927.9
5,290.8
-30.8
-44.3
-4.1
-7.9
-1.7
-14.9
2004
10,287.4
4,574.6
5,712.8
11,616.2
6,458.2
5,158.0
2.7
-14.8
22.9
-4.9
-6.8
-2.5
2005p
11,301.6
4,085.6
7,216.0
11,739.6
6,078.3
5,661.4
9.9
-10.7
26.3
1.1
-5.9
9.8
I
2,582.2
1,067.1
1,515.1
3,050.7
1,743.6
1,307.1
6.9
-26.9
58.3
4.2
3.3
5.4
II
2,385.5
1,275.9
1,109.6
2,685.4
1,388.1
1,297.3
-8.3
-22.0
-10.2
-10.8
-9.6
III
2,110.5
1,109.4
1,001.1
2,905.4
1,695.8
1,209.6
-11.0
-21.8
5.1
-9.3
-8.6
-10.3
IV
3,209.3
1,122.3
2,087.0
2,974.8
1,630.7
1,344.1
22.1
-14.5
58.6
-3.9
-10.8
6.1
I
4,394.6
1,697.0
2,697.6
3,228.8
1,946.3
1,282.5
70.2
59.0
78.0
5.8
11.6
-1.9
II
2,237.9
570.9
1,667.1
2,673.3
1,346.6
1,326.8
-6.2
-55.3
50.2
-0.4
-3.0
2.3
III
2,336.0
799.4
1,536.6
2,864.3
1,379.5
1,484.8
10.7
-27.9
53.5
-1.4
-18.7
22.8
2005
IVp
2,333.1
1,018.3
1,314.8
2,973.2
1,405.9
1,567.3
-27.3
-9.3
-37.0
-0.1
-13.8
16.6
Source: Building and Construction Authority
Percentage Change Over Corresponding Period Of Previous Year
BUILDING AND CONSTRUCTION ACTIVITIES [TABLE A10.1]
2004
Million Dollars
2005
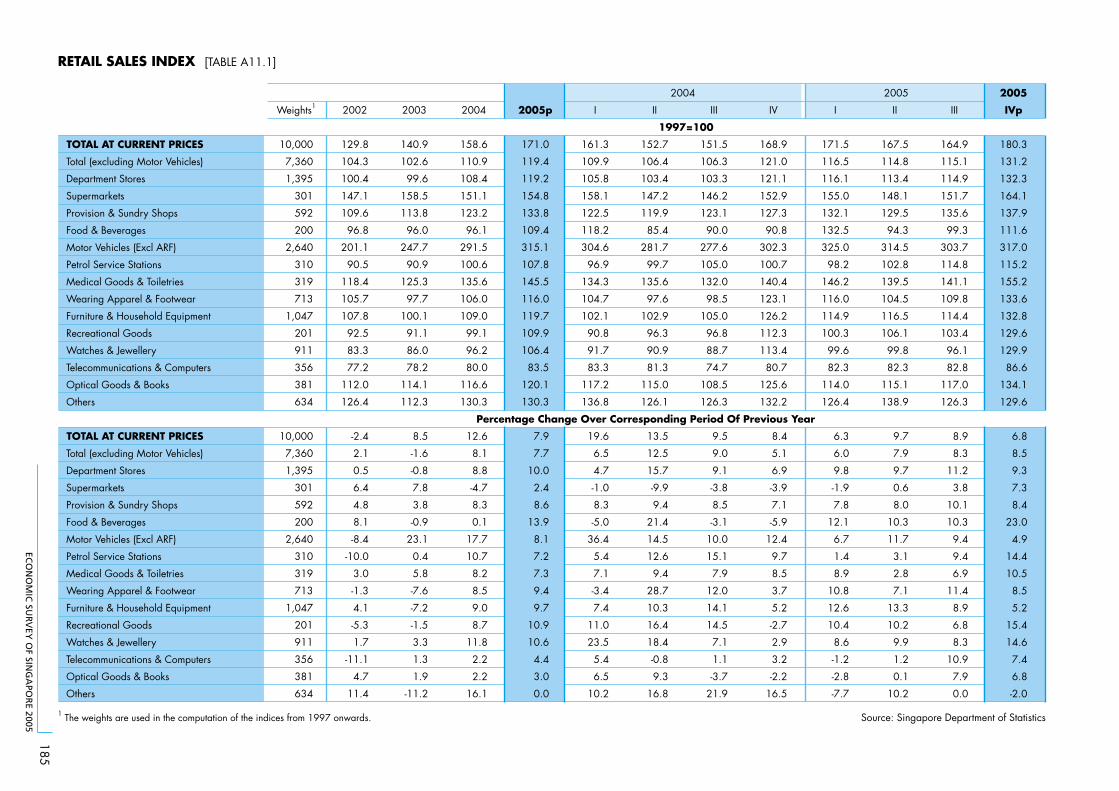
ECO
NO
MIC
SUR
VEY
OF SIN
GA
POR
E 2005
185
TOTAL AT CURRENT PRICES
Total (excluding Motor Vehicles)
Department Stores
Supermarkets
Provision & Sundry Shops
Food & Beverages
Motor Vehicles (Excl ARF)
Petrol Service Stations
Medical Goods & Toiletries
Wearing Apparel & Footwear
Furniture & Household Equipment
Recreational Goods
Watches & Jewellery
Telecommunications & Computers
Optical Goods & Books
Others
Weights1
10,000
7,360
1,395
301
592
200
2,640
310
319
713
1,047
201
911
356
381
634
10,000
7,360
1,395
301
592
200
2,640
310
319
713
1,047
201
911
356
381
634
2002
129.8
104.3
100.4
147.1
109.6
96.8
201.1
90.5
118.4
105.7
107.8
92.5
83.3
77.2
112.0
126.4
-2.4
2.1
0.5
6.4
4.8
8.1
-8.4
-10.0
3.0
-1.3
4.1
-5.3
1.7
-11.1
4.7
11.4
2003
140.9
102.6
99.6
158.5
113.8
96.0
247.7
90.9
125.3
97.7
100.1
91.1
86.0
78.2
114.1
112.3
8.5
-1.6
-0.8
7.8
3.8
-0.9
23.1
0.4
5.8
-7.6
-7.2
-1.5
3.3
1.3
1.9
-11.2
2004
158.6
110.9
108.4
151.1
123.2
96.1
291.5
100.6
135.6
106.0
109.0
99.1
96.2
80.0
116.6
130.3
12.6
8.1
8.8
-4.7
8.3
0.1
17.7
10.7
8.2
8.5
9.0
8.7
11.8
2.2
2.2
16.1
2005p
171.0
119.4
119.2
154.8
133.8
109.4
315.1
107.8
145.5
116.0
119.7
109.9
106.4
83.5
120.1
130.3
7.9
7.7
10.0
2.4
8.6
13.9
8.1
7.2
7.3
9.4
9.7
10.9
10.6
4.4
3.0
0.0
I
161.3
109.9
105.8
158.1
122.5
118.2
304.6
96.9
134.3
104.7
102.1
90.8
91.7
83.3
117.2
136.8
19.6
6.5
4.7
-1.0
8.3
-5.0
36.4
5.4
7.1
-3.4
7.4
11.0
23.5
5.4
6.5
10.2
II
152.7
106.4
103.4
147.2
119.9
85.4
281.7
99.7
135.6
97.6
102.9
96.3
90.9
81.3
115.0
126.1
13.5
12.5
15.7
-9.9
9.4
21.4
14.5
12.6
9.4
28.7
10.3
16.4
18.4
-0.8
9.3
16.8
III
151.5
106.3
103.3
146.2
123.1
90.0
277.6
105.0
132.0
98.5
105.0
96.8
88.7
74.7
108.5
126.3
9.5
9.0
9.1
-3.8
8.5
-3.1
10.0
15.1
7.9
12.0
14.1
14.5
7.1
1.1
-3.7
21.9
IV
168.9
121.0
121.1
152.9
127.3
90.8
302.3
100.7
140.4
123.1
126.2
112.3
113.4
80.7
125.6
132.2
8.4
5.1
6.9
-3.9
7.1
-5.9
12.4
9.7
8.5
3.7
5.2
-2.7
2.9
3.2
-2.2
16.5
I
171.5
116.5
116.1
155.0
132.1
132.5
325.0
98.2
146.2
116.0
114.9
100.3
99.6
82.3
114.0
126.4
6.3
6.0
9.8
-1.9
7.8
12.1
6.7
1.4
8.9
10.8
12.6
10.4
8.6
-1.2
-2.8
-7.7
II
167.5
114.8
113.4
148.1
129.5
94.3
314.5
102.8
139.5
104.5
116.5
106.1
99.8
82.3
115.1
138.9
9.7
7.9
9.7
0.6
8.0
10.3
11.7
3.1
2.8
7.1
13.3
10.2
9.9
1.2
0.1
10.2
III
164.9
115.1
114.9
151.7
135.6
99.3
303.7
114.8
141.1
109.8
114.4
103.4
96.1
82.8
117.0
126.3
8.9
8.3
11.2
3.8
10.1
10.3
9.4
9.4
6.9
11.4
8.9
6.8
8.3
10.9
7.9
0.0
2005
IVp
180.3
131.2
132.3
164.1
137.9
111.6
317.0
115.2
155.2
133.6
132.8
129.6
129.9
86.6
134.1
129.6
6.8
8.5
9.3
7.3
8.4
23.0
4.9
14.4
10.5
8.5
5.2
15.4
14.6
7.4
6.8
-2.0
1 The weights are used in the computation of the indices from 1997 onwards. Source: Singapore Department of Statistics
Percentage Change Over Corresponding Period Of Previous Year
RETAIL SALES INDEX [TABLE A11.1]
2004 2005
1997=100
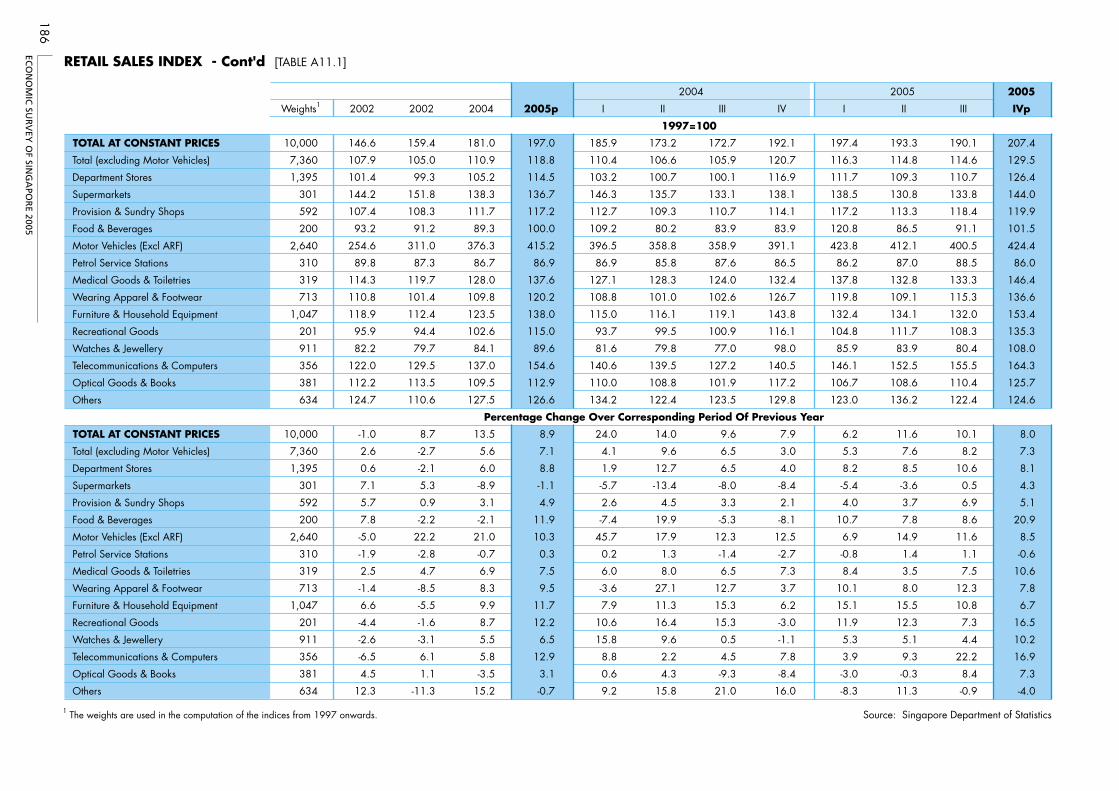
ECO
NO
MIC
SUR
VEY
OF SIN
GA
POR
E 2005
186
RETAIL SALES INDEX - Cont'd [TABLE A11.1]
TOTAL AT CONSTANT PRICES
Total (excluding Motor Vehicles)
Department Stores
Supermarkets
Provision & Sundry Shops
Food & Beverages
Motor Vehicles (Excl ARF)
Petrol Service Stations
Medical Goods & Toiletries
Wearing Apparel & Footwear
Furniture & Household Equipment
Recreational Goods
Watches & Jewellery
Telecommunications & Computers
Optical Goods & Books
Others
Weights1
10,000
7,360
1,395
301
592
200
2,640
310
319
713
1,047
201
911
356
381
634
10,000
7,360
1,395
301
592
200
2,640
310
319
713
1,047
201
911
356
381
634
2002
146.6
107.9
101.4
144.2
107.4
93.2
254.6
89.8
114.3
110.8
118.9
95.9
82.2
122.0
112.2
124.7
-1.0
2.6
0.6
7.1
5.7
7.8
-5.0
-1.9
2.5
-1.4
6.6
-4.4
-2.6
-6.5
4.5
12.3
2002
159.4
105.0
99.3
151.8
108.3
91.2
311.0
87.3
119.7
101.4
112.4
94.4
79.7
129.5
113.5
110.6
8.7
-2.7
-2.1
5.3
0.9
-2.2
22.2
-2.8
4.7
-8.5
-5.5
-1.6
-3.1
6.1
1.1
-11.3
2004
181.0
110.9
105.2
138.3
111.7
89.3
376.3
86.7
128.0
109.8
123.5
102.6
84.1
137.0
109.5
127.5
13.5
5.6
6.0
-8.9
3.1
-2.1
21.0
-0.7
6.9
8.3
9.9
8.7
5.5
5.8
-3.5
15.2
2005p
197.0
118.8
114.5
136.7
117.2
100.0
415.2
86.9
137.6
120.2
138.0
115.0
89.6
154.6
112.9
126.6
8.9
7.1
8.8
-1.1
4.9
11.9
10.3
0.3
7.5
9.5
11.7
12.2
6.5
12.9
3.1
-0.7
I
185.9
110.4
103.2
146.3
112.7
109.2
396.5
86.9
127.1
108.8
115.0
93.7
81.6
140.6
110.0
134.2
24.0
4.1
1.9
-5.7
2.6
-7.4
45.7
0.2
6.0
-3.6
7.9
10.6
15.8
8.8
0.6
9.2
II
173.2
106.6
100.7
135.7
109.3
80.2
358.8
85.8
128.3
101.0
116.1
99.5
79.8
139.5
108.8
122.4
14.0
9.6
12.7
-13.4
4.5
19.9
17.9
1.3
8.0
27.1
11.3
16.4
9.6
2.2
4.3
15.8
III
172.7
105.9
100.1
133.1
110.7
83.9
358.9
87.6
124.0
102.6
119.1
100.9
77.0
127.2
101.9
123.5
9.6
6.5
6.5
-8.0
3.3
-5.3
12.3
-1.4
6.5
12.7
15.3
15.3
0.5
4.5
-9.3
21.0
IV
192.1
120.7
116.9
138.1
114.1
83.9
391.1
86.5
132.4
126.7
143.8
116.1
98.0
140.5
117.2
129.8
7.9
3.0
4.0
-8.4
2.1
-8.1
12.5
-2.7
7.3
3.7
6.2
-3.0
-1.1
7.8
-8.4
16.0
I
197.4
116.3
111.7
138.5
117.2
120.8
423.8
86.2
137.8
119.8
132.4
104.8
85.9
146.1
106.7
123.0
6.2
5.3
8.2
-5.4
4.0
10.7
6.9
-0.8
8.4
10.1
15.1
11.9
5.3
3.9
-3.0
-8.3
II
193.3
114.8
109.3
130.8
113.3
86.5
412.1
87.0
132.8
109.1
134.1
111.7
83.9
152.5
108.6
136.2
11.6
7.6
8.5
-3.6
3.7
7.8
14.9
1.4
3.5
8.0
15.5
12.3
5.1
9.3
-0.3
11.3
III
190.1
114.6
110.7
133.8
118.4
91.1
400.5
88.5
133.3
115.3
132.0
108.3
80.4
155.5
110.4
122.4
10.1
8.2
10.6
0.5
6.9
8.6
11.6
1.1
7.5
12.3
10.8
7.3
4.4
22.2
8.4
-0.9
2005
IVp
207.4
129.5
126.4
144.0
119.9
101.5
424.4
86.0
146.4
136.6
153.4
135.3
108.0
164.3
125.7
124.6
8.0
7.3
8.1
4.3
5.1
20.9
8.5
-0.6
10.6
7.8
6.7
16.5
10.2
16.9
7.3
-4.0
1 The weights are used in the computation of the indices from 1997 onwards. Source: Singapore Department of Statistics
Percentage Change Over Corresponding Period Of Previous Year
2004 2005
1997=100
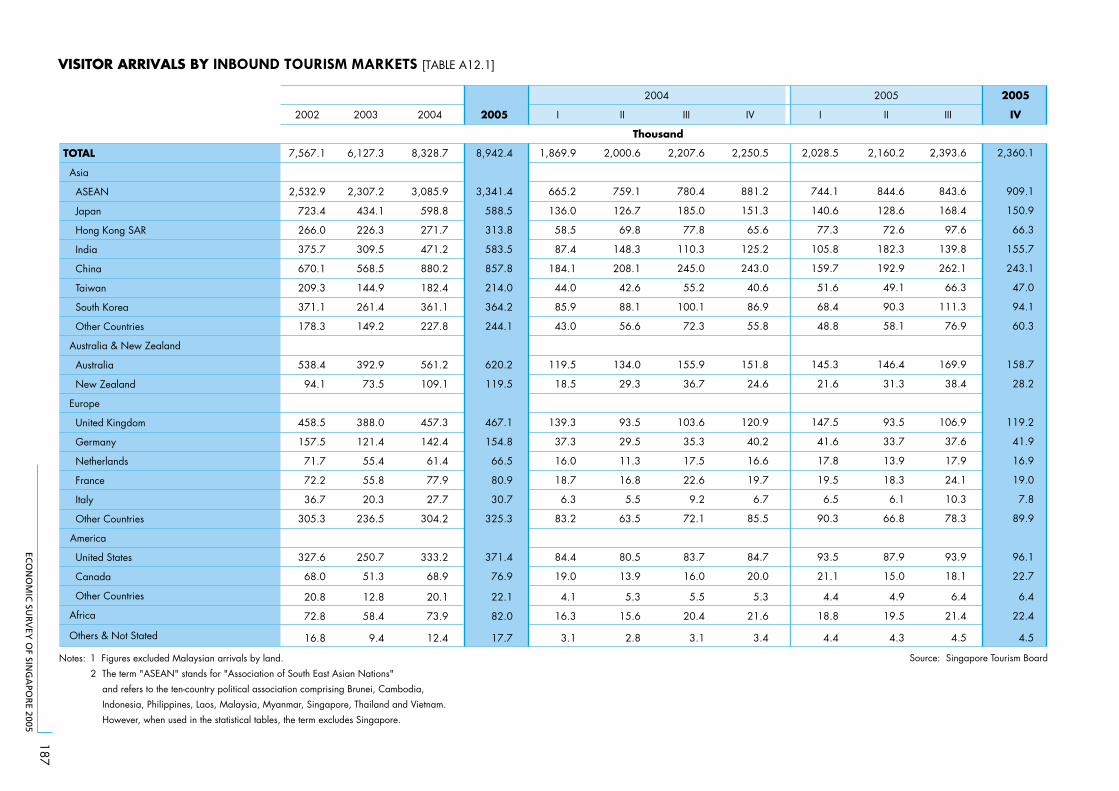
ECO
NO
MIC
SUR
VEY
OF SIN
GA
POR
E 2005
187
2005
2002 2003 2004 2005 I II III IV I II III IV
TOTAL
Asia
ASEAN
Japan
Hong Kong SAR
India
China
Taiwan
South Korea
Other Countries
Australia & New Zealand
Australia
New Zealand
Europe
United Kingdom
Germany
Netherlands
France
Italy
Other Countries
America
United States
Canada
Other Countries
Africa
Others & Not Stated
7,567.1
2,532.9
723.4
266.0
375.7
670.1
209.3
371.1
178.3
538.4
94.1
458.5
157.5
71.7
72.2
36.7
305.3
327.6
68.0
20.8
72.8
16.8
6,127.3
2,307.2
434.1
226.3
309.5
568.5
144.9
261.4
149.2
392.9
73.5
388.0
121.4
55.4
55.8
20.3
236.5
250.7
51.3
12.8
58.4
9.4
8,328.7
3,085.9
598.8
271.7
471.2
880.2
182.4
361.1
227.8
561.2
109.1
457.3
142.4
61.4
77.9
27.7
304.2
333.2
68.9
20.1
73.9
12.4
8,942.4
3,341.4
588.5
313.8
583.5
857.8
214.0
364.2
244.1
620.2
119.5
467.1
154.8
66.5
80.9
30.7
325.3
371.4
76.9
22.1
82.0
17.7
1,869.9
665.2
136.0
58.5
87.4
184.1
44.0
85.9
43.0
119.5
18.5
139.3
37.3
16.0
18.7
6.3
83.2
84.4
19.0
4.1
16.3
3.1
2,000.6
759.1
126.7
69.8
148.3
208.1
42.6
88.1
56.6
134.0
29.3
93.5
29.5
11.3
16.8
5.5
63.5
80.5
13.9
5.3
15.6
2.8
2,207.6
780.4
185.0
77.8
110.3
245.0
55.2
100.1
72.3
155.9
36.7
103.6
35.3
17.5
22.6
9.2
72.1
83.7
16.0
5.5
20.4
3.1
2,250.5
881.2
151.3
65.6
125.2
243.0
40.6
86.9
55.8
151.8
24.6
120.9
40.2
16.6
19.7
6.7
85.5
84.7
20.0
5.3
21.6
3.4
2,028.5
744.1
140.6
77.3
105.8
159.7
51.6
68.4
48.8
145.3
21.6
147.5
41.6
17.8
19.5
6.5
90.3
93.5
21.1
4.4
18.8
4.4
2,160.2
844.6
128.6
72.6
182.3
192.9
49.1
90.3
58.1
146.4
31.3
93.5
33.7
13.9
18.3
6.1
66.8
87.9
15.0
4.9
19.5
4.3
2,393.6
843.6
168.4
97.6
139.8
262.1
66.3
111.3
76.9
169.9
38.4
106.9
37.6
17.9
24.1
10.3
78.3
93.9
18.1
6.4
21.4
4.5
2,360.1
909.1
150.9
66.3
155.7
243.1
47.0
94.1
60.3
158.7
28.2
119.2
41.9
16.9
19.0
7.8
89.9
96.1
22.7
6.4
22.4
4.5
Notes: 1 Figures excluded Malaysian arrivals by land. Source: Singapore Tourism Board
2 The term "ASEAN" stands for "Association of South East Asian Nations"
and refers to the ten-country political association comprising Brunei, Cambodia,
Indonesia, Philippines, Laos, Malaysia, Myanmar, Singapore, Thailand and Vietnam.
However, when used in the statistical tables, the term excludes Singapore.
Thousand
VISITOR ARRIVALS BY INBOUND TOURISM MARKETS [TABLE A12.1]
2004 2005
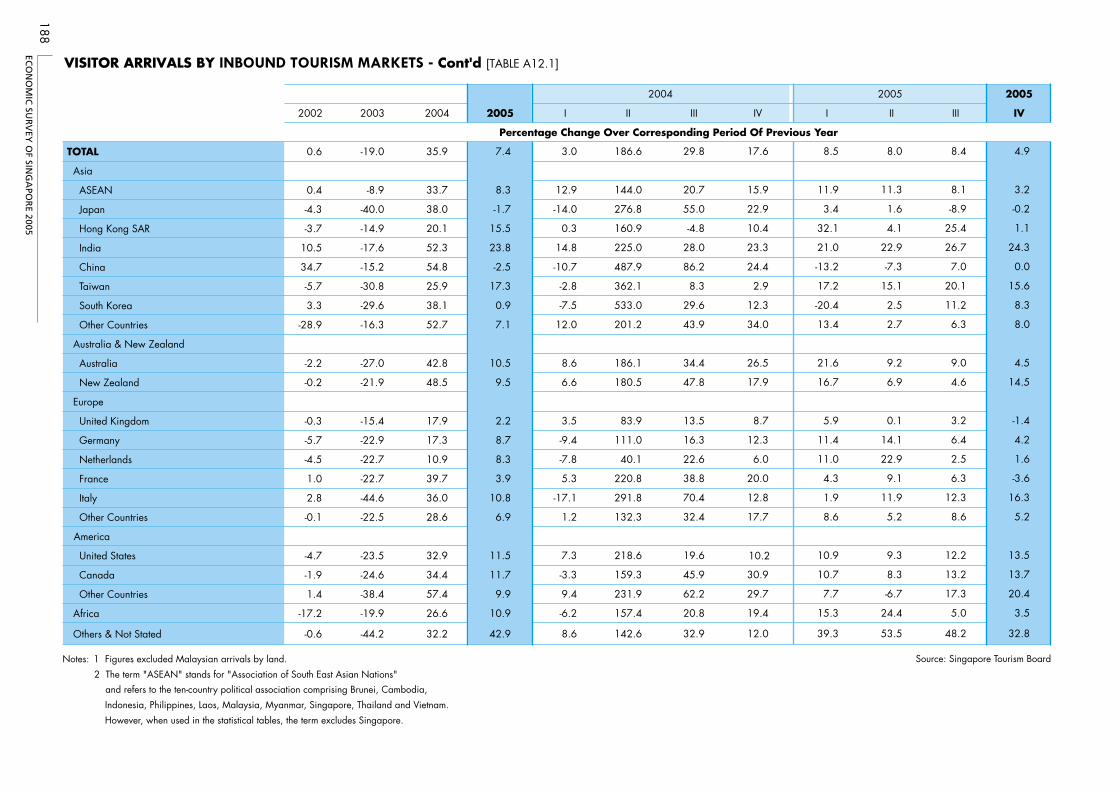
ECO
NO
MIC
SUR
VEY
OF SIN
GA
POR
E 2005
188
2005
2002 2003 2004 2005 I II III IV I II III IV
TOTAL
Asia
ASEAN
Japan
Hong Kong SAR
India
China
Taiwan
South Korea
Other Countries
Australia & New Zealand
Australia
New Zealand
Europe
United Kingdom
Germany
Netherlands
France
Italy
Other Countries
America
United States 10.2
Canada
Other Countries
Africa
Others & Not Stated
0.6
0.4
-4.3
-3.7
10.5
34.7
-5.7
3.3
-28.9
-2.2
-0.2
-0.3
-5.7
-4.5
1.0
2.8
-0.1
-4.7
-1.9
1.4
-17.2
-0.6
-19.0
-8.9
-40.0
-14.9
-17.6
-15.2
-30.8
-29.6
-16.3
-27.0
-21.9
-15.4
-22.9
-22.7
-22.7
-44.6
-22.5
-23.5
-24.6
-38.4
-19.9
-44.2
35.9
33.7
38.0
20.1
52.3
54.8
25.9
38.1
52.7
42.8
48.5
17.9
17.3
10.9
39.7
36.0
28.6
32.9
34.4
57.4
26.6
32.2
7.4
8.3
-1.7
15.5
23.8
-2.5
17.3
0.9
7.1
10.5
9.5
2.2
8.7
8.3
3.9
10.8
6.9
11.5
11.7
9.9
10.9
42.9
3.0
12.9
-14.0
0.3
14.8
-10.7
-2.8
-7.5
12.0
8.6
6.6
3.5
-9.4
-7.8
5.3
-17.1
1.2
7.3
-3.3
9.4
-6.2
8.6
186.6
144.0
276.8
160.9
225.0
487.9
362.1
533.0
201.2
186.1
180.5
83.9
111.0
40.1
220.8
291.8
132.3
218.6
159.3
231.9
157.4
142.6
29.8
20.7
55.0
-4.8
28.0
86.2
8.3
29.6
43.9
34.4
47.8
13.5
16.3
22.6
38.8
70.4
32.4
19.6
45.9
62.2
20.8
32.9
17.6
15.9
22.9
10.4
23.3
24.4
2.9
12.3
34.0
26.5
17.9
8.7
12.3
6.0
20.0
12.8
17.7
30.9
29.7
19.4
12.0
8.5
11.9
3.4
32.1
21.0
-13.2
17.2
-20.4
13.4
21.6
16.7
5.9
11.4
11.0
4.3
1.9
8.6
10.9
10.7
7.7
15.3
39.3
8.0
11.3
1.6
4.1
22.9
-7.3
15.1
2.5
2.7
9.2
6.9
0.1
14.1
22.9
9.1
11.9
5.2
9.3
8.3
-6.7
24.4
53.5
8.4
8.1
-8.9
25.4
26.7
7.0
20.1
11.2
6.3
9.0
4.6
3.2
6.4
2.5
6.3
12.3
8.6
12.2
13.2
17.3
5.0
48.2
4.9
3.2
-0.2
1.1
24.3
0.0
15.6
8.3
8.0
4.5
14.5
-1.4
4.2
1.6
-3.6
16.3
5.2
13.5
13.7
20.4
3.5
32.8
Notes: 1 Figures excluded Malaysian arrivals by land. Source: Singapore Tourism Board
2 The term "ASEAN" stands for "Association of South East Asian Nations"and refers to the ten-country political association comprising Brunei, Cambodia,
Indonesia, Philippines, Laos, Malaysia, Myanmar, Singapore, Thailand and Vietnam.
However, when used in the statistical tables, the term excludes Singapore.
Percentage Change Over Corresponding Period Of Previous Year
VISITOR ARRIVALS BY INBOUND TOURISM MARKETS - Cont'd [TABLE A12.1]
2004 2005
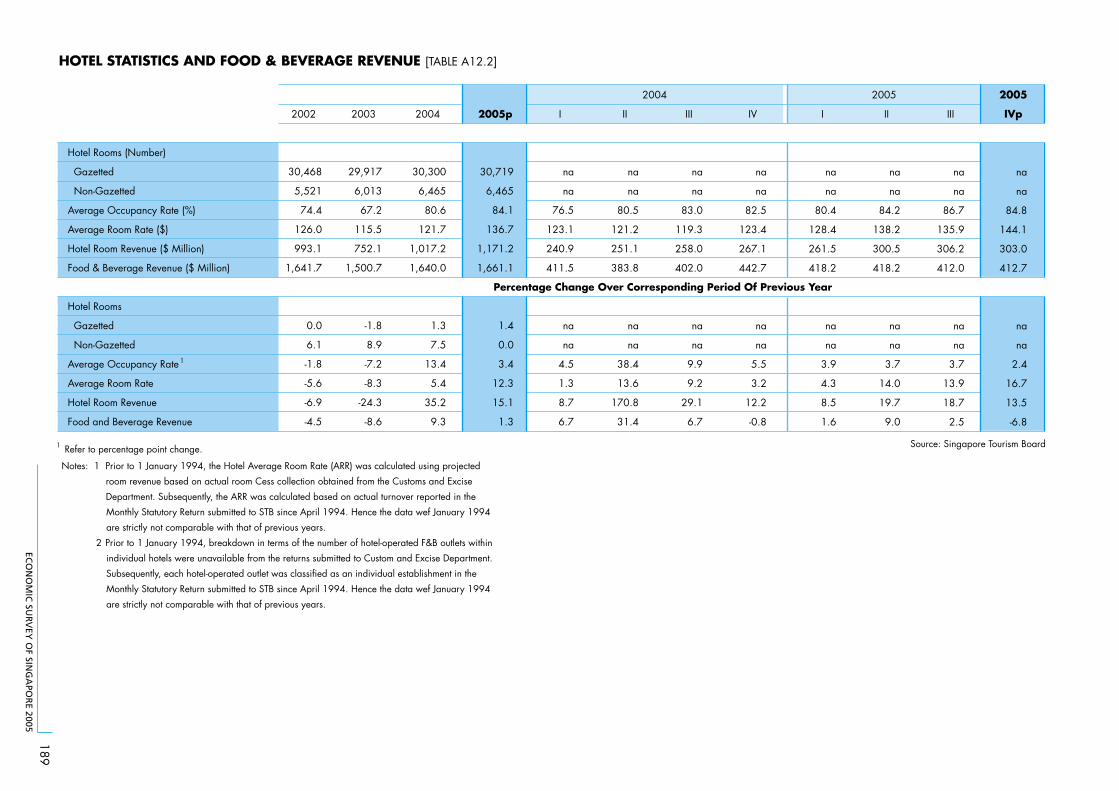
ECO
NO
MIC
SUR
VEY
OF SIN
GA
POR
E 2005
189
HOTEL STATISTICS AND FOOD & BEVERAGE REVENUE [TABLE A12.2]
2005
2002 2003 2004 2005p I II III IV I II III IVp
Hotel Rooms (Number)
Gazetted
Non-Gazetted
Average Occupancy Rate (%)
Average Room Rate ($)
Hotel Room Revenue ($ Million)
Food & Beverage Revenue ($ Million)
Hotel Rooms
Gazetted
Non-Gazetted
Average Occupancy Rate1
Average Room Rate
Hotel Room Revenue
Food and Beverage Revenue
30,468
5,521
74.4
126.0
993.1
1,641.7
0.0
6.1
-1.8
-5.6
-6.9
-4.5
29,917
6,013
67.2
115.5
752.1
1,500.7
-1.8
8.9
-7.2
-8.3
-24.3
-8.6
30,300
6,465
80.6
121.7
1,017.2
1,640.0
1.3
7.5
13.4
5.4
35.2
9.3
30,719
6,465
84.1
136.7
1,171.2
1,661.1
1.4
0.0
3.4
12.3
15.1
1.3
na
na
76.5
123.1
240.9
411.5
na
na
4.5
1.3
8.7
6.7
na
na
80.5
121.2
251.1
383.8
na
na
38.4
13.6
170.8
31.4
na
na
83.0
119.3
258.0
402.0
na
na
9.9
9.2
29.1
6.7
na
na
82.5
123.4
267.1
442.7
na
na
5.5
3.2
12.2
-0.8
na
na
80.4
128.4
261.5
418.2
na
na
3.9
4.3
8.5
1.6
na
na
84.2
138.2
300.5
418.2
na
na
3.7
14.0
19.7
9.0
na
na
86.7
135.9
306.2
412.0
na
na
3.7
13.9
18.7
2.5
na
na
84.8
144.1
303.0
412.7
na
na
2.4
16.7
13.5
-6.8
1 Refer to percentage point change. Source: Singapore Tourism Board
Notes: 1 Prior to 1 January 1994, the Hotel Average Room Rate (ARR) was calculated using projected
room revenue based on actual room Cess collection obtained from the Customs and Excise
Department. Subsequently, the ARR was calculated based on actual turnover reported in the
Monthly Statutory Return submitted to STB since April 1994. Hence the data wef January 1994
are strictly not comparable with that of previous years.
2 Prior to 1 January 1994, breakdown in terms of the number of hotel-operated F&B outlets within
individual hotels were unavailable from the returns submitted to Custom and Excise Department.
Subsequently, each hotel-operated outlet was classified as an individual establishment in the
Monthly Statutory Return submitted to STB since April 1994. Hence the data wef January 1994
are strictly not comparable with that of previous years.
Percentage Change Over Corresponding Period Of Previous Year
2004 2005
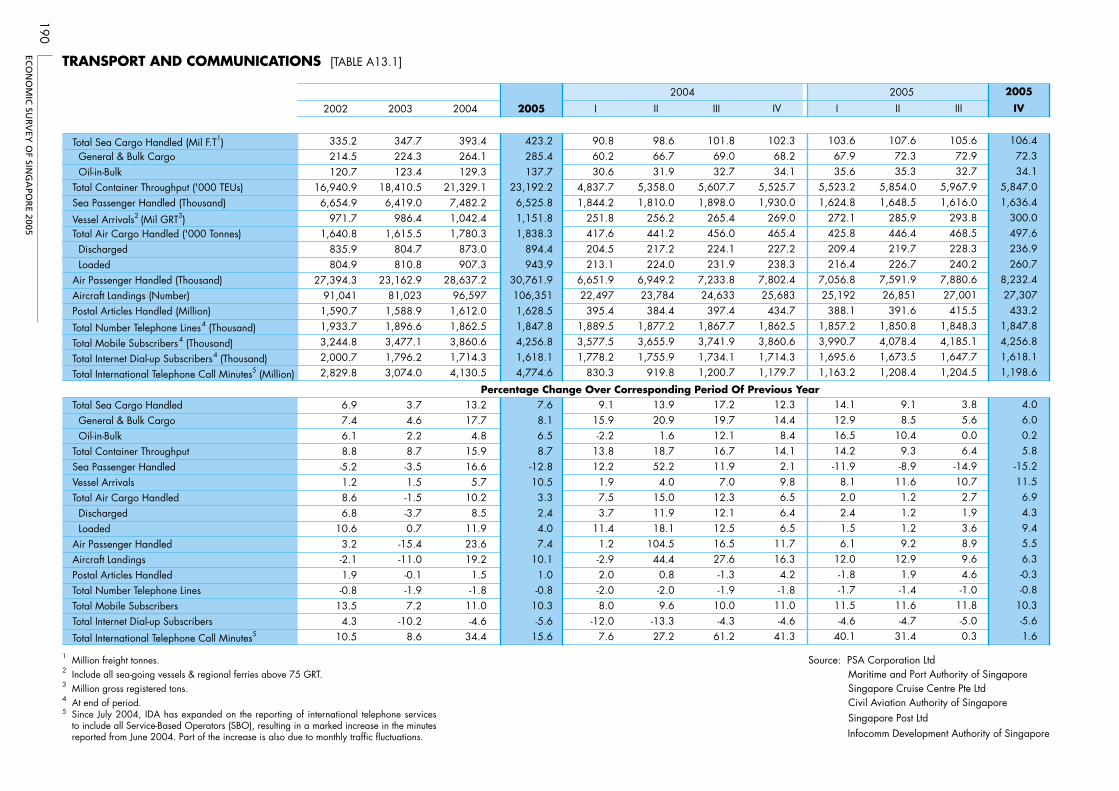
ECO
NO
MIC
SUR
VEY
OF SIN
GA
POR
E 2005
190
TRANSPORT AND COMMUNICATIONS [TABLE A13.1]
Total Sea Cargo Handled (Mil F.T1) General & Bulk Cargo Oil-in-Bulk Total Container Throughput ('000 TEUs) Sea Passenger Handled (Thousand)
Vessel Arrivals2 (Mil GRT3) Total Air Cargo Handled ('000 Tonnes) Discharged Loaded Air Passenger Handled (Thousand) Aircraft Landings (Number) Postal Articles Handled (Million)
Total Number Telephone Lines4 (Thousand) Total Mobile Subscribers4 (Thousand) Total Internet Dial-up Subscribers4 (Thousand) Total International Telephone Call Minutes5 (Million)
Total Sea Cargo Handled General & Bulk Cargo Oil-in-Bulk Total Container Throughput Sea Passenger Handled Vessel Arrivals Total Air Cargo Handled Discharged Loaded Air Passenger Handled Aircraft Landings Postal Articles Handled Total Number Telephone Lines Total Mobile Subscribers Total Internet Dial-up Subscribers
Total International Telephone Call Minutes5
2002
335.2214.5120.7
16,940.96,654.9
971.71,640.8
835.9804.9
27,394.391,0411,590.71,933.73,244.82,000.72,829.8
6.97.46.18.8-5.21.28.66.8
10.63.2-2.11.9-0.8
13.54.3
10.5
2003
347.7224.3123.4
18,410.56,419.0
986.41,615.5
804.7810.8
23,162.981,0231,588.91,896.63,477.11,796.23,074.0
3.74.62.28.7-3.51.5-1.5-3.70.7
-15.4-11.0-0.1-1.97.2
-10.28.6
2004
393.4264.1129.3
21,329.17,482.21,042.41,780.3
873.0907.3
28,637.296,5971,612.01,862.53,860.61,714.34,130.5
13.217.74.8
15.916.65.7
10.28.5
11.923.619.21.5-1.8
11.0-4.6
34.4
2005
423.2285.4137.7
23,192.26,525.81,151.81,838.3
894.4943.9
30,761.9106,3511,628.51,847.84,256.81,618.14,774.6
7.68.16.58.7
-12.810.53.32.44.07.4
10.11.0-0.8
10.3-5.6
15.6
I
90.860.230.6
4,837.71,844.2
251.8417.6204.5213.1
6,651.922,497395.4
1,889.53,577.51,778.2
830.3
9.115.9-2.2
13.812.21.97.53.7
11.41.2-2.92.0-2.08.0
-12.07.6
II
98.666.731.9
5,358.01,810.0
256.2441.2217.2224.0
6,949.223,784384.4
1,877.23,655.91,755.9
919.8
13.920.91.6
18.752.24.0
15.011.918.1
104.544.40.8-2.09.6
-13.327.2
III
101.869.032.7
5,607.71,898.0
265.4456.0224.1231.9
7,233.824,633397.4
1,867.73,741.91,734.11,200.7
17.219.712.116.711.97.0
12.312.112.516.527.6-1.3-1.9
10.0-4.3
61.2
IV
102.368.234.1
5,525.71,930.0
269.0465.4227.2238.3
7,802.425,683434.7
1,862.53,860.61,714.31,179.7
12.314.48.4
14.12.19.86.56.46.5
11.716.34.2-1.8
11.0-4.6
41.3
I
103.667.935.6
5,523.21,624.8
272.1425.8209.4216.4
7,056.825,192388.1
1,857.23,990.71,695.61,163.2
14.112.916.514.2-11.9
8.12.02.41.56.1
12.0-1.8-1.7
11.5-4.6
40.1
II
107.672.335.3
5,854.01,648.5
285.9446.4219.7226.7
7,591.926,851391.6
1,850.84,078.41,673.51,208.4
9.18.5
10.49.3-8.9
11.61.21.21.29.2
12.91.9-1.4
11.6-4.7
31.4
III
105.672.932.7
5,967.91,616.0
293.8468.5228.3240.2
7,880.627,001415.5
1,848.34,185.11,647.71,204.5
3.85.60.06.4
-14.910.72.71.93.68.99.64.6-1.0
11.8-5.00.3
2005
IV
106.472.334.1
5,847.01,636.4
300.0497.6236.9260.7
8,232.427,307433.2
1,847.84,256.81,618.11,198.6
4.06.00.25.8
-15.211.56.94.39.45.56.3-0.3-0.8
10.3-5.61.6
1 Million freight tonnes. Source: PSA Corporation Ltd2 Include all sea-going vessels & regional ferries above 75 GRT. Maritime and Port Authority of Singapore3 Million gross registered tons. Singapore Cruise Centre Pte Ltd4 At end of period. Civil Aviation Authority of Singapore
Singapore Post LtdInfocomm Development Authority of Singapore
2004
Percentage Change Over Corresponding Period Of Previous Year
2005
5 Since July 2004, IDA has expanded on the reporting of international telephone services to include all Service-Based Operators (SBO), resulting in a marked increase in the minutes reported from June 2004. Part of the increase is also due to monthly traffic fluctuations.
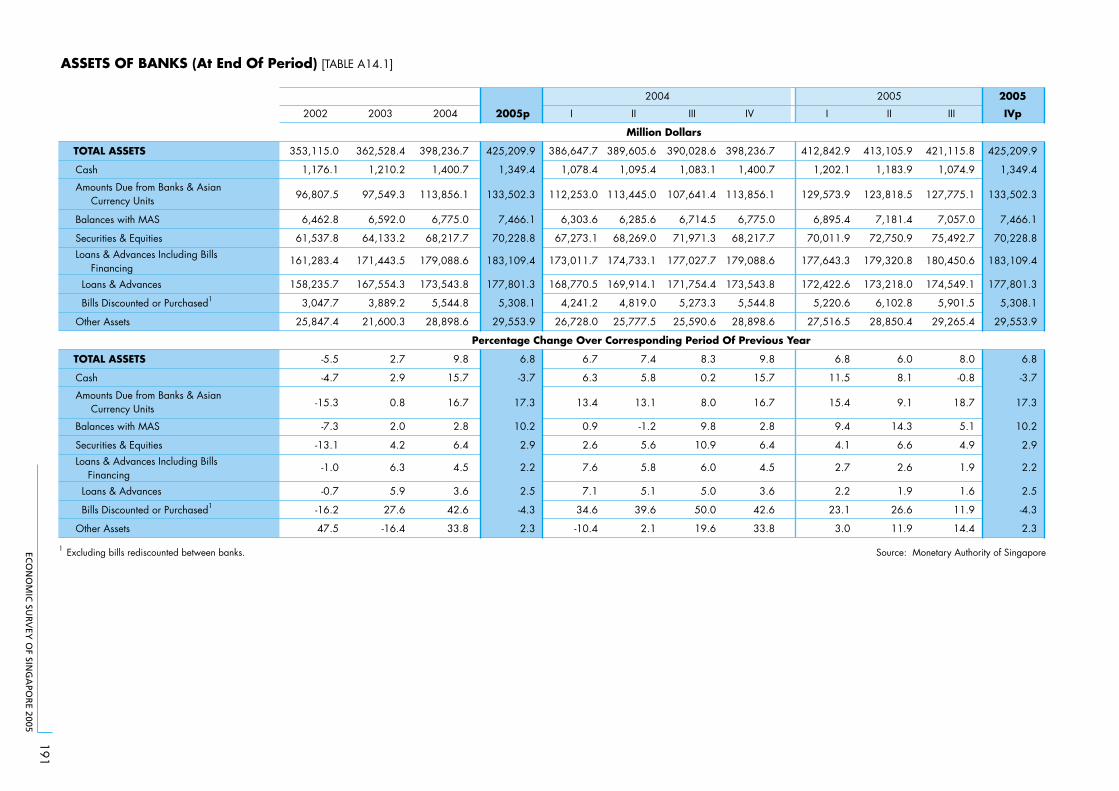
ECO
NO
MIC
SUR
VEY
OF SIN
GA
POR
E 2005
191
ASSETS OF BANKS (At End Of Period) [TABLE A14.1]
2005
2002 2003 2004 2005p I II III IV I II III IVp
TOTAL ASSETS 389,605.6 412,842.9
Cash 1,095.4 1,202.1
Amounts Due from Banks & Asian Currency Units 113,445.0 129,573.9
Balances with MAS 6,285.6 6,895.4
Securities & Equities 68,269.0 70,011.9
Loans & Advances Including Bills Financing
174,733.1 177,643.3
Loans & Advances 169,914.1 172,422.6
Bills Discounted or Purchased1 4,819.0 5,220.6
Other Assets 25,777.5 27,516.5
TOTAL ASSETS 7.4 6.8
Cash 5.8 11.5
Amounts Due from Banks & Asian Currency Units 13.1 15.4
Balances with MAS -1.2 9.4
Securities & Equities 5.6 4.1
Loans & Advances Including Bills Financing
5.8 2.7
Loans & Advances 5.1 2.2
Bills Discounted or Purchased1 39.6 23.1
Other Assets
353,115.0
1,176.1
96,807.5
6,462.8
61,537.8
161,283.4
158,235.7
3,047.7
25,847.4
-5.5
-4.7
-15.3
-7.3
-13.1
-1.0
-0.7
-16.2
47.5
362,528.4
1,210.2
97,549.3
6,592.0
64,133.2
171,443.5
167,554.3
3,889.2
21,600.3
2.7
2.9
0.8
2.0
4.2
6.3
5.9
27.6
-16.4
398,236.7
1,400.7
113,856.1
6,775.0
68,217.7
179,088.6
173,543.8
5,544.8
28,898.6
9.8
15.7
16.7
2.8
6.4
4.5
3.6
42.6
33.8
425,209.9
1,349.4
133,502.3
7,466.1
70,228.8
183,109.4
177,801.3
5,308.1
29,553.9
6.8
-3.7
17.3
10.2
2.9
2.2
2.5
-4.3
2.3
386,647.7
1,078.4
112,253.0
6,303.6
67,273.1
173,011.7
168,770.5
4,241.2
26,728.0
6.7
6.3
13.4
0.9
2.6
7.6
7.1
34.6
-10.4 2.1
390,028.6
1,083.1
107,641.4
6,714.5
71,971.3
177,027.7
171,754.4
5,273.3
25,590.6
8.3
0.2
8.0
9.8
10.9
6.0
5.0
50.0
19.6
398,236.7
1,400.7
113,856.1
6,775.0
68,217.7
179,088.6
173,543.8
5,544.8
28,898.6
9.8
15.7
16.7
2.8
6.4
4.5
3.6
42.6
33.8 3.0
413,105.9
1,183.9
123,818.5
7,181.4
72,750.9
179,320.8
173,218.0
6,102.8
28,850.4
6.0
8.1
9.1
14.3
6.6
2.6
1.9
26.6
11.9
421,115.8
1,074.9
127,775.1
7,057.0
75,492.7
180,450.6
174,549.1
5,901.5
29,265.4
8.0
-0.8
18.7
5.1
4.9
1.9
1.6
11.9
14.4
425,209.9
1,349.4
133,502.3
7,466.1
70,228.8
183,109.4
177,801.3
5,308.1
29,553.9
6.8
-3.7
17.3
10.2
2.9
2.2
2.5
-4.3
2.3
1 Excluding bills rediscounted between banks. Source: Monetary Authority of Singapore
Percentage Change Over Corresponding Period Of Previous Year
2004 2005
Million Dollars
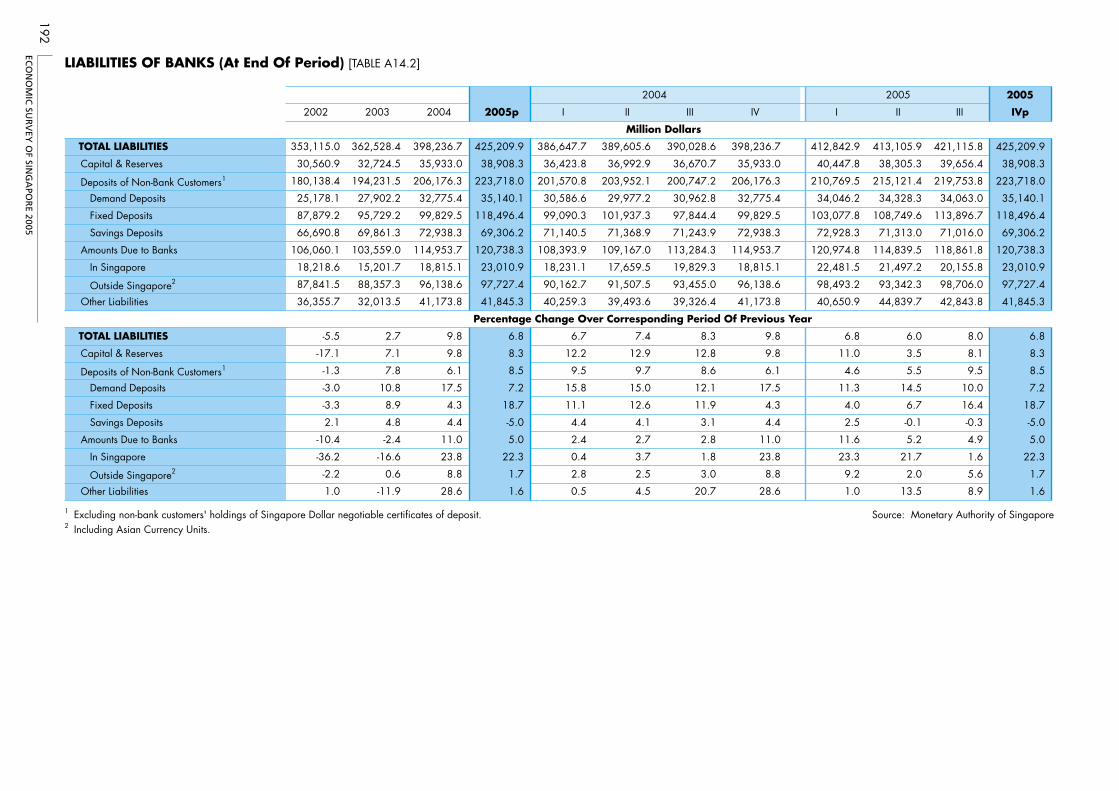
ECO
NO
MIC
SUR
VEY
OF SIN
GA
POR
E 2005
192
LIABILITIES OF BANKS (At End Of Period) [TABLE A14.2]
2005
2002 2003 2004 2005p I II III IV I II III IVp
TOTAL LIABILITIES
Capital & Reserves
Deposits of Non-Bank Customers1
Demand Deposits
Fixed Deposits
Savings Deposits
Amounts Due to Banks
In Singapore
Outside Singapore2
Other Liabilities
TOTAL LIABILITIES
Capital & Reserves
Deposits of Non-Bank Customers1
Demand Deposits
Fixed Deposits
Savings Deposits
Amounts Due to Banks
In Singapore
Outside Singapore2
Other Liabilities
353,115.0
30,560.9
180,138.4
25,178.1
87,879.2
66,690.8
106,060.1
18,218.6
87,841.5
36,355.7
-5.5
-17.1
-1.3
-3.0
-3.3
2.1
-10.4
-36.2
-2.2
1.0
362,528.4
32,724.5
194,231.5
27,902.2
95,729.2
69,861.3
103,559.0
15,201.7
88,357.3
32,013.5
2.7
7.1
7.8
10.8
8.9
4.8
-2.4
-16.6
0.6
-11.9
398,236.7
35,933.0
206,176.3
32,775.4
99,829.5
72,938.3
114,953.7
18,815.1
96,138.6
41,173.8
9.8
9.8
6.1
17.5
4.3
4.4
11.0
23.8
8.8
28.6
425,209.9
38,908.3
223,718.0
35,140.1
118,496.4
69,306.2
120,738.3
23,010.9
97,727.4
41,845.3
6.8
8.3
8.5
7.2
18.7
-5.0
5.0
22.3
1.7
1.6
386,647.7
36,423.8
201,570.8
30,586.6
99,090.3
71,140.5
108,393.9
18,231.1
90,162.7
40,259.3
6.7
12.2
9.5
15.8
11.1
4.4
2.4
0.4
2.8
0.5
389,605.6
36,992.9
203,952.1
29,977.2
101,937.3
71,368.9
109,167.0
17,659.5
91,507.5
39,493.6
7.4
12.9
9.7
15.0
12.6
4.1
2.7
3.7
2.5
4.5
390,028.6
36,670.7
200,747.2
30,962.8
97,844.4
71,243.9
113,284.3
19,829.3
93,455.0
39,326.4
8.3
12.8
8.6
12.1
11.9
3.1
2.8
1.8
3.0
20.7
398,236.7
35,933.0
206,176.3
32,775.4
99,829.5
72,938.3
114,953.7
18,815.1
96,138.6
41,173.8
9.8
9.8
6.1
17.5
4.3
4.4
11.0
23.8
8.8
28.6
412,842.9
40,447.8
210,769.5
34,046.2
103,077.8
72,928.3
120,974.8
22,481.5
98,493.2
40,650.9
6.8
11.0
4.6
11.3
4.0
2.5
11.6
23.3
9.2
1.0
413,105.9
38,305.3
215,121.4
34,328.3
108,749.6
71,313.0
114,839.5
21,497.2
93,342.3
44,839.7
6.0
3.5
5.5
14.5
6.7
-0.1
5.2
21.7
2.0
13.5
421,115.8
39,656.4
219,753.8
34,063.0
113,896.7
71,016.0
118,861.8
20,155.8
98,706.0
42,843.8
8.0
8.1
9.5
10.0
16.4
-0.3
4.9
1.6
5.6
8.9
425,209.9
38,908.3
223,718.0
35,140.1
118,496.4
69,306.2
120,738.3
23,010.9
97,727.4
41,845.3
6.8
8.3
8.5
7.2
18.7
-5.0
5.0
22.3
1.7
1.6
1 Excluding non-bank customers' holdings of Singapore Dollar negotiable certificates of deposit. Source: Monetary Authority of Singapore2 Including Asian Currency Units.
Million Dollars
Percentage Change Over Corresponding Period Of Previous Year
2004 2005
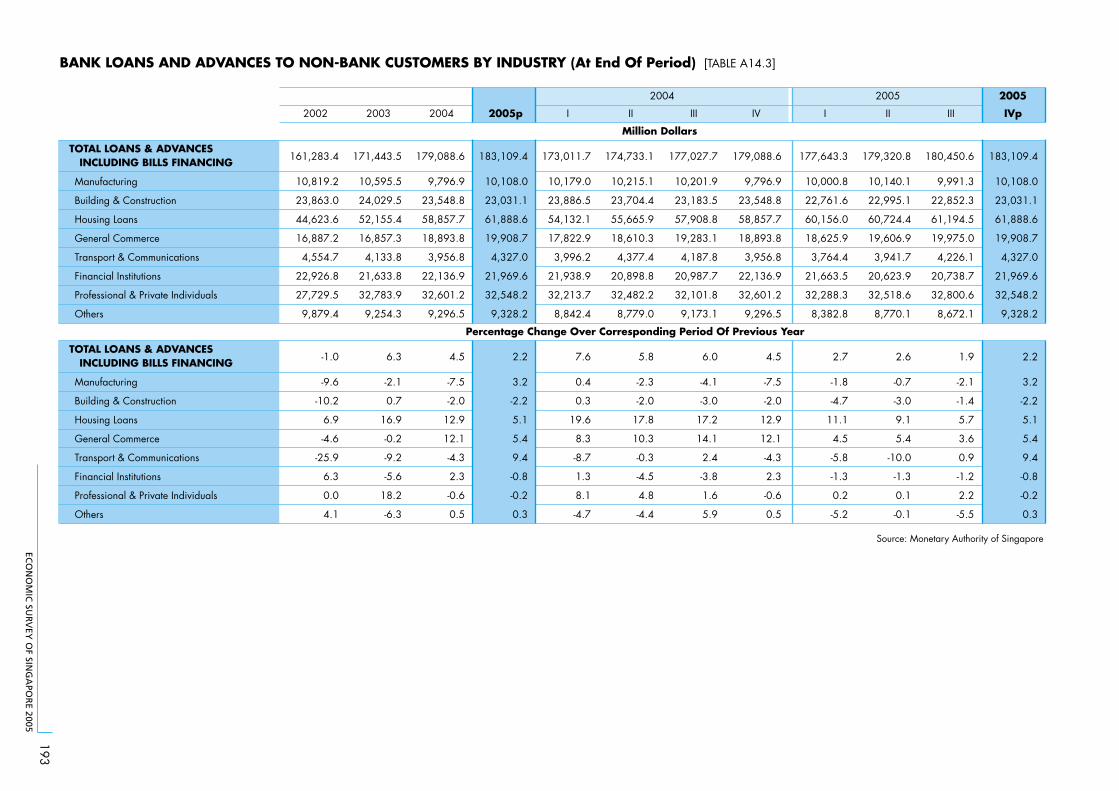
ECO
NO
MIC
SUR
VEY
OF SIN
GA
POR
E 2005
193
BANK LOANS AND ADVANCES TO NON-BANK CUSTOMERS BY INDUSTRY (At End Of Period) [TABLE A14.3]
2005
2002 2003 2004 2005p I II III IV I II III IVp
TOTAL LOANS & ADVANCES INCLUDING BILLS FINANCING
Manufacturing
Building & Construction
Housing Loans
General Commerce
Transport & Communications
Financial Institutions
Professional & Private Individuals
Others
TOTAL LOANS & ADVANCES INCLUDING BILLS FINANCING
Manufacturing
Building & Construction
Housing Loans
General Commerce
Transport & Communications
Financial Institutions
Professional & Private Individuals
Others
161,283.4
10,819.2
23,863.0
44,623.6
16,887.2
4,554.7
22,926.8
27,729.5
9,879.4
-1.0
-9.6
-10.2
6.9
-4.6
-25.9
6.3
0.0
4.1
171,443.5
10,595.5
24,029.5
52,155.4
16,857.3
4,133.8
21,633.8
32,783.9
9,254.3
6.3
-2.1
0.7
16.9
-0.2
-9.2
-5.6
18.2
-6.3
179,088.6
9,796.9
23,548.8
58,857.7
18,893.8
3,956.8
22,136.9
32,601.2
9,296.5
4.5
-7.5
-2.0
12.9
12.1
-4.3
2.3
-0.6
0.5
183,109.4
10,108.0
23,031.1
61,888.6
19,908.7
4,327.0
21,969.6
32,548.2
9,328.2
2.2
3.2
-2.2
5.1
5.4
9.4
-0.8
-0.2
0.3
173,011.7
10,179.0
23,886.5
54,132.1
17,822.9
3,996.2
21,938.9
32,213.7
8,842.4
7.6
0.4
0.3
19.6
8.3
-8.7
1.3
8.1
-4.7
174,733.1
10,215.1
23,704.4
55,665.9
18,610.3
4,377.4
20,898.8
32,482.2
8,779.0
5.8
-2.3
-2.0
17.8
10.3
-0.3
-4.5
4.8
-4.4
177,027.7
10,201.9
23,183.5
57,908.8
19,283.1
4,187.8
20,987.7
32,101.8
9,173.1
6.0
-4.1
-3.0
17.2
14.1
2.4
-3.8
1.6
5.9
179,088.6
9,796.9
23,548.8
58,857.7
18,893.8
3,956.8
22,136.9
32,601.2
9,296.5
4.5
-7.5
-2.0
12.9
12.1
-4.3
2.3
-0.6
0.5
177,643.3
10,000.8
22,761.6
60,156.0
18,625.9
3,764.4
21,663.5
32,288.3
8,382.8
2.7
-1.8
-4.7
11.1
4.5
-5.8
-1.3
0.2
-5.2
179,320.8
10,140.1
22,995.1
60,724.4
19,606.9
3,941.7
20,623.9
32,518.6
8,770.1
2.6
-0.7
-3.0
9.1
5.4
-10.0
-1.3
0.1
-0.1
180,450.6
9,991.3
22,852.3
61,194.5
19,975.0
4,226.1
20,738.7
32,800.6
8,672.1
1.9
-2.1
-1.4
5.7
3.6
0.9
-1.2
2.2
-5.5
183,109.4
10,108.0
23,031.1
61,888.6
19,908.7
4,327.0
21,969.6
32,548.2
9,328.2
2.2
3.2
-2.2
5.1
5.4
9.4
-0.8
-0.2
0.3
Source: Monetary Authority of Singapore
Million Dollars
Percentage Change Over Corresponding Period Of Previous Year
2004 2005
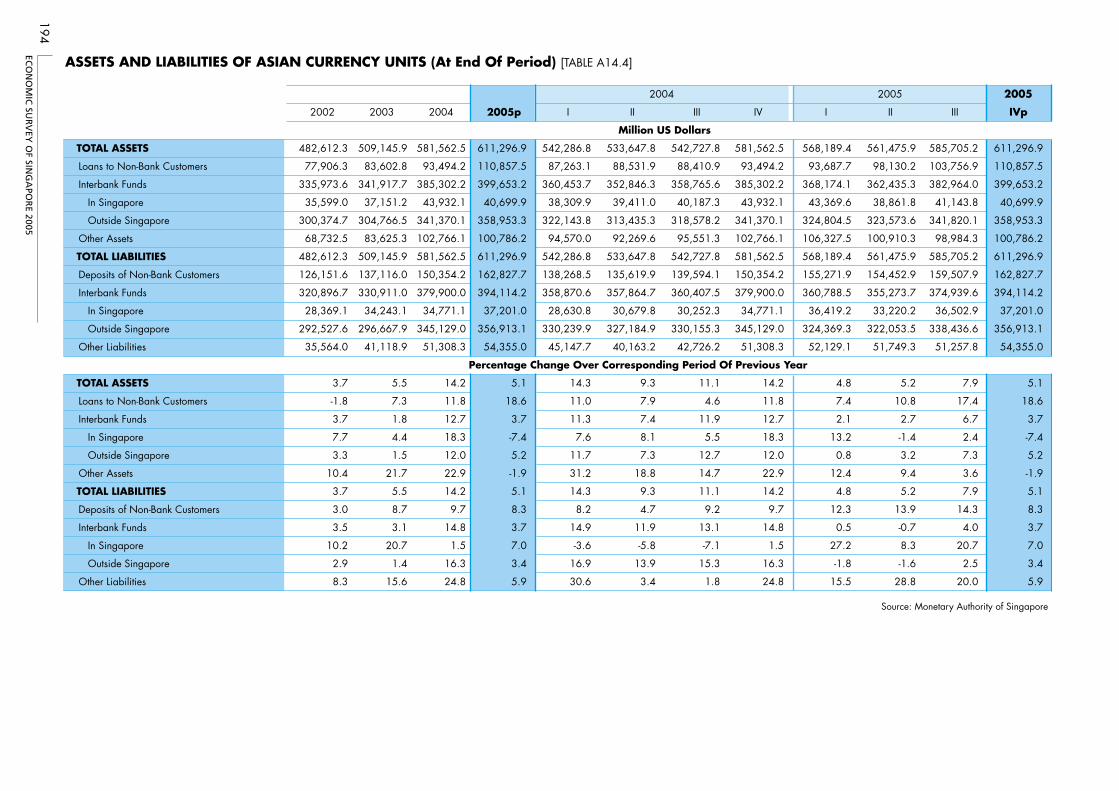
ECO
NO
MIC
SUR
VEY
OF SIN
GA
POR
E 2005
194
ASSETS AND LIABILITIES OF ASIAN CURRENCY UNITS (At End Of Period) [TABLE A14.4]
2005
2002 2003 2004 2005p I II III IV I II III IVp
TOTAL ASSETS 542,727.8
Loans to Non-Bank Customers 88,410.9
Interbank Funds 358,765.6
In Singapore 40,187.3
Outside Singapore 318,578.2
Other Assets 95,551.3
TOTAL LIABILITIES 542,727.8
Deposits of Non-Bank Customers 139,594.1
Interbank Funds 360,407.5
In Singapore 30,252.3
Outside Singapore 330,155.3
Other Liabilities 42,726.2
TOTAL ASSETS 11.1
Loans to Non-Bank Customers 4.6
Interbank Funds 11.9
In Singapore 5.5
Outside Singapore 12.7
Other Assets 14.7
TOTAL LIABILITIES 11.1
Deposits of Non-Bank Customers 9.2
Interbank Funds 13.1
In Singapore -7.1
Outside Singapore 15.3
Other Liabilities
482,612.3
77,906.3
335,973.6
35,599.0
300,374.7
68,732.5
482,612.3
126,151.6
320,896.7
28,369.1
292,527.6
35,564.0
3.7
-1.8
3.7
7.7
3.3
10.4
3.7
3.0
3.5
10.2
2.9
8.3
509,145.9
83,602.8
341,917.7
37,151.2
304,766.5
83,625.3
509,145.9
137,116.0
330,911.0
34,243.1
296,667.9
41,118.9
5.5
7.3
1.8
4.4
1.5
21.7
5.5
8.7
3.1
20.7
1.4
15.6
581,562.5
93,494.2
385,302.2
43,932.1
341,370.1
102,766.1
581,562.5
150,354.2
379,900.0
34,771.1
345,129.0
51,308.3
14.2
11.8
12.7
18.3
12.0
22.9
14.2
9.7
14.8
1.5
16.3
24.8
611,296.9
110,857.5
399,653.2
40,699.9
358,953.3
100,786.2
611,296.9
162,827.7
394,114.2
37,201.0
356,913.1
54,355.0
5.1
18.6
3.7
-7.4
5.2
-1.9
5.1
8.3
3.7
7.0
3.4
5.9
542,286.8
87,263.1
360,453.7
38,309.9
322,143.8
94,570.0
542,286.8
138,268.5
358,870.6
28,630.8
330,239.9
45,147.7
14.3
11.0
11.3
7.6
11.7
31.2
14.3
8.2
14.9
-3.6
16.9
30.6
533,647.8
88,531.9
352,846.3
39,411.0
313,435.3
92,269.6
533,647.8
135,619.9
357,864.7
30,679.8
327,184.9
40,163.2
9.3
7.9
7.4
8.1
7.3
18.8
9.3
4.7
11.9
-5.8
13.9
3.4 1.8
581,562.5
93,494.2
385,302.2
43,932.1
341,370.1
102,766.1
581,562.5
150,354.2
379,900.0
34,771.1
345,129.0
51,308.3
14.2
11.8
12.7
18.3
12.0
22.9
14.2
9.7
14.8
1.5
16.3
24.8
568,189.4
93,687.7
368,174.1
43,369.6
324,804.5
106,327.5
568,189.4
155,271.9
360,788.5
36,419.2
324,369.3
52,129.1
4.8
7.4
2.1
13.2
0.8
12.4
4.8
12.3
0.5
27.2
-1.8
15.5
561,475.9
98,130.2
362,435.3
38,861.8
323,573.6
100,910.3
561,475.9
154,452.9
355,273.7
33,220.2
322,053.5
51,749.3
5.2
10.8
2.7
-1.4
3.2
9.4
5.2
13.9
-0.7
8.3
-1.6
28.8
585,705.2
103,756.9
382,964.0
41,143.8
341,820.1
98,984.3
585,705.2
159,507.9
374,939.6
36,502.9
338,436.6
51,257.8
7.9
17.4
6.7
2.4
7.3
3.6
7.9
14.3
4.0
20.7
2.5
20.0
611,296.9
110,857.5
399,653.2
40,699.9
358,953.3
100,786.2
611,296.9
162,827.7
394,114.2
37,201.0
356,913.1
54,355.0
5.1
18.6
3.7
-7.4
5.2
-1.9
5.1
8.3
3.7
7.0
3.4
5.9
Source: Monetary Authority of Singapore
Million US Dollars
Percentage Change Over Corresponding Period Of Previous Year
2004 2005
Cheang Kok ChungDirectorEconomics and Strategy DivisionMinistry of Trade and Industry
Tang Hsiu ChinLead EconomistEconomics and Strategy DivisionMinistry of Trade and Industry
Tan Kim EngSenior EconomistEconomics and Strategy DivisionMinistry of Trade and Industry
EDITORIAL COMMITTEE
Ministry of Trade and Industry
Choy Choon HoHead, Statistics and Support UnitEconomics and Strategy Division
Ms Neo Lay HoonAssistant Head, Statistics and Support UnitEconomics and Strategy Division
Ms Chung Wei LingStatistical Support OfficerEconomics and Strategy Division
Mdm Chou Chui YuenCorporate Support OfficerEconomics and Strategy Division
Mdm Chin Wai FoonCorporate Support OfficerEconomics and Strategy Division
Mdm Ho Yoke FongCorporate Support OfficerEconomics and Strategy Division
Singapore Department of Statistics
Mrs Law Lan MuiManager
Tan Wah BoonManager
Mrs Ng Puay EngCorporate Support Officer
Mrs Tay Chew Mee, AngieCorporate Support Officer
Mrs Tan-Foo Siow MeiCorporate Support Officer
STATISTICAL AND ADMINISTRATIVE SUPPORT