Embed Size (px)
Citation preview
ECONOMIC REPORT ON PARTNER COUNTRIES
2008
A report by the
Development Economics Advisory Service (DEAS)
July 2008


ECONOMIC REPORT ON PARTNER COUNTRIES 2008

DEAS – Development Economics Advisory Service 2
ECONOMIC REPORT ON PARTNER COUNTRIES 2008
Table of contents
SUMMARY AND CONCLUSIONS.................................................................................................................... 3
PART I ............................................................................................................................................................... 4
OVERVIEW OF RECENT TRENDS AND STRUCTURAL ISSUES IN PARTNER COUNTRIES ................... 5 1 Introduction.............................................................................................................................................. 5 2 Global Overview ...................................................................................................................................... 5
Box: Recent Developments in Commodity Prices................................................................................... 7 3 FEMIP countries.................................................................................................................................... 11 4 Sub-Saharan Africa ............................................................................................................................... 13 5 Caribbean and Pacific economies......................................................................................................... 15 6 Latin America......................................................................................................................................... 16 7 Asia........................................................................................................................................................ 17 8 Eastern Neighbour Countries ................................................................................................................ 19
PART II ............................................................................................................................................................ 21
SCALING UP MICROFINANCE ..................................................................................................................... 22 1 Introduction............................................................................................................................................ 22 2 Status of the Industry ............................................................................................................................ 22 3 How microfinance works ....................................................................................................................... 25 4 Social and economic impact.................................................................................................................. 26
Box: The Pitfalls of Impact Assessment: lessons from Bangladesh ..................................................... 27 5 Sustainability ......................................................................................................................................... 28 6 The role of international finance ............................................................................................................ 29 7 Summary and Conclusions ................................................................................................................... 29

DEAS – Development Economics Advisory Service 3
SUMMARY AND CONCLUSIONS The 2008 Annual Economic Report on Partner Countries prepared by the Development Economics Advisory Service (DEAS) presents an overview of economic developments in countries covered by three of the EIB’s external mandates: the European Neighbourhood Partner Countries (ENPC) – including the Eastern Neighbour Countries (Eastern Europe, Southern Caucasus & Russia) as well as the Mediterranean Partner Countries (MPC) – Africa, Caribbean and Pacific (ACP) plus South Africa, Asia and Latin America (ALA). The report consists of two parts, the first of which presents a review of global and regional economic developments in 2007. In economic terms, the last year was dominated by a pronounced financial crisis in developed economies, booming commodity and food prices and the continued depreciation of the US dollar. Against this background, world economic growth inched down slightly in 2007 and it is expected to dip further down over the next two years. This outcome masks however a sharp distinction between the relative performance of industrial and emerging economies. With the impact of the financial crisis so far mostly contained within its epicentre – the United States – and to a number of European countries, growth developments and prospects for developing economies remain quite positive. In 2007 they accounted for about 70 percent of world growth, with China and India leading the way as their economies expanded by 11.4 and 9.2 percent in real terms, respectively. This growth momentum is broadly expected to carry over to 2008 and act as a buffer for the global economy. This could prove particularly beneficial for a number of Partner Countries, notably those in sub-Saharan Africa, as it would help them counterbalance a potential drop in demand from their main trading partner – the European Union – and sustain the growth momentum started earlier this decade. Part II of the report provides an overview of microfinance, an industry that is rapidly increasing its presence in the developing world. Over the period 2001 to 2006 the number of borrowers worldwide grew at an annual average rate of 19 percent p.a., and the gross loan portfolio increased at a rate of 54 percent p.a. However, in spite of the growth, the industry remains small in terms of GDP and is characterised by a large number of small microfinance institutions with diverse objectives and product offerings. If microfinance is to realise its potential to make inroads into poverty, through enterprise and job creation, it would have to continue to scale up and to re-structure to exploit economies of scale. Microfinance works by offering mechanisms to address market failures at their root. The group lending model, for example, uses local knowledge to select low-risk entrepreneurs, and peer pressure helps repayment. Access to finance lifts what would otherwise be a constraint on micro-entrepreneurs and enables them, to raise income and reduce poverty. In this way, it potentially avoids many of the pitfalls of scaling up aid with its associated constraints of diminishing returns and planning overheads. There is an accumulation of evidence of the beneficial impact of microfinance. Whilst this may not amount to proof due to the inherent difficulty of assessing social and economic impact, it provides some well-grounded support for what many practitioners regard as the self-evident benefits. However, there are doubts about sustainability and whether commercial pressure will lead to an undesirable shift away from social objectives. Implicit or explicit subsidies remain an important feature of the sector, particularly where there are objectives to extend outreach and develop new products. The report was prepared by a team of DEAS economists – Simona Bovha-Padilla, Pedro de Lima, Geoffrey Frewer, Samir Jahjah and Sabina Pogorelec – under the direction of Daniel Ottolenghi, Chief Development Economist. Bruno Marzin was responsible for database management and Esther Souville for editorial treatment. The report was written on the basis of information available up to 15th May 2008.

DEAS – Development Economics Advisory Service 4
PART I

OVERVIEW OF RECENT TRENDS AND STRUCTURAL ISSUES IN PARTNER COUNTRIES
1 Introduction This section looks at recent trends in partner countries viewed against the backdrop of trends in the world economy. It also identifies some issues that have been critical to developments in the various regions, and it discusses growth prospects over the near and medium terms.
2 Global Overview Economic developments in 2007 were dominated by a pronounced financial crisis in developed economies, booming commodity and food prices and the continued depreciation of the US dollar. Against this background, the pace of economic activity around the globe lost momentum and the medium-term outlook became significantly less positive than in recent years. World economic growth dropped from 5.0 percent in 2006 to an estimated 4.9 percent in 2007 (Chart 1) and it is expected to stay slightly below 4 percent over the next two years. A minority of analysts does not even exclude the possibility of a worldwide recession, i.e., world GDP growth at below 3 percent.
Chart 1: The world economy – Growth
0%
2%
4%
6%
8%
10%
2001 2002 2003 2004 2005 2006 2007 2008 2009
Industrial economies
Emerging & developing economies
World
Source: IMF World Economic Outlook, April 2008.
The overall figures mask however a sharp distinction between the relative performance of industrial and emerging economies.1 With the impact of the financial crisis so far mostly contained within its epicentre – the United States – and to a number of European countries, growth developments and prospects for emerging and developing economies remained quite positive. In 2007 they accounted for about 70 percent of world growth, with China and India leading the way as their economies expanded by 11.4 and 9.2 percent in real terms, respectively. Furthermore, China’s and India’s on-going productivity boosts are broadly expected to resist the slowdown of more developed economies, and serve as a buffer to the global economy. This could prove particularly beneficial for Partner Countries in sub-Saharan Africa, as it would help counterbalance a potential drop in demand from their main trading partner – the European Union – and sustain the growth momentum started earlier this decade. During this later period Sub-Saharan Africa recorded its three largest growth figures of the last thirty years, notably in 2007 (6.8 percent). This growth surge has been mostly the result of commodity price levels, but also of improved policy frameworks and external debt positions. The world economy has also witnessed an increase in inflationary pressures, with inflation reaching 4 percent in 2007 up from 3.7 percent in 2006 (Chart 2). In line with their rapid economic expansion, this rekindling of inflation was more evident in emerging and developing economies. Their consumer prices grew by 6.3 percent, whereas in industrialized countries average inflation for 2007 inched down slightly to 2.1 percent. Still, in the first few months of 2008 the spectre of inflation has surfaced in almost all economies around the world, even as global growth falters. In Germany, inflation is currently at levels (3 percent, year-on-year, in May) last seen in the early 1990s. Emerging Asia is one of the worst hit
Chart 2: The world economy – Inflation
0%
2%
4%
6%
8%
10%
2001 2002 2003 2004 2005 2006 2007 2008 2009
World
Emerging and developing economies
Industrial economies
Source: IMF World Economic Outlook, April 2008.
DEAS – Development Economics Advisory Service 5
1 In this report, the terms industrial and developed economies are used interchangeably. Emerging economies (markets) are developing countries that are rapidly approaching developed economic status.

regions, with inflation in China, rising to an 11-year high of 8.7 percent in February 2008, while in India wholesale-price inflation reached 7.8 percent, a four-year high. Similarly, in Indonesia and the Philippines inflation is now nearing double-digit figures. More spectacularly, inflation has recently reached 10.2 percent in South Africa, 14.3 percent in Russia, 25.2 percent in Vietnam and 29.3 percent in Venezuela. Inflationary pressures have been fed by the on-going commodity price boom, which has been linked to years of increasing global demand, limited supply side investments, as well as speculation pressures. While oil prices kept on breaking new records – both in nominal and real terms – the spotlight in recent months has also focused on other commodities, as well as on food prices (Chart 3). The text Box below characterizes the background against which these developments take place.
Chart 3: Oil and Food Prices
60
120
180
240
300
360
420
480
2002 2003 2004 2005 2006 2007 2008
Oil price index
Food index
Source: Global Insight and IMF, International Finance Statistics. Oil price index (monthly spot price of Brent and WTI crude blends) and index of foodstuffs (2002=100).
In the industrialized countries, current economic developments are dominated by the on-going financial turmoil in North American and European markets. The crisis, which was triggered by the debacle of the sub-prime mortgage market, led to a rapid deterioration of conditions in money markets and has had a severe impact on the balance sheets of a large number of systemically important financial institutions. The world's biggest financial companies have reported more than USD 300 billion in credit losses and write-downs since the start of 2007 – shared almost equally between North-American and European banks.2 This has prompted the rapid intervention of all major central banks through a series of measures aimed at providing liquidity to distressed markets and therefore contributing to maintain financial stability. The policy response of the European Central Bank (ECB) and the Federal Reserve (Fed) appeared to have introduced some novel elements over traditional monetary policies. First, the ECB emphasised the difference between tackling price stability concerns through the setting of its reference interest rate and the proper functioning of the money market through (large) liquidity injections. The Fed, which initially focused its response on providing a more accommodative stance through interest rate cuts (even as it recognized that inflationary expectations might be on the rise), has recently introduced a set of measures aimed at bolstering liquidity that expand the range of institutions that traditionally have access to those facilities to non-bank financial institutions such as primary dealers. In addition, it has reduced the cost and increasing the allowable term of discount window credit to commercial banks, and expanded on the type of non-Treasury securities it accepts as collateral. The Fed also took an exceptional step in staving off the collapse of a major non-bank financial firm.
DEAS – Development Economics Advisory Service 6
2 Fitch – Sub-prime Mortgage Related Losses. A Moving Target, May 2008 – estimates current losses on sub-prime residential mortgage-backed securities (RMBS) and collateralised debt obligations referencing sub-prime mortgage assets (ABD-CDO) exposures of USD165 billion. The final tab is estimated to be between USD 400 billion and USD 550 billion, for a market estimated to have originated as much as USD 1.4trn of loans in the last three years (2005: USD 625 billion; 2006: USD 600 billion; and 2007: USD 179 billion). Data collected by the Institute of International Finance (Capital Markets Monitor, Junes 2008) show that banking losses up to 2 June amounted to USD 386.7bn, 51.6 percent of which were reported by European banks and 42.8 percent by North-American banks. On the other hand, recapitalisation efforts were stronger among North-American banks than in their European counterparts.
DEAS – Development Economics Advisory Service 7
Box: Recent Developments in Commodity Prices
1. Background
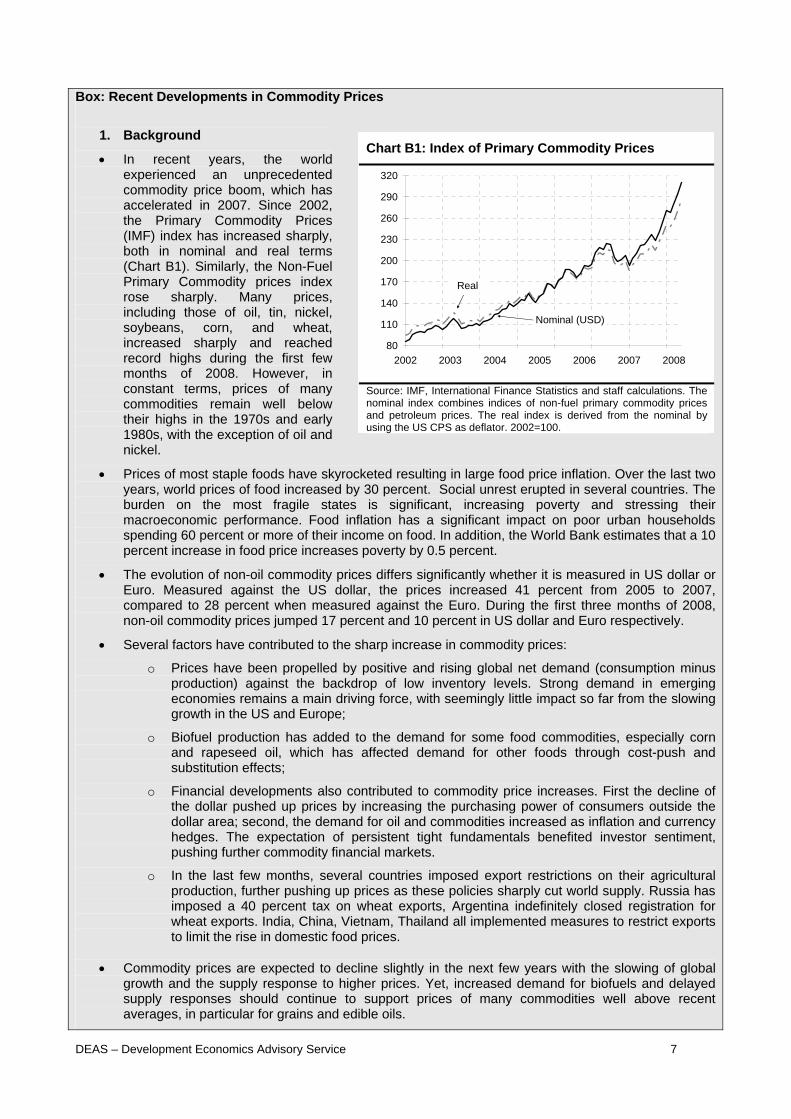
• In recent years, the world experienced an unprecedented commodity price boom, which has accelerated in 2007. Since 2002, the Primary Commodity Prices (IMF) index has increased sharply, both in nominal and real terms (Chart B1). Similarly, the Non-Fuel Primary Commodity prices index rose sharply. Many prices, including those of oil, tin, nickel, soybeans, corn, and wheat, increased sharply and reached record highs during the first few months of 2008. However, in constant terms, prices of many commodities remain well below their highs in the 1970s and early 1980s, with the exception of oil and nickel.
• Prices of most staple foods have skyrocketed resulting in large food price inflation. Over the last two years, world prices of food increased by 30 percent. Social unrest erupted in several countries. The burden on the most fragile states is significant, increasing poverty and stressing their macroeconomic performance. Food inflation has a significant impact on poor urban households spending 60 percent or more of their income on food. In addition, the World Bank estimates that a 10 percent increase in food price increases poverty by 0.5 percent.
• The evolution of non-oil commodity prices differs significantly whether it is measured in US dollar or Euro. Measured against the US dollar, the prices increased 41 percent from 2005 to 2007, compared to 28 percent when measured against the Euro. During the first three months of 2008, non-oil commodity prices jumped 17 percent and 10 percent in US dollar and Euro respectively.
• Several factors have contributed to the sharp increase in commodity prices:
o Prices have been propelled by positive and rising global net demand (consumption minus production) against the backdrop of low inventory levels. Strong demand in emerging economies remains a main driving force, with seemingly little impact so far from the slowing growth in the US and Europe;
o Biofuel production has added to the demand for some food commodities, especially corn and rapeseed oil, which has affected demand for other foods through cost-push and substitution effects;
o Financial developments also contributed to commodity price increases. First the decline of the dollar pushed up prices by increasing the purchasing power of consumers outside the dollar area; second, the demand for oil and commodities increased as inflation and currency hedges. The expectation of persistent tight fundamentals benefited investor sentiment, pushing further commodity financial markets.
o In the last few months, several countries imposed export restrictions on their agricultural production, further pushing up prices as these policies sharply cut world supply. Russia has imposed a 40 percent tax on wheat exports, Argentina indefinitely closed registration for wheat exports. India, China, Vietnam, Thailand all implemented measures to restrict exports to limit the rise in domestic food prices.
• Commodity prices are expected to decline slightly in the next few years with the slowing of global
growth and the supply response to higher prices. Yet, increased demand for biofuels and delayed supply responses should continue to support prices of many commodities well above recent averages, in particular for grains and edible oils.
Chart B1: Index of Primary Commodity Prices
80
110
140
2002 2003 2004 2005 2006 2007 2008
170
200
230
260
290
320
Real
Nominal (USD)
Source: IMF, International Finance Statistics and staff calculations. The nominal index combines indices of non-fuel primary commodity prices and petroleum prices. The real index is derived from the nominal by using the US CPS as deflator. 2002=100.

DEAS – Development Economics Advisory Service 8
2. Climate change, Food Prices and the Biofuel
• Food prices would have increased even without the switch to renewable energy and biofuel. Emerging countries, like China, have been growing fast and consumption habits have changed. For instance, meat consumption in China has doubled in the last 20 years, raising demand for water, animal feeds and fertilizers. Increased volatility of supply due to changing global weather conditions during the last decade has reduced inventories to their lowest level in 30 years.
• That being said, rising biofuel production in the United States and the European Union has boosted demand for corn and other grains and edible oils. Biofuels account for only 1.5 percent of the global liquid fuels supply, yet they accounted for half the increase in the consumption of major food crop in 2006-07. The US and EU have set ambitious targets to boost biofuels in the relatively short term, offering incentives and subsidies to farmers. In addition, rising oil prices are encouraging production from maize and other crops, further tightening market balances in food crops.
3. Macroeconomic Implications
• According to the IMF, the current commodity price boom is proving more favourable to developing economies than previous booms. Rising commodity exports have been accompanied by rising manufacturing exports. FDI and domestic investment have been growing fast, while government borrowing has been declining. In a context of increasing trade and financial integration, real economic growth has accelerated across the developing world. Inflation has picked up globally, both in net exporters and importers. In net importers, the price level increased through imported inflation. Second-round effects may further exacerbate headline inflation. In net commodity exporters, large current account surpluses and the accumulation of foreign exchange reserves increase money supply, and push headline inflation up as well.
• On the downside, many developing countries remain heavily dependent on commodity exports and they could prove vulnerable to commodity price shocks.
• For the most fragile economies, which are heavily dependent on commodity imports, socio economic impacts are devastating, with rising inflation, poverty, and social unrest. For these countries, rising food prices will widen their current account deficits and endanger sound fiscal policies as they recourse to costly subsidies.
Chart B2: Prices of Food and Beverages
80
100
120
140
160
180
200
220
2002 2003 2004 2005 2006 2007 2008
Food Beverages
Source: IMF, International Finance Statistics. Indices comprise 60 price series for 44 non-fuel primary commodities. Weights are based on the 1995-97 average of world export earnings. 2002=100.

The policy response of the Fed as well as of the ECB has contributed to stabilize financial markets. Since the crisis peak in March 2008, and despite persisting tensions in interbank markets, there has been some revival in bond issuance and volatilities came down in April (Chart 4). By the same token, equity and bond markets in emerging economies recovered in April some of the ground they have lost since the summer of 2007 (Chart 5).
Chart 4: Financial conditions in advanced economies
0
50
100
150
200
250
01/01/07 01/04/07 30/06/07 28/09/07 27/12/07 26/03/085
11
17
23
29
35
VIX (rhs)
TED spread (lhs)
Source: Global Insight. The TED spread corresponds to the difference (in basis points, left hand axis) between the three-month LIBOR and the three month U.S. T-bill rate. An increase in the index is perceived as an increase in the probability of default by banks. VIX corresponds to the Chicago Board Options Exchange Volatility Index, a measure the market's expectation of volatility (in percentage points, right hand axis).
Furthermore, the US growth figure for the first quarter of 2008 (0.9 percent), revealed an economy that although anaemic still had enough energy to avoid negative growth – as markets had broadly anticipated. While consumption remains squeezed by a weak labour market, higher food and energy prices as well as continued housing declines, the external sector has kept the economy afloat. Key to this development is the depreciation of the US dollar against the currencies of its main trading partners. Since 2002, the US dollar has depreciated by more than 25 percent in trade-weighted terms, with most of the adjustment done through a 40 percent depreciation against the Euro (Chart 6). This trend might however be coming to an end, as for the first time since 2005 forward exchange markets are currently betting on a stabilization or even on an appreciation of the US dollar against the world’s other major currencies. The appreciation of their currencies and the financial crisis withstanding, the Euro area and Japanese economies have shown remarkable resilience during the first quarter of 2008. European growth reached 2.2 percent – mostly driven by Germany’s performance – while in Japan annualized growth stood at 3.1 percent.
Chart 5: Financial conditions in emerging markets
200
400
600
800
1000
1200
1400
Jan-2005
Jul-2005
Jan-2006
Jul-2006
Jan-2007
Jul-2007
Jan-2008
Jul-2008
25
100
175
250
325
400
475
EMBI (bps, rhs)MSCI (lhs)
Source: Global Insight. MSCI corresponds to the Morgan Stanley International Capital Index, a measure of stock market performance in emerging markets (1987=100, left hand axis) and EMBI is the spread (in basis points, right hand axis) of the JP Morgan Emerging Markets Bond Index over the 3-month US T-bill.
That said, the balance of risks going forward still tilts on the negative side. Although the peak of the liquidity crisis might have already been crossed, the full impact of the crisis on the real economy has yet to unwind. As economic and credit conditions deteriorate so do corporate defaults and bank delinquencies. Some segments in financial markets have essentially shut down since the summer of 2007 and a quick recovery is unlikely. Furthermore, the on-going adjustment in the balance sheets of North-American consumers might take longer than anticipated, particularly if the simultaneous adjustment in banks’ balance sheets leads to further deterioration in credit conditions. At this level, the scope for further monetary policy support is also relatively limited, as real interest rates move into negative
Chart 6: The US dollar depreciation since 2002
-5%
5%
15%
25%
35%
45%
Jan-2002
Jan-2003
Jan-2004
Jan-2005
Jan-2006
Jan-2007
Jan-2008
Euro Trade weighted
Yen
Renminbi
Source: Global Insight and staff calculations.
DEAS – Development Economics Advisory Service 9

territory and inflationary pressures continue to build up on the back of oil price developments. As of the writing of this report, oil contracts for 2009 delivery were traded at above USD 130 per barrel. On the other hand, while some analysts continue to anticipate a prolonged North American recession, the percentage of those who do so appears to be receding. Should however that possibility materialize, other advanced economies – notably in Europe – would not remain immune to a prolonged North-American slowdown and eventually emerging markets and developing economies would also be affected. In emerging and developing economies, inflationary pressures appears as the main risk to a broadly positive outlook. The pass-through of high food to consumer price inflation (CPI) is considerably higher than in advanced economies due to the heavier weight of food in CPI baskets. Whereas food accounts for roughly 10 to 15 percent of CPI baskets in Europe and the US, it accounts for an average 30-40 percent in low-income countries and it can go up to as much as 60 percent in India, Jamaica and Nigeria.3 Furthermore, there is some evidence that monetary policy in emerging and developing countries might have been slow to respond to price increases. While the central banks of Brazil, Indonesia and Russia, among others, have increased interest rates already this year, monetary policies in a considerable number of emerging markets remain broadly accommodative and in fact, real interest rates have turned negative. Similarly, broad money is growing rapidly, considerably faster than nominal GDP. The scope for policy adjustment is however constrained by international capital movements. The Institute of International Finance estimates that in 2007 net private capital flows to emerging market economies reached USD 782 billion, an increase of USD 214 from 2006 (Chart 7).4 As a percentage of GDP, the 2007 figure (close to 6 percent) surpasses the previous peak of 1996. Interest rate hikes aimed at slowing down monetary growth and anchoring inflation expectations – or the appreciation of the domestic currencies – might actually further exacerbate capital inflows and contribute for perverse developments in domestic monetary aggregates. This is reinforced by low dollar interest rates and the economic slowdown in advanced economies, which further pushes investors to search for yield in the considerably more dynamic emerging markets. As a significant part of those flows are inherently short-term – if for example investors bet on further future currency or interest rate adjustments – the impact on the financial stability of some emerging economies can be considerable.
Chart 7: Net private capital flows to emerging markets
-100
100
300
500
700
900
2002 2003 2004 2005 2006 2007 2008
Banks and other creditors Direct Investment Portfolio Investment
Source: Institute of International Finance. In billions of US dollars.
This could prove particularly upsetting for local currency debt markets, a rapidly growing market in emerging economies on the back of improved economic outlooks and economic policy frameworks. The outstanding stock of domestic securities currently stands at USD 6trn, a six-fold increase in less than ten years. In the first quarter of 2008, local debt instruments accounted for 69 percent of the USD 1.228 trillion turnover in emerging market debt trading by international investors. Less than a decade ago that share did not exceed two fifths of the total.5 Together with the massive increase in international reserves – which have reached USD 4.28trn in 2007 (Chart 8) – this has contributed for a significant reduction in emerging economies’ exposure to foreign exchange risk. An unforeseen increase in currency and/or interest rate volatility could lead (international) investors to reposition their investments.
DEAS – Development Economics Advisory Service 10
3 See Fitch (May 2008), “Inflation and Emerging Market Sovereign Risk,” and The Economist (22 May 2008), “An old enemy rears its head.” 4 These figures only cover a subset of the 30 largest/most active emerging markets. 5 See the Volume Survey of the Emerging Market Traders Association (1st Quarter 2008) and Fitch (May 2008), “Local Currency Debt Markets Emerge from the Shadows.”

In forthcoming months financial markets will continue the adjustment process started in mid-2007. The need for banks and other financial institutions in developed markets to rebuild their equity positions – a development that is also a response to the requirements of the Revised International Capital Framework, Basle II – is being partly met by the abundant supply of funds recently amassed by investors in emerging and developing countries. Prominent among those, sovereign wealth funds (SWF) have been instrumental in the recapitalization of investment banks over the last few months as well as being quite active in private equity deals. Although SWFs have been around at least since the early 1950s, it is the recent reserve accumulation by a number of emerging market and developing economies – notably oil producing countries – that has attracted attention to their activities. Currently, more than 20 countries have a SWF, corresponding to an estimated total of USD 2–3trn assets, which could increase to USD 10trn by 2012.
Chart 8: Official reserves
0
1000
2000
3000
4000
5000
6000
2002 2003 2004 2005 2006 2007 2008
China Brazil, India and Russia GCC Sub-Saharan Africa
Emerging and Developing Economies
Source: IMF and staff calculations. In billions of US dollars. GCC corresponds to the countries of the Gulf Cooperation Council
3 FEMIP countries Underpinned by high oil and non-oil commodity prices, steady global growth and sound policies in many FEMIP countries, the region continued to grow at 5.4 percent in 2007, matching the decade-high pace of 5.3 percent achieved the preceding year, and it is expected to grow by 5.9 percent in 2008 (Table 1).6 Growth was mainly supported by a continued rise in hydrocarbon receipts among the region’s oil exporters, as world oil prices approached USD 100 a barrel toward the end of 2007. Despite the severe drought that mainly affected the Maghreb region, a recovery in European demand helped strengthen exports for resource-poor countries in the region, such as Jordan, Morocco, and Egypt (where a depreciation of the pound against the Euro also helped). Surging domestic demand, ambitious fiscal spending programs, and supply constraints – particularly for housing – have fuelled higher inflation rates across the region to 6.8 percent in 2007, up from 4.4 percent in 2006. Price levels have also been affected by rising import costs due to the weakness of the US dollar, as well as higher international costs for commodities such as food. Nevertheless, 2007 consumer prices tended to be in one-digit levels, with the exception of Egypt (10.9 percent), where inflation has trended higher because of domestic supply shocks, notably the partial elimination of subsidies in September 2006.
Table 1: Macroeconomic Indicators for FEMIP countries
Real GDP growth (%) Inflation (%) Current Account Balance (% of
GDP) Fiscal Balance
(% of GDP)
2005 2006 2007 2008 2005 2006 2007 2008 2005 2006 2007 2008 2005 2006 2007 2008
Maghreb (1) 4.1 4.4 4.2 5.5 1.5 3.1 3.1 3.7 11.5 14.3 12.4 13.9 4.5 6.5 6.0 8.1 Mashrek (2) 4.1 5.9 6.3 6.2 7.5 5.4 9.5 8.4 -2.2 -2.4 -2.8 -3.0 -7.4 -8.3 -7.4 -6.7FEMIP 4.1 5.3 5.4 5.9 4.9 4.4 6.8 6.4 5.4 6.6 5.4 6.2 -0.8 -0.3 -0.2 1.3 Source: IMF World Economic Outlook, April 2008. (1) Algeria, Morocco, Tunisia; (2) Egypt, Jordan, Lebanon, Syria;
Substantial increases in investment and consumer spending in oil-exporting countries led to strong import growth and therefore to a worsening of the FEMIP regional current account balance: as a percentage of GDP, the surplus declined from 6.6 percent in 2006 to 5.4 percent in 2007. Although the bulk of the region's trade surplus is derived from oil exports, the external accounts of the oil-importers (resource-poor countries) benefited from increased trade and tourism activity, along with the remittances of their nationals working in oil-exporting countries. However, the FEMIP external sector remains vulnerable to any major downturn in oil
DEAS – Development Economics Advisory Service 11
6 Weighted regional growth rate average excludes West Bank and Gaza as nominal GDP data is not available after 2007.

prices, although the region is now less vulnerable to external shocks than in the past thanks to greatly improved domestic and external finances. Capital flows to the FEMIP countries seem well placed to withstand the pressures caused by the recent turmoil in the US credit market, although the impact on the financial environment is present. After a record USD 11.5 billion, net private capital flows to FEMIP countries declined in 2007 to USD 8.7 billion (Chart 9). This decline in overall private flows is more than fully accounted for by a decline in net lending by commercial banks. On the other hand, the region experienced an increase in FDI flows to USD 20.1 billion, a 5.7 percent increase from 2006. This is due to the completion of major privatization deals and increased investment in the energy sector. Moreover, FDI from the Gulf countries to the FEMIP region increased also in infrastructure, real estate and tourism. In 2007 Egypt was the largest net FDI recipient, accounting for 50 percent of total flows in the region. The government intensively continues with its program to increase the economic role of the private sector mainly in banking and telecommunications. FDI in oil and gas is expected to increase further in the coming years. Morocco, the second largest recipient of FDI flows in the region, benefited mainly from privatization in the telecommunication sector.
Chart 9: Net private capital and net FDI flows
0
5
10
15
20
25
2000 2001 2002 2003 2004 2005 2006 2007
Net private capital flows
Net FDI flows
Source: IMF World Economic Outlook, April 2008. In billion of USD. Israel and Gaza and West Bank are not included.
Nevertheless, there are a number of reasons to be cautious about the prospect for FDI in the region. In 2007, FDI as a share of GDP decreased in all FEMIP countries but Egypt and Syria (Chart 10). Although evidence suggests that FDI continues to flow into the region, FDI activities are likely to be discouraged by growth-constraining structural weaknesses and financial vulnerabilities, as well as political tensions in the region. This backdrop contributes to explain why the region continues to receive a relatively small share of global FDI flows, with net direct investment representing only 9.7 percent of total FDI flows to developing countries. Fiscal balances across the region in 2007 ranged from a surplus of 11.7 percent of GDP in Algeria to a deficit of 11 percent of GDP in Lebanon. In general, the fiscal situation in the region improved only marginally from a deficit of 0.3 percent of GDP in 2006 to a deficit of 0.2 percent of GDP in 2007. Rising food and energy costs as well as increased global production dedicated to biofuels presents difficulties for a number of economies, causing strains on fiscal positions from widespread subsidies covering fuels and cereals.
DEAS – Development Economics Advisory Service 12
Looking forward, the region’s main economic challenge is to create sufficient job opportunities for a rapidly growing labour force. With diminished employment opportunities in the public sector, the most important engine for sustainable job growth is the private sector. Over the last years, almost every country in the region has undertaken steps to improve business environment. According to the World Bank’s Doing Business survey, Egypt was the top reformer for 2006/07. But reforming efforts were also evident in Morocco, which introduced one-stop shops in order to ease business start-up and approved legislation for a bidding process to establish one or more private credit bureaus. In order to lower registry costs, Tunisia digitized property records allowing notaries to check files more efficiently. Furthermore, improvements to the credit registries – which now record all loans, expanding coverage of borrowers by 25 percent – should make access to credit easier. West Bank and Gaza tripled
Chart 10: FDI flows as a share of GDP
0
5
10
15
20
25
Jorda
nLe
bano
n
Egypt
MPC Moro
cco
Syria
Tunisi
a
Algeria
2006 2007
Source: IMF World Economic Outlook, April 2008. MPC corresponds to the GDP weighted average of Mediterranean Partner Countries not including Israel and Gaza and West Bank.

coverage with a similar reform. Paying taxes became easier in Syria, which made major revisions in their tax codes. Despite recent efforts in business climate reform, the overall state of the business environment in FEMIP countries is poor. In a worldwide ordering of 178 countries based on the overall business climate, FEMIP countries rank in the second half with exception of Israel on 29th place, followed by Jordan on 80th place and Lebanon on 85th place. Syria on 137th place has the worst ranking within the region. Thus, further improvements especially in areas such as high licensing requirements and inefficient courts are needed in order to develop a productive and competitive private sector. Prospects for the FEMIP countries remain upbeat, with real GDP growth projected to reach 5.9 percent in 2008. Despite uncertainties in the external environment related to the US subprime mortgage crisis, growth in the region will be backed up by increased domestic demand. Furthermore, oil prices will likely remain at high levels and thus oil revenues will be able to support large, project-related expenditures. Notwithstanding, long term prospects in the region depend on the ability to create jobs through broad-based structural reforms.
4 Sub-Saharan Africa
Table 2: Macroeconomic Indicators for Sub-Saharan Africa Real GDP growth (%) Inflation (%) Current Account
Balance (% of GDP) Fiscal Balance
(% of GDP)
2005 2006 2007 2008 2005 2006 2007 2008 2005 2006 2007 2008 2005 2006 2007 2008
Sub-Saharan Africa 6.2 6.3 6.8 6.6 9.0 7.3 7.2 8.5 -0.9 0.0 -3.2 -1.7 1.8 4.9 0.7 2.4 Oil producing countries (1) 7.0 7.4 8.4 9.0 13.7 7.9 5.9 7.9 4.6 7.1 0.7 4.9 6.1 9.2 1.9 6.0
East Africa (2) 7.7 8.6 8.9 6.6 7.8 9.8 10.0 11.2 -5.7 -9.1 -7.5 -7.8 -2.5 -3.6 -3.3 -3.6Central Africa (3) 5.1 2.5 4.5 6.0 6.3 5.7 3.8 4.9 1.0 1.7 -1.2 1.2 6.1 16.0 7.5 8.1 West Africa (4) 5.1 5.4 5.4 7.6 14.5 7.8 5.5 7.7 2.0 4.7 -1.6 2.5 4.2 6.8 -0.2 4.2 Southern Africa (5) 6.7 7.0 7.4 6.0 6.8 6.7 8.0 8.9 -1.6 -0.6 -3.3 -3.2 0.7 4.2 1.2 1.9 Source: IMF World Economic Outlook, April 2008. (1) Angola, Cameroon, Chad, Republic of Congo, Côte d'Ivoire, Equatorial Guinea, Gabon, Mauritania, Nigeria, Sudan; (2) Djibouti, Eritrea, Ethiopia, Kenya, Sudan, Tanzania, Uganda; (3) Burundi, Cameroon, Central African Republic, Chad, Republic of Congo, Democratic Republic of Congo, Equatorial Guinea, Gabon, Rwanda, São Tomé & Príncipe; (4) Benin, Burkina Faso, Côte d'Ivoire, Gambia, Ghana, Guinea, Guinea-Bissau, Mali, Mauritania, Niger, Nigeria, Senegal, Sierra Leone, Togo; (5) Angola, Botswana, Lesotho, Madagascar, Malawi, Mozambique, Namibia, South Africa, Swaziland, Zambia.
Since 1995 sub-Saharan Africa (SSA) has embarked on a positive growth trend that has resulted in consecutive gains to real income per capita and appears to have put an end to the economic decline that characterized most of the 1980s and early 1990s (Chart 11). While the trend was slow at first, the last few years have brought more vigorous growth. In 2007, real GDP expanded by 6.8 percent, with particularly strong growth in resource-rich countries, due to the increase in commodity prices – combined with a much improved external debt situation, and a supportive weak US dollar. Angola once again scored the region’s highest growth figure – 21.1 percent – followed by Equatorial Guinea and Ethiopia – 12.4 and 11.4 percent, respectively. Inflation remained relatively restrained, although in some of the fastest growing countries there are some signs of over-heating demand. Despite the on-going financial turbulence in some developed countries, the outlook for 2008 and 2009 remains positive on the back of strong domestic demand as well as from China's and India's increasing demand for the region's resources. On the other hand, a significant slowdown in EU countries – the region's main trading partner – could significantly effect on SSA’s economic prospects.
Chart 11: Income per capita (Sub-Saharan Africa)
400
450
500
550
600
650
700
750
1980 1985 1990 1995 2000 2005
Source: IMF. Income per capita in constant 2000 USD prices.
DEAS – Development Economics Advisory Service 13

DEAS – Development Economics Advisory Service 14
While commodity exports have played a key role in the region’s economic revival, over the last few years domestic demand has been the main driver of growth. Investment’s share of demand has been growing steadily since the late 1990s, reaching 22.4 percent of GDP in 2007, up from 17.8 percent in 2000. The increase in the pace of economic activity is also driving rapid growth – close to 20 percent in 2007 – in credit activity, although intermediation levels remain low by international standards. A number of other factors also promoted growth. First, the region’s debt outlook improved considerably as the result of HIPC (Heavily Indebted Poor Countries) and of MDRI (Multilateral Debt Relief Initiative). The reduction in debt service obligations contributed to a reduction in the cost of capital and to an overall boost to private sector activity. Second, an overall – even if somewhat limited – improvement in the investment climate. A number of countries have adopted measures aimed at making regulatory frameworks more business-friendly. Financial sectors in particular have benefited from a clear move away from direct government intervention towards a privately dominated activity. Some SSA countries have registered considerable progress in the ranks of indicators such as the World Bank’s Doing Business Indicators or the Global Competitiveness Index of the World Economic Forum. Another positive development, which has contributed to enhance the visibility of the SSA countries to international investors, is the expanded number of regional sovereigns rated by one of the three largest credit rating agencies.7 Third, the last ten years have witnessed a much improved political environment, with a considerable smaller number of conflicts than in previous decades. That said the recent episodes in Cameroon, Kenya and South Africa, as well as the on-going political confrontation in Zimbabwe are vivid reminders of how fragile some of those recent gains can be. A significant number of SSA countries has witnessed large improvements in their respective external positions, even in the midst of an investment drive. Again, this development is heavily concentrated in countries with large foreign currency earnings, i.e., oil and other commodity exporters. Oil producing countries sustain a current account surplus, which in 2007 came down to 0.7 percent of GDP (from 7.1 percent in 2006) due to large infrastructure investments in Angola and Nigeria. Yet domestic saving levels remain high in those countries, suggesting that the proceeds form oil and other commodities are being applied in a relatively conservative manner. Similarly, their foreign reserve levels have continued to increase, reaching USD 75 billion in 2007 (more than doubling in two years time), or 9 months of import coverage. Fiscal positions have generally improved throughout the region. In addition to the increased revenues resulting from the commodity price boom, this improvement also reflects enhancements to the fiscal revenue and expenditure management frameworks, as well as the smaller debt burden resulting from the debt relief initiatives. Fiscal balances in SSA are currently positive – 0.7 percent of GDP in 2007 – and external debt has declined to 25 percent of GDP in 2007 from a high of 70 percent in 1999. The improved fiscal positions and the increased foreign appetite for investments in SSA have led some sovereigns to tap international bond markets. In 2007 three countries – Ghana, Gabon and the Republic of Congo – have done so for the first time and it is expected that sovereign debt issuance by African countries will continue to grow in 2008 and 2009. Before the recent political turmoil, Kenya was preparing to issue an international bond of USD 300mn, while Nigeria is expected to issue an international bond of USD 1 billion in 2009. Reflecting the improved economic environment and the substantive economic opportunities in the region – as well as the abundant liquidity levels that prevailed in international capital markets for the most part of the decade until mid-2007 – private capital flows to the region have been growing at a rapid pace. In 2007, flows to SSA totalled USD 53 billion, up from USD 11 billion in 2000 and have now overtaken official aid as the main source of external finance. The increase is shared evenly by all different types of capital flows – portfolio, debt and FDI – although in the past couple of years FDI has remained stable at about USD 15 to 21 billion, while portfolio flows have approached USD 20b. As for FDI flows, they are directed mainly towards the mineral sector, but increasingly they also target banking and telecoms.8 Equity portfolio flows are also attracted to African stock markets, which have performed very well since 2005. South Africa and Nigeria are the main destinations: South Africa attracted received 88 percent of the portfolio inflows, while South Africa and Nigeria accounted for 47 percent of total FDI flows.9
7 In 2003, Standard & Poor’s and the UNDP launched a joint initiative to provide sovereign risk ratings for much of Africa. Since then, Fitch has also expanded significantly its sovereign coverage in SSA. 8 A recent development is the emergence of some cross-border investment in the banking sector, with South African banks making forays into some adjacent countries as well as far north as Ghana and Nigeria. Similarly, some Nigerian banks have invested in other West African markets. 9 See the Sub-Saharan Africa Regional Economic Outlook, IMF, April 2008.

The last few years notwithstanding, the progress registered so far is limited and the challenges ahead remain enormous. Poverty remains widespread and in fact only a small minority of countries appears to be on track to meet the Millennium Development Goals. The number of failed states in SSA – although diminishing – remains significant. These countries have failed to benefit from the on-going economic revival, further dampening their future economic prospects. More broadly, the need for sweeping reforms remains pressing. SSA countries continue to dominate the bottom rankings of indicators such as the Doing Business Indicators of the World Bank or the Corruptions Perception Index of Transparency International. Further productivity gains remain hampered by low human development as well as weak infrastructures. On the other hand, while this difficult environment will undoubtedly continue to constrain the short to medium term outlook, SSA’s on-going growth momentum is not likely to be significantly hampered by the current international crisis – as long as growth in the region’s main trading partners remains in line with standard forecasts.
5 Caribbean and Pacific economies
Table 3: Macroeconomic Indicators for Caribbean and Pacific countries Real GDP growth (%) Inflation (%) Current Account
Balance (% of GDP) Fiscal Balance
(% of GDP)
2005 2006 2007 2008 2005 2006 2007 2008 2005 2006 2007 2008 2005 2006 2007 2008
Caribbean (1) 6.0 7.8 5.7 4.4 7.5 7.9 6.8 8.1 0.4 -0.3 -2.0 -2.1 -1.3 -1.5 -1.0 -0.8Pacific (2) 3.6 2.9 8.3 4.9 2.3 2.9 2.7 4.8 4.0 3.4 6.3 7.3 5.9 11.7 11.8 11.2Source: IMF World Economic Outlook, April 2008. (1) Bahamas, Barbados, Belize, Dominica, Dominican Republic, Grenada, Guyana,Haiti, Jamaica, St. Lucia, Suriname, Trinidad and Tobago; (2) Fiji, Kiribati, Papua New Guinea, Samoa, Solomon Islands, Timor Leste, Tonga
Caribbean macroeconomic performance was mixed in 2007. Regional economic growth remained robust, with the economy expanding by 5.7 percent. At 6.8 percent and 5.9 percent, respectively, Suriname and Trinidad and Tobago experienced the highest growth rates in the region. Economic activity in the region was underpinned by a favourable external environment, private construction, and energy exports from Trinidad and Tobago. In 2008, growth is expected to moderate to 4.6 percent as turbulence in the global economy could dampen tourism demand and domestic activity. After a period of fiscal consolidation, helped by reforms and strong economic activity, the region’s budget deficit has been reduced from 1.5 percent of GDP in 2006 to 1 percent of GDP in 2007, and is expected to further decrease to 0.8 percent of GDP in 2008. The earlier successes at fiscal consolidation, together with debt restructurings in some countries (Belize, Dominica, and Grenada), lowered the regional public debt ratio by about 12 percent of GDP during 2002–07. Nevertheless, the average ratio remains above 80 percent of GDP, and at more than 100 percent of GDP for the Eastern Caribbean Currency Union (ECCU). Regional governments continue to stress their commitment to reducing debt levels further over the medium term. On the other hand, imports related to hotel construction and rising energy costs contributed to the deterioration of region’s current account deficit. In 2007, it widened to 2 percent of GDP compared to 0.3 percent of GDP in 2006. Dominican Republic, Dominica and the Bahamas experienced current account deficits above 20 percent of GDP, followed by Jamaican deficit of 14.5 percent of GDP. These deficits have been largely financed by FDI, but their magnitude underscores the risks faced by the region and its dependence on capital flows. Trinidad and Tobago, as the only major oil exporter in the region, maintained a large current account surplus of 20 percent of GDP in 2007. In 2007 the economies of the Pacific region grew by 7 percent, partly due to high commodity prices. Papua New Guinea managed to pass the fiscal crisis and the current account is in surplus due to a booming mining sector. After economic collapse, the Solomon Islands are experiencing high economic growth combined with a government budget surplus and rapidly declining public debt. Inflation remains a concern due to higher costs for imported fuel, although in 2007 inflation decreased to 2.4 percent compared to 2.7 percent in 2006. The two countries most directly impacted were the Solomon Islands and Samoa with 6.3 percent and 6 percent annual inflation rates in 2007, respectively. High oil prices along with a rapid credit expansion in both countries along with demand stimulus from significant inflows of private remittances were the main reasons for high inflation. However, due to increasing food and commodity prices, inflation is expected to climb up to 4.8 percent in 2008.
DEAS – Development Economics Advisory Service 15

Because of their narrow production base Pacific islands are all dependent on imported goods, mainly from Australia and New Zealand. Except for Papua New Guinea, trade deficits are a regular feature of countries’ balance of payments. Private transfers and remittances from national living overseas have made major contributions in offsetting trade deficits, such as in Samoa, and Tonga. More broadly, official transfers have provided substantial support across the region. Due to high prices for commodities, the current-account surplus in Papua New Guinea has been increasing steadily and reached 4.3 percent of GDP in 2007. Similarly, large oil and gas revenues have led to a sizeable current account surplus in Timor Leste which amounted to 150 percent of GDP in 2007 and is expected to increase further to 172 percent of GDP in 2008. On the other hand, Fiji experienced significant current account deficits (14.8 percent of GDP in 2007, expected to increase to 18 percent of GDP in 2008) as domestic demand spilled over into imports, while the export performance disappointed following the loss of preferential access to some export markets over recent years (textile, sugar). In terms of fiscal performance, Papua New Guinea experienced a fiscal surplus for the third consecutive year in 2007 (6 percent of GDP). However, the underlying non-mineral deficit widened once again due to higher spending and lower non-mineral tax revenue (largely reflecting the phased reduction in the personal income tax). In Timor Leste government spending increased sharply on the back of emergency assistance programs, repair of damage and quick-disbursing grants for rural communities. Yet oil royalties pushed fiscal surpluses to 169 percent of GDP in 2007 and an expected 167 percent of GDP in 2008. In Fiji, the policy framework for 2007 reaffirmed the government’s intention to narrow the deficit – which stood at 0.1 percent of GDP in 2007 – over the medium term. The intention is to reduce the debt burden, which currently stands at 55 percent of GDP. The external debt accounts for 18.5 percent of GDP. Sustained structural reforms remain essential for further economic growth. There is much to be done to remove obstacles to economic development. Business investment is constrained by problems related to land tenure, access, and utilization. These are particularly detrimental to foreign private investment, notably in non-mineral sectors.
6 Latin America
Table 4: Macroeconomic Indicators for Latin American countries Real GDP growth (%) Inflation (%) Current Account Balance
(% of GDP) Fiscal Balance
(% of GDP)
2005 2006 2007 2008 2005 2006 2007 2008 2005 2006 2007 2008 2005 2006 2007 2008
Latin America (1) 4.6 5.4 5.6 4.4 6.4 5.3 5.5 6.7 1.4 1.6 0.6 -0.3 -1.3 -1.1 -1.4 -1.6
Central America (2) 4.7 6.3 6.5 4.7 8.3 6.5 6.7 8.4 -5.0 -4.9 -6.8 -7.6 -2.3 -0.9 -0.3 -1.3
Andean (3) 6.9 7.1 6.9 5.2 6.7 6.2 8.0 10.9 5.3 5.6 3.6 1.8 2.2 1.8 0.6 -0.8 Argentina 9.2 8.5 8.7 7.0 9.6 10.9 8.8 9.2 2.0 2.5 1.1 0.4 -2.0 -1.2 -2.4 -0.7 Brazil 3.2 3.8 5.4 4.8 6.9 4.2 3.6 4.8 1.6 1.3 0.3 -0.7 -3.0 -3.0 -2.3 -2.1 Mexico 2.8 4.8 3.3 2.0 4.0 3.6 4.0 3.8 -0.7 -0.3 -0.8 -1.0 -1.5 -0.7 -1.8 -2.0 Source: IMF World Economic Outlook, April 2008. (1) Argentina, Bolivia, Brazil, Chile, Colombia, Costa Rica, Ecuador, El Salvador, Guatemala, Honduras, Mexico, Nicaragua, Panama, Paraguay, Peru, Uruguay, Venezuela; (2) Costa Rica, El Salvador, Guatemala, Honduras, Nicaragua, Panama; (3) Chile, Colombia, Ecuador, Peru, Venezuela
The economies of Latin America performed strongly in 2007. Building on the strengthening domestic demand in 2005-2006 and continued robust external demand, the major economies of the region grew 5.6 percent in 2007 (Table 4). Growth was most rapid in Argentina, where the government opted for a highly expansionary fiscal policy in a presidential election year, adding stimulus to an economy that was already growing rapidly. Growth decelerated only in Mexico, due to a substantial decline in export growth. Rapid fiscal revenue growth in 2007, due in large part to cyclical factors and high commodity prices, helped governments in the region maintain strong finances. In many countries across the region, the strengthening of fiscal positions combined with skilful, disciplined liability management have helped to lower public sector debt to more manageable levels and reduce exchange rate and rollover risk. Regional public sector debt to GDP declined from 44.5 percent in 2006 to an average 43.4 percent in 2007. Tightening capacity constraints together with rising international prices of foodstuffs have resulted in inflation rising from a regional average of 5.3 percent in 2006 to 5.5 percent in 2007. Inflation in Argentina and DEAS – Development Economics Advisory Service 16

Venezuela, where the macroeconomic policy stance remains highly accommodative despite rapid growth, is well above the region’s average. The governments of these countries continue using price controls in an attempt to contain official inflation, creating substantial distortions in the process. Notwithstanding the recent deterioration in global financial markets, abundant liquidity in the first half of 2007, combined with strengthened macroeconomic policy and improved fundamentals, fostered a 147 percent increase in net private external capital flows to the region for the year as a whole, from USD 46.8 billion in 2006 to USD 129.4billion in 2007. Private capital comprised the bulk of net capital flows (Chart 12).
DEAS – Development Economics Advisory Service 17
Latin America’s current account surplus to GDP ratio narrowed to 0.6 percent in 2007 from 1.6 percent to GDP in 2006 due to a narrower merchandise trade surplus and a wider deficit in the services and income account. In the services and income account, a rise in interest payments to external creditors was only partially offset by rising net private transfers. The growth of remittance income from migrant workers declined from an average of 15 percent in 2000-2006 to 7 percent in 2007, largely due to a decline in construction activity in the U.S. Narrowing current account surpluses relative to GDP in Argentina, Brazil, Peru, and Venezuela were accompanied by widening deficits in Mexico and Colombia.
Chart 12: Capital flows to Latin America
-40-20
020406080
100120140
2002 2003 2004 2005 2006 2007 2008
Net private capital flows Net official capital flows
Source: IMF World Economic Outlook, April 2008. In billion of USD.
Although a host of social indicators have improved significantly over the past several years, poverty and income inequality remain formidable challenges in the region, adversely impacting longer-term prospects for prosperity. Over the longer horizon, however, a successful strategy to substantially reduce poverty and broaden the middle class will require robust economic growth and human capital development through education reform and investment in health and services.
7 Asia
Table 5: Macroeconomic Indicators for Asian countries Real GDP growth (%) Inflation (%) Current Account
Balance (% of GDP) Fiscal Balance
(% of GDP)
2005 2006 2007 2008 2005 2006 2007 2008 2005 2006 2007 2008 2005 2006 2007 2008
Asia (1) 8.5 9.2 9.3 7.8 3.6 3.9 5.0 5.7 4.2 5.6 6.4 5.1 -1.4 -1.1 -0.1 -1.2Asean4 (2) 5.1 5.5 6.1 5.7 7.2 8.2 4.0 5.0 2.1 5.2 5.8 4.0 -0.7 -0.4 -0.9 -1.4NIA (3) 4.8 5.6 5.6 4.0 2.2 1.6 2.2 3.0 5.1 5.2 6.0 4.5 1.7 2.0 3.5 2.0 China 10.4 11.1 11.4 9.3 1.8 1.5 4.8 5.9 7.2 9.4 11.1 9.8 -1.3 -0.8 1.1 -0.8India 9.1 9.7 9.2 7.9 4.2 6.2 6.4 5.2 -1.3 -1.1 -1.8 -3.1 -6.9 -6.3 -5.5 -5.5Source: IMF World Economic Outlook, April 2008. (1) Bangladesh, Brunei Darussalam, China, India, Indonesia, Korea, Lao People's Dem.Rep, Malaysia, Mongolia, Nepal, Pakistan, Philippines, Singapore, Sri Lanka, Thailand, Vietnam, Yemen; (2) Asean4: Indonesia, Malaysia, Philippines, Thailand (3) Newly Industrialized Asia: Hong Kong, Korea, Singapore, Taiwan
The leading emerging market economies of Asia have demonstrated considerable resilience to the challenges arising from the turmoil in the global financial markets, slackening demand from the U.S. and the steep run-up in commodity prices. In 2007, the region experienced a record growth of 9.3 percent, led by Chinese 11.4 percent and Indian 9.2 percent growth rates (Table 5). China’s rapid growth continues to be investment led, while in India domestic demand contributed to economic growth. However, in line with the U.S.-led global slowdown, signs of moderating activity emerged in Asia in late 2007 and early 2008. While growth remains high, and domestic demand is still buoyant, key activity indicators suggest that momentum in the region is easing and growth will reach 7.8 percent in 2008.

Inflation pressures have been rising across most of Asia and inflation increased to 4.7 percent in 2007 compared to 3.6 percent in 2006. Headline inflation has increased noticeably in India and China. Inflation in Newly Industrialized Asia (Hong Kong, Korea, Singapore, and Taiwan) has risen as well, but has turned down in the ASEAN-4 (Indonesia, Malaysia, Philippines, and Thailand). Currency appreciation in some countries has dampened imported inflation. While the initial rise in headline inflation in much of the region reflected supply-related food price shocks and higher global commodity prices (where they were allowed to pass through), price increases are starting to be more broad-based. By sustaining growth of more than 20 percent for the third consecutive year, merchandise exports continued to provide a key source of growth for the leading emerging markets in Asia. Recent trade performance has remained positive in the face of the U.S. slowdown. Export growth in the larger economies shows signs of stabilizing, while elsewhere exports have trended higher in recent months, partly reflecting rising commodity prices. In terms of destination, exports to the United States and the European Union – Asia’s two largest trading partners – peaked in mid-2007. Import growth has picked up as well recently, even after netting out the effects of oil. Nevertheless, strong growth in exports of goods and services, rising income receipts from expanding outward investment and buoyant inflows of private transfers, boosted the current account surpluses of Asia to 6.4 percent of GDP, of Asean-4 to 5.8 percent of GDP, and of NIA to 6 percent of GDP in 2007, respectively.
Chart 13: Net Private capital flows to Asia
0
50
100
150
200
250
300
2002 2003 2004 2005 2006 2007 2008 Source: IMF World Economic Outlook, April 2008. In billion of USD for all Asian countries covered in Table 5.
After rising more than four-fold between 2002 and 2006, net private capital inflows to the leading emerging markets of Asia levelled off in 2007 at around USD 255 billion (Chart 13). Net inflows of foreign direct equity investment continued the five-year upward trend to reach USD 116 billion in 2007, but large foreign sales of common stock led to USD 36 billion in net outflows of portfolio equity investment following net inflows of a similar magnitude in 2006.
DEAS – Development Economics Advisory Service 18
The current account surplus and large capital inflows have sustained the upward trajectory of official foreign exchange reserves so that they reached USD 2.6 trillion in March 2008, double the holdings at the end of 2005 (Chart 14). Part of the increase also reflects the valuation effect of non-dollar holdings arising from the fall in the dollar. China accounted for more than two-thirds of the increase of the group over the past year, but reserves rose in every country. While the strong balance of payments across the region is a product of the underlying fundamentals, the widespread increase reflects the continuing policy objective of limiting exchange rate appreciation.
Chart 14: Official foreign exchange reserves in Asia
0
500
1000
1500
2000
2500
3000
2005 2006 2007 Mar-08
China India Other EM Asia
Source: IMF World Economic Outlook, April 2008. In billion of USD. Other EM Asia corresponds to all Asian countries covered in Table 5 with the exception of China and India.
In general, the leading emerging markets in Asia are well positioned to weather uncertain and less favourable global conditions. Growth has been strong, while the buoyant balance of payments and large accumulation of reserves has diminished the region's vulnerability to external financing. The global financial turmoil that began in mid-2007 triggered an asset market correction across the region that has had only a moderate impact on the real economies and is unlikely to undermine macroeconomic stability over the medium term.
However, the re-emergence of conservative attitudes against privatization, structural reform and market liberalization might be at odds with plans to further foster growth and development in the future. Similarly, while financial sector reforms seem inevitable, the sub-prime crisis might contribute to delay them. The reluctance to allow greater exchange rate flexibility also creates distortions that can keep an economy from reaching its potential.
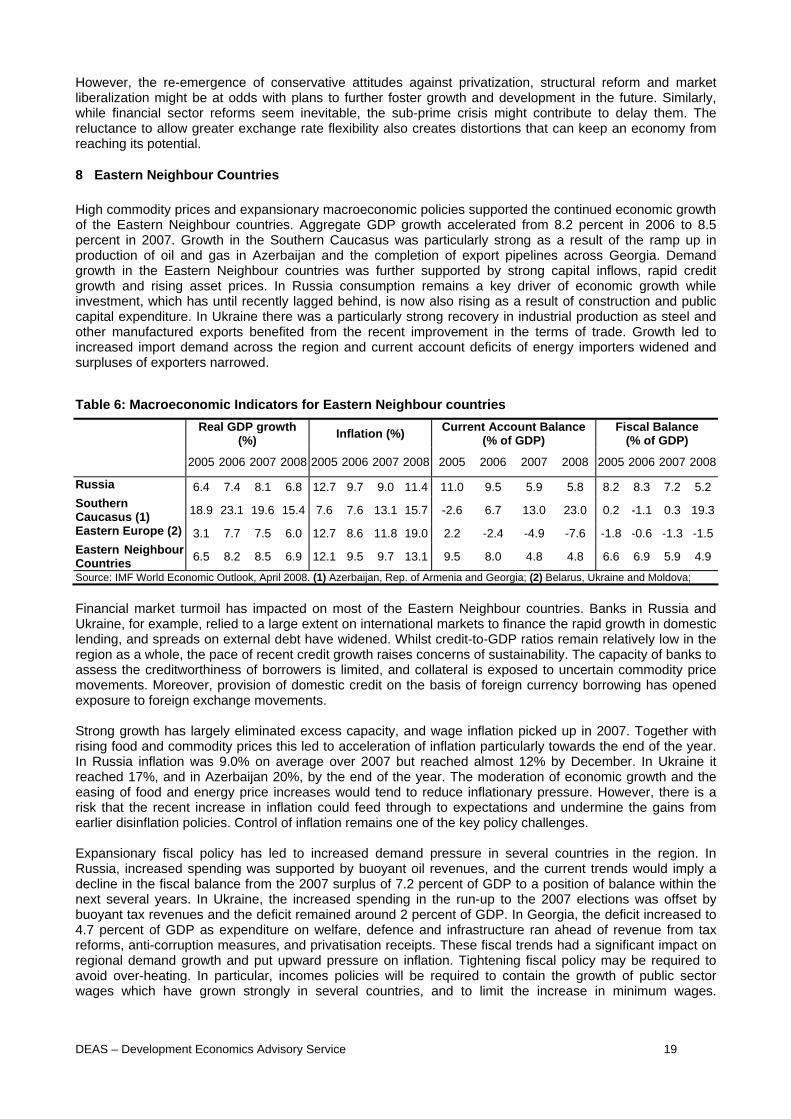
8 Eastern Neighbour Countries High commodity prices and expansionary macroeconomic policies supported the continued economic growth of the Eastern Neighbour countries. Aggregate GDP growth accelerated from 8.2 percent in 2006 to 8.5 percent in 2007. Growth in the Southern Caucasus was particularly strong as a result of the ramp up in production of oil and gas in Azerbaijan and the completion of export pipelines across Georgia. Demand growth in the Eastern Neighbour countries was further supported by strong capital inflows, rapid credit growth and rising asset prices. In Russia consumption remains a key driver of economic growth while investment, which has until recently lagged behind, is now also rising as a result of construction and public capital expenditure. In Ukraine there was a particularly strong recovery in industrial production as steel and other manufactured exports benefited from the recent improvement in the terms of trade. Growth led to increased import demand across the region and current account deficits of energy importers widened and surpluses of exporters narrowed.
Table 6: Macroeconomic Indicators for Eastern Neighbour countries
Real GDP growth (%) Inflation (%) Current Account Balance
(% of GDP) Fiscal Balance
(% of GDP)
2005 2006 2007 2008 2005 2006 2007 2008 2005 2006 2007 2008 2005 2006 2007 2008
Russia 6.4 7.4 8.1 6.8 12.7 9.7 9.0 11.4 11.0 9.5 5.9 5.8 8.2 8.3 7.2 5.2 Southern Caucasus (1) 18.9 23.1 19.6 15.4 7.6 7.6 13.1 15.7 -2.6 6.7 13.0 23.0 0.2 -1.1 0.3 19.3
Eastern Europe (2) 3.1 7.7 7.5 6.0 12.7 8.6 11.8 19.0 2.2 -2.4 -4.9 -7.6 -1.8 -0.6 -1.3 -1.5Eastern Neighbour Countries 6.5 8.2 8.5 6.9 12.1 9.5 9.7 13.1 9.5 8.0 4.8 4.8 6.6 6.9 5.9 4.9
Source: IMF World Economic Outlook, April 2008. (1) Azerbaijan, Rep. of Armenia and Georgia; (2) Belarus, Ukraine and Moldova;
Financial market turmoil has impacted on most of the Eastern Neighbour countries. Banks in Russia and Ukraine, for example, relied to a large extent on international markets to finance the rapid growth in domestic lending, and spreads on external debt have widened. Whilst credit-to-GDP ratios remain relatively low in the region as a whole, the pace of recent credit growth raises concerns of sustainability. The capacity of banks to assess the creditworthiness of borrowers is limited, and collateral is exposed to uncertain commodity price movements. Moreover, provision of domestic credit on the basis of foreign currency borrowing has opened exposure to foreign exchange movements. Strong growth has largely eliminated excess capacity, and wage inflation picked up in 2007. Together with rising food and commodity prices this led to acceleration of inflation particularly towards the end of the year. In Russia inflation was 9.0% on average over 2007 but reached almost 12% by December. In Ukraine it reached 17%, and in Azerbaijan 20%, by the end of the year. The moderation of economic growth and the easing of food and energy price increases would tend to reduce inflationary pressure. However, there is a risk that the recent increase in inflation could feed through to expectations and undermine the gains from earlier disinflation policies. Control of inflation remains one of the key policy challenges. Expansionary fiscal policy has led to increased demand pressure in several countries in the region. In Russia, increased spending was supported by buoyant oil revenues, and the current trends would imply a decline in the fiscal balance from the 2007 surplus of 7.2 percent of GDP to a position of balance within the next several years. In Ukraine, the increased spending in the run-up to the 2007 elections was offset by buoyant tax revenues and the deficit remained around 2 percent of GDP. In Georgia, the deficit increased to 4.7 percent of GDP as expenditure on welfare, defence and infrastructure ran ahead of revenue from tax reforms, anti-corruption measures, and privatisation receipts. These fiscal trends had a significant impact on regional demand growth and put upward pressure on inflation. Tightening fiscal policy may be required to avoid over-heating. In particular, incomes policies will be required to contain the growth of public sector wages which have grown strongly in several countries, and to limit the increase in minimum wages.
DEAS – Development Economics Advisory Service 19

DEAS – Development Economics Advisory Service 20
Monetary conditions tightened in Ukraine in the second half of 2007 in response to rising inflation. Tighter monetary policy combined with exchange rate appreciation may also be necessary in Georgia and Russia. Over the medium term, the region remains exposed to oil and commodity prices and diversification away from commodities is a key challenge. Investment over recent years remains low at approximately 20 percent of GDP and has been concentrated in the extractive industries and construction. Non-energy sectors in Russia have made significant progress and are currently growing at approximately twice the rate of the energy sector. Although Russian oil production recovered rapidly from the low levels of the mid-1990s, there are doubts about the potential for continued expansion over the medium term. In Ukraine chemical and metal sectors with limited potential for increased value added still dominate the industrial sector, and in Georgia energy transportation is a key source of revenue. Improvements in the regional business environment will be necessary to promote private sector activity and greater economic diversification.

DEAS – Development Economics Advisory Service 21
PART II

DEAS – Development Economics Advisory Service 22
SCALING UP MICROFINANCE
1 Introduction The microfinance industry is going through a period of rapid growth. Over the period 2001 to 2006 the number of borrowers worldwide, according to Mix data, grew at an annual average rate of 19% p.a., and the gross loan portfolio increased at a rate of 54% p.a. The data cover a diverse and largely unregulated activity where reporting is voluntary and incomplete. However, in spite of the data uncertainties the growth of the sector in recent years has clearly been phenomenal. Even so, microfinance remains small with estimates of total outstanding loans in the order of one quarter of a percent of GDP in developing countries, and an aggregate penetration rate of approximately 1% (measured as the ratio of clients to total population), though it is much higher in some countries. For the advocates of microfinance, its small scale and low penetration rates are indicators of future opportunities. If microfinance is to realise its potential to make inroads into poverty, through enterprise and job creation, and contribute to the achievement of the Millennium Development Goals, it must continue to scale up. The term scaling up has been widely used in the context of aid initiatives that seek to roll out a successful pilot programme to a wider population. Jeffrey Sachs10, for example, cites the green revolution in Asia as a case where new techniques (high yielding crop varieties) were applied on a sufficient scale to have a major economic impact at national and regional levels. Microfinance appears to be a potential candidate for this kind of scaling up, through public support and subsidy or support from private investors and intermediation of savings. As an instrument for economic development it offers a home-grown solution, or at least one that can be rapidly assimilated after a relatively short period of external support. Once MFIs (microfinance institutions) reach a position of financial sustainability, access to commercial finance enables a rapid roll-out of the programme. Moreover, if it is correctly targeted, access to finance lifts what would otherwise be a constraint on micro-entrepreneurs and enables them, by their own enterprise, to raise income and reduce poverty. In this way, it potentially avoids many of the pitfalls of scaling up aid with its associated constraints of diminishing returns and planning overheads. However, the potential of microfinance has probably been over-stated. Despite many studies addressing the social and economic impact of microfinance, decisive proof remains elusive, and there is a growing body of literature expressing doubts about some of the more extravagant claims of microfinance advocates. The backlash not only points out the pitfalls of impact assessment but also expresses more far-reaching concerns. The term mission drift is widely used in the literature to refer to the common view that MFIs seeking to expand their operations lose sight of their original social objectives and re-focus on a wealthier client-base as they target increasingly commercial objectives. “What’s Wrong with Microfinance” (2007)11, raises questions about opportunity costs, and potentially harmful impacts, “Microfinance Banana skins” (2008)12, surveys the concerns from within the industry on governance and other issues, and “Finance for All”13, expresses doubt about the use of subsidies to support credit instead of non-credit instruments such as savings, and money transfer systems. The objective of this section is to examine the possibility of scaling up of microfinance. The discussion is based on recent data about the performance of the sector, and a literature review. The section is structured as follows. Recent developments and the status of the industry are discussed under heading 2. Heading 3 reviews some recent literature on market failure and describes the basic rationale for intervention in microfinance. Difficulties and issues in impact assessment are described under heading 4, while industry-specific sustainability issues are covered under heading 5. Heading 6 addresses recent developments in financing the sector. Concluding remarks are under heading 7.
2 Status of the Industry The story of modern microfinance starts in 1976 in Bangladesh when Mohamad Yunus lent a group of stool makers USD 27 from his own pocket. Their previous loan had been form a traditional money-lender whose terms required them to sell all of their stools to him at prices that barely covered production costs and kept the producers trapped in a position of dependence and poverty. This first loan was never repaid, but nevertheless Yunus went on to develop a business which in 1983 saw the establishment of the Grameen
10 Sachs, “The End of Poverty”, Penguin 2005. 11 Dichter and Harper, “What’s Wrong with Microfinance”, Intermediate Technology Publications, Warwickshire, 2007. 12 Centre for the Study of Financial Innovation, “Microfinance Banana Skins 2008, Risk in a Booming Industry”, CGAP, 2008. 13 The World Bank, “Finance for All? Policies and Pitfalls in Expanding Access”, 2008.

DEAS – Development Economics Advisory Service 23
Bank, and by 2006 had grow to reach 6.7 million clients, or some 14 % of the population of Bangladesh. The business model is based on lending to groups of women who guarantee each others’ loans, and social pressure within the group means that they nearly always pay back14. From the start, Grameen credit included a combination of credit and compulsory and voluntary savings. The offerings have been developed over time and in particular, new loans provide greater flexibility in repayment schedules to allow for the changing circumstances of the clients. The Grameen Bank made profits (which are redistributed to clients) every year except when the country was devastated by floods. Table 1: Characteristics of Selected Microfinance Institutions
Grameen,
Bangladesh(31.12.2006)
Banco Sol, Bolivia
(31.12.2007)
Compartamos, Mexico
(31.12.2007)
Al Amana, Morocco (31.12.2007)
Established 1983 1992 1990 1997 Number of borrowers 6,707,000 121,207 837,743 481,303 Number of savers 6,707,000 169,507 2,749 - Average loan size USD 79 1,724 450 636 Percent female borrowers 96% 46% 98% 48% Group lending? Yes Yes Yes Yes Collateral required? No No No No Portfolio at risk >30 days ratio (1) 2.8% 1.0% 2.7% 0.9% Return on equity 22.1% 32.7% 45.7% 23.5% Return on assets 2.4% 3.2% 20.0% 4.1% Operational self-sufficiency (2) 116% 127% 176% 127% Notes: (1) Portfolio at Risk > 30 days/ Gross Loan Portfolio (2) Financial Revenue (total) / (Financial Expenses + Loan Loss Provision Expenses + Operating Expenses) Source: Sengupta and Aubuchon (2008)15, and Mix market Recognition for Mohamad Yunus came in 2006 with the award of the Nobel Peace Prize. One measure of the success of the Grameen Bank is its ability to access finance while at the same time keeping interest rates low enough to be affordable to the poor. The Bank has benefited from the support of wealthy individuals and benefits from an implicit subsidy because it is not obliged to provide returns to capital. However, high repayment rates have allowed the Bank to access international finance. In addition, access to local finance through the banking system and intermediation of local savings make the Grameen Bank largely self-sufficient in terms of covering operating expenses. Bangladesh has provided a model for the development of microfinance in many other parts of the world. There are many examples where group lending models have been successfully replicated, sometimes with explicit advice and training from the Grameen Bank itself. However, different business models have also been applied, including individual loans, consumer credit, lending to SMEs, and savings-led programmes. These offerings differ significantly in their loan sizes. Grameen-type operations which target the very poor have average loan amounts of less than USD 100. Loans of over USD 1 500 (by Banco Sol, for example) indicate a much wealthier client base and a greater focus on SMEs. This diversity16 makes it difficult to generalise about the industry and underlies the controversy surrounding the beneficial impact of microfinance. The following examples illustrate the diversity of the sector, and table 1 provides comparisons with Grameen Bank.
• Banco Sol started out as an NGO (PRODEM) lending to groups of micro-entrepreneurs with Grameen-type lending products. In 1992 they transformed into a commercial bank and now offer a variety of products including savings, credit, insurance and housing loans. What distinguishes them from Grameen is their focus on making a profit, with poverty alleviation as only a secondary goal.
14 Ghatak, M and T Guinnane. “The Economics of Lending with Joint Liability: Theory and Practice”, Journal of Development Economics 60 (1): 19-228, 1999, pointed out that high reported repayment rates are potentially misleading in a rapidly growing market because they compare defaults on past loans with the current outstanding balance. Furthermore, there are general concerns with the reliability and consistency of repayment estimates where recovery from other group members or repossession of property to cover repayment are not counted as default. 15 Sengupta, R and CP Aubuchon, “The Microfinance Revolution: An Overview”, Federal Reserve Bank of St Louis Review, 90(1), pp 9-30, Jan/Feb 2008. 16 Microfinance is not restricted to developing countries. The Enterprise Development Group, Washington DC provides microfinance in the US, and Grameen-type operations are being established to serve the economically marginalised in New York.

DEAS – Development Economics Advisory Service 24
Whereas the Grameen Bank is a social business, defined by Yunus as non-profit or non-dividend businesses, the potential of the sector has also attracted profit-maximising businesses raising concerns about regulation and consumer protection.
• Compartamos was one of the first MFI’s to issue debt when in 2002 they were listed on the Mexican
stock exchange. Their first bond issue was rated by S&P at MXA (Mexican AA). Compartamos expanded its products from credit to savings and other bank service when it became a commercial bank in 2006. Compartamos has now completed a fifth bond issue which was three times oversubscribed, and 70% of the issue went to institutional investors. Access to the commercial debt market enabled Compartamos to operate without subsidies for over a decade, and to improve services to clients including the provision of life insurance for all borrowers. This commercial success and the large returns it generated (the IPO valued the company at around 13 times book value) led to a wider debate in the media about the ethics of making money from lending to the poor.
Table 2. Regional Microfinance Indicators 2006
E Asia, Pacific
Europe, C Asia
L Am., Carrib. MENA S Asia Africa All
Regions Number of MFIs 131 202 272 41 202 190 1038 Millions of borrowers 10.5 1.8 9.3 1.7 29.8 4.8 57.9 Millions of voluntary savers 32.3 2.7 6.9 0 18.6 7.2 67.7 Average loan balance (USD) 534 2581 1126 520 137 617 1031 Op. expenses as % of avg. gross loan portfolio 28% 21% 30% 23% 22% 44% 29% ROA – average -1.1% 2.8% 0.6% -1.9% -3.5% -6.5% -1.4% ROA – median 1.4% 2.7% 2.0% 0.5% 0.4% -1.8% 1.1% Portfolio at risk >30 days 7.1% 3.2% 5.8% 7.6% 3.8% 9.4% 5.7% Source: Microfinance Information Exchange
• Al Amana is a leading player in Morocco. National banking regulations do not allow MFIs to take
deposits, and therefore Al Amana, like most of the other MFIs in the Mediterranean region, cannot offer savings accounts. It is not a profit-maximising business and operates in an environment with a relatively high level of GDP per capita and little poverty in comparison with South Asia. Whereas Grameen, for example, has specific goals in terms of reaching the poor, the focus of Al Amana is on inclusion of marginal groups in the formal economy. The institution has expanded rapidly over recent years, and as the number of borrowers increased from 78,000 in 2002 to 481,000 at the end of 2007, the focus shifted towards less-poor clients and the average loan size increased from USD 200 to USD 636. Although Al Amana was established with donations, the sustainability of its operations has brought access to finance both from the local banking system and foreign financial institutions. The average cost of finance, according to the Al Amana annual report, declined from 5.5% in 2005 to 5.3% in 2006.
The diversity of the microfinance industry is also apparent at the national and regional levels from the types of services provided and the market penetration rates. Although there are more savers than borrowers worldwide (see chart 1), this is largely due to South East Asia and sub-Saharan Africa where the industry has followed a savings-led development path. In other regions, the industry has been predominantly credit-driven and in the Middle East and North Africa, for example, banking regulations for the most part do not allow MFIs to offer savings accounts. Market penetration also varies across regions (see chart 2), and this gives some broad indications of the degree of market saturation. FEMIP countries, for example, were relatively late in developing microfinance and, with the exception of Morocco, have low rates of penetration. However, the penetration statistics also reflect differences in the size of the microfinance markets, and the degree of competition from banks. The penetration rate of around 2% of population in Morocco, which is a middle income country with a relatively sophisticated financial system, implies a much higher level of saturation of the potential microfinance market than the similar rates of penetration in countries like Malawi and Togo where a larger proportion of the population is without access to conventional finance.

Chart 1: Number of Microfinance Clients
0
20
40
60
80
Number of borrowers Number of voluntary savers
Milli
ons
East Asia, Pacific E. Europe, Central AsiaL. America, Carribean Middle East, North AfricaSouth Asia Africa
Source: MixMarket, World Bank, Sanabel, FEMIP TA and Trust Fund studies
3 How microfinance works Microfinance works by offering mechanisms to address market failures at their root. The group lending model, for example, provides a screening and selection process undertaken by insiders who have access to the relevant enterprise-specific information. Repayment is enforced by a combination of incentives of progressive access to larger loans, compulsory savings, and social pressure from within the group. The effectiveness of these incentive mechanisms is evident from the large supply of credit, strong demand, and the high reported rates of repayment17. Group lending has thus allowed the emergence of a functioning credit market where most market failures have been overcome.
DEAS – Development Economics Advisory Service 25
However, group lending is not the best instrument for all microfinance clients. The switch from group to individual lending by a number of MFIs has provided evidence on the relative merits of the two models. In the Philippines18 the conversion to individual loans did not reduce the repayment rates on pre-existing loans. Furthermore, the conversion made an important contribution to growth by attracting new clients who had previously been deterred by the peer pressure of group lending, and the risks of entering join liability commitments. For some clients the provision of savings products is more important than credit. For example, a poor household with volatile income faces extreme consequences in the event of enterprise failure. These risks prevent them from undertaking innovative enterprises that would potentially break the cycle of poverty and low growth19. Consumption smoothing, which addresses the underlying risks may be achieved more cheaply by saving than borrowing, and insurance can be preferable to access to credit in times of crisis. These economic arguments are supported by recent evidence showing that when savings instruments are made available, the demand for credit declines20. In
Chart 2: Market Penetration
0% 2% 4% 6% 8% 10% 12% 14%
BoliviaNicaragua
El SalvadorHonduras
SyriaLebanon
JordanTunisia
EgyptMoroccoEthiopia
NigerMali
SenegalBanin
GambiaTogo
MalawiIndia
NepalCambodia
VietnamSri LankaThailand
IndonesiaBangladesh
Clients as percentage of population
Source: MixMarket, World Bank, Sanabel, FEMIP TA and Trust Fund studies
17 A number of studies have offered explanations of how group lending works, emphasising issues of moral hazard (Stizlitz 1990, “Peer Monitoring and Credit markets”. World Bank Economic Review, 4(3):351-366), adverse selection (Ghatak 1999, “Group Lending, Local Information and Peer Selection”, Journal of Development Economics, 60(1):27-50), and contract enforcement (Besley and Coate 1995, “Group Lending Repayment Incentives and Social Collateral”, Journal of Development Economics, 46(1):1-18). In a recent study of group lending in Thailand, Ahlin and Towshend (2007), “Using Repayment Data to Test across Models of Joint Liability Lending”, Economic Journal 117 (517), F11-F51, concluded that as microfinance markets become more mature, there is a tendency for the binding constraint to shift from contract enforcement to more subtle problems of information and selection. 18 Giné and Karlan (2006), “Group vs Individual Liability: A Field Experiment in the Philippines”. Policy Research Working Paper 4008, World Bank. 19 Dercon, S, T Bold, and C Calvo (2008), “Insurance for the Poor?” Global Poverty Research Group, GPRG-WPS-073. http_//www.gprp.org/ 20 Ashraf, Karlan and Yin (2006), “Deposit Collectors”, Advances in Economic Ananlysis and Policy 6(2):1483-83.
DEAS – Development Economics Advisory Service 26
addition, savings enable the accumulation of assets over the long term. This facilitates enterprise development and plays an important part in achieving economic growth21. High transactions costs are often cited as an obstacle to increasing outreach. MFIs that seek to cover their operating costs must pass on the cost of providing small loans in remote areas in the form of high interest rates. However, two sets of empirical studies suggest that this obstacle may not be as serious as it appears. First, case studies in Sri Lanka22 and Mexico23 show that micro-enterprise returns are generally high, and returns greater than 10% per month are not exceptional. Second, results from Dhaka24 and S Africa25 suggest that the elasticity of demand for credit is low. Taken together, these findings suggest that high interest rates need not be an obstacle to growth of the microfinance industry. Nevertheless, new technologies are reducing the cost of money transfer and the provision of more-affordable transfer services has important synergies with nearly all other microfinance activities, which could boost economic and social impact. Some of the key issues are addressed in the EIB’s “Study on Improving the Efficiency of Workers’ Remittances in Mediterranean Countries”26. Furthermore, recent evidence from the academic literature supports the view that reducing transactions costs will have a significant impact on the choice of transfer channel. Gibson et al (2006)27 for example, estimated that a 10% reduction in costs would increase remittances by 2%. Furthermore, there is evidence from El Salvador28 that when remittances are channelled through the banking system, they expand the use of bank services to a larger client population. This opens the door to higher saving rates and consumption smoothing.
4 Social and economic impact Impact of microfinance on GDP is hard to identify due to the small aggregate size of microfinance lending, which on a regional basis is in the range of 0.1% to 0.6% of GDP (see chart 3). Impact assessment studies therefore typically focus on the micro impacts of microfinance programmes. A recent study by the EIB for FEMIP reviewed 34 impact assessments worldwide, with 10 in the FEMIP region.
This literature shows an accumulation of evidence of the beneficial impact on individual clients, households, and micro-enterprises. Whilst this may not constitute proof in scientific terms due to the inherent methodological difficulties involved in impact assessment, it nevertheless provides some well-grounded support for what many practitioners regard as the self-evident benefits of microfinance. The most robust results are the improvement in household income and enterprise profits and revenue. There are some regional differences however: whereas the increased income is generally reflected in improved housing and increased food consumption, these variables are not affected to the same extent in the Mediterranean.
21 Ahlin and Jiang (2007), “Can Micro-credit bring Development?”, Journal of Development Economics 86:1-21, develops the long run equilibrium theory, which suggests that lasting impacts of micro-credit depend on the simultaneous facilitation of micro-savings. 22 DeMel, McKensie and Woodruff (2007). “Returns to Capital in Microenterprises: Evidence from a Field Experiment”, Policy Research Paper 4230, World Bank. 23 McKensie and Woodruff (2007). “Experimental Evidence on Returns to Capital and Access to Finance in Mexico”. World Bank Working Paper. 24 Dehejia, Montgommery and Morduch (2005), “Do Interest Rates Matter? Credit Demand in the Dhaka Slums”, Working Paper, New York University. 25 Karlan and Zinman (forthcoming), “Credit Elasticities in Less Developed Countries: Implications for Microfinance”. American Economic Review. 26 EIB (2006), “Study on Improving the Efficiency of Workers’ Remittances in Mediterranean Countries” 27 Gibson J, D McKenzie, and H Rohorua (2006), “How Cost-elastic are Remittances? Estimates from Tongan Migrants in New Zealand”. Working paper World Bank Development Research Group, Washington DC. 28 Demiguc-Kunt and Maria Soledad Martinez Peria (2007), “Remittances and the Use of Banking Services. Evidence from El Salvador”, Working Paper, World Bank Development Research Group.

At the enterprise level, the impact on employment is generally weak, because the majority of micro-enterprises remain one-man businesses. However, benefits to enterprise are more apparent from increases in productivity, and improved relationships with suppliers. Credit is typically used for working capital which is often the binding constraint on enterprise development, and lending for capital formation is less common. The impact on household savings is also difficult to identify as the boundaries between the household and the enterprise are often indistinct, and savings may be held in the form of enterprise inventories.
Chart 3: Loans as % of GDP
0.0%
0.1%
0.2%
0.3%
0.4%
0.5%
0.6%
0.7%
East
Asi
a,Pa
cific
L.Am
eric
a,C
arrib
ean
Sout
hAs
ia
All
Reg
ions
Loan
s as
% o
f GD
P
0.0%
0.5%
1.0%
1.5%
2.0%
2.5%
3.0%
Pene
traio
n %
Penetration (right axis)Loans in percent of GDP
Source: MixMarket, World Bank, Sanabel, FEMIP TA and Trust Fund studies
However, impact assessment has not convinced the sceptics because these studies have a number of important limitations. First, impact assessment is intrinsically difficult and in particular, it is difficult to establish a convincing counterfactual against which the impact can be measured. Some of the methodological pitfalls are illustrated in the assessments of Bangladesh discussed in the text box. Second, it is hard to prove that impact assessments are impartial. Respondents to surveys may perceive a risk that their credit will be cut off, staff involved in conducting surveys may have their own interests in the results, and the motivation for funding the assessment, either by donors or MFIs, is typically to provide a justification for their interventions. Third, there is potential conflict between the objectives of social and economic impact assessment and the more operational needs for market research.
Chart 4: Rate of Return and Loan Size
-10%-5%0%5%
10%15%20%25%30%35%40%
0 500 1000 1500 2000 2500
Loan size USD
Ret
urn
on A
sset
s %
Sample of 595 MFIs in 2006 with ROA > minus 10%, and loan size < USD 2,500
Source: MixMarket
Box: The Pitfalls of Impact Assessment: lessons from Bangladesh In 1998 Pitt and Khandker29 published an impact assessment of three microfinance programmes in Bangladesh including the Grameen Bank. The authors were concerned about the problem of selection bias – that there would be a tendency for MFIs to focus on more entrepreneurial groups (or for them to be more attracted to microfinance), and that the results would reflect these underlying qualities in the clients themselves rather than the impact of the programme. However, the three MFIs each operated a policy of lending only to clients with less than half an acre of land, as a means of focusing on the poor. Pitt and Khandker used this half-acre cut-off to set up a control group which appeared to avoid the problem of selection bias. Having allowed for other household characteristics, the difference between a household with just less than half an acre and one with just more than half an acre could be attributed to the impact of the programme. Using a carefully specified econometric model to allow for the known differences in household characteristics, Pitt and Khandker found small but significant positive effects on household expenditure, assets, labour supply, and the likelihood that children would attend school. Furthermore, the impact on labour supply was relatively weak compared with the increase in income and this suggested that the primary impact of microfinance was to raise the productivity of labour rather than to increase working hours.
DEAS – Development Economics Advisory Service 27
29 Pitt, M and S Khandker. “The Impact of Group-Based Credit Programs on Poor Households in Bangladesh: Does the Gender of Participants Matter?” Journal of Political Economy 106 (5): 958-96, 1998.

DEAS – Development Economics Advisory Service 28
However, the methodology and results of the study were called into question by Morduch30 who pointed out that the all-important half-acre cut-off was not systematically enforced by the MFIs and that in practice some 20-30% of loans were made to clients above the threshold. But in order to establish the control group for the study, Pitt and Khandker had applied a systematic cut-off, and therefore their results based on the difference between the two groups tended to over-state the true impact. Furthermore, Morduch challenged the econometric model and using a simplified alternative approach found no evidence of impact. New data became available with a second round of surveys, and this panel data made it possible to examine changes over time as well as differences between clients and non-clients. Khandker31 was therefore able to make more accurate estimates in 2003, and to control for household characteristics that are not directly observable but are constant over time. This revised analysis suggested a substantially lower impact of credit than the original Pitt and Khandker study had found in 1998. In order to address some of the best-practice issues, a substantial effort has been devoted to impact assessment tools. These are standardised methods and procedures which can be adapted to local conditions to provide more consistent and reliable low-cost assessments. Examples of these tools include SEEP (Small Enterprise Education and Promotion), developed by USAID, and IKM (Impact Knowledge Market) used by Planet Finance. In addition impact assessment is one of the dimensions addressed by recent efforts to develop social performance assessment which looks also at the formation and monitoring of social goals within the MFI itself. The development of these tools has been focused on improving the monitoring and assessment of changes in client circumstances without necessarily being able to attribute the changes to microfinance. Therefore, while they serve a valuable purpose for donors and MFIs, they do not provide proof.
5 Sustainability Achieving a position of sustainability, where revenues cover costs, is the goal of many MFIs. Whilst the reduced dependence on subsidies enables the MFI to expand and reach new clients, it also brings new commercial pressures and risks of mission drift. The debate remains far from settled on whether sustainability on a broad scale is desirable or even feasible. In a sample of 124 MFIs in 49 countries32, only half of what are probably the world’s most cost-efficient MFIs are found to be self-sustainable. This lack of sustainability does not imply that MFIs are failing, but reflects the different objectives and structures of the institutions. Subsidised micro-credit may in some instances be one of the few instruments available to reach the poor, and the presence of these subsidies can help MFIs to maintain their focus on the poorest clients.
Reaching poor clients, sometimes in remote areas, entails high transactions costs. These costs tend to weigh more heavily on the poorest clients where loan sizes are small. As a result, many MFIs that focus on the poor are dependent on subsidies33. Some are charitable institutions and others receive aid or government subsidies aimed at achieving social objectives. Implicit subsidies are also present when MFIs are structured in such a way that they do not earn a market return on capital. There is clearly a link between small loan sizes and lack of self sustainability. Chart 4 shows that MFIs with low returns were predominantly those with low average loan sizes. However, the size of the MFIs is also a contributing factor as many smaller institutions are unable to exploit economies of scale. Increasing the average loan size by shifting focus to less poor clients does not necessarily increase sustainability. The wide distribution of returns, particularly for MFIs with average loan sizes of less than USD 500, shows that many MFIs can be both profitable and serve the poor. Wealthier clients demand different types of loan products, and the upper segments of the market particularly in urban areas face competition from banks. Over the medium term the subsidisation of microfinance has an economic opportunity cost because there are alternative uses for the funds such as support for health, education and infrastructure programmes. However, evaluation of microfinance programmes implicitly assumes that there is no alternative, and
30 Morduch, J. “Does Microfinance Really Help the Poor? New Evidence from the Flagship Programs in Bangladesh”. Princeton University, Department of Economics, Princeton, NJ, 1998. 31 Khandker S, “Microfinance and Poverty: Evidence Using Panel Data from Bangladesh”. Policy Research Working Paper 2945, World Bank Washington DC, 2003. 32 Cull, R., A Demirguc-Kunt, and J Morduch (2007). “Financial Performance and Outreach: A Global Analysis of Leading Microbanks.” Economic Journal 117 (517): F107-F133. 33 Armendariaz and Morduch 2005, “The Economics of Microfinance”, Cambridge, MA: MIT Press.

DEAS – Development Economics Advisory Service 29
compares against a do-nothing scenario. (Ellerman34 described this kind of analysis as a “low hurdle” for microfinance). This may have been a legitimate assumption in the early stages of some microfinance programmes, when there were no alternative financial sector interventions and there were short term constraints on reaching the poor even with health and education programmes. However, as the industry develops, microfinance is facing new cost-benefit type questions: what are the relative merits of micro-credit versus micro-savings in meeting the needs of the poor? Does microfinance help the poor as much as broader financial sector development? And how do government subsidies to credit measure up against support of health, education and infrastructure in benefiting the poor? These questions suggest a broader approach to the analysis of economic opportunity costs.
6 The role of international finance International capital flows to the microfinance industry more than tripled over the period 2004 to 2006 to reach approximately USD 4 billion35. However, these flows remain a relatively small contributor to the sector, in comparison to the intermediation of savings, and access to local financing. Many MFIs operate a business model that leads with savings rather than credit. BRI Unit Desa in Indonesia, for example, is the world’s largest MFI and has ten times as many savers as borrowers. These savings-driven MFIs have no need for external sources of finance. Furthermore, the situation is changing rapidly, and for example, although the Grameen bank in Bangladesh made extensive use of international finance in the past, it now has excess liquidity from deposits. In addition, MFIs that are run on a sustainable basis also have access to finance from local banks and bond issues. International capital flows are largely concentrated in two regions, Latin America and Eastern Europe/Central Asia which account for approximately 75% of the total capital flows to the industry. This source of finance is also focused on a relatively small number of MFIs with some 150 of the top tier institutions receiving the majority of the funds. The origin of capital flows may be divided into three broad categories: Development Finance Institutions provide over half of the total, with large contributions form EBRD, IADB, IFC, and KfW; individual investors include cooperatives, and faith-based organisations, as well as wealthy individuals36; and institutional investors which are made up of banks, insurance companies and pension funds. Investors are making use of sophisticated instruments to spread risks and channel funds to the microfinance institutions. Deal structures include both collateralized debt obligations, such as Blue Orchard’s USD 40 million debt issue in 2004, and securitisation, such as the Bangladesh Rural Advancement Committee USD 95 million issue in 2006. In addition, approximately 80 microfinance investment vehicles have been established and around half of the total international flows pass through these entities. There are already some indications of saturation of the market given that international finance is confined to a relatively small number of top tier MFIs with a specific regional focus. Debt ratios in this relatively small segment have risen rapidly and are reaching maximum prudential levels. As a result there is growing interest in equity instruments. Profit-seeking investors are still a small minority, and most investors are seeking the so-called double-bottom-line of acceptable financial returns combined with social objectives. The institutional investors, for example, typically look to microfinance as a form of socially responsible investment and there is growing pressure for increased transparency about social impact. This is reflected in microfinance ratings which are starting to include analysis of social goals.
7 Summary and Conclusions There is an accumulation of evidence of the beneficial impact of microfinance. Whilst this may not amount to proof due to the inherent difficulty of assessing social and economic impact, it provides some well-grounded support for what many practitioners regard as the self-evident benefits. Microfinance works by offering mechanisms to address market failures at their root. The group lending model, for example, uses local knowledge to select low-risk entrepreneurs, and peer pressure helps repayment. Microfinance also reaches the poor by promoting enterprise, without many of the disadvantages of dependence associated with direct
34 Ellerman, D. “Microfinance: Some conceptual and methodological problems”, in Dichter and Harper eds. What’s Wrong with Microfinance, 2007. 35 CGAP, “Foreign Capital Investment in Microfinance, Balancing Social and Financial Returns”, Focus Note No. 44, Feb. 2008. 36 Not all individual investors are wealthy. Over 120 000 private individuals have put more than USD12 million into microfinance through kiva.org, a web-based platform that puts investors in touch with micro-entrepreneurs through local MFI intermediaries.

DEAS – Development Economics Advisory Service 30
income support. However, it is not a panacea. There are risks that the booming market and the growing interest in the sector will raise false expectations about what can be achieved. The debate has revealed many gaps in our knowledge about the potential of microfinance markets, and its broader interactions with financial sector development, poverty reduction and growth. More evidence is needed to convince the sceptics.
Does this mean that a further round of scaling up is justified? To the extent that expansion is due to the growth of self-sustainable MFIs that are meeting the demands of the market, there is no need for further justification. Some MFIs may be concerned about the risk of mission drift and chose to retain their focus on the poor, but there are many that do no take this view. The issues for government and development institutions are how to regulate and facilitate this growth. Consumer protection, governance and transparency are high on the agenda as the range of products increases and MFIs become larger and more complex organisations. In this context there are likely to be on-going needs for knowledge transfer and capacity building both in the MFIs and the regulatory institutions. Financing would be provided largely by the market with development finance limited to the role of catalysing private capital flows.
However, the scaling up of subsidies for microfinance is more problematic. In the start-up phase, subsidies were provided on a relatively small scale, often by NGOs. The use of subsidies on a larger scale requires particular care, for two reasons. First, while there are significant doubts about impact, it is difficult to make the case that microfinance should take priority over the alternative uses for these limited resources such as healthcare, education and infrastructure. Second, the case for subsidy does not apply equally to all types of microfinance. For some forms of micro-credit subsidies might be justified, where for example it addresses market failures that constrain enterprise development by the poor. However, in other situations, such as lending to larger SMEs, there are risks that indiscriminate use of subsidies would tend to undermine competition and introduce economic distortions. The development of micro-savings and money-transfer systems are alternative candidates for support. Micro-savings, for example, provide a potentially valuable source of finance for MFIs, as well as helping clients address some of the basic risks that cause poverty traps and hold back micro-entrepreneurs. Ultimately the package of products that works best is an empirical question which highlights the importance of monitoring and evaluating these interventions.