Embed Size (px)
Citation preview
4E U R O P E A NC O M M I S S I O N
THEME 4Industry, trade and services
countries
20
01
ED
ITIO
N
Tourism trends inmediterranean
For further information on Tourism Statistics by Eurostat, please refer to the followingpublications:
Tourism in Europe and the Mediterranean countries - Key Figures 1998-1999, 2000, Eurostat(CA-23-00-047-EN-C)Tourism in the Mediterranean countries - Key Figures 1997-1998, 1999 Eurostat (CA-23-99-039-EN-C)Tourism in the Mediterranean countries, Statistics in Focus - Tourism, Theme 4, 04/1999,Eurostat (CA-NP-99-004-EN-C).Tourism in Europe - Trends 1995 - 98, 2000, Eurostat (KS-28-00-591-EN-C)Tourism in Europe - Key figures 1997-1998, 1999, Eurostat (CA/23/99/031/En/C)Inbound tourism flows rising in Europe, Statistics in Focus - Tourism, Theme 4, 05/1999,Eurostat (CA-NP-99-005-EN-C).Community methodology on tourism statistics, 1998, Eurostat – DG XXIII (ISBN 92-828-1921-38).
For general information on statistics produced at Community level, please refer to theEurostat Catalogue (ISBN 92-828-0093-8) and to the internet site:www.europa.eu.int/comm/eurostat
For information on Euro-Mediterranean statistical co-operation, please contact Eurostat:Yves Mahieu, Eurostat C3 "Technical co-operation with non member countries (except Phareand Tacis)", Tel: (352) 4301 33607, Fax: 4301 34359.
For information on statistics and methodology in this publication, please contact Eurostat:Hans Werner Schmidt, Eurostat D1 “Classification, Methodological Co-ordination, Registers,Information Society, Tourism and Steel”, Tel. (352) 4301 34087, Fax (352) 4301 34359
For ordering publications and data extractions, please contact one of our Data shops(addresses at the end of the publication).
For information on Community activity in the field of Tourism, please refer to :
Enhancing Tourism’s Potential for Employment - COM(1999) 205 final of 28.04.1999.Conclusions and recommendations of the High Level Group on Tourism and Employment,European Commission, DG XXIII, October 1998.Community Measures Affecting Tourism (1995-96) - Third Report from the Commission,COM (97) 332 final of 02.07.1997Results from the Eurobarometer survey no 48 regarding the profile of the Europeans onholiday:Facts and figures on the Europeans on holiday, (1997-98), 1998, DG XXIII
For further information on Community activity in the field of Tourism, please contact DGENTERPRISE:Tel. (32) 2 299 50 50, Fax (32) 2 296 13 77Internet site: http://europa.eu.int/comm/dgs/enterprise/index.htm
A great deal of additional information on the European Union is available on the Internet.It can be accessed through the Europa server (http://europa.eu.int).
Cataloguing data can be found at the end of this publication.
Luxembourg: Office for Official Publications of the European Communities, 2001
ISBN 92-894-0066-8
© European Communities, 2001
Printed in Luxembourg
PRINTED ON WHITE CHLORINE-FREE PAPER
FOREWORD
The exchange of comparable information collected at Community level increases the value ofthe information produced at national level due to the importance of international tourism flowsin the Mediterranean region. Moreover, tourism includes a wide range of economic activitiesthat have an influence on - and depend upon - various economic sectors. Compilation ofstatistical information in a global framework is essential for evaluating the impact of tourismand its performance, exploiting all relevant sources, thus providing public authorities and theindustry with valuable information.
Tourism and the need for information on tourism has from the outset of the Euro-Mediterranean co-operation initiative been considered of high interest. The BarcelonaDeclaration on Euro-Mediterranean co-operation adopted in November 1995 makes in itswork programme specific reference to actions on tourism, notably in the field of “information,promotion and training” and to statistics to “promote co-operation on statistics in order toharmonise methods and exchange data”. Moreover, the Council Resolution on Euro-Mediterranean co-operation regarding tourism, explicitly mentions statistical co-operation inthis field.
In response to the Barcelona Declaration statistical co-operation (MEDSTAT) between EUand the Mediterranean countries was launched in 1996. The European Community under theMEDA regulation finances the MEDSTAT programme, which is a programme running up tothe year 2004. This general statistical programme covers a number of priority fields includingtourism, migration, transport, national accounts, external trade, environment and nonobserved economy.
Under the control and guidance of the responsible services of the European Commission,CESD-Madrid, an agency of the Spanish National Statistical Institute (INE), has been giventhe responsibility to guarantee the execution of the tourism statistics project (MED-Tour).
This first panorama publication on Tourism in the Mediterranean countries has beenproduced within the framework of the Euro-Mediterranean co-operation project on tourismstatistics (MED-Tour. This project, whose principal objectives are to improve the exchange ofstatistical information and achieve comparability through convergence in data collectionmethods, comprises a number of actions including the dissemination of existing statisticalinformation. As the project bears its fruits, this publication and other means of disseminationcan provide a reliable and comparable of source of information on tourism between the EUand Mediterranean countries and between the Mediterranean countries themselves.
Thanks to the active involvement of Statistical Institutes and Public Administrationsresponsible for tourism statistics within the Euro-Med region, co-operation with and amongthe participating countries is making significant progress.
Yves Franchet Fabio ColasantiDirector General, Eurostat Director General, DG Enterprise
IV
This report was prepared under the responsibility of CESD-Madrid in co-operation withEurostat (unit D1) within the framework of the MED-Tour project.
The views expressed in the publication are those of the authors and do notnecessarily reflect the opinion of the European Commission.
General Co-ordination and Editorial projectHans Werner Schmidt (Responsible for Tourism Statistics, Eurostat Unit D1)
Publication managementNatalie Kirwan, Gonzalo Arévalo (CESD-Madrid)
Information editor and Technical editingNatalie Kirwan, Adozinda Alves (CESD-Madrid)
Composition and Desk-top publishingAdozinda Alves, Jose Luis Rodriguez (CESD-Madrid)
Translation from French into EnglishMarie-Louise Cep
Acknowledgements
Eurostat, Directorate-General Enterprise, Directorate-General External Relations and CESD-Madridgratefully acknowledge the valuable contributions of following institutions:
National Statistics Office and the Ministry of Tourism and Art and Crafts (Algeria)Statistical Service of Cyprus and the Cyprus Tourism Organisation (Cyprus)Central Agency for Public Mobilisation and Statistics and the Ministry of Tourism (Egypt)Central Bureau of Statistics and the Ministry of Tourism (Israel)Department of Statistics and the Ministry of Tourism (Jordan)Central Administration for Statistics and Ministry of Tourism (Lebanon)Central Office of Statistics (Malta)Department of Statistics and the Ministry of Tourism (Morocco)Central Bureau of Statistics (Palestine)Central Bureau of Statistics and the Ministry of Tourism and Antiquities (Syria)National Statistical Institute and the Ministry of Tourism (Tunisia)State Institute of Statistics and the Ministry of Tourism (Turkey)
And the authors of the country reports:National Statistics Office of Algeria (Mrs Bedria Derkouche)Statistical Service of Cyprus (Mrs Dora Kyriakides)Ministry of Tourism of Egypt (Dr Mohamed Sakr)Central Bureau of Statistics of IsraelMinistry of Tourism and Antiquities of Jordan (Mr Louay Khatib and Mr Haider Qussous)Ministry of Tourism of Lebanon (Mr Antoine Accaoui)Central Office of Statistics of MaltaMinistry of Tourism of Morocco and Etudes démographique économique et statistiques appliqués(EDESA)Central Bureau of Statistics of PalestineCentral Bureau of Statistics of SyriaMinistry of Tourism of Tunisia and TANIT CommunicationsMinistry of Tourism of Turkey
C O N T E N T S
V
TOURISM IN THE EURO-MEDITERRANEAN REGION......……………………...….1
COUNTRY ANALYSIS…………………………………………………………...29
Algeria……………………………………………………………………………………….31
Cyprus………………………………………………………………………………………49
Egypt.………………………………………………………………………………………..65
Israel…………………………………………………………………………………………85
Jordan……………………………………………………………………………………….99
Lebanon…………………………………………………………………………………...111
Malta…………………………….………………………………………………………….127
Morocco...…………………………………………………………………………………147
Palestine.………………………………………………………………………………….167
Syria…………………………………………………...….…………………….………….177
Tunisia……………………………………………………………………….…………….189
Turkey..…………………………………………………………………………………….207
ANNEXES................…………………..……………………………………..227
ABBREVIATIONS……………………………………………………………………….…….229
TECHNICAL NOTES…………………………………………..………………………………231
EXCHANGE RATES………………………………………………………………………......235

VI
Symbols used throughout the publication:
: Ü not available
. . Ü not applicable or not existing
- Ü Value "0" or less than half the unit used

TOURISM IN THE EURO-MEDITERRANEAN REGION
ATOURISM IN THE EURO-MEDITERRANEAN REGION
Tourism Trends in Mediterranean countries 3
Part I: General situation and main indicators
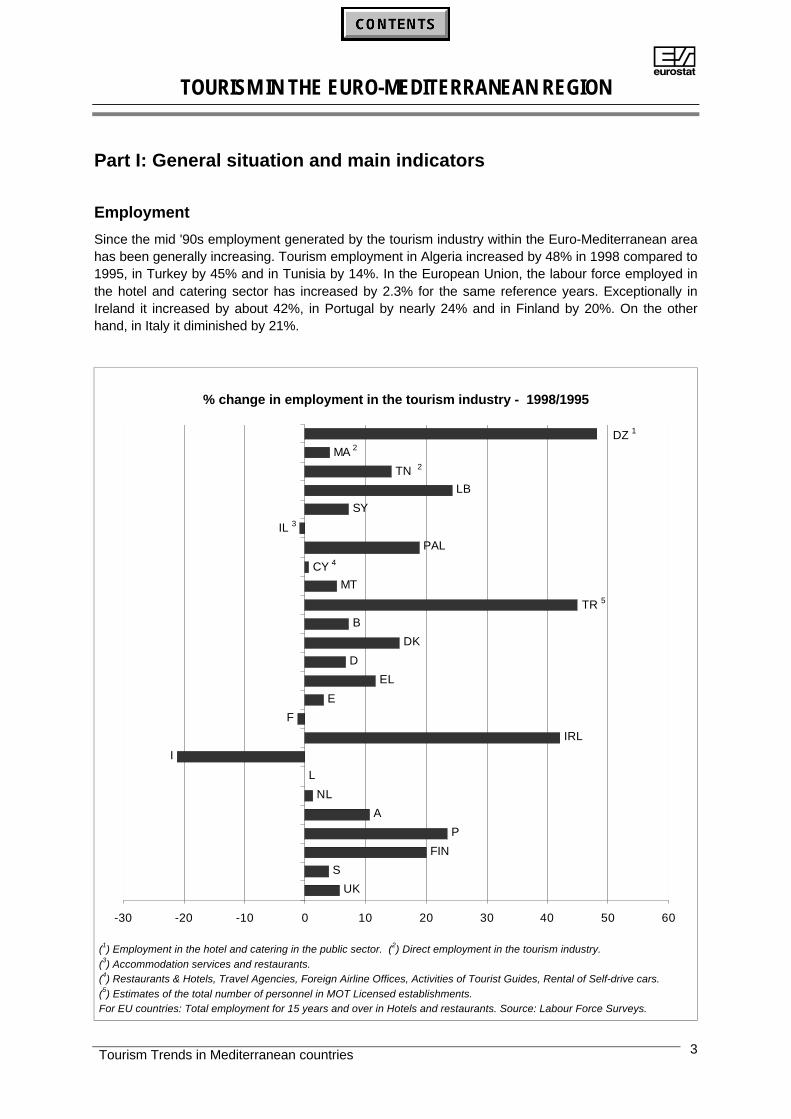
Employment
Since the mid '90s employment generated by the tourism industry within the Euro-Mediterranean areahas been generally increasing. Tourism employment in Algeria increased by 48% in 1998 compared to1995, in Turkey by 45% and in Tunisia by 14%. In the European Union, the labour force employed inthe hotel and catering sector has increased by 2.3% for the same reference years. Exceptionally inIreland it increased by about 42%, in Portugal by nearly 24% and in Finland by 20%. On the otherhand, in Italy it diminished by 21%.
% change in employment in the tourism industry - 1998/1995
LB
SY
B
DK
D
EL
E
F
IRL
I
L
NL
A
P
FIN
S
UK
TR 5
PAL
MA 2
TN 2
DZ 1
IL 3
MT
CY 4
-30 -20 -10 0 10 20 30 40 50 60
(1) Employment in the hotel and catering in the public sector. (2) Direct employment in the tourism industry.(3) Accommodation services and restaurants.(4) Restaurants & Hotels, Travel Agencies, Foreign Airline Offices, Activities of Tourist Guides, Rental of Self-drive cars.(5) Estimates of the total number of personnel in MOT Licensed establishments.For EU countries: Total employment for 15 years and over in Hotels and restaurants. Source: Labour Force Surveys.
ATOURISM IN THE EURO-MEDITERRANEAN REGION
Tourism Trends in Mediterranean countries4
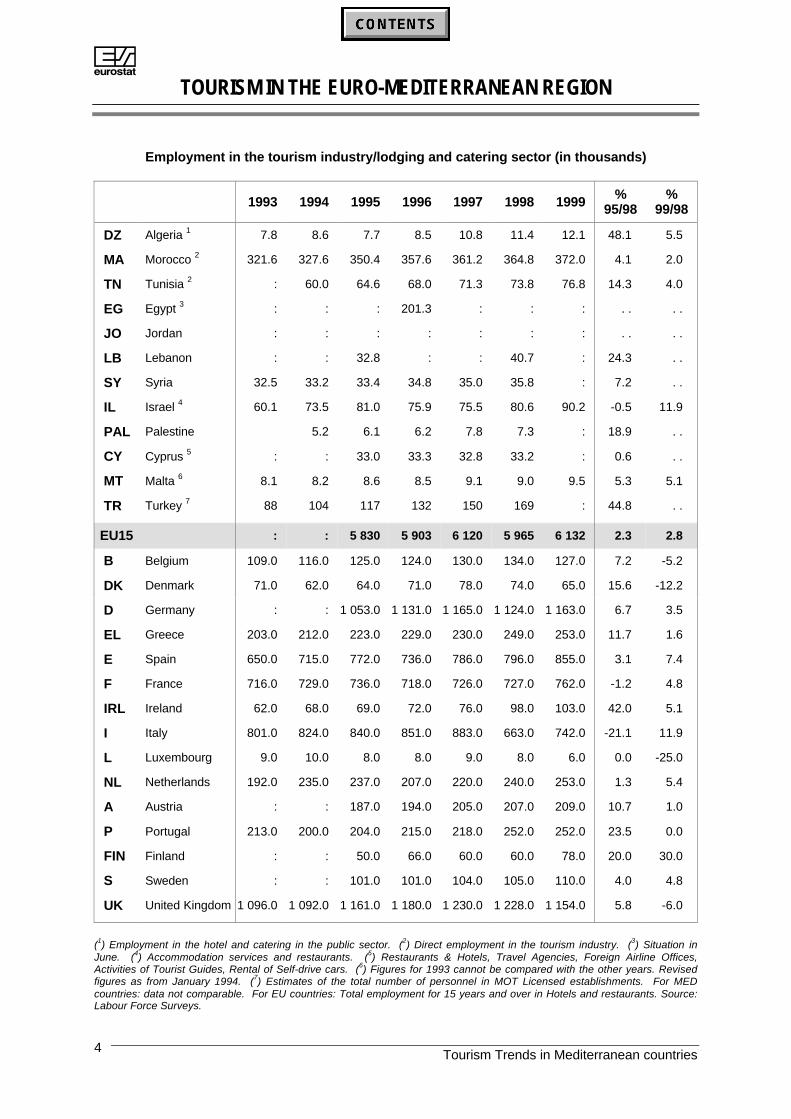
Employment in the tourism industry/lodging and catering sector (in thousands)
1993 1994 1995 1996 1997 1998 1999 %95/98
%99/98
DZ Algeria 1 7.8 8.6 7.7 8.5 10.8 11.4 12.1 48.1 5.5
MA Morocco 2 321.6 327.6 350.4 357.6 361.2 364.8 372.0 4.1 2.0
TN Tunisia 2 : 60.0 64.6 68.0 71.3 73.8 76.8 14.3 4.0
EG Egypt 3 : : : 201.3 : : : . . . .
JO Jordan : : : : : : : . . . .
LB Lebanon : : 32.8 : : 40.7 : 24.3 . .
SY Syria 32.5 33.2 33.4 34.8 35.0 35.8 : 7.2 . .
IL Israel 4 60.1 73.5 81.0 75.9 75.5 80.6 90.2 -0.5 11.9
PAL Palestine 5.2 6.1 6.2 7.8 7.3 : 18.9 . .
CY Cyprus 5 : : 33.0 33.3 32.8 33.2 : 0.6 . .
MT Malta 6 8.1 8.2 8.6 8.5 9.1 9.0 9.5 5.3 5.1
TR Turkey 7 88 104 117 132 150 169 : 44.8 . .
EU15 : : 5 830 5 903 6 120 5 965 6 132 2.3 2.8
B Belgium 109.0 116.0 125.0 124.0 130.0 134.0 127.0 7.2 -5.2
DK Denmark 71.0 62.0 64.0 71.0 78.0 74.0 65.0 15.6 -12.2
D Germany : : 1 053.0 1 131.0 1 165.0 1 124.0 1 163.0 6.7 3.5
EL Greece 203.0 212.0 223.0 229.0 230.0 249.0 253.0 11.7 1.6
E Spain 650.0 715.0 772.0 736.0 786.0 796.0 855.0 3.1 7.4
F France 716.0 729.0 736.0 718.0 726.0 727.0 762.0 -1.2 4.8
IRL Ireland 62.0 68.0 69.0 72.0 76.0 98.0 103.0 42.0 5.1
I Italy 801.0 824.0 840.0 851.0 883.0 663.0 742.0 -21.1 11.9
L Luxembourg 9.0 10.0 8.0 8.0 9.0 8.0 6.0 0.0 -25.0
NL Netherlands 192.0 235.0 237.0 207.0 220.0 240.0 253.0 1.3 5.4
A Austria : : 187.0 194.0 205.0 207.0 209.0 10.7 1.0
P Portugal 213.0 200.0 204.0 215.0 218.0 252.0 252.0 23.5 0.0
FIN Finland : : 50.0 66.0 60.0 60.0 78.0 20.0 30.0
S Sweden : : 101.0 101.0 104.0 105.0 110.0 4.0 4.8
UK United Kingdom 1 096.0 1 092.0 1 161.0 1 180.0 1 230.0 1 228.0 1 154.0 5.8 -6.0
(1) Employment in the hotel and catering in the public sector. (2) Direct employment in the tourism industry. (3) Situation inJune. (4) Accommodation services and restaurants. (5) Restaurants & Hotels, Travel Agencies, Foreign Airline Offices,Activities of Tourist Guides, Rental of Self-drive cars. (6) Figures for 1993 cannot be compared with the other years. Revisedfigures as from January 1994. (7) Estimates of the total number of personnel in MOT Licensed establishments. For MEDcountries: data not comparable. For EU countries: Total employment for 15 years and over in Hotels and restaurants. Source:Labour Force Surveys.
ATOURISM IN THE EURO-MEDITERRANEAN REGION
Tourism Trends in Mediterranean countries 5
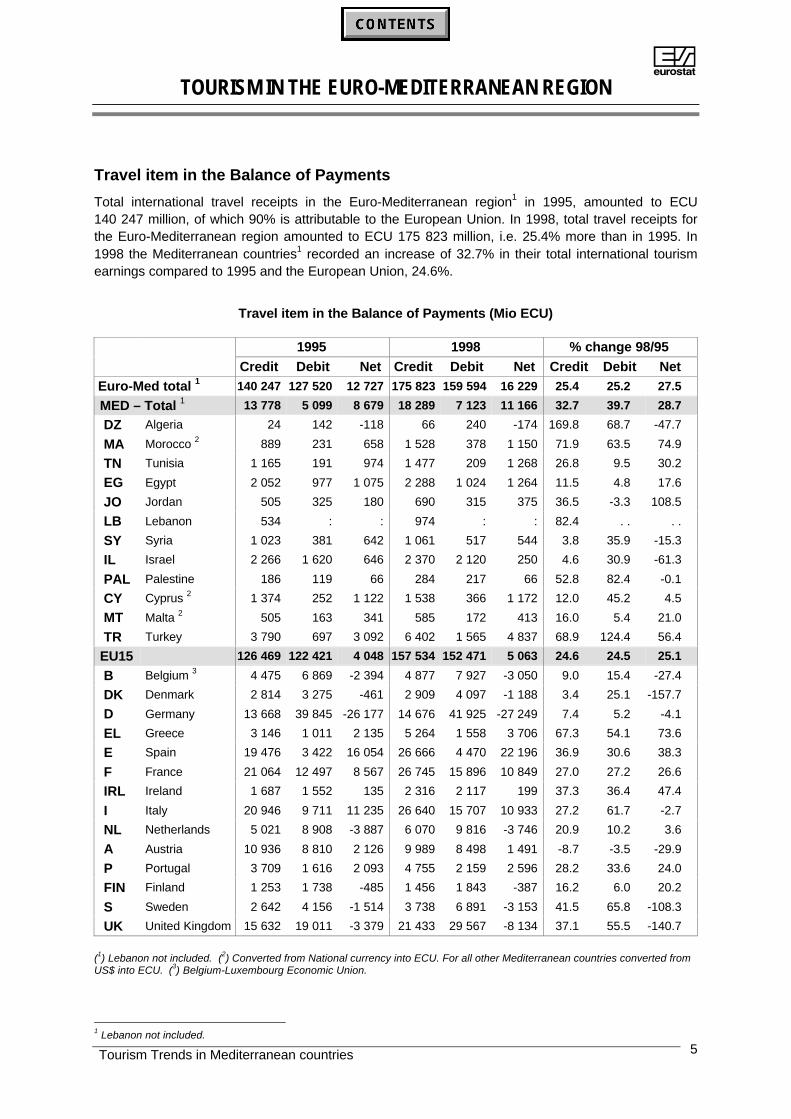
Travel item in the Balance of Payments
Total international travel receipts in the Euro-Mediterranean region1 in 1995, amounted to ECU140 247 million, of which 90% is attributable to the European Union. In 1998, total travel receipts forthe Euro-Mediterranean region amounted to ECU 175 823 million, i.e. 25.4% more than in 1995. In1998 the Mediterranean countries1 recorded an increase of 32.7% in their total international tourismearnings compared to 1995 and the European Union, 24.6%.
Travel item in the Balance of Payments (Mio ECU)
1995 1998 % change 98/95Credit Debit Net Credit Debit Net Credit Debit Net
Euro-Med total 1 140 247 127 520 12 727 175 823 159 594 16 229 25.4 25.2 27.5
MED – Total 1 13 778 5 099 8 679 18 289 7 123 11 166 32.7 39.7 28.7
DZ Algeria 24 142 -118 66 240 -174 169.8 68.7 -47.7
MA Morocco 2 889 231 658 1 528 378 1 150 71.9 63.5 74.9
TN Tunisia 1 165 191 974 1 477 209 1 268 26.8 9.5 30.2
EG Egypt 2 052 977 1 075 2 288 1 024 1 264 11.5 4.8 17.6
JO Jordan 505 325 180 690 315 375 36.5 -3.3 108.5
LB Lebanon 534 : : 974 : : 82.4 . . . .
SY Syria 1 023 381 642 1 061 517 544 3.8 35.9 -15.3
IL Israel 2 266 1 620 646 2 370 2 120 250 4.6 30.9 -61.3
PAL Palestine 186 119 66 284 217 66 52.8 82.4 -0.1
CY Cyprus 2 1 374 252 1 122 1 538 366 1 172 12.0 45.2 4.5
MT Malta 2 505 163 341 585 172 413 16.0 5.4 21.0
TR Turkey 3 790 697 3 092 6 402 1 565 4 837 68.9 124.4 56.4
EU15 126 469 122 421 4 048 157 534 152 471 5 063 24.6 24.5 25.1
B Belgium 3 4 475 6 869 -2 394 4 877 7 927 -3 050 9.0 15.4 -27.4
DK Denmark 2 814 3 275 -461 2 909 4 097 -1 188 3.4 25.1 -157.7
D Germany 13 668 39 845 -26 177 14 676 41 925 -27 249 7.4 5.2 -4.1
EL Greece 3 146 1 011 2 135 5 264 1 558 3 706 67.3 54.1 73.6
E Spain 19 476 3 422 16 054 26 666 4 470 22 196 36.9 30.6 38.3
F France 21 064 12 497 8 567 26 745 15 896 10 849 27.0 27.2 26.6
IRL Ireland 1 687 1 552 135 2 316 2 117 199 37.3 36.4 47.4
I Italy 20 946 9 711 11 235 26 640 15 707 10 933 27.2 61.7 -2.7
NL Netherlands 5 021 8 908 -3 887 6 070 9 816 -3 746 20.9 10.2 3.6
A Austria 10 936 8 810 2 126 9 989 8 498 1 491 -8.7 -3.5 -29.9
P Portugal 3 709 1 616 2 093 4 755 2 159 2 596 28.2 33.6 24.0
FIN Finland 1 253 1 738 -485 1 456 1 843 -387 16.2 6.0 20.2
S Sweden 2 642 4 156 -1 514 3 738 6 891 -3 153 41.5 65.8 -108.3
UK United Kingdom 15 632 19 011 -3 379 21 433 29 567 -8 134 37.1 55.5 -140.7
(1) Lebanon not included. (2) Converted from National currency into ECU. For all other Mediterranean countries converted fromUS$ into ECU. (3) Belgium-Luxembourg Economic Union.
1 Lebanon not included.

ATOURISM IN THE EURO-MEDITERRANEAN REGION
Tourism Trends in Mediterranean countries6
The EU countries that recorded the highest increases in travel receipts in 1998 compared to 1995were Greece (67.3%), Sweden (41.5%), Ireland (37.3%), Spain (36.9%), Portugal (28.2%), followedby Italy, France and The Netherlands. However, Austria recorded in this same period a decrease of8.7% in its income from inbound tourism. All the Mediterranean countries recorded an increase inreceipts from international tourism in 1998 compared to 1995. Noteworthy are: Algeria, with anincrease of 169.8%, Morocco (71.9%), Turkey (68.9%), Palestine (52.8%), Jordan (36.5%) andTunisia (26.8%), followed by Malta, Cyprus, Egypt, Israel and Syria.
Of the EU countries France, Spain and Italy are the top ranking international tourism export earners,with ECU 26 745 million, ECU 26 666 million and ECU 26 640 million respectively in 1998. Of theMediterranean countries Turkey is the largest international tourism export earner, with ECU 6 402million, followed by Israel with ECU 2 370 million and Egypt with 2 288 million in 1998.
The graph below illustrates the relationship between physical flows of inbound tourism (arrivals ofvisitors from abroad to the Mediterranean countries) and the foreign trade earnings generated byinbound tourism.
Arrivals of visitors at borders (in thousands) and Travel Receipts (Mio ECU) in theMediterranean Countries – 1998
TR MT 4CY 4 IL SY 3LB 2 JO 1 EGTN MA DZ
0
2 000
4 000
6 000
8 000
10 000
12 000
Visitors
0
1 000
2 000
3 000
4 000
5 000
6 000
7 000
Receipts
Arrivals of visitors Travel Receipts
(1) Excluding Jordanians. (2) Lebanese and Syrians excluded. (3) Excluding Syrians. (4) Arrivals of tourists from abroad.
ATOURISM IN THE EURO-MEDITERRANEAN REGION
Tourism Trends in Mediterranean countries 7
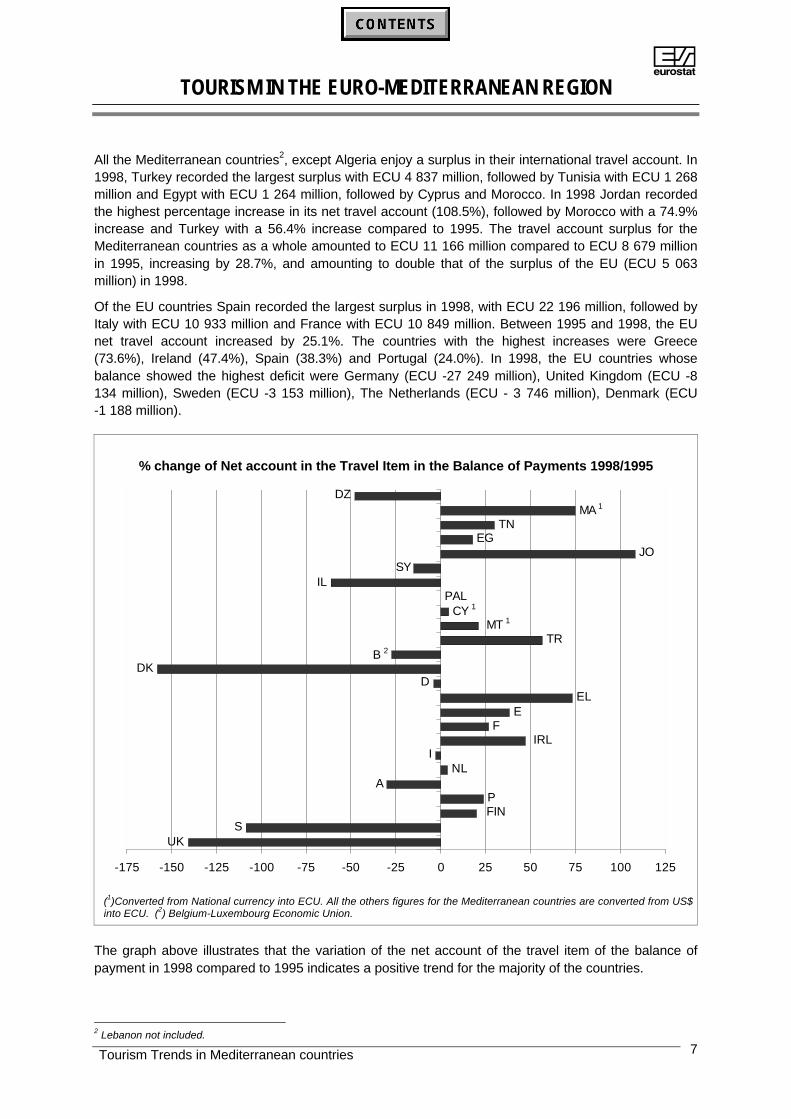
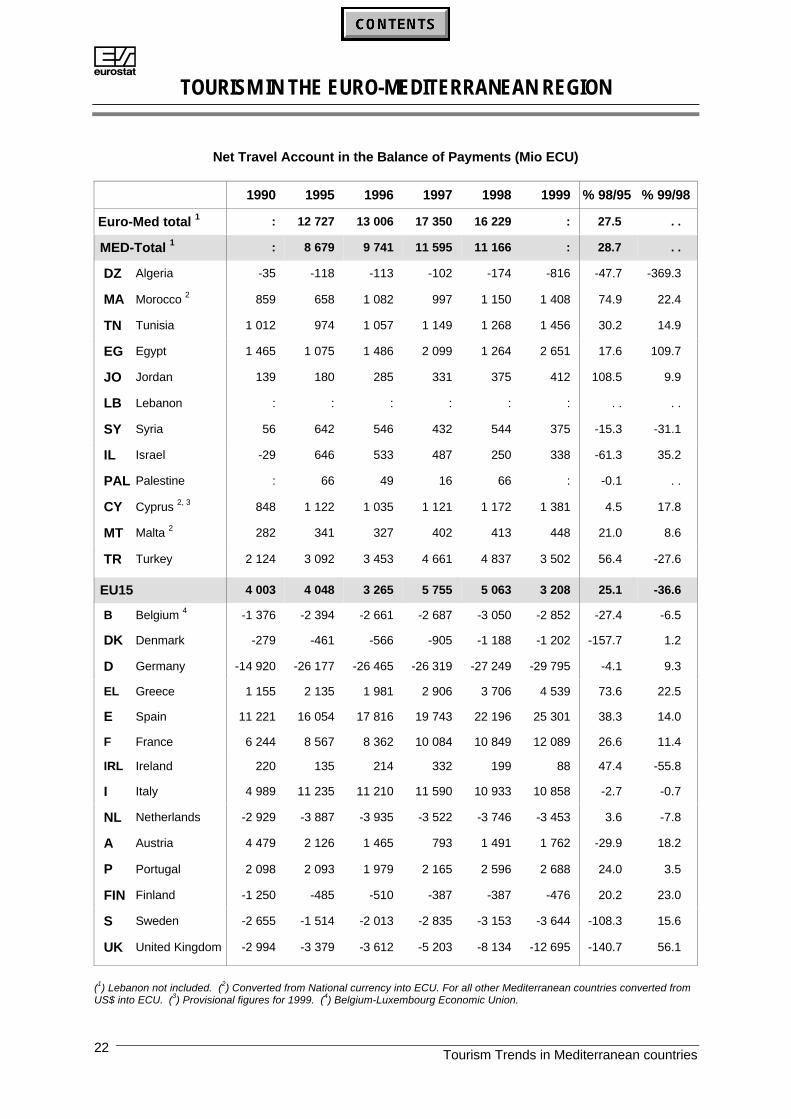
All the Mediterranean countries2, except Algeria enjoy a surplus in their international travel account. In1998, Turkey recorded the largest surplus with ECU 4 837 million, followed by Tunisia with ECU 1 268million and Egypt with ECU 1 264 million, followed by Cyprus and Morocco. In 1998 Jordan recordedthe highest percentage increase in its net travel account (108.5%), followed by Morocco with a 74.9%increase and Turkey with a 56.4% increase compared to 1995. The travel account surplus for theMediterranean countries as a whole amounted to ECU 11 166 million compared to ECU 8 679 millionin 1995, increasing by 28.7%, and amounting to double that of the surplus of the EU (ECU 5 063million) in 1998.
Of the EU countries Spain recorded the largest surplus in 1998, with ECU 22 196 million, followed byItaly with ECU 10 933 million and France with ECU 10 849 million. Between 1995 and 1998, the EUnet travel account increased by 25.1%. The countries with the highest increases were Greece(73.6%), Ireland (47.4%), Spain (38.3%) and Portugal (24.0%). In 1998, the EU countries whosebalance showed the highest deficit were Germany (ECU -27 249 million), United Kingdom (ECU -8134 million), Sweden (ECU -3 153 million), The Netherlands (ECU - 3 746 million), Denmark (ECU-1 188 million).
% change of Net account in the Travel Item in the Balance of Payments 1998/1995
DZ
TNEG
JO
PAL
TR
DKD
ELE
F
INL
AP
SUK
MA 1
IL
MT 1
B 2
CY 1
SY
IRL
FIN
-175 -150 -125 -100 -75 -50 -25 0 25 50 75 100 125
(1)Converted from National currency into ECU. All the others figures for the Mediterranean countries are converted from US$into ECU. (2) Belgium-Luxembourg Economic Union.
The graph above illustrates that the variation of the net account of the travel item of the balance ofpayment in 1998 compared to 1995 indicates a positive trend for the majority of the countries.
2 Lebanon not included.
ATOURISM IN THE EURO-MEDITERRANEAN REGION
Tourism Trends in Mediterranean countries8
Part II: Tourism Supply
Infrastructure and Accommodation Capacity
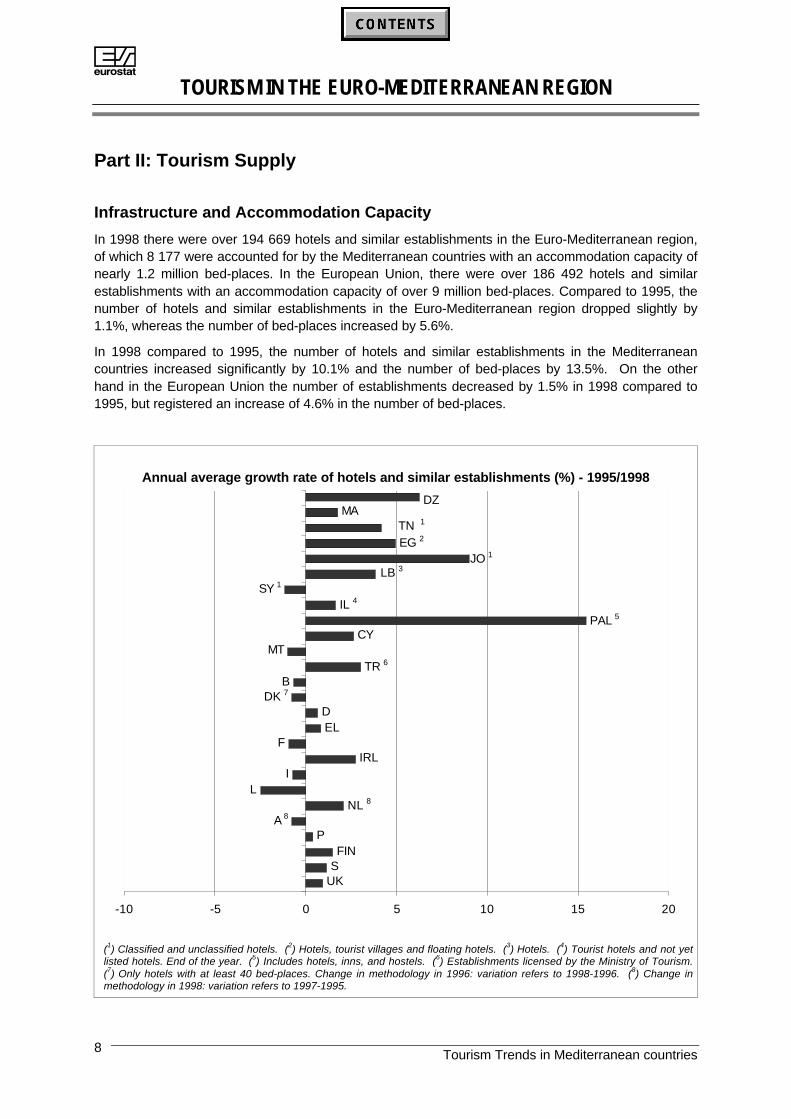
In 1998 there were over 194 669 hotels and similar establishments in the Euro-Mediterranean region,of which 8 177 were accounted for by the Mediterranean countries with an accommodation capacity ofnearly 1.2 million bed-places. In the European Union, there were over 186 492 hotels and similarestablishments with an accommodation capacity of over 9 million bed-places. Compared to 1995, thenumber of hotels and similar establishments in the Euro-Mediterranean region dropped slightly by1.1%, whereas the number of bed-places increased by 5.6%.
In 1998 compared to 1995, the number of hotels and similar establishments in the Mediterraneancountries increased significantly by 10.1% and the number of bed-places by 13.5%. On the otherhand in the European Union the number of establishments decreased by 1.5% in 1998 compared to1995, but registered an increase of 4.6% in the number of bed-places.
Annual average growth rate of hotels and similar establishments (%) - 1995/1998
DZ
B
DEL
FIRL
I L
PFIN
S
CY
SY 1
MATN 1
EG 2
JO 1
LB 3
IL 4
PAL 5
MT TR 6
DK 7
A 8NL 8
UK
-10 -5 0 5 10 15 20
(1) Classified and unclassified hotels. (2) Hotels, tourist villages and floating hotels. (3) Hotels. (4) Tourist hotels and not yetlisted hotels. End of the year. (5) Includes hotels, inns, and hostels. (6) Establishments licensed by the Ministry of Tourism.(7) Only hotels with at least 40 bed-places. Change in methodology in 1996: variation refers to 1998-1996. (8) Change inmethodology in 1998: variation refers to 1997-1995.

ATOURISM IN THE EURO-MEDITERRANEAN REGION
Tourism Trends in Mediterranean countries 9
Number of hotels and similar establishments and bed-places – 1995/1998
Establishments Bed-places (in thousands)
1995 1998
Annualaverage
growth rate95-98 (%)
1995 1998
Annualaverage
growth rate95-98 (%)
Euro-Med total 1 196 818 194 669 -0.3 9 631 10 168 2.5
MED – Total 7 429 8 177 3.2 1 018 1 155 4.3
DZ Algeria 653 781 6.3 62 71 4.6
MA Morocco 1 553 1 635 1.7 123 125 0.4
TN Tunisia 2 612 692 4.2 161 185 4.6
EG Egypt 3 752 869 4.9 129 167 9.0
JO Jordan 2, 4 294 380 9.0 21 27 9.5
LB Lebanon 5 191 214 3.9 15 19 7.6
SY Syria 2 454 438 -1.2 31 32 0.1
IL Israel 6 298 313 1.7 75 90 6.3
PAL Palestine 7 60 92 15.4 6 8 9.8
CY Cyprus 537 580 2.7 77 85 3.4
MT Malta 256 248 -1.0 37 39 1.4
TR Turkey 8 1 769 1 935 3.0 280 309 3.3
EU15 1 189 389 186 492 -0.5 8 613 9 013 1.5
B Belgium 2 038 1 998 -0.6 115 116 0.4
DK Denmark 9 564 467 -0.8 99 60 -0.2
D Germany 38 172 38 914 0.6 1 447 1 547 2.3
EL Greece 7 754 7 946 0.8 557 585 1.6
E Spain 10 10 422 7 539 . . 1 032 979 . .
F France 20 147 19 555 -0.9 1 193 1 451 7.3
IRL Ireland 5 039 5 460 2.8 97 117 6.6
I Italy 34 296 33 548 -0.7 1 740 1 782 0.8
L Luxembourg 369 342 -2.5 15 15 -0.1
NL Netherlands 11 1 749 2 788 2.1 143 169 3.6
A Austria 11 18 120 15 780 -0.8 646 585 -0.6
P Portugal 1 733 1 754 0.4 204 216 1.8
FIN Finland 936 978 1.5 103 110 2.3
S Sweden 1 829 1 891 1.1 174 185 2.0
UK United Kingdom 46 221 47 532 0.9 1 050 1 096 1.5
(1) Variations exclude Spain. (2) Classified and unclassified hotels. (3) Hotels, tourist villages and floating hotels. (4) Revisedtime series. (5) Only hotels. (6) Tourist hotels and not yet listed hotels. End of the year. (7) Includes hotels, inns, and hostels.(8) Number of establishments licensed by the Ministry of Tourism. (9) Only hotels with at least 40 bed-places. Change inMethodology in 1996: variation refers to 1998-1996. (10) Change in methodology in 1997. Data are not comparable.(11) Change in methodology in 1998: variation refers to 1997-1995.
ATOURISM IN THE EURO-MEDITERRANEAN REGION
Tourism Trends in Mediterranean countries10
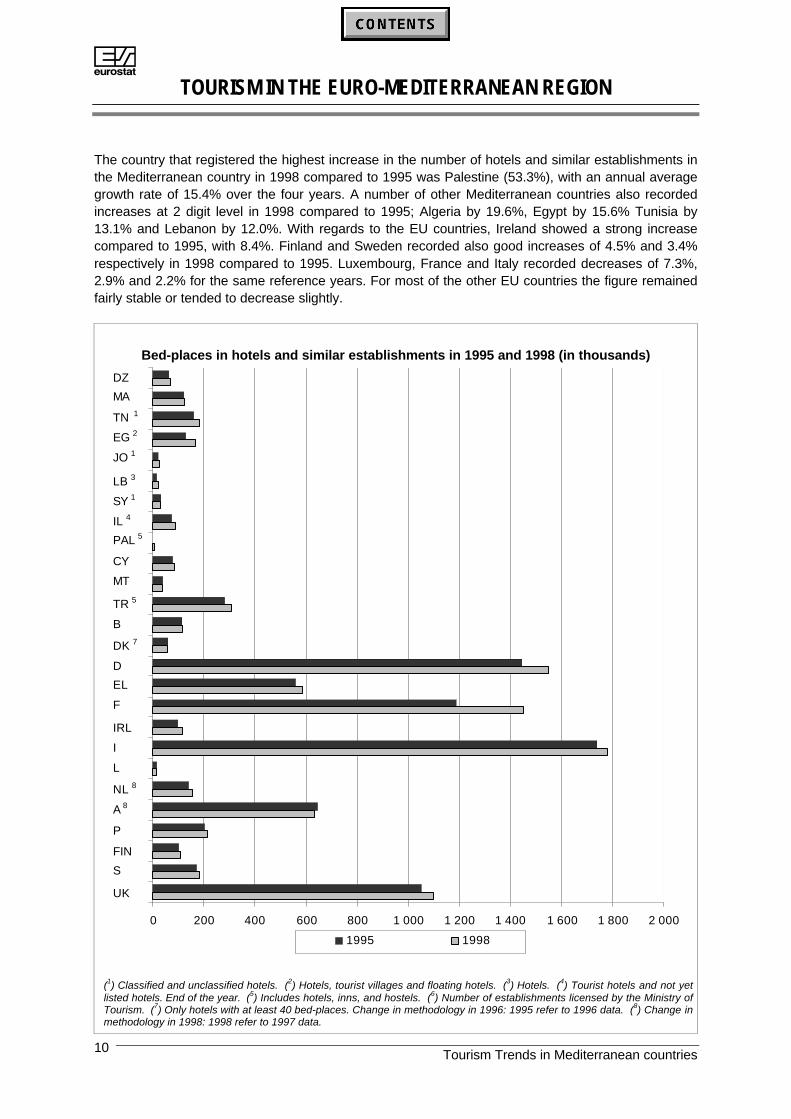
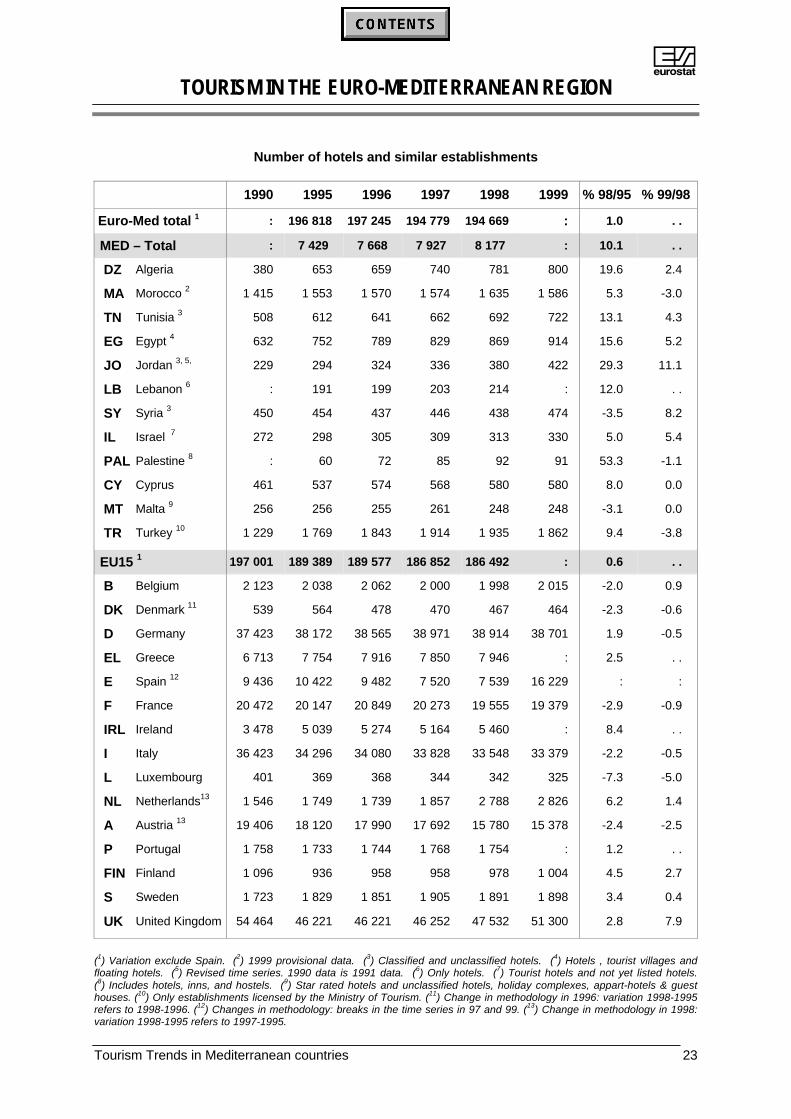
The country that registered the highest increase in the number of hotels and similar establishments inthe Mediterranean country in 1998 compared to 1995 was Palestine (53.3%), with an annual averagegrowth rate of 15.4% over the four years. A number of other Mediterranean countries also recordedincreases at 2 digit level in 1998 compared to 1995; Algeria by 19.6%, Egypt by 15.6% Tunisia by13.1% and Lebanon by 12.0%. With regards to the EU countries, Ireland showed a strong increasecompared to 1995, with 8.4%. Finland and Sweden recorded also good increases of 4.5% and 3.4%respectively in 1998 compared to 1995. Luxembourg, France and Italy recorded decreases of 7.3%,2.9% and 2.2% for the same reference years. For most of the other EU countries the figure remainedfairly stable or tended to decrease slightly.
Bed-places in hotels and similar establishments in 1995 and 1998 (in thousands)
DZ
TR 5
MA
TN 1
EG 2
JO 1
LB 3
SY 1
IL 4
PAL 5
CY
MT
B
DK 7
D
EL
F
IRL
I
L
A 8NL 8
P
FIN
S
UK
0 200 400 600 800 1 000 1 200 1 400 1 600 1 800 2 000
1995 1998
(1) Classified and unclassified hotels. (2) Hotels, tourist villages and floating hotels. (3) Hotels. (4) Tourist hotels and not yetlisted hotels. End of the year. (5) Includes hotels, inns, and hostels. (6) Number of establishments licensed by the Ministry ofTourism. (7) Only hotels with at least 40 bed-places. Change in methodology in 1996: 1995 refer to 1996 data. (8) Change inmethodology in 1998: 1998 refer to 1997 data.
ATOURISM IN THE EURO-MEDITERRANEAN REGION
Tourism Trends in Mediterranean countries 11
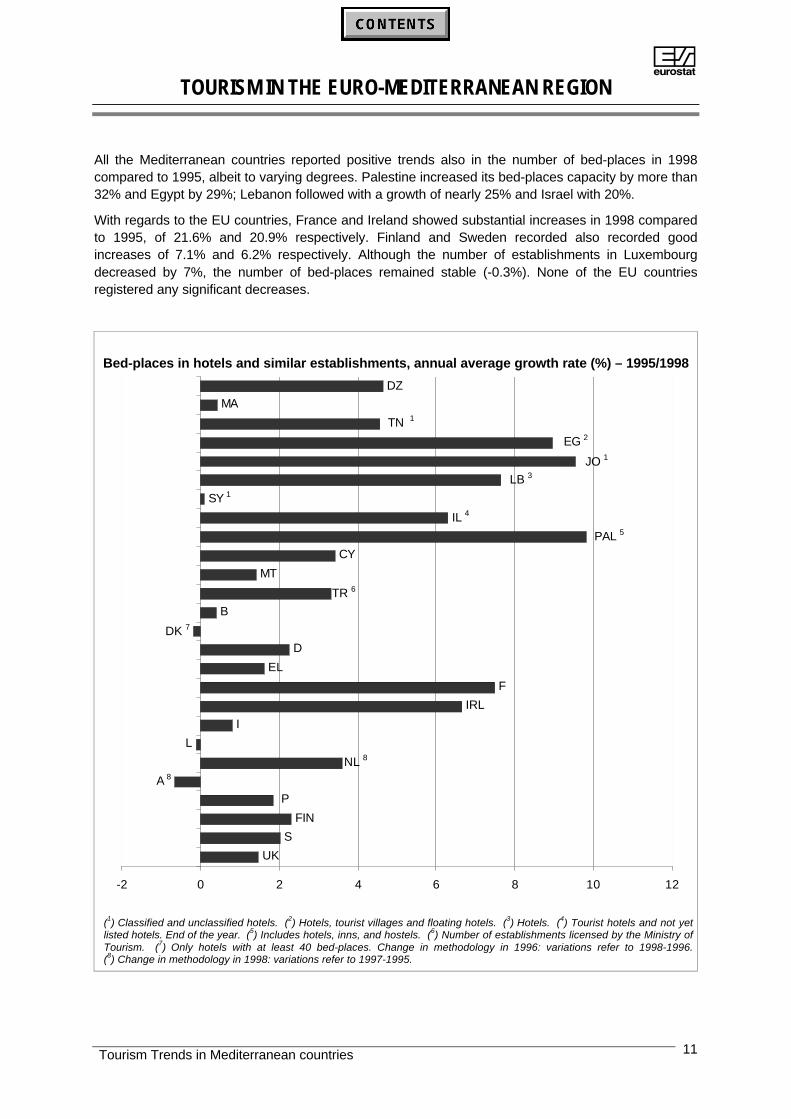
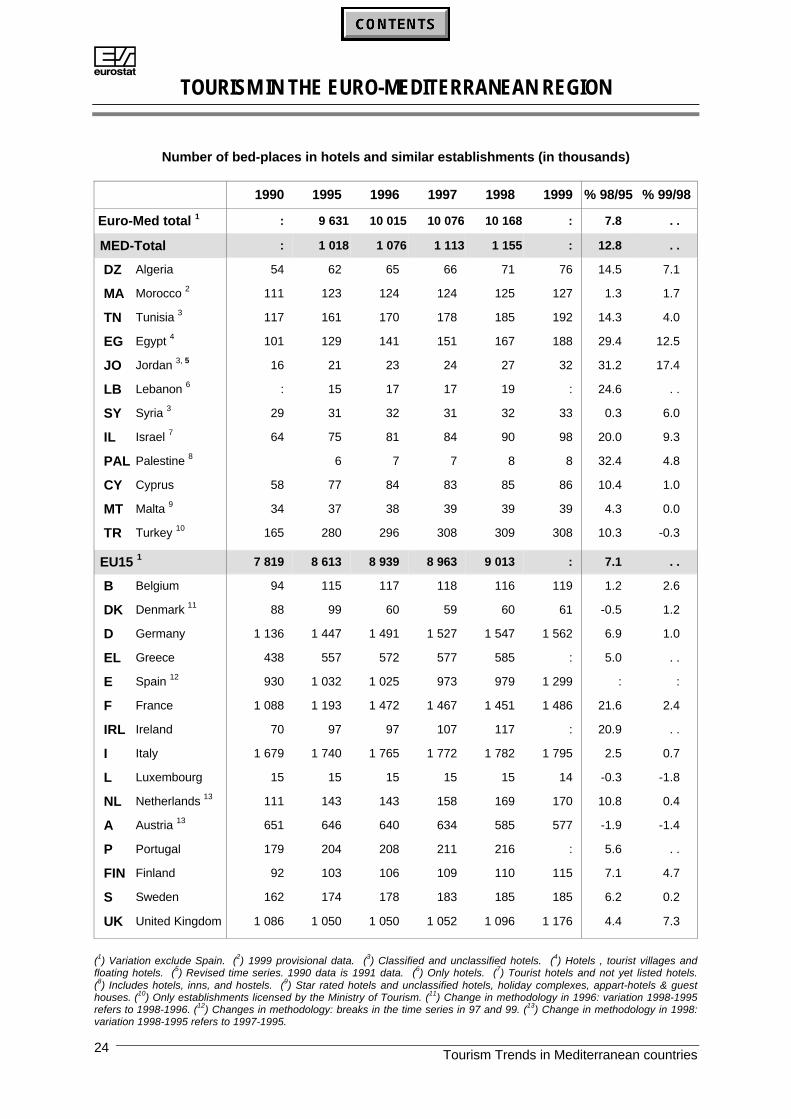
All the Mediterranean countries reported positive trends also in the number of bed-places in 1998compared to 1995, albeit to varying degrees. Palestine increased its bed-places capacity by more than32% and Egypt by 29%; Lebanon followed with a growth of nearly 25% and Israel with 20%.
With regards to the EU countries, France and Ireland showed substantial increases in 1998 comparedto 1995, of 21.6% and 20.9% respectively. Finland and Sweden recorded also recorded goodincreases of 7.1% and 6.2% respectively. Although the number of establishments in Luxembourgdecreased by 7%, the number of bed-places remained stable (-0.3%). None of the EU countriesregistered any significant decreases.
Bed-places in hotels and similar establishments, annual average growth rate (%) – 1995/1998
DZ
B
D
EL
F
IRL
I
L
FIN
S
UK
P
A 8NL 8
DK 7
TR 6MT
PAL 5IL 4
LB 3
JO 1
EG 2TN 1
MA
SY 1
CY
-2 0 2 4 6 8 10 12
(1) Classified and unclassified hotels. (2) Hotels, tourist villages and floating hotels. (3) Hotels. (4) Tourist hotels and not yetlisted hotels. End of the year. (5) Includes hotels, inns, and hostels. (6) Number of establishments licensed by the Ministry ofTourism. (7) Only hotels with at least 40 bed-places. Change in methodology in 1996: variations refer to 1998-1996.(8) Change in methodology in 1998: variations refer to 1997-1995.
ATOURISM IN THE EURO-MEDITERRANEAN REGION
Tourism Trends in Mediterranean countries12
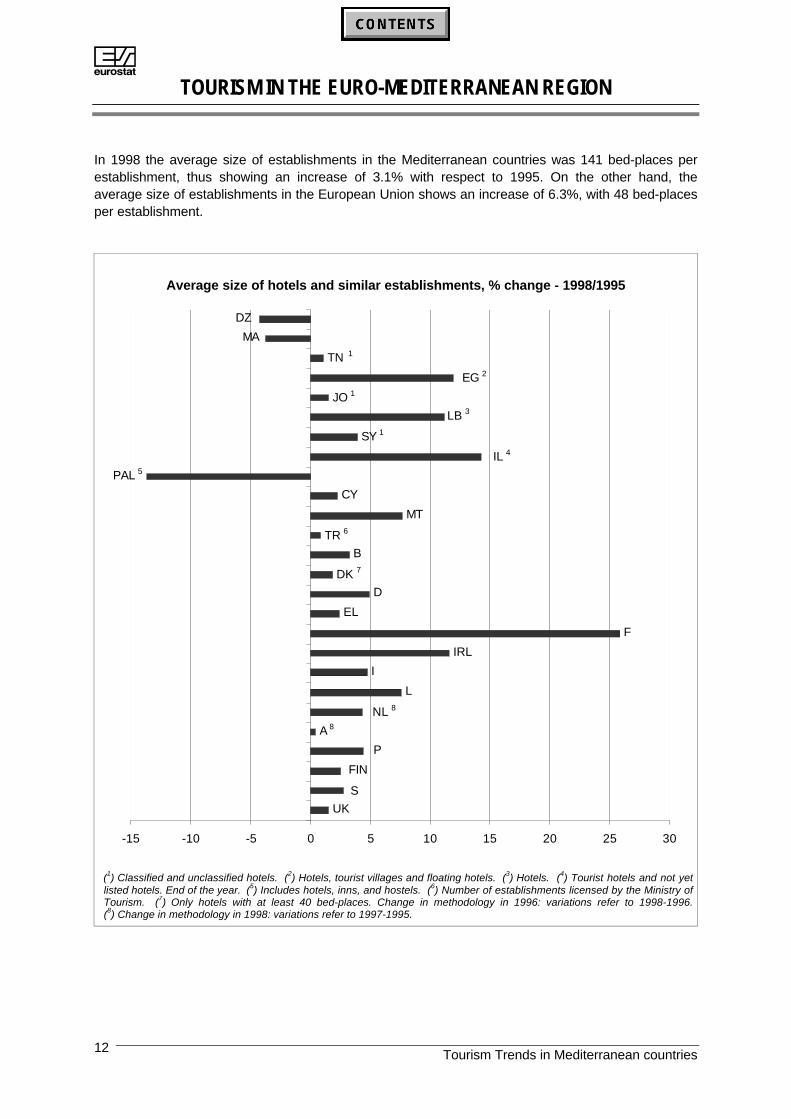
In 1998 the average size of establishments in the Mediterranean countries was 141 bed-places perestablishment, thus showing an increase of 3.1% with respect to 1995. On the other hand, theaverage size of establishments in the European Union shows an increase of 6.3%, with 48 bed-placesper establishment.
Average size of hotels and similar establishments, % change - 1998/1995
B
D
EL
F
IRL
I
L
UK
P
S
FIN
CY
SY 1
MA
TN 1
EG 2
JO 1
LB 3
IL 4
PAL 5
MT
TR 6
DZ
DK 7
NL 8
A 8
-15 -10 -5 0 5 10 15 20 25 30
(1) Classified and unclassified hotels. (2) Hotels, tourist villages and floating hotels. (3) Hotels. (4) Tourist hotels and not yetlisted hotels. End of the year. (5) Includes hotels, inns, and hostels. (6) Number of establishments licensed by the Ministry ofTourism. (7) Only hotels with at least 40 bed-places. Change in methodology in 1996: variations refer to 1998-1996.(8) Change in methodology in 1998: variations refer to 1997-1995.
ATOURISM IN THE EURO-MEDITERRANEAN REGION
Tourism Trends in Mediterranean countries 13
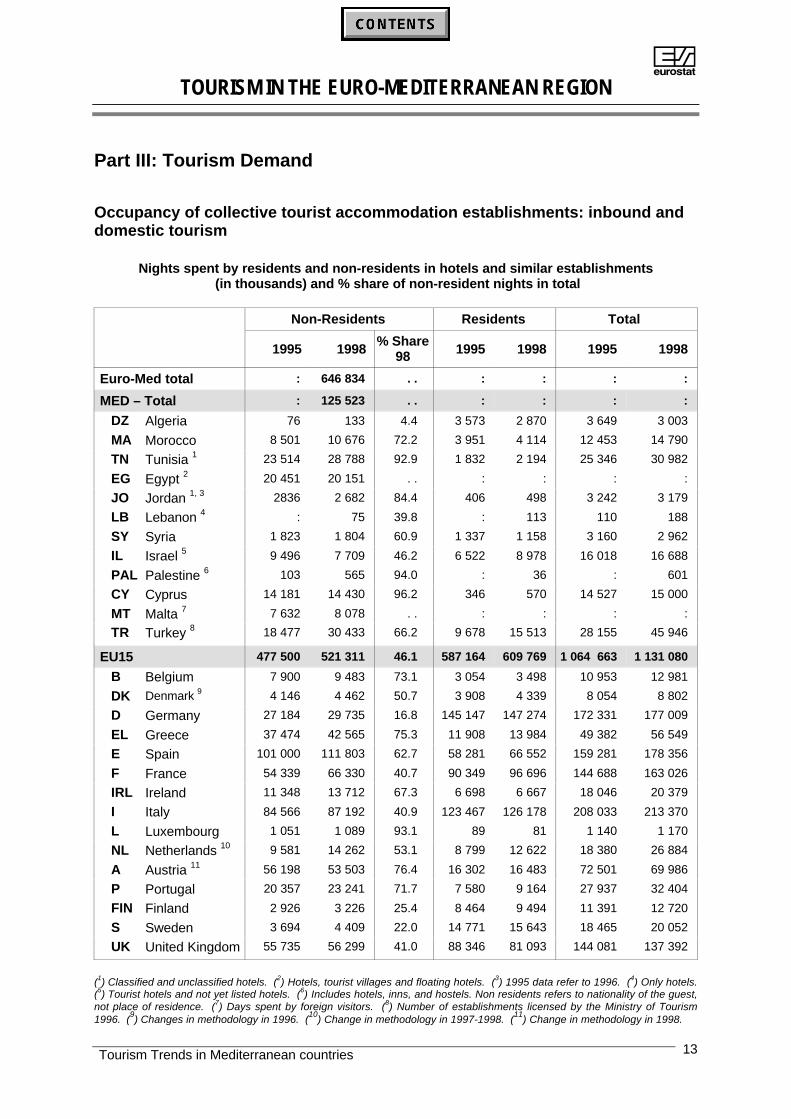
Part III: Tourism Demand
Occupancy of collective tourist accommodation establishments: inbound anddomestic tourism
Nights spent by residents and non-residents in hotels and similar establishments (in thousands) and % share of non-resident nights in total
Non-Residents Residents Total
1995 1998% Share
98 1995 1998 1995 1998
Euro-Med total : 646 834 . . : : : :
MED – Total : 125 523 . . : : : :
DZ Algeria 76 133 4.4 3 573 2 870 3 649 3 003
MA Morocco 8 501 10 676 72.2 3 951 4 114 12 453 14 790
TN Tunisia 1 23 514 28 788 92.9 1 832 2 194 25 346 30 982
EG Egypt 2 20 451 20 151 . . : : : :
JO Jordan 1, 3 2836 2 682 84.4 406 498 3 242 3 179
LB Lebanon 4 : 75 39.8 : 113 110 188
SY Syria 1 823 1 804 60.9 1 337 1 158 3 160 2 962
IL Israel 5 9 496 7 709 46.2 6 522 8 978 16 018 16 688
PAL Palestine 6 103 565 94.0 : 36 : 601
CY Cyprus 14 181 14 430 96.2 346 570 14 527 15 000
MT Malta 7 7 632 8 078 . . : : : :
TR Turkey 8 18 477 30 433 66.2 9 678 15 513 28 155 45 946
EU15 477 500 521 311 46.1 587 164 609 769 1 064 663 1 131 080
B Belgium 7 900 9 483 73.1 3 054 3 498 10 953 12 981
DK Denmark 9 4 146 4 462 50.7 3 908 4 339 8 054 8 802
D Germany 27 184 29 735 16.8 145 147 147 274 172 331 177 009
EL Greece 37 474 42 565 75.3 11 908 13 984 49 382 56 549
E Spain 101 000 111 803 62.7 58 281 66 552 159 281 178 356
F France 54 339 66 330 40.7 90 349 96 696 144 688 163 026
IRL Ireland 11 348 13 712 67.3 6 698 6 667 18 046 20 379
I Italy 84 566 87 192 40.9 123 467 126 178 208 033 213 370
L Luxembourg 1 051 1 089 93.1 89 81 1 140 1 170
NL Netherlands 10 9 581 14 262 53.1 8 799 12 622 18 380 26 884
A Austria 11 56 198 53 503 76.4 16 302 16 483 72 501 69 986
P Portugal 20 357 23 241 71.7 7 580 9 164 27 937 32 404
FIN Finland 2 926 3 226 25.4 8 464 9 494 11 391 12 720
S Sweden 3 694 4 409 22.0 14 771 15 643 18 465 20 052
UK United Kingdom 55 735 56 299 41.0 88 346 81 093 144 081 137 392
(1) Classified and unclassified hotels. (2) Hotels, tourist villages and floating hotels. (3) 1995 data refer to 1996. (4) Only hotels.(5) Tourist hotels and not yet listed hotels. (6) Includes hotels, inns, and hostels. Non residents refers to nationality of the guest,not place of residence. (7) Days spent by foreign visitors. (8) Number of establishments licensed by the Ministry of Tourism1996. (9) Changes in methodology in 1996. (10) Change in methodology in 1997-1998. (11) Change in methodology in 1998.
ATOURISM IN THE EURO-MEDITERRANEAN REGION
Tourism Trends in Mediterranean countries14
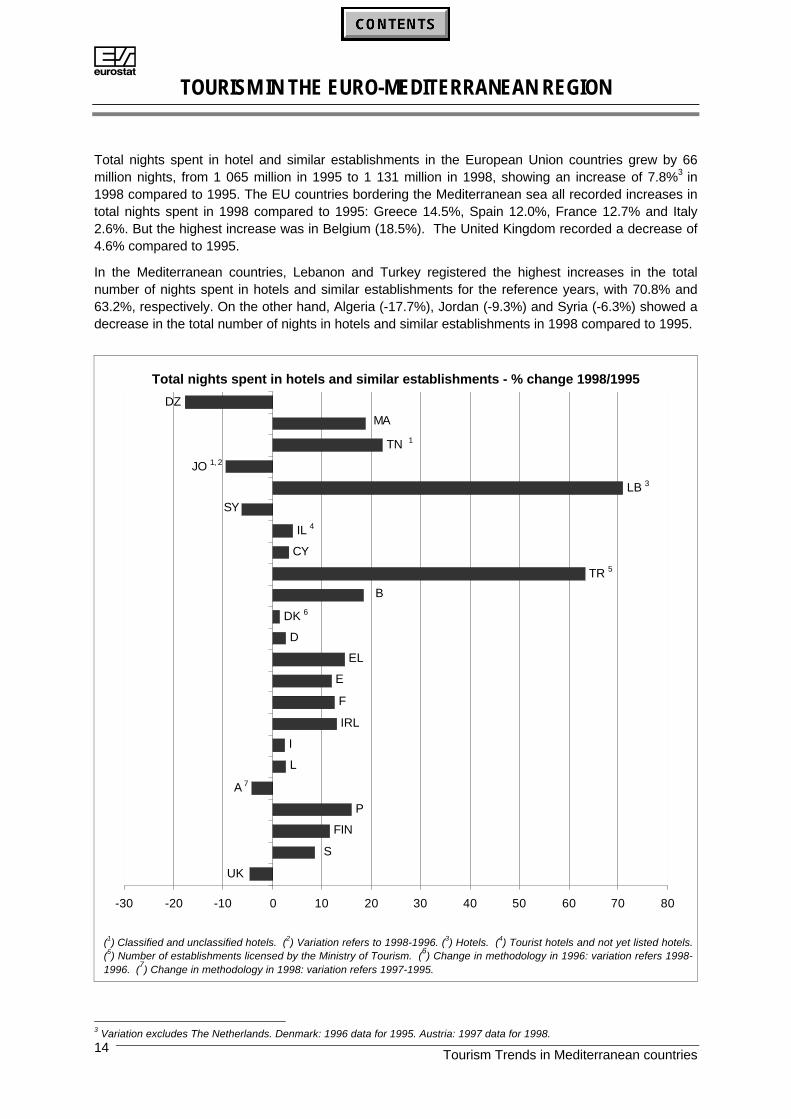
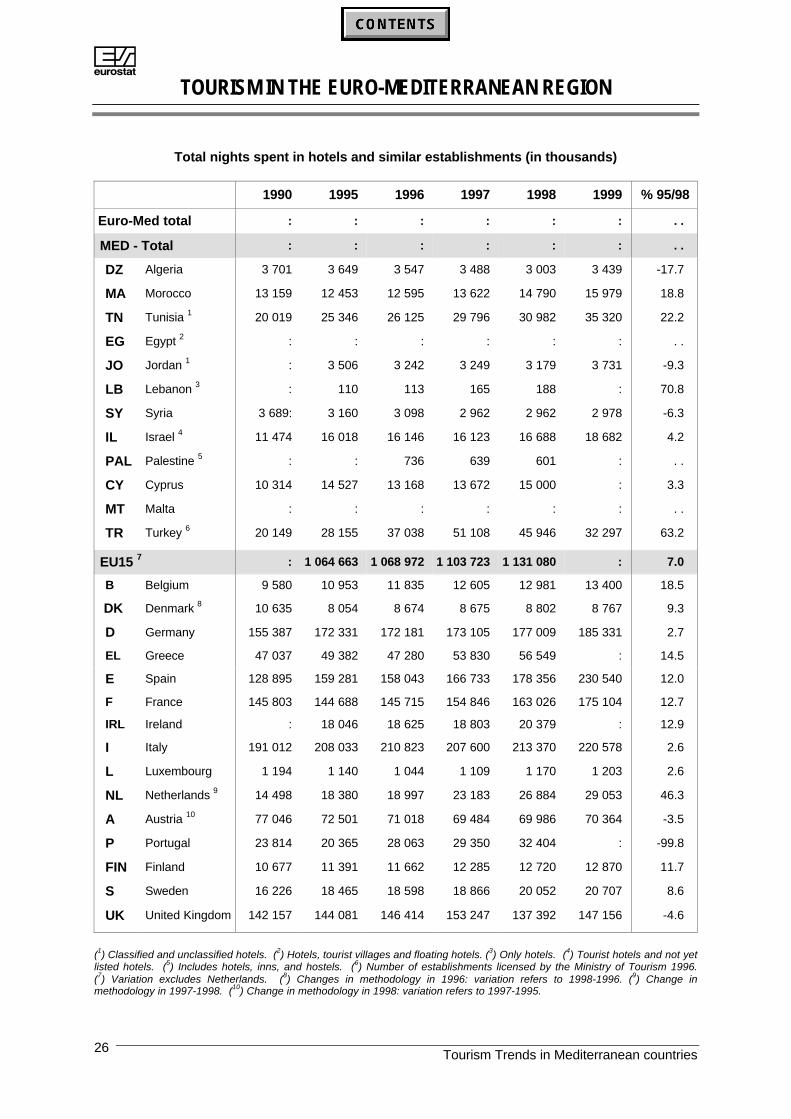
Total nights spent in hotel and similar establishments in the European Union countries grew by 66million nights, from 1 065 million in 1995 to 1 131 million in 1998, showing an increase of 7.8%3 in1998 compared to 1995. The EU countries bordering the Mediterranean sea all recorded increases intotal nights spent in 1998 compared to 1995: Greece 14.5%, Spain 12.0%, France 12.7% and Italy2.6%. But the highest increase was in Belgium (18.5%). The United Kingdom recorded a decrease of4.6% compared to 1995.
In the Mediterranean countries, Lebanon and Turkey registered the highest increases in the totalnumber of nights spent in hotels and similar establishments for the reference years, with 70.8% and63.2%, respectively. On the other hand, Algeria (-17.7%), Jordan (-9.3%) and Syria (-6.3%) showed adecrease in the total number of nights in hotels and similar establishments in 1998 compared to 1995.
Total nights spent in hotels and similar establishments - % change 1998/1995
DZ
CY
D
EL
E
F
IRL
I
L
FIN
LB 3
IL 4
JO 1, 2
TN 1
S
A 7
SY
B
UK
DK 6
P
TR 5
MA
-30 -20 -10 0 10 20 30 40 50 60 70 80
(1) Classified and unclassified hotels. (2) Variation refers to 1998-1996. (3) Hotels. (4) Tourist hotels and not yet listed hotels.(5) Number of establishments licensed by the Ministry of Tourism. (6) Change in methodology in 1996: variation refers 1998-1996. (7) Change in methodology in 1998: variation refers 1997-1995.
3 Variation excludes The Netherlands. Denmark: 1996 data for 1995. Austria: 1997 data for 1998.
ATOURISM IN THE EURO-MEDITERRANEAN REGION
Tourism Trends in Mediterranean countries 15
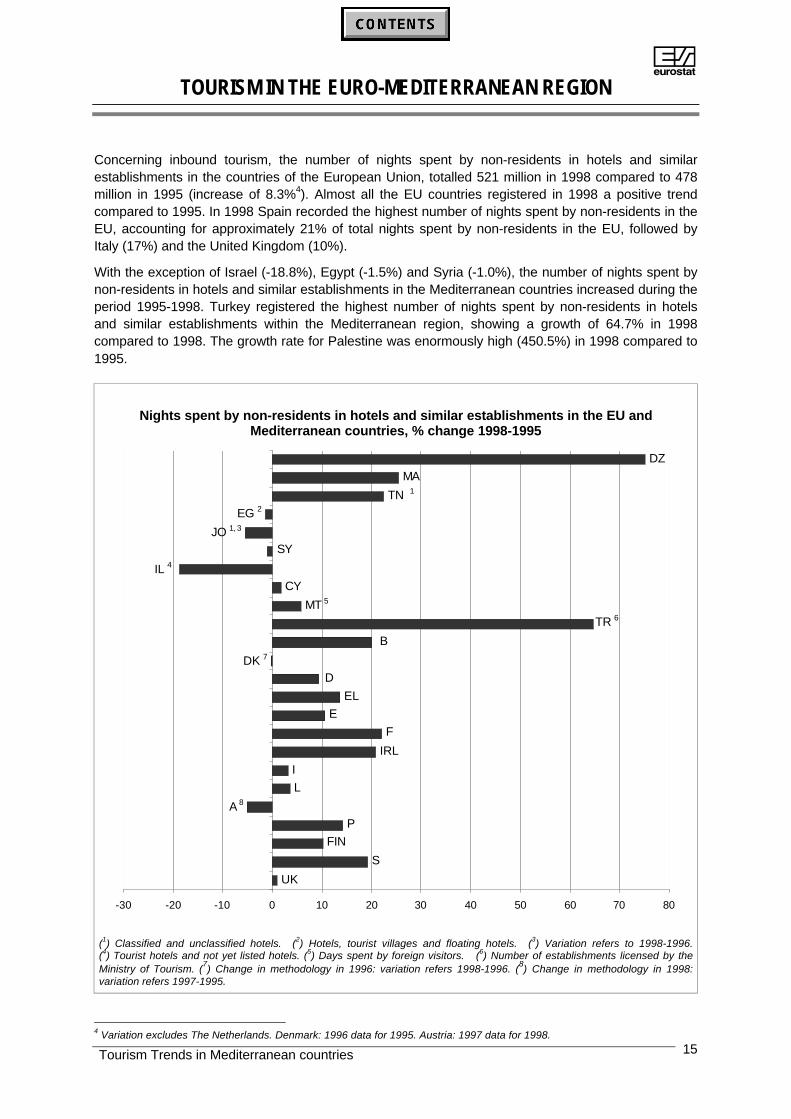
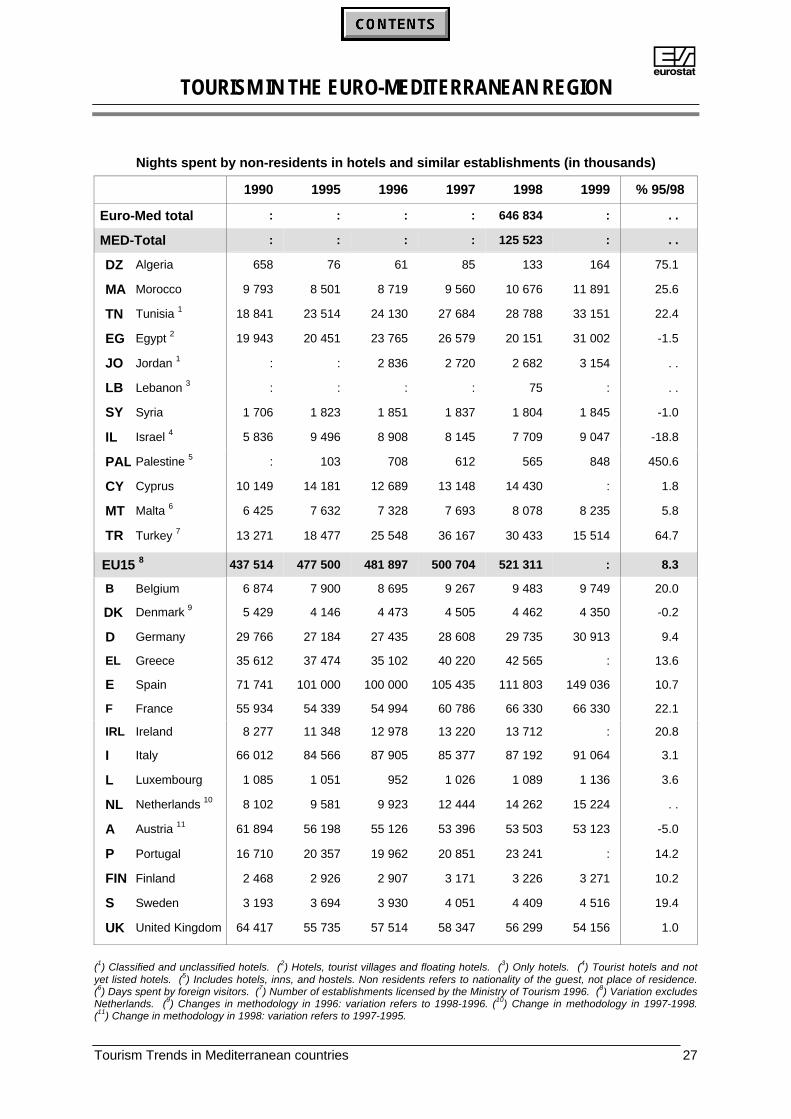
Concerning inbound tourism, the number of nights spent by non-residents in hotels and similarestablishments in the countries of the European Union, totalled 521 million in 1998 compared to 478million in 1995 (increase of 8.3%4). Almost all the EU countries registered in 1998 a positive trendcompared to 1995. In 1998 Spain recorded the highest number of nights spent by non-residents in theEU, accounting for approximately 21% of total nights spent by non-residents in the EU, followed byItaly (17%) and the United Kingdom (10%).
With the exception of Israel (-18.8%), Egypt (-1.5%) and Syria (-1.0%), the number of nights spent bynon-residents in hotels and similar establishments in the Mediterranean countries increased during theperiod 1995-1998. Turkey registered the highest number of nights spent by non-residents in hotelsand similar establishments within the Mediterranean region, showing a growth of 64.7% in 1998compared to 1998. The growth rate for Palestine was enormously high (450.5%) in 1998 compared to1995.
Nights spent by non-residents in hotels and similar establishments in the EU andMediterranean countries, % change 1998-1995
DZ
CY
EL
E
F
IRL
I
L
S
UK
IL 4
EG 2TN 1
A 8
DK 7
MT 5
MA
JO 1, 3
B
P
FIN
D
SY
TR 6
-30 -20 -10 0 10 20 30 40 50 60 70 80
(1) Classified and unclassified hotels. (2) Hotels, tourist villages and floating hotels. (3) Variation refers to 1998-1996.(4) Tourist hotels and not yet listed hotels. (5) Days spent by foreign visitors. (6) Number of establishments licensed by theMinistry of Tourism. (7) Change in methodology in 1996: variation refers 1998-1996. (8) Change in methodology in 1998:variation refers 1997-1995.
4 Variation excludes The Netherlands. Denmark: 1996 data for 1995. Austria: 1997 data for 1998.

ATOURISM IN THE EURO-MEDITERRANEAN REGION
Tourism Trends in Mediterranean countries16
In 1998, the number of nights spent by non-residents in hotels and similar establishments in almost allthe EU and Mediterranean countries represented the most important segment. In Mediterranean area,there is the exception of Algeria with non-resident nights accounting for only 4.4% of total nights. Inthe case of the EU countries the share of nights spent by non-residents in the total is fairly low forGermany (16.8%), Finland (25.4%) and Sweden (22.0%).
% share of nights spent by residents and non residents in hotels and similar establishmentsin 1998
DZ
MA
TN 1
JO 1, 2
LB 3
SY
IL 4
PAL 5
CY
TR 6
B
DK
D
EL
E
F
IRL
L
I
A
P
FIN
S
UK
0% 10% 20% 30% 40% 50% 60% 70% 80% 90% 100%
Non-residents Residents
(1) Classified and unclassified hotels. (2) 1998 data refer to 1997. (3) Hotels. (4) Tourist hotels and not yet listed hotels.(5) Includes hotels, inns, and hostels. Non residents refers to nationality of the guest, not place of residence. (6) Number ofestablishments licensed by the Ministry of Tourism.
ATOURISM IN THE EURO-MEDITERRANEAN REGION
Tourism Trends in Mediterranean countries 17
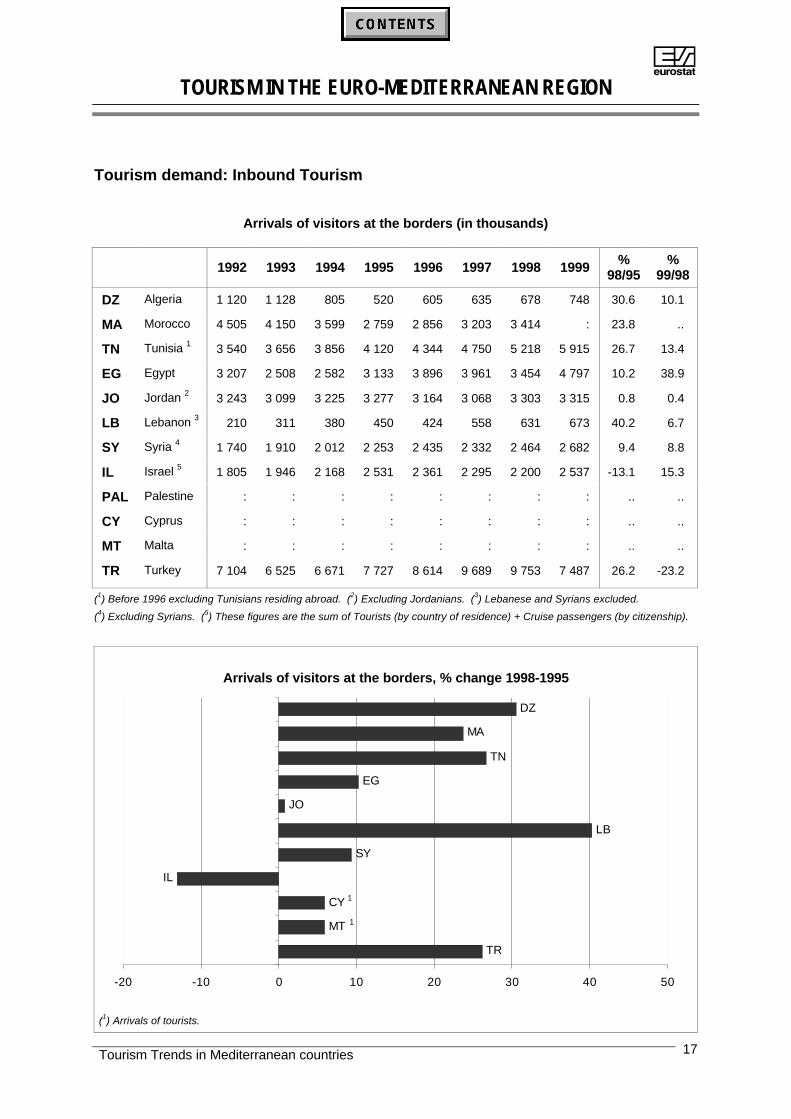
Tourism demand: Inbound Tourism
Arrivals of visitors at the borders (in thousands)
1992 1993 1994 1995 1996 1997 1998 1999 %98/95
%99/98
DZ Algeria 1 120 1 128 805 520 605 635 678 748 30.6 10.1
MA Morocco 4 505 4 150 3 599 2 759 2 856 3 203 3 414 : 23.8 ..
TN Tunisia 1 3 540 3 656 3 856 4 120 4 344 4 750 5 218 5 915 26.7 13.4
EG Egypt 3 207 2 508 2 582 3 133 3 896 3 961 3 454 4 797 10.2 38.9
JO Jordan 2 3 243 3 099 3 225 3 277 3 164 3 068 3 303 3 315 0.8 0.4
LB Lebanon 3 210 311 380 450 424 558 631 673 40.2 6.7
SY Syria 4 1 740 1 910 2 012 2 253 2 435 2 332 2 464 2 682 9.4 8.8
IL Israel 5 1 805 1 946 2 168 2 531 2 361 2 295 2 200 2 537 -13.1 15.3
PAL Palestine : : : : : : : : .. ..
CY Cyprus : : : : : : : : .. ..
MT Malta : : : : : : : : .. ..
TR Turkey 7 104 6 525 6 671 7 727 8 614 9 689 9 753 7 487 26.2 -23.2
(1) Before 1996 excluding Tunisians residing abroad. (2) Excluding Jordanians. (3) Lebanese and Syrians excluded.
(4) Excluding Syrians. (5) These figures are the sum of Tourists (by country of residence) + Cruise passengers (by citizenship).
Arrivals of visitors at the borders, % change 1998-1995
DZ
MA
TN
EG
JO
LB
SY
IL
TR
CY 1
MT 1
-20 -10 0 10 20 30 40 50
(1) Arrivals of tourists.
ATOURISM IN THE EURO-MEDITERRANEAN REGION
Tourism Trends in Mediterranean countries18
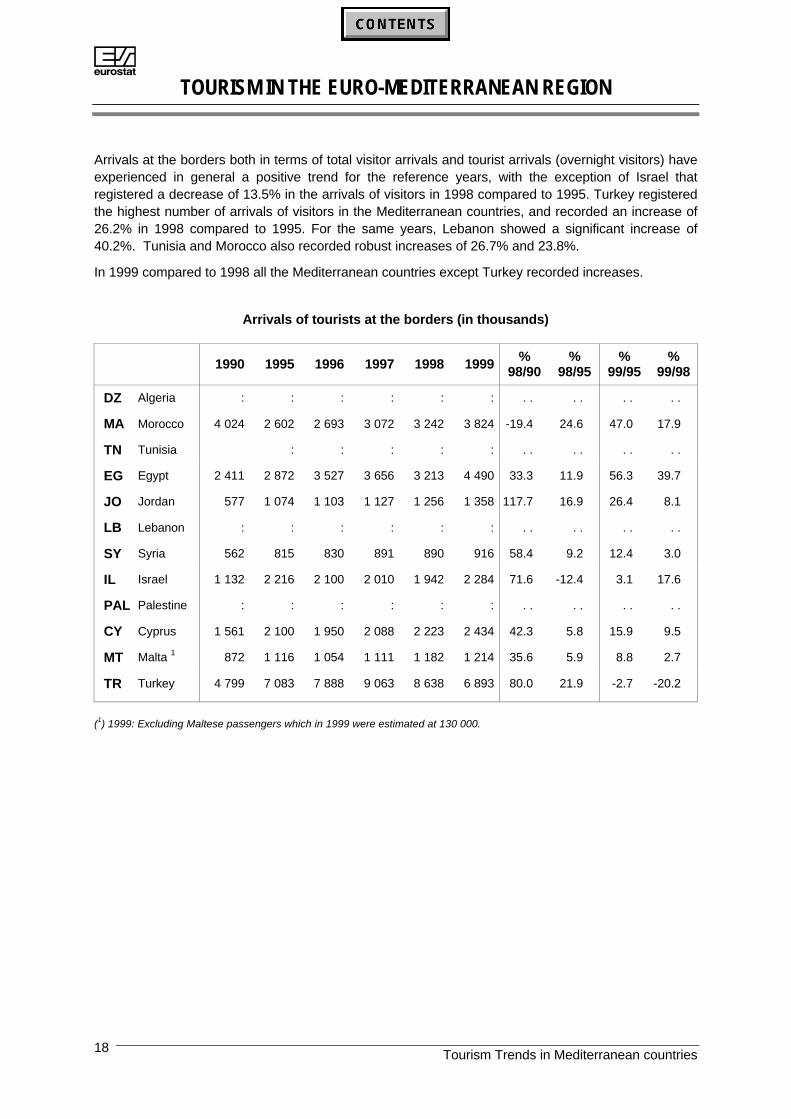
Arrivals at the borders both in terms of total visitor arrivals and tourist arrivals (overnight visitors) haveexperienced in general a positive trend for the reference years, with the exception of Israel thatregistered a decrease of 13.5% in the arrivals of visitors in 1998 compared to 1995. Turkey registeredthe highest number of arrivals of visitors in the Mediterranean countries, and recorded an increase of26.2% in 1998 compared to 1995. For the same years, Lebanon showed a significant increase of40.2%. Tunisia and Morocco also recorded robust increases of 26.7% and 23.8%.
In 1999 compared to 1998 all the Mediterranean countries except Turkey recorded increases.
Arrivals of tourists at the borders (in thousands)
1990 1995 1996 1997 1998 1999 %98/90
%98/95
%99/95
%99/98
DZ Algeria : : : : : : . . . . . . . .
MA Morocco 4 024 2 602 2 693 3 072 3 242 3 824 -19.4 24.6 47.0 17.9
TN Tunisia : : : : : . . . . . . . .
EG Egypt 2 411 2 872 3 527 3 656 3 213 4 490 33.3 11.9 56.3 39.7
JO Jordan 577 1 074 1 103 1 127 1 256 1 358 117.7 16.9 26.4 8.1
LB Lebanon : : : : : : . . . . . . . .
SY Syria 562 815 830 891 890 916 58.4 9.2 12.4 3.0
IL Israel 1 132 2 216 2 100 2 010 1 942 2 284 71.6 -12.4 3.1 17.6
PAL Palestine : : : : : : . . . . . . . .
CY Cyprus 1 561 2 100 1 950 2 088 2 223 2 434 42.3 5.8 15.9 9.5
MT Malta 1 872 1 116 1 054 1 111 1 182 1 214 35.6 5.9 8.8 2.7
TR Turkey 4 799 7 083 7 888 9 063 8 638 6 893 80.0 21.9 -2.7 -20.2
(1) 1999: Excluding Maltese passengers which in 1999 were estimated at 130 000.
ATOURISM IN THE EURO-MEDITERRANEAN REGION
Tourism Trends in Mediterranean countries 19
DETAILED TABLES
• The Travel item in the Balance of Payments:
⇒ Receipts
⇒ Expenditures
⇒ Net Account
• Accommodation supply:
⇒ Number of hotels and similar establishments
⇒ Number of bed-places in hotels and similar establishments
⇒ Average size of hotels and similar establishments
• Nights spent in hotels and similar establishments:
⇒ by non-residents
⇒ by residents
⇒ Total
ATOURISM IN THE EURO-MEDITERRANEAN REGION
Tourism Trends in Mediterranean countries20
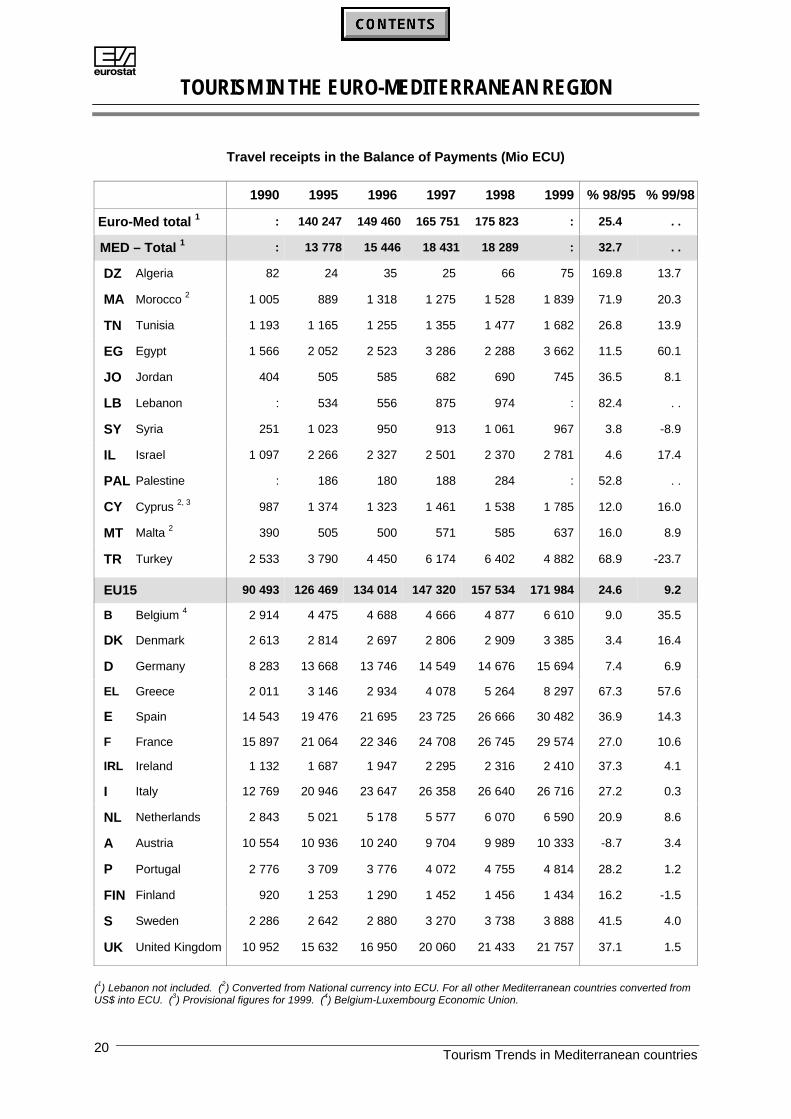
Travel receipts in the Balance of Payments (Mio ECU)
1990 1995 1996 1997 1998 1999 % 98/95 % 99/98
Euro-Med total 1 : 140 247 149 460 165 751 175 823 : 25.4 . .
MED – Total 1 : 13 778 15 446 18 431 18 289 : 32.7 . .
DZ Algeria 82 24 35 25 66 75 169.8 13.7
MA Morocco 2 1 005 889 1 318 1 275 1 528 1 839 71.9 20.3
TN Tunisia 1 193 1 165 1 255 1 355 1 477 1 682 26.8 13.9
EG Egypt 1 566 2 052 2 523 3 286 2 288 3 662 11.5 60.1
JO Jordan 404 505 585 682 690 745 36.5 8.1
LB Lebanon : 534 556 875 974 : 82.4 . .
SY Syria 251 1 023 950 913 1 061 967 3.8 -8.9
IL Israel 1 097 2 266 2 327 2 501 2 370 2 781 4.6 17.4
PAL Palestine : 186 180 188 284 : 52.8 . .
CY Cyprus 2, 3 987 1 374 1 323 1 461 1 538 1 785 12.0 16.0
MT Malta 2 390 505 500 571 585 637 16.0 8.9
TR Turkey 2 533 3 790 4 450 6 174 6 402 4 882 68.9 -23.7
EU15 90 493 126 469 134 014 147 320 157 534 171 984 24.6 9.2
B Belgium 4 2 914 4 475 4 688 4 666 4 877 6 610 9.0 35.5
DK Denmark 2 613 2 814 2 697 2 806 2 909 3 385 3.4 16.4
D Germany 8 283 13 668 13 746 14 549 14 676 15 694 7.4 6.9
EL Greece 2 011 3 146 2 934 4 078 5 264 8 297 67.3 57.6
E Spain 14 543 19 476 21 695 23 725 26 666 30 482 36.9 14.3
F France 15 897 21 064 22 346 24 708 26 745 29 574 27.0 10.6
IRL Ireland 1 132 1 687 1 947 2 295 2 316 2 410 37.3 4.1
I Italy 12 769 20 946 23 647 26 358 26 640 26 716 27.2 0.3
NL Netherlands 2 843 5 021 5 178 5 577 6 070 6 590 20.9 8.6
A Austria 10 554 10 936 10 240 9 704 9 989 10 333 -8.7 3.4
P Portugal 2 776 3 709 3 776 4 072 4 755 4 814 28.2 1.2
FIN Finland 920 1 253 1 290 1 452 1 456 1 434 16.2 -1.5
S Sweden 2 286 2 642 2 880 3 270 3 738 3 888 41.5 4.0
UK United Kingdom 10 952 15 632 16 950 20 060 21 433 21 757 37.1 1.5
(1) Lebanon not included. (2) Converted from National currency into ECU. For all other Mediterranean countries converted fromUS$ into ECU. (3) Provisional figures for 1999. (4) Belgium-Luxembourg Economic Union.
ATOURISM IN THE EURO-MEDITERRANEAN REGION
Tourism Trends in Mediterranean countries 21
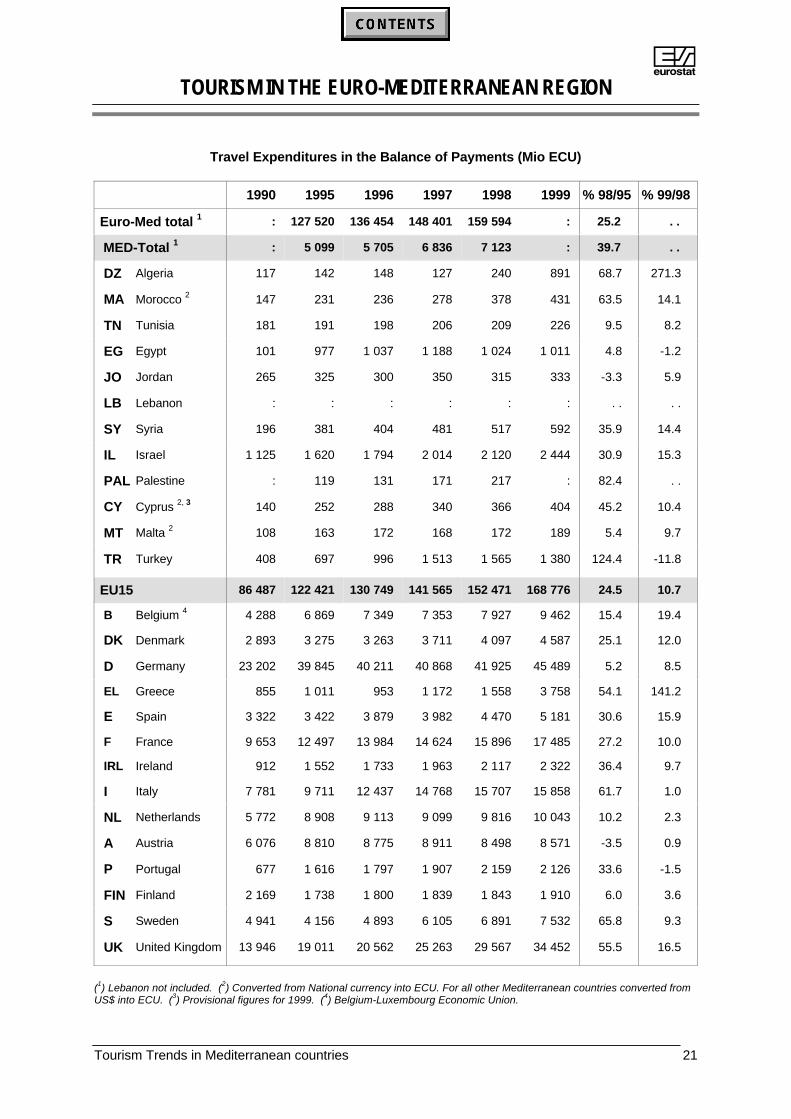
Travel Expenditures in the Balance of Payments (Mio ECU)
1990 1995 1996 1997 1998 1999 % 98/95 % 99/98
Euro-Med total 1 : 127 520 136 454 148 401 159 594 : 25.2 . .
MED-Total 1 : 5 099 5 705 6 836 7 123 : 39.7 . .
DZ Algeria 117 142 148 127 240 891 68.7 271.3
MA Morocco 2 147 231 236 278 378 431 63.5 14.1
TN Tunisia 181 191 198 206 209 226 9.5 8.2
EG Egypt 101 977 1 037 1 188 1 024 1 011 4.8 -1.2
JO Jordan 265 325 300 350 315 333 -3.3 5.9
LB Lebanon : : : : : : . . . .
SY Syria 196 381 404 481 517 592 35.9 14.4
IL Israel 1 125 1 620 1 794 2 014 2 120 2 444 30.9 15.3
PAL Palestine : 119 131 171 217 : 82.4 . .
CY Cyprus 2, 3 140 252 288 340 366 404 45.2 10.4
MT Malta 2 108 163 172 168 172 189 5.4 9.7
TR Turkey 408 697 996 1 513 1 565 1 380 124.4 -11.8
EU15 86 487 122 421 130 749 141 565 152 471 168 776 24.5 10.7
B Belgium 4 4 288 6 869 7 349 7 353 7 927 9 462 15.4 19.4
DK Denmark 2 893 3 275 3 263 3 711 4 097 4 587 25.1 12.0
D Germany 23 202 39 845 40 211 40 868 41 925 45 489 5.2 8.5
EL Greece 855 1 011 953 1 172 1 558 3 758 54.1 141.2
E Spain 3 322 3 422 3 879 3 982 4 470 5 181 30.6 15.9
F France 9 653 12 497 13 984 14 624 15 896 17 485 27.2 10.0
IRL Ireland 912 1 552 1 733 1 963 2 117 2 322 36.4 9.7
I Italy 7 781 9 711 12 437 14 768 15 707 15 858 61.7 1.0
NL Netherlands 5 772 8 908 9 113 9 099 9 816 10 043 10.2 2.3
A Austria 6 076 8 810 8 775 8 911 8 498 8 571 -3.5 0.9
P Portugal 677 1 616 1 797 1 907 2 159 2 126 33.6 -1.5
FIN Finland 2 169 1 738 1 800 1 839 1 843 1 910 6.0 3.6
S Sweden 4 941 4 156 4 893 6 105 6 891 7 532 65.8 9.3
UK United Kingdom 13 946 19 011 20 562 25 263 29 567 34 452 55.5 16.5
(1) Lebanon not included. (2) Converted from National currency into ECU. For all other Mediterranean countries converted fromUS$ into ECU. (3) Provisional figures for 1999. (4) Belgium-Luxembourg Economic Union.
ATOURISM IN THE EURO-MEDITERRANEAN REGION
Tourism Trends in Mediterranean countries22
Net Travel Account in the Balance of Payments (Mio ECU)
1990 1995 1996 1997 1998 1999 % 98/95 % 99/98
Euro-Med total 1 : 12 727 13 006 17 350 16 229 : 27.5 . .
MED-Total 1 : 8 679 9 741 11 595 11 166 : 28.7 . .
DZ Algeria -35 -118 -113 -102 -174 -816 -47.7 -369.3
MA Morocco 2 859 658 1 082 997 1 150 1 408 74.9 22.4
TN Tunisia 1 012 974 1 057 1 149 1 268 1 456 30.2 14.9
EG Egypt 1 465 1 075 1 486 2 099 1 264 2 651 17.6 109.7
JO Jordan 139 180 285 331 375 412 108.5 9.9
LB Lebanon : : : : : : . . . .
SY Syria 56 642 546 432 544 375 -15.3 -31.1
IL Israel -29 646 533 487 250 338 -61.3 35.2
PAL Palestine : 66 49 16 66 : -0.1 . .
CY Cyprus 2, 3 848 1 122 1 035 1 121 1 172 1 381 4.5 17.8
MT Malta 2 282 341 327 402 413 448 21.0 8.6
TR Turkey 2 124 3 092 3 453 4 661 4 837 3 502 56.4 -27.6
EU15 4 003 4 048 3 265 5 755 5 063 3 208 25.1 -36.6
B Belgium 4 -1 376 -2 394 -2 661 -2 687 -3 050 -2 852 -27.4 -6.5
DK Denmark -279 -461 -566 -905 -1 188 -1 202 -157.7 1.2
D Germany -14 920 -26 177 -26 465 -26 319 -27 249 -29 795 -4.1 9.3
EL Greece 1 155 2 135 1 981 2 906 3 706 4 539 73.6 22.5
E Spain 11 221 16 054 17 816 19 743 22 196 25 301 38.3 14.0
F France 6 244 8 567 8 362 10 084 10 849 12 089 26.6 11.4
IRL Ireland 220 135 214 332 199 88 47.4 -55.8
I Italy 4 989 11 235 11 210 11 590 10 933 10 858 -2.7 -0.7
NL Netherlands -2 929 -3 887 -3 935 -3 522 -3 746 -3 453 3.6 -7.8
A Austria 4 479 2 126 1 465 793 1 491 1 762 -29.9 18.2
P Portugal 2 098 2 093 1 979 2 165 2 596 2 688 24.0 3.5
FIN Finland -1 250 -485 -510 -387 -387 -476 20.2 23.0
S Sweden -2 655 -1 514 -2 013 -2 835 -3 153 -3 644 -108.3 15.6
UK United Kingdom -2 994 -3 379 -3 612 -5 203 -8 134 -12 695 -140.7 56.1
(1) Lebanon not included. (2) Converted from National currency into ECU. For all other Mediterranean countries converted fromUS$ into ECU. (3) Provisional figures for 1999. (4) Belgium-Luxembourg Economic Union.
ATOURISM IN THE EURO-MEDITERRANEAN REGION
Tourism Trends in Mediterranean countries 23
Number of hotels and similar establishments
1990 1995 1996 1997 1998 1999 % 98/95 % 99/98
Euro-Med total 1 : 196 818 197 245 194 779 194 669 : 1.0 . .
MED – Total : 7 429 7 668 7 927 8 177 : 10.1 . .
DZ Algeria 380 653 659 740 781 800 19.6 2.4
MA Morocco 2 1 415 1 553 1 570 1 574 1 635 1 586 5.3 -3.0
TN Tunisia 3 508 612 641 662 692 722 13.1 4.3
EG Egypt 4 632 752 789 829 869 914 15.6 5.2
JO Jordan 3, 5, 229 294 324 336 380 422 29.3 11.1
LB Lebanon 6 : 191 199 203 214 : 12.0 . .
SY Syria 3 450 454 437 446 438 474 -3.5 8.2
IL Israel 7 272 298 305 309 313 330 5.0 5.4
PAL Palestine 8 : 60 72 85 92 91 53.3 -1.1
CY Cyprus 461 537 574 568 580 580 8.0 0.0
MT Malta 9 256 256 255 261 248 248 -3.1 0.0
TR Turkey 10 1 229 1 769 1 843 1 914 1 935 1 862 9.4 -3.8
EU15 1 197 001 189 389 189 577 186 852 186 492 : 0.6 . .
B Belgium 2 123 2 038 2 062 2 000 1 998 2 015 -2.0 0.9
DK Denmark 11 539 564 478 470 467 464 -2.3 -0.6
D Germany 37 423 38 172 38 565 38 971 38 914 38 701 1.9 -0.5
EL Greece 6 713 7 754 7 916 7 850 7 946 : 2.5 . .
E Spain 12 9 436 10 422 9 482 7 520 7 539 16 229 : :
F France 20 472 20 147 20 849 20 273 19 555 19 379 -2.9 -0.9
IRL Ireland 3 478 5 039 5 274 5 164 5 460 : 8.4 . .
I Italy 36 423 34 296 34 080 33 828 33 548 33 379 -2.2 -0.5
L Luxembourg 401 369 368 344 342 325 -7.3 -5.0
NL Netherlands13 1 546 1 749 1 739 1 857 2 788 2 826 6.2 1.4
A Austria 13 19 406 18 120 17 990 17 692 15 780 15 378 -2.4 -2.5
P Portugal 1 758 1 733 1 744 1 768 1 754 : 1.2 . .
FIN Finland 1 096 936 958 958 978 1 004 4.5 2.7
S Sweden 1 723 1 829 1 851 1 905 1 891 1 898 3.4 0.4
UK United Kingdom 54 464 46 221 46 221 46 252 47 532 51 300 2.8 7.9
(1) Variation exclude Spain. (2) 1999 provisional data. (3) Classified and unclassified hotels. (4) Hotels , tourist villages andfloating hotels. (5) Revised time series. 1990 data is 1991 data. (6) Only hotels. (7) Tourist hotels and not yet listed hotels.(8) Includes hotels, inns, and hostels. (9) Star rated hotels and unclassified hotels, holiday complexes, appart-hotels & guesthouses. (10) Only establishments licensed by the Ministry of Tourism. (11) Change in methodology in 1996: variation 1998-1995refers to 1998-1996. (12) Changes in methodology: breaks in the time series in 97 and 99. (13) Change in methodology in 1998:variation 1998-1995 refers to 1997-1995.
ATOURISM IN THE EURO-MEDITERRANEAN REGION
Tourism Trends in Mediterranean countries24
Number of bed-places in hotels and similar establishments (in thousands)
1990 1995 1996 1997 1998 1999 % 98/95 % 99/98
Euro-Med total 1 : 9 631 10 015 10 076 10 168 : 7.8 . .
MED-Total : 1 018 1 076 1 113 1 155 : 12.8 . .
DZ Algeria 54 62 65 66 71 76 14.5 7.1
MA Morocco 2 111 123 124 124 125 127 1.3 1.7
TN Tunisia 3 117 161 170 178 185 192 14.3 4.0
EG Egypt 4 101 129 141 151 167 188 29.4 12.5
JO Jordan 3, 5 16 21 23 24 27 32 31.2 17.4
LB Lebanon 6 : 15 17 17 19 : 24.6 . .
SY Syria 3 29 31 32 31 32 33 0.3 6.0
IL Israel 7 64 75 81 84 90 98 20.0 9.3
PAL Palestine 8 6 7 7 8 8 32.4 4.8
CY Cyprus 58 77 84 83 85 86 10.4 1.0
MT Malta 9 34 37 38 39 39 39 4.3 0.0
TR Turkey 10 165 280 296 308 309 308 10.3 -0.3
EU15 1 7 819 8 613 8 939 8 963 9 013 : 7.1 . .
B Belgium 94 115 117 118 116 119 1.2 2.6
DK Denmark 11 88 99 60 59 60 61 -0.5 1.2
D Germany 1 136 1 447 1 491 1 527 1 547 1 562 6.9 1.0
EL Greece 438 557 572 577 585 : 5.0 . .
E Spain 12 930 1 032 1 025 973 979 1 299 : :
F France 1 088 1 193 1 472 1 467 1 451 1 486 21.6 2.4
IRL Ireland 70 97 97 107 117 : 20.9 . .
I Italy 1 679 1 740 1 765 1 772 1 782 1 795 2.5 0.7
L Luxembourg 15 15 15 15 15 14 -0.3 -1.8
NL Netherlands 13 111 143 143 158 169 170 10.8 0.4
A Austria 13 651 646 640 634 585 577 -1.9 -1.4
P Portugal 179 204 208 211 216 : 5.6 . .
FIN Finland 92 103 106 109 110 115 7.1 4.7
S Sweden 162 174 178 183 185 185 6.2 0.2
UK United Kingdom 1 086 1 050 1 050 1 052 1 096 1 176 4.4 7.3
(1) Variation exclude Spain. (2) 1999 provisional data. (3) Classified and unclassified hotels. (4) Hotels , tourist villages andfloating hotels. (5) Revised time series. 1990 data is 1991 data. (6) Only hotels. (7) Tourist hotels and not yet listed hotels.(8) Includes hotels, inns, and hostels. (9) Star rated hotels and unclassified hotels, holiday complexes, appart-hotels & guesthouses. (10) Only establishments licensed by the Ministry of Tourism. (11) Change in methodology in 1996: variation 1998-1995refers to 1998-1996. (12) Changes in methodology: breaks in the time series in 97 and 99. (13) Change in methodology in 1998:variation 1998-1995 refers to 1997-1995.

ATOURISM IN THE EURO-MEDITERRANEAN REGION
Tourism Trends in Mediterranean countries 25
Average size of hotels and similar establishments
1990 1995 1996 1997 1998 1999 % 98/95 % 99/98
Euro-Med total 1 : 48.9 50.8 51.7 52.2 : 6.8 . .
MED-Total : 137.1 140.4 140.4 141.3 : 3.1 . .
DZ Algeria 141.6 94.9 98.2 88.8 90.9 95.0 -4.3 4.5
MA Morocco 2 78.7 79.2 79.1 78.7 76.2 79.9 -3.8 4.8
TN Tunisia 3 229.4 263.9 265.1 269.1 266.8 265.9 1.1 -0.3
EG Egypt 4 160.6 171.5 178.4 182.1 192.0 205.3 11.9 6.9
JO Jordan 3,5 68.2 70.1 70.2 70.8 71.2 75.3 1.5 5.7
LB Lebanon 6 : 81.1 83.7 85.6 90.2 : 11.2 . .
SY Syria 3 65.3 69.3 73.8 70.4 72.0 70.5 3.9 -2.1
IL Israel 7 233.8 251.5 266.7 271.7 287.4 297.9 14.3 3.7
PAL Palestine 8 : 97.3 90.4 82.8 84.0 89.0 -13.6 6.0
CY Cyprus 125.0 143.6 145.5 146.6 146.8 148.4 2.2 1.0
MT Malta 9 131.4 145.3 149.2 150.7 156.4 156.4 7.7 0.0
TR Turkey 10 134.3 158.4 160.5 161.0 159.7 165.5 0.8 3.6
EU15 1 39.7 45.5 47.2 48.0 48.3 : 6.5 . .
B Belgium 44.1 56.4 56.9 58.8 58.2 59.2 3.3 1.8
DK Denmark 11 164.1 175.5 125.7 126.3 128.0 130.4 1.8 1.9
D Germany 30.3 37.9 38.7 39.2 39.8 40.4 4.9 1.5
EL Greece 65.3 71.9 72.2 73.5 73.6 : 2.4 . .
E Spain 12 98.5 99.0 108.1 129.4 129.9 80.0 : :
F France 53.1 59.2 70.6 72.4 74.2 76.7 25.3 3.3
IRL Ireland 20.2 19.2 18.4 20.8 21.5 : 11.6 . .
I Italy 46.1 50.7 51.8 52.4 53.1 53.8 4.7 1.2
L Luxembourg 36.9 40.0 40.1 43.0 43.0 44.5 7.6 3.4
NL Netherlands 13 72.0 81.5 82.1 85.0 60.6 60.1 4.4 -1.0
A Austria 13 33.5 35.7 35.6 35.8 37.1 37.5 0.4 1.2
P Portugal 102.0 117.7 119.4 119.5 122.9 : 4.4 . .
FIN Finland 84.0 109.5 110.6 114.2 112.3 114.4 2.5 1.9
S Sweden 93.9 95.0 96.0 95.9 97.6 97.5 2.7 -0.1
UK United Kingdom 19.9 22.7 22.7 22.7 23.1 22.9 1.5 -0.6
(1) Variation exclude Spain. (2) 1999 provisional data. (3) Classified and unclassified hotels. (4) Hotels , tourist villages andfloating hotels. (5) Revised time series. 1990 data is 1991 data. (6) Only hotels. (7) Tourist hotels and not yet listed hotels.(8) Includes hotels, inns, and hostels. (9) Star rated hotels and unclassified hotels, holiday complexes, appart-hotels & guesthouses. (10) Only establishments licensed by the Ministry of Tourism. (11) Change in methodology in 1996: variation 1998-1995refers to 1998-1996. (12) Changes in methodology: breaks in the time series in 97 and 99. (13) Change in methodology in 1998:variation 1998-1995 refers to 1997-1995.
ATOURISM IN THE EURO-MEDITERRANEAN REGION
Tourism Trends in Mediterranean countries26
Total nights spent in hotels and similar establishments (in thousands)
1990 1995 1996 1997 1998 1999 % 95/98
Euro-Med total : : : : : : . .
MED - Total : : : : : : . .
DZ Algeria 3 701 3 649 3 547 3 488 3 003 3 439 -17.7
MA Morocco 13 159 12 453 12 595 13 622 14 790 15 979 18.8
TN Tunisia 1 20 019 25 346 26 125 29 796 30 982 35 320 22.2
EG Egypt 2 : : : : : : . .
JO Jordan 1 : 3 506 3 242 3 249 3 179 3 731 -9.3
LB Lebanon 3 : 110 113 165 188 : 70.8
SY Syria 3 689: 3 160 3 098 2 962 2 962 2 978 -6.3
IL Israel 4 11 474 16 018 16 146 16 123 16 688 18 682 4.2
PAL Palestine 5 : : 736 639 601 : . .
CY Cyprus 10 314 14 527 13 168 13 672 15 000 : 3.3
MT Malta : : : : : : . .
TR Turkey 6 20 149 28 155 37 038 51 108 45 946 32 297 63.2
EU15 7 : 1 064 663 1 068 972 1 103 723 1 131 080 : 7.0
B Belgium 9 580 10 953 11 835 12 605 12 981 13 400 18.5
DK Denmark 8 10 635 8 054 8 674 8 675 8 802 8 767 9.3
D Germany 155 387 172 331 172 181 173 105 177 009 185 331 2.7
EL Greece 47 037 49 382 47 280 53 830 56 549 : 14.5
E Spain 128 895 159 281 158 043 166 733 178 356 230 540 12.0
F France 145 803 144 688 145 715 154 846 163 026 175 104 12.7
IRL Ireland : 18 046 18 625 18 803 20 379 : 12.9
I Italy 191 012 208 033 210 823 207 600 213 370 220 578 2.6
L Luxembourg 1 194 1 140 1 044 1 109 1 170 1 203 2.6
NL Netherlands 9 14 498 18 380 18 997 23 183 26 884 29 053 46.3
A Austria 10 77 046 72 501 71 018 69 484 69 986 70 364 -3.5
P Portugal 23 814 20 365 28 063 29 350 32 404 : -99.8
FIN Finland 10 677 11 391 11 662 12 285 12 720 12 870 11.7
S Sweden 16 226 18 465 18 598 18 866 20 052 20 707 8.6
UK United Kingdom 142 157 144 081 146 414 153 247 137 392 147 156 -4.6
(1) Classified and unclassified hotels. (2) Hotels, tourist villages and floating hotels. (3) Only hotels. (4) Tourist hotels and not yetlisted hotels. (5) Includes hotels, inns, and hostels. (6) Number of establishments licensed by the Ministry of Tourism 1996.(7) Variation excludes Netherlands. (8) Changes in methodology in 1996: variation refers to 1998-1996. (9) Change inmethodology in 1997-1998. (10) Change in methodology in 1998: variation refers to 1997-1995.
ATOURISM IN THE EURO-MEDITERRANEAN REGION
Tourism Trends in Mediterranean countries 27
Nights spent by non-residents in hotels and similar establishments (in thousands)
1990 1995 1996 1997 1998 1999 % 95/98
Euro-Med total : : : : 646 834 : . .
MED-Total : : : : 125 523 : . .
DZ Algeria 658 76 61 85 133 164 75.1
MA Morocco 9 793 8 501 8 719 9 560 10 676 11 891 25.6
TN Tunisia 1 18 841 23 514 24 130 27 684 28 788 33 151 22.4
EG Egypt 2 19 943 20 451 23 765 26 579 20 151 31 002 -1.5
JO Jordan 1 : : 2 836 2 720 2 682 3 154 . .
LB Lebanon 3 : : : : 75 : . .
SY Syria 1 706 1 823 1 851 1 837 1 804 1 845 -1.0
IL Israel 4 5 836 9 496 8 908 8 145 7 709 9 047 -18.8
PAL Palestine 5 : 103 708 612 565 848 450.6
CY Cyprus 10 149 14 181 12 689 13 148 14 430 : 1.8
MT Malta 6 6 425 7 632 7 328 7 693 8 078 8 235 5.8
TR Turkey 7 13 271 18 477 25 548 36 167 30 433 15 514 64.7
EU15 8 437 514 477 500 481 897 500 704 521 311 : 8.3
B Belgium 6 874 7 900 8 695 9 267 9 483 9 749 20.0
DK Denmark 9 5 429 4 146 4 473 4 505 4 462 4 350 -0.2
D Germany 29 766 27 184 27 435 28 608 29 735 30 913 9.4
EL Greece 35 612 37 474 35 102 40 220 42 565 : 13.6
E Spain 71 741 101 000 100 000 105 435 111 803 149 036 10.7
F France 55 934 54 339 54 994 60 786 66 330 66 330 22.1
IRL Ireland 8 277 11 348 12 978 13 220 13 712 : 20.8
I Italy 66 012 84 566 87 905 85 377 87 192 91 064 3.1
L Luxembourg 1 085 1 051 952 1 026 1 089 1 136 3.6
NL Netherlands 10 8 102 9 581 9 923 12 444 14 262 15 224 . .
A Austria 11 61 894 56 198 55 126 53 396 53 503 53 123 -5.0
P Portugal 16 710 20 357 19 962 20 851 23 241 : 14.2
FIN Finland 2 468 2 926 2 907 3 171 3 226 3 271 10.2
S Sweden 3 193 3 694 3 930 4 051 4 409 4 516 19.4
UK United Kingdom 64 417 55 735 57 514 58 347 56 299 54 156 1.0
(1) Classified and unclassified hotels. (2) Hotels, tourist villages and floating hotels. (3) Only hotels. (4) Tourist hotels and notyet listed hotels. (5) Includes hotels, inns, and hostels. Non residents refers to nationality of the guest, not place of residence.(6) Days spent by foreign visitors. (7) Number of establishments licensed by the Ministry of Tourism 1996. (8) Variation excludesNetherlands. (9) Changes in methodology in 1996: variation refers to 1998-1996. (10) Change in methodology in 1997-1998.(11) Change in methodology in 1998: variation refers to 1997-1995.
ATOURISM IN THE EURO-MEDITERRANEAN REGION
Tourism Trends in Mediterranean countries28
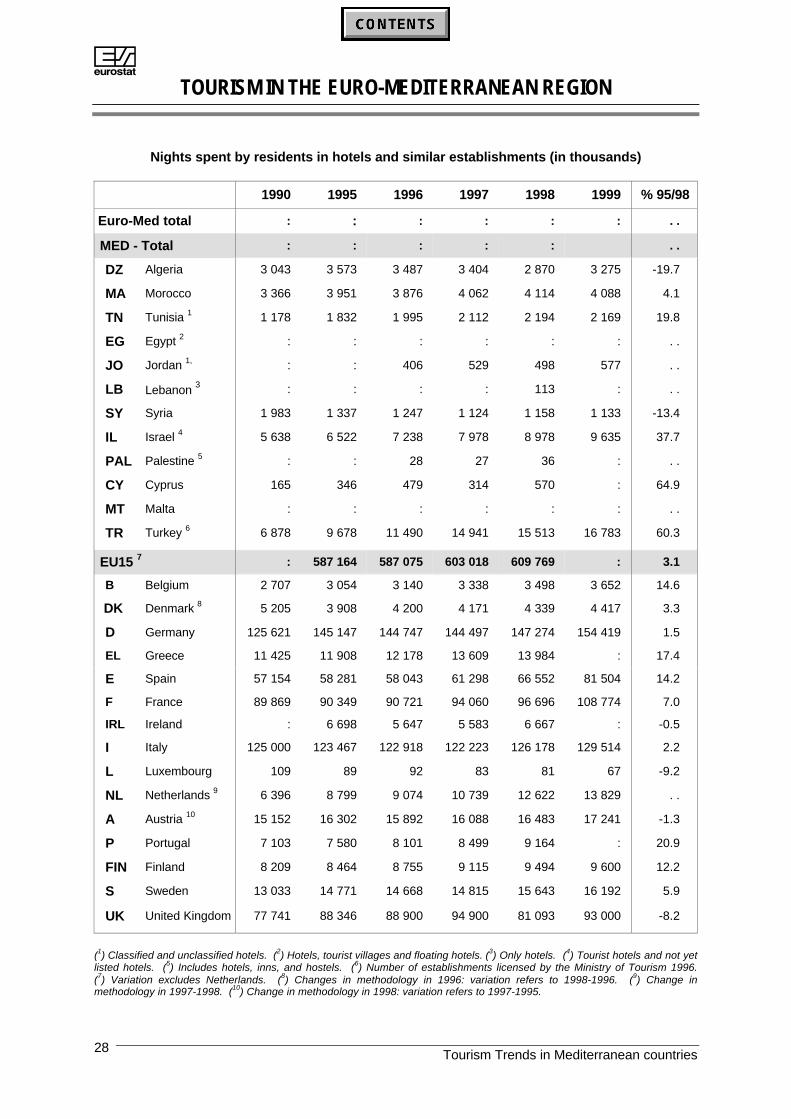
Nights spent by residents in hotels and similar establishments (in thousands)
1990 1995 1996 1997 1998 1999 % 95/98
Euro-Med total : : : : : : . .
MED - Total : : : : : . .
DZ Algeria 3 043 3 573 3 487 3 404 2 870 3 275 -19.7
MA Morocco 3 366 3 951 3 876 4 062 4 114 4 088 4.1
TN Tunisia 1 1 178 1 832 1 995 2 112 2 194 2 169 19.8
EG Egypt 2 : : : : : : . .
JO Jordan 1, : : 406 529 498 577 . .
LB Lebanon 3 : : : : 113 : . .
SY Syria 1 983 1 337 1 247 1 124 1 158 1 133 -13.4
IL Israel 4 5 638 6 522 7 238 7 978 8 978 9 635 37.7
PAL Palestine 5 : : 28 27 36 : . .
CY Cyprus 165 346 479 314 570 : 64.9
MT Malta : : : : : : . .
TR Turkey 6 6 878 9 678 11 490 14 941 15 513 16 783 60.3
EU15 7 : 587 164 587 075 603 018 609 769 : 3.1
B Belgium 2 707 3 054 3 140 3 338 3 498 3 652 14.6
DK Denmark 8 5 205 3 908 4 200 4 171 4 339 4 417 3.3
D Germany 125 621 145 147 144 747 144 497 147 274 154 419 1.5
EL Greece 11 425 11 908 12 178 13 609 13 984 : 17.4
E Spain 57 154 58 281 58 043 61 298 66 552 81 504 14.2
F France 89 869 90 349 90 721 94 060 96 696 108 774 7.0
IRL Ireland : 6 698 5 647 5 583 6 667 : -0.5
I Italy 125 000 123 467 122 918 122 223 126 178 129 514 2.2
L Luxembourg 109 89 92 83 81 67 -9.2
NL Netherlands 9 6 396 8 799 9 074 10 739 12 622 13 829 . .
A Austria 10 15 152 16 302 15 892 16 088 16 483 17 241 -1.3
P Portugal 7 103 7 580 8 101 8 499 9 164 : 20.9
FIN Finland 8 209 8 464 8 755 9 115 9 494 9 600 12.2
S Sweden 13 033 14 771 14 668 14 815 15 643 16 192 5.9
UK United Kingdom 77 741 88 346 88 900 94 900 81 093 93 000 -8.2
(1) Classified and unclassified hotels. (2) Hotels, tourist villages and floating hotels. (3) Only hotels. (4) Tourist hotels and not yetlisted hotels. (5) Includes hotels, inns, and hostels. (6) Number of establishments licensed by the Ministry of Tourism 1996. (7) Variation excludes Netherlands. (8) Changes in methodology in 1996: variation refers to 1998-1996. (9) Change inmethodology in 1997-1998. (10) Change in methodology in 1998: variation refers to 1997-1995.

COUNTRY ANALYSIS
AA L G E R I A
Tourism Trends in Mediterranean countries 31
Part I: General situation and main indicators
Development and Impact of Tourism
It is only recently that the tourism industry has become of some interest to the national economy. Alook at its history shows that it went through over 15 years of instability characterised by a great dealof restructuring. But now, the new strategy adopted by the Algerian government includes the tourismindustry among the main sectors, due to its important potential capacity to boost the economy.
The sector has been standing on its own right since 1993. This new status is characterised by thecreation, within the government, of a Ministry of Tourism and of Arts and Crafts and by the progressiveimplementation of decentralised services. Given its current situation, Algeria does not appear to be afavourite destination for inbound tourism, since the arrivals of foreign visitors account for no more than15% of the tourism demand (arrivals at the borders) in 1998.
Tourism has suffered a great deal from the difficult socio-economic situation that Algeria has gonethrough since the nineties, and especially so since the country has started a process of deep reforms.
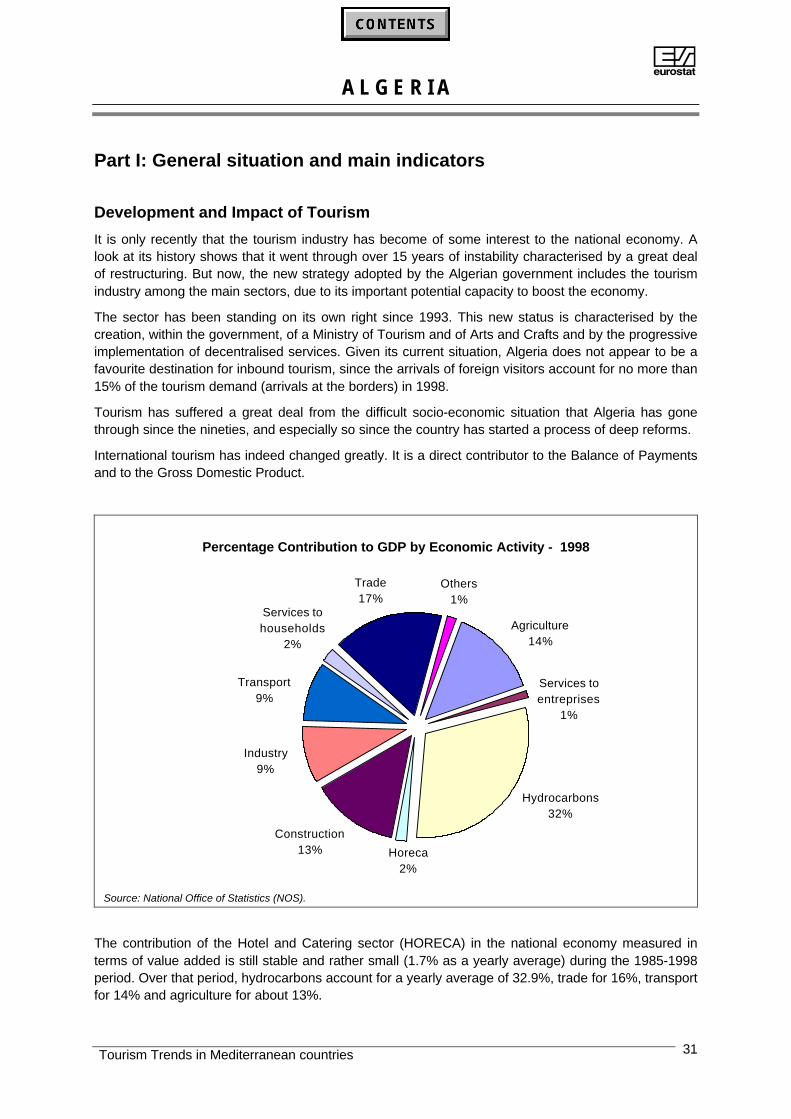
International tourism has indeed changed greatly. It is a direct contributor to the Balance of Paymentsand to the Gross Domestic Product.
Percentage Contribution to GDP by Economic Activity - 1998
Services to entreprises
1%
Agriculture14%
Others1%
Hydrocarbons32%
Horeca2%
Construction13%
Industry9%
Transport9%
Services to households
2%
Trade17%
Source: National Office of Statistics (NOS).
The contribution of the Hotel and Catering sector (HORECA) in the national economy measured interms of value added is still stable and rather small (1.7% as a yearly average) during the 1985-1998period. Over that period, hydrocarbons account for a yearly average of 32.9%, trade for 16%, transportfor 14% and agriculture for about 13%.
AA L G E R I A
Tourism Trends in Mediterranean countries32
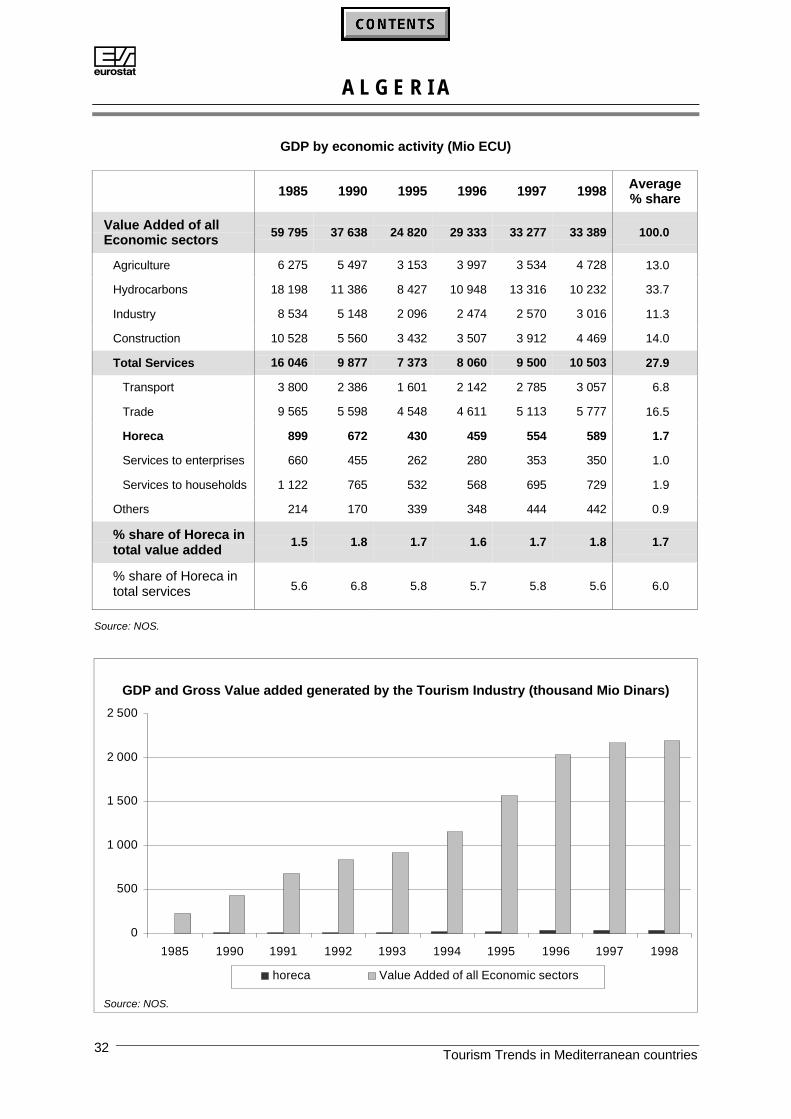
GDP by economic activity (Mio ECU)
1985 1990 1995 1996 1997 1998 Average% share
Value Added of allEconomic sectors
59 795 37 638 24 820 29 333 33 277 33 389 100.0
Agriculture 6 275 5 497 3 153 3 997 3 534 4 728 13.0
Hydrocarbons 18 198 11 386 8 427 10 948 13 316 10 232 33.7
Industry 8 534 5 148 2 096 2 474 2 570 3 016 11.3
Construction 10 528 5 560 3 432 3 507 3 912 4 469 14.0
Total Services 16 046 9 877 7 373 8 060 9 500 10 503 27.9
Transport 3 800 2 386 1 601 2 142 2 785 3 057 6.8
Trade 9 565 5 598 4 548 4 611 5 113 5 777 16.5
Horeca 899 672 430 459 554 589 1.7
Services to enterprises 660 455 262 280 353 350 1.0
Services to households 1 122 765 532 568 695 729 1.9
Others 214 170 339 348 444 442 0.9
% share of Horeca intotal value added
1.5 1.8 1.7 1.6 1.7 1.8 1.7
% share of Horeca intotal services 5.6 6.8 5.8 5.7 5.8 5.6 6.0
Source: NOS.
GDP and Gross Value added generated by the Tourism Industry (thousand Mio Dinars)
0
500
1 000
1 500
2 000
2 500
1985 1990 1991 1992 1993 1994 1995 1996 1997 1998
horeca Value Added of all Economic sectors
Source: NOS.
AA L G E R I A
Tourism Trends in Mediterranean countries 33
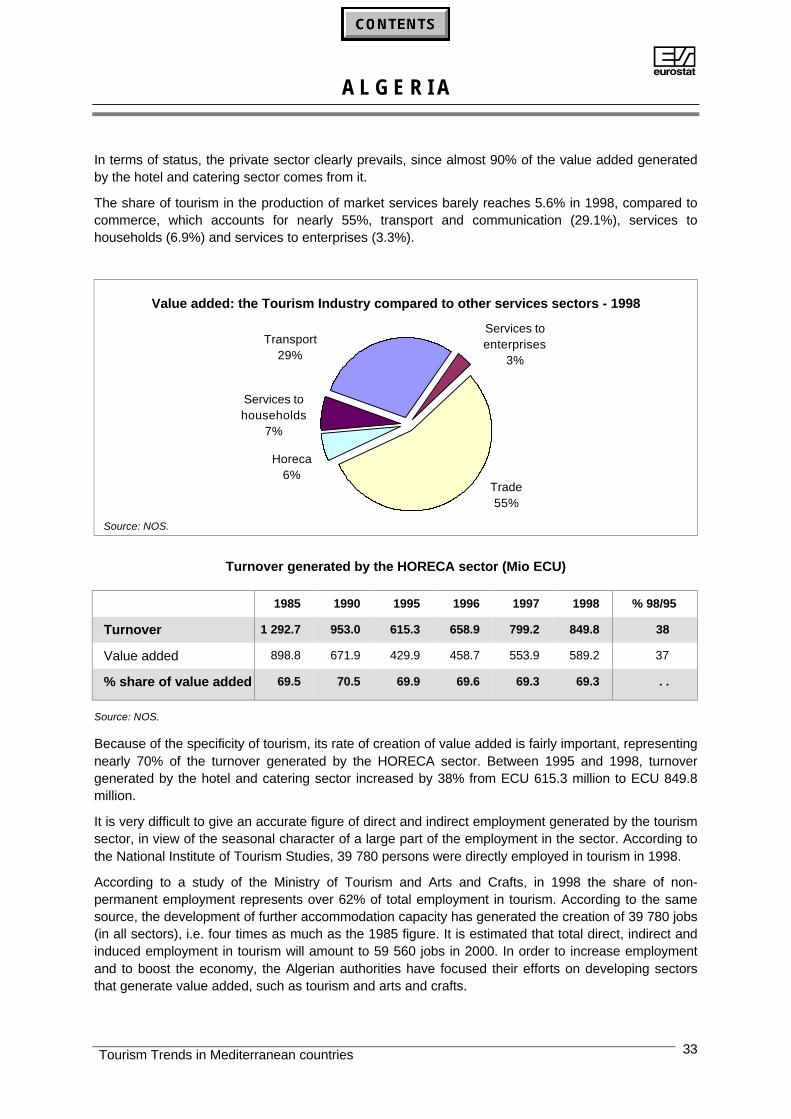
In terms of status, the private sector clearly prevails, since almost 90% of the value added generatedby the hotel and catering sector comes from it.
The share of tourism in the production of market services barely reaches 5.6% in 1998, compared tocommerce, which accounts for nearly 55%, transport and communication (29.1%), services tohouseholds (6.9%) and services to enterprises (3.3%).
Value added: the Tourism Industry compared to other services sectors - 1998
Services to households
7%
Horeca6%
Trade55%
Transport29%
Services to enterprises
3%
Source: NOS.
Turnover generated by the HORECA sector (Mio ECU)
1985 1990 1995 1996 1997 1998 % 98/95
Turnover 1 292.7 953.0 615.3 658.9 799.2 849.8 38
Value added 898.8 671.9 429.9 458.7 553.9 589.2 37
% share of value added 69.5 70.5 69.9 69.6 69.3 69.3 . .
Source: NOS.
Because of the specificity of tourism, its rate of creation of value added is fairly important, representingnearly 70% of the turnover generated by the HORECA sector. Between 1995 and 1998, turnovergenerated by the hotel and catering sector increased by 38% from ECU 615.3 million to ECU 849.8million.
It is very difficult to give an accurate figure of direct and indirect employment generated by the tourismsector, in view of the seasonal character of a large part of the employment in the sector. According tothe National Institute of Tourism Studies, 39 780 persons were directly employed in tourism in 1998.
According to a study of the Ministry of Tourism and Arts and Crafts, in 1998 the share of non-permanent employment represents over 62% of total employment in tourism. According to the samesource, the development of further accommodation capacity has generated the creation of 39 780 jobs(in all sectors), i.e. four times as much as the 1985 figure. It is estimated that total direct, indirect andinduced employment in tourism will amount to 59 560 jobs in 2000. In order to increase employmentand to boost the economy, the Algerian authorities have focused their efforts on developing sectorsthat generate value added, such as tourism and arts and crafts.
AA L G E R I A
Tourism Trends in Mediterranean countries34
With that perspective in mind, the Algerian State actively encourages local or international privateinvestments and has done so since the promulgation of the 93-12 decree of 5 October 1993 related tothe promotion of investment in the tourism field.
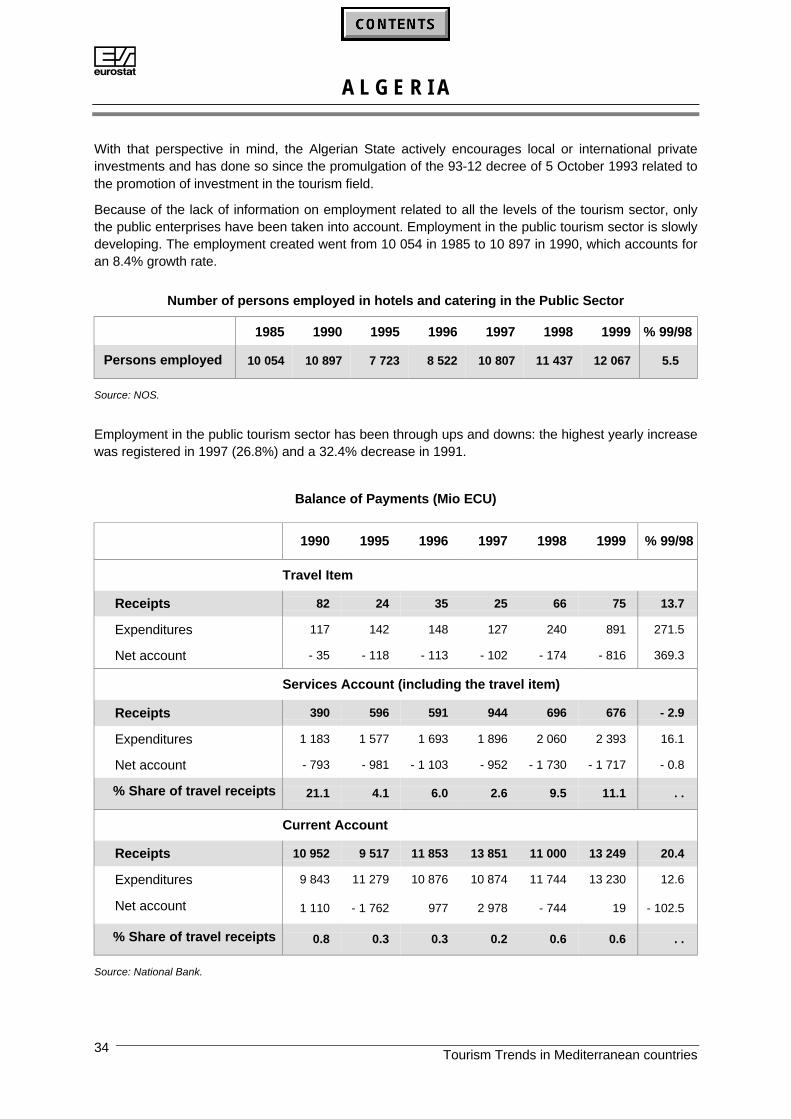
Because of the lack of information on employment related to all the levels of the tourism sector, onlythe public enterprises have been taken into account. Employment in the public tourism sector is slowlydeveloping. The employment created went from 10 054 in 1985 to 10 897 in 1990, which accounts foran 8.4% growth rate.
Number of persons employed in hotels and catering in the Public Sector
1985 1990 1995 1996 1997 1998 1999 % 99/98
Persons employed 10 054 10 897 7 723 8 522 10 807 11 437 12 067 5.5
Source: NOS.
Employment in the public tourism sector has been through ups and downs: the highest yearly increasewas registered in 1997 (26.8%) and a 32.4% decrease in 1991.
Balance of Payments (Mio ECU)
1990 1995 1996 1997 1998 1999 % 99/98
Travel Item
Receipts 82 24 35 25 66 75 13.7
Expenditures 117 142 148 127 240 891 271.5
Net account - 35 - 118 - 113 - 102 - 174 - 816 369.3
Services Account (including the travel item)
Receipts 390 596 591 944 696 676 - 2.9
Expenditures 1 183 1 577 1 693 1 896 2 060 2 393 16.1
Net account - 793 - 981 - 1 103 - 952 - 1 730 - 1 717 - 0.8
% Share of travel receipts 21.1 4.1 6.0 2.6 9.5 11.1 . .
Current Account
Receipts 10 952 9 517 11 853 13 851 11 000 13 249 20.4
Expenditures 9 843 11 279 10 876 10 874 11 744 13 230 12.6
Net account 1 110 - 1 762 977 2 978 - 744 19 - 102.5
% Share of travel receipts 0.8 0.3 0.3 0.2 0.6 0.6 . .
Source: National Bank.
AA L G E R I A
Tourism Trends in Mediterranean countries 35
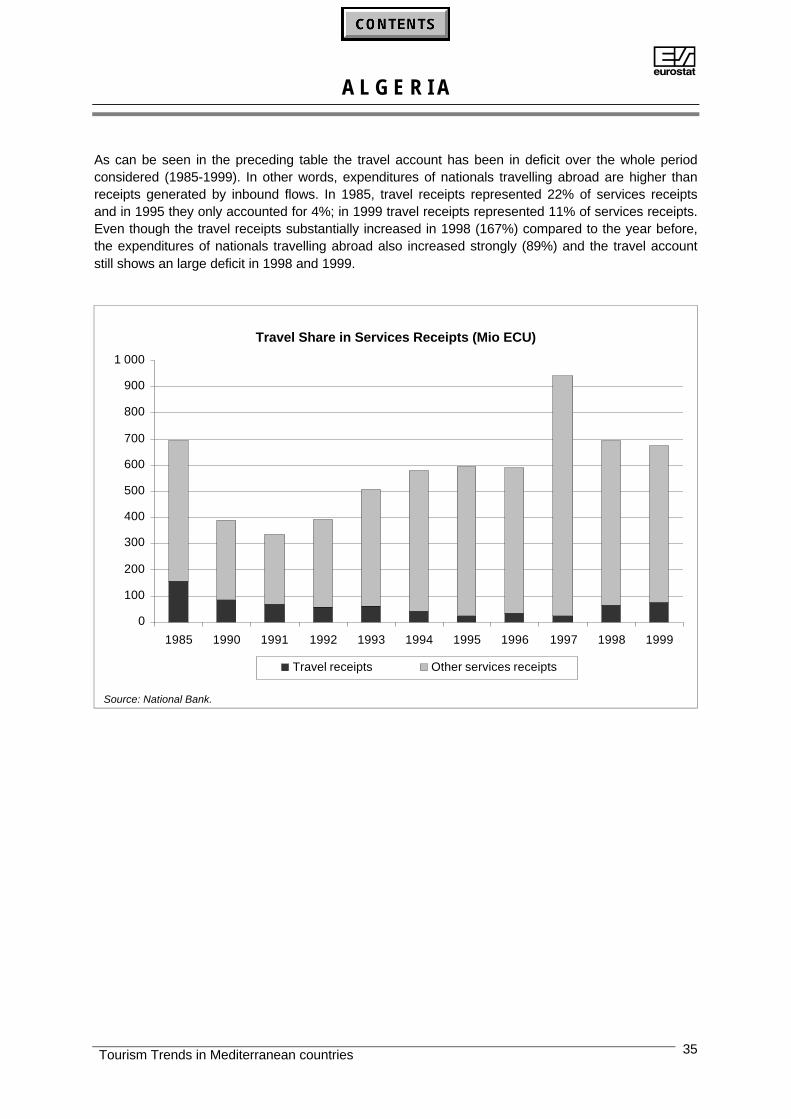
As can be seen in the preceding table the travel account has been in deficit over the whole periodconsidered (1985-1999). In other words, expenditures of nationals travelling abroad are higher thanreceipts generated by inbound flows. In 1985, travel receipts represented 22% of services receiptsand in 1995 they only accounted for 4%; in 1999 travel receipts represented 11% of services receipts.Even though the travel receipts substantially increased in 1998 (167%) compared to the year before,the expenditures of nationals travelling abroad also increased strongly (89%) and the travel accountstill shows an large deficit in 1998 and 1999.
Travel Share in Services Receipts (Mio ECU)
0
100
200
300
400
500
600
700
800
900
1 000
1985 1990 1991 1992 1993 1994 1995 1996 1997 1998 1999
Travel receipts Other services receipts
Source: National Bank.
AA L G E R I A
Tourism Trends in Mediterranean countries36
Part II: Tourism supply
Infrastructure and Accommodation Capacity
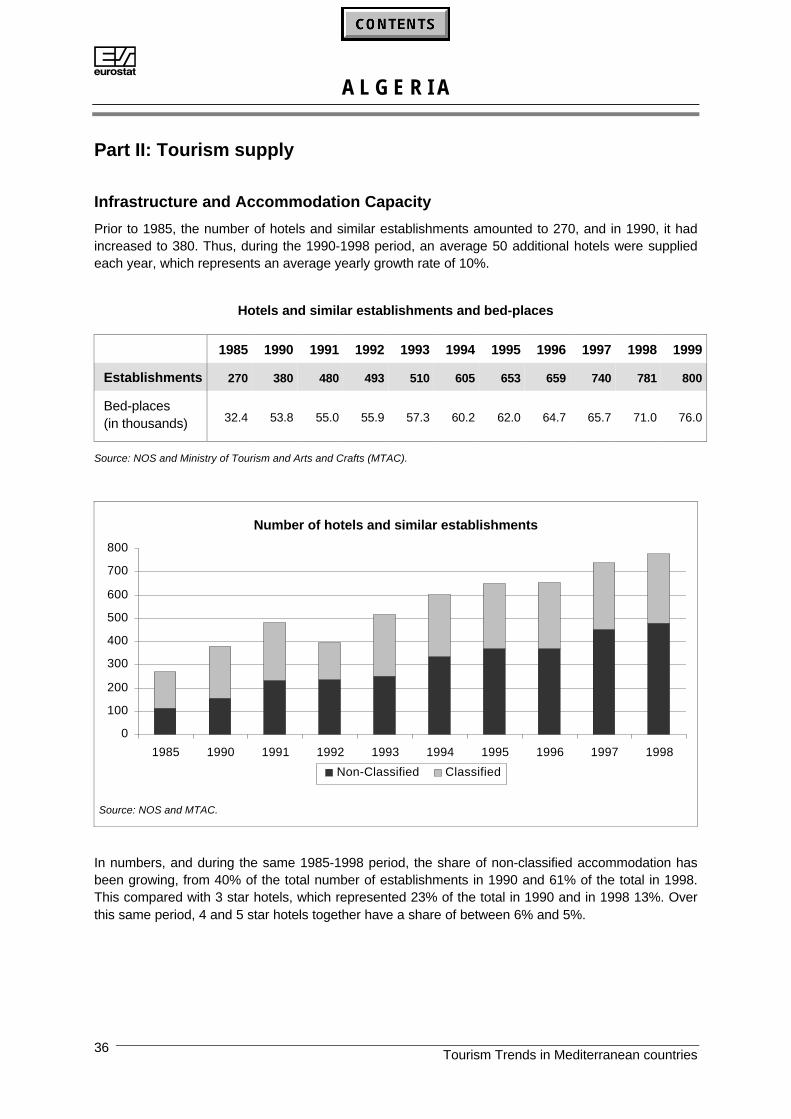
Prior to 1985, the number of hotels and similar establishments amounted to 270, and in 1990, it hadincreased to 380. Thus, during the 1990-1998 period, an average 50 additional hotels were suppliedeach year, which represents an average yearly growth rate of 10%.
Hotels and similar establishments and bed-places
1985 1990 1991 1992 1993 1994 1995 1996 1997 1998 1999
Establishments 270 380 480 493 510 605 653 659 740 781 800
Bed-places(in thousands) 32.4 53.8 55.0 55.9 57.3 60.2 62.0 64.7 65.7 71.0 76.0
Source: NOS and Ministry of Tourism and Arts and Crafts (MTAC).
Number of hotels and similar establishments
0
100
200
300
400
500
600
700
800
1985 1990 1991 1992 1993 1994 1995 1996 1997 1998
Non-Classified Classified
Source: NOS and MTAC.
In numbers, and during the same 1985-1998 period, the share of non-classified accommodation hasbeen growing, from 40% of the total number of establishments in 1990 and 61% of the total in 1998.This compared with 3 star hotels, which represented 23% of the total in 1990 and in 1998 13%. Overthis same period, 4 and 5 star hotels together have a share of between 6% and 5%.
AA L G E R I A
Tourism Trends in Mediterranean countries 37
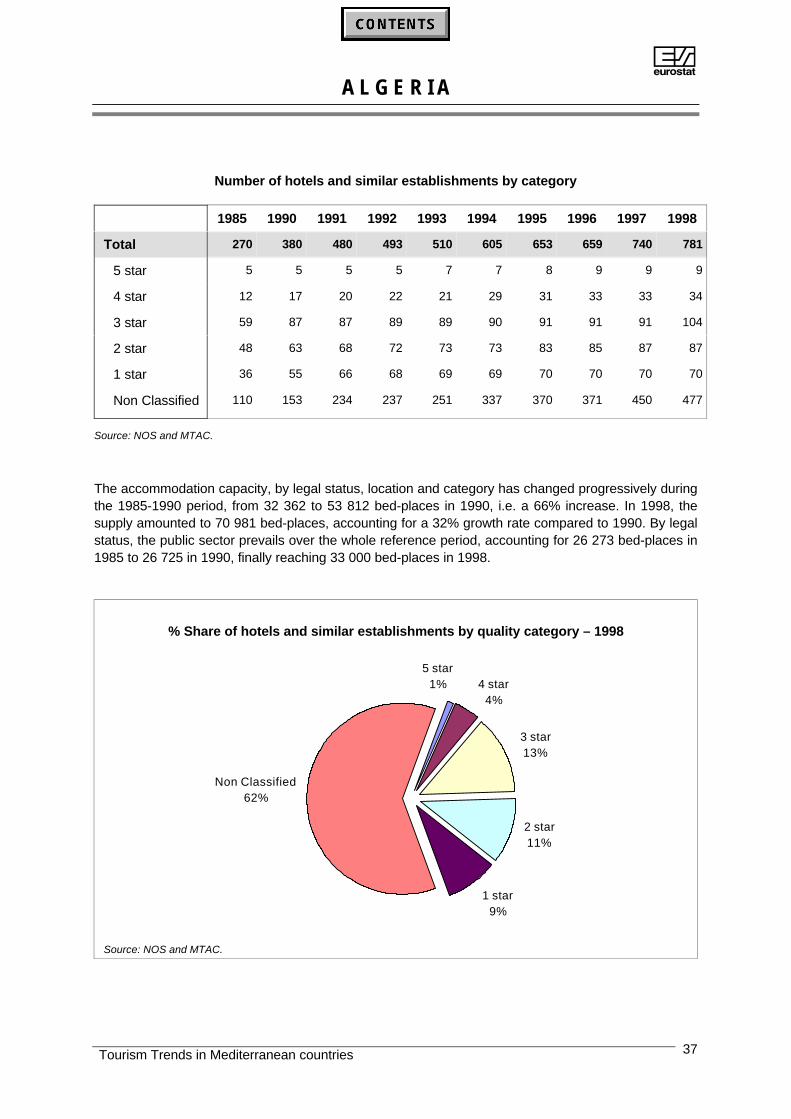
Number of hotels and similar establishments by category
1985 1990 1991 1992 1993 1994 1995 1996 1997 1998
Total 270 380 480 493 510 605 653 659 740 781
5 star 5 5 5 5 7 7 8 9 9 9
4 star 12 17 20 22 21 29 31 33 33 34
3 star 59 87 87 89 89 90 91 91 91 104
2 star 48 63 68 72 73 73 83 85 87 87
1 star 36 55 66 68 69 69 70 70 70 70
Non Classified 110 153 234 237 251 337 370 371 450 477
Source: NOS and MTAC.
The accommodation capacity, by legal status, location and category has changed progressively duringthe 1985-1990 period, from 32 362 to 53 812 bed-places in 1990, i.e. a 66% increase. In 1998, thesupply amounted to 70 981 bed-places, accounting for a 32% growth rate compared to 1990. By legalstatus, the public sector prevails over the whole reference period, accounting for 26 273 bed-places in1985 to 26 725 in 1990, finally reaching 33 000 bed-places in 1998.
% Share of hotels and similar establishments by quality category – 1998
Non Classified62%
1 star9%
2 star11%
3 star13%
5 star1% 4 star
4%
Source: NOS and MTAC.
AA L G E R I A
Tourism Trends in Mediterranean countries38
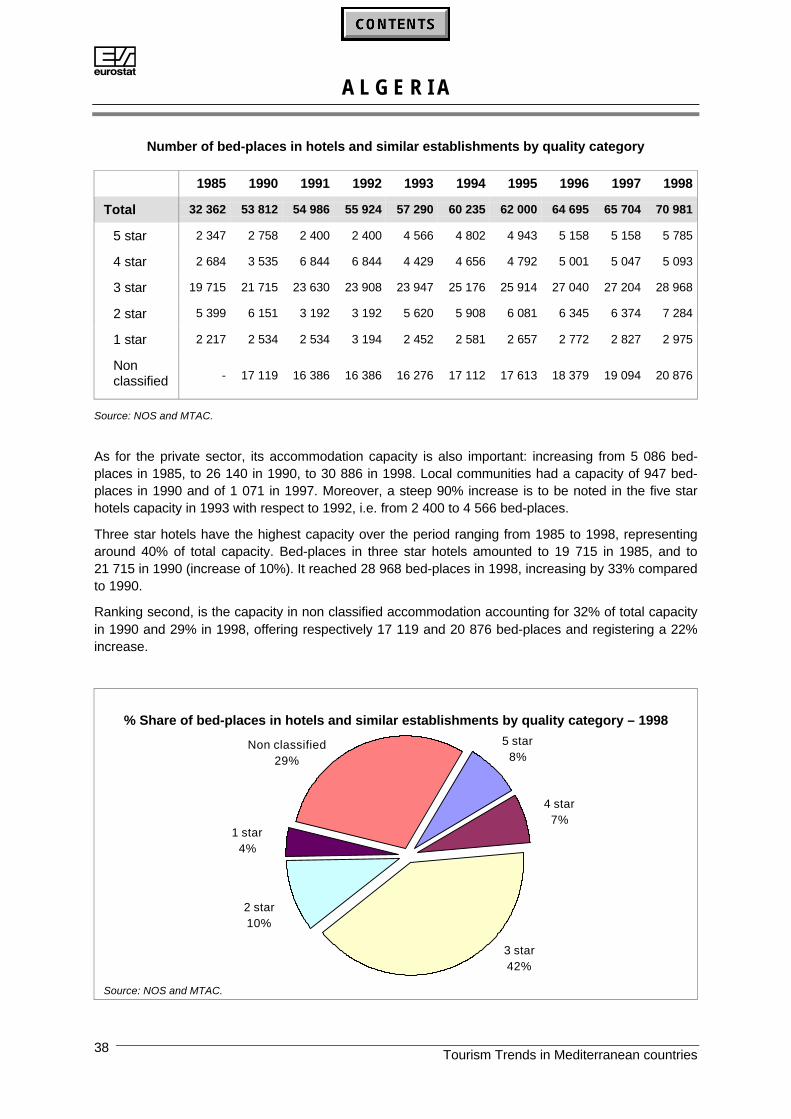
Number of bed-places in hotels and similar establishments by quality category
1985 1990 1991 1992 1993 1994 1995 1996 1997 1998
Total 32 362 53 812 54 986 55 924 57 290 60 235 62 000 64 695 65 704 70 981
5 star 2 347 2 758 2 400 2 400 4 566 4 802 4 943 5 158 5 158 5 785
4 star 2 684 3 535 6 844 6 844 4 429 4 656 4 792 5 001 5 047 5 093
3 star 19 715 21 715 23 630 23 908 23 947 25 176 25 914 27 040 27 204 28 968
2 star 5 399 6 151 3 192 3 192 5 620 5 908 6 081 6 345 6 374 7 284
1 star 2 217 2 534 2 534 3 194 2 452 2 581 2 657 2 772 2 827 2 975
Nonclassified - 17 119 16 386 16 386 16 276 17 112 17 613 18 379 19 094 20 876
Source: NOS and MTAC.
As for the private sector, its accommodation capacity is also important: increasing from 5 086 bed-places in 1985, to 26 140 in 1990, to 30 886 in 1998. Local communities had a capacity of 947 bed-places in 1990 and of 1 071 in 1997. Moreover, a steep 90% increase is to be noted in the five starhotels capacity in 1993 with respect to 1992, i.e. from 2 400 to 4 566 bed-places.
Three star hotels have the highest capacity over the period ranging from 1985 to 1998, representingaround 40% of total capacity. Bed-places in three star hotels amounted to 19 715 in 1985, and to21 715 in 1990 (increase of 10%). It reached 28 968 bed-places in 1998, increasing by 33% comparedto 1990.
Ranking second, is the capacity in non classified accommodation accounting for 32% of total capacityin 1990 and 29% in 1998, offering respectively 17 119 and 20 876 bed-places and registering a 22%increase.
% Share of bed-places in hotels and similar establishments by quality category – 1998
4 star7%
5 star8%
3 star42%
2 star10%
1 star4%
Non classified29%
Source: NOS and MTAC.
AA L G E R I A
Tourism Trends in Mediterranean countries 39
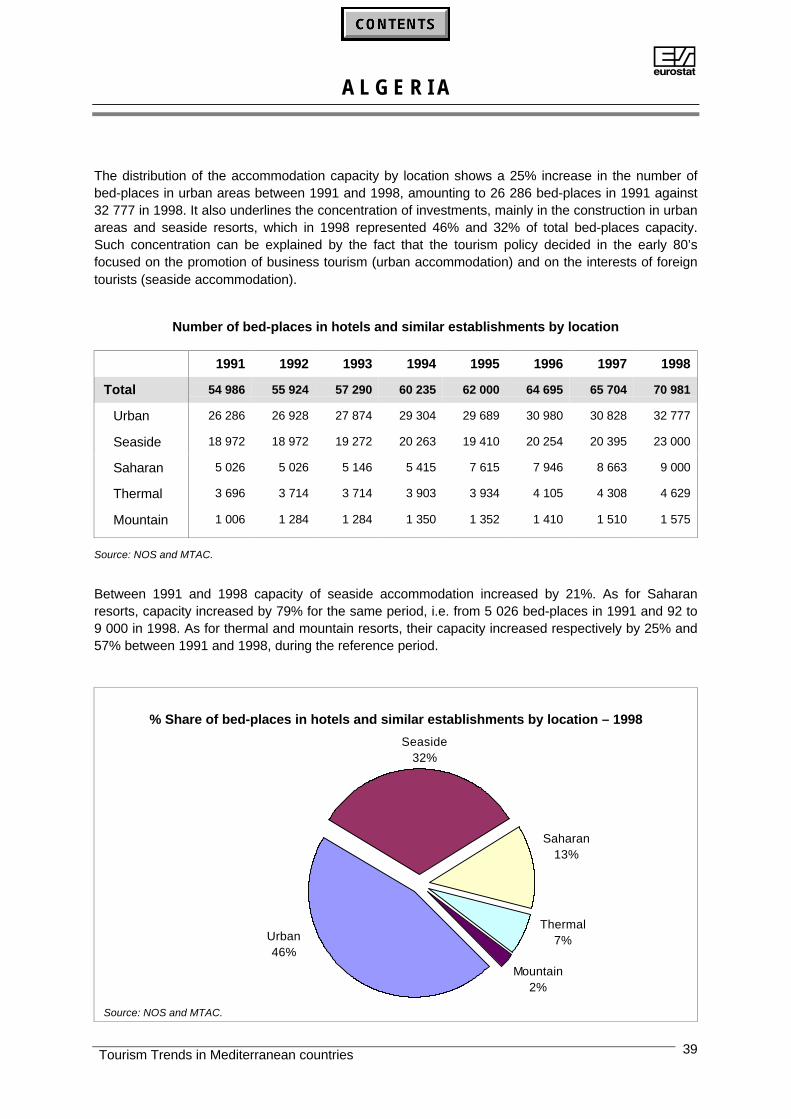
The distribution of the accommodation capacity by location shows a 25% increase in the number ofbed-places in urban areas between 1991 and 1998, amounting to 26 286 bed-places in 1991 against32 777 in 1998. It also underlines the concentration of investments, mainly in the construction in urbanareas and seaside resorts, which in 1998 represented 46% and 32% of total bed-places capacity.Such concentration can be explained by the fact that the tourism policy decided in the early 80’sfocused on the promotion of business tourism (urban accommodation) and on the interests of foreigntourists (seaside accommodation).
Number of bed-places in hotels and similar establishments by location
1991 1992 1993 1994 1995 1996 1997 1998
Total 54 986 55 924 57 290 60 235 62 000 64 695 65 704 70 981
Urban 26 286 26 928 27 874 29 304 29 689 30 980 30 828 32 777
Seaside 18 972 18 972 19 272 20 263 19 410 20 254 20 395 23 000
Saharan 5 026 5 026 5 146 5 415 7 615 7 946 8 663 9 000
Thermal 3 696 3 714 3 714 3 903 3 934 4 105 4 308 4 629
Mountain 1 006 1 284 1 284 1 350 1 352 1 410 1 510 1 575
Source: NOS and MTAC.
Between 1991 and 1998 capacity of seaside accommodation increased by 21%. As for Saharanresorts, capacity increased by 79% for the same period, i.e. from 5 026 bed-places in 1991 and 92 to9 000 in 1998. As for thermal and mountain resorts, their capacity increased respectively by 25% and57% between 1991 and 1998, during the reference period.
% Share of bed-places in hotels and similar establishments by location – 1998
Mountain2%
Thermal7%
Saharan13%
Urban46%
Seaside32%
Source: NOS and MTAC.
AA L G E R I A
Tourism Trends in Mediterranean countries40
Part III: Tourism demand
Occupancy of collective tourist accommodation establishments: inbound anddomestic tourism
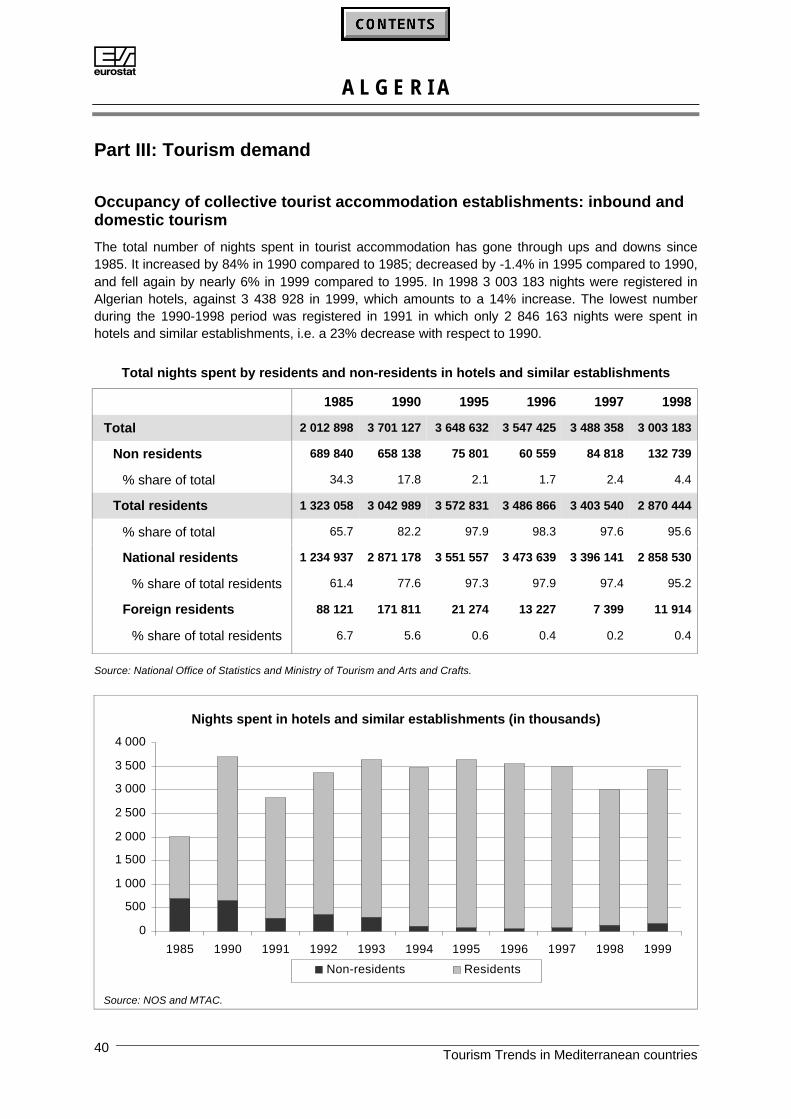
The total number of nights spent in tourist accommodation has gone through ups and downs since1985. It increased by 84% in 1990 compared to 1985; decreased by -1.4% in 1995 compared to 1990,and fell again by nearly 6% in 1999 compared to 1995. In 1998 3 003 183 nights were registered inAlgerian hotels, against 3 438 928 in 1999, which amounts to a 14% increase. The lowest numberduring the 1990-1998 period was registered in 1991 in which only 2 846 163 nights were spent inhotels and similar establishments, i.e. a 23% decrease with respect to 1990.
Total nights spent by residents and non-residents in hotels and similar establishments
1985 1990 1995 1996 1997 1998
Total 2 012 898 3 701 127 3 648 632 3 547 425 3 488 358 3 003 183
Non residents 689 840 658 138 75 801 60 559 84 818 132 739
% share of total 34.3 17.8 2.1 1.7 2.4 4.4
Total residents 1 323 058 3 042 989 3 572 831 3 486 866 3 403 540 2 870 444
% share of total 65.7 82.2 97.9 98.3 97.6 95.6
National residents 1 234 937 2 871 178 3 551 557 3 473 639 3 396 141 2 858 530
% share of total residents 61.4 77.6 97.3 97.9 97.4 95.2
Foreign residents 88 121 171 811 21 274 13 227 7 399 11 914
% share of total residents 6.7 5.6 0.6 0.4 0.2 0.4
Source: National Office of Statistics and Ministry of Tourism and Arts and Crafts.
Nights spent in hotels and similar establishments (in thousands)
0
500
1 000
1 500
2 000
2 500
3 000
3 500
4 000
1985 1990 1991 1992 1993 1994 1995 1996 1997 1998 1999
Non-residents Residents
Source: NOS and MTAC.
AA L G E R I A
Tourism Trends in Mediterranean countries 41
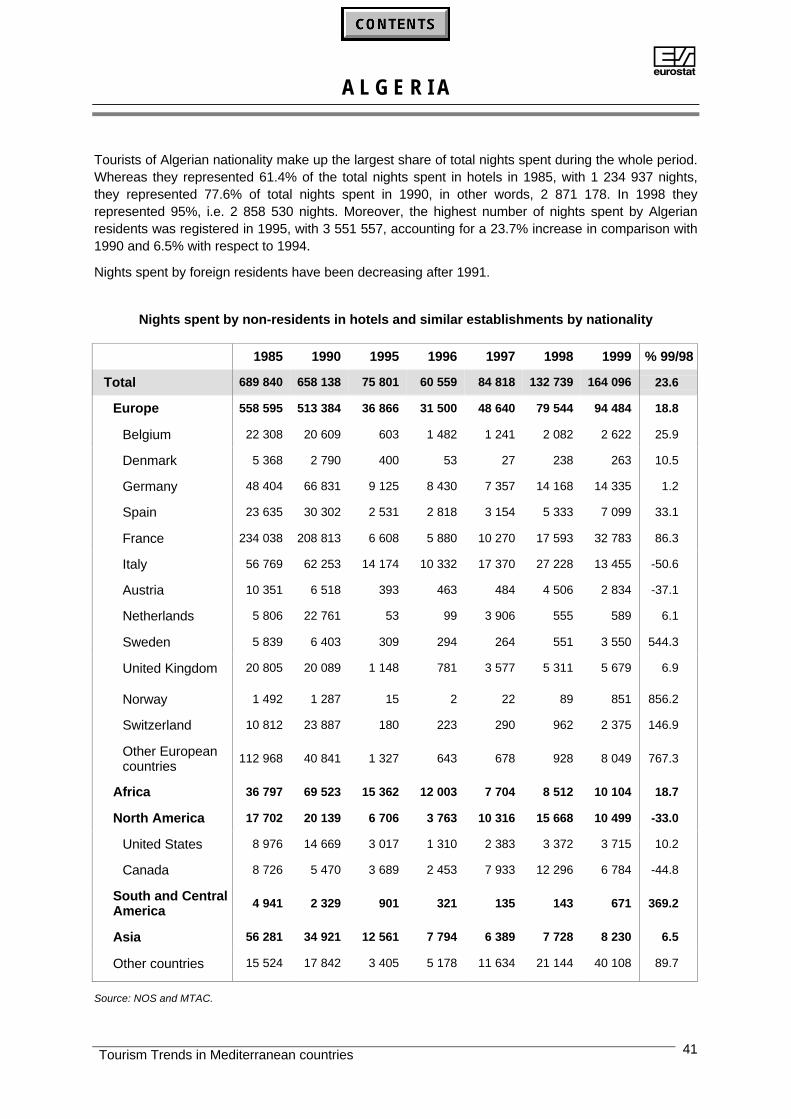
Tourists of Algerian nationality make up the largest share of total nights spent during the whole period.Whereas they represented 61.4% of the total nights spent in hotels in 1985, with 1 234 937 nights,they represented 77.6% of total nights spent in 1990, in other words, 2 871 178. In 1998 theyrepresented 95%, i.e. 2 858 530 nights. Moreover, the highest number of nights spent by Algerianresidents was registered in 1995, with 3 551 557, accounting for a 23.7% increase in comparison with1990 and 6.5% with respect to 1994.
Nights spent by foreign residents have been decreasing after 1991.
Nights spent by non-residents in hotels and similar establishments by nationality
1985 1990 1995 1996 1997 1998 1999 % 99/98
Total 689 840 658 138 75 801 60 559 84 818 132 739 164 096 23.6
Europe 558 595 513 384 36 866 31 500 48 640 79 544 94 484 18.8
Belgium 22 308 20 609 603 1 482 1 241 2 082 2 622 25.9
Denmark 5 368 2 790 400 53 27 238 263 10.5
Germany 48 404 66 831 9 125 8 430 7 357 14 168 14 335 1.2
Spain 23 635 30 302 2 531 2 818 3 154 5 333 7 099 33.1
France 234 038 208 813 6 608 5 880 10 270 17 593 32 783 86.3
Italy 56 769 62 253 14 174 10 332 17 370 27 228 13 455 -50.6
Austria 10 351 6 518 393 463 484 4 506 2 834 -37.1
Netherlands 5 806 22 761 53 99 3 906 555 589 6.1
Sweden 5 839 6 403 309 294 264 551 3 550 544.3
United Kingdom 20 805 20 089 1 148 781 3 577 5 311 5 679 6.9
Norway 1 492 1 287 15 2 22 89 851 856.2
Switzerland 10 812 23 887 180 223 290 962 2 375 146.9
Other Europeancountries
112 968 40 841 1 327 643 678 928 8 049 767.3
Africa 36 797 69 523 15 362 12 003 7 704 8 512 10 104 18.7
North America 17 702 20 139 6 706 3 763 10 316 15 668 10 499 -33.0
United States 8 976 14 669 3 017 1 310 2 383 3 372 3 715 10.2
Canada 8 726 5 470 3 689 2 453 7 933 12 296 6 784 -44.8
South and CentralAmerica
4 941 2 329 901 321 135 143 671 369.2
Asia 56 281 34 921 12 561 7 794 6 389 7 728 8 230 6.5
Other countries 15 524 17 842 3 405 5 178 11 634 21 144 40 108 89.7
Source: NOS and MTAC.
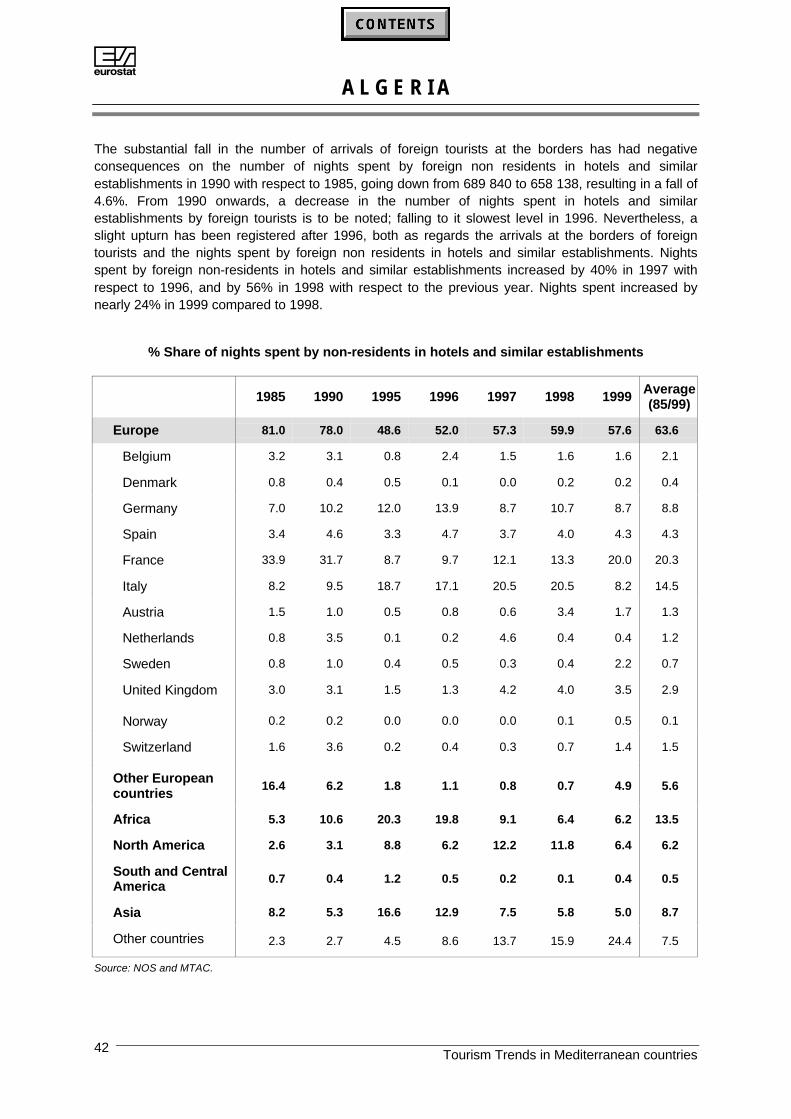
AA L G E R I A
Tourism Trends in Mediterranean countries42
The substantial fall in the number of arrivals of foreign tourists at the borders has had negativeconsequences on the number of nights spent by foreign non residents in hotels and similarestablishments in 1990 with respect to 1985, going down from 689 840 to 658 138, resulting in a fall of4.6%. From 1990 onwards, a decrease in the number of nights spent in hotels and similarestablishments by foreign tourists is to be noted; falling to it slowest level in 1996. Nevertheless, aslight upturn has been registered after 1996, both as regards the arrivals at the borders of foreigntourists and the nights spent by foreign non residents in hotels and similar establishments. Nightsspent by foreign non-residents in hotels and similar establishments increased by 40% in 1997 withrespect to 1996, and by 56% in 1998 with respect to the previous year. Nights spent increased bynearly 24% in 1999 compared to 1998.
% Share of nights spent by non-residents in hotels and similar establishments
1985 1990 1995 1996 1997 1998 1999 Average(85/99)
Europe 81.0 78.0 48.6 52.0 57.3 59.9 57.6 63.6
Belgium 3.2 3.1 0.8 2.4 1.5 1.6 1.6 2.1
Denmark 0.8 0.4 0.5 0.1 0.0 0.2 0.2 0.4
Germany 7.0 10.2 12.0 13.9 8.7 10.7 8.7 8.8
Spain 3.4 4.6 3.3 4.7 3.7 4.0 4.3 4.3
France 33.9 31.7 8.7 9.7 12.1 13.3 20.0 20.3
Italy 8.2 9.5 18.7 17.1 20.5 20.5 8.2 14.5
Austria 1.5 1.0 0.5 0.8 0.6 3.4 1.7 1.3
Netherlands 0.8 3.5 0.1 0.2 4.6 0.4 0.4 1.2
Sweden 0.8 1.0 0.4 0.5 0.3 0.4 2.2 0.7
United Kingdom 3.0 3.1 1.5 1.3 4.2 4.0 3.5 2.9
Norway 0.2 0.2 0.0 0.0 0.0 0.1 0.5 0.1
Switzerland 1.6 3.6 0.2 0.4 0.3 0.7 1.4 1.5
Other Europeancountries
16.4 6.2 1.8 1.1 0.8 0.7 4.9 5.6
Africa 5.3 10.6 20.3 19.8 9.1 6.4 6.2 13.5
North America 2.6 3.1 8.8 6.2 12.2 11.8 6.4 6.2
South and CentralAmerica
0.7 0.4 1.2 0.5 0.2 0.1 0.4 0.5
Asia 8.2 5.3 16.6 12.9 7.5 5.8 5.0 8.7
Other countries 2.3 2.7 4.5 8.6 13.7 15.9 24.4 7.5
Source: NOS and MTAC.
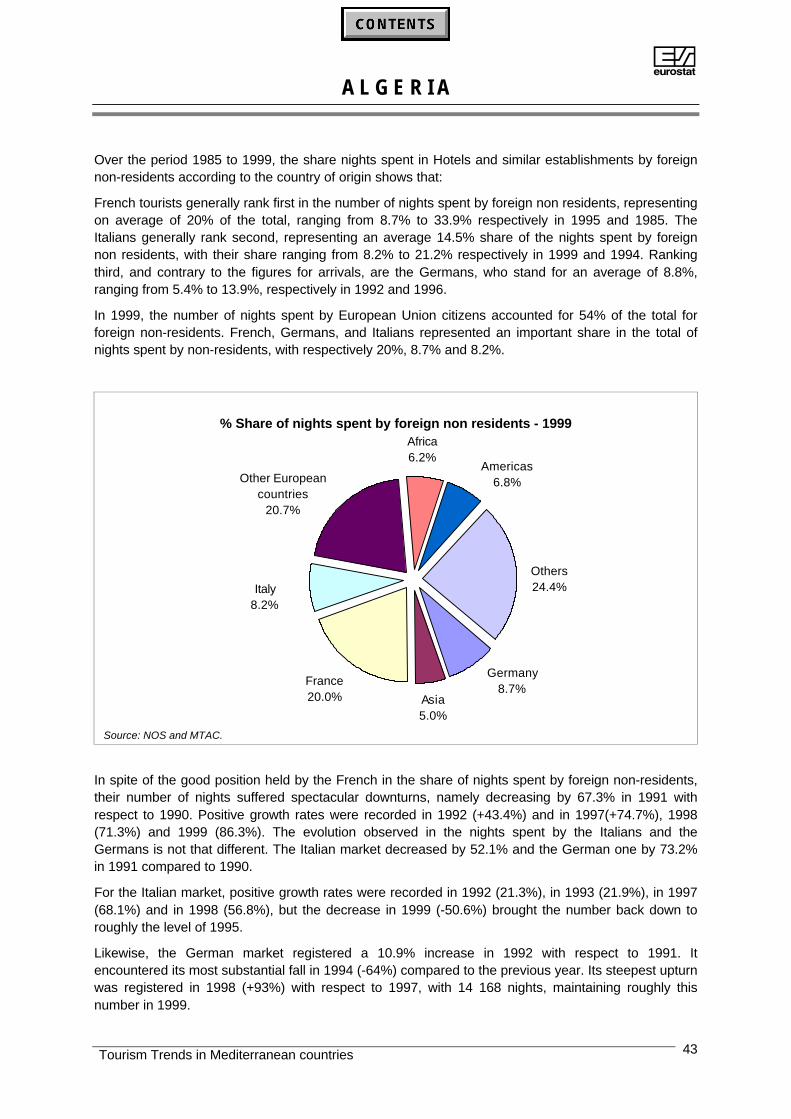
AA L G E R I A
Tourism Trends in Mediterranean countries 43
Over the period 1985 to 1999, the share nights spent in Hotels and similar establishments by foreignnon-residents according to the country of origin shows that:
French tourists generally rank first in the number of nights spent by foreign non residents, representingon average of 20% of the total, ranging from 8.7% to 33.9% respectively in 1995 and 1985. TheItalians generally rank second, representing an average 14.5% share of the nights spent by foreignnon residents, with their share ranging from 8.2% to 21.2% respectively in 1999 and 1994. Rankingthird, and contrary to the figures for arrivals, are the Germans, who stand for an average of 8.8%,ranging from 5.4% to 13.9%, respectively in 1992 and 1996.
In 1999, the number of nights spent by European Union citizens accounted for 54% of the total forforeign non-residents. French, Germans, and Italians represented an important share in the total ofnights spent by non-residents, with respectively 20%, 8.7% and 8.2%.
% Share of nights spent by foreign non residents - 1999
Asia5.0%
Germany8.7%
France20.0%
Italy8.2%
Other European countries
20.7%
Africa6.2%
Americas6.8%
Others24.4%
Source: NOS and MTAC.
In spite of the good position held by the French in the share of nights spent by foreign non-residents,their number of nights suffered spectacular downturns, namely decreasing by 67.3% in 1991 withrespect to 1990. Positive growth rates were recorded in 1992 (+43.4%) and in 1997(+74.7%), 1998(71.3%) and 1999 (86.3%). The evolution observed in the nights spent by the Italians and theGermans is not that different. The Italian market decreased by 52.1% and the German one by 73.2%in 1991 compared to 1990.
For the Italian market, positive growth rates were recorded in 1992 (21.3%), in 1993 (21.9%), in 1997(68.1%) and in 1998 (56.8%), but the decrease in 1999 (-50.6%) brought the number back down toroughly the level of 1995.
Likewise, the German market registered a 10.9% increase in 1992 with respect to 1991. Itencountered its most substantial fall in 1994 (-64%) compared to the previous year. Its steepest upturnwas registered in 1998 (+93%) with respect to 1997, with 14 168 nights, maintaining roughly thisnumber in 1999.

AA L G E R I A
Tourism Trends in Mediterranean countries44
Tourism demand: Inbound and National Tourism
The number of arrivals of visitors at the borders substantially dropped during the nineties, reaching thelowest level in 1995 (519 576 arrivals). Since then it has picked up to amount to 748 537 visitors in1999 (increase of 44%).
Arrivals of visitors from abroad by nationality
1992 1993 1994 1995 1996 1997 1998 1999
Total 1 119 548 1 127 545 804 713 519 576 604 968 634 752 678 448 748 537
Nationals residingabroad
495 452 555 552 468 487 421 926 511 477 539 920 571 235 607 675
Foreign visitors 624 096 571 993 336 226 97 650 93 491 94 832 107 213 140 862
Europe 151 180 144 248 60 383 37 826 45 570 48 440 56 509 72 573
EU15 136 907 130 378 55 909 34 561 43 503 45 733 53 461 67 836
Belgium 3 645 3 251 756 508 679 742 1 032 1 605
Denmark 710 838 189 93 71 57 160 229
Germany 9 314 7 781 2 416 1 398 1 467 1 554 1 721 3 168
Greece 616 718 341 237 132 128 156 219
Spain 6 417 7 878 2 137 1 621 1 826 3 664 5 518 4 652
France 92 053 88 788 38 581 26 349 35 214 34 690 38 357 49 559
Italy 14 392 12 529 8 788 2 791 2 541 2 555 3 419 4 483
Luxembourg 98 86 41 27 30 14 28 42
Netherlands 1 618 1 217 300 117 244 303 432 753
Portugal 761 555 210 122 185 162 257 520
United Kingdom 4 449 4 422 1 399 935 735 1 435 1 829 1 785
Austria 1 462 1 143 386 114 137 169 255 337
Finland 334 294 77 26 28 39 38 54
Sweden 1 038 878 288 223 214 221 259 430
Norway 219 172 77 35 26 53 90 186
Switzerland 3 884 3 280 801 353 513 576 885 1 132
Other Europeancountries
10 170 10 418 3 596 2 877 1 528 2 078 2 073 3 419
Africa 450 814 405 547 263 135 50 576 41 378 39 638 41 689 55 481
North America 4 169 4 396 2 385 1 702 1 623 1 725 2 081 2 293
South andCentral America
977 720 428 303 147 113 216 270
Asia 16 377 16 722 9 739 7 193 4 751 4 846 6 594 10 116
Australia,Oceania andother territories
579 360 156 50 22 70 124 129
Source: NOS.
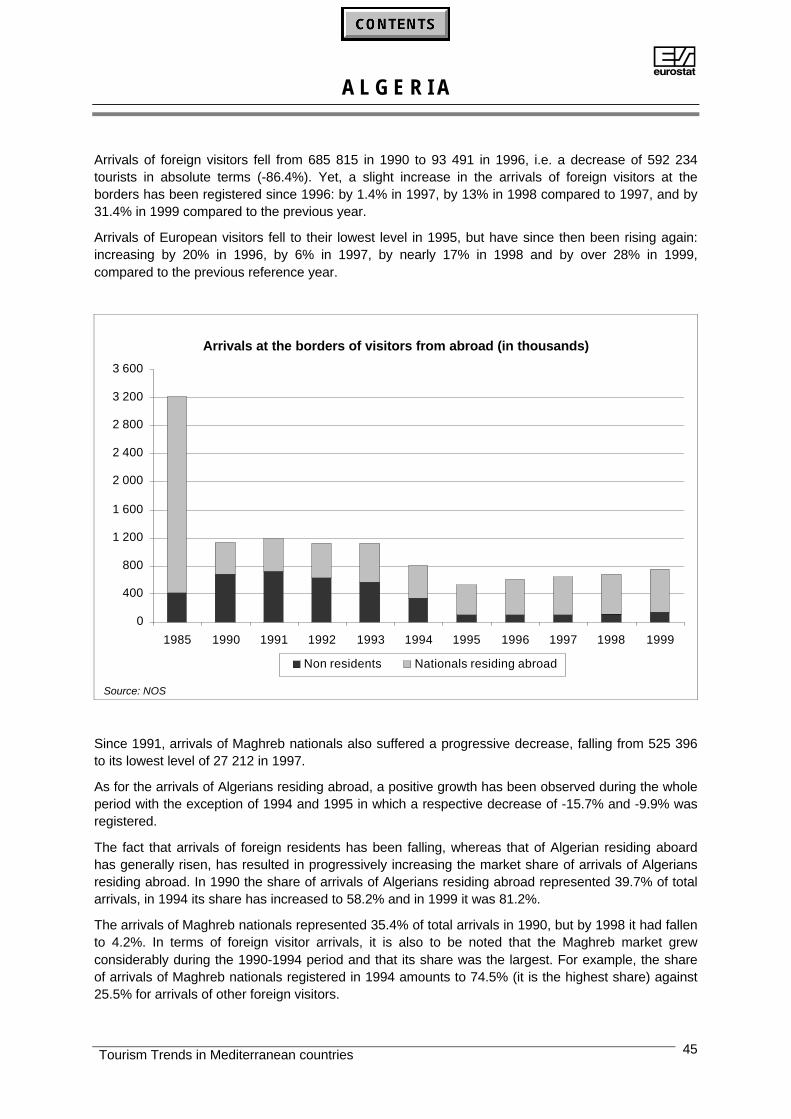
AA L G E R I A
Tourism Trends in Mediterranean countries 45
Arrivals of foreign visitors fell from 685 815 in 1990 to 93 491 in 1996, i.e. a decrease of 592 234tourists in absolute terms (-86.4%). Yet, a slight increase in the arrivals of foreign visitors at theborders has been registered since 1996: by 1.4% in 1997, by 13% in 1998 compared to 1997, and by31.4% in 1999 compared to the previous year.
Arrivals of European visitors fell to their lowest level in 1995, but have since then been rising again:increasing by 20% in 1996, by 6% in 1997, by nearly 17% in 1998 and by over 28% in 1999,compared to the previous reference year.
Arrivals at the borders of visitors from abroad (in thousands)
0
400
800
1 200
1 600
2 000
2 400
2 800
3 200
3 600
1985 1990 1991 1992 1993 1994 1995 1996 1997 1998 1999
Non residents Nationals residing abroad
Source: NOS
Since 1991, arrivals of Maghreb nationals also suffered a progressive decrease, falling from 525 396to its lowest level of 27 212 in 1997.
As for the arrivals of Algerians residing abroad, a positive growth has been observed during the wholeperiod with the exception of 1994 and 1995 in which a respective decrease of -15.7% and -9.9% wasregistered.
The fact that arrivals of foreign residents has been falling, whereas that of Algerian residing aboardhas generally risen, has resulted in progressively increasing the market share of arrivals of Algeriansresiding abroad. In 1990 the share of arrivals of Algerians residing abroad represented 39.7% of totalarrivals, in 1994 its share has increased to 58.2% and in 1999 it was 81.2%.
The arrivals of Maghreb nationals represented 35.4% of total arrivals in 1990, but by 1998 it had fallento 4.2%. In terms of foreign visitor arrivals, it is also to be noted that the Maghreb market grewconsiderably during the 1990-1994 period and that its share was the largest. For example, the shareof arrivals of Maghreb nationals registered in 1994 amounts to 74.5% (it is the highest share) against25.5% for arrivals of other foreign visitors.
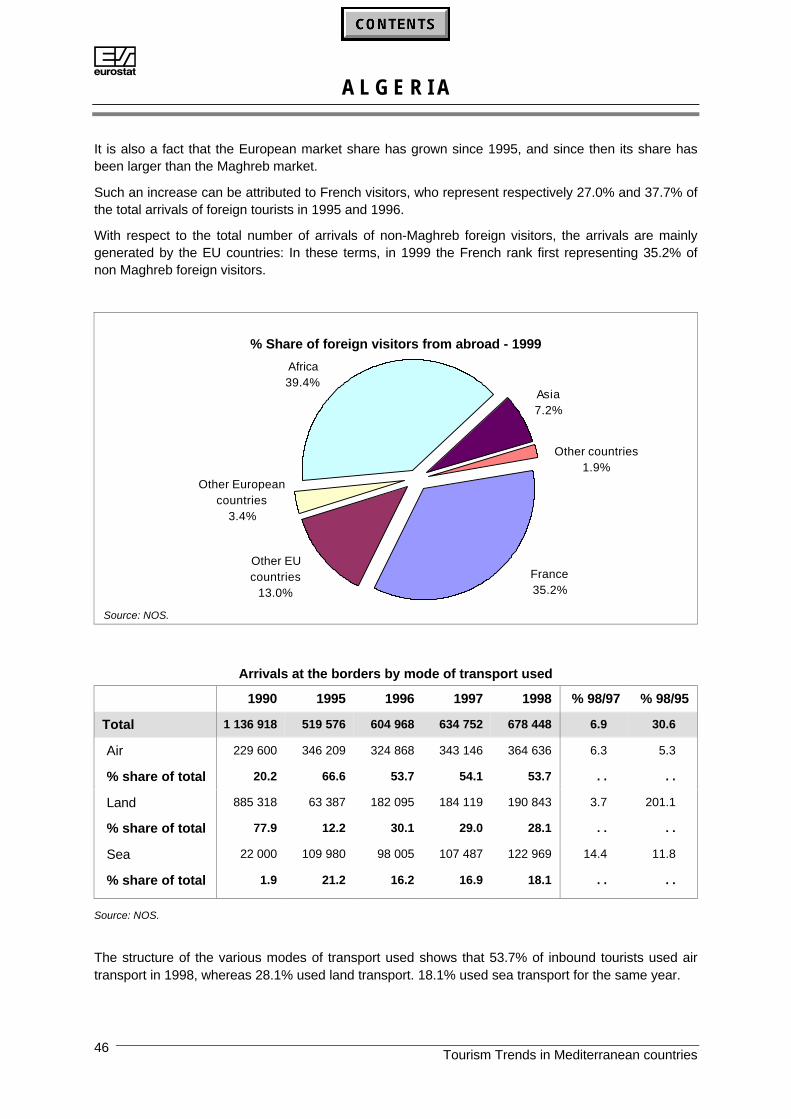
AA L G E R I A
Tourism Trends in Mediterranean countries46
It is also a fact that the European market share has grown since 1995, and since then its share hasbeen larger than the Maghreb market.
Such an increase can be attributed to French visitors, who represent respectively 27.0% and 37.7% ofthe total arrivals of foreign tourists in 1995 and 1996.
With respect to the total number of arrivals of non-Maghreb foreign visitors, the arrivals are mainlygenerated by the EU countries: In these terms, in 1999 the French rank first representing 35.2% ofnon Maghreb foreign visitors.
% Share of foreign visitors from abroad - 1999
Other countries1.9%
Asia7.2%
Africa39.4%
Other European countries
3.4%
France35.2%
Other EU countries
13.0%
Source: NOS.
Arrivals at the borders by mode of transport used
1990 1995 1996 1997 1998 % 98/97 % 98/95
Total 1 136 918 519 576 604 968 634 752 678 448 6.9 30.6
Air 229 600 346 209 324 868 343 146 364 636 6.3 5.3
% share of total 20.2 66.6 53.7 54.1 53.7 . . . .
Land 885 318 63 387 182 095 184 119 190 843 3.7 201.1
% share of total 77.9 12.2 30.1 29.0 28.1 . . . .
Sea 22 000 109 980 98 005 107 487 122 969 14.4 11.8
% share of total 1.9 21.2 16.2 16.9 18.1 . . . .
Source: NOS.
The structure of the various modes of transport used shows that 53.7% of inbound tourists used airtransport in 1998, whereas 28.1% used land transport. 18.1% used sea transport for the same year.

AA L G E R I A
Tourism Trends in Mediterranean countries 47
The number of tourists arriving by way of land transport increased after 1996, after a severe decreasein 1995, year in which it represented a mere 12.2% of the total of arrivals.
During the 1990-1993 period, the number of tourists arriving by land means was much higher thanthose using other modes of transport, representing 77.9% of the total in 1990. The number of touristarrivals by sea has remained fairly stable since 1991.
Arrivals of visitors - breakdown by mode of transport (in thousands)
0
200
400
600
800
1 000
1990 1991 1992 1993 1994 1995 1996 1997
Air Land Sea
Source: NOS.
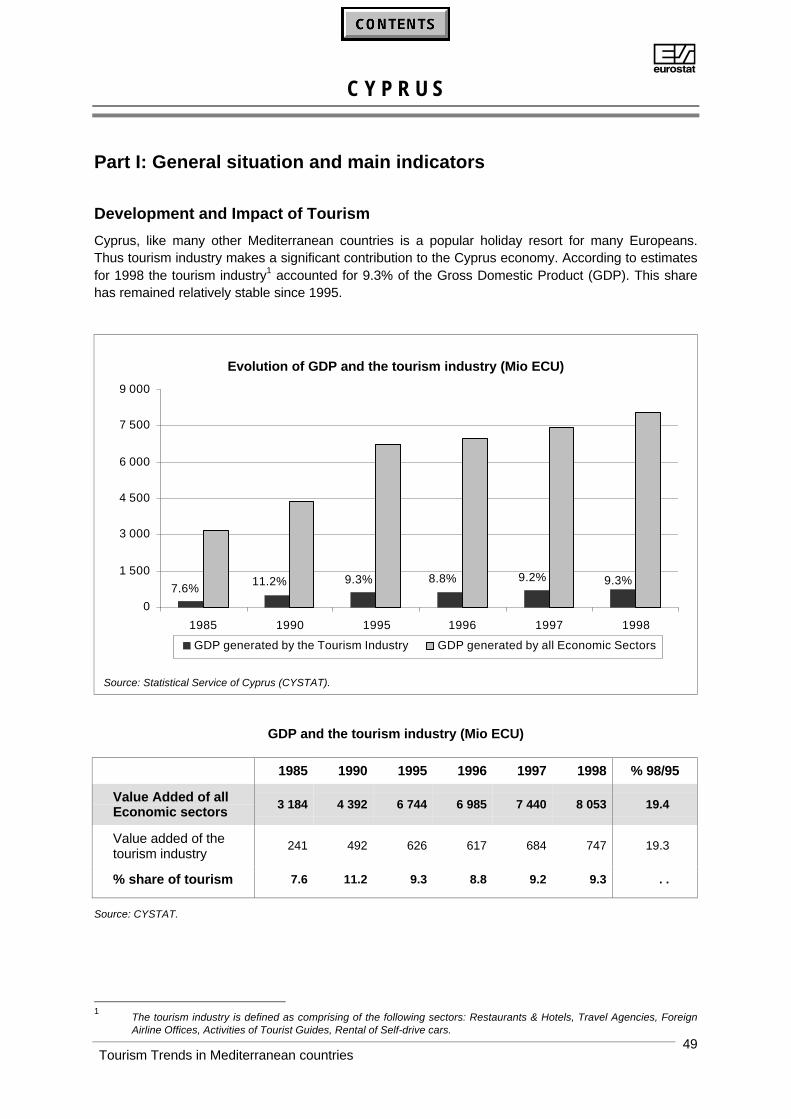
AC Y P R U S
Tourism Trends in Mediterranean countries49
Part I: General situation and main indicators
Development and Impact of Tourism
Cyprus, like many other Mediterranean countries is a popular holiday resort for many Europeans.Thus tourism industry makes a significant contribution to the Cyprus economy. According to estimatesfor 1998 the tourism industry1 accounted for 9.3% of the Gross Domestic Product (GDP). This sharehas remained relatively stable since 1995.
Evolution of GDP and the tourism industry (Mio ECU)
9.3%9.2%8.8%9.3%11.2%7.6%
0
1 500
3 000
4 500
6 000
7 500
9 000
1985 1990 1995 1996 1997 1998
GDP generated by the Tourism Industry GDP generated by all Economic Sectors
Source: Statistical Service of Cyprus (CYSTAT).
GDP and the tourism industry (Mio ECU)
1985 1990 1995 1996 1997 1998 % 98/95
Value Added of allEconomic sectors
3 184 4 392 6 744 6 985 7 440 8 053 19.4
Value added of thetourism industry
241 492 626 617 684 747 19.3
% share of tourism 7.6 11.2 9.3 8.8 9.2 9.3 . .
Source: CYSTAT.
1
The tourism industry is defined as comprising of the following sectors: Restaurants & Hotels, Travel Agencies, ForeignAirline Offices, Activities of Tourist Guides, Rental of Self-drive cars.
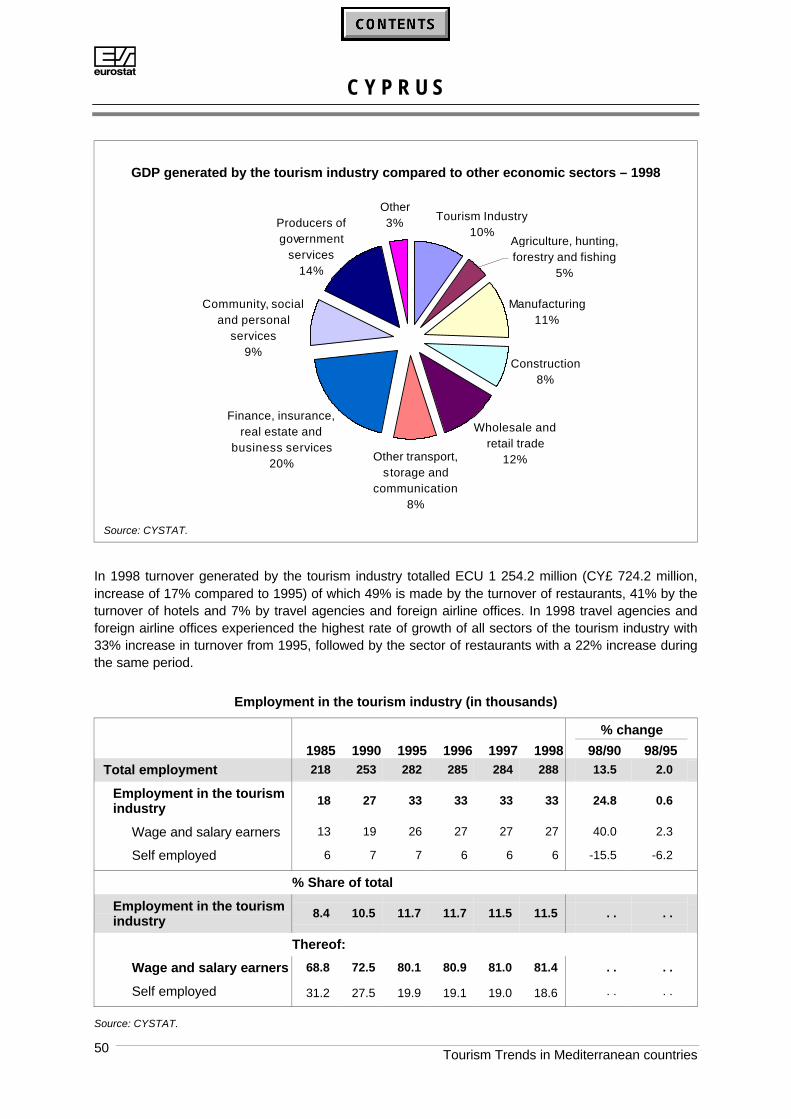
AC Y P R U S
Tourism Trends in Mediterranean countries50
GDP generated by the tourism industry compared to other economic sectors – 1998
Agriculture, hunting, forestry and fishing
5%
Tourism Industry10%
Other 3%
Manufacturing11%
Construction8%
Wholesale and retail trade
12%Other transport, storage and
communication8%
Finance, insurance, real estate and
business services20%
Community, social and personal
services9%
Producers of government
services14%
Source: CYSTAT.
In 1998 turnover generated by the tourism industry totalled ECU 1 254.2 million (CY£ 724.2 million,increase of 17% compared to 1995) of which 49% is made by the turnover of restaurants, 41% by theturnover of hotels and 7% by travel agencies and foreign airline offices. In 1998 travel agencies andforeign airline offices experienced the highest rate of growth of all sectors of the tourism industry with33% increase in turnover from 1995, followed by the sector of restaurants with a 22% increase duringthe same period.
Employment in the tourism industry (in thousands)
% change
1985 1990 1995 1996 1997 1998 98/90 98/95Total employment 218 253 282 285 284 288 13.5 2.0
Employment in the tourismindustry
18 27 33 33 33 33 24.8 0.6
Wage and salary earners 13 19 26 27 27 27 40.0 2.3
Self employed 6 7 7 6 6 6 -15.5 -6.2
% Share of total
Employment in the tourismindustry
8.4 10.5 11.7 11.7 11.5 11.5 . . . .
Thereof:
Wage and salary earners 68.8 72.5 80.1 80.9 81.0 81.4 . . . .
Self employed 31.2 27.5 19.9 19.1 19.0 18.6 . . . .
Source: CYSTAT.
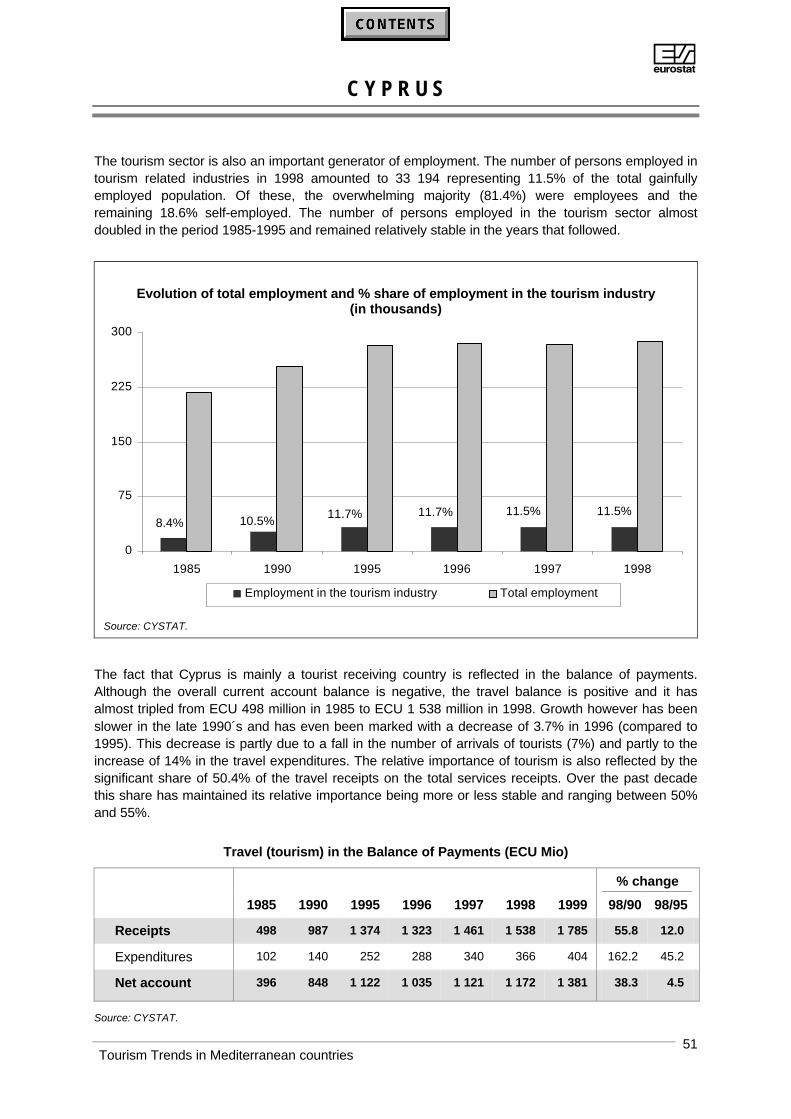
AC Y P R U S
Tourism Trends in Mediterranean countries51
The tourism sector is also an important generator of employment. The number of persons employed intourism related industries in 1998 amounted to 33 194 representing 11.5% of the total gainfullyemployed population. Of these, the overwhelming majority (81.4%) were employees and theremaining 18.6% self-employed. The number of persons employed in the tourism sector almostdoubled in the period 1985-1995 and remained relatively stable in the years that followed.
Evolution of total employment and % share of employment in the tourism industry(in thousands)
11.5% 11.5%11.7%11.7%8.4% 10.5%
0
75
150
225
300
1985 1990 1995 1996 1997 1998
Employment in the tourism industry Total employment
Source: CYSTAT.
The fact that Cyprus is mainly a tourist receiving country is reflected in the balance of payments.Although the overall current account balance is negative, the travel balance is positive and it hasalmost tripled from ECU 498 million in 1985 to ECU 1 538 million in 1998. Growth however has beenslower in the late 1990´s and has even been marked with a decrease of 3.7% in 1996 (compared to1995). This decrease is partly due to a fall in the number of arrivals of tourists (7%) and partly to theincrease of 14% in the travel expenditures. The relative importance of tourism is also reflected by thesignificant share of 50.4% of the travel receipts on the total services receipts. Over the past decadethis share has maintained its relative importance being more or less stable and ranging between 50%and 55%.
Travel (tourism) in the Balance of Payments (ECU Mio)
% change
1985 1990 1995 1996 1997 1998 1999 98/90 98/95
Receipts 498 987 1 374 1 323 1 461 1 538 1 785 55.8 12.0
Expenditures 102 140 252 288 340 366 404 162.2 45.2
Net account 396 848 1 122 1 035 1 121 1 172 1 381 38.3 4.5
Source: CYSTAT.
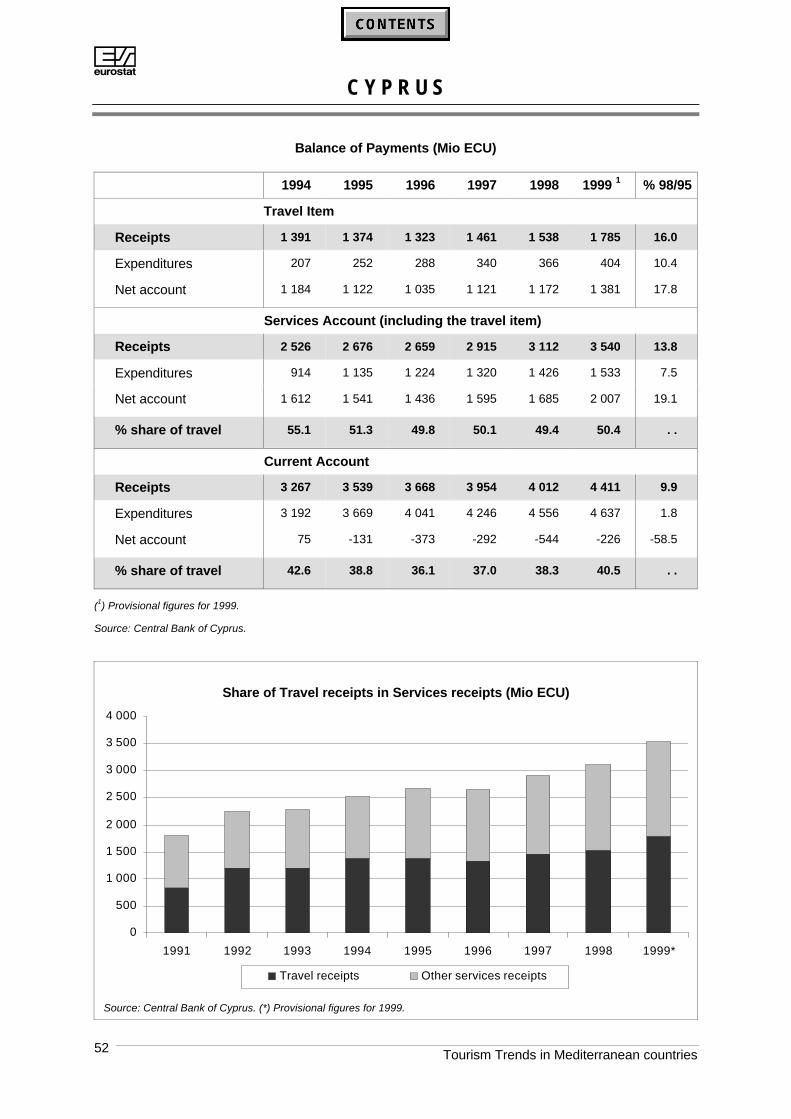
AC Y P R U S
Tourism Trends in Mediterranean countries52
Balance of Payments (Mio ECU)
1994 1995 1996 1997 1998 1999 1 % 98/95
Travel Item
Receipts 1 391 1 374 1 323 1 461 1 538 1 785 16.0
Expenditures 207 252 288 340 366 404 10.4
Net account 1 184 1 122 1 035 1 121 1 172 1 381 17.8
Services Account (including the travel item)
Receipts 2 526 2 676 2 659 2 915 3 112 3 540 13.8
Expenditures 914 1 135 1 224 1 320 1 426 1 533 7.5
Net account 1 612 1 541 1 436 1 595 1 685 2 007 19.1
% share of travel 55.1 51.3 49.8 50.1 49.4 50.4 . .
Current Account
Receipts 3 267 3 539 3 668 3 954 4 012 4 411 9.9
Expenditures 3 192 3 669 4 041 4 246 4 556 4 637 1.8
Net account 75 -131 -373 -292 -544 -226 -58.5
% share of travel 42.6 38.8 36.1 37.0 38.3 40.5 . .
(1) Provisional figures for 1999.
Source: Central Bank of Cyprus.
Share of Travel receipts in Services receipts (Mio ECU)
0
500
1 000
1 500
2 000
2 500
3 000
3 500
4 000
1991 1992 1993 1994 1995 1996 1997 1998 1999*
Travel receipts Other services receipts
Source: Central Bank of Cyprus. (*) Provisional figures for 1999.
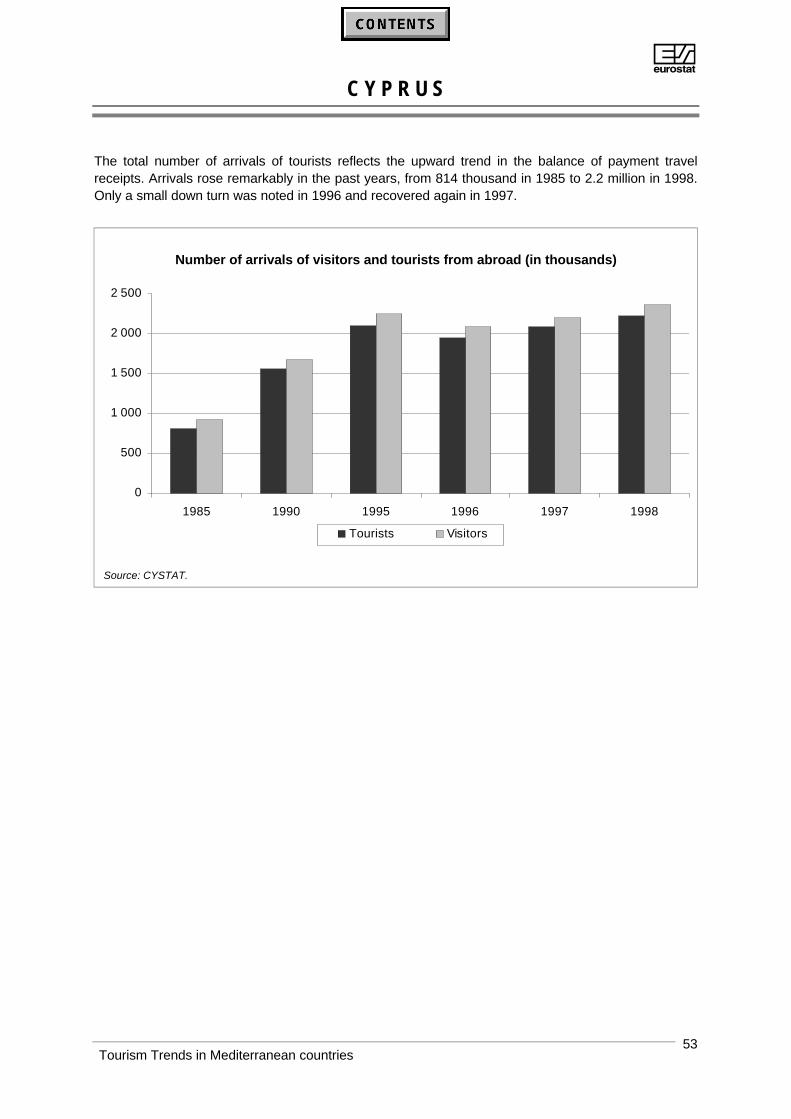
AC Y P R U S
Tourism Trends in Mediterranean countries53
The total number of arrivals of tourists reflects the upward trend in the balance of payment travelreceipts. Arrivals rose remarkably in the past years, from 814 thousand in 1985 to 2.2 million in 1998.Only a small down turn was noted in 1996 and recovered again in 1997.
Number of arrivals of visitors and tourists from abroad (in thousands)
0
500
1 000
1 500
2 000
2 500
1985 1990 1995 1996 1997 1998
Tourists Visitors
Source: CYSTAT.
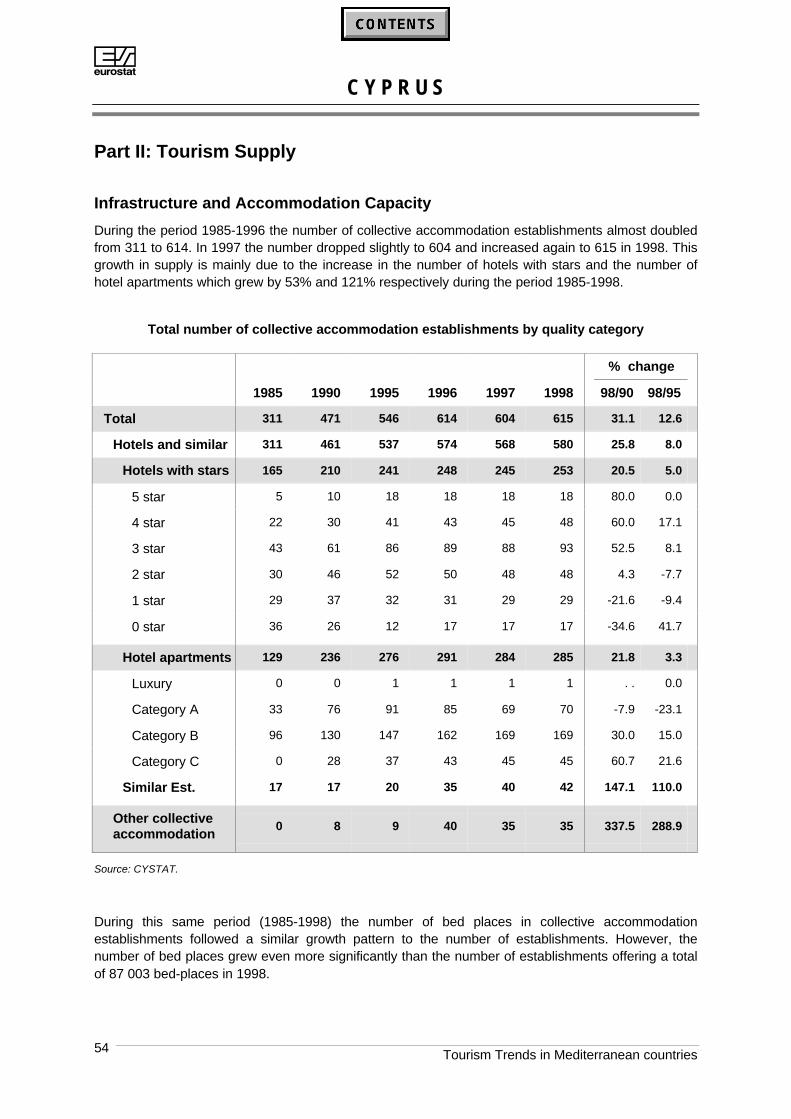
AC Y P R U S
Tourism Trends in Mediterranean countries54
Part II: Tourism Supply
Infrastructure and Accommodation Capacity
During the period 1985-1996 the number of collective accommodation establishments almost doubledfrom 311 to 614. In 1997 the number dropped slightly to 604 and increased again to 615 in 1998. Thisgrowth in supply is mainly due to the increase in the number of hotels with stars and the number ofhotel apartments which grew by 53% and 121% respectively during the period 1985-1998.
Total number of collective accommodation establishments by quality category
% change
1985 1990 1995 1996 1997 1998 98/90 98/95
Total 311 471 546 614 604 615 31.1 12.6
Hotels and similar 311 461 537 574 568 580 25.8 8.0
Hotels with stars 165 210 241 248 245 253 20.5 5.0
5 star 5 10 18 18 18 18 80.0 0.0
4 star 22 30 41 43 45 48 60.0 17.1
3 star 43 61 86 89 88 93 52.5 8.1
2 star 30 46 52 50 48 48 4.3 -7.7
1 star 29 37 32 31 29 29 -21.6 -9.4
0 star 36 26 12 17 17 17 -34.6 41.7
Hotel apartments 129 236 276 291 284 285 21.8 3.3
Luxury 0 0 1 1 1 1 . . 0.0
Category A 33 76 91 85 69 70 -7.9 -23.1
Category B 96 130 147 162 169 169 30.0 15.0
Category C 0 28 37 43 45 45 60.7 21.6
Similar Est. 17 17 20 35 40 42 147.1 110.0
Other collectiveaccommodation
0 8 9 40 35 35 337.5 288.9
Source: CYSTAT.
During this same period (1985-1998) the number of bed places in collective accommodationestablishments followed a similar growth pattern to the number of establishments. However, thenumber of bed places grew even more significantly than the number of establishments offering a totalof 87 003 bed-places in 1998.
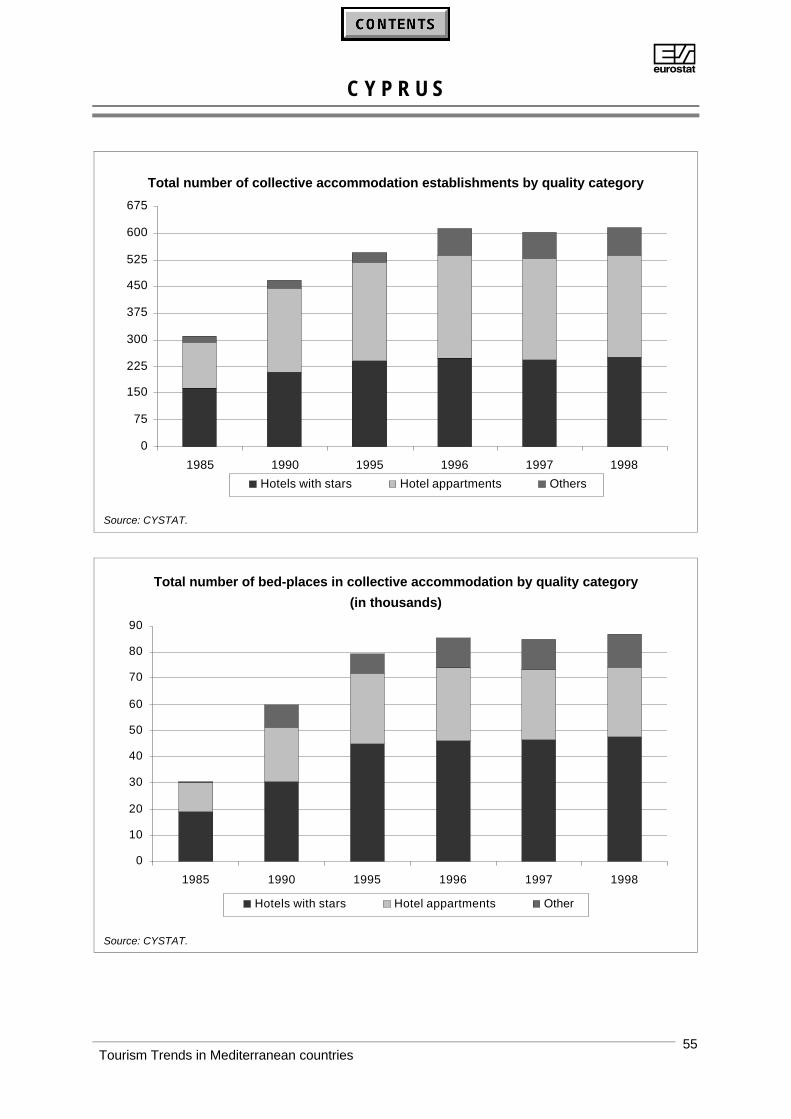
AC Y P R U S
Tourism Trends in Mediterranean countries55
Total number of collective accommodation establishments by quality category
0
75
150
225
300
375
450
525
600
675
1985 1990 1995 1996 1997 1998
Hotels with stars Hotel appartments Others
Source: CYSTAT.
Total number of bed-places in collective accommodation by quality category
(in thousands)
0
10
20
30
40
50
60
70
80
90
1985 1990 1995 1996 1997 1998
Hotels with stars Hotel appartments Other
Source: CYSTAT.
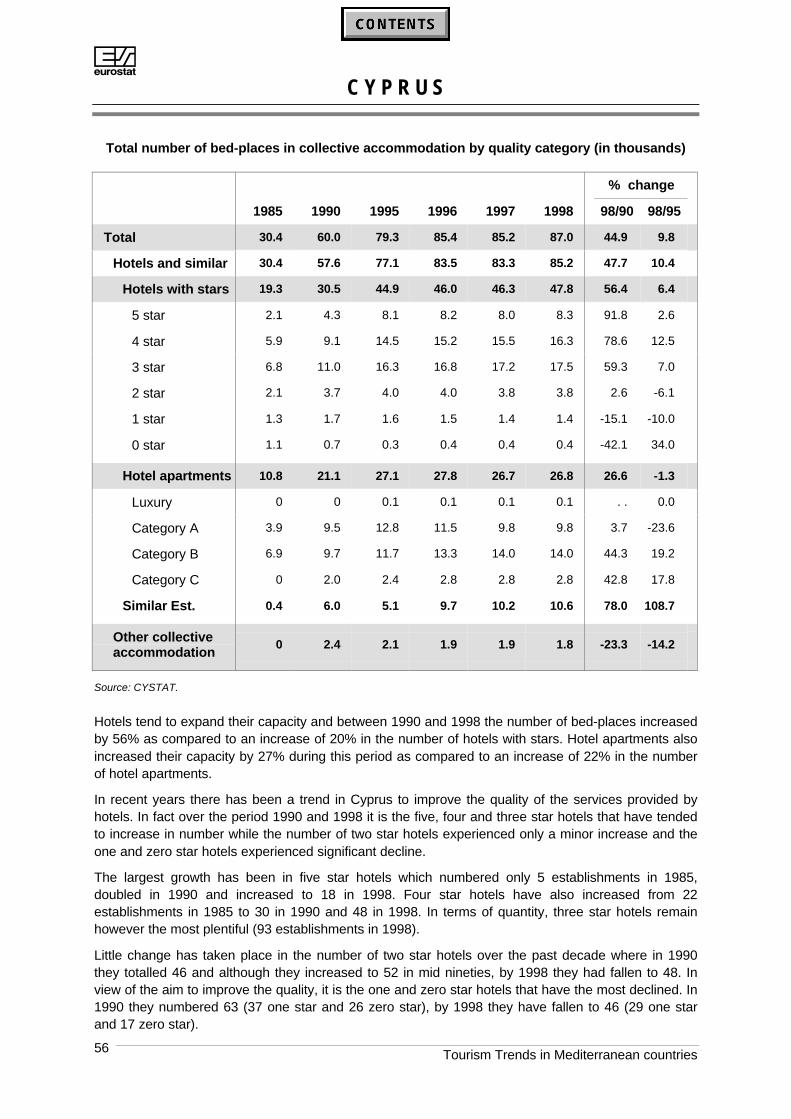
AC Y P R U S
Tourism Trends in Mediterranean countries56
Total number of bed-places in collective accommodation by quality category (in thousands)
% change
1985 1990 1995 1996 1997 1998 98/90 98/95
Total 30.4 60.0 79.3 85.4 85.2 87.0 44.9 9.8
Hotels and similar 30.4 57.6 77.1 83.5 83.3 85.2 47.7 10.4
Hotels with stars 19.3 30.5 44.9 46.0 46.3 47.8 56.4 6.4
5 star 2.1 4.3 8.1 8.2 8.0 8.3 91.8 2.6
4 star 5.9 9.1 14.5 15.2 15.5 16.3 78.6 12.5
3 star 6.8 11.0 16.3 16.8 17.2 17.5 59.3 7.0
2 star 2.1 3.7 4.0 4.0 3.8 3.8 2.6 -6.1
1 star 1.3 1.7 1.6 1.5 1.4 1.4 -15.1 -10.0
0 star 1.1 0.7 0.3 0.4 0.4 0.4 -42.1 34.0
Hotel apartments 10.8 21.1 27.1 27.8 26.7 26.8 26.6 -1.3
Luxury 0 0 0.1 0.1 0.1 0.1 . . 0.0
Category A 3.9 9.5 12.8 11.5 9.8 9.8 3.7 -23.6
Category B 6.9 9.7 11.7 13.3 14.0 14.0 44.3 19.2
Category C 0 2.0 2.4 2.8 2.8 2.8 42.8 17.8
Similar Est. 0.4 6.0 5.1 9.7 10.2 10.6 78.0 108.7
Other collectiveaccommodation
0 2.4 2.1 1.9 1.9 1.8 -23.3 -14.2
Source: CYSTAT.
Hotels tend to expand their capacity and between 1990 and 1998 the number of bed-places increasedby 56% as compared to an increase of 20% in the number of hotels with stars. Hotel apartments alsoincreased their capacity by 27% during this period as compared to an increase of 22% in the numberof hotel apartments.
In recent years there has been a trend in Cyprus to improve the quality of the services provided byhotels. In fact over the period 1990 and 1998 it is the five, four and three star hotels that have tendedto increase in number while the number of two star hotels experienced only a minor increase and theone and zero star hotels experienced significant decline.
The largest growth has been in five star hotels which numbered only 5 establishments in 1985,doubled in 1990 and increased to 18 in 1998. Four star hotels have also increased from 22establishments in 1985 to 30 in 1990 and 48 in 1998. In terms of quantity, three star hotels remainhowever the most plentiful (93 establishments in 1998).
Little change has taken place in the number of two star hotels over the past decade where in 1990they totalled 46 and although they increased to 52 in mid nineties, by 1998 they had fallen to 48. Inview of the aim to improve the quality, it is the one and zero star hotels that have the most declined. In1990 they numbered 63 (37 one star and 26 zero star), by 1998 they have fallen to 46 (29 one starand 17 zero star).
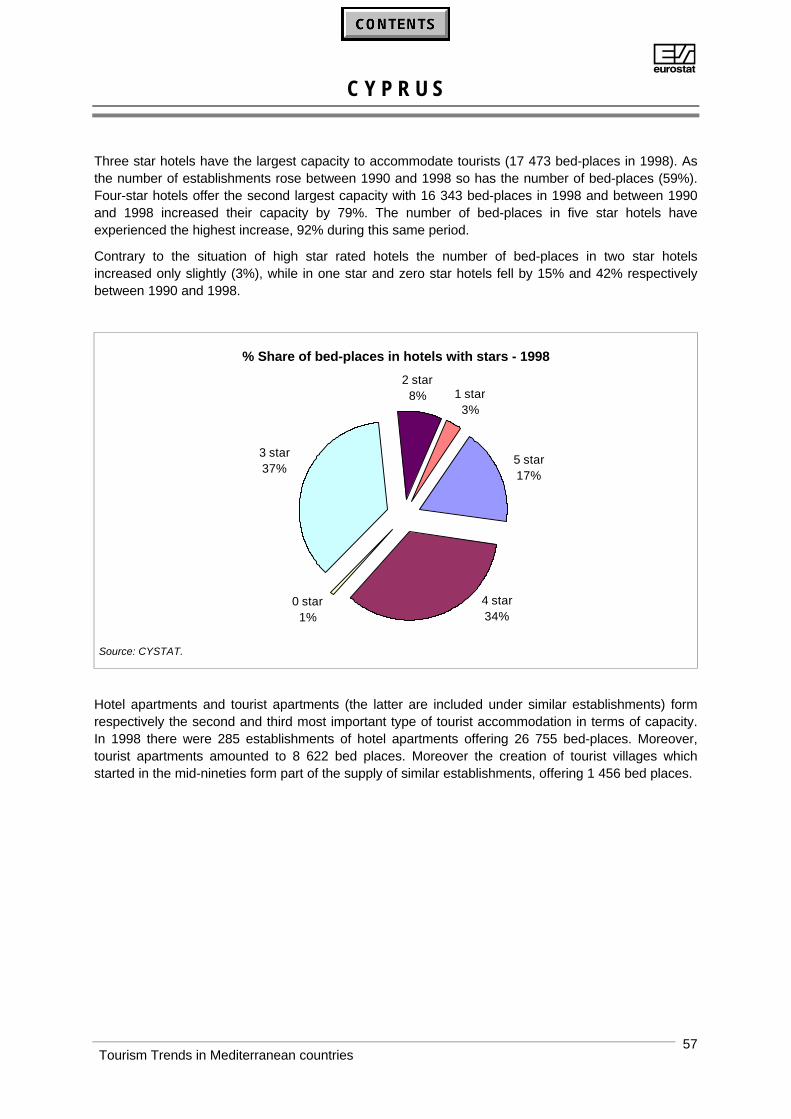
AC Y P R U S
Tourism Trends in Mediterranean countries57
Three star hotels have the largest capacity to accommodate tourists (17 473 bed-places in 1998). Asthe number of establishments rose between 1990 and 1998 so has the number of bed-places (59%).Four-star hotels offer the second largest capacity with 16 343 bed-places in 1998 and between 1990and 1998 increased their capacity by 79%. The number of bed-places in five star hotels haveexperienced the highest increase, 92% during this same period.
Contrary to the situation of high star rated hotels the number of bed-places in two star hotelsincreased only slightly (3%), while in one star and zero star hotels fell by 15% and 42% respectivelybetween 1990 and 1998.
% Share of bed-places in hotels with stars - 1998
4 star34%
5 star17%
0 star1%
3 star37%
2 star8% 1 star
3%
Source: CYSTAT.
Hotel apartments and tourist apartments (the latter are included under similar establishments) formrespectively the second and third most important type of tourist accommodation in terms of capacity.In 1998 there were 285 establishments of hotel apartments offering 26 755 bed-places. Moreover,tourist apartments amounted to 8 622 bed places. Moreover the creation of tourist villages whichstarted in the mid-nineties form part of the supply of similar establishments, offering 1 456 bed places.
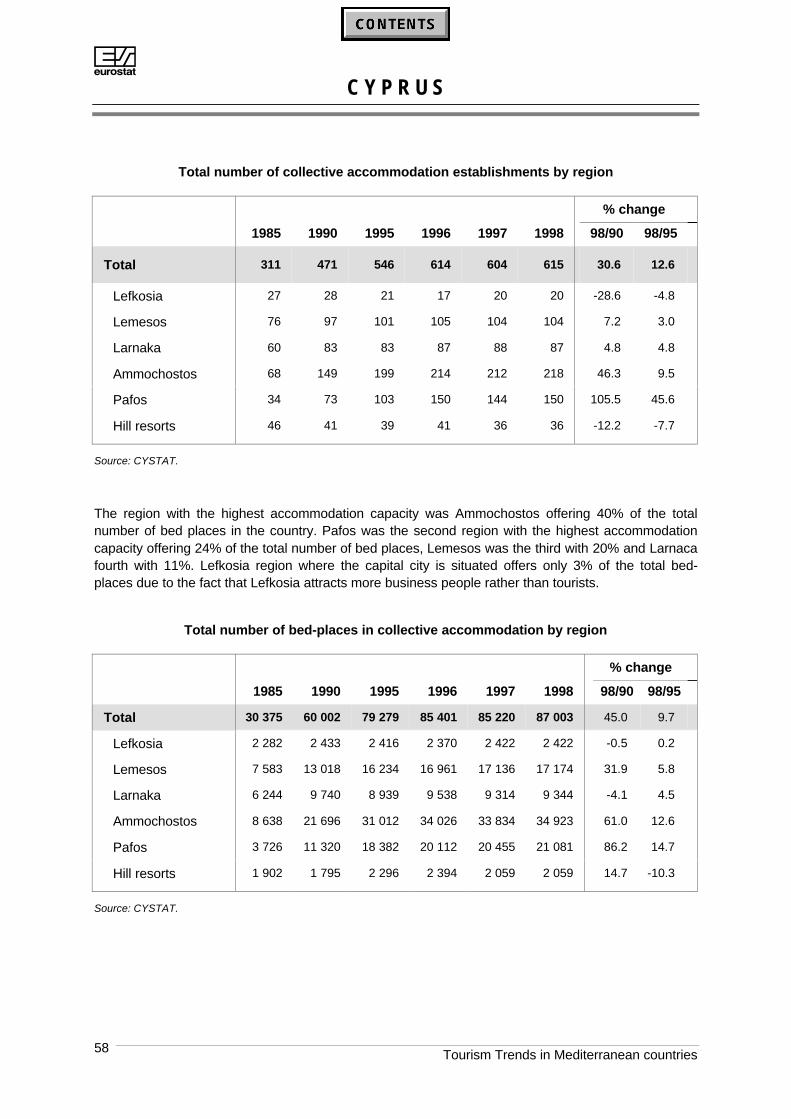
AC Y P R U S
Tourism Trends in Mediterranean countries58
Total number of collective accommodation establishments by region
% change
1985 1990 1995 1996 1997 1998 98/90 98/95
Total 311 471 546 614 604 615 30.6 12.6
Lefkosia 27 28 21 17 20 20 -28.6 -4.8
Lemesos 76 97 101 105 104 104 7.2 3.0
Larnaka 60 83 83 87 88 87 4.8 4.8
Ammochostos 68 149 199 214 212 218 46.3 9.5
Pafos 34 73 103 150 144 150 105.5 45.6
Hill resorts 46 41 39 41 36 36 -12.2 -7.7
Source: CYSTAT.
The region with the highest accommodation capacity was Ammochostos offering 40% of the totalnumber of bed places in the country. Pafos was the second region with the highest accommodationcapacity offering 24% of the total number of bed places, Lemesos was the third with 20% and Larnacafourth with 11%. Lefkosia region where the capital city is situated offers only 3% of the total bed-places due to the fact that Lefkosia attracts more business people rather than tourists.
Total number of bed-places in collective accommodation by region
% change
1985 1990 1995 1996 1997 1998 98/90 98/95
Total 30 375 60 002 79 279 85 401 85 220 87 003 45.0 9.7
Lefkosia 2 282 2 433 2 416 2 370 2 422 2 422 -0.5 0.2
Lemesos 7 583 13 018 16 234 16 961 17 136 17 174 31.9 5.8
Larnaka 6 244 9 740 8 939 9 538 9 314 9 344 -4.1 4.5
Ammochostos 8 638 21 696 31 012 34 026 33 834 34 923 61.0 12.6
Pafos 3 726 11 320 18 382 20 112 20 455 21 081 86.2 14.7
Hill resorts 1 902 1 795 2 296 2 394 2 059 2 059 14.7 -10.3
Source: CYSTAT.
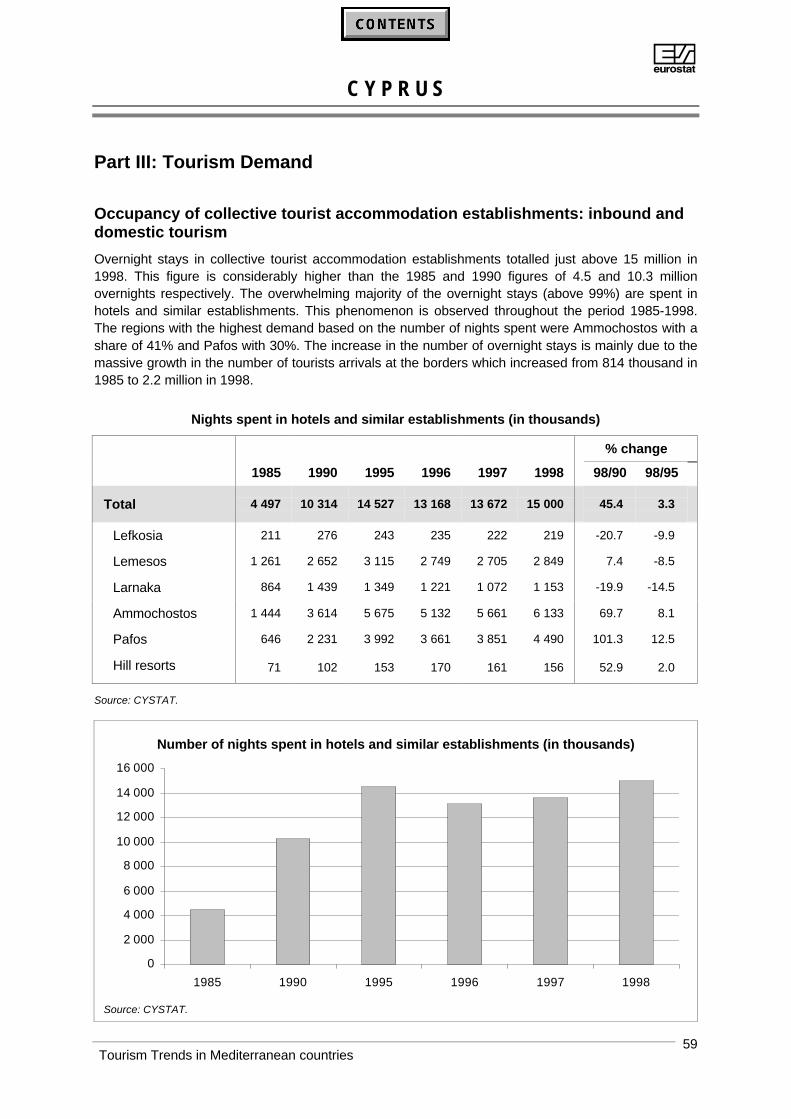
AC Y P R U S
Tourism Trends in Mediterranean countries59
Part III: Tourism Demand
Occupancy of collective tourist accommodation establishments: inbound anddomestic tourism
Overnight stays in collective tourist accommodation establishments totalled just above 15 million in1998. This figure is considerably higher than the 1985 and 1990 figures of 4.5 and 10.3 millionovernights respectively. The overwhelming majority of the overnight stays (above 99%) are spent inhotels and similar establishments. This phenomenon is observed throughout the period 1985-1998.The regions with the highest demand based on the number of nights spent were Ammochostos with ashare of 41% and Pafos with 30%. The increase in the number of overnight stays is mainly due to themassive growth in the number of tourists arrivals at the borders which increased from 814 thousand in1985 to 2.2 million in 1998.
Nights spent in hotels and similar establishments (in thousands)
% change
1985 1990 1995 1996 1997 1998 98/90 98/95
Total 4 497 10 314 14 527 13 168 13 672 15 000 45.4 3.3
Lefkosia 211 276 243 235 222 219 -20.7 -9.9
Lemesos 1 261 2 652 3 115 2 749 2 705 2 849 7.4 -8.5
Larnaka 864 1 439 1 349 1 221 1 072 1 153 -19.9 -14.5
Ammochostos 1 444 3 614 5 675 5 132 5 661 6 133 69.7 8.1
Pafos 646 2 231 3 992 3 661 3 851 4 490 101.3 12.5
Hill resorts 71 102 153 170 161 156 52.9 2.0
Source: CYSTAT.
Number of nights spent in hotels and similar establishments (in thousands)
0
2 000
4 000
6 000
8 000
10 000
12 000
14 000
16 000
1985 1990 1995 1996 1997 1998
Source: CYSTAT.

AC Y P R U S
Tourism Trends in Mediterranean countries60
Tourism accommodation establishments in Cyprus rely in fact on non-resident demand. The share ofnon-resident demand in total overnight stays during 1985-1998 was of the order of 96% which reflectsthe high rate of inbound tourism.
The largest share of non-resident demand based on the number of overnights in 1998 was held bytourists from the United Kingdom with 49%. Tourists from Germany represented 10% of all overnightstays of non-residents. Sweden (4%), Greece (3%) and all other EU countries together accounted for17%. In recent years Russian tourists started to form an important group of visitors and this is seenfrom their relatively high share of 9%.
% Share of non-resident nights by country of residence - 1998
Other 6%
Israel1%
Other European8%
Russia9%
Other EU17%
United Kingdom49%
Germany10%
Source: CYSTAT.
Since 1995 net occupancy rates for hotels and similar establishments have experienced somefluctuation from 60% in 1995 to 55% in 1996, 54% in 1997 and 57% in 1998. Gross occupancy ratesfollowed the same pattern as net rates but they were on average 9% lower.
Evolution of gross and net occupancy rates (%) in hotels and similar establishments
40
50
60
70
1990 1991 1992 1993 1994 1995 1996 1997 1998
Gross Net
Source: CYSTAT.
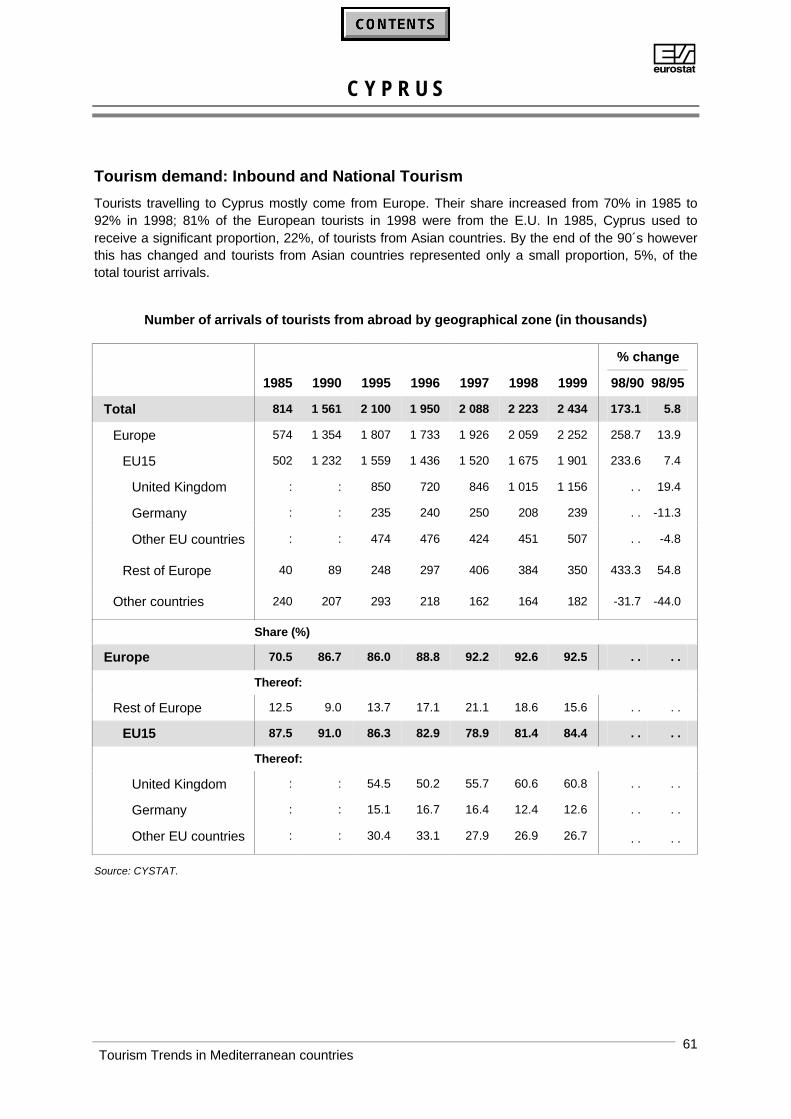
AC Y P R U S
Tourism Trends in Mediterranean countries61
Tourism demand: Inbound and National Tourism
Tourists travelling to Cyprus mostly come from Europe. Their share increased from 70% in 1985 to92% in 1998; 81% of the European tourists in 1998 were from the E.U. In 1985, Cyprus used toreceive a significant proportion, 22%, of tourists from Asian countries. By the end of the 90´s howeverthis has changed and tourists from Asian countries represented only a small proportion, 5%, of thetotal tourist arrivals.
Number of arrivals of tourists from abroad by geographical zone (in thousands)
% change
1985 1990 1995 1996 1997 1998 1999 98/90 98/95
Total 814 1 561 2 100 1 950 2 088 2 223 2 434 173.1 5.8
Europe 574 1 354 1 807 1 733 1 926 2 059 2 252 258.7 13.9
EU15 502 1 232 1 559 1 436 1 520 1 675 1 901 233.6 7.4
United Kingdom : : 850 720 846 1 015 1 156 . . 19.4
Germany : : 235 240 250 208 239 . . -11.3
Other EU countries : : 474 476 424 451 507 . . -4.8
Rest of Europe 40 89 248 297 406 384 350 433.3 54.8
Other countries 240 207 293 218 162 164 182 -31.7 -44.0
Share (%)
Europe 70.5 86.7 86.0 88.8 92.2 92.6 92.5 . . . .
Thereof:
Rest of Europe 12.5 9.0 13.7 17.1 21.1 18.6 15.6 . . . .
EU15 87.5 91.0 86.3 82.9 78.9 81.4 84.4 . . . .
Thereof:
United Kingdom : : 54.5 50.2 55.7 60.6 60.8 . . . .
Germany : : 15.1 16.7 16.4 12.4 12.6 . . . .
Other EU countries : : 30.4 33.1 27.9 26.9 26.7 . . . .
Source: CYSTAT.
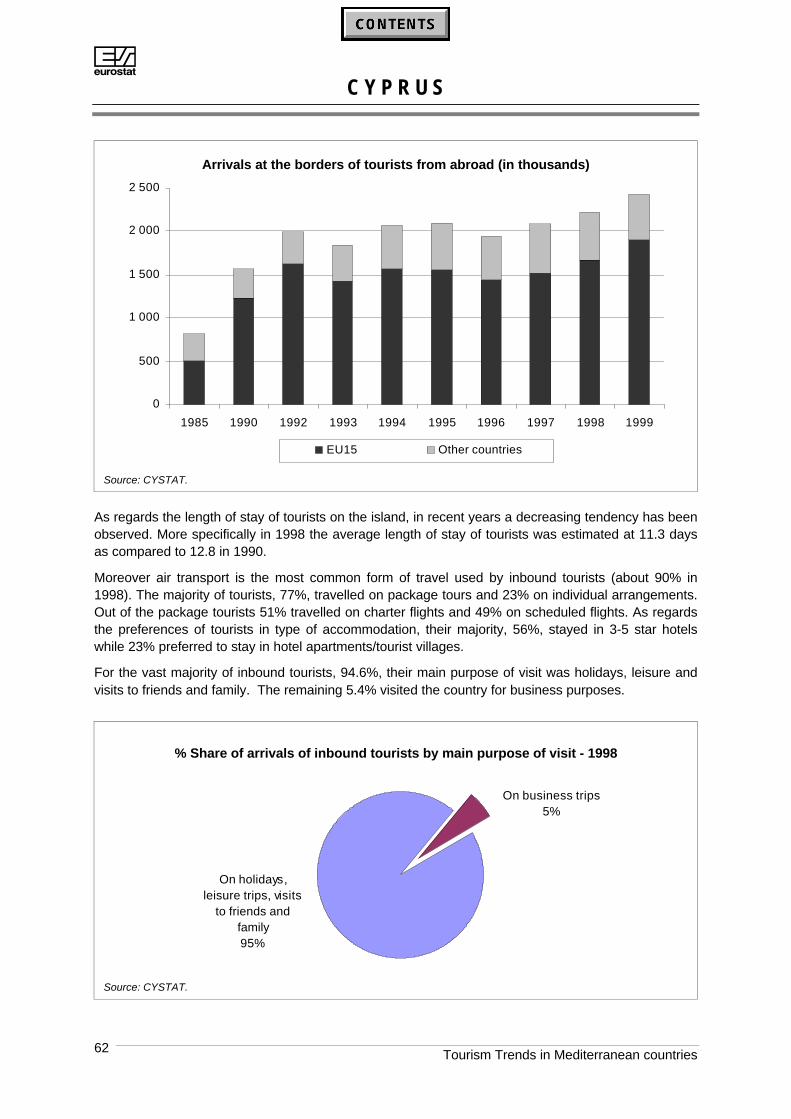
AC Y P R U S
Tourism Trends in Mediterranean countries62
Arrivals at the borders of tourists from abroad (in thousands)
0
500
1 000
1 500
2 000
2 500
1985 1990 1992 1993 1994 1995 1996 1997 1998 1999
EU15 Other countries
Source: CYSTAT.
As regards the length of stay of tourists on the island, in recent years a decreasing tendency has beenobserved. More specifically in 1998 the average length of stay of tourists was estimated at 11.3 daysas compared to 12.8 in 1990.
Moreover air transport is the most common form of travel used by inbound tourists (about 90% in1998). The majority of tourists, 77%, travelled on package tours and 23% on individual arrangements.Out of the package tourists 51% travelled on charter flights and 49% on scheduled flights. As regardsthe preferences of tourists in type of accommodation, their majority, 56%, stayed in 3-5 star hotelswhile 23% preferred to stay in hotel apartments/tourist villages.
For the vast majority of inbound tourists, 94.6%, their main purpose of visit was holidays, leisure andvisits to friends and family. The remaining 5.4% visited the country for business purposes.
% Share of arrivals of inbound tourists by main purpose of visit - 1998
On business trips5%
On holidays, leisure trips, visits
to friends and family95%
Source: CYSTAT.
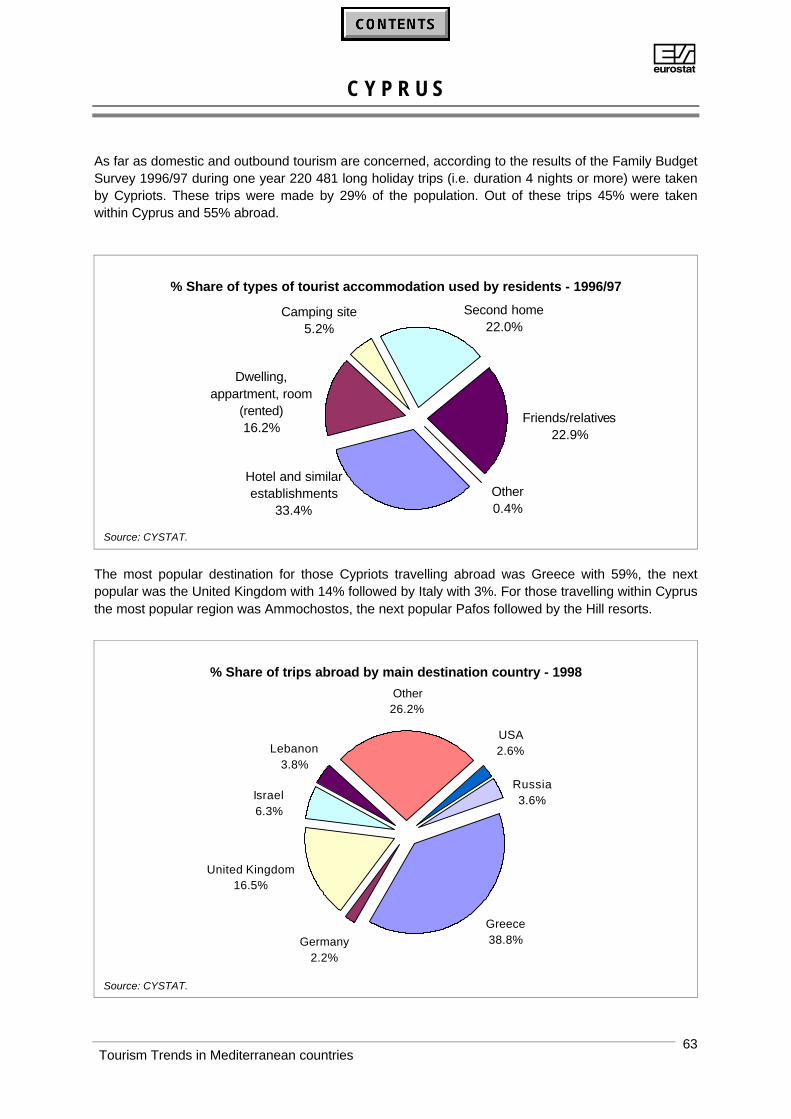
AC Y P R U S
Tourism Trends in Mediterranean countries63
As far as domestic and outbound tourism are concerned, according to the results of the Family BudgetSurvey 1996/97 during one year 220 481 long holiday trips (i.e. duration 4 nights or more) were takenby Cypriots. These trips were made by 29% of the population. Out of these trips 45% were takenwithin Cyprus and 55% abroad.
% Share of types of tourist accommodation used by residents - 1996/97
Dwelling, appartment, room
(rented)16.2%
Hotel and similar establishments
33.4%
Camping site5.2%
Second home22.0%
Friends/relatives22.9%
Other0.4%
Source: CYSTAT.
The most popular destination for those Cypriots travelling abroad was Greece with 59%, the nextpopular was the United Kingdom with 14% followed by Italy with 3%. For those travelling within Cyprusthe most popular region was Ammochostos, the next popular Pafos followed by the Hill resorts.
% Share of trips abroad by main destination country - 1998
Germany2.2%
Greece38.8%
United Kingdom16.5%
Israel6.3%
Lebanon3.8%
Other26.2%
USA2.6%
Russia3.6%
Source: CYSTAT.

AC Y P R U S
Tourism Trends in Mediterranean countries64
PART IV: Future Perspectives
In view of the fact that tourism in Cyprus will continue to be a leading sector of the economy over thenext decade, the Cyprus Tourism Organisation is carrying out a study of the strategy of tourism inCyprus to the year 2010 the scope of which is to identify the new strategic direction of tourism inCyprus taking into account the opportunities and threats of international tourism environment as wellas the strengths and weaknesses of the Cyprus tourism product.
As it appears so far through the study, Cyprus has the capability to pursue a strategy of value, thusover the coming years it will direct its efforts towards increasing revenue from tourism throughpursuing increasing expenditure per visitor along with controlled increases in volume, increasinglength of stay, the number of repeat visitors and expanding the tourist season.

AE G Y P T
Tourism Trends in Mediterranean countries 65
Part I: General situation and main indicators
Development and Impact of Tourism
Tourism is one of the main contributors to the Egyptian economy. The sector is a principal generatorof income and foreign exchange earnings, as well as a main provider of job opportunities.
Throughout the period 1985-1997, the ratio of international tourism receipts to GNP at market pricesrose from 2.9% to 8%, recording an outstanding performance. In 1996, foreign visitor expendituredirectly accounted for 4.1% of GDP at market prices; and indirectly, for a further 6.6%, bringingthereby total tourism contribution to GDP to 10.7%.
Tourism Receipts and Gross National Product (Mio ECU)
Year 1985 1990 1995 1997 % Change 97/95
Tourism Receipts 1 180.7 1 526.6 2 052.0 3 286.5 60.2
Gross National Product(at market prices)
41 156.5 26 958.7 32 337.7 41 284.3 27.7
Tourism Receipts/GNP (%) 2.9 5.7 6.3 8.0 . .
Source: Central Bank of Egypt (CBE) and Ministry of Tourism (MOT).
Gross National Product and Travel Receipts (Mio ECU)
8.0% 6.3%5.7%2.9% 0
10 000
20 000
30 000
40 000
50 000
1985 1990 1995 1997
Tourism Receipts Gross National Product (at market prices)
Source: CBE and MOT.
In 1996 turnover directly generated by tourism activities totalled ECU 2 252 million, of which 51% wasmade by hotels and restaurants; 22.2% by entertainment and cultural services; 10.2% bytransportation services; and, 7.1% by retail services. Applying the relevant multipliers, the total saleeffect reaches nearly ECU 5 985 million.
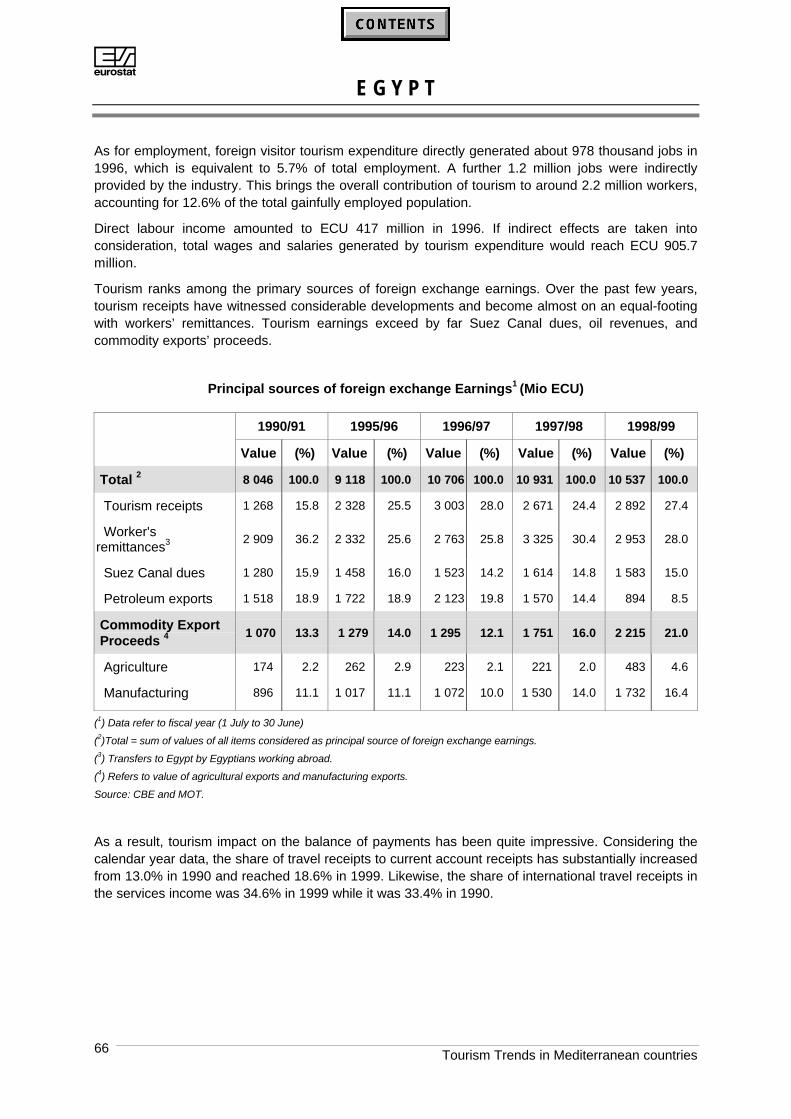
AE G Y P T
Tourism Trends in Mediterranean countries66
As for employment, foreign visitor tourism expenditure directly generated about 978 thousand jobs in1996, which is equivalent to 5.7% of total employment. A further 1.2 million jobs were indirectlyprovided by the industry. This brings the overall contribution of tourism to around 2.2 million workers,accounting for 12.6% of the total gainfully employed population.
Direct labour income amounted to ECU 417 million in 1996. If indirect effects are taken intoconsideration, total wages and salaries generated by tourism expenditure would reach ECU 905.7million.
Tourism ranks among the primary sources of foreign exchange earnings. Over the past few years,tourism receipts have witnessed considerable developments and become almost on an equal-footingwith workers’ remittances. Tourism earnings exceed by far Suez Canal dues, oil revenues, andcommodity exports’ proceeds.
Principal sources of foreign exchange Earnings1 (Mio ECU)
1990/91 1995/96 1996/97 1997/98 1998/99
Value (%) Value (%) Value (%) Value (%) Value (%)
Total 2 8 046 100.0 9 118 100.0 10 706 100.0 10 931 100.0 10 537 100.0
Tourism receipts 1 268 15.8 2 328 25.5 3 003 28.0 2 671 24.4 2 892 27.4
Worker'sremittances3 2 909 36.2 2 332 25.6 2 763 25.8 3 325 30.4 2 953 28.0
Suez Canal dues 1 280 15.9 1 458 16.0 1 523 14.2 1 614 14.8 1 583 15.0
Petroleum exports 1 518 18.9 1 722 18.9 2 123 19.8 1 570 14.4 894 8.5
Commodity ExportProceeds 4
1 070 13.3 1 279 14.0 1 295 12.1 1 751 16.0 2 215 21.0
Agriculture 174 2.2 262 2.9 223 2.1 221 2.0 483 4.6
Manufacturing 896 11.1 1 017 11.1 1 072 10.0 1 530 14.0 1 732 16.4
(1) Data refer to fiscal year (1 July to 30 June)
(2)Total = sum of values of all items considered as principal source of foreign exchange earnings.
(3) Transfers to Egypt by Egyptians working abroad.
(4) Refers to value of agricultural exports and manufacturing exports.
Source: CBE and MOT.
As a result, tourism impact on the balance of payments has been quite impressive. Considering thecalendar year data, the share of travel receipts to current account receipts has substantially increasedfrom 13.0% in 1990 and reached 18.6% in 1999. Likewise, the share of international travel receipts inthe services income was 34.6% in 1999 while it was 33.4% in 1990.
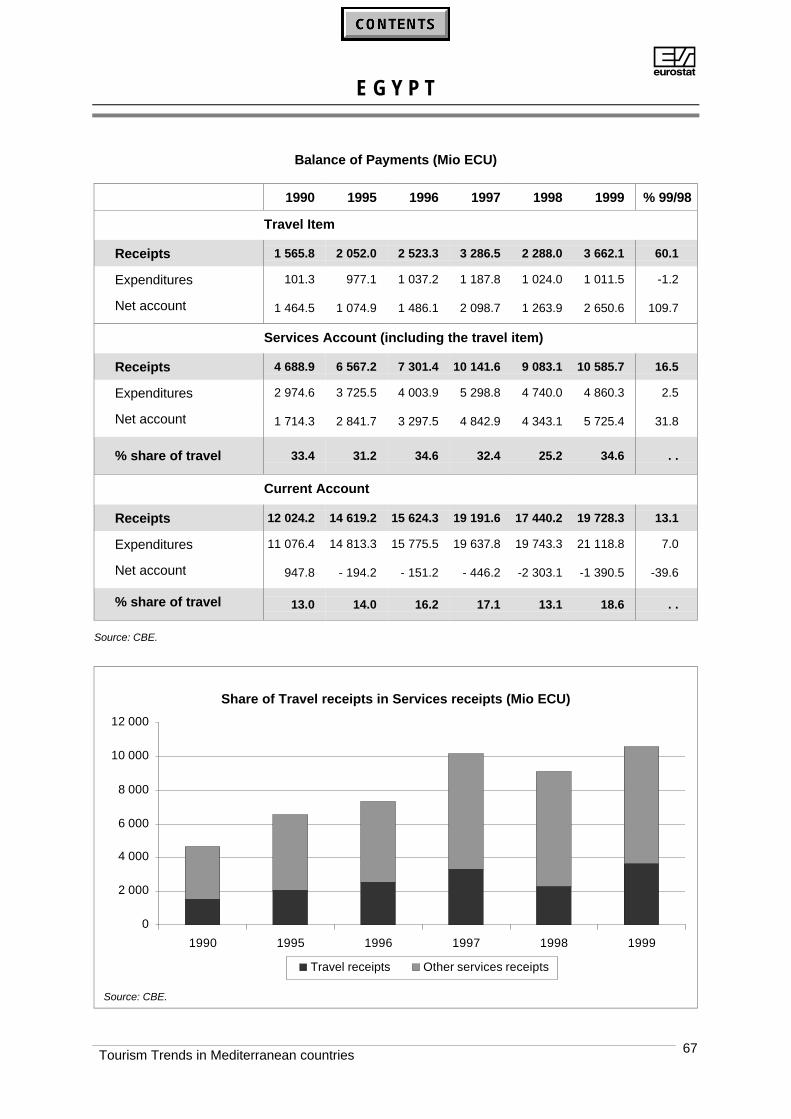
AE G Y P T
Tourism Trends in Mediterranean countries 67
Balance of Payments (Mio ECU)
1990 1995 1996 1997 1998 1999 % 99/98
Travel Item
Receipts 1 565.8 2 052.0 2 523.3 3 286.5 2 288.0 3 662.1 60.1
Expenditures 101.3 977.1 1 037.2 1 187.8 1 024.0 1 011.5 -1.2
Net account 1 464.5 1 074.9 1 486.1 2 098.7 1 263.9 2 650.6 109.7
Services Account (including the travel item)
Receipts 4 688.9 6 567.2 7 301.4 10 141.6 9 083.1 10 585.7 16.5
Expenditures 2 974.6 3 725.5 4 003.9 5 298.8 4 740.0 4 860.3 2.5
Net account 1 714.3 2 841.7 3 297.5 4 842.9 4 343.1 5 725.4 31.8
% share of travel 33.4 31.2 34.6 32.4 25.2 34.6 . .
Current Account
Receipts 12 024.2 14 619.2 15 624.3 19 191.6 17 440.2 19 728.3 13.1
Expenditures 11 076.4 14 813.3 15 775.5 19 637.8 19 743.3 21 118.8 7.0
Net account 947.8 - 194.2 - 151.2 - 446.2 -2 303.1 -1 390.5 -39.6
% share of travel 13.0 14.0 16.2 17.1 13.1 18.6 . .
Source: CBE.
Share of Travel receipts in Services receipts (Mio ECU)
0
2 000
4 000
6 000
8 000
10 000
12 000
1990 1995 1996 1997 1998 1999
Travel receipts Other services receipts
Source: CBE.
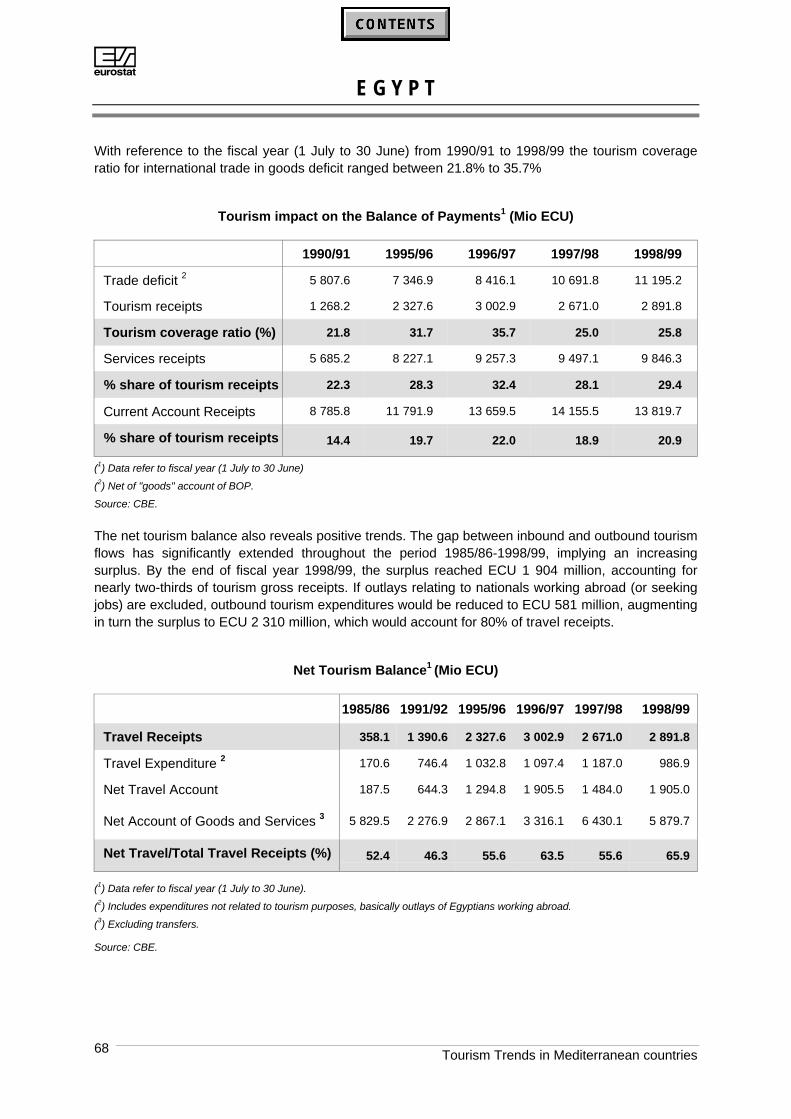
AE G Y P T
Tourism Trends in Mediterranean countries68
With reference to the fiscal year (1 July to 30 June) from 1990/91 to 1998/99 the tourism coverageratio for international trade in goods deficit ranged between 21.8% to 35.7%
Tourism impact on the Balance of Payments1 (Mio ECU)
1990/91 1995/96 1996/97 1997/98 1998/99
Trade deficit 2 5 807.6 7 346.9 8 416.1 10 691.8 11 195.2
Tourism receipts 1 268.2 2 327.6 3 002.9 2 671.0 2 891.8
Tourism coverage ratio (%) 21.8 31.7 35.7 25.0 25.8
Services receipts 5 685.2 8 227.1 9 257.3 9 497.1 9 846.3
% share of tourism receipts 22.3 28.3 32.4 28.1 29.4
Current Account Receipts 8 785.8 11 791.9 13 659.5 14 155.5 13 819.7
% share of tourism receipts 14.4 19.7 22.0 18.9 20.9
(1) Data refer to fiscal year (1 July to 30 June)
(2) Net of "goods" account of BOP.
Source: CBE.
The net tourism balance also reveals positive trends. The gap between inbound and outbound tourismflows has significantly extended throughout the period 1985/86-1998/99, implying an increasingsurplus. By the end of fiscal year 1998/99, the surplus reached ECU 1 904 million, accounting fornearly two-thirds of tourism gross receipts. If outlays relating to nationals working abroad (or seekingjobs) are excluded, outbound tourism expenditures would be reduced to ECU 581 million, augmentingin turn the surplus to ECU 2 310 million, which would account for 80% of travel receipts.
Net Tourism Balance1 (Mio ECU)
1985/86 1991/92 1995/96 1996/97 1997/98 1998/99
Travel Receipts 358.1 1 390.6 2 327.6 3 002.9 2 671.0 2 891.8
Travel Expenditure 2 170.6 746.4 1 032.8 1 097.4 1 187.0 986.9
Net Travel Account 187.5 644.3 1 294.8 1 905.5 1 484.0 1 905.0
Net Account of Goods and Services 3 5 829.5 2 276.9 2 867.1 3 316.1 6 430.1 5 879.7
Net Travel/Total Travel Receipts (%) 52.4 46.3 55.6 63.5 55.6 65.9
(1) Data refer to fiscal year (1 July to 30 June).
(2) Includes expenditures not related to tourism purposes, basically outlays of Egyptians working abroad.
(3) Excluding transfers.
Source: CBE.
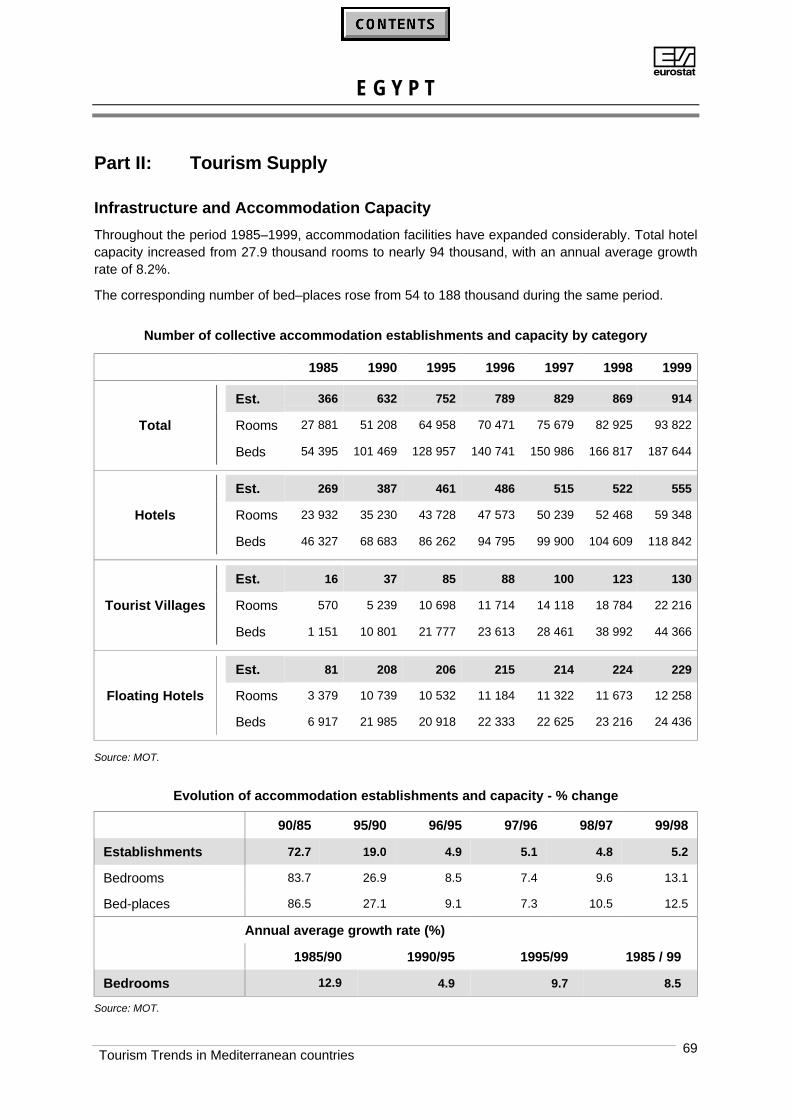
AE G Y P T
Tourism Trends in Mediterranean countries 69
Part II: Tourism Supply
Infrastructure and Accommodation Capacity
Throughout the period 1985–1999, accommodation facilities have expanded considerably. Total hotelcapacity increased from 27.9 thousand rooms to nearly 94 thousand, with an annual average growthrate of 8.2%.
The corresponding number of bed–places rose from 54 to 188 thousand during the same period.
Number of collective accommodation establishments and capacity by category
1985 1990 1995 1996 1997 1998 1999
Est. 366 632 752 789 829 869 914
Rooms 27 881 51 208 64 958 70 471 75 679 82 925 93 822Total
Beds 54 395 101 469 128 957 140 741 150 986 166 817 187 644
Est. 269 387 461 486 515 522 555
Rooms 23 932 35 230 43 728 47 573 50 239 52 468 59 348Hotels
Beds 46 327 68 683 86 262 94 795 99 900 104 609 118 842
Est. 16 37 85 88 100 123 130
Rooms 570 5 239 10 698 11 714 14 118 18 784 22 216Tourist Villages
Beds 1 151 10 801 21 777 23 613 28 461 38 992 44 366
Est. 81 208 206 215 214 224 229
Rooms 3 379 10 739 10 532 11 184 11 322 11 673 12 258Floating Hotels
Beds 6 917 21 985 20 918 22 333 22 625 23 216 24 436
Source: MOT.
Evolution of accommodation establishments and capacity - % change
90/85 95/90 96/95 97/96 98/97 99/98
Establishments 72.7 19.0 4.9 5.1 4.8 5.2
Bedrooms 83.7 26.9 8.5 7.4 9.6 13.1
Bed-places 86.5 27.1 9.1 7.3 10.5 12.5
Annual average growth rate (%)
1985/90 1990/95 1995/99 1985 / 99
Bedrooms 12.9 4.9 9.7 8.5
Source: MOT.
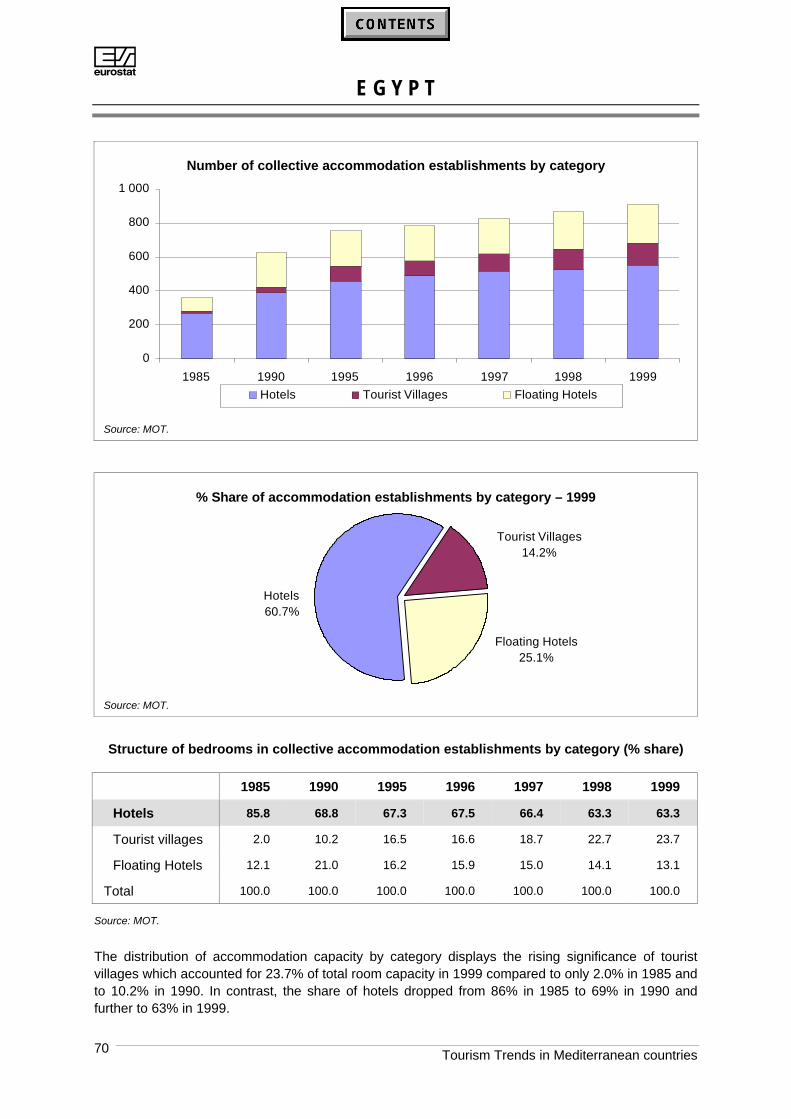
AE G Y P T
Tourism Trends in Mediterranean countries70
Number of collective accommodation establishments by category
0
200
400
600
800
1 000
1985 1990 1995 1996 1997 1998 1999
Hotels Tourist Villages Floating Hotels
Source: MOT.
% Share of accommodation establishments by category – 1999
Tourist Villages14.2%
Floating Hotels25.1%
Hotels60.7%
Source: MOT.
Structure of bedrooms in collective accommodation establishments by category (% share)
1985 1990 1995 1996 1997 1998 1999
Hotels 85.8 68.8 67.3 67.5 66.4 63.3 63.3
Tourist villages 2.0 10.2 16.5 16.6 18.7 22.7 23.7
Floating Hotels 12.1 21.0 16.2 15.9 15.0 14.1 13.1
Total 100.0 100.0 100.0 100.0 100.0 100.0 100.0
Source: MOT.
The distribution of accommodation capacity by category displays the rising significance of touristvillages which accounted for 23.7% of total room capacity in 1999 compared to only 2.0% in 1985 andto 10.2% in 1990. In contrast, the share of hotels dropped from 86% in 1985 to 69% in 1990 andfurther to 63% in 1999.
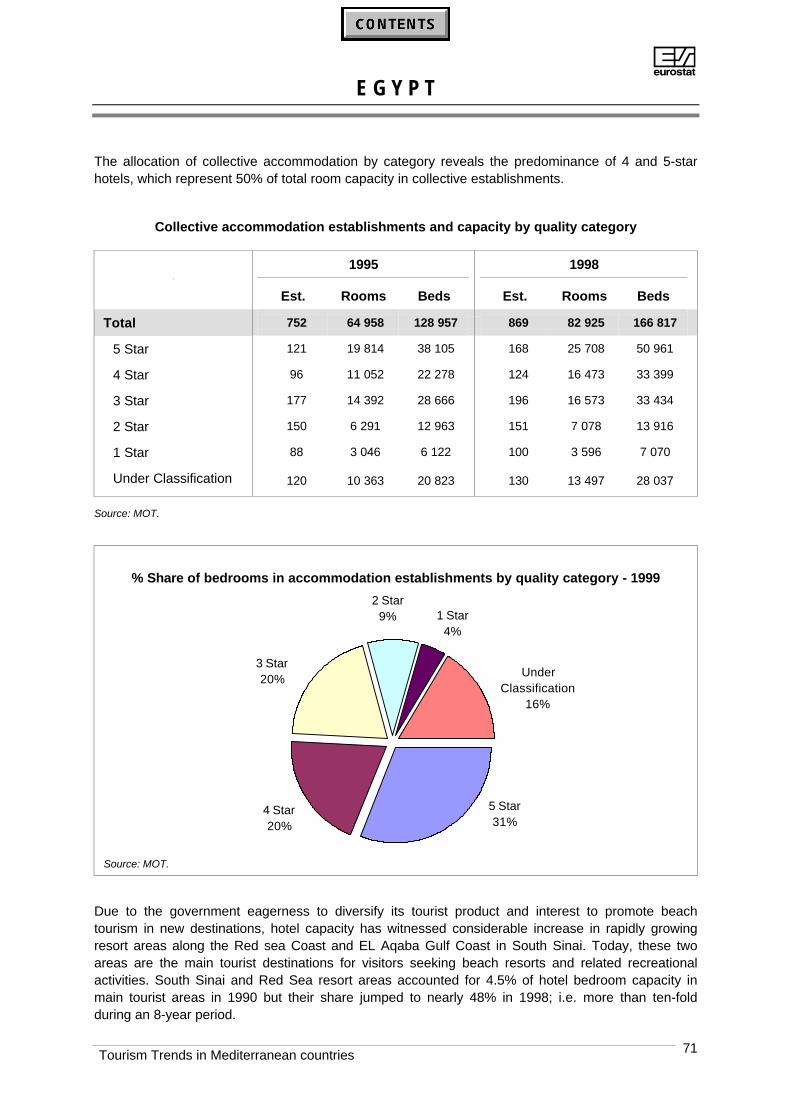
AE G Y P T
Tourism Trends in Mediterranean countries 71
The allocation of collective accommodation by category reveals the predominance of 4 and 5-starhotels, which represent 50% of total room capacity in collective establishments.
Collective accommodation establishments and capacity by quality category
1995 19980
Est. Rooms Beds Est. Rooms Beds
Total 752 64 958 128 957 869 82 925 166 817
5 Star 121 19 814 38 105 168 25 708 50 961
4 Star 96 11 052 22 278 124 16 473 33 399
3 Star 177 14 392 28 666 196 16 573 33 434
2 Star 150 6 291 12 963 151 7 078 13 916
1 Star 88 3 046 6 122 100 3 596 7 070
Under Classification 120 10 363 20 823 130 13 497 28 037
Source: MOT.
% Share of bedrooms in accommodation establishments by quality category - 1999
5 Star31%
3 Star20%
2 Star9% 1 Star
4%
Under Classification
16%
4 Star20%
Source: MOT.
Due to the government eagerness to diversify its tourist product and interest to promote beachtourism in new destinations, hotel capacity has witnessed considerable increase in rapidly growingresort areas along the Red sea Coast and EL Aqaba Gulf Coast in South Sinai. Today, these twoareas are the main tourist destinations for visitors seeking beach resorts and related recreationalactivities. South Sinai and Red Sea resort areas accounted for 4.5% of hotel bedroom capacity inmain tourist areas in 1990 but their share jumped to nearly 48% in 1998; i.e. more than ten-foldduring an 8-year period.
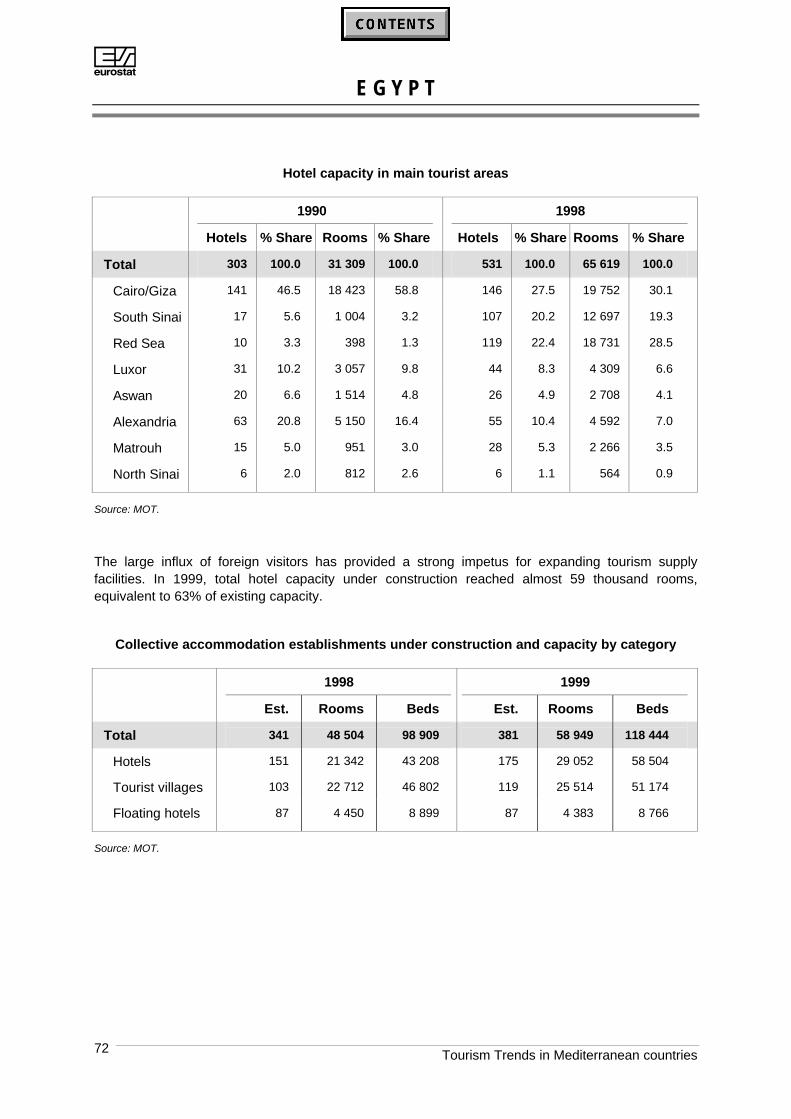
AE G Y P T
Tourism Trends in Mediterranean countries72
Hotel capacity in main tourist areas
1990 1998
Hotels % Share Rooms % Share Hotels % Share Rooms % Share
Total 303 100.0 31 309 100.0 531 100.0 65 619 100.0
Cairo/Giza 141 46.5 18 423 58.8 146 27.5 19 752 30.1
South Sinai 17 5.6 1 004 3.2 107 20.2 12 697 19.3
Red Sea 10 3.3 398 1.3 119 22.4 18 731 28.5
Luxor 31 10.2 3 057 9.8 44 8.3 4 309 6.6
Aswan 20 6.6 1 514 4.8 26 4.9 2 708 4.1
Alexandria 63 20.8 5 150 16.4 55 10.4 4 592 7.0
Matrouh 15 5.0 951 3.0 28 5.3 2 266 3.5
North Sinai 6 2.0 812 2.6 6 1.1 564 0.9
Source: MOT.
The large influx of foreign visitors has provided a strong impetus for expanding tourism supplyfacilities. In 1999, total hotel capacity under construction reached almost 59 thousand rooms,equivalent to 63% of existing capacity.
Collective accommodation establishments under construction and capacity by category
1998 1999
Est. Rooms Beds Est. Rooms Beds
Total 341 48 504 98 909 381 58 949 118 444
Hotels 151 21 342 43 208 175 29 052 58 504
Tourist villages 103 22 712 46 802 119 25 514 51 174
Floating hotels 87 4 450 8 899 87 4 383 8 766
Source: MOT.
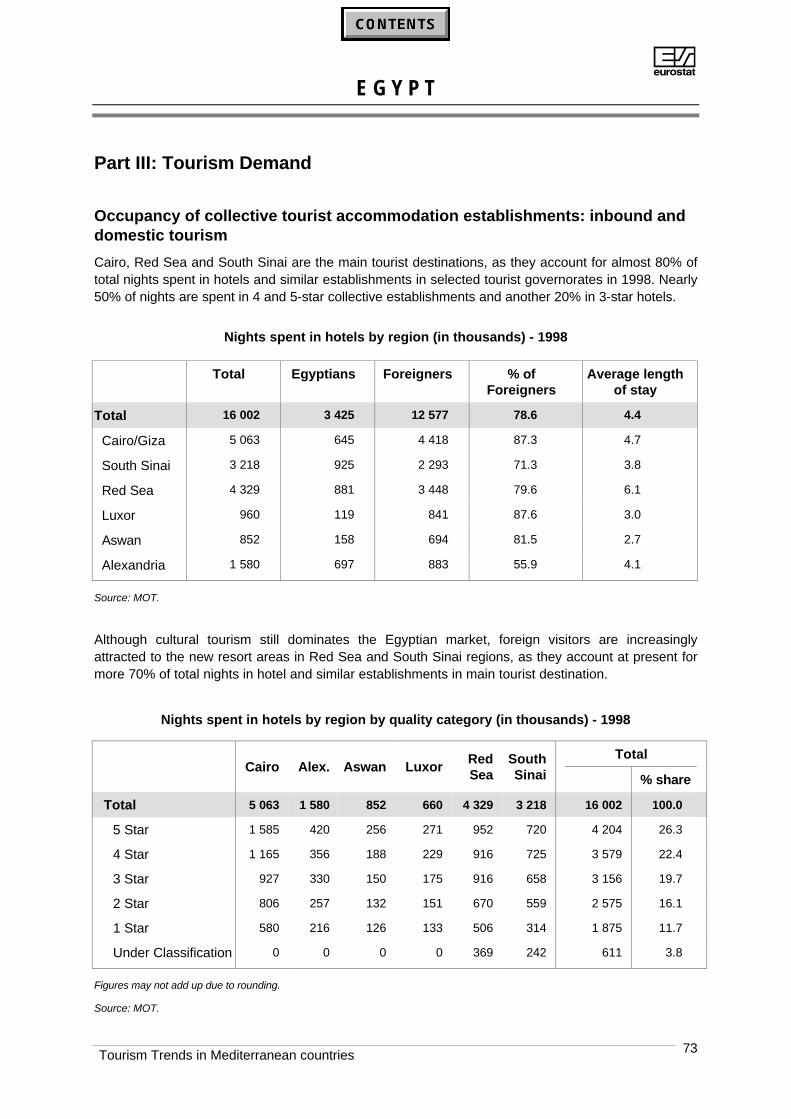
AE G Y P T
Tourism Trends in Mediterranean countries 73
Part III: Tourism Demand
Occupancy of collective tourist accommodation establishments: inbound anddomestic tourism
Cairo, Red Sea and South Sinai are the main tourist destinations, as they account for almost 80% oftotal nights spent in hotels and similar establishments in selected tourist governorates in 1998. Nearly50% of nights are spent in 4 and 5-star collective establishments and another 20% in 3-star hotels.
Nights spent in hotels by region (in thousands) - 1998
Total Egyptians Foreigners % ofForeigners
Average lengthof stay
Total 16 002 3 425 12 577 78.6 4.4
Cairo/Giza 5 063 645 4 418 87.3 4.7
South Sinai 3 218 925 2 293 71.3 3.8
Red Sea 4 329 881 3 448 79.6 6.1
Luxor 960 119 841 87.6 3.0
Aswan 852 158 694 81.5 2.7
Alexandria 1 580 697 883 55.9 4.1
Source: MOT.
Although cultural tourism still dominates the Egyptian market, foreign visitors are increasinglyattracted to the new resort areas in Red Sea and South Sinai regions, as they account at present formore 70% of total nights in hotel and similar establishments in main tourist destination.
Nights spent in hotels by region by quality category (in thousands) - 1998
TotalCairo Alex. Aswan Luxor
RedSea
SouthSinai % share
Total 5 063 1 580 852 660 4 329 3 218 16 002 100.0
5 Star 1 585 420 256 271 952 720 4 204 26.3
4 Star 1 165 356 188 229 916 725 3 579 22.4
3 Star 927 330 150 175 916 658 3 156 19.7
2 Star 806 257 132 151 670 559 2 575 16.1
1 Star 580 216 126 133 506 314 1 875 11.7
Under Classification 0 0 0 0 369 242 611 3.8
Figures may not add up due to rounding.
Source: MOT.

AE G Y P T
Tourism Trends in Mediterranean countries74
As for inbound tourism nights in hotels, tourist villages and floating hotels, their number totalled 31million in 1999 compared to only 9 million in 1985 and to less than 20 million in 1990. Over 70% oftourist nights in that year were made by European visitors. The share of EU countries amounts to58%, compared to 17% for Middle East countries, and to only 5% for Americans.
Nights spent by non-residents in tourist accommodation1 by country of residence
(in thousands) 1995 1996 1997 1998 1999 % 99/95
Total 20 451 23 765 26 579 20 151 31 002 51.6
Europe 10 744 14 370 16 827 11 730 22 057 105.3
% share of Europe 52.5 60.5 63.3 58.2 71.1 . .
EU15 8 360 11 111 13 526 8 791 18 101 116.5
% share of EU15 40.9 46.8 50.9 43.6 58.4 . .
Rest of Europe 2 384 3 259 3 301 2 939 3 956 65.9
Americas 1 462 1 471 1 694 1 297 1 699 16.2
Africa 1 051 815 868 845 935 -11.0
Asia 1 380 1 433 1 524 850 1 104 -20.0
Middle East 5 789 5 650 5 646 5 412 5 191 -10.3
Others 26 20 20 17 16 -38.5
(1) Hotels, tourist villages and floating hotels
Source: MOT.
Nights spent by non residents in tourist accommodation1 (in thousands)
0
4 000
8 000
12 000
16 000
20 000
24 000
28 000
32 000
1985 1990 1991 1992 1993 1994 1995 1996 1997 1998 1999
(1) Hotels, tourist villages and floating hotels
Source: MOT.
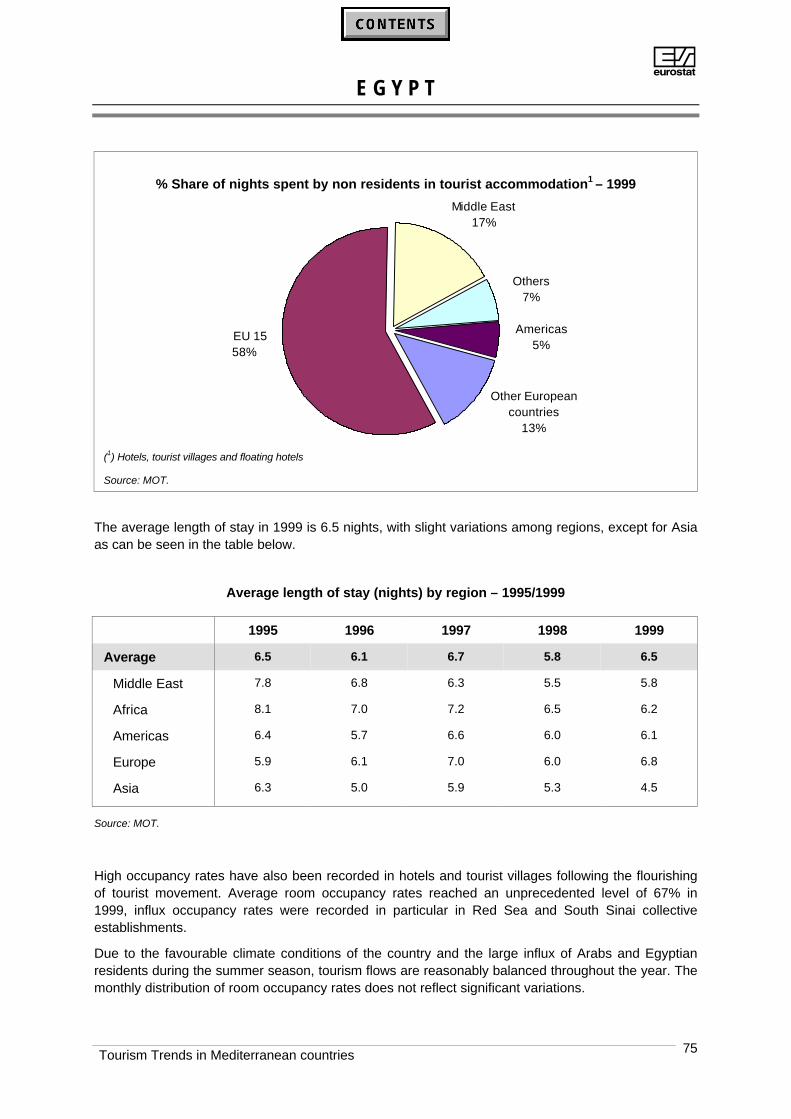
AE G Y P T
Tourism Trends in Mediterranean countries 75
% Share of nights spent by non residents in tourist accommodation1 – 1999
Other European countries
13%
Middle East17%
Others7%
Americas5%
EU 1558%
(1) Hotels, tourist villages and floating hotels
Source: MOT.
The average length of stay in 1999 is 6.5 nights, with slight variations among regions, except for Asiaas can be seen in the table below.
Average length of stay (nights) by region – 1995/1999
1995 1996 1997 1998 1999
Average 6.5 6.1 6.7 5.8 6.5
Middle East 7.8 6.8 6.3 5.5 5.8
Africa 8.1 7.0 7.2 6.5 6.2
Americas 6.4 5.7 6.6 6.0 6.1
Europe 5.9 6.1 7.0 6.0 6.8
Asia 6.3 5.0 5.9 5.3 4.5
Source: MOT.
High occupancy rates have also been recorded in hotels and tourist villages following the flourishingof tourist movement. Average room occupancy rates reached an unprecedented level of 67% in1999, influx occupancy rates were recorded in particular in Red Sea and South Sinai collectiveestablishments.
Due to the favourable climate conditions of the country and the large influx of Arabs and Egyptianresidents during the summer season, tourism flows are reasonably balanced throughout the year. Themonthly distribution of room occupancy rates does not reflect significant variations.
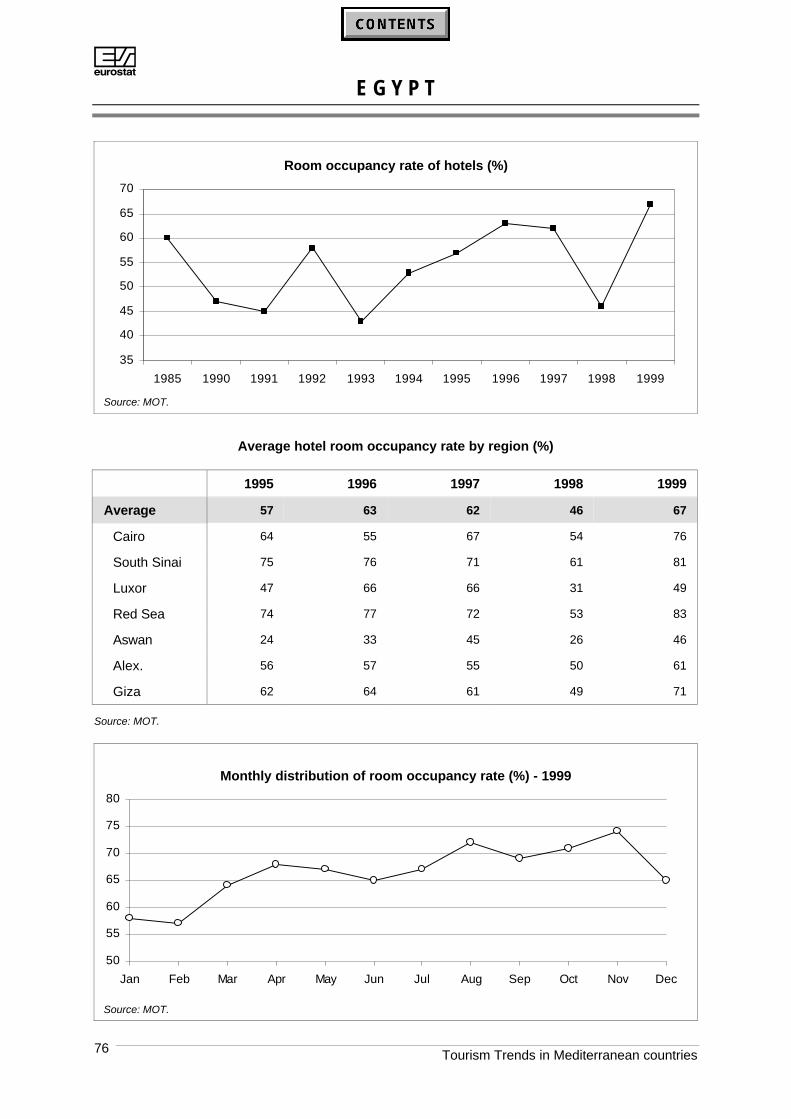
AE G Y P T
Tourism Trends in Mediterranean countries76
Room occupancy rate of hotels (%)
35
40
45
50
55
60
65
70
1985 1990 1991 1992 1993 1994 1995 1996 1997 1998 1999
Source: MOT.
Average hotel room occupancy rate by region (%)
1995 1996 1997 1998 1999
Average 57 63 62 46 67
Cairo 64 55 67 54 76
South Sinai 75 76 71 61 81
Luxor 47 66 66 31 49
Red Sea 74 77 72 53 83
Aswan 24 33 45 26 46
Alex. 56 57 55 50 61
Giza 62 64 61 49 71
Source: MOT.
Monthly distribution of room occupancy rate (%) - 1999
50
55
60
65
70
75
80
Jan Feb Mar Apr May Jun Jul Aug Sep Oct Nov Dec
Source: MOT.

AE G Y P T
Tourism Trends in Mediterranean countries 77
Tourism demand: Inbound and National Tourism
During the past fifteen years, the tourism sector has witnessed a boost. The number of foreign visitorsincreased from 1.5 million to nearly 4.8 million throughout the period 1985-1999. The recovery fromLuxor incident (Nov. 1997) has been quite remarkable, as the 1999 figure registers an increase ofabout 39% compared to 1998. The breakdown of foreign visitors into tourists and same-day visitorsreveals the modest magnitude of the latter group, which accounts on average for 8% of total inboundflows.
Arrivals of foreign visitors at the borders (in thousands)
1985 1990 1995 1996 1997 1998 1999 % 99/95
Total 1 518 2 600 3 134 3 896 3 961 3 454 4 797 53.1
Tourists 1 406 2 411 2 872 3 527 3 656 3 213 4 490 56.3
% share of total 92.6 92.7 91.6 90.6 92.3 93.0 93.6 . .
Same day visitors 112 189 262 368 305 241 307 17.2
% share of total 7.4 7.3 8.4 9.4 7.7 7.0 6.4 . .
Growth rates (% change)
90/85 95/90 96/95 97/96 98/97 99/98
Total 71.3 20.5 24.3 1.7 -12.8 38.9
Tourists 71.5 19.1 22.8 3.7 -12.1 39.7
Same day visitors 68.8 38.6 40.5 -17.1 -21.0 27.4
Source: MOT.
Top ten generating countries - foreign visitor arrivals (in thousands)
1995 1999
Rank ArrivalsMarket
Share (%)Rank Arrivals
MarketShare (%)
Total top ten 1 987 63.4 Total top ten 3 188 66.4
Germany 1 319 10.2 Italy 1 668 13.9
Israel 2 296 9.4 Germany 2 548 11.4
UK 3 292 9.3 Israel 3 415 8.7
Italy 4 257 8.2 UK 4 336 7.0
Saudi Arabia 5 179 5.7 France 5 313 6.5
Libya 6 156 5.0 Saudi Arabia 6 241 5.0
USA 7 155 5.0 USA 7 196 4.1
France 8 122 3.9 USSR (former) 8 165 3.4
USSR (former) 9 112 3.6 Palestine 9 160 3.3
Palestine 10 99 3.1 Libya 10 146 3.1
Source: MOT.
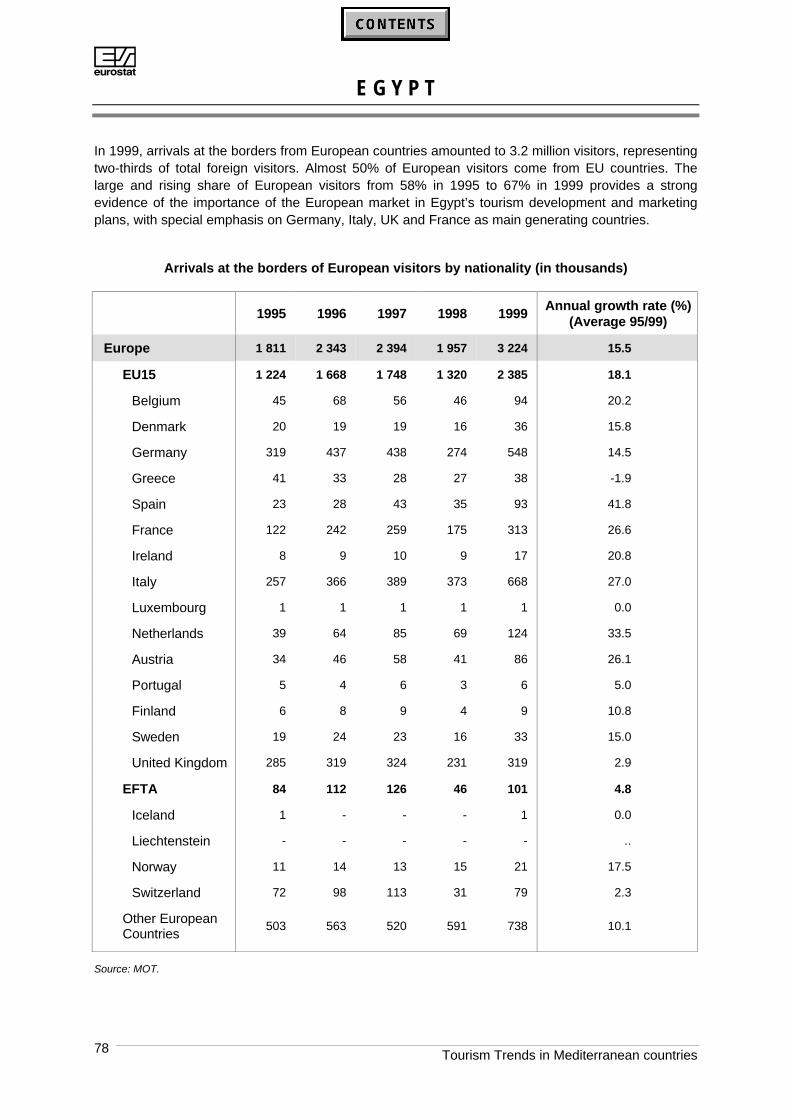
AE G Y P T
Tourism Trends in Mediterranean countries78
In 1999, arrivals at the borders from European countries amounted to 3.2 million visitors, representingtwo-thirds of total foreign visitors. Almost 50% of European visitors come from EU countries. Thelarge and rising share of European visitors from 58% in 1995 to 67% in 1999 provides a strongevidence of the importance of the European market in Egypt’s tourism development and marketingplans, with special emphasis on Germany, Italy, UK and France as main generating countries.
Arrivals at the borders of European visitors by nationality (in thousands)
1995 1996 1997 1998 1999Annual growth rate (%)
(Average 95/99)
Europe 1 811 2 343 2 394 1 957 3 224 15.5
EU15 1 224 1 668 1 748 1 320 2 385 18.1
Belgium 45 68 56 46 94 20.2
Denmark 20 19 19 16 36 15.8
Germany 319 437 438 274 548 14.5
Greece 41 33 28 27 38 -1.9
Spain 23 28 43 35 93 41.8
France 122 242 259 175 313 26.6
Ireland 8 9 10 9 17 20.8
Italy 257 366 389 373 668 27.0
Luxembourg 1 1 1 1 1 0.0
Netherlands 39 64 85 69 124 33.5
Austria 34 46 58 41 86 26.1
Portugal 5 4 6 3 6 5.0
Finland 6 8 9 4 9 10.8
Sweden 19 24 23 16 33 15.0
United Kingdom 285 319 324 231 319 2.9
EFTA 84 112 126 46 101 4.8
Iceland 1 - - - 1 0.0
Liechtenstein - - - - - ..
Norway 11 14 13 15 21 17.5
Switzerland 72 98 113 31 79 2.3
Other EuropeanCountries
503 563 520 591 738 10.1
Source: MOT.
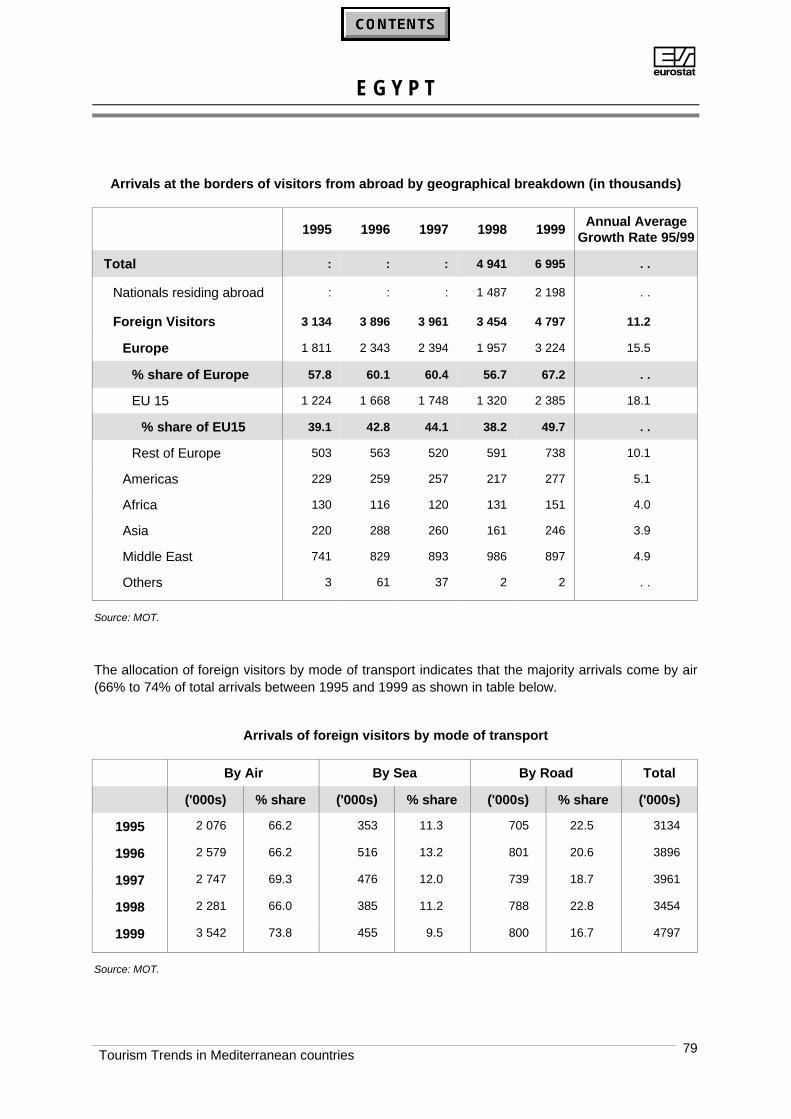
AE G Y P T
Tourism Trends in Mediterranean countries 79
Arrivals at the borders of visitors from abroad by geographical breakdown (in thousands)
1995 1996 1997 1998 1999Annual Average
Growth Rate 95/99
Total : : : 4 941 6 995 . .
Nationals residing abroad : : : 1 487 2 198 . .
Foreign Visitors 3 134 3 896 3 961 3 454 4 797 11.2
Europe 1 811 2 343 2 394 1 957 3 224 15.5
% share of Europe 57.8 60.1 60.4 56.7 67.2 . .
EU 15 1 224 1 668 1 748 1 320 2 385 18.1
% share of EU15 39.1 42.8 44.1 38.2 49.7 . .
Rest of Europe 503 563 520 591 738 10.1
Americas 229 259 257 217 277 5.1
Africa 130 116 120 131 151 4.0
Asia 220 288 260 161 246 3.9
Middle East 741 829 893 986 897 4.9
Others 3 61 37 2 2 . .
Source: MOT.
The allocation of foreign visitors by mode of transport indicates that the majority arrivals come by air(66% to 74% of total arrivals between 1995 and 1999 as shown in table below.
Arrivals of foreign visitors by mode of transport
By Air By Sea By Road Total
('000s) % share ('000s) % share ('000s) % share ('000s)
1995 2 076 66.2 353 11.3 705 22.5 3134
1996 2 579 66.2 516 13.2 801 20.6 3896
1997 2 747 69.3 476 12.0 739 18.7 3961
1998 2 281 66.0 385 11.2 788 22.8 3454
1999 3 542 73.8 455 9.5 800 16.7 4797
Source: MOT.
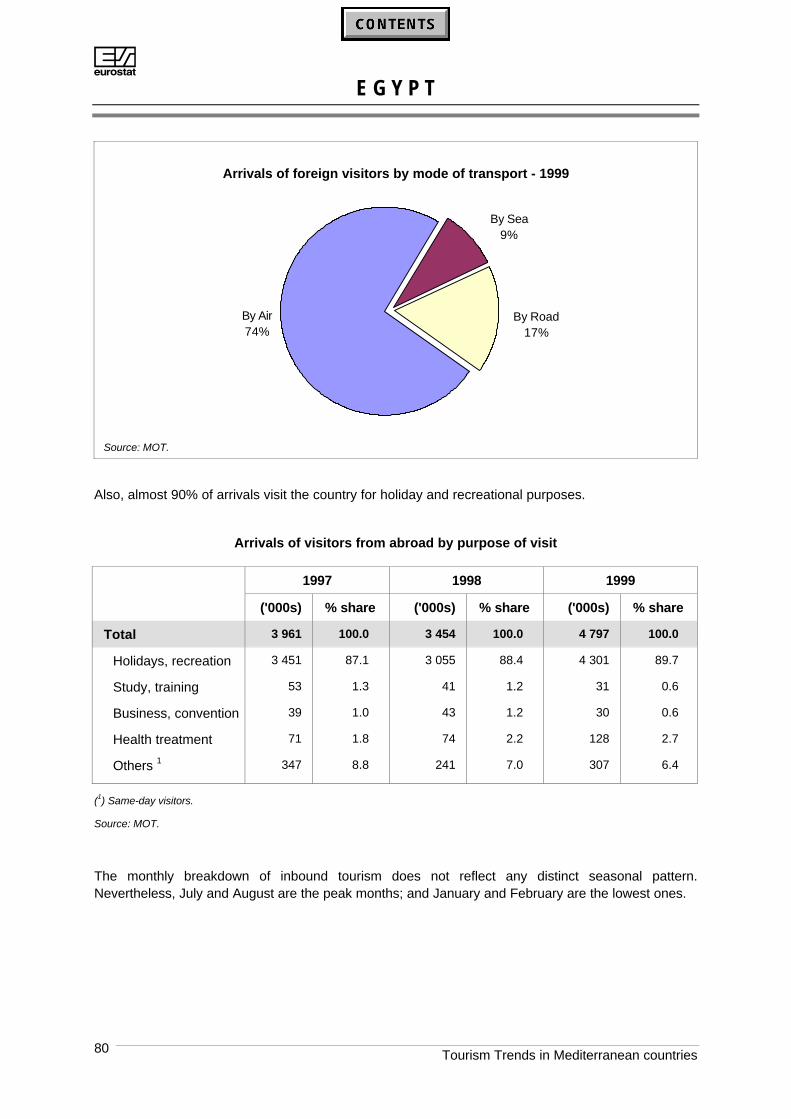
AE G Y P T
Tourism Trends in Mediterranean countries80
Arrivals of foreign visitors by mode of transport - 1999
By Sea9%
By Road17%
By Air74%
Source: MOT.
Also, almost 90% of arrivals visit the country for holiday and recreational purposes.
Arrivals of visitors from abroad by purpose of visit
1997 1998 1999
('000s) % share ('000s) % share ('000s) % share
Total 3 961 100.0 3 454 100.0 4 797 100.0
Holidays, recreation 3 451 87.1 3 055 88.4 4 301 89.7
Study, training 53 1.3 41 1.2 31 0.6
Business, convention 39 1.0 43 1.2 30 0.6
Health treatment 71 1.8 74 2.2 128 2.7
Others 1 347 8.8 241 7.0 307 6.4
(1) Same-day visitors.
Source: MOT.
The monthly breakdown of inbound tourism does not reflect any distinct seasonal pattern.Nevertheless, July and August are the peak months; and January and February are the lowest ones.
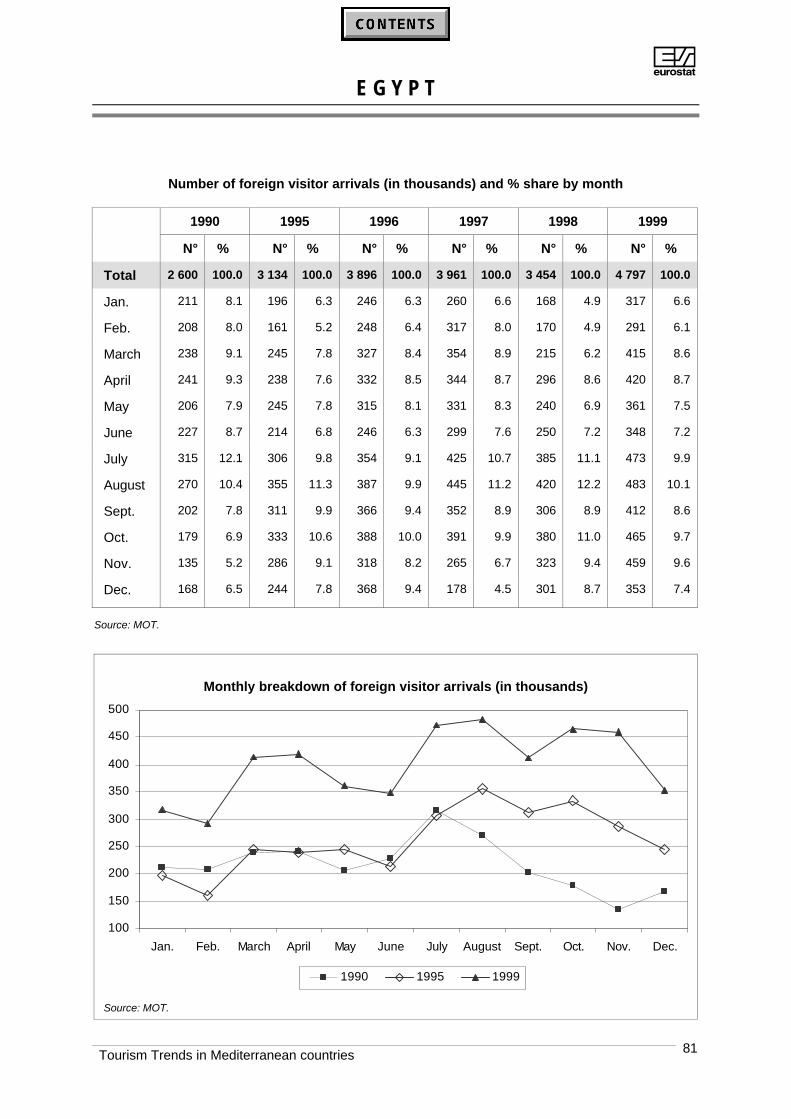
AE G Y P T
Tourism Trends in Mediterranean countries 81
Number of foreign visitor arrivals (in thousands) and % share by month
1990 1995 1996 1997 1998 1999
N° % N° % N° % N° % N° % N° %
Total 2 600 100.0 3 134 100.0 3 896 100.0 3 961 100.0 3 454 100.0 4 797 100.0
Jan. 211 8.1 196 6.3 246 6.3 260 6.6 168 4.9 317 6.6
Feb. 208 8.0 161 5.2 248 6.4 317 8.0 170 4.9 291 6.1
March 238 9.1 245 7.8 327 8.4 354 8.9 215 6.2 415 8.6
April 241 9.3 238 7.6 332 8.5 344 8.7 296 8.6 420 8.7
May 206 7.9 245 7.8 315 8.1 331 8.3 240 6.9 361 7.5
June 227 8.7 214 6.8 246 6.3 299 7.6 250 7.2 348 7.2
July 315 12.1 306 9.8 354 9.1 425 10.7 385 11.1 473 9.9
August 270 10.4 355 11.3 387 9.9 445 11.2 420 12.2 483 10.1
Sept. 202 7.8 311 9.9 366 9.4 352 8.9 306 8.9 412 8.6
Oct. 179 6.9 333 10.6 388 10.0 391 9.9 380 11.0 465 9.7
Nov. 135 5.2 286 9.1 318 8.2 265 6.7 323 9.4 459 9.6
Dec. 168 6.5 244 7.8 368 9.4 178 4.5 301 8.7 353 7.4
Source: MOT.
Monthly breakdown of foreign visitor arrivals (in thousands)
100
150
200
250
300
350
400
450
500
Jan. Feb. March April May June July August Sept. Oct. Nov. Dec.
1990 1995 1999
Source: MOT.
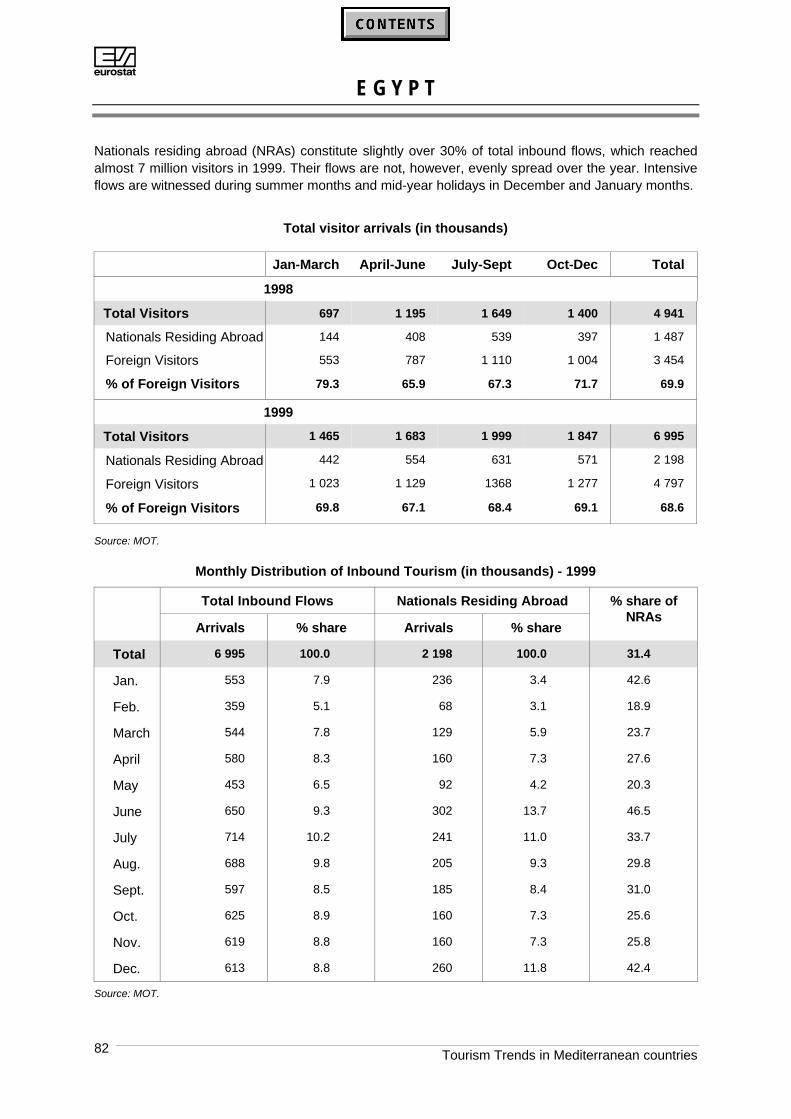
AE G Y P T
Tourism Trends in Mediterranean countries82
Nationals residing abroad (NRAs) constitute slightly over 30% of total inbound flows, which reachedalmost 7 million visitors in 1999. Their flows are not, however, evenly spread over the year. Intensiveflows are witnessed during summer months and mid-year holidays in December and January months.
Total visitor arrivals (in thousands)
Jan-March April-June July-Sept Oct-Dec Total
1998
Total Visitors 697 1 195 1 649 1 400 4 941
Nationals Residing Abroad 144 408 539 397 1 487
Foreign Visitors 553 787 1 110 1 004 3 454
% of Foreign Visitors 79.3 65.9 67.3 71.7 69.9
1999
Total Visitors 1 465 1 683 1 999 1 847 6 995
Nationals Residing Abroad 442 554 631 571 2 198
Foreign Visitors 1 023 1 129 1368 1 277 4 797
% of Foreign Visitors 69.8 67.1 68.4 69.1 68.6
Source: MOT.
Monthly Distribution of Inbound Tourism (in thousands) - 1999
Total Inbound Flows Nationals Residing Abroad
Arrivals % share Arrivals % share
% share ofNRAs
Total 6 995 100.0 2 198 100.0 31.4
Jan. 553 7.9 236 3.4 42.6
Feb. 359 5.1 68 3.1 18.9
March 544 7.8 129 5.9 23.7
April 580 8.3 160 7.3 27.6
May 453 6.5 92 4.2 20.3
June 650 9.3 302 13.7 46.5
July 714 10.2 241 11.0 33.7
Aug. 688 9.8 205 9.3 29.8
Sept. 597 8.5 185 8.4 31.0
Oct. 625 8.9 160 7.3 25.6
Nov. 619 8.8 160 7.3 25.8
Dec. 613 8.8 260 11.8 42.4
Source: MOT.
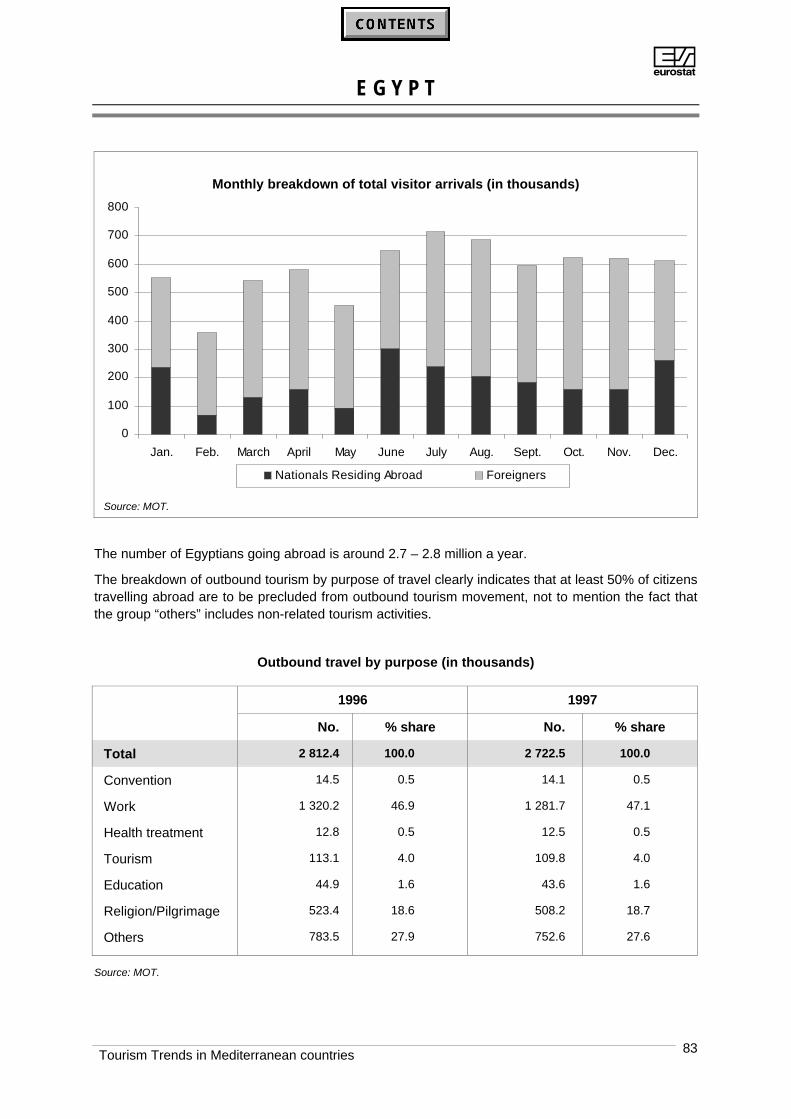
AE G Y P T
Tourism Trends in Mediterranean countries 83
Monthly breakdown of total visitor arrivals (in thousands)
0
100
200
300
400
500
600
700
800
Jan. Feb. March April May June July Aug. Sept. Oct. Nov. Dec.
Nationals Residing Abroad Foreigners
Source: MOT.
The number of Egyptians going abroad is around 2.7 – 2.8 million a year.
The breakdown of outbound tourism by purpose of travel clearly indicates that at least 50% of citizenstravelling abroad are to be precluded from outbound tourism movement, not to mention the fact thatthe group “others” includes non-related tourism activities.
Outbound travel by purpose (in thousands)
1996 1997
No. % share No. % share
Total 2 812.4 100.0 2 722.5 100.0
Convention 14.5 0.5 14.1 0.5
Work 1 320.2 46.9 1 281.7 47.1
Health treatment 12.8 0.5 12.5 0.5
Tourism 113.1 4.0 109.8 4.0
Education 44.9 1.6 43.6 1.6
Religion/Pilgrimage 523.4 18.6 508.2 18.7
Others 783.5 27.9 752.6 27.6
Source: MOT.
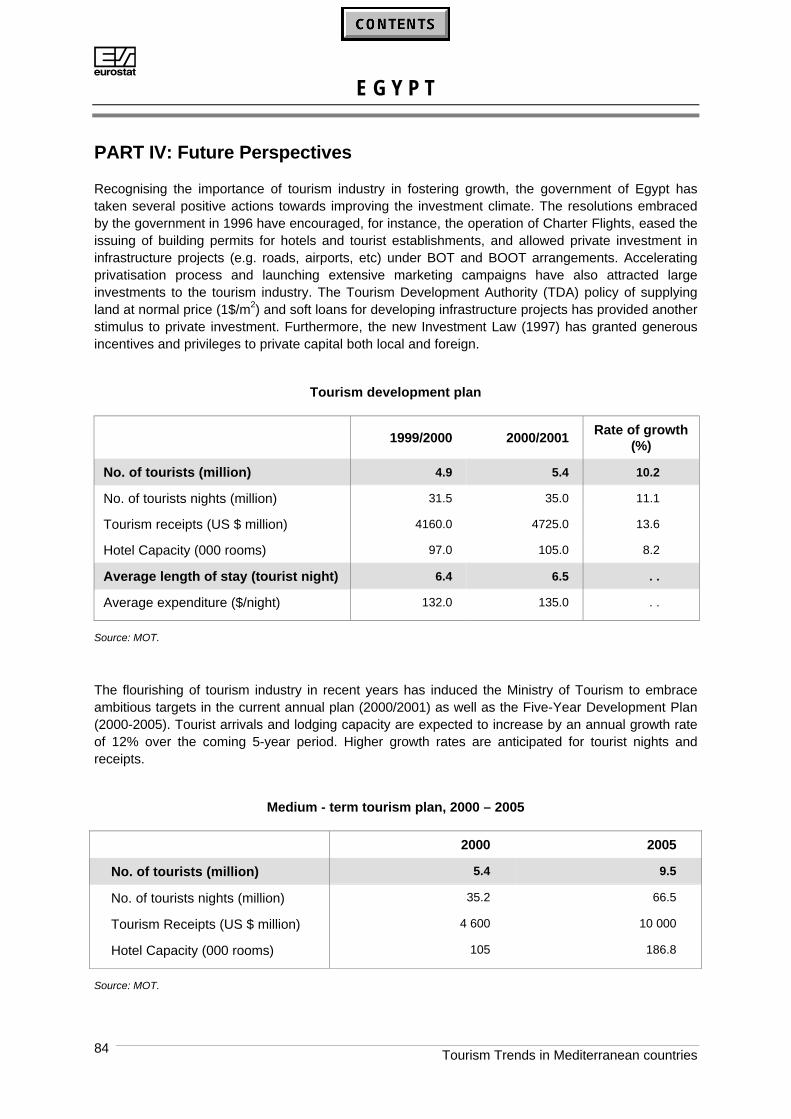
AE G Y P T
Tourism Trends in Mediterranean countries84
PART IV: Future Perspectives
Recognising the importance of tourism industry in fostering growth, the government of Egypt hastaken several positive actions towards improving the investment climate. The resolutions embracedby the government in 1996 have encouraged, for instance, the operation of Charter Flights, eased theissuing of building permits for hotels and tourist establishments, and allowed private investment ininfrastructure projects (e.g. roads, airports, etc) under BOT and BOOT arrangements. Acceleratingprivatisation process and launching extensive marketing campaigns have also attracted largeinvestments to the tourism industry. The Tourism Development Authority (TDA) policy of supplyingland at normal price (1$/m2) and soft loans for developing infrastructure projects has provided anotherstimulus to private investment. Furthermore, the new Investment Law (1997) has granted generousincentives and privileges to private capital both local and foreign.
Tourism development plan
1999/2000 2000/2001Rate of growth
(%)
No. of tourists (million) 4.9 5.4 10.2
No. of tourists nights (million) 31.5 35.0 11.1
Tourism receipts (US $ million) 4160.0 4725.0 13.6
Hotel Capacity (000 rooms) 97.0 105.0 8.2
Average length of stay (tourist night) 6.4 6.5 . .
Average expenditure ($/night) 132.0 135.0 . .
Source: MOT.
The flourishing of tourism industry in recent years has induced the Ministry of Tourism to embraceambitious targets in the current annual plan (2000/2001) as well as the Five-Year Development Plan(2000-2005). Tourist arrivals and lodging capacity are expected to increase by an annual growth rateof 12% over the coming 5-year period. Higher growth rates are anticipated for tourist nights andreceipts.
Medium - term tourism plan, 2000 – 2005
2000 2005
No. of tourists (million) 5.4 9.5
No. of tourists nights (million) 35.2 66.5
Tourism Receipts (US $ million) 4 600 10 000
Hotel Capacity (000 rooms) 105 186.8
Source: MOT.
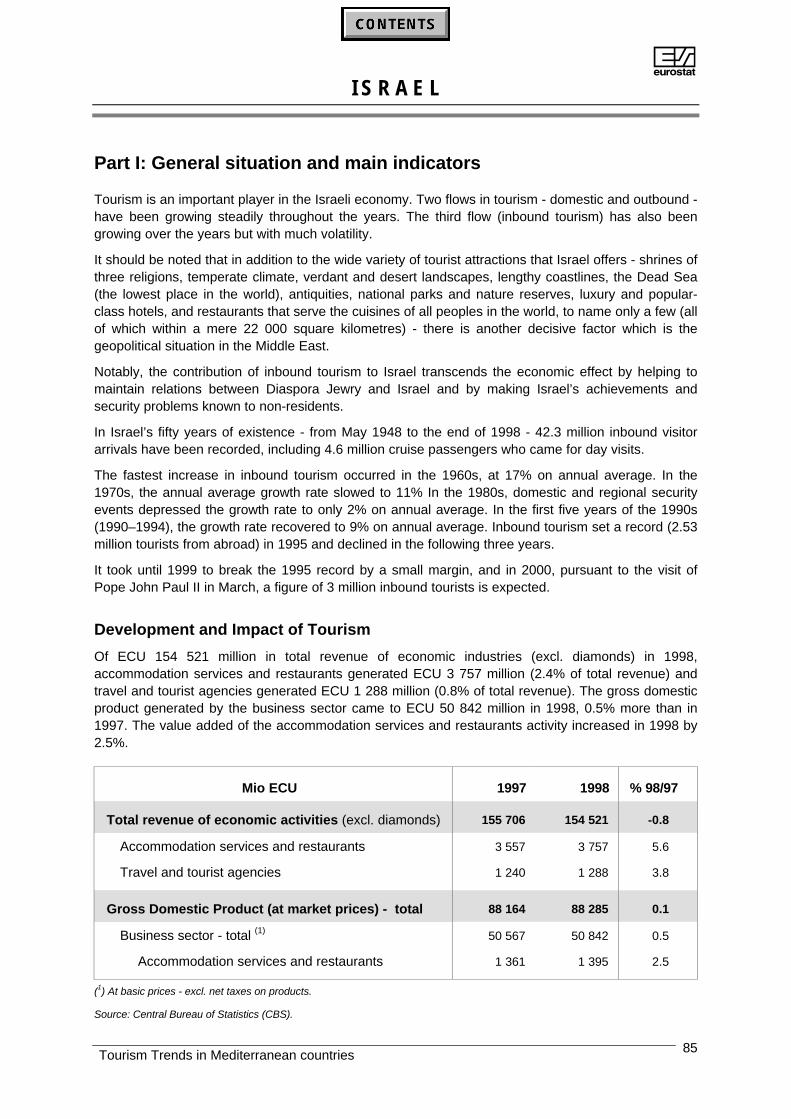
AI S R A E L
Tourism Trends in Mediterranean countries 85
Part I: General situation and main indicators
Tourism is an important player in the Israeli economy. Two flows in tourism - domestic and outbound -have been growing steadily throughout the years. The third flow (inbound tourism) has also beengrowing over the years but with much volatility.
It should be noted that in addition to the wide variety of tourist attractions that Israel offers - shrines ofthree religions, temperate climate, verdant and desert landscapes, lengthy coastlines, the Dead Sea(the lowest place in the world), antiquities, national parks and nature reserves, luxury and popular-class hotels, and restaurants that serve the cuisines of all peoples in the world, to name only a few (allof which within a mere 22 000 square kilometres) - there is another decisive factor which is thegeopolitical situation in the Middle East.
Notably, the contribution of inbound tourism to Israel transcends the economic effect by helping tomaintain relations between Diaspora Jewry and Israel and by making Israel’s achievements andsecurity problems known to non-residents.
In Israel’s fifty years of existence - from May 1948 to the end of 1998 - 42.3 million inbound visitorarrivals have been recorded, including 4.6 million cruise passengers who came for day visits.
The fastest increase in inbound tourism occurred in the 1960s, at 17% on annual average. In the1970s, the annual average growth rate slowed to 11% In the 1980s, domestic and regional securityevents depressed the growth rate to only 2% on annual average. In the first five years of the 1990s(1990–1994), the growth rate recovered to 9% on annual average. Inbound tourism set a record (2.53million tourists from abroad) in 1995 and declined in the following three years.
It took until 1999 to break the 1995 record by a small margin, and in 2000, pursuant to the visit ofPope John Paul II in March, a figure of 3 million inbound tourists is expected.
Development and Impact of Tourism
Of ECU 154 521 million in total revenue of economic industries (excl. diamonds) in 1998,accommodation services and restaurants generated ECU 3 757 million (2.4% of total revenue) andtravel and tourist agencies generated ECU 1 288 million (0.8% of total revenue). The gross domesticproduct generated by the business sector came to ECU 50 842 million in 1998, 0.5% more than in1997. The value added of the accommodation services and restaurants activity increased in 1998 by2.5%.
Mio ECU 1997 1998 % 98/97
Total revenue of economic activities (excl. diamonds) 155 706 154 521 -0.8
Accommodation services and restaurants 3 557 3 757 5.6
Travel and tourist agencies 1 240 1 288 3.8
Gross Domestic Product (at market prices) - total 88 164 88 285 0.1
Business sector - total (1) 50 567 50 842 0.5
Accommodation services and restaurants 1 361 1 395 2.5
(1) At basic prices - excl. net taxes on products.
Source: Central Bureau of Statistics (CBS).
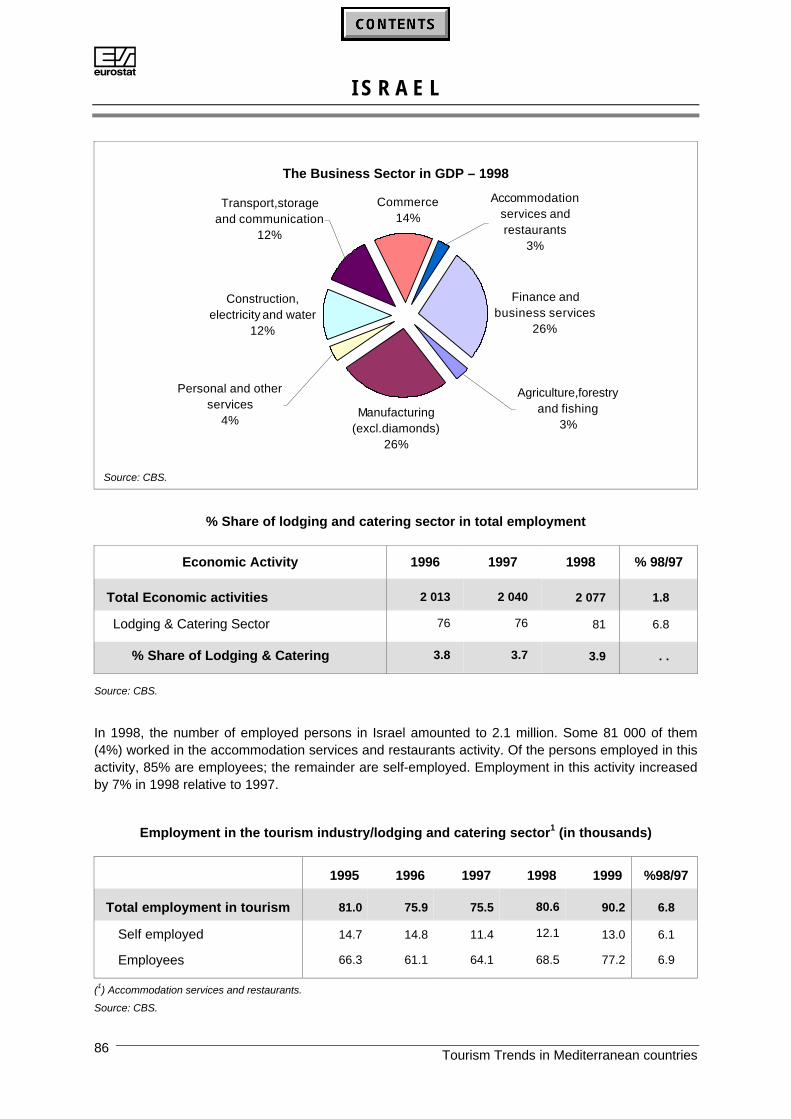
AI S R A E L
Tourism Trends in Mediterranean countries86
The Business Sector in GDP – 1998
Construction, electricity and water
12%
Agriculture,forestry and fishing
3%
Finance and business services
26%
Accommodationservices and restaurants
3%
Commerce14%
Transport,storage and communication
12%
Manufacturing (excl.diamonds)
26%
Personal and other services
4%
Source: CBS.
% Share of lodging and catering sector in total employment
Economic Activity 1996 1997 1998 % 98/97
Total Economic activities 2 013 2 040 2 077 1.8
Lodging & Catering Sector 76 76 81 6.8
% Share of Lodging & Catering 3.8 3.7 3.9 . .
Source: CBS.
In 1998, the number of employed persons in Israel amounted to 2.1 million. Some 81 000 of them(4%) worked in the accommodation services and restaurants activity. Of the persons employed in thisactivity, 85% are employees; the remainder are self-employed. Employment in this activity increasedby 7% in 1998 relative to 1997.
Employment in the tourism industry/lodging and catering sector1 (in thousands)
1995 1996 1997 1998 1999 %98/97
Total employment in tourism 81.0 75.9 75.5 80.6 90.2 6.8
Self employed 14.7 14.8 11.4 12.1 13.0 6.1
Employees 66.3 61.1 64.1 68.5 77.2 6.9
(1) Accommodation services and restaurants.
Source: CBS.
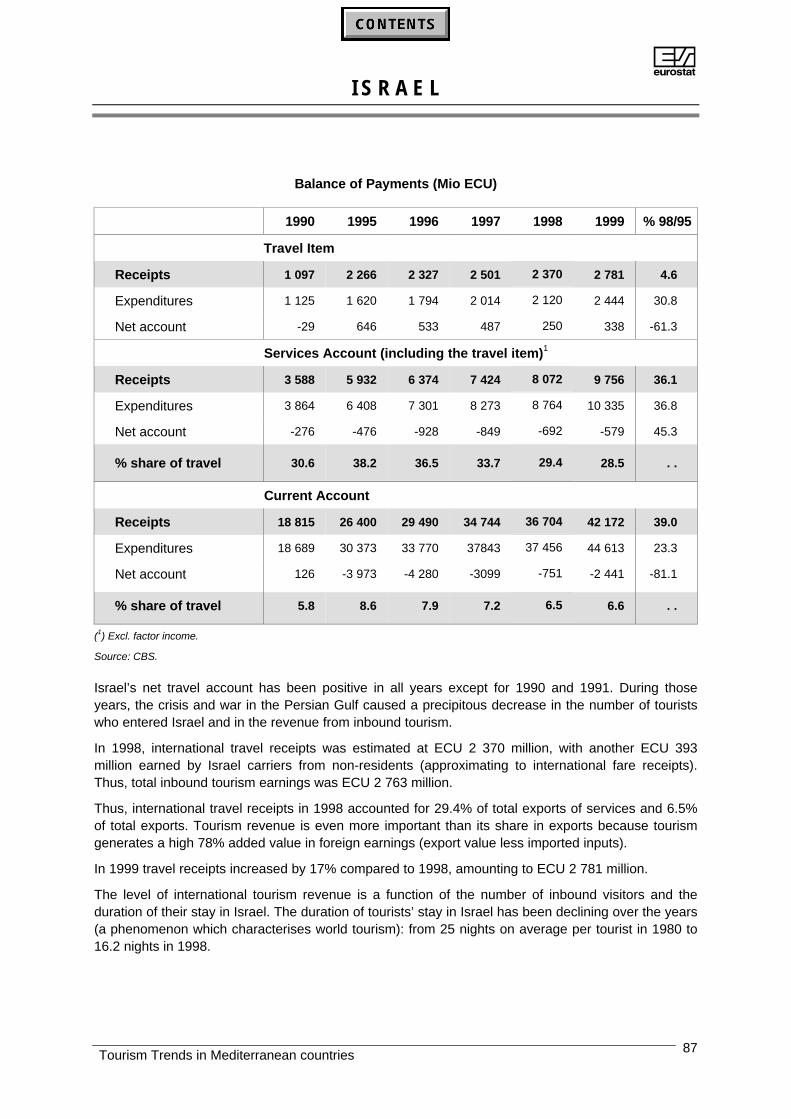
AI S R A E L
Tourism Trends in Mediterranean countries 87
Balance of Payments (Mio ECU)
1990 1995 1996 1997 1998 1999 % 98/95
Travel Item
Receipts 1 097 2 266 2 327 2 501 2 370 2 781 4.6
Expenditures 1 125 1 620 1 794 2 014 2 120 2 444 30.8
Net account -29 646 533 487 250 338 -61.3
Services Account (including the travel item)1
Receipts 3 588 5 932 6 374 7 424 8 072 9 756 36.1
Expenditures 3 864 6 408 7 301 8 273 8 764 10 335 36.8
Net account -276 -476 -928 -849 -692 -579 45.3
% share of travel 30.6 38.2 36.5 33.7 29.4 28.5 . .
Current Account
Receipts 18 815 26 400 29 490 34 744 36 704 42 172 39.0
Expenditures 18 689 30 373 33 770 37843 37 456 44 613 23.3
Net account 126 -3 973 -4 280 -3099 -751 -2 441 -81.1
% share of travel 5.8 8.6 7.9 7.2 6.5 6.6 . .
(1) Excl. factor income.
Source: CBS.
Israel’s net travel account has been positive in all years except for 1990 and 1991. During thoseyears, the crisis and war in the Persian Gulf caused a precipitous decrease in the number of touristswho entered Israel and in the revenue from inbound tourism.
In 1998, international travel receipts was estimated at ECU 2 370 million, with another ECU 393million earned by Israel carriers from non-residents (approximating to international fare receipts).Thus, total inbound tourism earnings was ECU 2 763 million.
Thus, international travel receipts in 1998 accounted for 29.4% of total exports of services and 6.5%of total exports. Tourism revenue is even more important than its share in exports because tourismgenerates a high 78% added value in foreign earnings (export value less imported inputs).
In 1999 travel receipts increased by 17% compared to 1998, amounting to ECU 2 781 million.
The level of international tourism revenue is a function of the number of inbound visitors and theduration of their stay in Israel. The duration of tourists’ stay in Israel has been declining over the years(a phenomenon which characterises world tourism): from 25 nights on average per tourist in 1980 to16.2 nights in 1998.
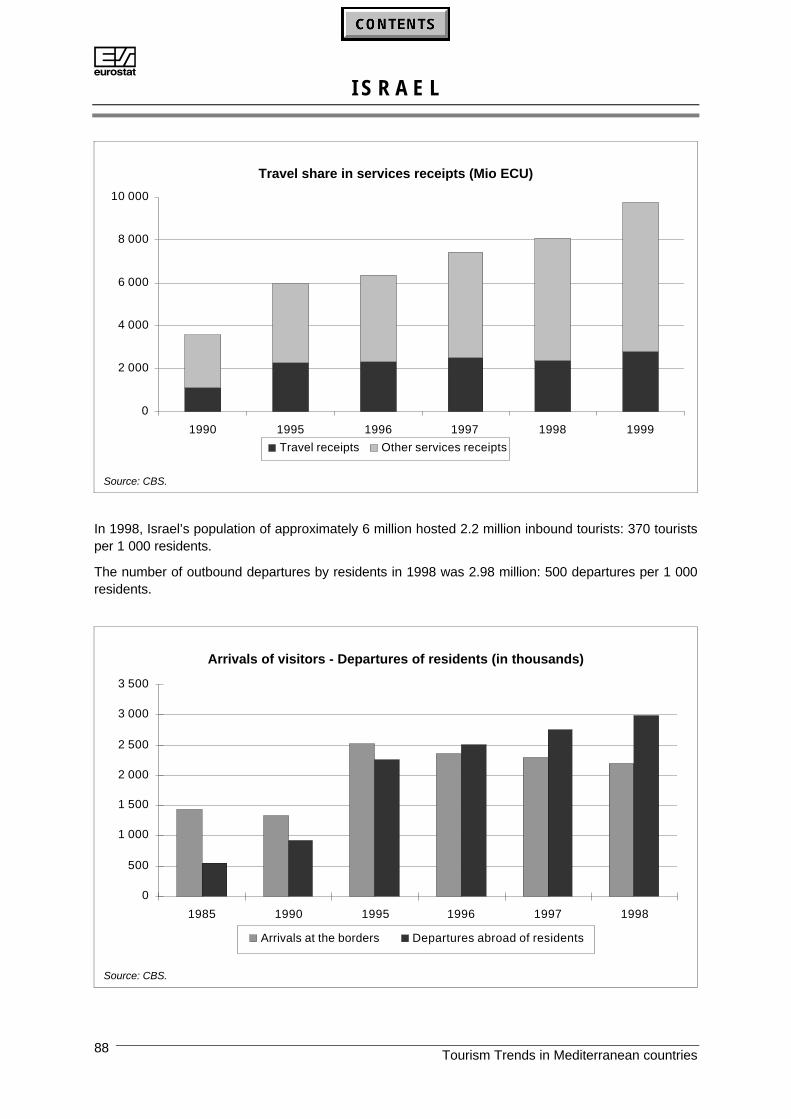
AI S R A E L
Tourism Trends in Mediterranean countries88
Travel share in services receipts (Mio ECU)
0
2 000
4 000
6 000
8 000
10 000
1990 1995 1996 1997 1998 1999
Travel receipts Other services receipts
Source: CBS.
In 1998, Israel’s population of approximately 6 million hosted 2.2 million inbound tourists: 370 touristsper 1 000 residents.
The number of outbound departures by residents in 1998 was 2.98 million: 500 departures per 1 000residents.
Arrivals of visitors - Departures of residents (in thousands)
0
500
1 000
1 500
2 000
2 500
3 000
3 500
1985 1990 1995 1996 1997 1998
Arrivals at the borders Departures abroad of residents
Source: CBS.
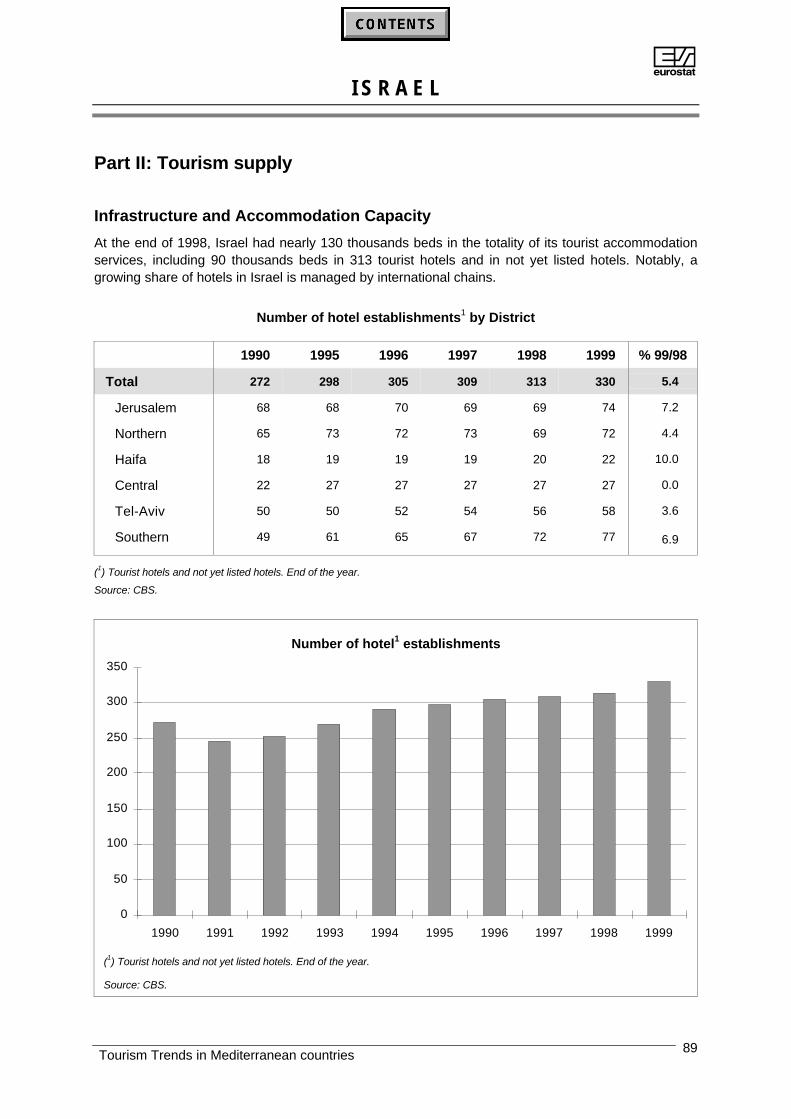
AI S R A E L
Tourism Trends in Mediterranean countries 89
Part II: Tourism supply
Infrastructure and Accommodation Capacity
At the end of 1998, Israel had nearly 130 thousands beds in the totality of its tourist accommodationservices, including 90 thousands beds in 313 tourist hotels and in not yet listed hotels. Notably, agrowing share of hotels in Israel is managed by international chains.
Number of hotel establishments1 by District
1990 1995 1996 1997 1998 1999 % 99/98
Total 272 298 305 309 313 330 5.4
Jerusalem 68 68 70 69 69 74 7.2
Northern 65 73 72 73 69 72 4.4
Haifa 18 19 19 19 20 22 10.0
Central 22 27 27 27 27 27 0.0
Tel-Aviv 50 50 52 54 56 58 3.6
Southern 49 61 65 67 72 77 6.9
(1) Tourist hotels and not yet listed hotels. End of the year.
Source: CBS.
Number of hotel1 establishments
0
50
100
150
200
250
300
350
1990 1991 1992 1993 1994 1995 1996 1997 1998 1999
(1) Tourist hotels and not yet listed hotels. End of the year.
Source: CBS.
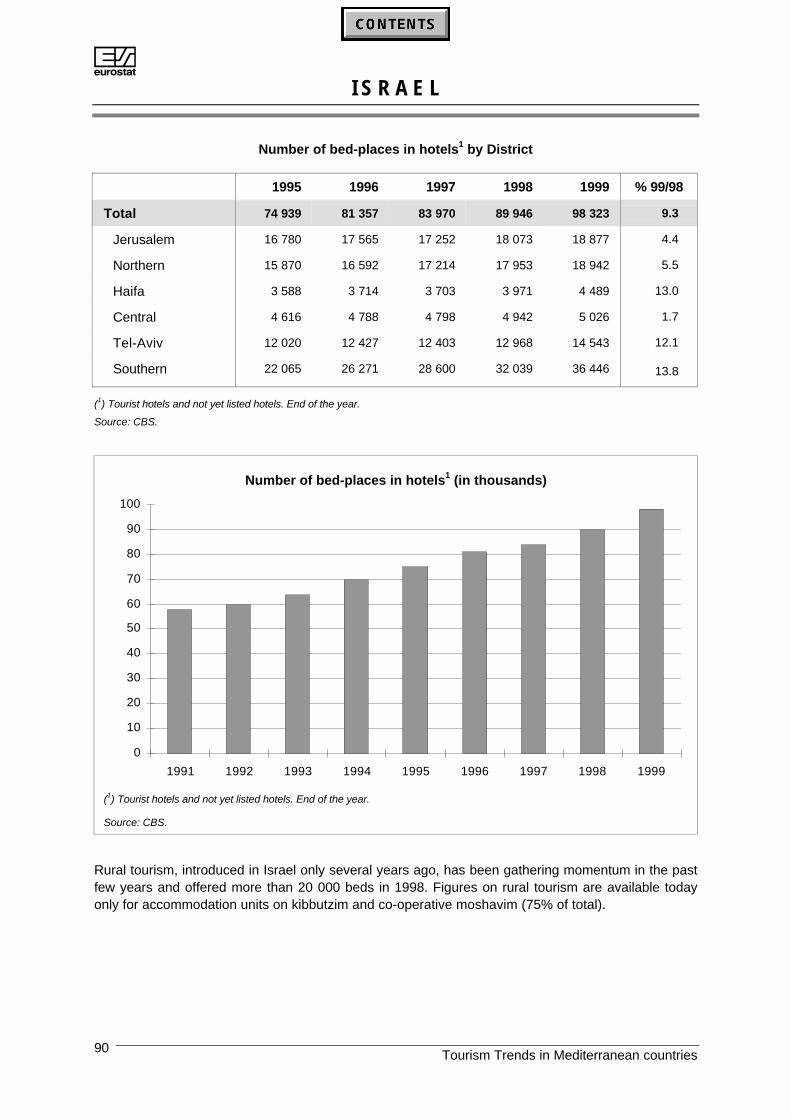
AI S R A E L
Tourism Trends in Mediterranean countries90
Number of bed-places in hotels1 by District
1995 1996 1997 1998 1999 % 99/98
Total 74 939 81 357 83 970 89 946 98 323 9.3
Jerusalem 16 780 17 565 17 252 18 073 18 877 4.4
Northern 15 870 16 592 17 214 17 953 18 942 5.5
Haifa 3 588 3 714 3 703 3 971 4 489 13.0
Central 4 616 4 788 4 798 4 942 5 026 1.7
Tel-Aviv 12 020 12 427 12 403 12 968 14 543 12.1
Southern 22 065 26 271 28 600 32 039 36 446 13.8
(1) Tourist hotels and not yet listed hotels. End of the year.
Source: CBS.
Number of bed-places in hotels1 (in thousands)
0
10
20
30
40
50
60
70
80
90
100
1991 1992 1993 1994 1995 1996 1997 1998 1999
(1) Tourist hotels and not yet listed hotels. End of the year.
Source: CBS.
Rural tourism, introduced in Israel only several years ago, has been gathering momentum in the pastfew years and offered more than 20 000 beds in 1998. Figures on rural tourism are available todayonly for accommodation units on kibbutzim and co-operative moshavim (75% of total).
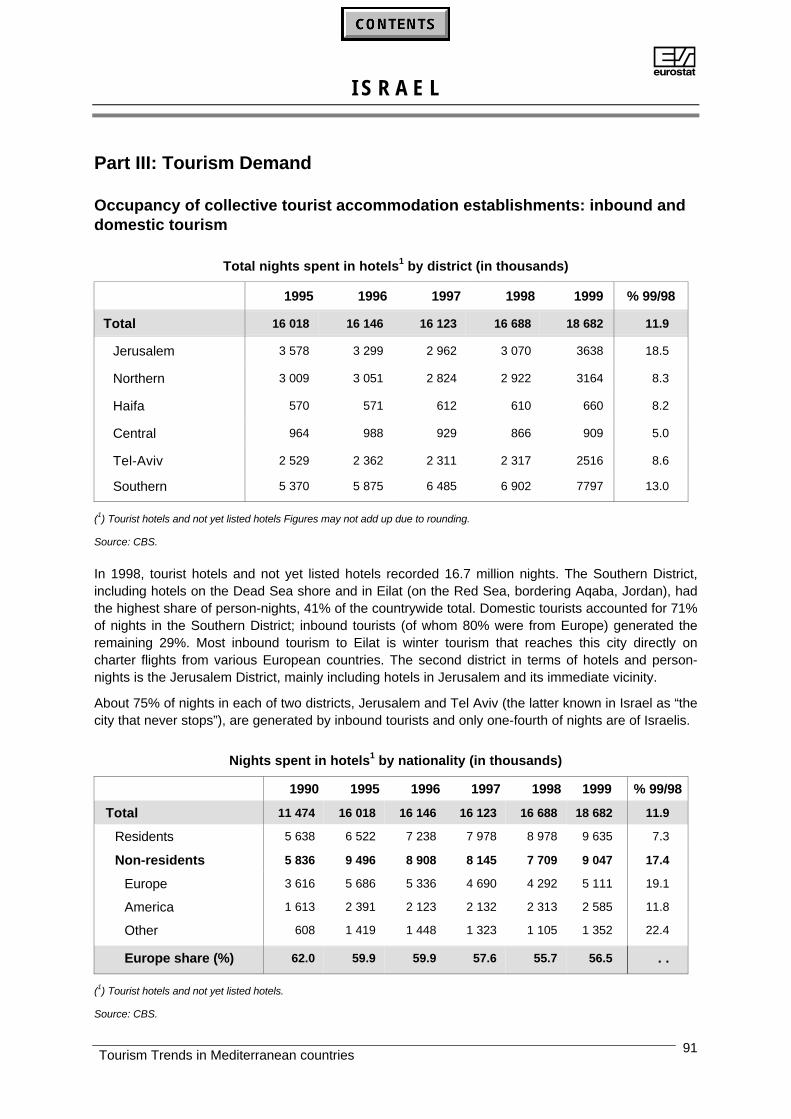
AI S R A E L
Tourism Trends in Mediterranean countries 91
Part III: Tourism Demand
Occupancy of collective tourist accommodation establishments: inbound anddomestic tourism
Total nights spent in hotels1 by district (in thousands)
1995 1996 1997 1998 1999 % 99/98
Total 16 018 16 146 16 123 16 688 18 682 11.9
Jerusalem 3 578 3 299 2 962 3 070 3638 18.5
Northern 3 009 3 051 2 824 2 922 3164 8.3
Haifa 570 571 612 610 660 8.2
Central 964 988 929 866 909 5.0
Tel-Aviv 2 529 2 362 2 311 2 317 2516 8.6
Southern 5 370 5 875 6 485 6 902 7797 13.0
(1) Tourist hotels and not yet listed hotels Figures may not add up due to rounding.
Source: CBS.
In 1998, tourist hotels and not yet listed hotels recorded 16.7 million nights. The Southern District,including hotels on the Dead Sea shore and in Eilat (on the Red Sea, bordering Aqaba, Jordan), hadthe highest share of person-nights, 41% of the countrywide total. Domestic tourists accounted for 71%of nights in the Southern District; inbound tourists (of whom 80% were from Europe) generated theremaining 29%. Most inbound tourism to Eilat is winter tourism that reaches this city directly oncharter flights from various European countries. The second district in terms of hotels and person-nights is the Jerusalem District, mainly including hotels in Jerusalem and its immediate vicinity.
About 75% of nights in each of two districts, Jerusalem and Tel Aviv (the latter known in Israel as “thecity that never stops”), are generated by inbound tourists and only one-fourth of nights are of Israelis.
Nights spent in hotels1 by nationality (in thousands)
1990 1995 1996 1997 1998 1999 % 99/98
Total 11 474 16 018 16 146 16 123 16 688 18 682 11.9
Residents 5 638 6 522 7 238 7 978 8 978 9 635 7.3
Non-residents 5 836 9 496 8 908 8 145 7 709 9 047 17.4
Europe 3 616 5 686 5 336 4 690 4 292 5 111 19.1
America 1 613 2 391 2 123 2 132 2 313 2 585 11.8
Other 608 1 419 1 448 1 323 1 105 1 352 22.4
Europe share (%) 62.0 59.9 59.9 57.6 55.7 56.5 . .
(1) Tourist hotels and not yet listed hotels.
Source: CBS.
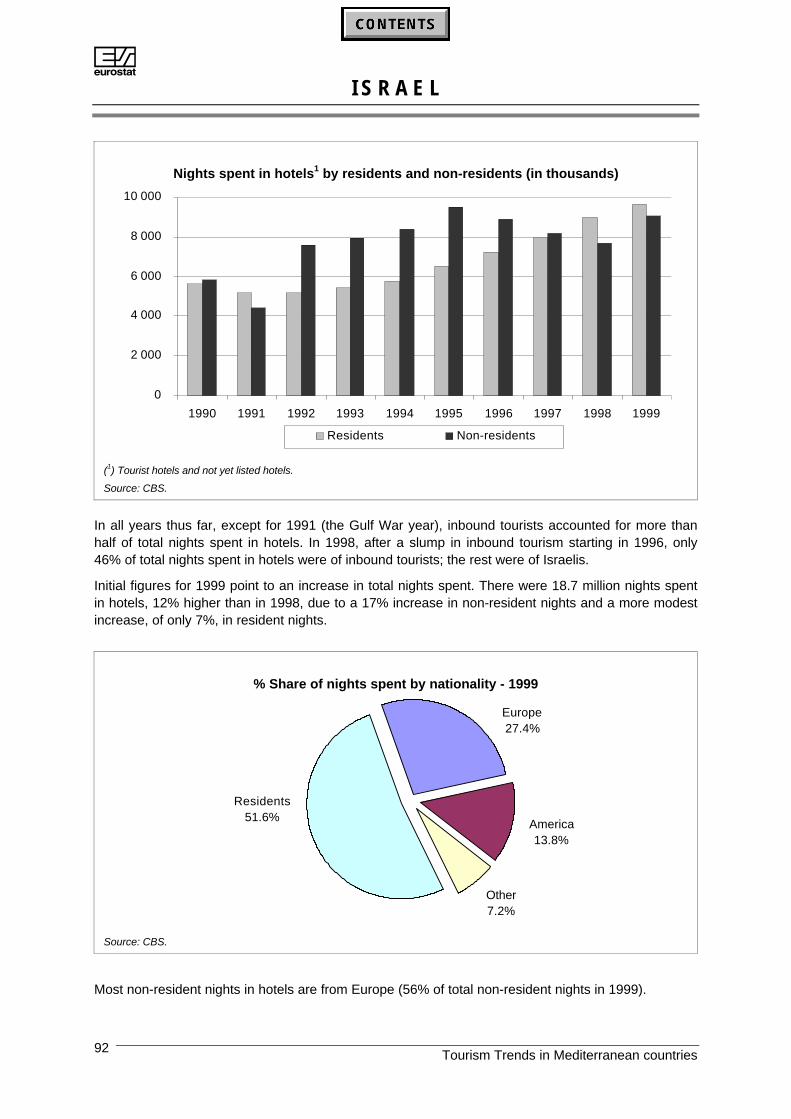
AI S R A E L
Tourism Trends in Mediterranean countries92
Nights spent in hotels1 by residents and non-residents (in thousands)
0
2 000
4 000
6 000
8 000
10 000
1990 1991 1992 1993 1994 1995 1996 1997 1998 1999
Residents Non-residents
(1) Tourist hotels and not yet listed hotels.
Source: CBS.
In all years thus far, except for 1991 (the Gulf War year), inbound tourists accounted for more thanhalf of total nights spent in hotels. In 1998, after a slump in inbound tourism starting in 1996, only46% of total nights spent in hotels were of inbound tourists; the rest were of Israelis.
Initial figures for 1999 point to an increase in total nights spent. There were 18.7 million nights spentin hotels, 12% higher than in 1998, due to a 17% increase in non-resident nights and a more modestincrease, of only 7%, in resident nights.
% Share of nights spent by nationality - 1999
Residents51.6%
Other7.2%
Europe27.4%
America13.8%
Source: CBS.
Most non-resident nights in hotels are from Europe (56% of total non-resident nights in 1999).
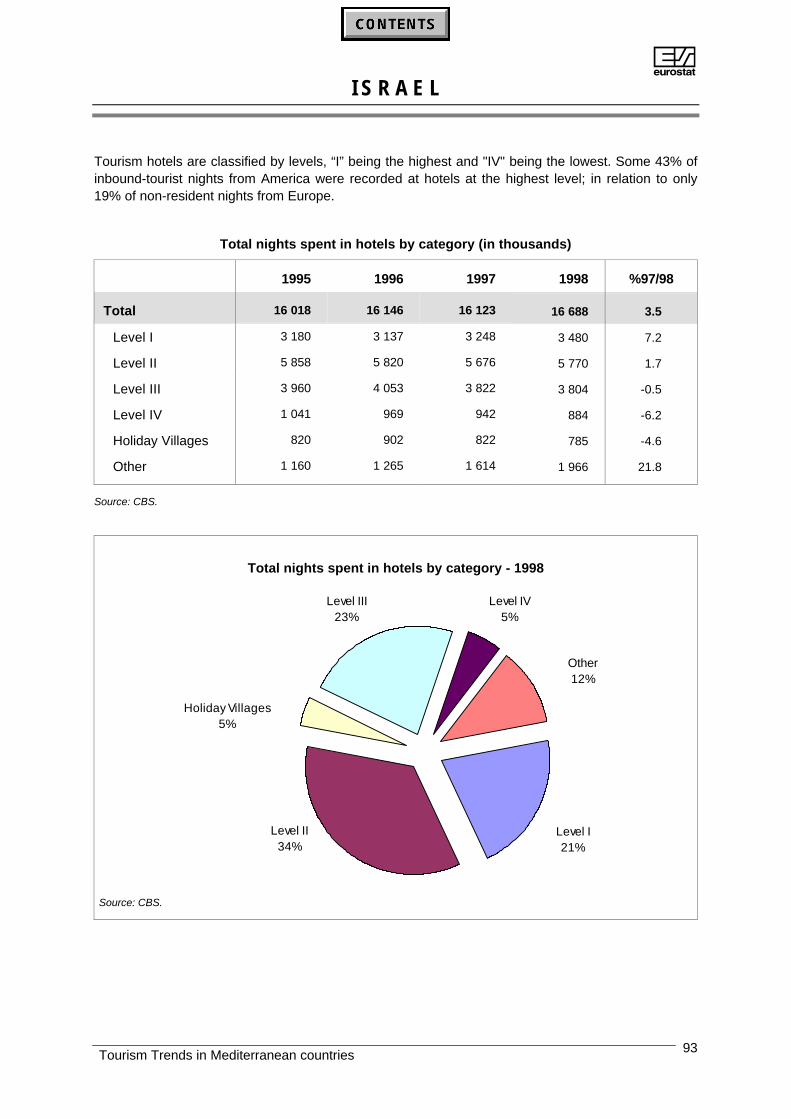
AI S R A E L
Tourism Trends in Mediterranean countries 93
Tourism hotels are classified by levels, “I” being the highest and "IV" being the lowest. Some 43% ofinbound-tourist nights from America were recorded at hotels at the highest level; in relation to only19% of non-resident nights from Europe.
Total nights spent in hotels by category (in thousands)
1995 1996 1997 1998 %97/98
Total 16 018 16 146 16 123 16 688 3.5
Level I 3 180 3 137 3 248 3 480 7.2
Level II 5 858 5 820 5 676 5 770 1.7
Level III 3 960 4 053 3 822 3 804 -0.5
Level IV 1 041 969 942 884 -6.2
Holiday Villages 820 902 822 785 -4.6
Other 1 160 1 265 1 614 1 966 21.8
Source: CBS.
Total nights spent in hotels by category - 1998
Holiday Villages5%
Level II34%
Level IV5%
Other12%
Level I21%
Level III23%
Source: CBS.
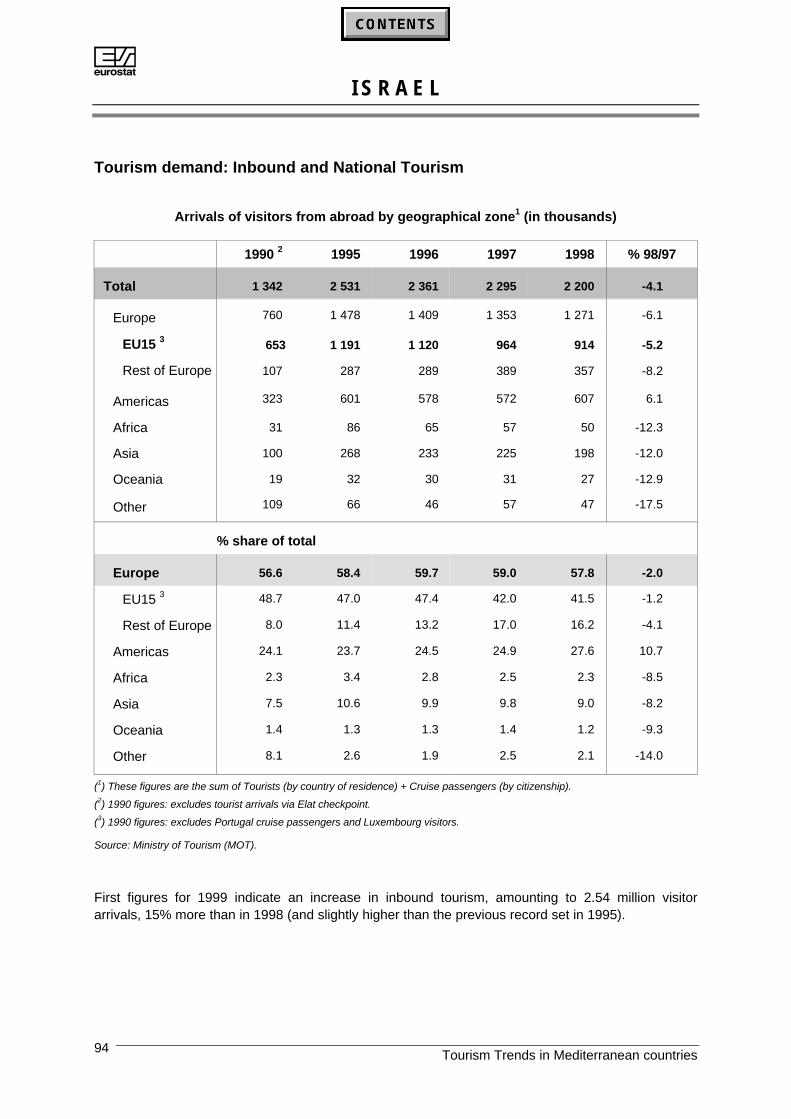
AI S R A E L
Tourism Trends in Mediterranean countries94
Tourism demand: Inbound and National Tourism
Arrivals of visitors from abroad by geographical zone1 (in thousands)
1990 2 1995 1996 1997 1998 % 98/97
Total 1 342 2 531 2 361 2 295 2 200 -4.1
Europe 760 1 478 1 409 1 353 1 271 -6.1
EU15 3 653 1 191 1 120 964 914 -5.2
Rest of Europe 107 287 289 389 357 -8.2
Americas 323 601 578 572 607 6.1
Africa 31 86 65 57 50 -12.3
Asia 100 268 233 225 198 -12.0
Oceania 19 32 30 31 27 -12.9
Other 109 66 46 57 47 -17.5
% share of total
Europe 56.6 58.4 59.7 59.0 57.8 -2.0
EU15 3 48.7 47.0 47.4 42.0 41.5 -1.2
Rest of Europe 8.0 11.4 13.2 17.0 16.2 -4.1
Americas 24.1 23.7 24.5 24.9 27.6 10.7
Africa 2.3 3.4 2.8 2.5 2.3 -8.5
Asia 7.5 10.6 9.9 9.8 9.0 -8.2
Oceania 1.4 1.3 1.3 1.4 1.2 -9.3
Other 8.1 2.6 1.9 2.5 2.1 -14.0
(1) These figures are the sum of Tourists (by country of residence) + Cruise passengers (by citizenship).
(2) 1990 figures: excludes tourist arrivals via Elat checkpoint.
(3) 1990 figures: excludes Portugal cruise passengers and Luxembourg visitors.
Source: Ministry of Tourism (MOT).
First figures for 1999 indicate an increase in inbound tourism, amounting to 2.54 million visitorarrivals, 15% more than in 1998 (and slightly higher than the previous record set in 1995).
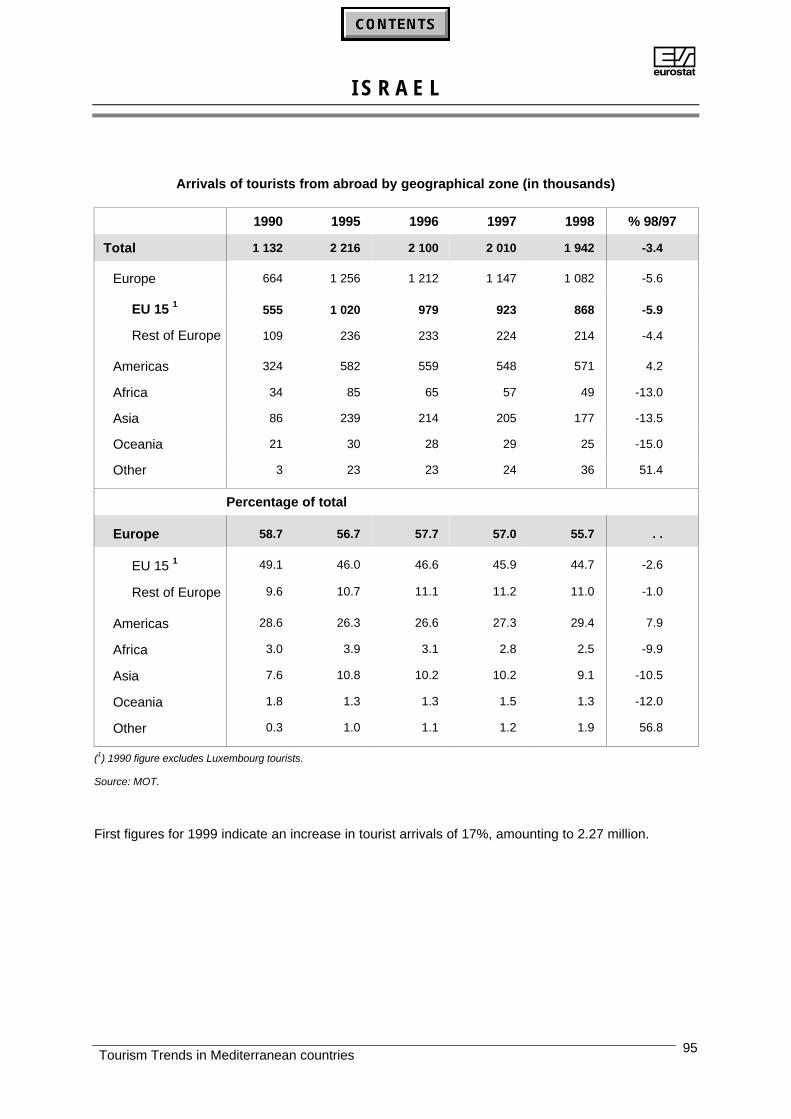
AI S R A E L
Tourism Trends in Mediterranean countries 95
Arrivals of tourists from abroad by geographical zone (in thousands)
1990 1995 1996 1997 1998 % 98/97
Total 1 132 2 216 2 100 2 010 1 942 -3.4
Europe 664 1 256 1 212 1 147 1 082 -5.6
EU 15 1 555 1 020 979 923 868 -5.9
Rest of Europe 109 236 233 224 214 -4.4
Americas 324 582 559 548 571 4.2
Africa 34 85 65 57 49 -13.0
Asia 86 239 214 205 177 -13.5
Oceania 21 30 28 29 25 -15.0
Other 3 23 23 24 36 51.4
Percentage of total
Europe 58.7 56.7 57.7 57.0 55.7 . .
EU 15 1 49.1 46.0 46.6 45.9 44.7 -2.6
Rest of Europe 9.6 10.7 11.1 11.2 11.0 -1.0
Americas 28.6 26.3 26.6 27.3 29.4 7.9
Africa 3.0 3.9 3.1 2.8 2.5 -9.9
Asia 7.6 10.8 10.2 10.2 9.1 -10.5
Oceania 1.8 1.3 1.3 1.5 1.3 -12.0
Other 0.3 1.0 1.1 1.2 1.9 56.8
(1) 1990 figure excludes Luxembourg tourists.
Source: MOT.
First figures for 1999 indicate an increase in tourist arrivals of 17%, amounting to 2.27 million.
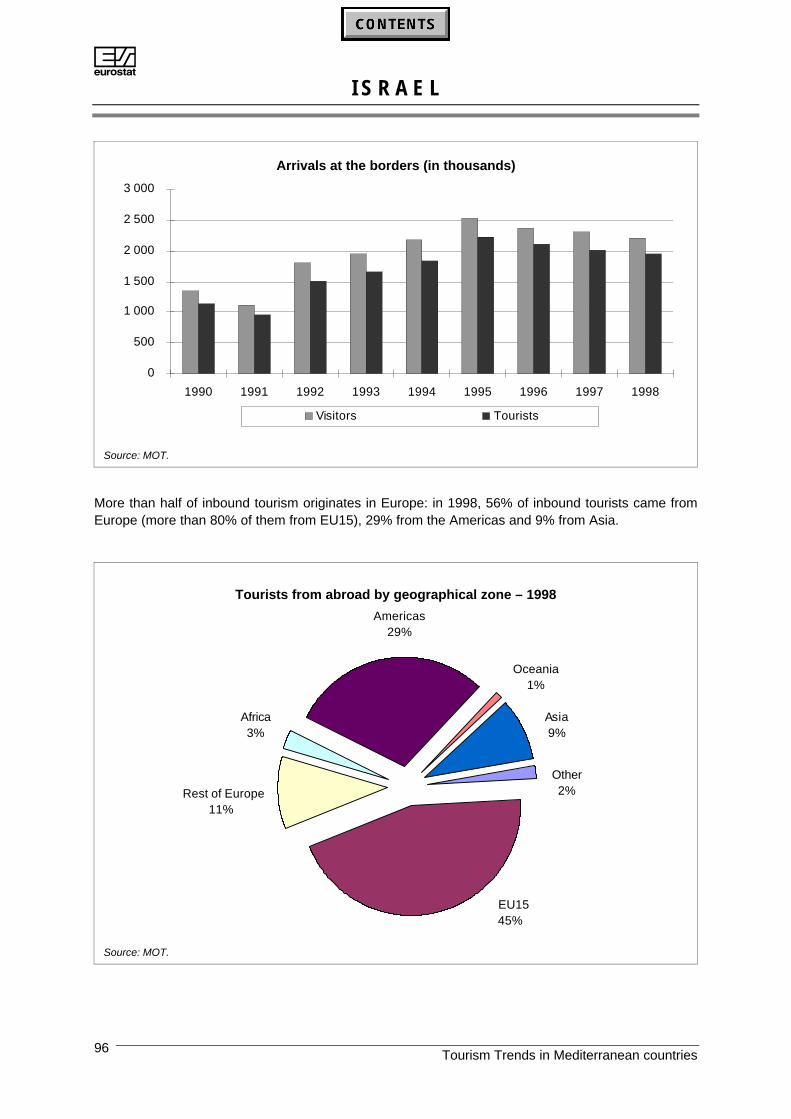
AI S R A E L
Tourism Trends in Mediterranean countries96
Arrivals at the borders (in thousands)
0
500
1 000
1 500
2 000
2 500
3 000
1990 1991 1992 1993 1994 1995 1996 1997 1998
Visitors Tourists
Source: MOT.
More than half of inbound tourism originates in Europe: in 1998, 56% of inbound tourists came fromEurope (more than 80% of them from EU15), 29% from the Americas and 9% from Asia.
Tourists from abroad by geographical zone – 1998
Rest of Europe11%
EU1545%
Americas29%
Oceania1%
Asia9%
Other2%
Africa3%
Source: MOT.
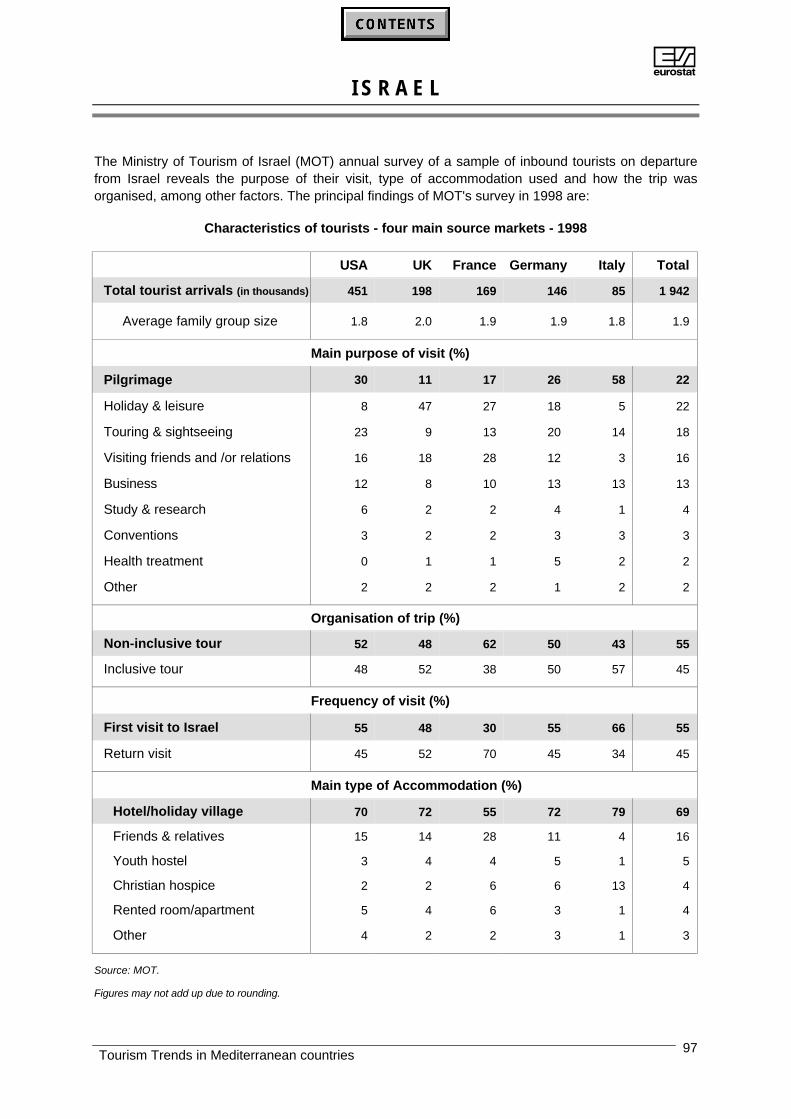
AI S R A E L
Tourism Trends in Mediterranean countries 97
The Ministry of Tourism of Israel (MOT) annual survey of a sample of inbound tourists on departurefrom Israel reveals the purpose of their visit, type of accommodation used and how the trip wasorganised, among other factors. The principal findings of MOT's survey in 1998 are:
Characteristics of tourists - four main source markets - 1998
USA UK France Germany Italy Total
Total tourist arrivals (in thousands) 451 198 169 146 85 1 942
Average family group size 1.8 2.0 1.9 1.9 1.8 1.9
Main purpose of visit (%)
Pilgrimage 30 11 17 26 58 22
Holiday & leisure 8 47 27 18 5 22
Touring & sightseeing 23 9 13 20 14 18
Visiting friends and /or relations 16 18 28 12 3 16
Business 12 8 10 13 13 13
Study & research 6 2 2 4 1 4
Conventions 3 2 2 3 3 3
Health treatment 0 1 1 5 2 2
Other 2 2 2 1 2 2
Organisation of trip (%)
Non-inclusive tour 52 48 62 50 43 55
Inclusive tour 48 52 38 50 57 45
Frequency of visit (%)
First visit to Israel 55 48 30 55 66 55
Return visit 45 52 70 45 34 45
Main type of Accommodation (%)
Hotel/holiday village 70 72 55 72 79 69
Friends & relatives 15 14 28 11 4 16
Youth hostel 3 4 4 5 1 5
Christian hospice 2 2 6 6 13 4
Rented room/apartment 5 4 6 3 1 4
Other 4 2 2 3 1 3
Source: MOT.
Figures may not add up due to rounding.
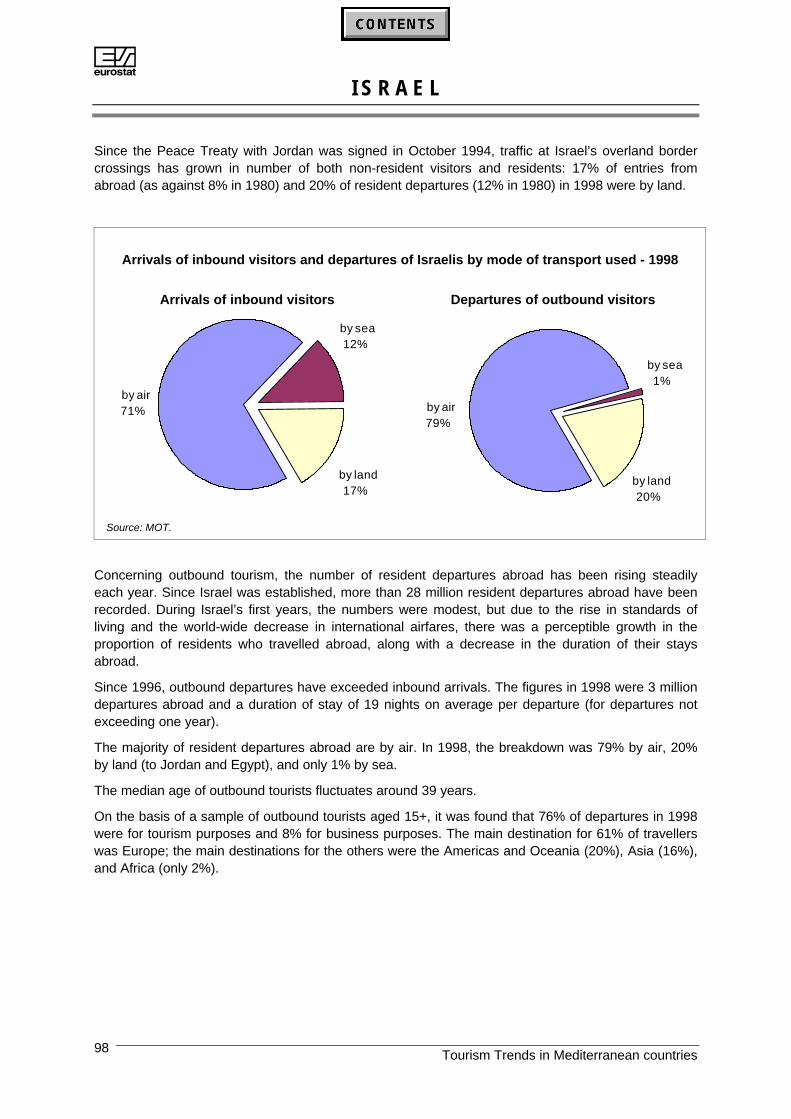
AI S R A E L
Tourism Trends in Mediterranean countries98
Since the Peace Treaty with Jordan was signed in October 1994, traffic at Israel’s overland bordercrossings has grown in number of both non-resident visitors and residents: 17% of entries fromabroad (as against 8% in 1980) and 20% of resident departures (12% in 1980) in 1998 were by land.
Arrivals of inbound visitors and departures of Israelis by mode of transport used - 1998
Arrivals of inbound visitors
by sea12%
by air71%
by land17%
Source: MOT.
Departures of outbound visitors
by sea1%
by air79%
by land20%
Concerning outbound tourism, the number of resident departures abroad has been rising steadilyeach year. Since Israel was established, more than 28 million resident departures abroad have beenrecorded. During Israel’s first years, the numbers were modest, but due to the rise in standards ofliving and the world-wide decrease in international airfares, there was a perceptible growth in theproportion of residents who travelled abroad, along with a decrease in the duration of their staysabroad.
Since 1996, outbound departures have exceeded inbound arrivals. The figures in 1998 were 3 milliondepartures abroad and a duration of stay of 19 nights on average per departure (for departures notexceeding one year).
The majority of resident departures abroad are by air. In 1998, the breakdown was 79% by air, 20%by land (to Jordan and Egypt), and only 1% by sea.
The median age of outbound tourists fluctuates around 39 years.
On the basis of a sample of outbound tourists aged 15+, it was found that 76% of departures in 1998were for tourism purposes and 8% for business purposes. The main destination for 61% of travellerswas Europe; the main destinations for the others were the Americas and Oceania (20%), Asia (16%),and Africa (only 2%).
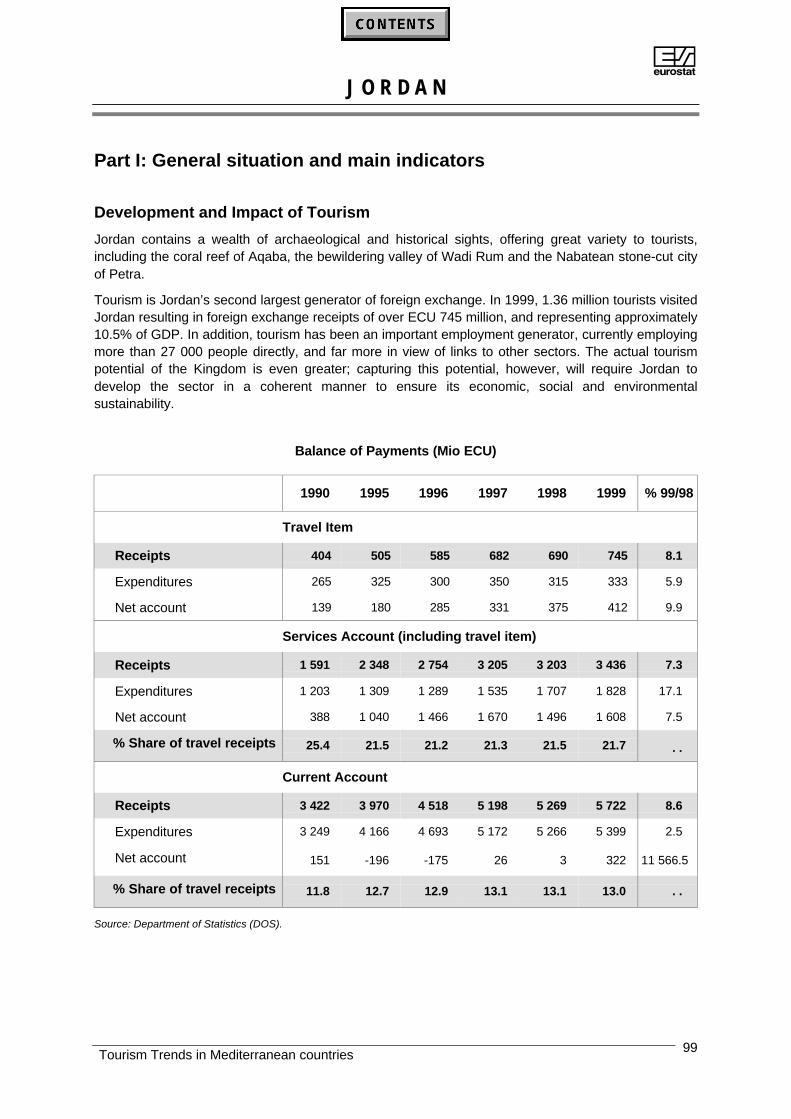
AJ O R D A N
Tourism Trends in Mediterranean countries 99
Part I: General situation and main indicators
Development and Impact of Tourism
Jordan contains a wealth of archaeological and historical sights, offering great variety to tourists,including the coral reef of Aqaba, the bewildering valley of Wadi Rum and the Nabatean stone-cut cityof Petra.
Tourism is Jordan’s second largest generator of foreign exchange. In 1999, 1.36 million tourists visitedJordan resulting in foreign exchange receipts of over ECU 745 million, and representing approximately10.5% of GDP. In addition, tourism has been an important employment generator, currently employingmore than 27 000 people directly, and far more in view of links to other sectors. The actual tourismpotential of the Kingdom is even greater; capturing this potential, however, will require Jordan todevelop the sector in a coherent manner to ensure its economic, social and environmentalsustainability.
Balance of Payments (Mio ECU)
1990 1995 1996 1997 1998 1999 % 99/98
Travel Item
Receipts 404 505 585 682 690 745 8.1
Expenditures 265 325 300 350 315 333 5.9
Net account 139 180 285 331 375 412 9.9
Services Account (including travel item)
Receipts 1 591 2 348 2 754 3 205 3 203 3 436 7.3
Expenditures 1 203 1 309 1 289 1 535 1 707 1 828 17.1
Net account 388 1 040 1 466 1 670 1 496 1 608 7.5
% Share of travel receipts 25.4 21.5 21.2 21.3 21.5 21.7 . .
Current Account
Receipts 3 422 3 970 4 518 5 198 5 269 5 722 8.6
Expenditures 3 249 4 166 4 693 5 172 5 266 5 399 2.5
Net account 151 -196 -175 26 3 322 11 566.5
% Share of travel receipts 11.8 12.7 12.9 13.1 13.1 13.0 . .
Source: Department of Statistics (DOS).
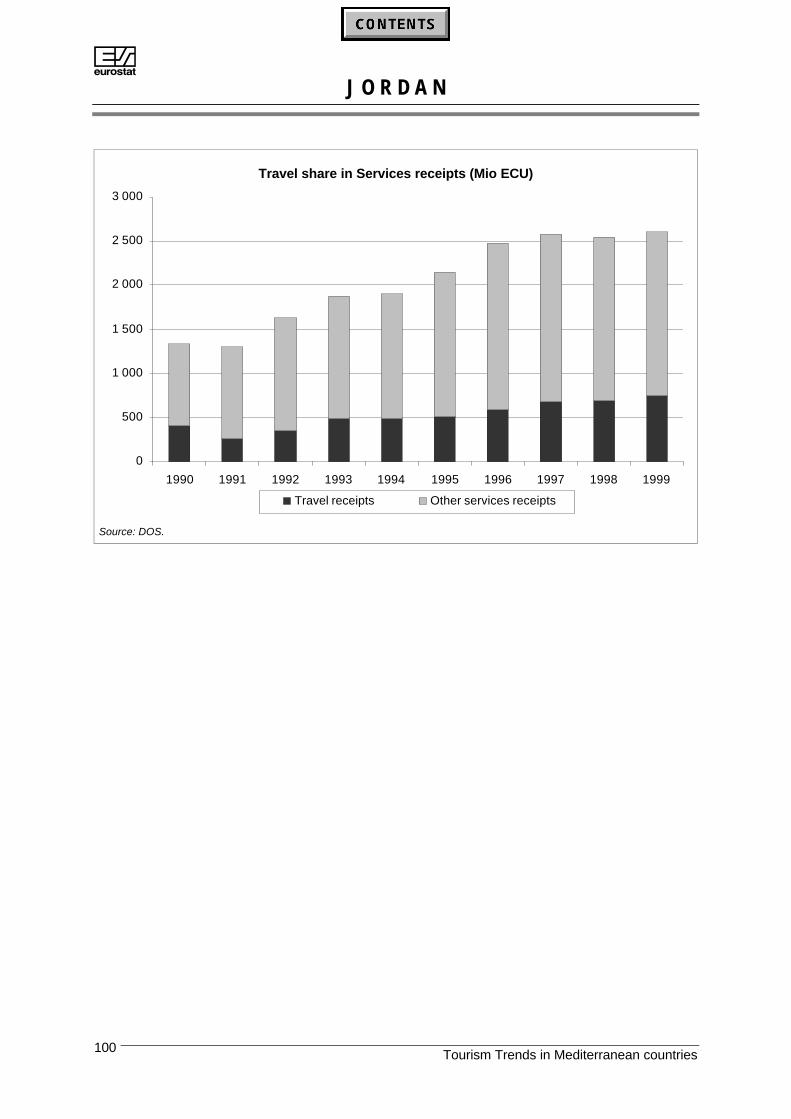
AJ O R D A N
Tourism Trends in Mediterranean countries100
Travel share in Services receipts (Mio ECU)
0
500
1 000
1 500
2 000
2 500
3 000
1990 1991 1992 1993 1994 1995 1996 1997 1998 1999
Travel receipts Other services receipts
Source: DOS.
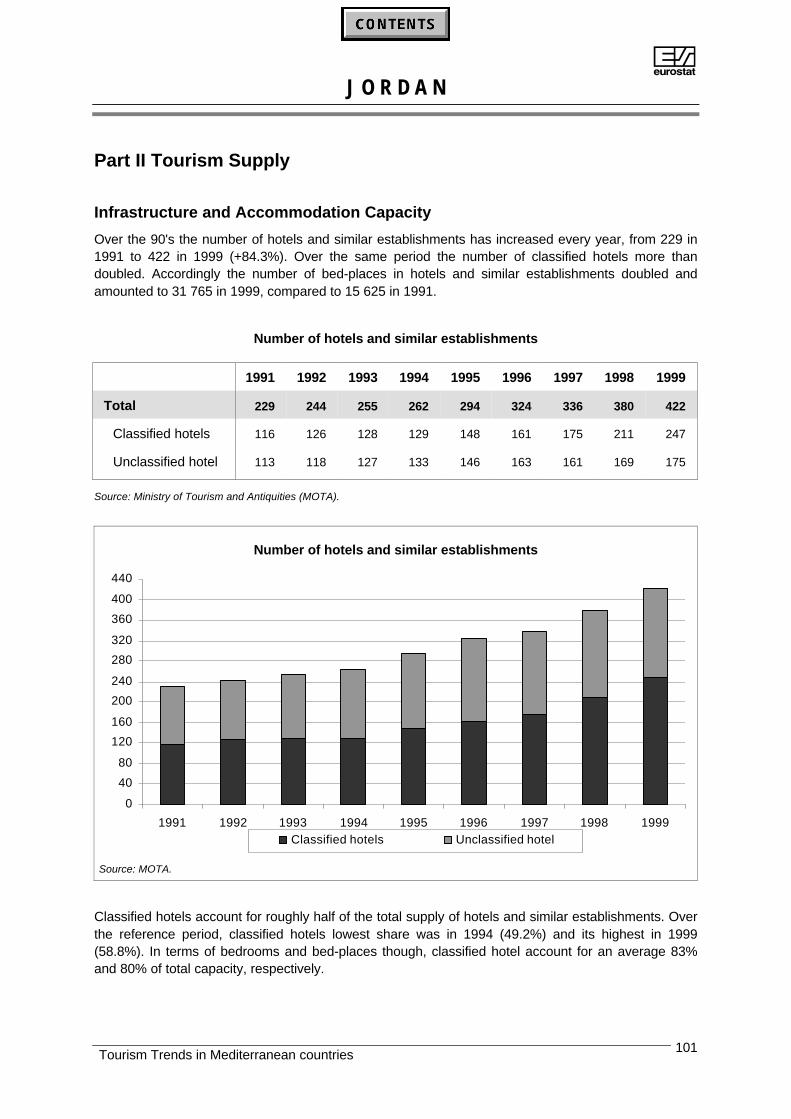
AJ O R D A N
Tourism Trends in Mediterranean countries 101
Part II Tourism Supply
Infrastructure and Accommodation Capacity
Over the 90's the number of hotels and similar establishments has increased every year, from 229 in1991 to 422 in 1999 (+84.3%). Over the same period the number of classified hotels more thandoubled. Accordingly the number of bed-places in hotels and similar establishments doubled andamounted to 31 765 in 1999, compared to 15 625 in 1991.
Number of hotels and similar establishments
1991 1992 1993 1994 1995 1996 1997 1998 1999
Total 229 244 255 262 294 324 336 380 422
Classified hotels 116 126 128 129 148 161 175 211 247
Unclassified hotel 113 118 127 133 146 163 161 169 175
Source: Ministry of Tourism and Antiquities (MOTA).
Number of hotels and similar establishments
0
40
80
120
160
200
240
280
320
360
400
440
1991 1992 1993 1994 1995 1996 1997 1998 1999Classified hotels Unclassified hotel
Source: MOTA.
Classified hotels account for roughly half of the total supply of hotels and similar establishments. Overthe reference period, classified hotels lowest share was in 1994 (49.2%) and its highest in 1999(58.8%). In terms of bedrooms and bed-places though, classified hotel account for an average 83%and 80% of total capacity, respectively.
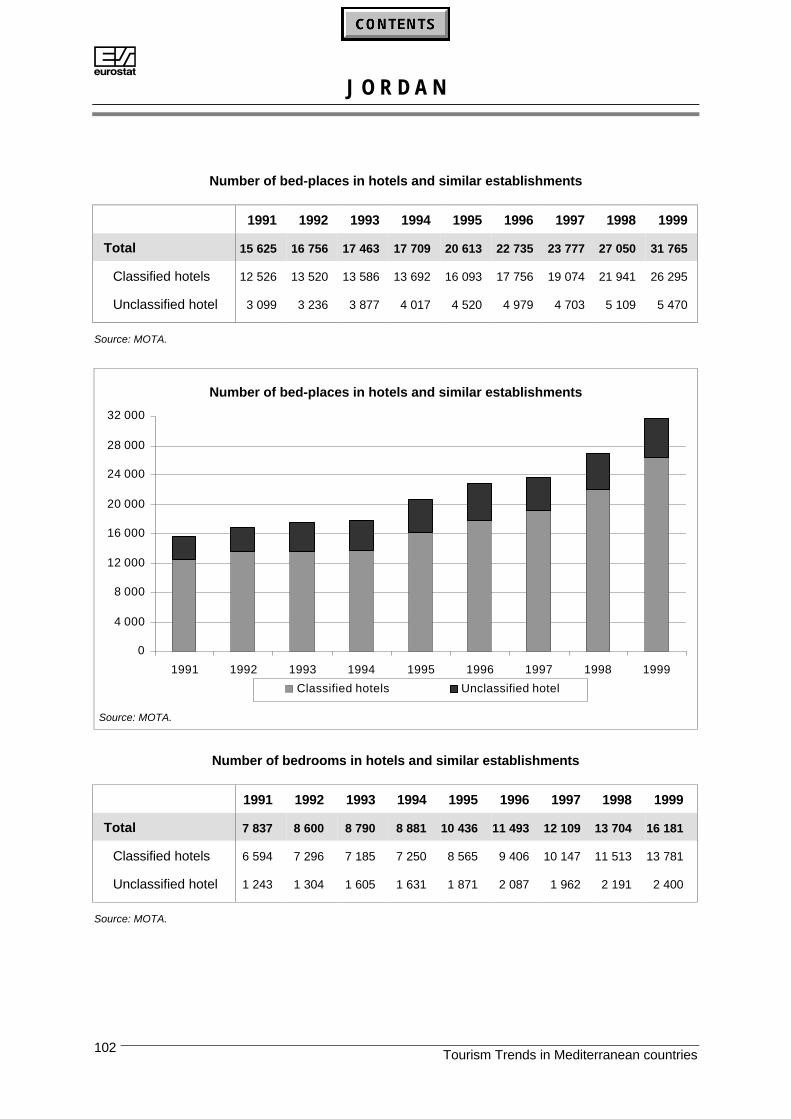
AJ O R D A N
Tourism Trends in Mediterranean countries102
Number of bed-places in hotels and similar establishments
1991 1992 1993 1994 1995 1996 1997 1998 1999
Total 15 625 16 756 17 463 17 709 20 613 22 735 23 777 27 050 31 765
Classified hotels 12 526 13 520 13 586 13 692 16 093 17 756 19 074 21 941 26 295
Unclassified hotel 3 099 3 236 3 877 4 017 4 520 4 979 4 703 5 109 5 470
Source: MOTA.
Number of bed-places in hotels and similar establishments
0
4 000
8 000
12 000
16 000
20 000
24 000
28 000
32 000
1991 1992 1993 1994 1995 1996 1997 1998 1999
Classified hotels Unclassified hotel
Source: MOTA.
Number of bedrooms in hotels and similar establishments
1991 1992 1993 1994 1995 1996 1997 1998 1999
Total 7 837 8 600 8 790 8 881 10 436 11 493 12 109 13 704 16 181
Classified hotels 6 594 7 296 7 185 7 250 8 565 9 406 10 147 11 513 13 781
Unclassified hotel 1 243 1 304 1 605 1 631 1 871 2 087 1 962 2 191 2 400
Source: MOTA.
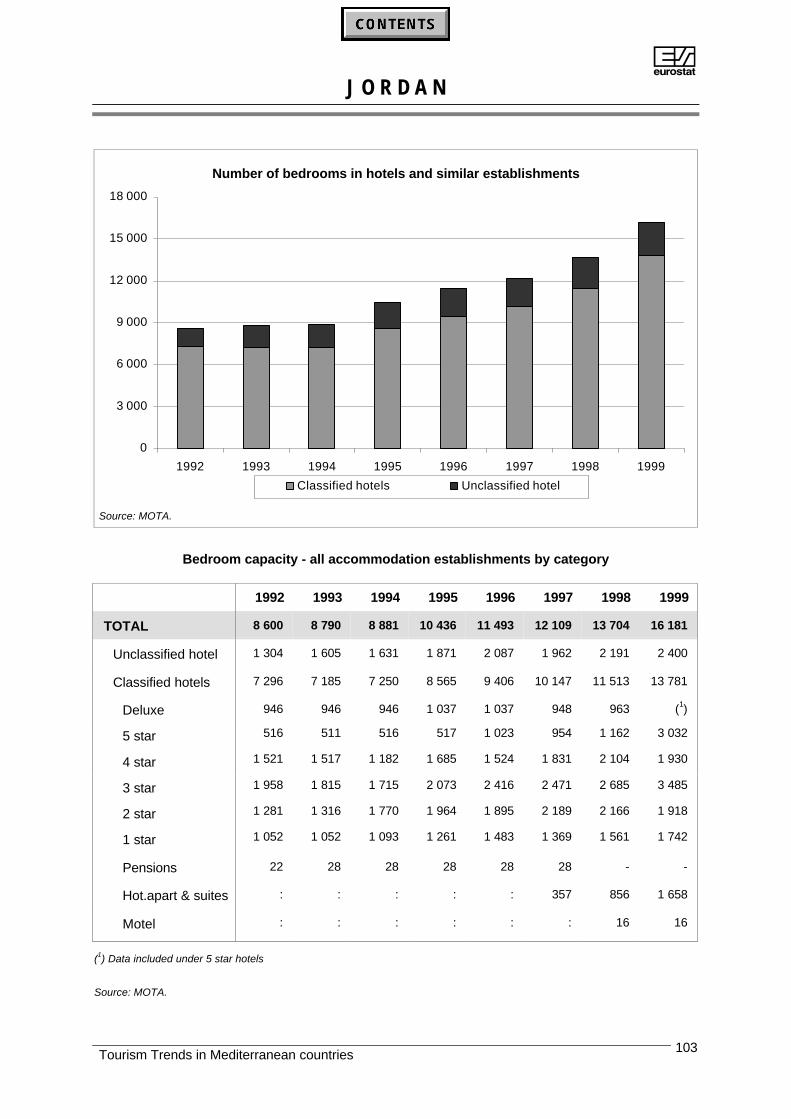
AJ O R D A N
Tourism Trends in Mediterranean countries 103
Number of bedrooms in hotels and similar establishments
0
3 000
6 000
9 000
12 000
15 000
18 000
1992 1993 1994 1995 1996 1997 1998 1999
Classified hotels Unclassified hotel
Source: MOTA.
Bedroom capacity - all accommodation establishments by category
1992 1993 1994 1995 1996 1997 1998 1999
TOTAL 8 600 8 790 8 881 10 436 11 493 12 109 13 704 16 181
Unclassified hotel 1 304 1 605 1 631 1 871 2 087 1 962 2 191 2 400
Classified hotels 7 296 7 185 7 250 8 565 9 406 10 147 11 513 13 781
Deluxe 946 946 946 1 037 1 037 948 963 (1)
5 star 516 511 516 517 1 023 954 1 162 3 032
4 star 1 521 1 517 1 182 1 685 1 524 1 831 2 104 1 930
3 star 1 958 1 815 1 715 2 073 2 416 2 471 2 685 3 485
2 star 1 281 1 316 1 770 1 964 1 895 2 189 2 166 1 918
1 star 1 052 1 052 1 093 1 261 1 483 1 369 1 561 1 742
Pensions 22 28 28 28 28 28 - -
Hot.apart & suites : : : : : 357 856 1 658
Motel : : : : : : 16 16
(1) Data included under 5 star hotels
Source: MOTA.
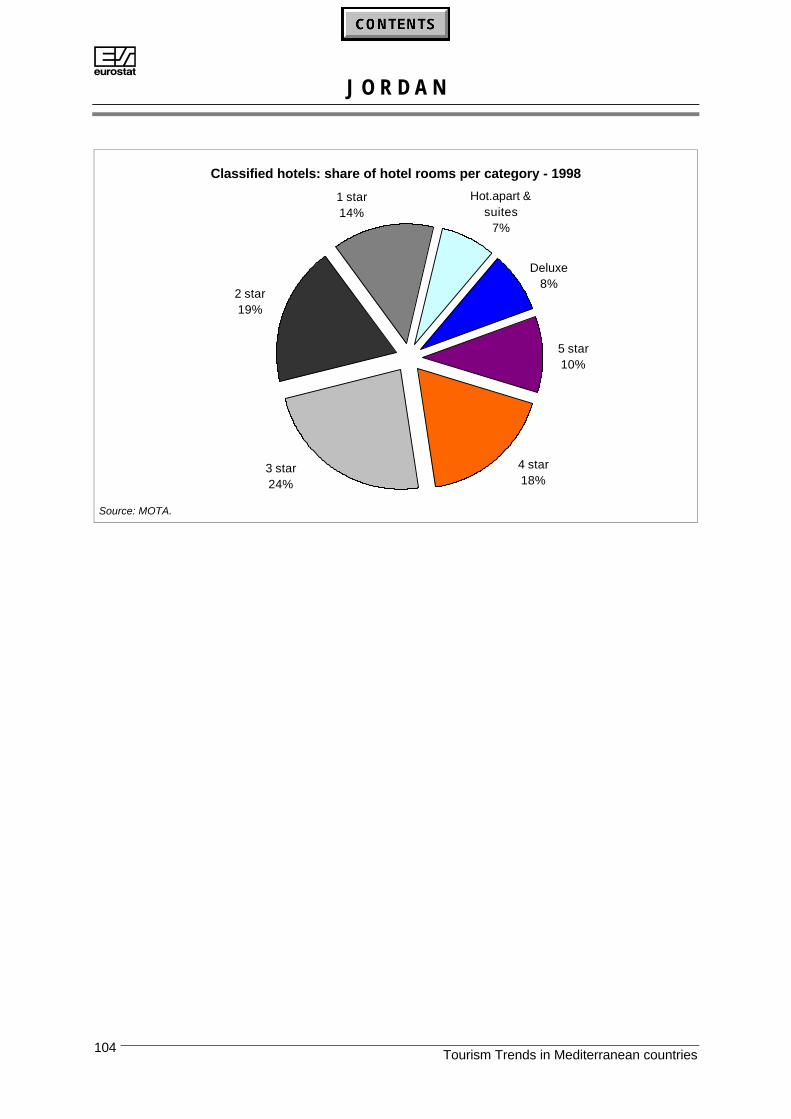
AJ O R D A N
Tourism Trends in Mediterranean countries104
Classified hotels: share of hotel rooms per category - 1998
5 star10%
4 star18%
3 star24%
2 star19%
1 star14%
Hot.apart & suites
7%
Deluxe8%
Source: MOTA.
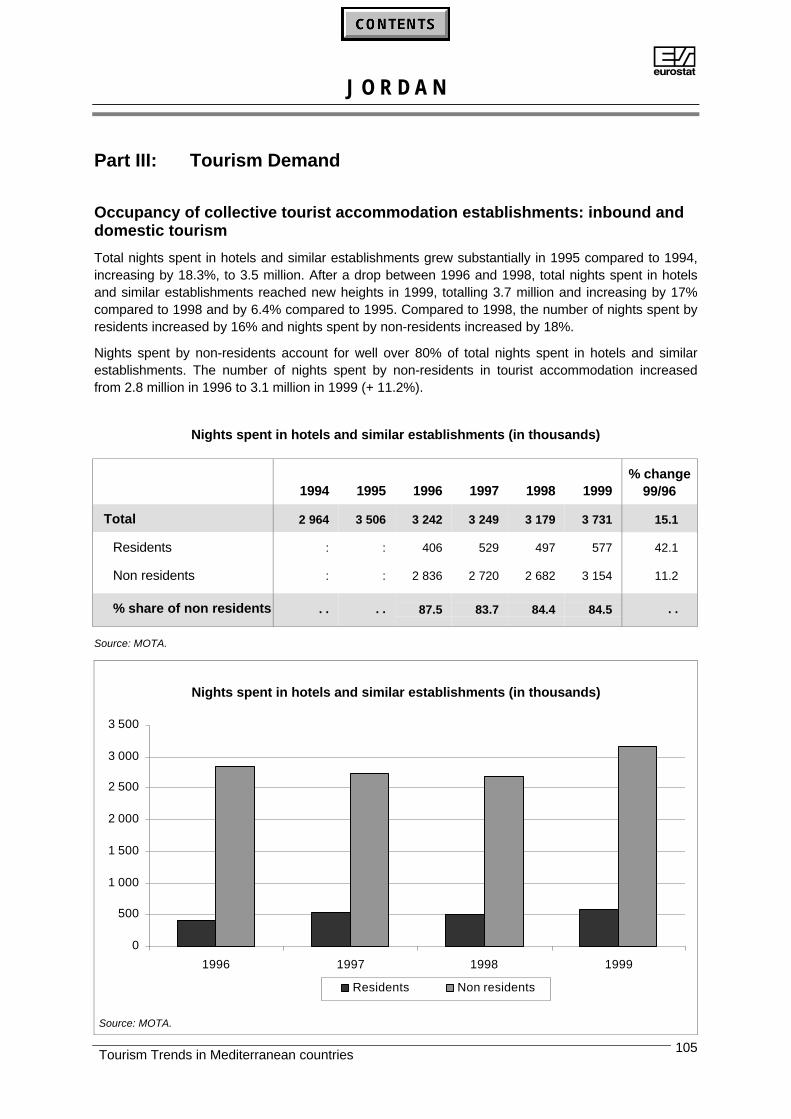
AJ O R D A N
Tourism Trends in Mediterranean countries 105
Part III: Tourism Demand
Occupancy of collective tourist accommodation establishments: inbound anddomestic tourism
Total nights spent in hotels and similar establishments grew substantially in 1995 compared to 1994,increasing by 18.3%, to 3.5 million. After a drop between 1996 and 1998, total nights spent in hotelsand similar establishments reached new heights in 1999, totalling 3.7 million and increasing by 17%compared to 1998 and by 6.4% compared to 1995. Compared to 1998, the number of nights spent byresidents increased by 16% and nights spent by non-residents increased by 18%.
Nights spent by non-residents account for well over 80% of total nights spent in hotels and similarestablishments. The number of nights spent by non-residents in tourist accommodation increasedfrom 2.8 million in 1996 to 3.1 million in 1999 (+ 11.2%).
Nights spent in hotels and similar establishments (in thousands)
1994 1995 1996 1997 1998 1999% change
99/96
Total 2 964 3 506 3 242 3 249 3 179 3 731 15.1
Residents : : 406 529 497 577 42.1
Non residents : : 2 836 2 720 2 682 3 154 11.2
% share of non residents . . . . 87.5 83.7 84.4 84.5 . .
Source: MOTA.
Nights spent in hotels and similar establishments (in thousands)
0
500
1 000
1 500
2 000
2 500
3 000
3 500
1996 1997 1998 1999
Residents Non residents
Source: MOTA.
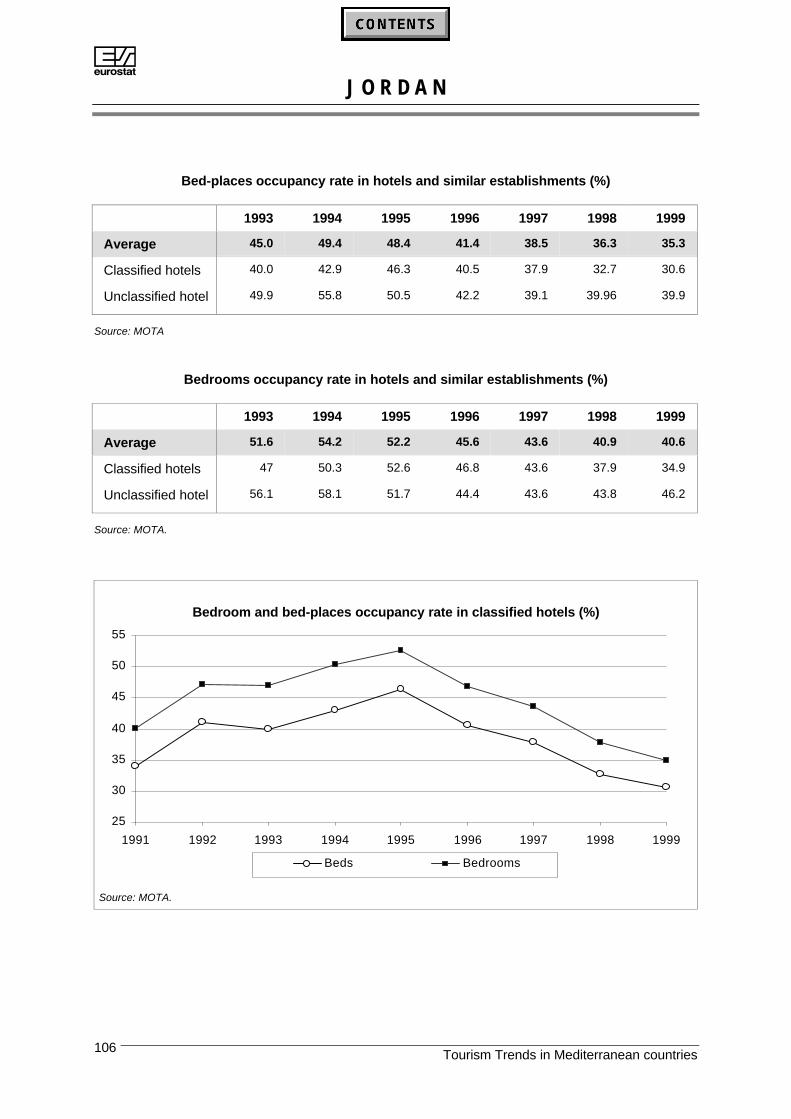
AJ O R D A N
Tourism Trends in Mediterranean countries106
Bed-places occupancy rate in hotels and similar establishments (%)
1993 1994 1995 1996 1997 1998 1999
Average 45.0 49.4 48.4 41.4 38.5 36.3 35.3
Classified hotels 40.0 42.9 46.3 40.5 37.9 32.7 30.6
Unclassified hotel 49.9 55.8 50.5 42.2 39.1 39.96 39.9
Source: MOTA
Bedrooms occupancy rate in hotels and similar establishments (%)
1993 1994 1995 1996 1997 1998 1999
Average 51.6 54.2 52.2 45.6 43.6 40.9 40.6
Classified hotels 47 50.3 52.6 46.8 43.6 37.9 34.9
Unclassified hotel 56.1 58.1 51.7 44.4 43.6 43.8 46.2
Source: MOTA.
Bedroom and bed-places occupancy rate in classified hotels (%)
25
30
35
40
45
50
55
1991 1992 1993 1994 1995 1996 1997 1998 1999
Beds Bedrooms
Source: MOTA.
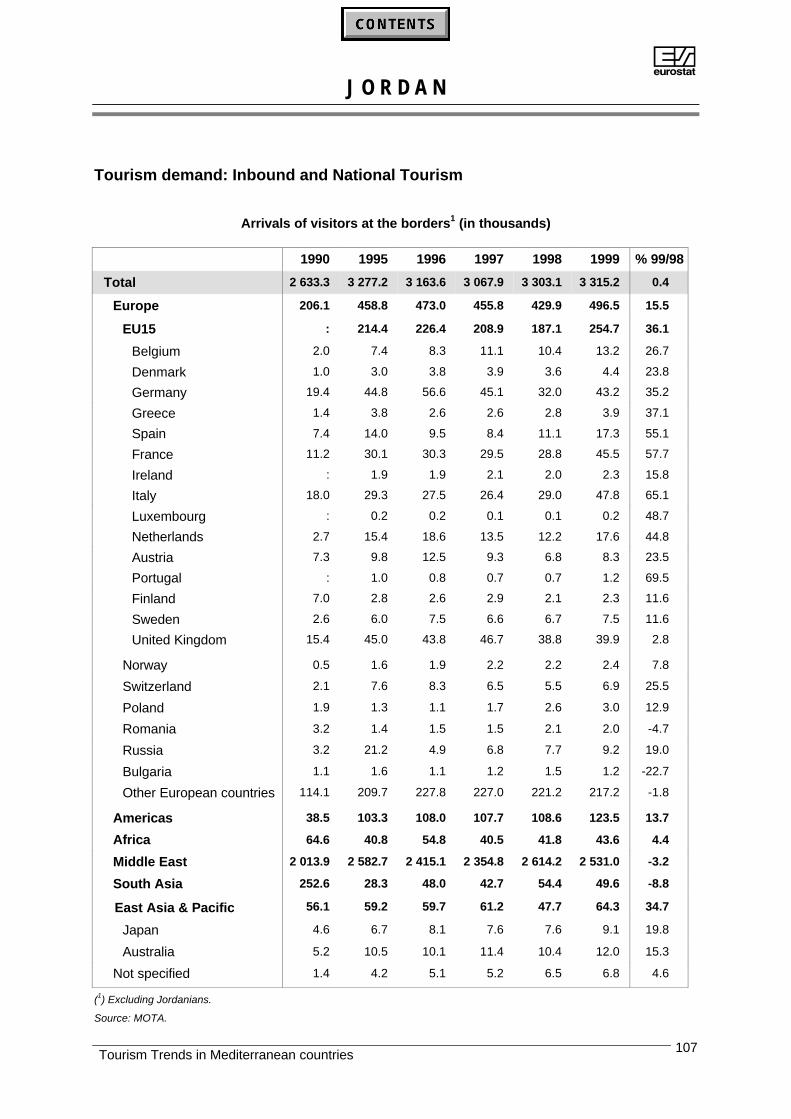
AJ O R D A N
Tourism Trends in Mediterranean countries 107
Tourism demand: Inbound and National Tourism
Arrivals of visitors at the borders1 (in thousands)
1990 1995 1996 1997 1998 1999 % 99/98
Total 2 633.3 3 277.2 3 163.6 3 067.9 3 303.1 3 315.2 0.4
Europe 206.1 458.8 473.0 455.8 429.9 496.5 15.5
EU15 : 214.4 226.4 208.9 187.1 254.7 36.1
Belgium 2.0 7.4 8.3 11.1 10.4 13.2 26.7
Denmark 1.0 3.0 3.8 3.9 3.6 4.4 23.8
Germany 19.4 44.8 56.6 45.1 32.0 43.2 35.2
Greece 1.4 3.8 2.6 2.6 2.8 3.9 37.1
Spain 7.4 14.0 9.5 8.4 11.1 17.3 55.1
France 11.2 30.1 30.3 29.5 28.8 45.5 57.7
Ireland : 1.9 1.9 2.1 2.0 2.3 15.8
Italy 18.0 29.3 27.5 26.4 29.0 47.8 65.1
Luxembourg : 0.2 0.2 0.1 0.1 0.2 48.7
Netherlands 2.7 15.4 18.6 13.5 12.2 17.6 44.8
Austria 7.3 9.8 12.5 9.3 6.8 8.3 23.5
Portugal : 1.0 0.8 0.7 0.7 1.2 69.5
Finland 7.0 2.8 2.6 2.9 2.1 2.3 11.6
Sweden 2.6 6.0 7.5 6.6 6.7 7.5 11.6
United Kingdom 15.4 45.0 43.8 46.7 38.8 39.9 2.8
Norway 0.5 1.6 1.9 2.2 2.2 2.4 7.8
Switzerland 2.1 7.6 8.3 6.5 5.5 6.9 25.5
Poland 1.9 1.3 1.1 1.7 2.6 3.0 12.9
Romania 3.2 1.4 1.5 1.5 2.1 2.0 -4.7
Russia 3.2 21.2 4.9 6.8 7.7 9.2 19.0
Bulgaria 1.1 1.6 1.1 1.2 1.5 1.2 -22.7
Other European countries 114.1 209.7 227.8 227.0 221.2 217.2 -1.8
Americas 38.5 103.3 108.0 107.7 108.6 123.5 13.7
Africa 64.6 40.8 54.8 40.5 41.8 43.6 4.4
Middle East 2 013.9 2 582.7 2 415.1 2 354.8 2 614.2 2 531.0 -3.2
South Asia 252.6 28.3 48.0 42.7 54.4 49.6 -8.8
East Asia & Pacific 56.1 59.2 59.7 61.2 47.7 64.3 34.7
Japan 4.6 6.7 8.1 7.6 7.6 9.1 19.8
Australia 5.2 10.5 10.1 11.4 10.4 12.0 15.3
Not specified 1.4 4.2 5.1 5.2 6.5 6.8 4.6
(1) Excluding Jordanians.
Source: MOTA.

AJ O R D A N
Tourism Trends in Mediterranean countries108
Since 1992, the total number of arrivals at the borders has always been over 3 million. In 1998 and1999 it attained new heights with 3.3 million, after having experienced a decline in 1996 and 1997. In1999 the number of arrivals of international visitors remained stable compared to 1998, increasingonly very slightly by 0.4%.
Arrivals at the borders (in thousands)
0
500
1 000
1 500
2 000
2 500
3 000
3 500
1991 1992 1993 1994 1995 1996 1997 1998 1999
Visitors Tourists
Source: MOTA.
The majority of visitors come from Middle East countries: 76% in 1999 compared to 86% in 1992. In1999 arrivals of visitors from Europe accounted for 15% of the total (compared to 8.8% in 1992), butrepresented 22% of tourist arrivals.
Arrivals at the borders of tourists from abroad (in thousands)
1990 1991 1992 1993 1994 1995 1996 1997 1998 1999
Total 577 439 669 775 858 1 074 1 103 1 127 1 256 1 358
Europe 118 58 122 153 192 255 252 239 219 293
EU15 : 48 106 131 172 214 226 209 187 255
Americas 39 24 39 52 70 103 108 108 109 124
Middle East 405 348 491 547 553 567 573 604 772 762
Others 16 9 18 24 43 148 170 176 156 180
% Share of Europe 20.4 13.2 18.2 19.7 22.4 23.7 22.8 21.2 17.4 21.6
% Share of EU15 . . 11.0 15.8 16.9 20.0 19.9 20.5 18.5 14.9 18.8
% Share of Americas 6.8 5.5 5.8 6.7 8.2 9.6 9.8 9.6 8.7 9.1
% Share of Middle East 70.2 79.3 73.4 70.6 64.4 52.8 52.0 53.6 61.5 56.1
Source: MOTA.
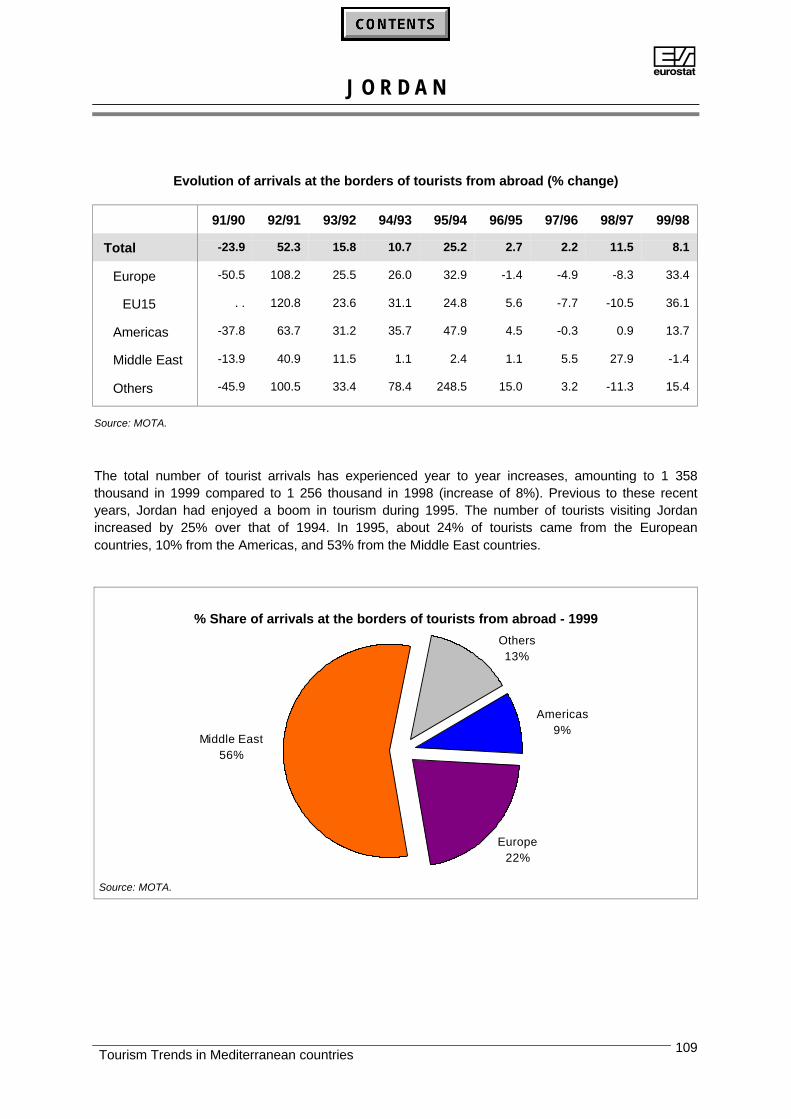
AJ O R D A N
Tourism Trends in Mediterranean countries 109
Evolution of arrivals at the borders of tourists from abroad (% change)
91/90 92/91 93/92 94/93 95/94 96/95 97/96 98/97 99/98
Total -23.9 52.3 15.8 10.7 25.2 2.7 2.2 11.5 8.1
Europe -50.5 108.2 25.5 26.0 32.9 -1.4 -4.9 -8.3 33.4
EU15 . . 120.8 23.6 31.1 24.8 5.6 -7.7 -10.5 36.1
Americas -37.8 63.7 31.2 35.7 47.9 4.5 -0.3 0.9 13.7
Middle East -13.9 40.9 11.5 1.1 2.4 1.1 5.5 27.9 -1.4
Others -45.9 100.5 33.4 78.4 248.5 15.0 3.2 -11.3 15.4
Source: MOTA.
The total number of tourist arrivals has experienced year to year increases, amounting to 1 358thousand in 1999 compared to 1 256 thousand in 1998 (increase of 8%). Previous to these recentyears, Jordan had enjoyed a boom in tourism during 1995. The number of tourists visiting Jordanincreased by 25% over that of 1994. In 1995, about 24% of tourists came from the Europeancountries, 10% from the Americas, and 53% from the Middle East countries.
% Share of arrivals at the borders of tourists from abroad - 1999
Americas9%
Others13%
Middle East56%
Europe22%
Source: MOTA.
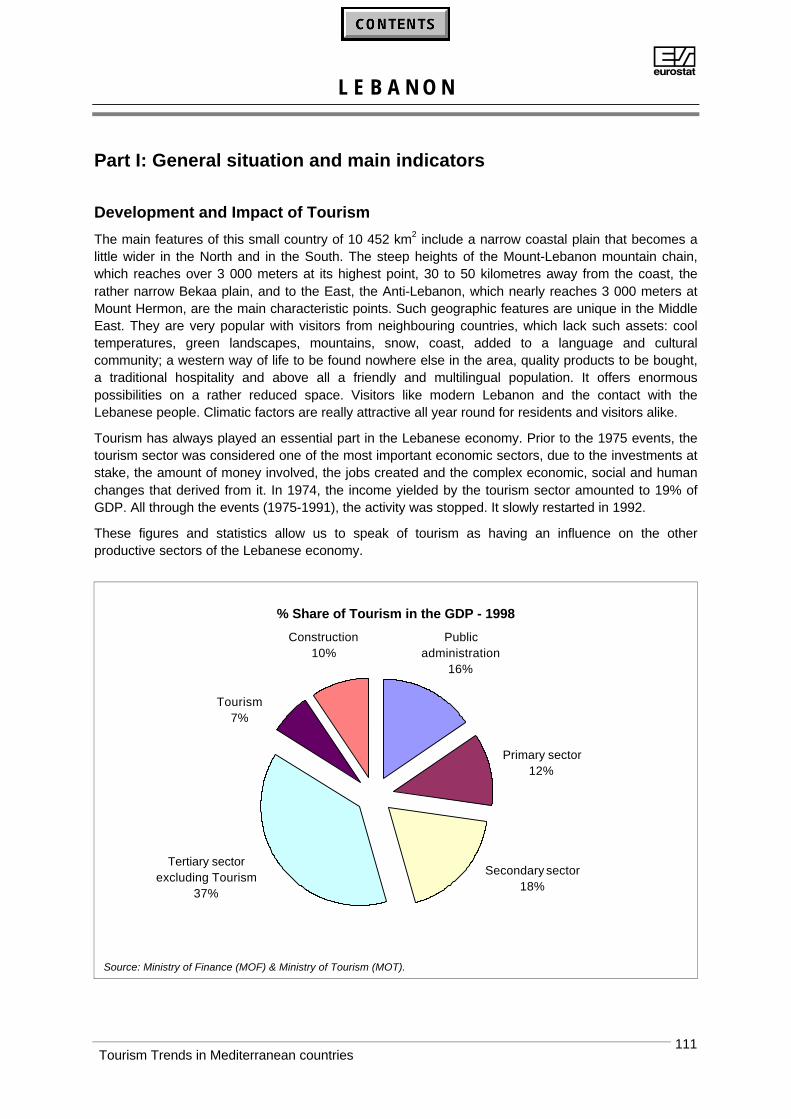
AL E B A N O N
Tourism Trends in Mediterranean countries 111
Part I: General situation and main indicators
Development and Impact of Tourism
The main features of this small country of 10 452 km2 include a narrow coastal plain that becomes alittle wider in the North and in the South. The steep heights of the Mount-Lebanon mountain chain,which reaches over 3 000 meters at its highest point, 30 to 50 kilometres away from the coast, therather narrow Bekaa plain, and to the East, the Anti-Lebanon, which nearly reaches 3 000 meters atMount Hermon, are the main characteristic points. Such geographic features are unique in the MiddleEast. They are very popular with visitors from neighbouring countries, which lack such assets: cooltemperatures, green landscapes, mountains, snow, coast, added to a language and culturalcommunity; a western way of life to be found nowhere else in the area, quality products to be bought,a traditional hospitality and above all a friendly and multilingual population. It offers enormouspossibilities on a rather reduced space. Visitors like modern Lebanon and the contact with theLebanese people. Climatic factors are really attractive all year round for residents and visitors alike.
Tourism has always played an essential part in the Lebanese economy. Prior to the 1975 events, thetourism sector was considered one of the most important economic sectors, due to the investments atstake, the amount of money involved, the jobs created and the complex economic, social and humanchanges that derived from it. In 1974, the income yielded by the tourism sector amounted to 19% ofGDP. All through the events (1975-1991), the activity was stopped. It slowly restarted in 1992.
These figures and statistics allow us to speak of tourism as having an influence on the otherproductive sectors of the Lebanese economy.
% Share of Tourism in the GDP - 1998
Construction10%
Tourism7%
Tertiary sector excluding Tourism
37%
Secondary sector18%
Public administration
16%
Primary sector12%
Source: Ministry of Finance (MOF) & Ministry of Tourism (MOT).

AL E B A N O N
Tourism Trends in Mediterranean countries112
The Gross Domestic Product is broken down in the following sectors: primary 12%, secondary 18%,tertiary 38.25% (tourism sector excluded), public administration 15.5%, construction 9.5% and tourism6.75%.
GDP and Balance of Payments (Mio ECU)
1995 1996 1997 1998 % change 98/97
GDP 8 500 10 232 13 106 14 419 10.0
Travel Receipts 534 556 875 974 11.4
% Share of travel receipts inrelation to GDP
6.3 5.4 6.7 6.8 . .
Source: MOF and MOT.
Because of data availability, tourism receipts will be used instead of the share of tourism in GDP. Thegraph below shows the trend in GDP and tourism receipts for the period 1995-1998. It shows that thecontribution of tourism in the creation of national revenue is growing.
Tourist receipts have been constantly increasing since calm returned.
Evolution of the GDP and Travel receipts (Mio ECU)
8.4%8.1%5.8%6.3%
0
2 000
4 000
6 000
8 000
10 000
12 000
1995 1996 1997 1998
GDP Travel receipts
Source: MOF and MOT.
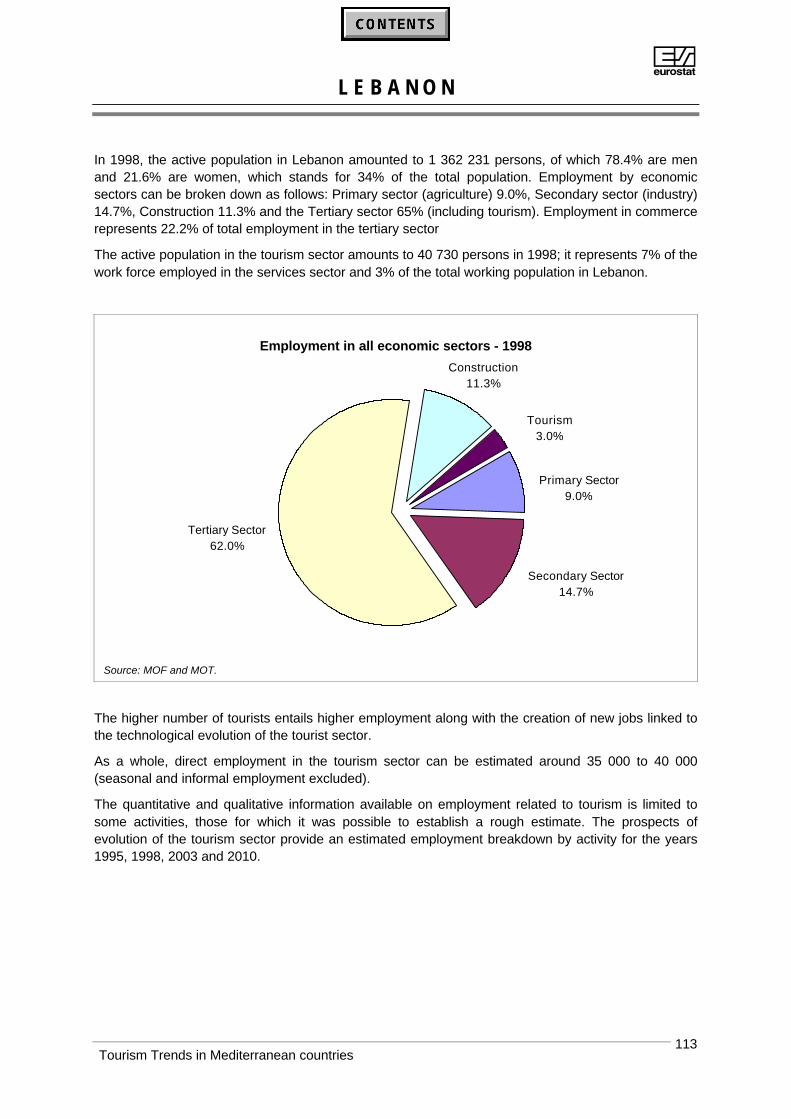
AL E B A N O N
Tourism Trends in Mediterranean countries 113
In 1998, the active population in Lebanon amounted to 1 362 231 persons, of which 78.4% are menand 21.6% are women, which stands for 34% of the total population. Employment by economicsectors can be broken down as follows: Primary sector (agriculture) 9.0%, Secondary sector (industry)14.7%, Construction 11.3% and the Tertiary sector 65% (including tourism). Employment in commercerepresents 22.2% of total employment in the tertiary sector
The active population in the tourism sector amounts to 40 730 persons in 1998; it represents 7% of thework force employed in the services sector and 3% of the total working population in Lebanon.
Employment in all economic sectors - 1998
Secondary Sector14.7%
Primary Sector9.0%
Tertiary Sector 62.0%
Construction11.3%
Tourism3.0%
Source: MOF and MOT.
The higher number of tourists entails higher employment along with the creation of new jobs linked tothe technological evolution of the tourist sector.
As a whole, direct employment in the tourism sector can be estimated around 35 000 to 40 000(seasonal and informal employment excluded).
The quantitative and qualitative information available on employment related to tourism is limited tosome activities, those for which it was possible to establish a rough estimate. The prospects ofevolution of the tourism sector provide an estimated employment breakdown by activity for the years1995, 1998, 2003 and 2010.
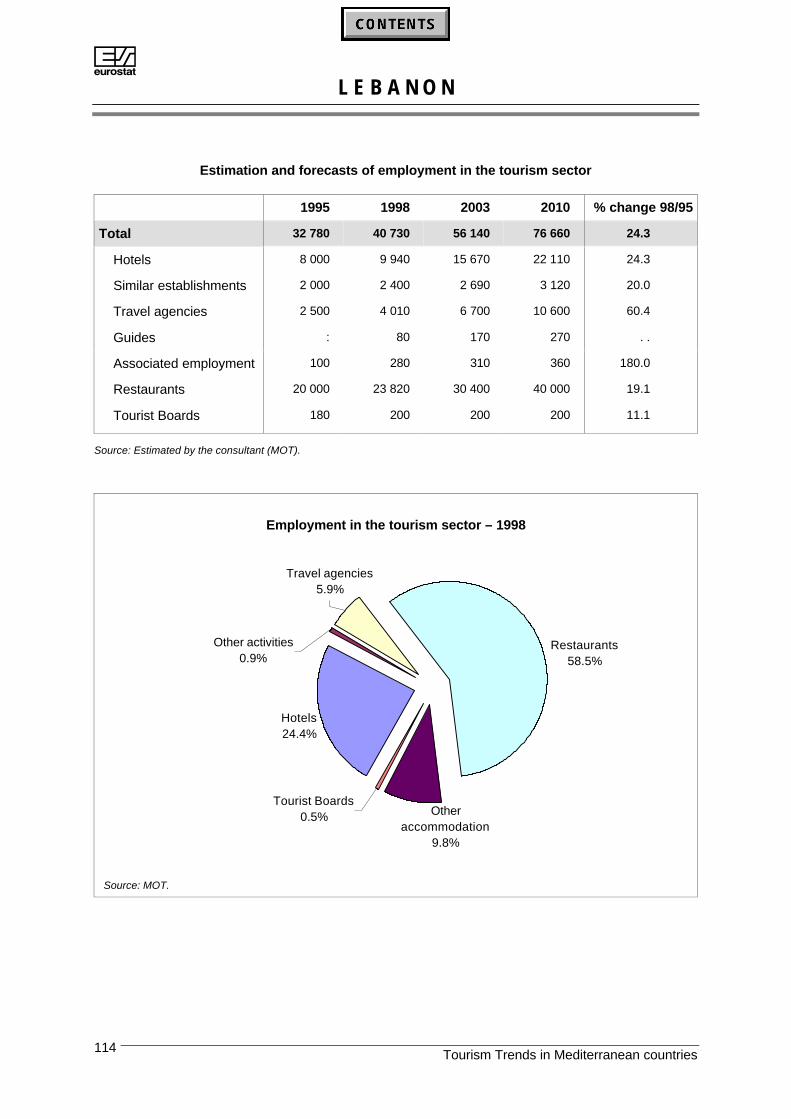
AL E B A N O N
Tourism Trends in Mediterranean countries114
Estimation and forecasts of employment in the tourism sector
1995 1998 2003 2010 % change 98/95
Total 32 780 40 730 56 140 76 660 24.3
Hotels 8 000 9 940 15 670 22 110 24.3
Similar establishments 2 000 2 400 2 690 3 120 20.0
Travel agencies 2 500 4 010 6 700 10 600 60.4
Guides : 80 170 270 . .
Associated employment 100 280 310 360 180.0
Restaurants 20 000 23 820 30 400 40 000 19.1
Tourist Boards 180 200 200 200 11.1
Source: Estimated by the consultant (MOT).
Employment in the tourism sector – 1998
Other activities0.9%
Hotels24.4%
Travel agencies5.9%
Restaurants58.5%
Other accommodation
9.8%
Tourist Boards0.5%
Source: MOT.
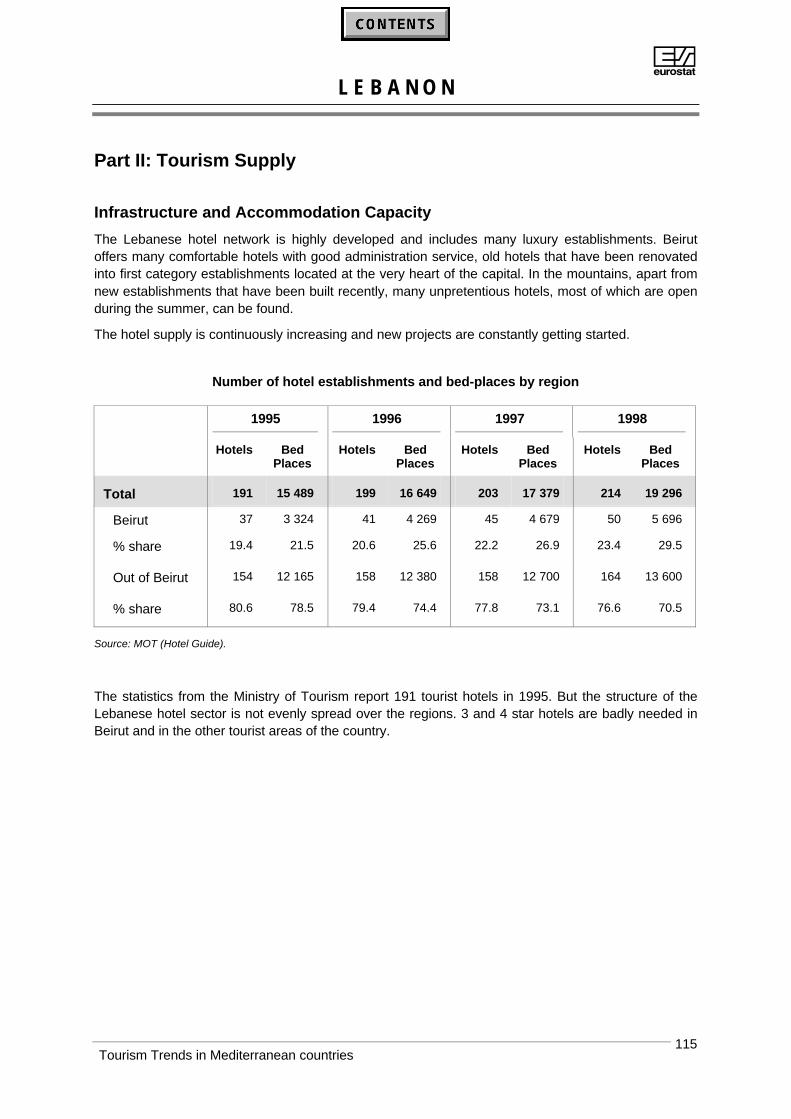
AL E B A N O N
Tourism Trends in Mediterranean countries 115
Part II: Tourism Supply
Infrastructure and Accommodation Capacity
The Lebanese hotel network is highly developed and includes many luxury establishments. Beirutoffers many comfortable hotels with good administration service, old hotels that have been renovatedinto first category establishments located at the very heart of the capital. In the mountains, apart fromnew establishments that have been built recently, many unpretentious hotels, most of which are openduring the summer, can be found.
The hotel supply is continuously increasing and new projects are constantly getting started.
Number of hotel establishments and bed-places by region
1995 1996 1997 1998
Hotels BedPlaces
Hotels BedPlaces
Hotels BedPlaces
Hotels BedPlaces
Total 191 15 489 199 16 649 203 17 379 214 19 296
Beirut 37 3 324 41 4 269 45 4 679 50 5 696
% share 19.4 21.5 20.6 25.6 22.2 26.9 23.4 29.5
Out of Beirut 154 12 165 158 12 380 158 12 700 164 13 600
% share 80.6 78.5 79.4 74.4 77.8 73.1 76.6 70.5
Source: MOT (Hotel Guide).
The statistics from the Ministry of Tourism report 191 tourist hotels in 1995. But the structure of theLebanese hotel sector is not evenly spread over the regions. 3 and 4 star hotels are badly needed inBeirut and in the other tourist areas of the country.
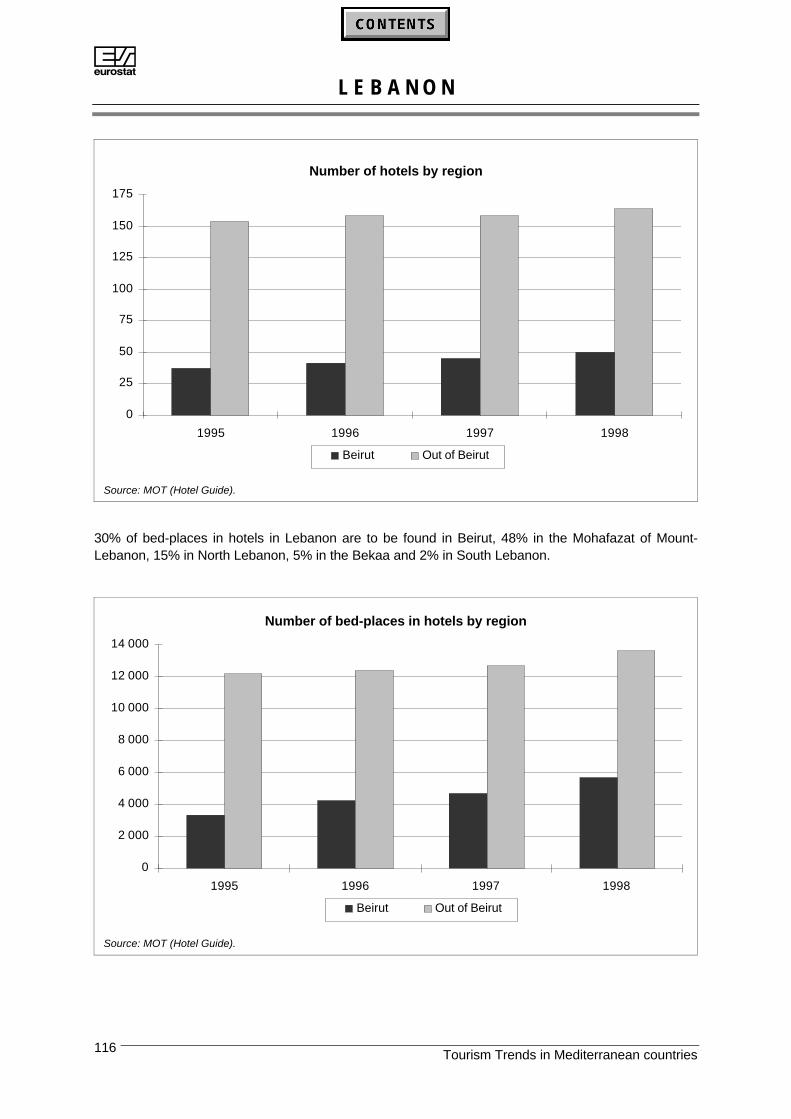
AL E B A N O N
Tourism Trends in Mediterranean countries116
Number of hotels by region
0
25
50
75
100
125
150
175
1995 1996 1997 1998
Beirut Out of Beirut
Source: MOT (Hotel Guide).
30% of bed-places in hotels in Lebanon are to be found in Beirut, 48% in the Mohafazat of Mount-Lebanon, 15% in North Lebanon, 5% in the Bekaa and 2% in South Lebanon.
Number of bed-places in hotels by region
0
2 000
4 000
6 000
8 000
10 000
12 000
14 000
1995 1996 1997 1998
Beirut Out of Beirut
Source: MOT (Hotel Guide).
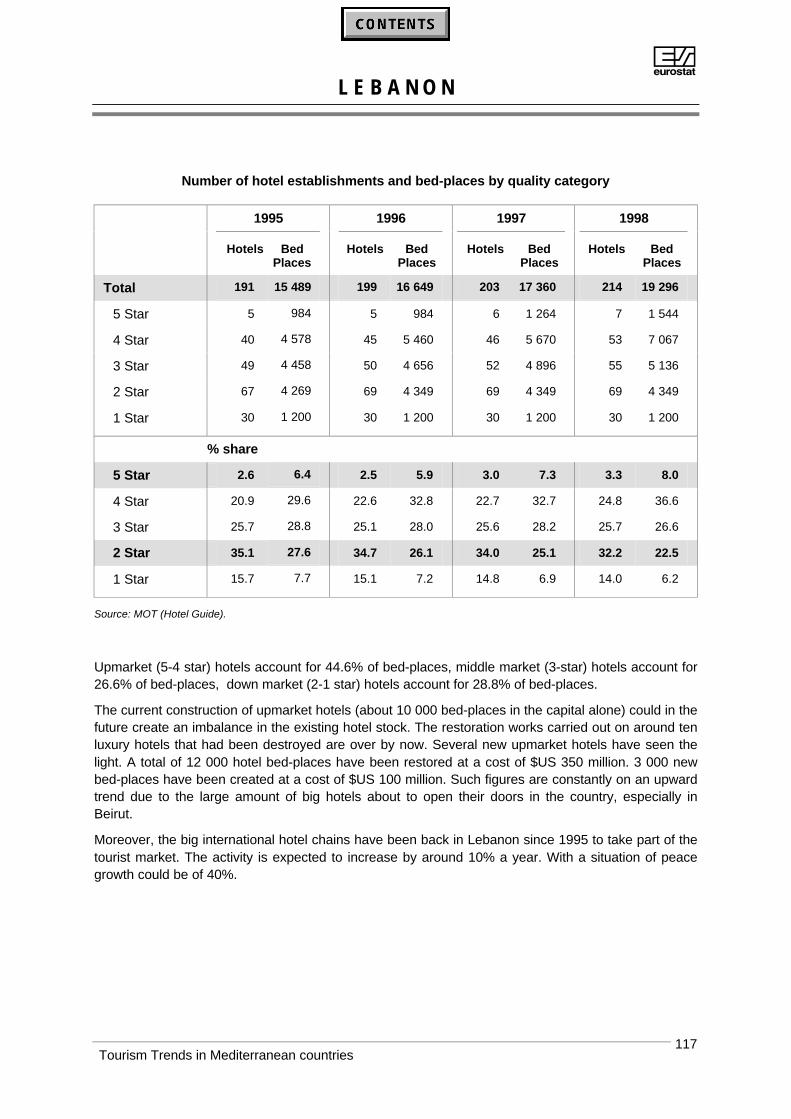
AL E B A N O N
Tourism Trends in Mediterranean countries 117
Number of hotel establishments and bed-places by quality category
1995 1996 1997 1998
Hotels BedPlaces
Hotels BedPlaces
Hotels BedPlaces
Hotels BedPlaces
Total 191 15 489 199 16 649 203 17 360 214 19 296
5 Star 5 984 5 984 6 1 264 7 1 544
4 Star 40 4 578 45 5 460 46 5 670 53 7 067
3 Star 49 4 458 50 4 656 52 4 896 55 5 136
2 Star 67 4 269 69 4 349 69 4 349 69 4 349
1 Star 30 1 200 30 1 200 30 1 200 30 1 200
% share
5 Star 2.6 6.4 2.5 5.9 3.0 7.3 3.3 8.0
4 Star 20.9 29.6 22.6 32.8 22.7 32.7 24.8 36.6
3 Star 25.7 28.8 25.1 28.0 25.6 28.2 25.7 26.6
2 Star 35.1 27.6 34.7 26.1 34.0 25.1 32.2 22.5
1 Star 15.7 7.7 15.1 7.2 14.8 6.9 14.0 6.2
Source: MOT (Hotel Guide).
Upmarket (5-4 star) hotels account for 44.6% of bed-places, middle market (3-star) hotels account for26.6% of bed-places, down market (2-1 star) hotels account for 28.8% of bed-places.
The current construction of upmarket hotels (about 10 000 bed-places in the capital alone) could in thefuture create an imbalance in the existing hotel stock. The restoration works carried out on around tenluxury hotels that had been destroyed are over by now. Several new upmarket hotels have seen thelight. A total of 12 000 hotel bed-places have been restored at a cost of $US 350 million. 3 000 newbed-places have been created at a cost of $US 100 million. Such figures are constantly on an upwardtrend due to the large amount of big hotels about to open their doors in the country, especially inBeirut.
Moreover, the big international hotel chains have been back in Lebanon since 1995 to take part of thetourist market. The activity is expected to increase by around 10% a year. With a situation of peacegrowth could be of 40%.
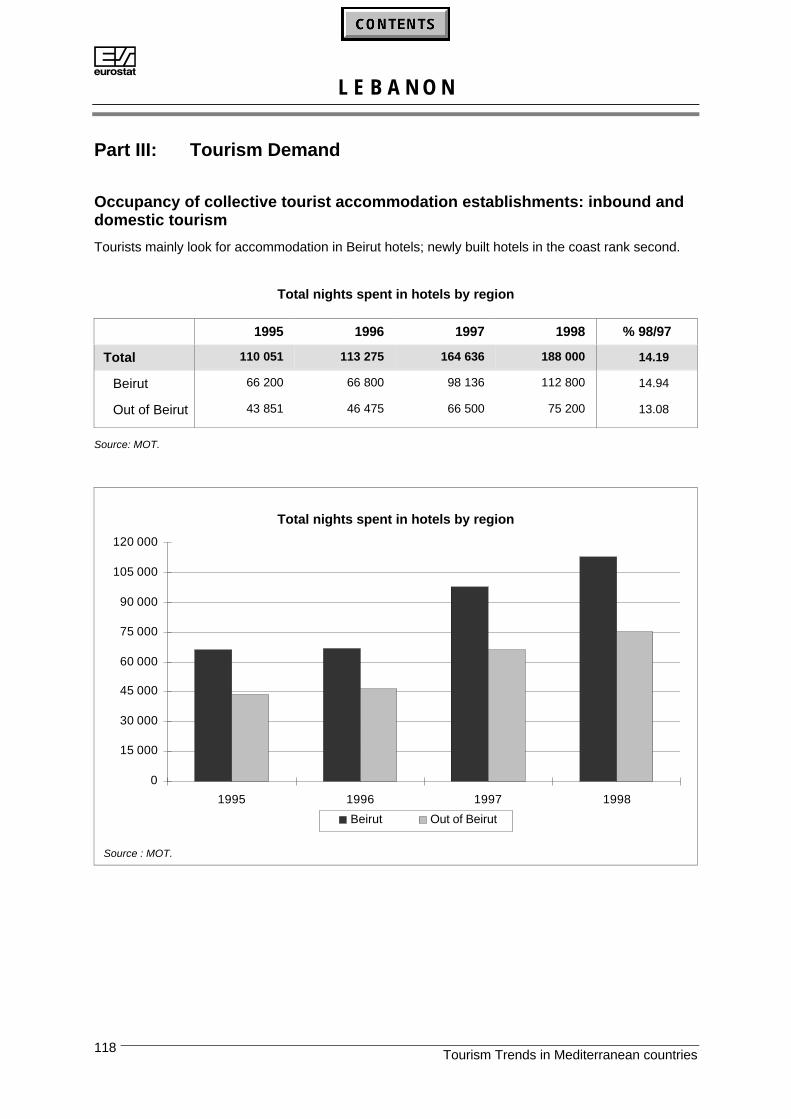
AL E B A N O N
Tourism Trends in Mediterranean countries118
Part III: Tourism Demand
Occupancy of collective tourist accommodation establishments: inbound anddomestic tourism
Tourists mainly look for accommodation in Beirut hotels; newly built hotels in the coast rank second.
Total nights spent in hotels by region
1995 1996 1997 1998 % 98/97
Total 110 051 113 275 164 636 188 000 14.19
Beirut 66 200 66 800 98 136 112 800 14.94
Out of Beirut 43 851 46 475 66 500 75 200 13.08
Source: MOT.
Total nights spent in hotels by region
0
15 000
30 000
45 000
60 000
75 000
90 000
105 000
120 000
1995 1996 1997 1998
Beirut Out of Beirut
Source : MOT.
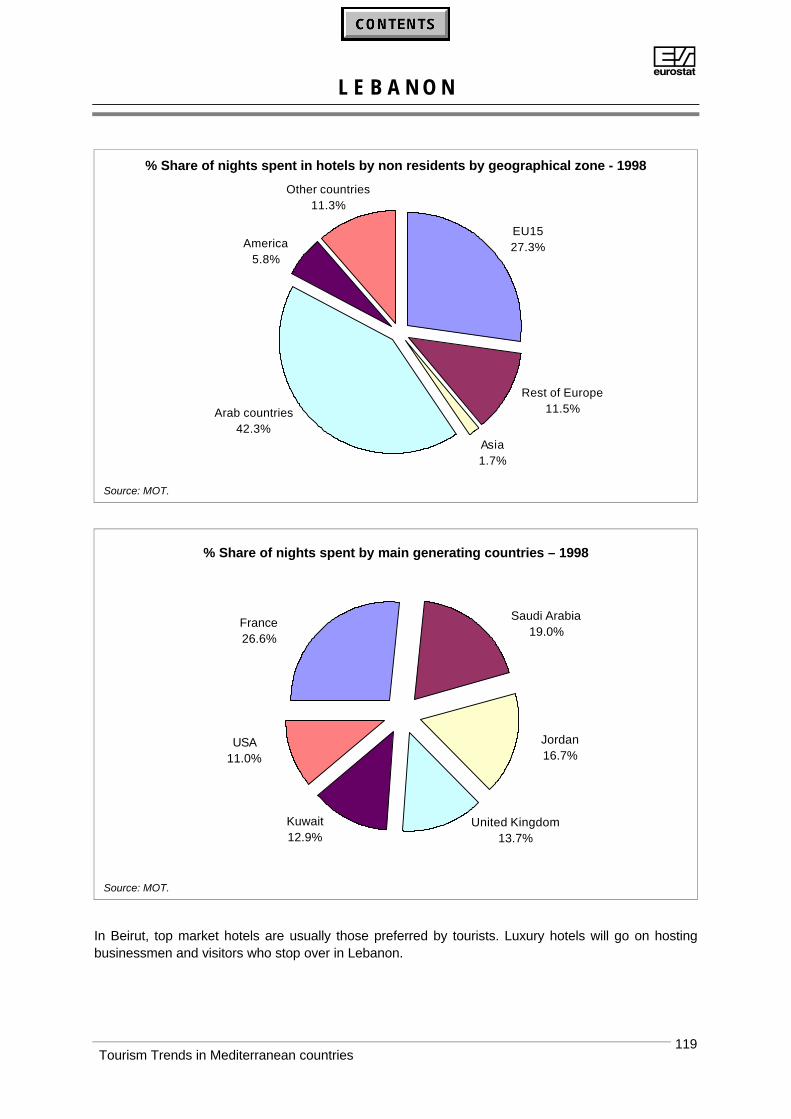
AL E B A N O N
Tourism Trends in Mediterranean countries 119
% Share of nights spent in hotels by non residents by geographical zone - 1998
Rest of Europe11.5%
EU1527.3%
Asia1.7%
Arab countries42.3%
America5.8%
Other countries11.3%
Source: MOT.
% Share of nights spent by main generating countries – 1998
Saudi Arabia19.0%
France26.6%
Jordan16.7%
United Kingdom13.7%
Kuwait12.9%
USA11.0%
Source: MOT.
In Beirut, top market hotels are usually those preferred by tourists. Luxury hotels will go on hostingbusinessmen and visitors who stop over in Lebanon.
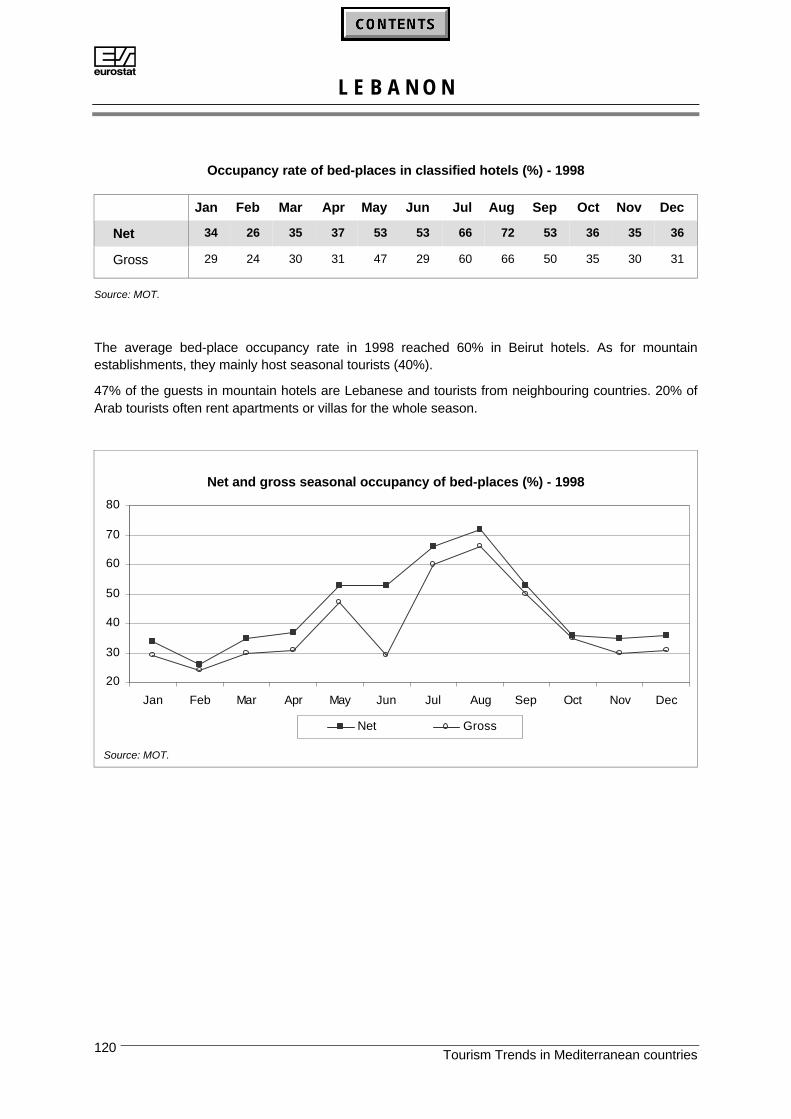
AL E B A N O N
Tourism Trends in Mediterranean countries120
Occupancy rate of bed-places in classified hotels (%) - 1998
Jan Feb Mar Apr May Jun Jul Aug Sep Oct Nov Dec
Net 34 26 35 37 53 53 66 72 53 36 35 36
Gross 29 24 30 31 47 29 60 66 50 35 30 31
Source: MOT.
The average bed-place occupancy rate in 1998 reached 60% in Beirut hotels. As for mountainestablishments, they mainly host seasonal tourists (40%).
47% of the guests in mountain hotels are Lebanese and tourists from neighbouring countries. 20% ofArab tourists often rent apartments or villas for the whole season.
Net and gross seasonal occupancy of bed-places (%) - 1998
20
30
40
50
60
70
80
Jan Feb Mar Apr May Jun Jul Aug Sep Oct Nov Dec
Net Gross
Source: MOT.
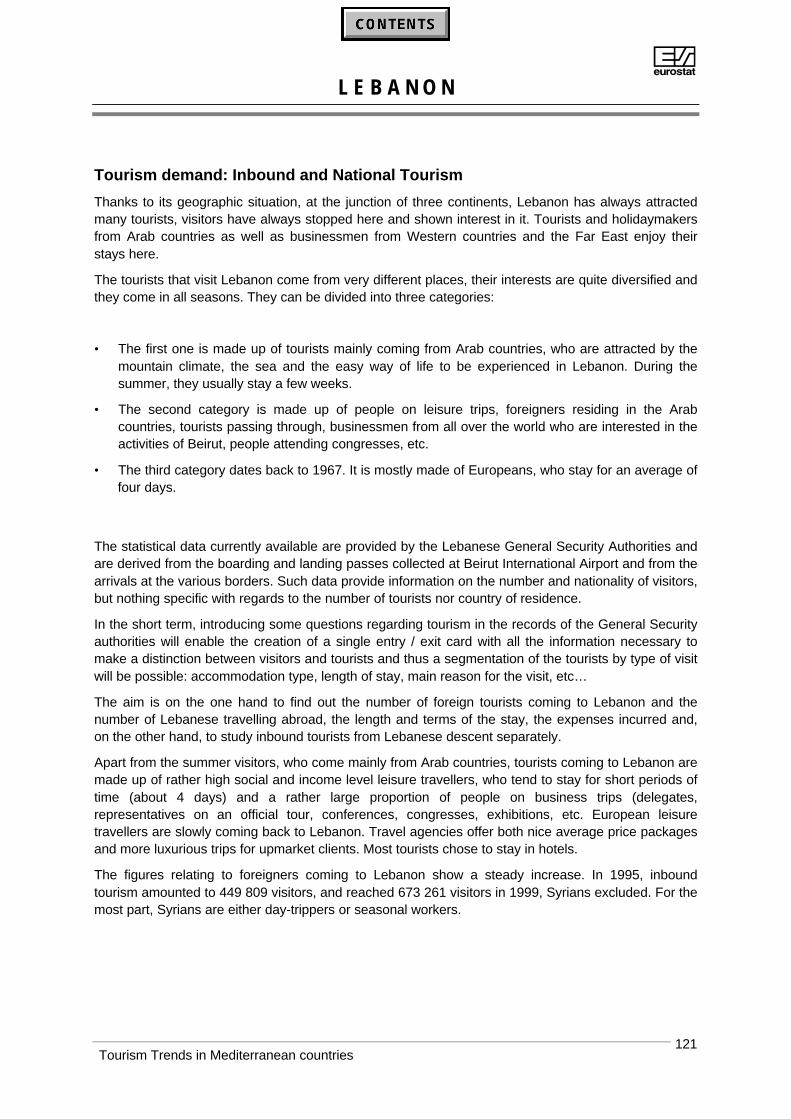
AL E B A N O N
Tourism Trends in Mediterranean countries 121
Tourism demand: Inbound and National Tourism
Thanks to its geographic situation, at the junction of three continents, Lebanon has always attractedmany tourists, visitors have always stopped here and shown interest in it. Tourists and holidaymakersfrom Arab countries as well as businessmen from Western countries and the Far East enjoy theirstays here.
The tourists that visit Lebanon come from very different places, their interests are quite diversified andthey come in all seasons. They can be divided into three categories:
• The first one is made up of tourists mainly coming from Arab countries, who are attracted by themountain climate, the sea and the easy way of life to be experienced in Lebanon. During thesummer, they usually stay a few weeks.
• The second category is made up of people on leisure trips, foreigners residing in the Arabcountries, tourists passing through, businessmen from all over the world who are interested in theactivities of Beirut, people attending congresses, etc.
• The third category dates back to 1967. It is mostly made of Europeans, who stay for an average offour days.
The statistical data currently available are provided by the Lebanese General Security Authorities andare derived from the boarding and landing passes collected at Beirut International Airport and from thearrivals at the various borders. Such data provide information on the number and nationality of visitors,but nothing specific with regards to the number of tourists nor country of residence.
In the short term, introducing some questions regarding tourism in the records of the General Securityauthorities will enable the creation of a single entry / exit card with all the information necessary tomake a distinction between visitors and tourists and thus a segmentation of the tourists by type of visitwill be possible: accommodation type, length of stay, main reason for the visit, etc…
The aim is on the one hand to find out the number of foreign tourists coming to Lebanon and thenumber of Lebanese travelling abroad, the length and terms of the stay, the expenses incurred and,on the other hand, to study inbound tourists from Lebanese descent separately.
Apart from the summer visitors, who come mainly from Arab countries, tourists coming to Lebanon aremade up of rather high social and income level leisure travellers, who tend to stay for short periods oftime (about 4 days) and a rather large proportion of people on business trips (delegates,representatives on an official tour, conferences, congresses, exhibitions, etc. European leisuretravellers are slowly coming back to Lebanon. Travel agencies offer both nice average price packagesand more luxurious trips for upmarket clients. Most tourists chose to stay in hotels.
The figures relating to foreigners coming to Lebanon show a steady increase. In 1995, inboundtourism amounted to 449 809 visitors, and reached 673 261 visitors in 1999, Syrians excluded. For themost part, Syrians are either day-trippers or seasonal workers.
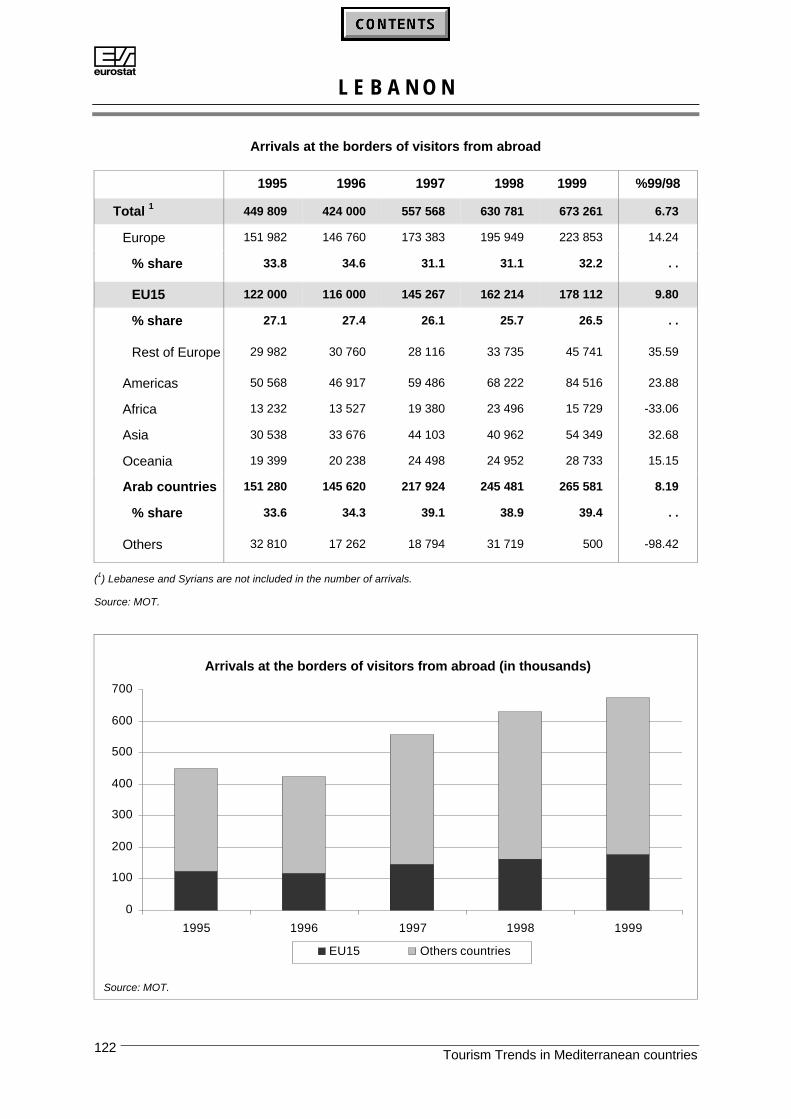
AL E B A N O N
Tourism Trends in Mediterranean countries122
Arrivals at the borders of visitors from abroad
1995 1996 1997 1998 1999 %99/98
Total 1 449 809 424 000 557 568 630 781 673 261 6.73
Europe 151 982 146 760 173 383 195 949 223 853 14.24
% share 33.8 34.6 31.1 31.1 32.2 . .
EU15 122 000 116 000 145 267 162 214 178 112 9.80
% share 27.1 27.4 26.1 25.7 26.5 . .
Rest of Europe 29 982 30 760 28 116 33 735 45 741 35.59
Americas 50 568 46 917 59 486 68 222 84 516 23.88
Africa 13 232 13 527 19 380 23 496 15 729 -33.06
Asia 30 538 33 676 44 103 40 962 54 349 32.68
Oceania 19 399 20 238 24 498 24 952 28 733 15.15
Arab countries 151 280 145 620 217 924 245 481 265 581 8.19
% share 33.6 34.3 39.1 38.9 39.4 . .
Others 32 810 17 262 18 794 31 719 500 -98.42
(1) Lebanese and Syrians are not included in the number of arrivals.
Source: MOT.
Arrivals at the borders of visitors from abroad (in thousands)
0
100
200
300
400
500
600
700
1995 1996 1997 1998 1999
EU15 Others countries
Source: MOT.
AL E B A N O N
Tourism Trends in Mediterranean countries 123
Roughly 40% of the total number of visitors are Arabs. Among Arab visitors, 71 143 out of the total of630 781 that arrived at the borders in 1998 came from Saudi Arabia alone, 50 640 from Jordan and 40191 from Kuwait.
As for visitors from European countries (31%), French nationals rank first in 1998 with 58 527 arrivals,followed by 27 148 Germans, 22 033 British and 14 674 Italians. Some of these visitors are residentsin countries other than their countries of origin, for example in the neighbouring Arab countries. Suchtourists visit the country more and more frequently.
Arrivals of visitors at the borders by geographical zone - 1999
Arab countries39.5%
Oceania4.3%
Asia8.1%
Africa2.3%Americas
12.6%
EU1526.5%
Rest of Europe6.8%
Source: MOT.
Arab tourism registers a high seasonal peak in summer. As for European visitors, they mostly come inApril and between July and October.
According to the surveys, it appears that 60% of foreign tourists come to Lebanon on holidays, 30%on business and 10% to visit relatives. Transport modes used are mainly by air, 70% in regular flights;30% by land.
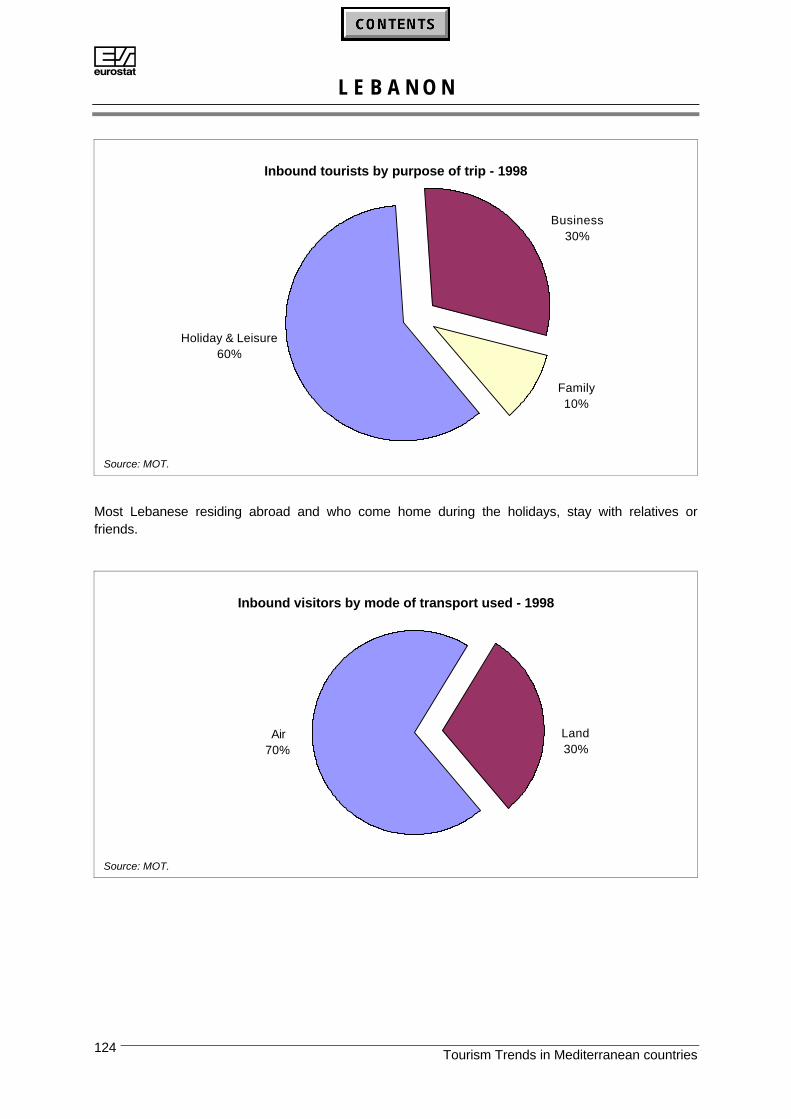
AL E B A N O N
Tourism Trends in Mediterranean countries124
Inbound tourists by purpose of trip - 1998
Business30%
Holiday & Leisure60%
Family10%
Source: MOT.
Most Lebanese residing abroad and who come home during the holidays, stay with relatives orfriends.
Inbound visitors by mode of transport used - 1998
Land30%
Air70%
Source: MOT.
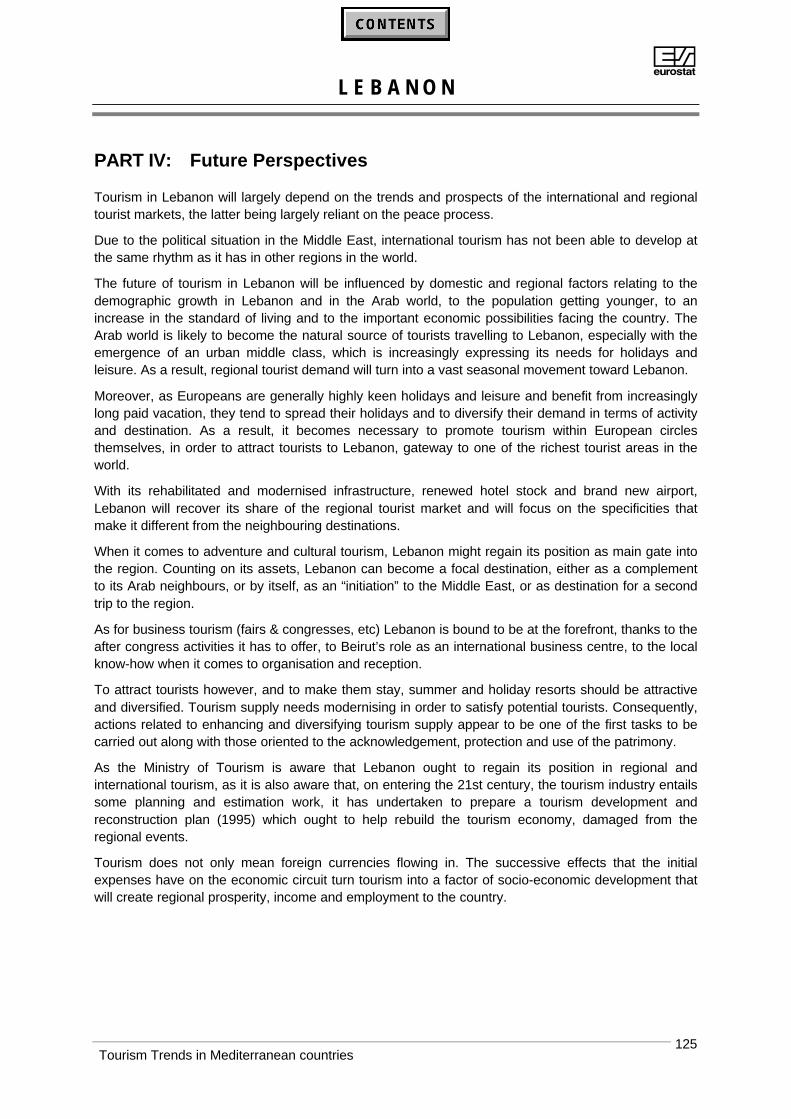
AL E B A N O N
Tourism Trends in Mediterranean countries 125
PART IV: Future Perspectives
Tourism in Lebanon will largely depend on the trends and prospects of the international and regionaltourist markets, the latter being largely reliant on the peace process.
Due to the political situation in the Middle East, international tourism has not been able to develop atthe same rhythm as it has in other regions in the world.
The future of tourism in Lebanon will be influenced by domestic and regional factors relating to thedemographic growth in Lebanon and in the Arab world, to the population getting younger, to anincrease in the standard of living and to the important economic possibilities facing the country. TheArab world is likely to become the natural source of tourists travelling to Lebanon, especially with theemergence of an urban middle class, which is increasingly expressing its needs for holidays andleisure. As a result, regional tourist demand will turn into a vast seasonal movement toward Lebanon.
Moreover, as Europeans are generally highly keen holidays and leisure and benefit from increasinglylong paid vacation, they tend to spread their holidays and to diversify their demand in terms of activityand destination. As a result, it becomes necessary to promote tourism within European circlesthemselves, in order to attract tourists to Lebanon, gateway to one of the richest tourist areas in theworld.
With its rehabilitated and modernised infrastructure, renewed hotel stock and brand new airport,Lebanon will recover its share of the regional tourist market and will focus on the specificities thatmake it different from the neighbouring destinations.
When it comes to adventure and cultural tourism, Lebanon might regain its position as main gate intothe region. Counting on its assets, Lebanon can become a focal destination, either as a complementto its Arab neighbours, or by itself, as an “initiation” to the Middle East, or as destination for a secondtrip to the region.
As for business tourism (fairs & congresses, etc) Lebanon is bound to be at the forefront, thanks to theafter congress activities it has to offer, to Beirut’s role as an international business centre, to the localknow-how when it comes to organisation and reception.
To attract tourists however, and to make them stay, summer and holiday resorts should be attractiveand diversified. Tourism supply needs modernising in order to satisfy potential tourists. Consequently,actions related to enhancing and diversifying tourism supply appear to be one of the first tasks to becarried out along with those oriented to the acknowledgement, protection and use of the patrimony.
As the Ministry of Tourism is aware that Lebanon ought to regain its position in regional andinternational tourism, as it is also aware that, on entering the 21st century, the tourism industry entailssome planning and estimation work, it has undertaken to prepare a tourism development andreconstruction plan (1995) which ought to help rebuild the tourism economy, damaged from theregional events.
Tourism does not only mean foreign currencies flowing in. The successive effects that the initialexpenses have on the economic circuit turn tourism into a factor of socio-economic development thatwill create regional prosperity, income and employment to the country.
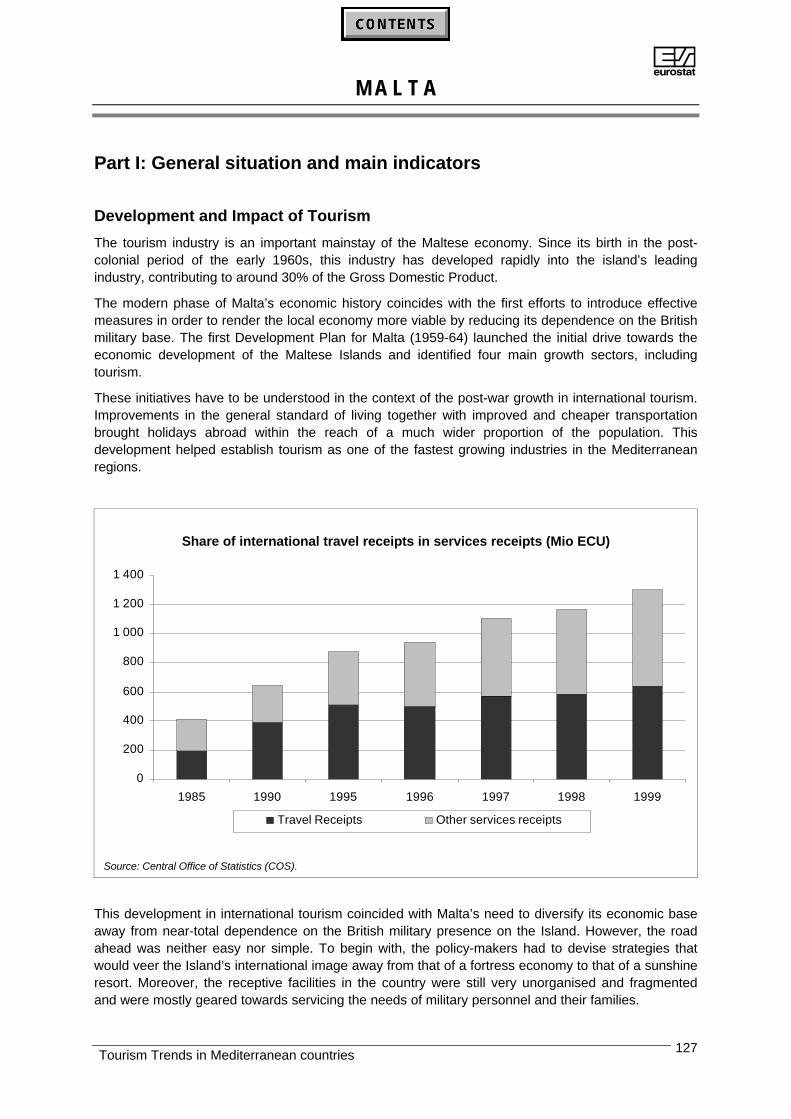
AM A L T A
Tourism Trends in Mediterranean countries 127
Part I: General situation and main indicators
Development and Impact of Tourism
The tourism industry is an important mainstay of the Maltese economy. Since its birth in the post-colonial period of the early 1960s, this industry has developed rapidly into the island’s leadingindustry, contributing to around 30% of the Gross Domestic Product.
The modern phase of Malta’s economic history coincides with the first efforts to introduce effectivemeasures in order to render the local economy more viable by reducing its dependence on the Britishmilitary base. The first Development Plan for Malta (1959-64) launched the initial drive towards theeconomic development of the Maltese Islands and identified four main growth sectors, includingtourism.
These initiatives have to be understood in the context of the post-war growth in international tourism.Improvements in the general standard of living together with improved and cheaper transportationbrought holidays abroad within the reach of a much wider proportion of the population. Thisdevelopment helped establish tourism as one of the fastest growing industries in the Mediterraneanregions.
Share of international travel receipts in services receipts (Mio ECU)
0
200
400
600
800
1 000
1 200
1 400
1985 1990 1995 1996 1997 1998 1999
Travel Receipts Other services receipts
Source: Central Office of Statistics (COS).
This development in international tourism coincided with Malta’s need to diversify its economic baseaway from near-total dependence on the British military presence on the Island. However, the roadahead was neither easy nor simple. To begin with, the policy-makers had to devise strategies thatwould veer the Island’s international image away from that of a fortress economy to that of a sunshineresort. Moreover, the receptive facilities in the country were still very unorganised and fragmentedand were mostly geared towards servicing the needs of military personnel and their families.
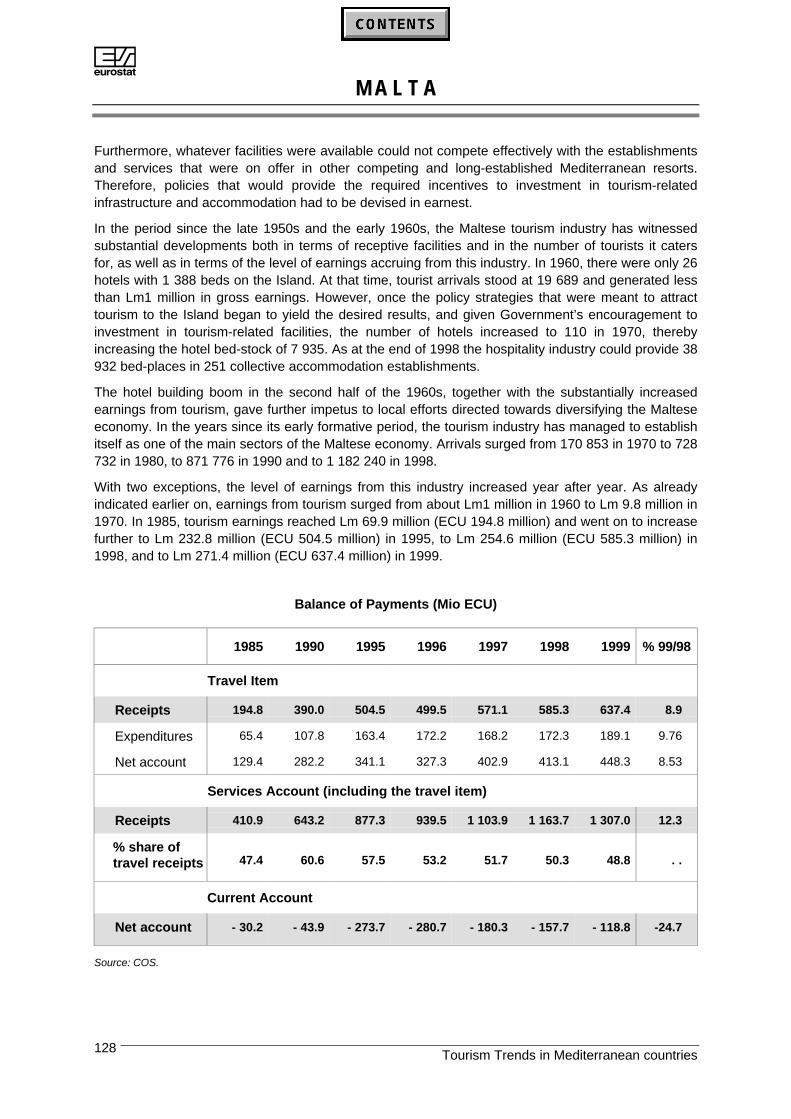
AM A L T A
Tourism Trends in Mediterranean countries128
Furthermore, whatever facilities were available could not compete effectively with the establishmentsand services that were on offer in other competing and long-established Mediterranean resorts.Therefore, policies that would provide the required incentives to investment in tourism-relatedinfrastructure and accommodation had to be devised in earnest.
In the period since the late 1950s and the early 1960s, the Maltese tourism industry has witnessedsubstantial developments both in terms of receptive facilities and in the number of tourists it catersfor, as well as in terms of the level of earnings accruing from this industry. In 1960, there were only 26hotels with 1 388 beds on the Island. At that time, tourist arrivals stood at 19 689 and generated lessthan Lm1 million in gross earnings. However, once the policy strategies that were meant to attracttourism to the Island began to yield the desired results, and given Government’s encouragement toinvestment in tourism-related facilities, the number of hotels increased to 110 in 1970, therebyincreasing the hotel bed-stock of 7 935. As at the end of 1998 the hospitality industry could provide 38932 bed-places in 251 collective accommodation establishments.
The hotel building boom in the second half of the 1960s, together with the substantially increasedearnings from tourism, gave further impetus to local efforts directed towards diversifying the Malteseeconomy. In the years since its early formative period, the tourism industry has managed to establishitself as one of the main sectors of the Maltese economy. Arrivals surged from 170 853 in 1970 to 728732 in 1980, to 871 776 in 1990 and to 1 182 240 in 1998.
With two exceptions, the level of earnings from this industry increased year after year. As alreadyindicated earlier on, earnings from tourism surged from about Lm1 million in 1960 to Lm 9.8 million in1970. In 1985, tourism earnings reached Lm 69.9 million (ECU 194.8 million) and went on to increasefurther to Lm 232.8 million (ECU 504.5 million) in 1995, to Lm 254.6 million (ECU 585.3 million) in1998, and to Lm 271.4 million (ECU 637.4 million) in 1999.
Balance of Payments (Mio ECU)
1985 1990 1995 1996 1997 1998 1999 % 99/98
Travel Item
Receipts 194.8 390.0 504.5 499.5 571.1 585.3 637.4 8.9
Expenditures 65.4 107.8 163.4 172.2 168.2 172.3 189.1 9.76
Net account 129.4 282.2 341.1 327.3 402.9 413.1 448.3 8.53
Services Account (including the travel item)
Receipts 410.9 643.2 877.3 939.5 1 103.9 1 163.7 1 307.0 12.3
% share oftravel receipts 47.4 60.6 57.5 53.2 51.7 50.3 48.8 . .
Current Account
Net account - 30.2 - 43.9 - 273.7 - 280.7 - 180.3 - 157.7 - 118.8 -24.7
Source: COS.
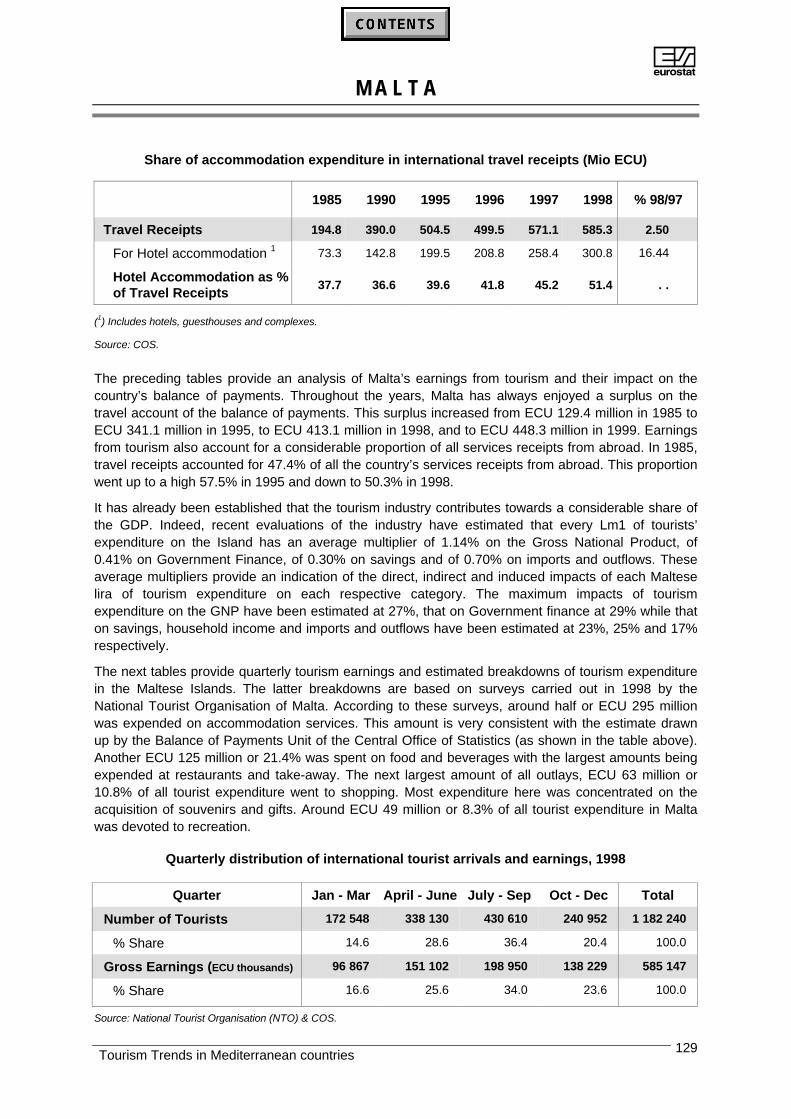
AM A L T A
Tourism Trends in Mediterranean countries 129
Share of accommodation expenditure in international travel receipts (Mio ECU)
1985 1990 1995 1996 1997 1998 % 98/97
Travel Receipts 194.8 390.0 504.5 499.5 571.1 585.3 2.50
For Hotel accommodation 1 73.3 142.8 199.5 208.8 258.4 300.8 16.44
Hotel Accommodation as %of Travel Receipts
37.7 36.6 39.6 41.8 45.2 51.4 . .
(1) Includes hotels, guesthouses and complexes.
Source: COS.
The preceding tables provide an analysis of Malta’s earnings from tourism and their impact on thecountry’s balance of payments. Throughout the years, Malta has always enjoyed a surplus on thetravel account of the balance of payments. This surplus increased from ECU 129.4 million in 1985 toECU 341.1 million in 1995, to ECU 413.1 million in 1998, and to ECU 448.3 million in 1999. Earningsfrom tourism also account for a considerable proportion of all services receipts from abroad. In 1985,travel receipts accounted for 47.4% of all the country’s services receipts from abroad. This proportionwent up to a high 57.5% in 1995 and down to 50.3% in 1998.
It has already been established that the tourism industry contributes towards a considerable share ofthe GDP. Indeed, recent evaluations of the industry have estimated that every Lm1 of tourists’expenditure on the Island has an average multiplier of 1.14% on the Gross National Product, of0.41% on Government Finance, of 0.30% on savings and of 0.70% on imports and outflows. Theseaverage multipliers provide an indication of the direct, indirect and induced impacts of each Malteselira of tourism expenditure on each respective category. The maximum impacts of tourismexpenditure on the GNP have been estimated at 27%, that on Government finance at 29% while thaton savings, household income and imports and outflows have been estimated at 23%, 25% and 17%respectively.
The next tables provide quarterly tourism earnings and estimated breakdowns of tourism expenditurein the Maltese Islands. The latter breakdowns are based on surveys carried out in 1998 by theNational Tourist Organisation of Malta. According to these surveys, around half or ECU 295 millionwas expended on accommodation services. This amount is very consistent with the estimate drawnup by the Balance of Payments Unit of the Central Office of Statistics (as shown in the table above).Another ECU 125 million or 21.4% was spent on food and beverages with the largest amounts beingexpended at restaurants and take-away. The next largest amount of all outlays, ECU 63 million or10.8% of all tourist expenditure went to shopping. Most expenditure here was concentrated on theacquisition of souvenirs and gifts. Around ECU 49 million or 8.3% of all tourist expenditure in Maltawas devoted to recreation.
Quarterly distribution of international tourist arrivals and earnings, 1998
Quarter Jan - Mar April - June July - Sep Oct - Dec Total
Number of Tourists 172 548 338 130 430 610 240 952 1 182 240
% Share 14.6 28.6 36.4 20.4 100.0
Gross Earnings (ECU thousands) 96 867 151 102 198 950 138 229 585 147
% Share 16.6 25.6 34.0 23.6 100.0
Source: National Tourist Organisation (NTO) & COS.
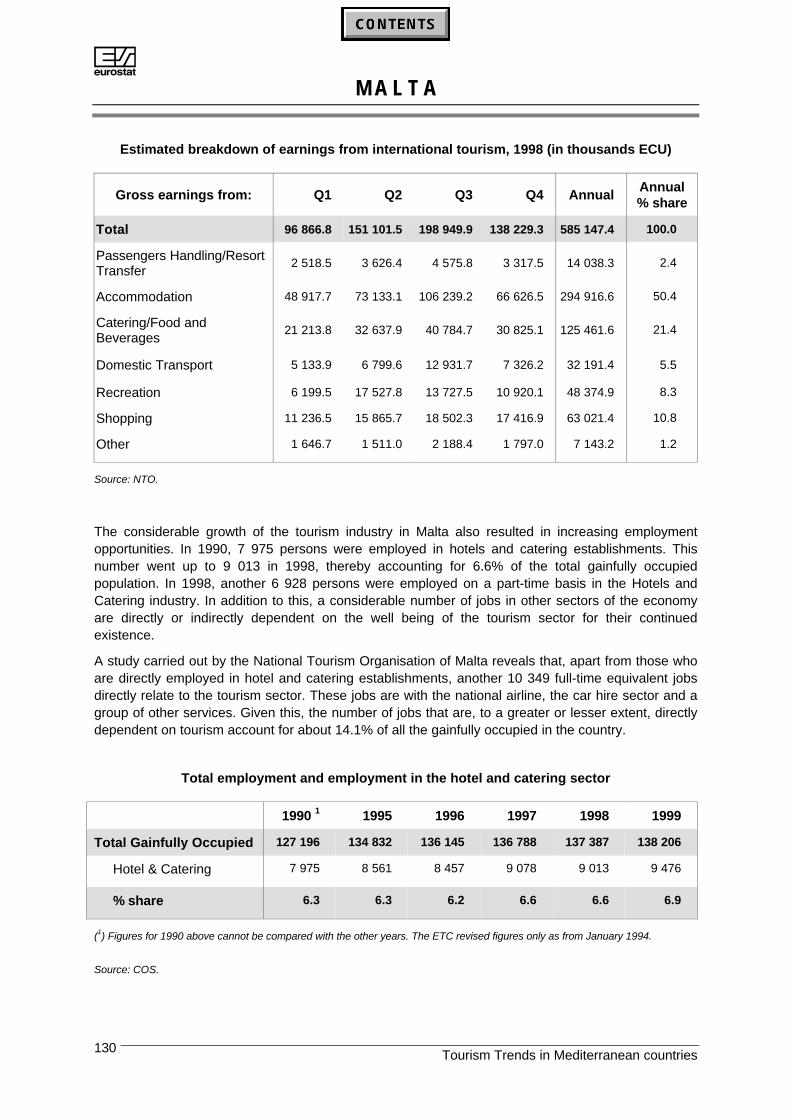
AM A L T A
Tourism Trends in Mediterranean countries130
Estimated breakdown of earnings from international tourism, 1998 (in thousands ECU)
Gross earnings from: Q1 Q2 Q3 Q4 AnnualAnnual% share
Total 96 866.8 151 101.5 198 949.9 138 229.3 585 147.4 100.0
Passengers Handling/ResortTransfer
2 518.5 3 626.4 4 575.8 3 317.5 14 038.3 2.4
Accommodation 48 917.7 73 133.1 106 239.2 66 626.5 294 916.6 50.4
Catering/Food andBeverages
21 213.8 32 637.9 40 784.7 30 825.1 125 461.6 21.4
Domestic Transport 5 133.9 6 799.6 12 931.7 7 326.2 32 191.4 5.5
Recreation 6 199.5 17 527.8 13 727.5 10 920.1 48 374.9 8.3
Shopping 11 236.5 15 865.7 18 502.3 17 416.9 63 021.4 10.8
Other 1 646.7 1 511.0 2 188.4 1 797.0 7 143.2 1.2
Source: NTO.
The considerable growth of the tourism industry in Malta also resulted in increasing employmentopportunities. In 1990, 7 975 persons were employed in hotels and catering establishments. Thisnumber went up to 9 013 in 1998, thereby accounting for 6.6% of the total gainfully occupiedpopulation. In 1998, another 6 928 persons were employed on a part-time basis in the Hotels andCatering industry. In addition to this, a considerable number of jobs in other sectors of the economyare directly or indirectly dependent on the well being of the tourism sector for their continuedexistence.
A study carried out by the National Tourism Organisation of Malta reveals that, apart from those whoare directly employed in hotel and catering establishments, another 10 349 full-time equivalent jobsdirectly relate to the tourism sector. These jobs are with the national airline, the car hire sector and agroup of other services. Given this, the number of jobs that are, to a greater or lesser extent, directlydependent on tourism account for about 14.1% of all the gainfully occupied in the country.
Total employment and employment in the hotel and catering sector
1990 1 1995 1996 1997 1998 1999
Total Gainfully Occupied 127 196 134 832 136 145 136 788 137 387 138 206
Hotel & Catering 7 975 8 561 8 457 9 078 9 013 9 476
% share 6.3 6.3 6.2 6.6 6.6 6.9
(1) Figures for 1990 above cannot be compared with the other years. The ETC revised figures only as from January 1994.
Source: COS.
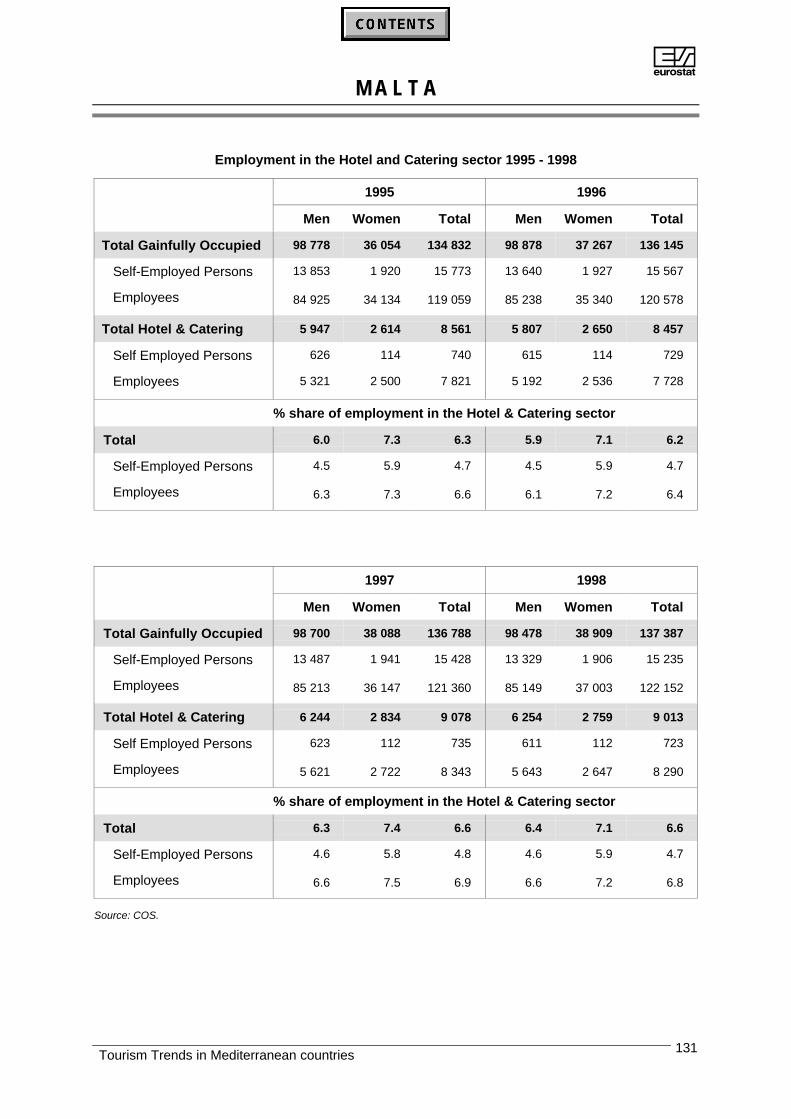
AM A L T A
Tourism Trends in Mediterranean countries 131
Employment in the Hotel and Catering sector 1995 - 1998
1995 1996
Men Women Total Men Women Total
Total Gainfully Occupied 98 778 36 054 134 832 98 878 37 267 136 145
Self-Employed Persons 13 853 1 920 15 773 13 640 1 927 15 567
Employees 84 925 34 134 119 059 85 238 35 340 120 578
Total Hotel & Catering 5 947 2 614 8 561 5 807 2 650 8 457
Self Employed Persons 626 114 740 615 114 729
Employees 5 321 2 500 7 821 5 192 2 536 7 728
% share of employment in the Hotel & Catering sector
Total 6.0 7.3 6.3 5.9 7.1 6.2
Self-Employed Persons 4.5 5.9 4.7 4.5 5.9 4.7
Employees 6.3 7.3 6.6 6.1 7.2 6.4
1997 1998
Men Women Total Men Women Total
Total Gainfully Occupied 98 700 38 088 136 788 98 478 38 909 137 387
Self-Employed Persons 13 487 1 941 15 428 13 329 1 906 15 235
Employees 85 213 36 147 121 360 85 149 37 003 122 152
Total Hotel & Catering 6 244 2 834 9 078 6 254 2 759 9 013
Self Employed Persons 623 112 735 611 112 723
Employees 5 621 2 722 8 343 5 643 2 647 8 290
% share of employment in the Hotel & Catering sector
Total 6.3 7.4 6.6 6.4 7.1 6.6
Self-Employed Persons 4.6 5.8 4.8 4.6 5.9 4.7
Employees 6.6 7.5 6.9 6.6 7.2 6.8
Source: COS.
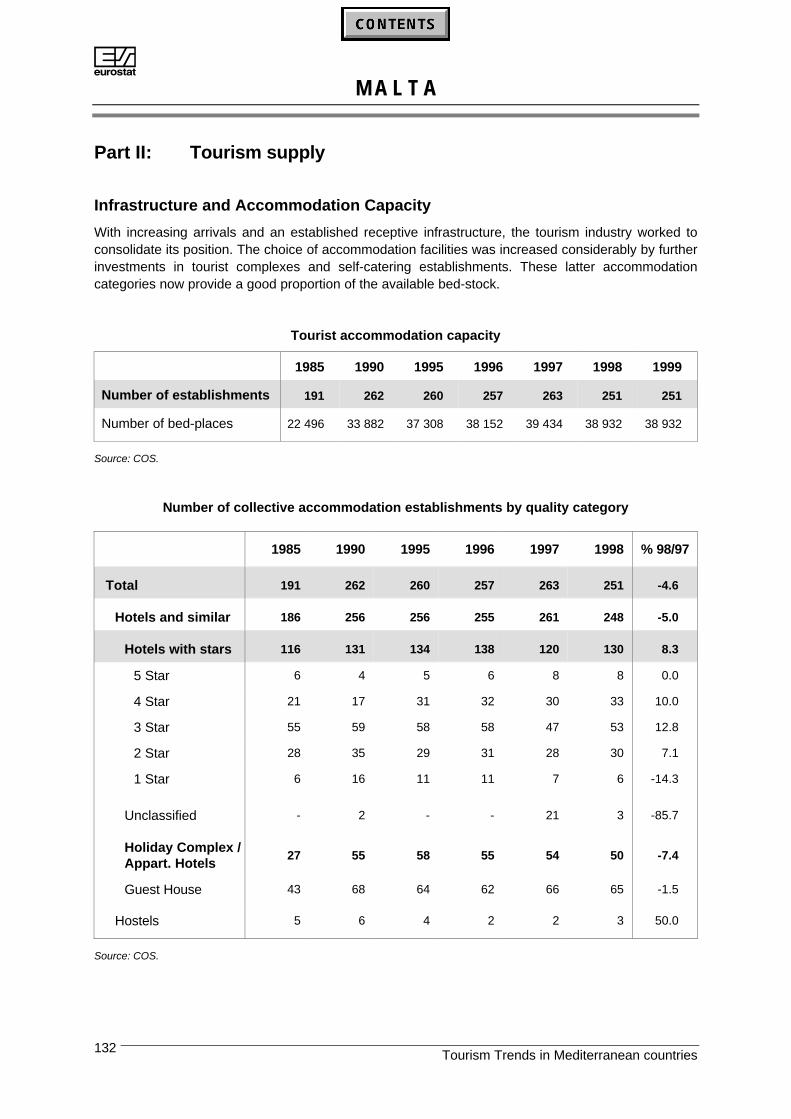
AM A L T A
Tourism Trends in Mediterranean countries132
Part II: Tourism supply
Infrastructure and Accommodation Capacity
With increasing arrivals and an established receptive infrastructure, the tourism industry worked toconsolidate its position. The choice of accommodation facilities was increased considerably by furtherinvestments in tourist complexes and self-catering establishments. These latter accommodationcategories now provide a good proportion of the available bed-stock.
Tourist accommodation capacity
1985 1990 1995 1996 1997 1998 1999
Number of establishments 191 262 260 257 263 251 251
Number of bed-places 22 496 33 882 37 308 38 152 39 434 38 932 38 932
Source: COS.
Number of collective accommodation establishments by quality category
1985 1990 1995 1996 1997 1998 % 98/97
Total 191 262 260 257 263 251 -4.6
Hotels and similar 186 256 256 255 261 248 -5.0
Hotels with stars 116 131 134 138 120 130 8.3
5 Star 6 4 5 6 8 8 0.0
4 Star 21 17 31 32 30 33 10.0
3 Star 55 59 58 58 47 53 12.8
2 Star 28 35 29 31 28 30 7.1
1 Star 6 16 11 11 7 6 -14.3
Unclassified - 2 - - 21 3 -85.7
Holiday Complex /Appart. Hotels
27 55 58 55 54 50 -7.4
Guest House 43 68 64 62 66 65 -1.5
Hostels 5 6 4 2 2 3 50.0
Source: COS.
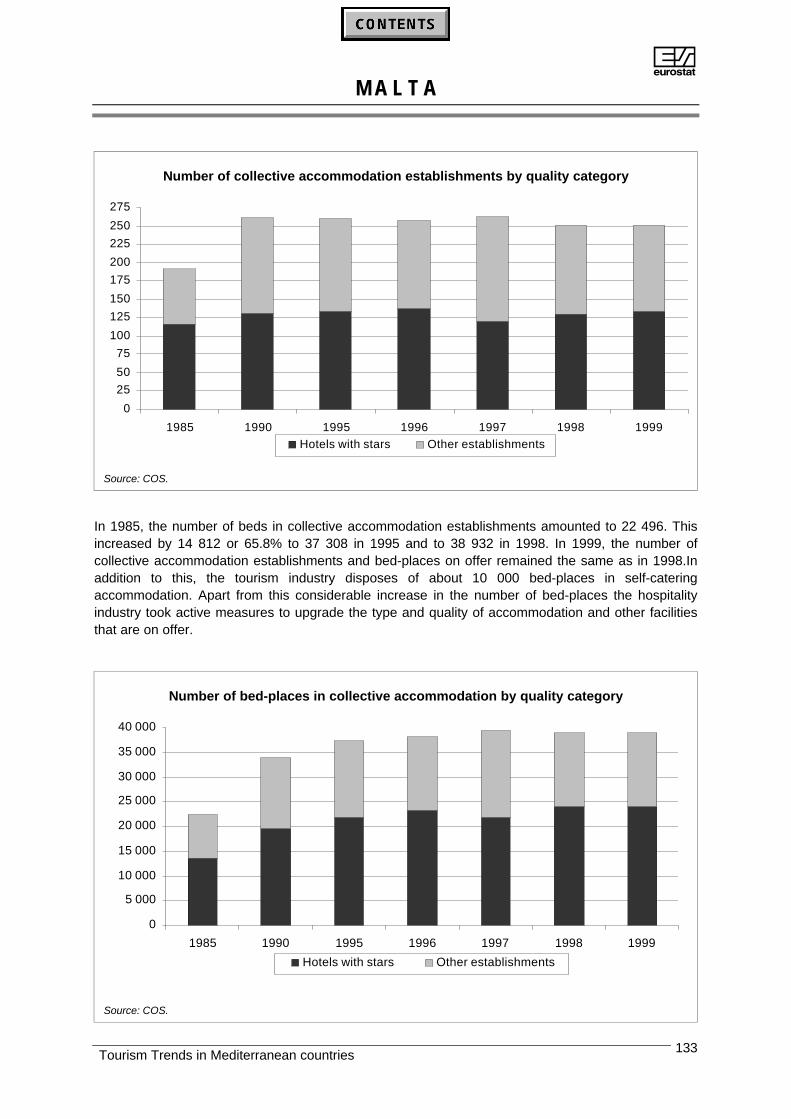
AM A L T A
Tourism Trends in Mediterranean countries 133
Number of collective accommodation establishments by quality category
0
25
50
75
100
125
150
175
200
225
250
275
1985 1990 1995 1996 1997 1998 1999Hotels with stars Other establishments
Source: COS.
In 1985, the number of beds in collective accommodation establishments amounted to 22 496. Thisincreased by 14 812 or 65.8% to 37 308 in 1995 and to 38 932 in 1998. In 1999, the number ofcollective accommodation establishments and bed-places on offer remained the same as in 1998.Inaddition to this, the tourism industry disposes of about 10 000 bed-places in self-cateringaccommodation. Apart from this considerable increase in the number of bed-places the hospitalityindustry took active measures to upgrade the type and quality of accommodation and other facilitiesthat are on offer.
Number of bed-places in collective accommodation by quality category
0
5 000
10 000
15 000
20 000
25 000
30 000
35 000
40 000
1985 1990 1995 1996 1997 1998 1999
Hotels with stars Other establishments
Source: COS.
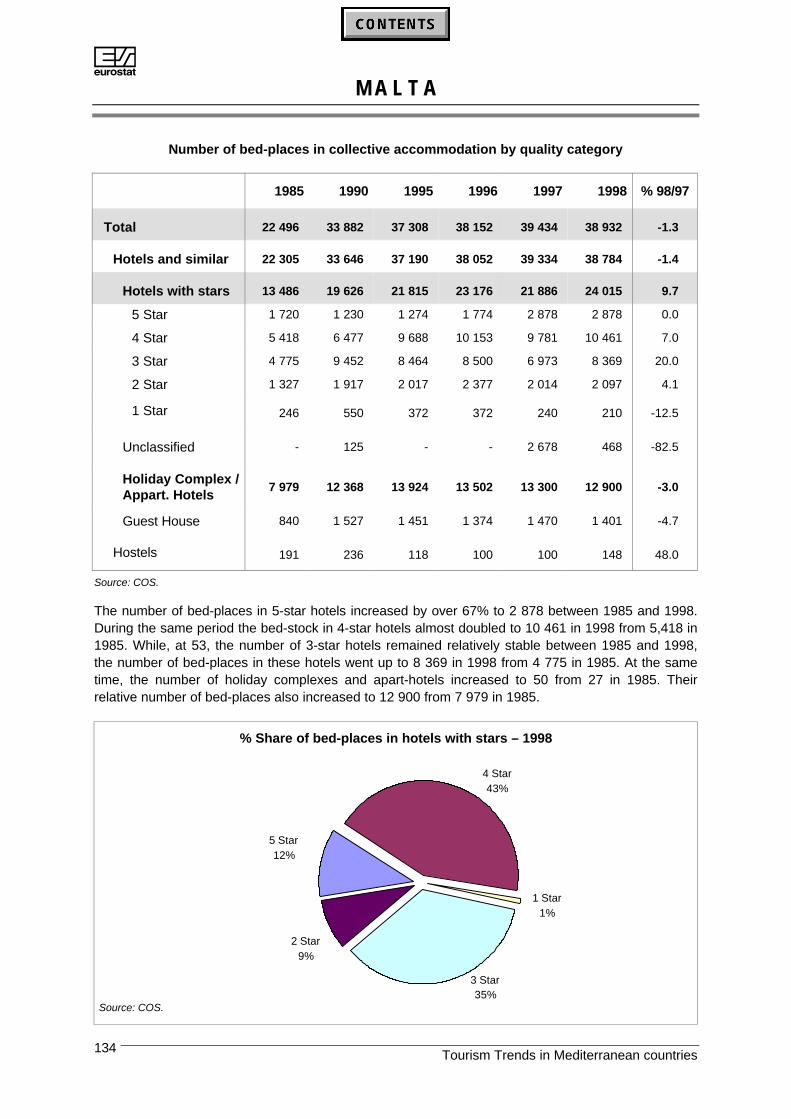
AM A L T A
Tourism Trends in Mediterranean countries134
Number of bed-places in collective accommodation by quality category
1985 1990 1995 1996 1997 1998 % 98/97
Total 22 496 33 882 37 308 38 152 39 434 38 932 -1.3
Hotels and similar 22 305 33 646 37 190 38 052 39 334 38 784 -1.4
Hotels with stars 13 486 19 626 21 815 23 176 21 886 24 015 9.7
5 Star 1 720 1 230 1 274 1 774 2 878 2 878 0.0
4 Star 5 418 6 477 9 688 10 153 9 781 10 461 7.0
3 Star 4 775 9 452 8 464 8 500 6 973 8 369 20.0
2 Star 1 327 1 917 2 017 2 377 2 014 2 097 4.1
1 Star 246 550 372 372 240 210 -12.5
Unclassified - 125 - - 2 678 468 -82.5
Holiday Complex /Appart. Hotels
7 979 12 368 13 924 13 502 13 300 12 900 -3.0
Guest House 840 1 527 1 451 1 374 1 470 1 401 -4.7
Hostels 191 236 118 100 100 148 48.0
Source: COS.
The number of bed-places in 5-star hotels increased by over 67% to 2 878 between 1985 and 1998.During the same period the bed-stock in 4-star hotels almost doubled to 10 461 in 1998 from 5,418 in1985. While, at 53, the number of 3-star hotels remained relatively stable between 1985 and 1998,the number of bed-places in these hotels went up to 8 369 in 1998 from 4 775 in 1985. At the sametime, the number of holiday complexes and apart-hotels increased to 50 from 27 in 1985. Theirrelative number of bed-places also increased to 12 900 from 7 979 in 1985.
% Share of bed-places in hotels with stars – 1998
2 Star9%
3 Star35%
1 Star1%
5 Star12%
4 Star43%
Source: COS.
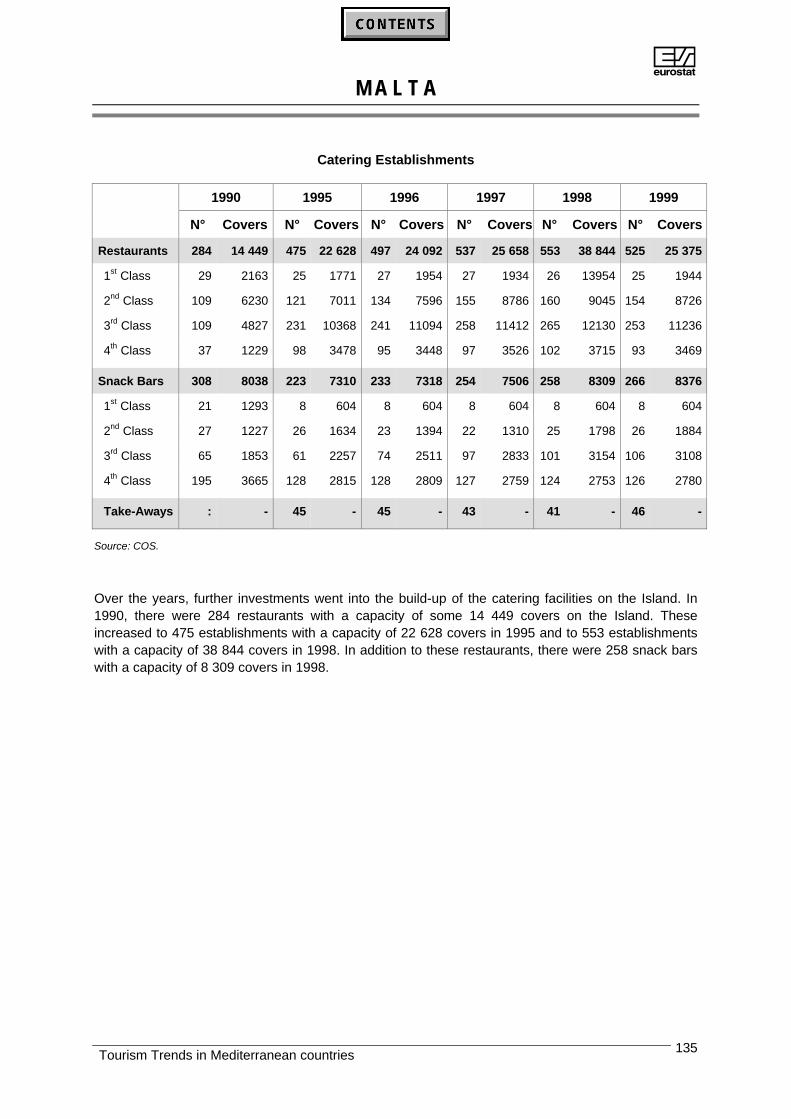
AM A L T A
Tourism Trends in Mediterranean countries 135
Catering Establishments
1990 1995 1996 1997 1998 1999
N° Covers N° Covers N° Covers N° Covers N° Covers N° Covers
Restaurants 284 14 449 475 22 628 497 24 092 537 25 658 553 38 844 525 25 375
1st Class 29 2163 25 1771 27 1954 27 1934 26 13954 25 1944
2nd Class 109 6230 121 7011 134 7596 155 8786 160 9045 154 8726
3rd Class 109 4827 231 10368 241 11094 258 11412 265 12130 253 11236
4th Class 37 1229 98 3478 95 3448 97 3526 102 3715 93 3469
Snack Bars 308 8038 223 7310 233 7318 254 7506 258 8309 266 8376
1st Class 21 1293 8 604 8 604 8 604 8 604 8 604
2nd Class 27 1227 26 1634 23 1394 22 1310 25 1798 26 1884
3rd Class 65 1853 61 2257 74 2511 97 2833 101 3154 106 3108
4th Class 195 3665 128 2815 128 2809 127 2759 124 2753 126 2780
Take-Aways : - 45 - 45 - 43 - 41 - 46 -
Source: COS.
Over the years, further investments went into the build-up of the catering facilities on the Island. In1990, there were 284 restaurants with a capacity of some 14 449 covers on the Island. Theseincreased to 475 establishments with a capacity of 22 628 covers in 1995 and to 553 establishmentswith a capacity of 38 844 covers in 1998. In addition to these restaurants, there were 258 snack barswith a capacity of 8 309 covers in 1998.
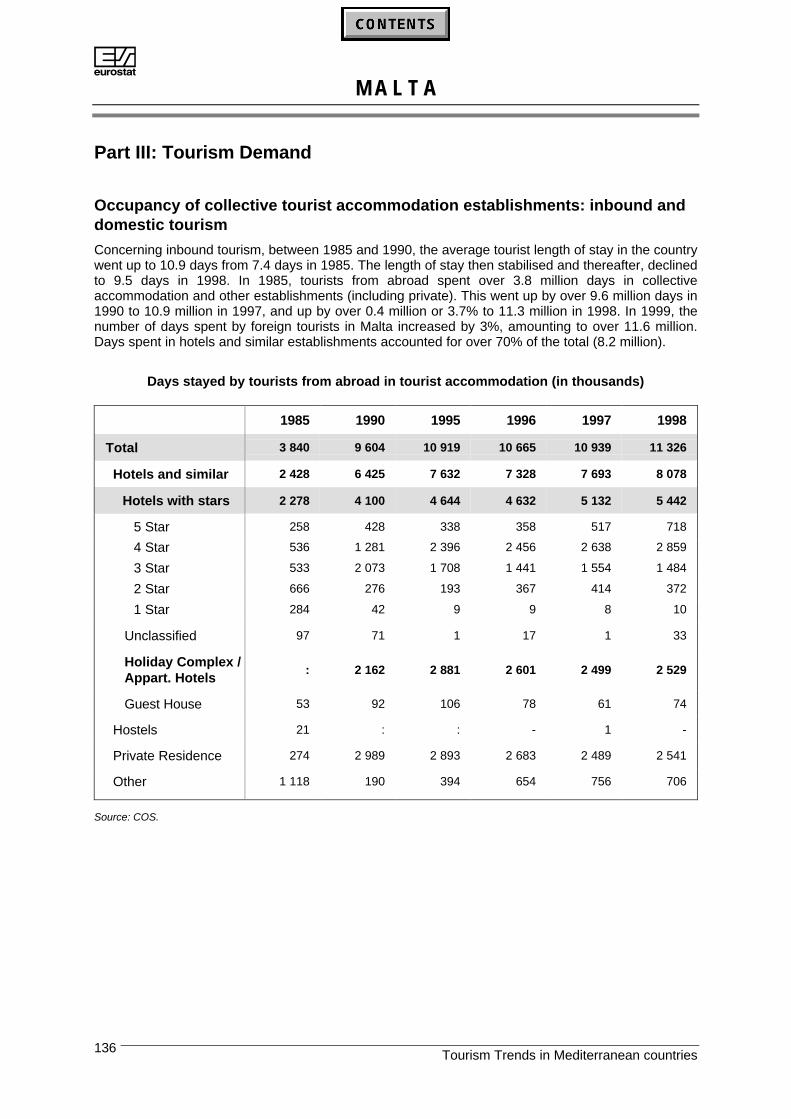
AM A L T A
Tourism Trends in Mediterranean countries136
Part III: Tourism Demand
Occupancy of collective tourist accommodation establishments: inbound anddomestic tourism
Concerning inbound tourism, between 1985 and 1990, the average tourist length of stay in the countrywent up to 10.9 days from 7.4 days in 1985. The length of stay then stabilised and thereafter, declinedto 9.5 days in 1998. In 1985, tourists from abroad spent over 3.8 million days in collectiveaccommodation and other establishments (including private). This went up by over 9.6 million days in1990 to 10.9 million in 1997, and up by over 0.4 million or 3.7% to 11.3 million in 1998. In 1999, thenumber of days spent by foreign tourists in Malta increased by 3%, amounting to over 11.6 million.Days spent in hotels and similar establishments accounted for over 70% of the total (8.2 million).
Days stayed by tourists from abroad in tourist accommodation (in thousands)
1985 1990 1995 1996 1997 1998
Total 3 840 9 604 10 919 10 665 10 939 11 326
Hotels and similar 2 428 6 425 7 632 7 328 7 693 8 078
Hotels with stars 2 278 4 100 4 644 4 632 5 132 5 442
5 Star 258 428 338 358 517 718
4 Star 536 1 281 2 396 2 456 2 638 2 859
3 Star 533 2 073 1 708 1 441 1 554 1 484
2 Star 666 276 193 367 414 372
1 Star 284 42 9 9 8 10
Unclassified 97 71 1 17 1 33
Holiday Complex /Appart. Hotels
: 2 162 2 881 2 601 2 499 2 529
Guest House 53 92 106 78 61 74
Hostels 21 : : - 1 -
Private Residence 274 2 989 2 893 2 683 2 489 2 541
Other 1 118 190 394 654 756 706
Source: COS.
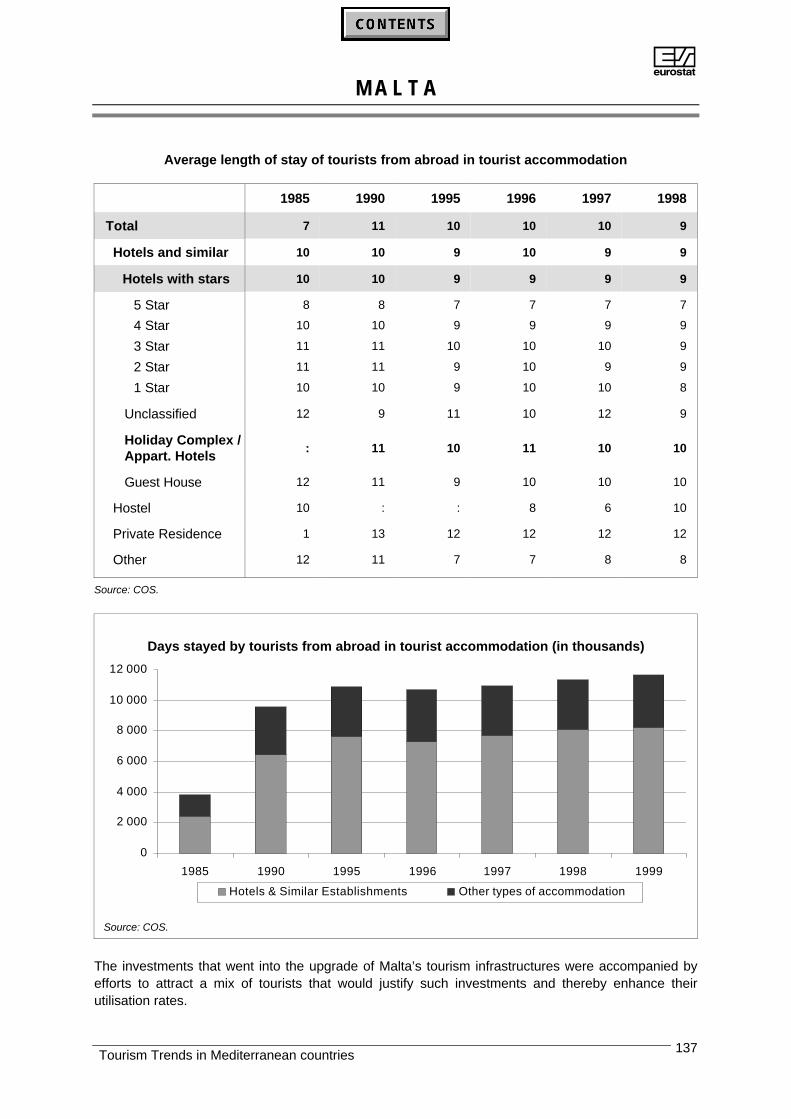
AM A L T A
Tourism Trends in Mediterranean countries 137
Average length of stay of tourists from abroad in tourist accommodation
1985 1990 1995 1996 1997 1998
Total 7 11 10 10 10 9
Hotels and similar 10 10 9 10 9 9
Hotels with stars 10 10 9 9 9 9
5 Star 8 8 7 7 7 7
4 Star 10 10 9 9 9 9
3 Star 11 11 10 10 10 9
2 Star 11 11 9 10 9 9
1 Star 10 10 9 10 10 8
Unclassified 12 9 11 10 12 9
Holiday Complex /Appart. Hotels
: 11 10 11 10 10
Guest House 12 11 9 10 10 10
Hostel 10 : : 8 6 10
Private Residence 1 13 12 12 12 12
Other 12 11 7 7 8 8
Source: COS.
Days stayed by tourists from abroad in tourist accommodation (in thousands)
0
2 000
4 000
6 000
8 000
10 000
12 000
1985 1990 1995 1996 1997 1998 1999
Hotels & Similar Establishments Other types of accommodation
Source: COS.
The investments that went into the upgrade of Malta’s tourism infrastructures were accompanied byefforts to attract a mix of tourists that would justify such investments and thereby enhance theirutilisation rates.
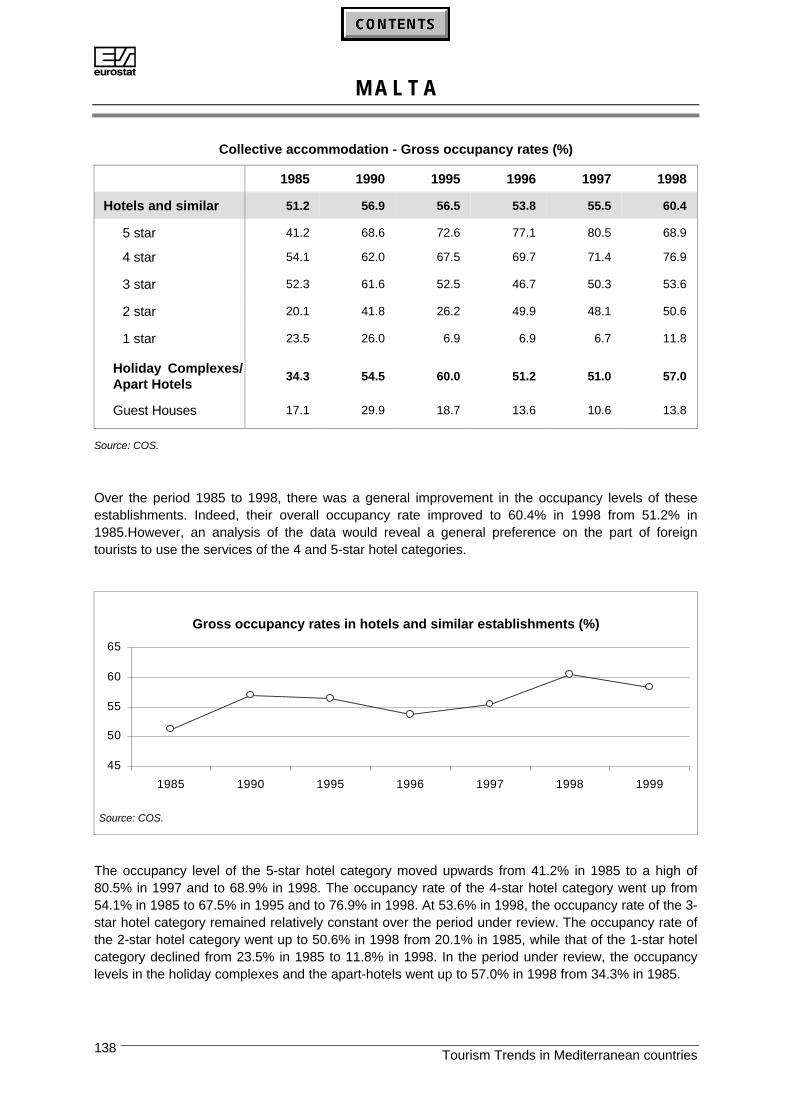
AM A L T A
Tourism Trends in Mediterranean countries138
Collective accommodation - Gross occupancy rates (%)
1985 1990 1995 1996 1997 1998
Hotels and similar 51.2 56.9 56.5 53.8 55.5 60.4
5 star 41.2 68.6 72.6 77.1 80.5 68.9
4 star 54.1 62.0 67.5 69.7 71.4 76.9
3 star 52.3 61.6 52.5 46.7 50.3 53.6
2 star 20.1 41.8 26.2 49.9 48.1 50.6
1 star 23.5 26.0 6.9 6.9 6.7 11.8
Holiday Complexes/Apart Hotels
34.3 54.5 60.0 51.2 51.0 57.0
Guest Houses 17.1 29.9 18.7 13.6 10.6 13.8
Source: COS.
Over the period 1985 to 1998, there was a general improvement in the occupancy levels of theseestablishments. Indeed, their overall occupancy rate improved to 60.4% in 1998 from 51.2% in1985.However, an analysis of the data would reveal a general preference on the part of foreigntourists to use the services of the 4 and 5-star hotel categories.
Gross occupancy rates in hotels and similar establishments (%)
45
50
55
60
65
1985 1990 1995 1996 1997 1998 1999
Source: COS.
The occupancy level of the 5-star hotel category moved upwards from 41.2% in 1985 to a high of80.5% in 1997 and to 68.9% in 1998. The occupancy rate of the 4-star hotel category went up from54.1% in 1985 to 67.5% in 1995 and to 76.9% in 1998. At 53.6% in 1998, the occupancy rate of the 3-star hotel category remained relatively constant over the period under review. The occupancy rate ofthe 2-star hotel category went up to 50.6% in 1998 from 20.1% in 1985, while that of the 1-star hotelcategory declined from 23.5% in 1985 to 11.8% in 1998. In the period under review, the occupancylevels in the holiday complexes and the apart-hotels went up to 57.0% in 1998 from 34.3% in 1985.
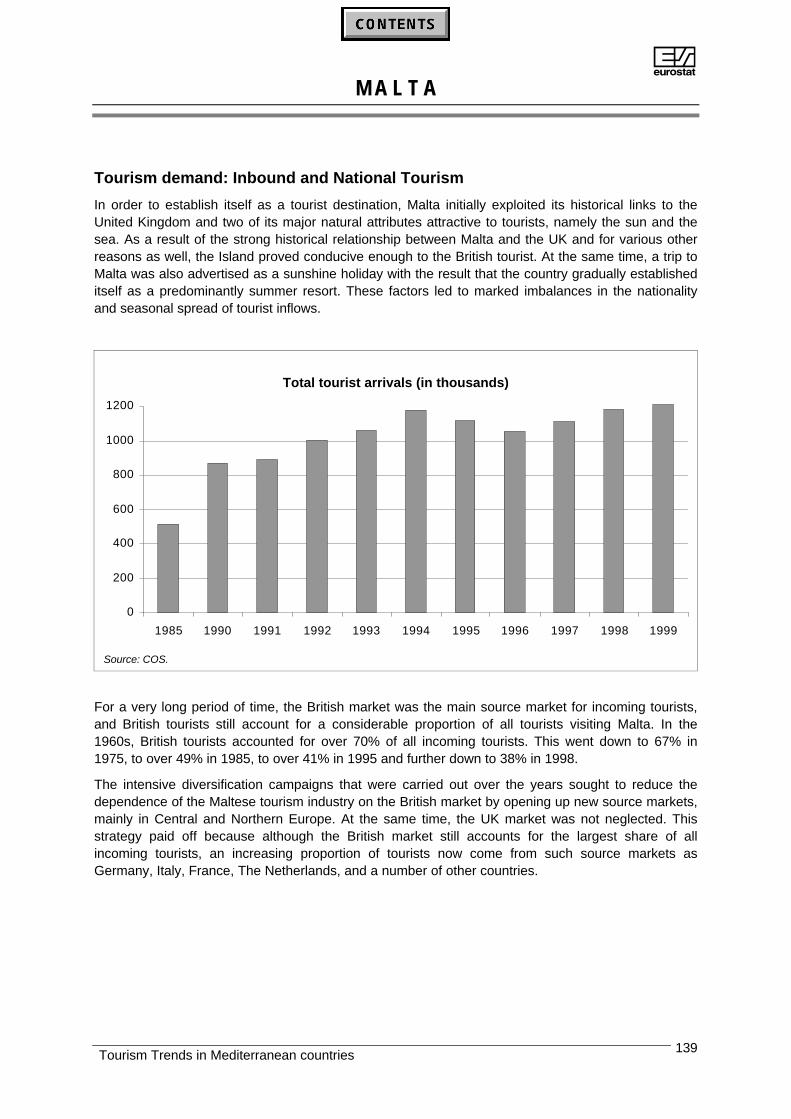
AM A L T A
Tourism Trends in Mediterranean countries 139
Tourism demand: Inbound and National Tourism
In order to establish itself as a tourist destination, Malta initially exploited its historical links to theUnited Kingdom and two of its major natural attributes attractive to tourists, namely the sun and thesea. As a result of the strong historical relationship between Malta and the UK and for various otherreasons as well, the Island proved conducive enough to the British tourist. At the same time, a trip toMalta was also advertised as a sunshine holiday with the result that the country gradually establisheditself as a predominantly summer resort. These factors led to marked imbalances in the nationalityand seasonal spread of tourist inflows.
Total tourist arrivals (in thousands)
0
200
400
600
800
1000
1200
1985 1990 1991 1992 1993 1994 1995 1996 1997 1998 1999
Source: COS.
For a very long period of time, the British market was the main source market for incoming tourists,and British tourists still account for a considerable proportion of all tourists visiting Malta. In the1960s, British tourists accounted for over 70% of all incoming tourists. This went down to 67% in1975, to over 49% in 1985, to over 41% in 1995 and further down to 38% in 1998.
The intensive diversification campaigns that were carried out over the years sought to reduce thedependence of the Maltese tourism industry on the British market by opening up new source markets,mainly in Central and Northern Europe. At the same time, the UK market was not neglected. Thisstrategy paid off because although the British market still accounts for the largest share of allincoming tourists, an increasing proportion of tourists now come from such source markets asGermany, Italy, France, The Netherlands, and a number of other countries.
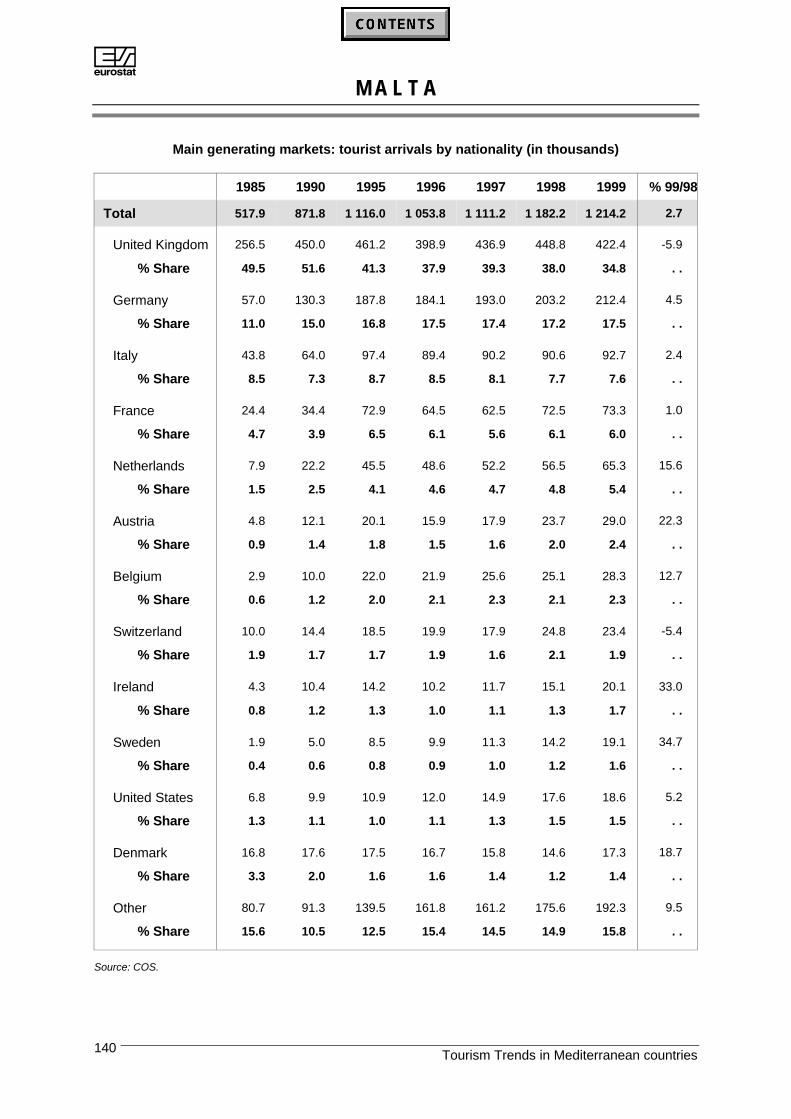
AM A L T A
Tourism Trends in Mediterranean countries140
Main generating markets: tourist arrivals by nationality (in thousands)
1985 1990 1995 1996 1997 1998 1999 % 99/98
Total 517.9 871.8 1 116.0 1 053.8 1 111.2 1 182.2 1 214.2 2.7
United Kingdom 256.5 450.0 461.2 398.9 436.9 448.8 422.4 -5.9
% Share 49.5 51.6 41.3 37.9 39.3 38.0 34.8 . .
Germany 57.0 130.3 187.8 184.1 193.0 203.2 212.4 4.5
% Share 11.0 15.0 16.8 17.5 17.4 17.2 17.5 . .
Italy 43.8 64.0 97.4 89.4 90.2 90.6 92.7 2.4
% Share 8.5 7.3 8.7 8.5 8.1 7.7 7.6 . .
France 24.4 34.4 72.9 64.5 62.5 72.5 73.3 1.0
% Share 4.7 3.9 6.5 6.1 5.6 6.1 6.0 . .
Netherlands 7.9 22.2 45.5 48.6 52.2 56.5 65.3 15.6
% Share 1.5 2.5 4.1 4.6 4.7 4.8 5.4 . .
Austria 4.8 12.1 20.1 15.9 17.9 23.7 29.0 22.3
% Share 0.9 1.4 1.8 1.5 1.6 2.0 2.4 . .
Belgium 2.9 10.0 22.0 21.9 25.6 25.1 28.3 12.7
% Share 0.6 1.2 2.0 2.1 2.3 2.1 2.3 . .
Switzerland 10.0 14.4 18.5 19.9 17.9 24.8 23.4 -5.4
% Share 1.9 1.7 1.7 1.9 1.6 2.1 1.9 . .
Ireland 4.3 10.4 14.2 10.2 11.7 15.1 20.1 33.0
% Share 0.8 1.2 1.3 1.0 1.1 1.3 1.7 . .
Sweden 1.9 5.0 8.5 9.9 11.3 14.2 19.1 34.7
% Share 0.4 0.6 0.8 0.9 1.0 1.2 1.6 . .
United States 6.8 9.9 10.9 12.0 14.9 17.6 18.6 5.2
% Share 1.3 1.1 1.0 1.1 1.3 1.5 1.5 . .
Denmark 16.8 17.6 17.5 16.7 15.8 14.6 17.3 18.7
% Share 3.3 2.0 1.6 1.6 1.4 1.2 1.4 . .
Other 80.7 91.3 139.5 161.8 161.2 175.6 192.3 9.5
% Share 15.6 10.5 12.5 15.4 14.5 14.9 15.8 . .
Source: COS.
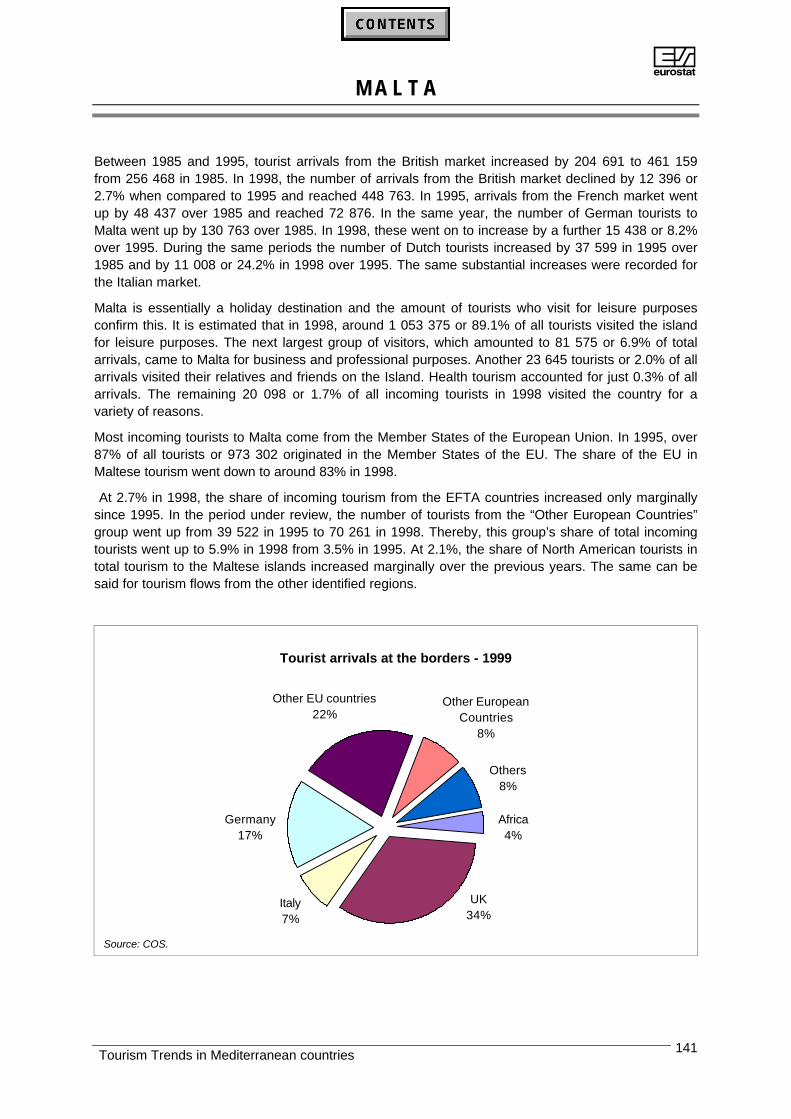
AM A L T A
Tourism Trends in Mediterranean countries 141
Between 1985 and 1995, tourist arrivals from the British market increased by 204 691 to 461 159from 256 468 in 1985. In 1998, the number of arrivals from the British market declined by 12 396 or2.7% when compared to 1995 and reached 448 763. In 1995, arrivals from the French market wentup by 48 437 over 1985 and reached 72 876. In the same year, the number of German tourists toMalta went up by 130 763 over 1985. In 1998, these went on to increase by a further 15 438 or 8.2%over 1995. During the same periods the number of Dutch tourists increased by 37 599 in 1995 over1985 and by 11 008 or 24.2% in 1998 over 1995. The same substantial increases were recorded forthe Italian market.
Malta is essentially a holiday destination and the amount of tourists who visit for leisure purposesconfirm this. It is estimated that in 1998, around 1 053 375 or 89.1% of all tourists visited the islandfor leisure purposes. The next largest group of visitors, which amounted to 81 575 or 6.9% of totalarrivals, came to Malta for business and professional purposes. Another 23 645 tourists or 2.0% of allarrivals visited their relatives and friends on the Island. Health tourism accounted for just 0.3% of allarrivals. The remaining 20 098 or 1.7% of all incoming tourists in 1998 visited the country for avariety of reasons.
Most incoming tourists to Malta come from the Member States of the European Union. In 1995, over87% of all tourists or 973 302 originated in the Member States of the EU. The share of the EU inMaltese tourism went down to around 83% in 1998.
At 2.7% in 1998, the share of incoming tourism from the EFTA countries increased only marginallysince 1995. In the period under review, the number of tourists from the “Other European Countries”group went up from 39 522 in 1995 to 70 261 in 1998. Thereby, this group’s share of total incomingtourists went up to 5.9% in 1998 from 3.5% in 1995. At 2.1%, the share of North American tourists intotal tourism to the Maltese islands increased marginally over the previous years. The same can besaid for tourism flows from the other identified regions.
Tourist arrivals at the borders - 1999
Others8%
Other European Countries
8%
Other EU countries22%
Germany17%
Italy7%
Africa4%
UK34%
Source: COS.
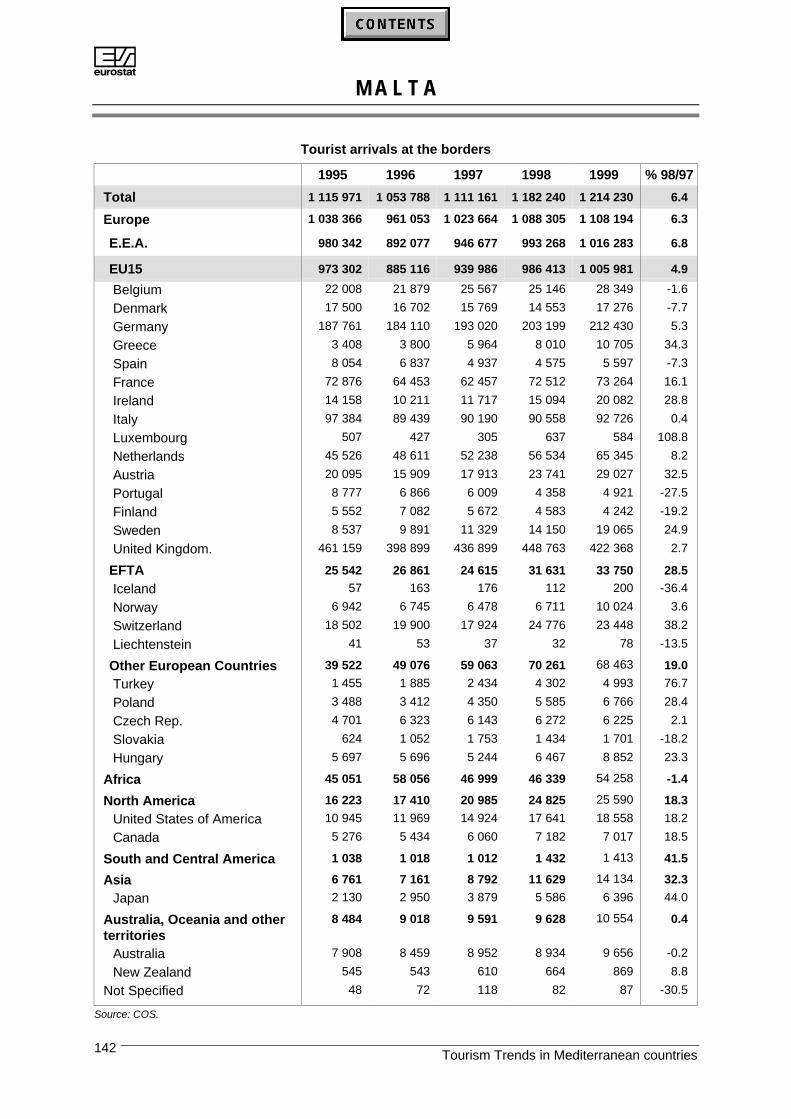
AM A L T A
Tourism Trends in Mediterranean countries142
Tourist arrivals at the borders
1995 1996 1997 1998 1999 % 98/97
Total 1 115 971 1 053 788 1 111 161 1 182 240 1 214 230 6.4
Europe 1 038 366 961 053 1 023 664 1 088 305 1 108 194 6.3
E.E.A. 980 342 892 077 946 677 993 268 1 016 283 6.8
EU15 973 302 885 116 939 986 986 413 1 005 981 4.9
Belgium 22 008 21 879 25 567 25 146 28 349 -1.6
Denmark 17 500 16 702 15 769 14 553 17 276 -7.7
Germany 187 761 184 110 193 020 203 199 212 430 5.3
Greece 3 408 3 800 5 964 8 010 10 705 34.3
Spain 8 054 6 837 4 937 4 575 5 597 -7.3
France 72 876 64 453 62 457 72 512 73 264 16.1
Ireland 14 158 10 211 11 717 15 094 20 082 28.8
Italy 97 384 89 439 90 190 90 558 92 726 0.4
Luxembourg 507 427 305 637 584 108.8
Netherlands 45 526 48 611 52 238 56 534 65 345 8.2
Austria 20 095 15 909 17 913 23 741 29 027 32.5
Portugal 8 777 6 866 6 009 4 358 4 921 -27.5
Finland 5 552 7 082 5 672 4 583 4 242 -19.2
Sweden 8 537 9 891 11 329 14 150 19 065 24.9
United Kingdom. 461 159 398 899 436 899 448 763 422 368 2.7
EFTA 25 542 26 861 24 615 31 631 33 750 28.5
Iceland 57 163 176 112 200 -36.4
Norway 6 942 6 745 6 478 6 711 10 024 3.6
Switzerland 18 502 19 900 17 924 24 776 23 448 38.2
Liechtenstein 41 53 37 32 78 -13.5
Other European Countries 39 522 49 076 59 063 70 261 68 463 19.0
Turkey 1 455 1 885 2 434 4 302 4 993 76.7
Poland 3 488 3 412 4 350 5 585 6 766 28.4
Czech Rep. 4 701 6 323 6 143 6 272 6 225 2.1
Slovakia 624 1 052 1 753 1 434 1 701 -18.2
Hungary 5 697 5 696 5 244 6 467 8 852 23.3
Africa 45 051 58 056 46 999 46 339 54 258 -1.4
North America 16 223 17 410 20 985 24 825 25 590 18.3
United States of America 10 945 11 969 14 924 17 641 18 558 18.2
Canada 5 276 5 434 6 060 7 182 7 017 18.5
South and Central America 1 038 1 018 1 012 1 432 1 413 41.5
Asia 6 761 7 161 8 792 11 629 14 134 32.3
Japan 2 130 2 950 3 879 5 586 6 396 44.0
Australia, Oceania and otherterritories
8 484 9 018 9 591 9 628 10 554 0.4
Australia 7 908 8 459 8 952 8 934 9 656 -0.2
New Zealand 545 543 610 664 869 8.8
Not Specified 48 72 118 82 87 -30.5
Source: COS.
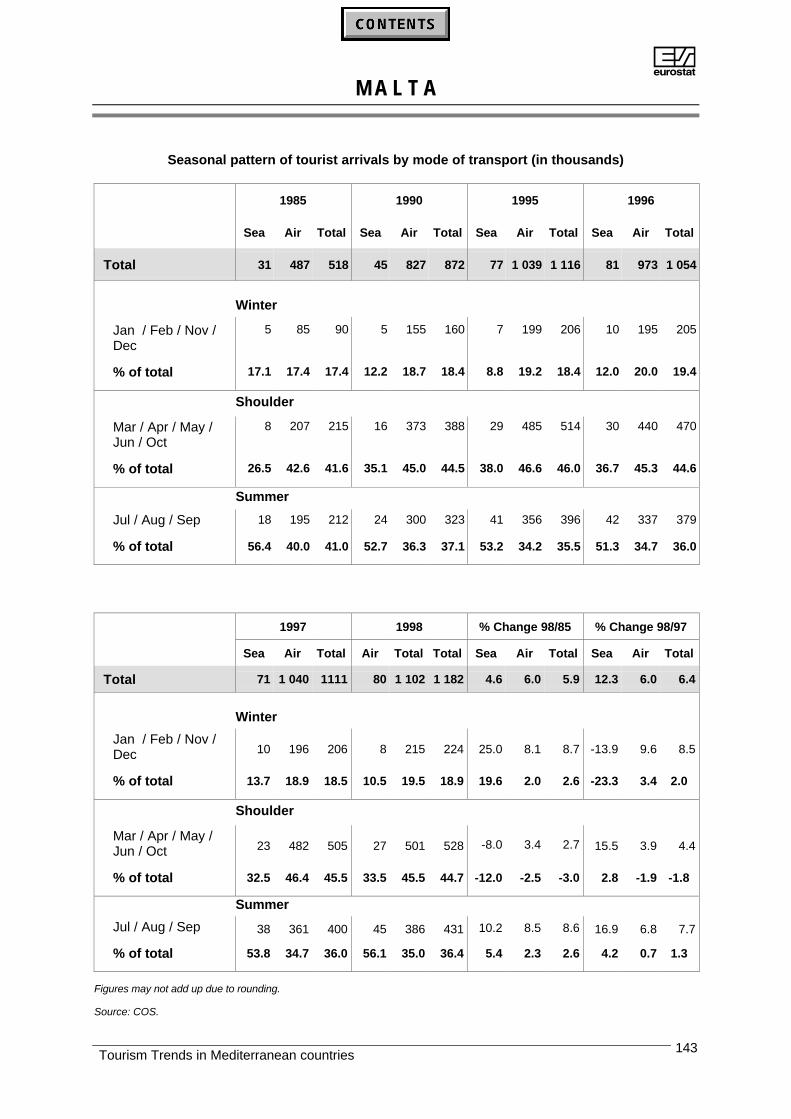
AM A L T A
Tourism Trends in Mediterranean countries 143
Seasonal pattern of tourist arrivals by mode of transport (in thousands)
1985 1990 1995 1996
Sea Air Total Sea Air Total Sea Air Total Sea Air Total
Total 31 487 518 45 827 872 77 1 039 1 116 81 973 1 054
Winter
Jan / Feb / Nov /Dec
5 85 90 5 155 160 7 199 206 10 195 205
% of total 17.1 17.4 17.4 12.2 18.7 18.4 8.8 19.2 18.4 12.0 20.0 19.4
Shoulder
Mar / Apr / May /Jun / Oct
8 207 215 16 373 388 29 485 514 30 440 470
% of total 26.5 42.6 41.6 35.1 45.0 44.5 38.0 46.6 46.0 36.7 45.3 44.6
Summer
Jul / Aug / Sep 18 195 212 24 300 323 41 356 396 42 337 379
% of total 56.4 40.0 41.0 52.7 36.3 37.1 53.2 34.2 35.5 51.3 34.7 36.0
1997 1998 % Change 98/85 % Change 98/97
Sea Air Total Air Total Total Sea Air Total Sea Air Total
Total 71 1 040 1111 80 1 102 1 182 4.6 6.0 5.9 12.3 6.0 6.4
Winter
Jan / Feb / Nov /Dec 10 196 206 8 215 224 25.0 8.1 8.7 -13.9 9.6 8.5
% of total 13.7 18.9 18.5 10.5 19.5 18.9 19.6 2.0 2.6 -23.3 3.4 2.0
Shoulder
Mar / Apr / May /Jun / Oct 23 482 505 27 501 528 -8.0 3.4 2.7 15.5 3.9 4.4
% of total 32.5 46.4 45.5 33.5 45.5 44.7 -12.0 -2.5 -3.0 2.8 -1.9 -1.8
Summer
Jul / Aug / Sep 38 361 400 45 386 431 10.2 8.5 8.6 16.9 6.8 7.7
% of total 53.8 34.7 36.0 56.1 35.0 36.4 5.4 2.3 2.6 4.2 0.7 1.3
Figures may not add up due to rounding.
Source: COS.
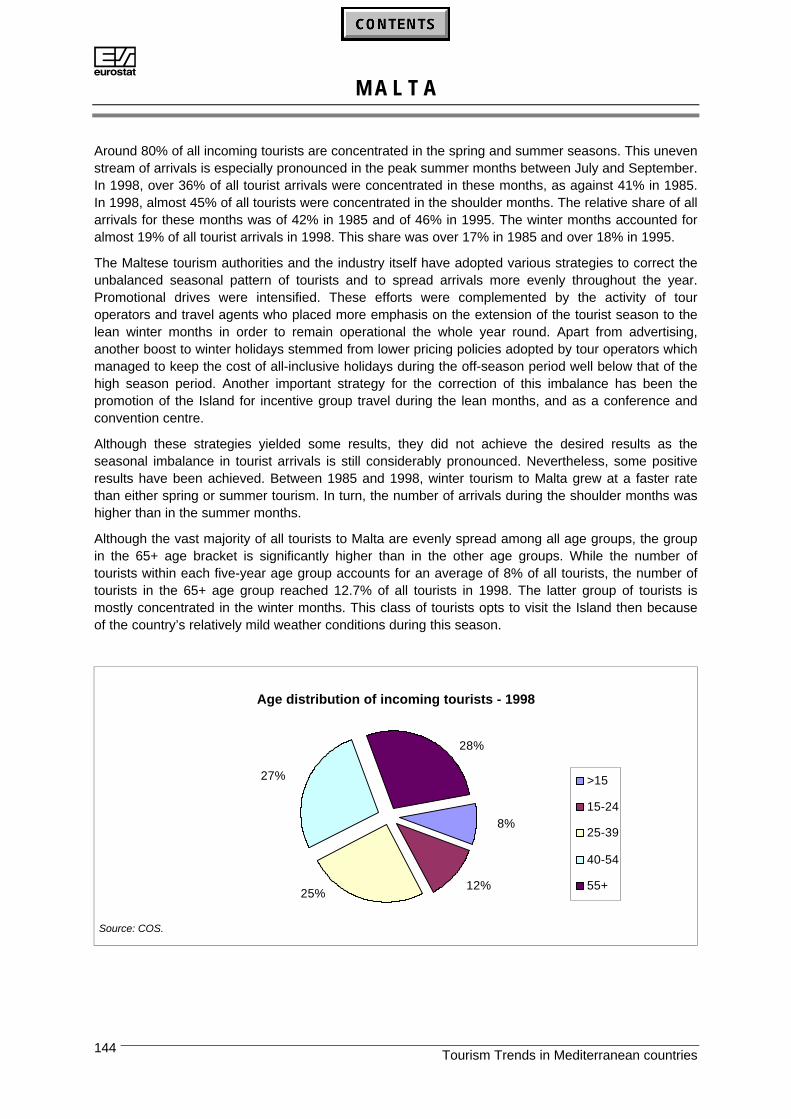
AM A L T A
Tourism Trends in Mediterranean countries144
Around 80% of all incoming tourists are concentrated in the spring and summer seasons. This unevenstream of arrivals is especially pronounced in the peak summer months between July and September.In 1998, over 36% of all tourist arrivals were concentrated in these months, as against 41% in 1985.In 1998, almost 45% of all tourists were concentrated in the shoulder months. The relative share of allarrivals for these months was of 42% in 1985 and of 46% in 1995. The winter months accounted foralmost 19% of all tourist arrivals in 1998. This share was over 17% in 1985 and over 18% in 1995.
The Maltese tourism authorities and the industry itself have adopted various strategies to correct theunbalanced seasonal pattern of tourists and to spread arrivals more evenly throughout the year.Promotional drives were intensified. These efforts were complemented by the activity of touroperators and travel agents who placed more emphasis on the extension of the tourist season to thelean winter months in order to remain operational the whole year round. Apart from advertising,another boost to winter holidays stemmed from lower pricing policies adopted by tour operators whichmanaged to keep the cost of all-inclusive holidays during the off-season period well below that of thehigh season period. Another important strategy for the correction of this imbalance has been thepromotion of the Island for incentive group travel during the lean months, and as a conference andconvention centre.
Although these strategies yielded some results, they did not achieve the desired results as theseasonal imbalance in tourist arrivals is still considerably pronounced. Nevertheless, some positiveresults have been achieved. Between 1985 and 1998, winter tourism to Malta grew at a faster ratethan either spring or summer tourism. In turn, the number of arrivals during the shoulder months washigher than in the summer months.
Although the vast majority of all tourists to Malta are evenly spread among all age groups, the groupin the 65+ age bracket is significantly higher than in the other age groups. While the number oftourists within each five-year age group accounts for an average of 8% of all tourists, the number oftourists in the 65+ age group reached 12.7% of all tourists in 1998. The latter group of tourists ismostly concentrated in the winter months. This class of tourists opts to visit the Island then becauseof the country’s relatively mild weather conditions during this season.
Age distribution of incoming tourists - 1998
12%
8%
25%
27%
28%
>15
15-24
25-39
40-54
55+
Source: COS.
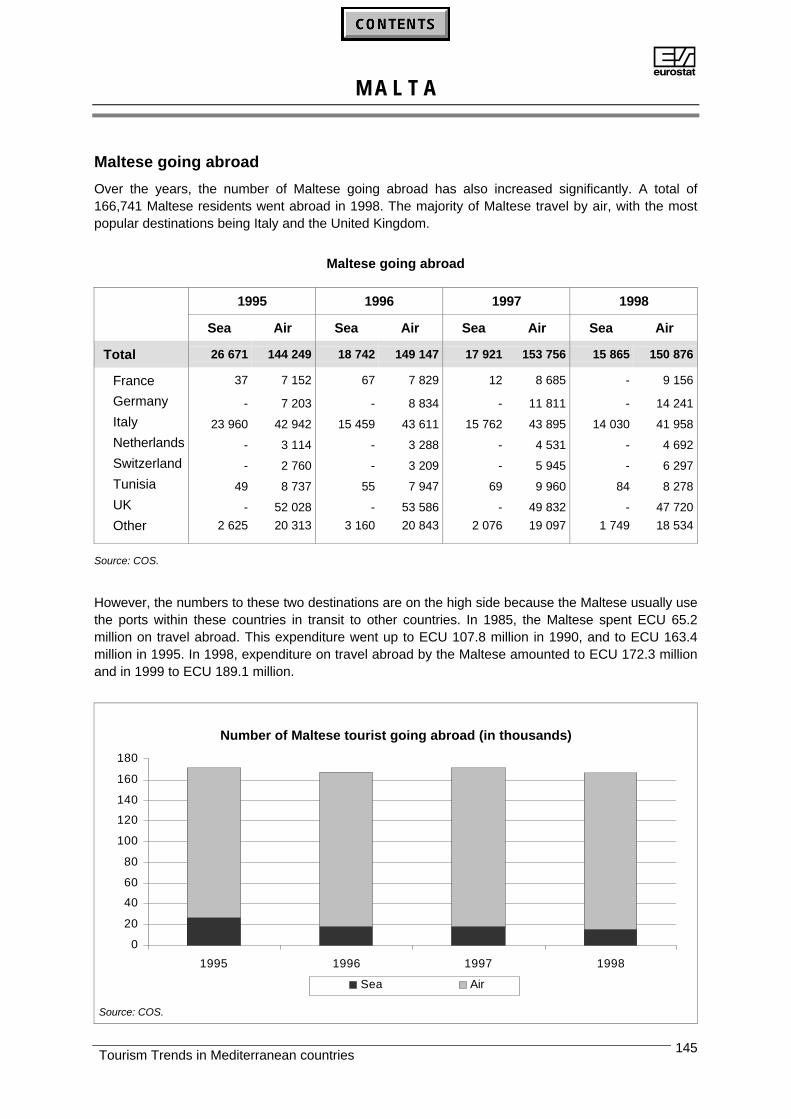
AM A L T A
Tourism Trends in Mediterranean countries 145
Maltese going abroad
Over the years, the number of Maltese going abroad has also increased significantly. A total of166,741 Maltese residents went abroad in 1998. The majority of Maltese travel by air, with the mostpopular destinations being Italy and the United Kingdom.
Maltese going abroad
1995 1996 1997 1998
Sea Air Sea Air Sea Air Sea Air
Total 26 671 144 249 18 742 149 147 17 921 153 756 15 865 150 876
France 37 7 152 67 7 829 12 8 685 - 9 156
Germany - 7 203 - 8 834 - 11 811 - 14 241
Italy 23 960 42 942 15 459 43 611 15 762 43 895 14 030 41 958
Netherlands - 3 114 - 3 288 - 4 531 - 4 692
Switzerland - 2 760 - 3 209 - 5 945 - 6 297
Tunisia 49 8 737 55 7 947 69 9 960 84 8 278
UK - 52 028 - 53 586 - 49 832 - 47 720
Other 2 625 20 313 3 160 20 843 2 076 19 097 1 749 18 534
Source: COS.
However, the numbers to these two destinations are on the high side because the Maltese usually usethe ports within these countries in transit to other countries. In 1985, the Maltese spent ECU 65.2million on travel abroad. This expenditure went up to ECU 107.8 million in 1990, and to ECU 163.4million in 1995. In 1998, expenditure on travel abroad by the Maltese amounted to ECU 172.3 millionand in 1999 to ECU 189.1 million.
Number of Maltese tourist going abroad (in thousands)
0
20
40
60
80
100
120
140
160
180
1995 1996 1997 1998
Sea Air
Source: COS.
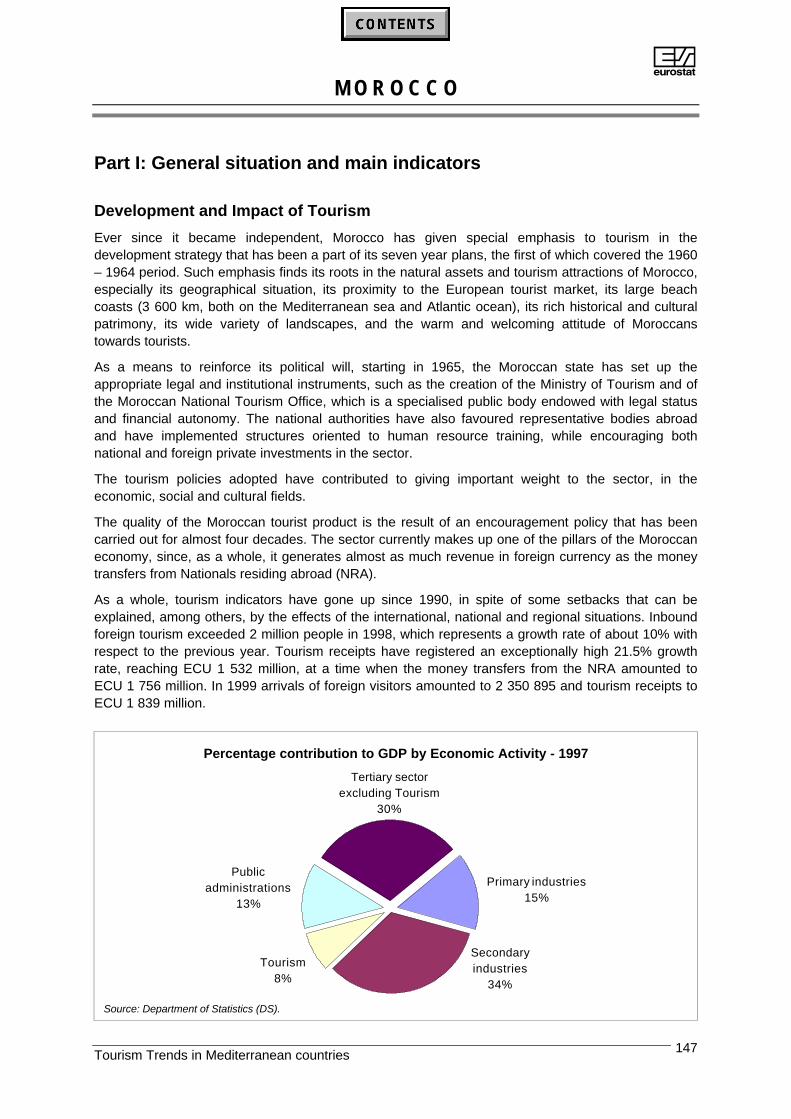
AM O R O C C O
Tourism Trends in Mediterranean countries 147
Part I: General situation and main indicators
Development and Impact of Tourism
Ever since it became independent, Morocco has given special emphasis to tourism in thedevelopment strategy that has been a part of its seven year plans, the first of which covered the 1960– 1964 period. Such emphasis finds its roots in the natural assets and tourism attractions of Morocco,especially its geographical situation, its proximity to the European tourist market, its large beachcoasts (3 600 km, both on the Mediterranean sea and Atlantic ocean), its rich historical and culturalpatrimony, its wide variety of landscapes, and the warm and welcoming attitude of Moroccanstowards tourists.
As a means to reinforce its political will, starting in 1965, the Moroccan state has set up theappropriate legal and institutional instruments, such as the creation of the Ministry of Tourism and ofthe Moroccan National Tourism Office, which is a specialised public body endowed with legal statusand financial autonomy. The national authorities have also favoured representative bodies abroadand have implemented structures oriented to human resource training, while encouraging bothnational and foreign private investments in the sector.
The tourism policies adopted have contributed to giving important weight to the sector, in theeconomic, social and cultural fields.
The quality of the Moroccan tourist product is the result of an encouragement policy that has beencarried out for almost four decades. The sector currently makes up one of the pillars of the Moroccaneconomy, since, as a whole, it generates almost as much revenue in foreign currency as the moneytransfers from Nationals residing abroad (NRA).
As a whole, tourism indicators have gone up since 1990, in spite of some setbacks that can beexplained, among others, by the effects of the international, national and regional situations. Inboundforeign tourism exceeded 2 million people in 1998, which represents a growth rate of about 10% withrespect to the previous year. Tourism receipts have registered an exceptionally high 21.5% growthrate, reaching ECU 1 532 million, at a time when the money transfers from the NRA amounted toECU 1 756 million. In 1999 arrivals of foreign visitors amounted to 2 350 895 and tourism receipts toECU 1 839 million.
Percentage contribution to GDP by Economic Activity - 1997
Primary industries15%
Tourism8%
Public administrations
13%
Tertiary sector excluding Tourism
30%
Secondary industries
34%
Source: Department of Statistics (DS).
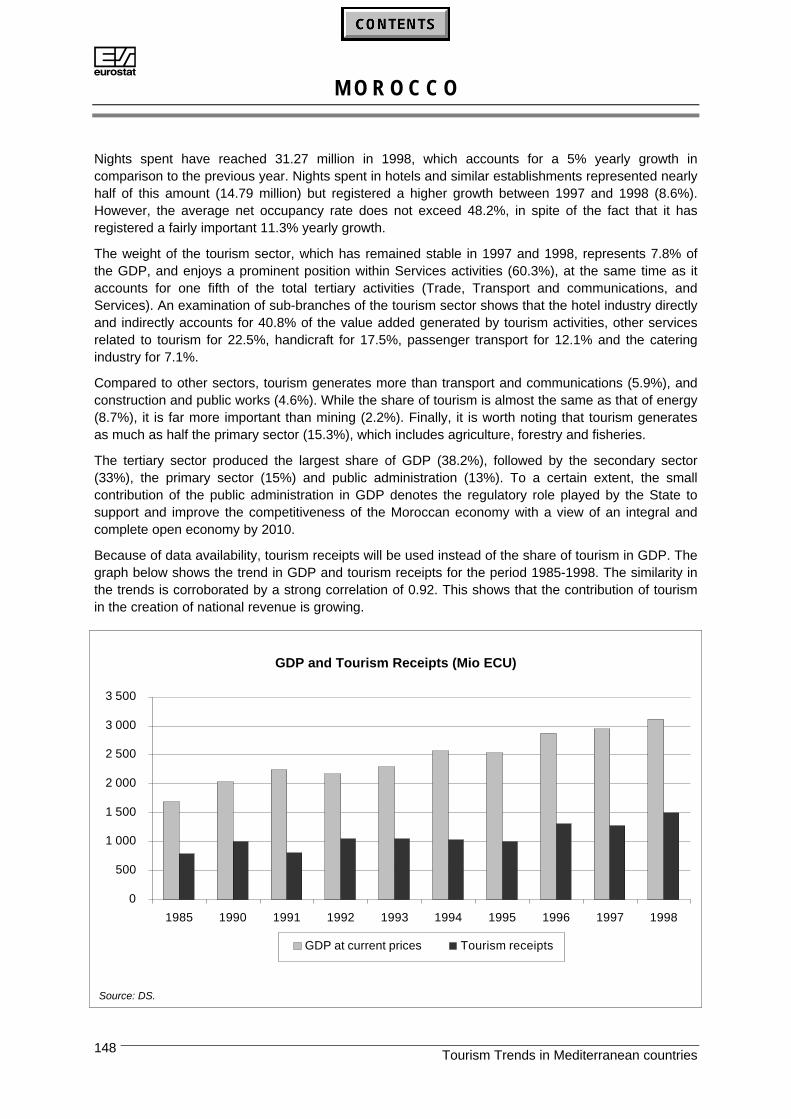
AM O R O C C O
Tourism Trends in Mediterranean countries148
Nights spent have reached 31.27 million in 1998, which accounts for a 5% yearly growth incomparison to the previous year. Nights spent in hotels and similar establishments represented nearlyhalf of this amount (14.79 million) but registered a higher growth between 1997 and 1998 (8.6%).However, the average net occupancy rate does not exceed 48.2%, in spite of the fact that it hasregistered a fairly important 11.3% yearly growth.
The weight of the tourism sector, which has remained stable in 1997 and 1998, represents 7.8% ofthe GDP, and enjoys a prominent position within Services activities (60.3%), at the same time as itaccounts for one fifth of the total tertiary activities (Trade, Transport and communications, andServices). An examination of sub-branches of the tourism sector shows that the hotel industry directlyand indirectly accounts for 40.8% of the value added generated by tourism activities, other servicesrelated to tourism for 22.5%, handicraft for 17.5%, passenger transport for 12.1% and the cateringindustry for 7.1%.
Compared to other sectors, tourism generates more than transport and communications (5.9%), andconstruction and public works (4.6%). While the share of tourism is almost the same as that of energy(8.7%), it is far more important than mining (2.2%). Finally, it is worth noting that tourism generatesas much as half the primary sector (15.3%), which includes agriculture, forestry and fisheries.
The tertiary sector produced the largest share of GDP (38.2%), followed by the secondary sector(33%), the primary sector (15%) and public administration (13%). To a certain extent, the smallcontribution of the public administration in GDP denotes the regulatory role played by the State tosupport and improve the competitiveness of the Moroccan economy with a view of an integral andcomplete open economy by 2010.
Because of data availability, tourism receipts will be used instead of the share of tourism in GDP. Thegraph below shows the trend in GDP and tourism receipts for the period 1985-1998. The similarity inthe trends is corroborated by a strong correlation of 0.92. This shows that the contribution of tourismin the creation of national revenue is growing.
GDP and Tourism Receipts (Mio ECU)
0
500
1 000
1 500
2 000
2 500
3 000
3 500
1985 1990 1991 1992 1993 1994 1995 1996 1997 1998
GDP at current prices Tourism receipts
Source: DS.
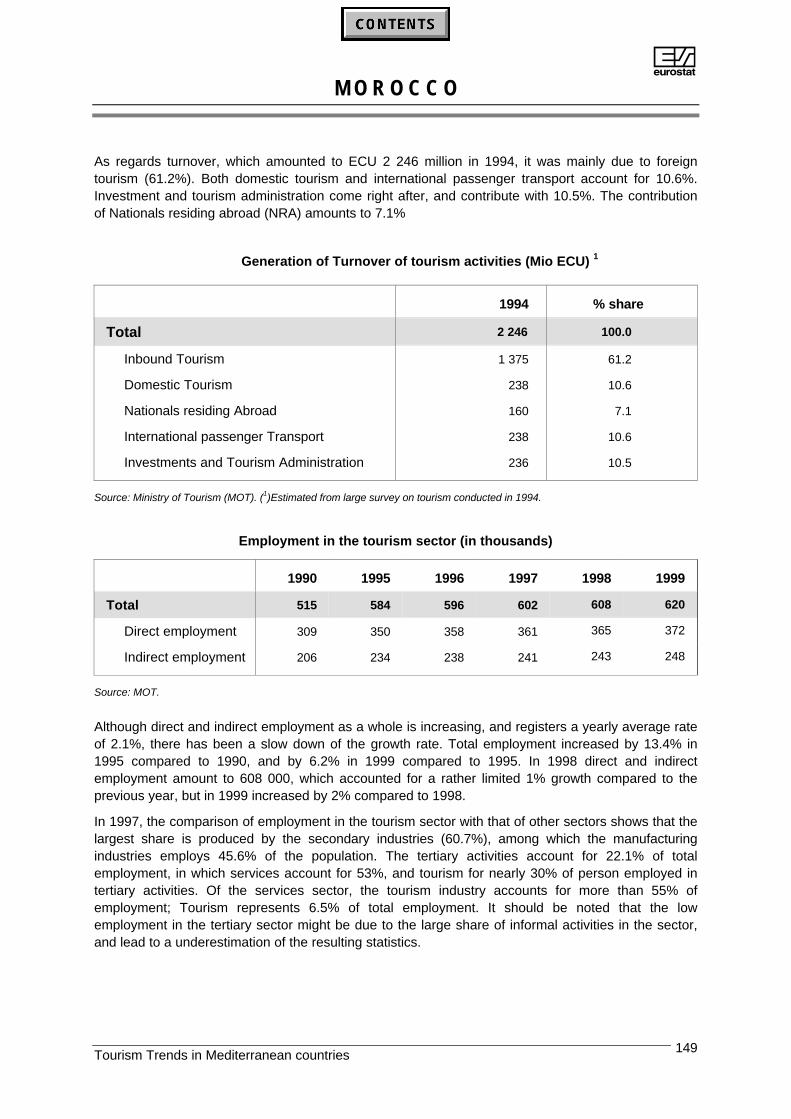
AM O R O C C O
Tourism Trends in Mediterranean countries 149
As regards turnover, which amounted to ECU 2 246 million in 1994, it was mainly due to foreigntourism (61.2%). Both domestic tourism and international passenger transport account for 10.6%.Investment and tourism administration come right after, and contribute with 10.5%. The contributionof Nationals residing abroad (NRA) amounts to 7.1%
Generation of Turnover of tourism activities (Mio ECU) 1
1994 % share
Total 2 246 100.0
Inbound Tourism 1 375 61.2
Domestic Tourism 238 10.6
Nationals residing Abroad 160 7.1
International passenger Transport 238 10.6
Investments and Tourism Administration 236 10.5
Source: Ministry of Tourism (MOT). (1)Estimated from large survey on tourism conducted in 1994.
Employment in the tourism sector (in thousands)
1990 1995 1996 1997 1998 1999
Total 515 584 596 602 608 620
Direct employment 309 350 358 361 365 372
Indirect employment 206 234 238 241 243 248
Source: MOT.
Although direct and indirect employment as a whole is increasing, and registers a yearly average rateof 2.1%, there has been a slow down of the growth rate. Total employment increased by 13.4% in1995 compared to 1990, and by 6.2% in 1999 compared to 1995. In 1998 direct and indirectemployment amount to 608 000, which accounted for a rather limited 1% growth compared to theprevious year, but in 1999 increased by 2% compared to 1998.
In 1997, the comparison of employment in the tourism sector with that of other sectors shows that thelargest share is produced by the secondary industries (60.7%), among which the manufacturingindustries employs 45.6% of the population. The tertiary activities account for 22.1% of totalemployment, in which services account for 53%, and tourism for nearly 30% of person employed intertiary activities. Of the services sector, the tourism industry accounts for more than 55% ofemployment; Tourism represents 6.5% of total employment. It should be noted that the lowemployment in the tertiary sector might be due to the large share of informal activities in the sector,and lead to a underestimation of the resulting statistics.
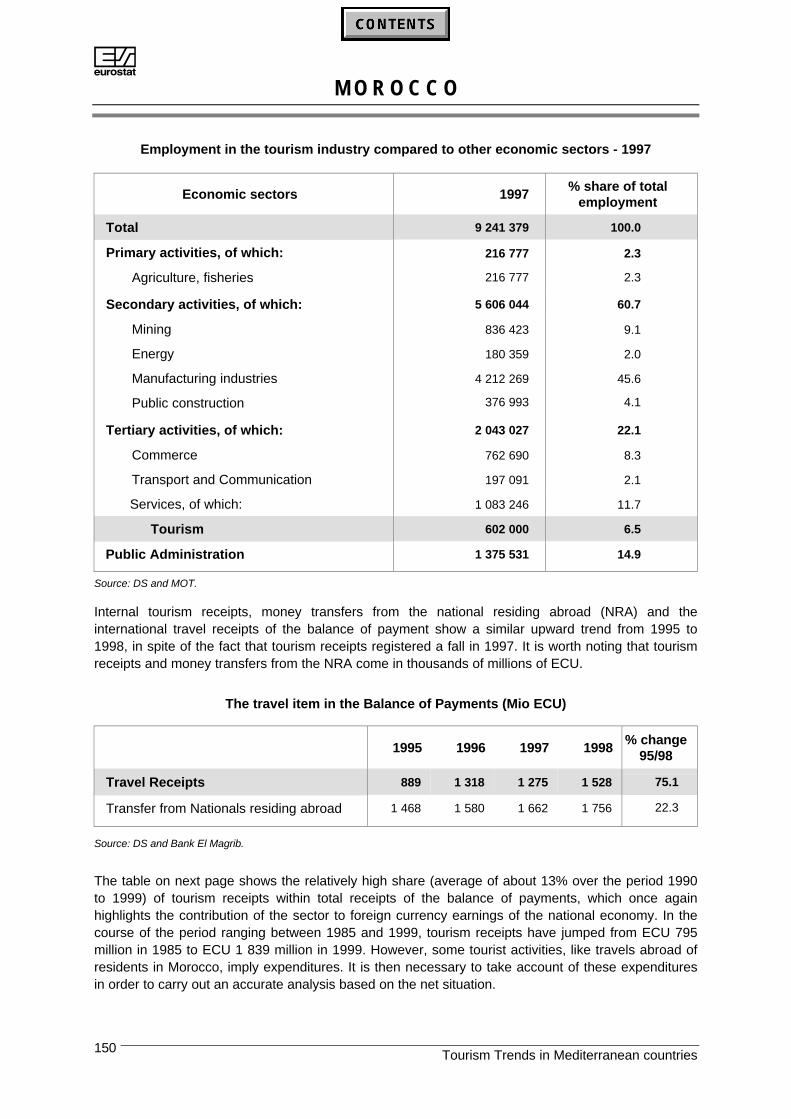
AM O R O C C O
Tourism Trends in Mediterranean countries150
Employment in the tourism industry compared to other economic sectors - 1997
Economic sectors 1997% share of total
employment
Total 9 241 379 100.0
Primary activities, of which: 216 777 2.3
Agriculture, fisheries 216 777 2.3
Secondary activities, of which: 5 606 044 60.7
Mining 836 423 9.1
Energy 180 359 2.0
Manufacturing industries 4 212 269 45.6
Public construction 376 993 4.1
Tertiary activities, of which: 2 043 027 22.1
Commerce 762 690 8.3
Transport and Communication 197 091 2.1
Services, of which: 1 083 246 11.7
Tourism 602 000 6.5
Public Administration 1 375 531 14.9
Source: DS and MOT.
Internal tourism receipts, money transfers from the national residing abroad (NRA) and theinternational travel receipts of the balance of payment show a similar upward trend from 1995 to1998, in spite of the fact that tourism receipts registered a fall in 1997. It is worth noting that tourismreceipts and money transfers from the NRA come in thousands of millions of ECU.
The travel item in the Balance of Payments (Mio ECU)
1995 1996 1997 1998% change
95/98
Travel Receipts 889 1 318 1 275 1 528 75.1
Transfer from Nationals residing abroad 1 468 1 580 1 662 1 756 22.3
Source: DS and Bank El Magrib.
The table on next page shows the relatively high share (average of about 13% over the period 1990to 1999) of tourism receipts within total receipts of the balance of payments, which once againhighlights the contribution of the sector to foreign currency earnings of the national economy. In thecourse of the period ranging between 1985 and 1999, tourism receipts have jumped from ECU 795million in 1985 to ECU 1 839 million in 1999. However, some tourist activities, like travels abroad ofresidents in Morocco, imply expenditures. It is then necessary to take account of these expendituresin order to carry out an accurate analysis based on the net situation.
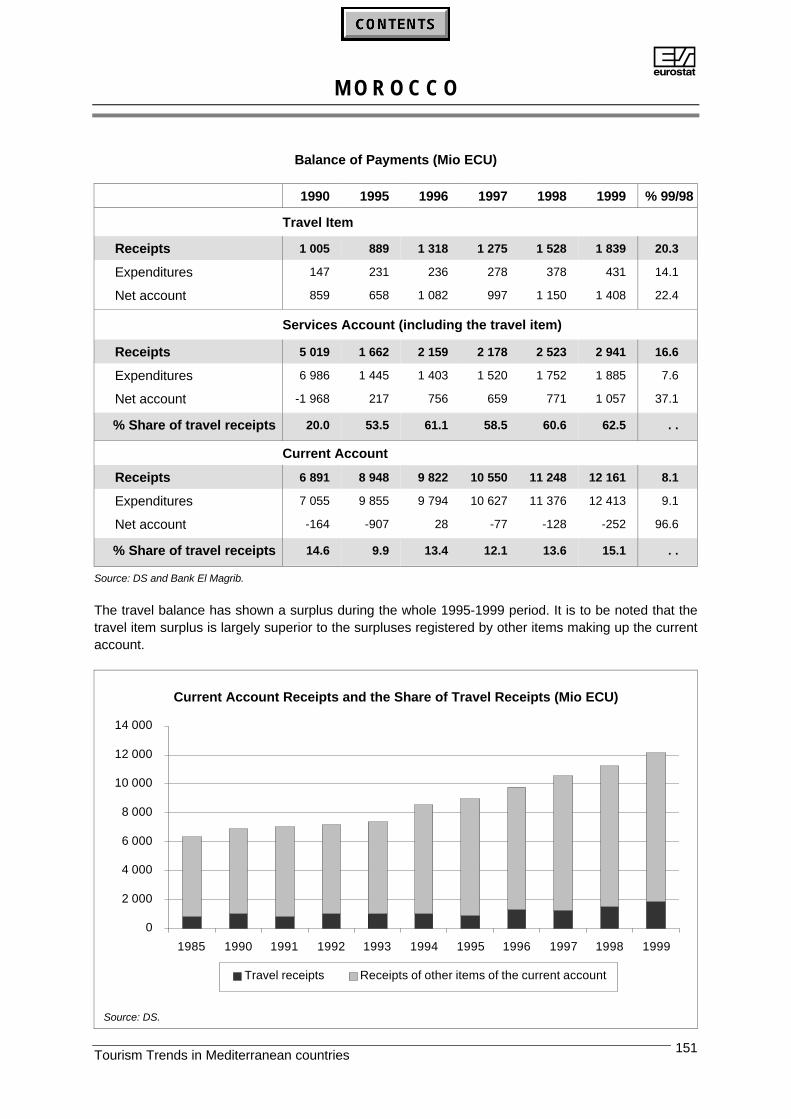
AM O R O C C O
Tourism Trends in Mediterranean countries 151
Balance of Payments (Mio ECU)
1990 1995 1996 1997 1998 1999 % 99/98
Travel Item
Receipts 1 005 889 1 318 1 275 1 528 1 839 20.3
Expenditures 147 231 236 278 378 431 14.1
Net account 859 658 1 082 997 1 150 1 408 22.4
Services Account (including the travel item)
Receipts 5 019 1 662 2 159 2 178 2 523 2 941 16.6
Expenditures 6 986 1 445 1 403 1 520 1 752 1 885 7.6
Net account -1 968 217 756 659 771 1 057 37.1
% Share of travel receipts 20.0 53.5 61.1 58.5 60.6 62.5 . .
Current Account
Receipts 6 891 8 948 9 822 10 550 11 248 12 161 8.1
Expenditures 7 055 9 855 9 794 10 627 11 376 12 413 9.1
Net account -164 -907 28 -77 -128 -252 96.6
% Share of travel receipts 14.6 9.9 13.4 12.1 13.6 15.1 . .
Source: DS and Bank El Magrib.
The travel balance has shown a surplus during the whole 1995-1999 period. It is to be noted that thetravel item surplus is largely superior to the surpluses registered by other items making up the currentaccount.
Current Account Receipts and the Share of Travel Receipts (Mio ECU)
0
2 000
4 000
6 000
8 000
10 000
12 000
14 000
1985 1990 1991 1992 1993 1994 1995 1996 1997 1998 1999
Travel receipts Receipts of other items of the current account
Source: DS.
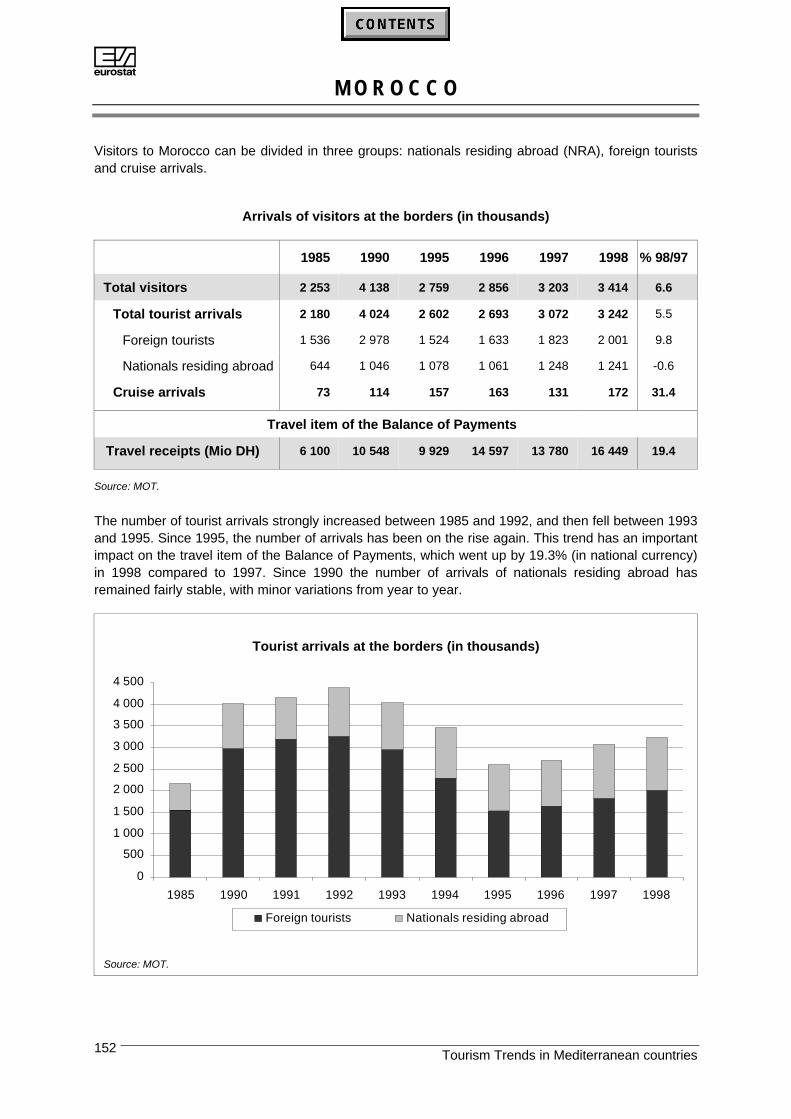
AM O R O C C O
Tourism Trends in Mediterranean countries152
Visitors to Morocco can be divided in three groups: nationals residing abroad (NRA), foreign touristsand cruise arrivals.
Arrivals of visitors at the borders (in thousands)
1985 1990 1995 1996 1997 1998 % 98/97
Total visitors 2 253 4 138 2 759 2 856 3 203 3 414 6.6
Total tourist arrivals 2 180 4 024 2 602 2 693 3 072 3 242 5.5
Foreign tourists 1 536 2 978 1 524 1 633 1 823 2 001 9.8
Nationals residing abroad 644 1 046 1 078 1 061 1 248 1 241 -0.6
Cruise arrivals 73 114 157 163 131 172 31.4
Travel item of the Balance of Payments
Travel receipts (Mio DH) 6 100 10 548 9 929 14 597 13 780 16 449 19.4
Source: MOT.
The number of tourist arrivals strongly increased between 1985 and 1992, and then fell between 1993and 1995. Since 1995, the number of arrivals has been on the rise again. This trend has an importantimpact on the travel item of the Balance of Payments, which went up by 19.3% (in national currency)in 1998 compared to 1997. Since 1990 the number of arrivals of nationals residing abroad hasremained fairly stable, with minor variations from year to year.
Tourist arrivals at the borders (in thousands)
0
500
1 000
1 500
2 000
2 500
3 000
3 500
4 000
4 500
1985 1990 1991 1992 1993 1994 1995 1996 1997 1998
Foreign tourists Nationals residing abroad
Source: MOT.
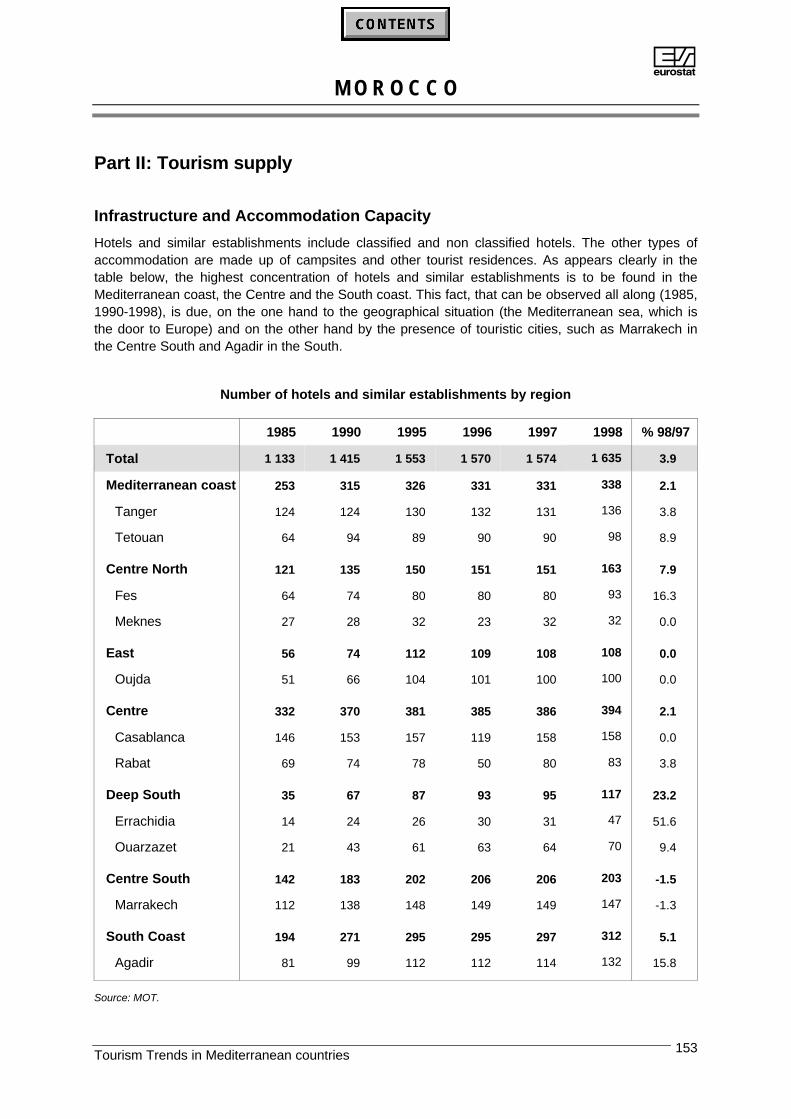
AM O R O C C O
Tourism Trends in Mediterranean countries 153
Part II: Tourism supply
Infrastructure and Accommodation Capacity
Hotels and similar establishments include classified and non classified hotels. The other types ofaccommodation are made up of campsites and other tourist residences. As appears clearly in thetable below, the highest concentration of hotels and similar establishments is to be found in theMediterranean coast, the Centre and the South coast. This fact, that can be observed all along (1985,1990-1998), is due, on the one hand to the geographical situation (the Mediterranean sea, which isthe door to Europe) and on the other hand by the presence of touristic cities, such as Marrakech inthe Centre South and Agadir in the South.
Number of hotels and similar establishments by region
1985 1990 1995 1996 1997 1998 % 98/97
Total 1 133 1 415 1 553 1 570 1 574 1 635 3.9
Mediterranean coast 253 315 326 331 331 338 2.1
Tanger 124 124 130 132 131 136 3.8
Tetouan 64 94 89 90 90 98 8.9
Centre North 121 135 150 151 151 163 7.9
Fes 64 74 80 80 80 93 16.3
Meknes 27 28 32 23 32 32 0.0
East 56 74 112 109 108 108 0.0
Oujda 51 66 104 101 100 100 0.0
Centre 332 370 381 385 386 394 2.1
Casablanca 146 153 157 119 158 158 0.0
Rabat 69 74 78 50 80 83 3.8
Deep South 35 67 87 93 95 117 23.2
Errachidia 14 24 26 30 31 47 51.6
Ouarzazet 21 43 61 63 64 70 9.4
Centre South 142 183 202 206 206 203 -1.5
Marrakech 112 138 148 149 149 147 -1.3
South Coast 194 271 295 295 297 312 5.1
Agadir 81 99 112 112 114 132 15.8
Source: MOT.
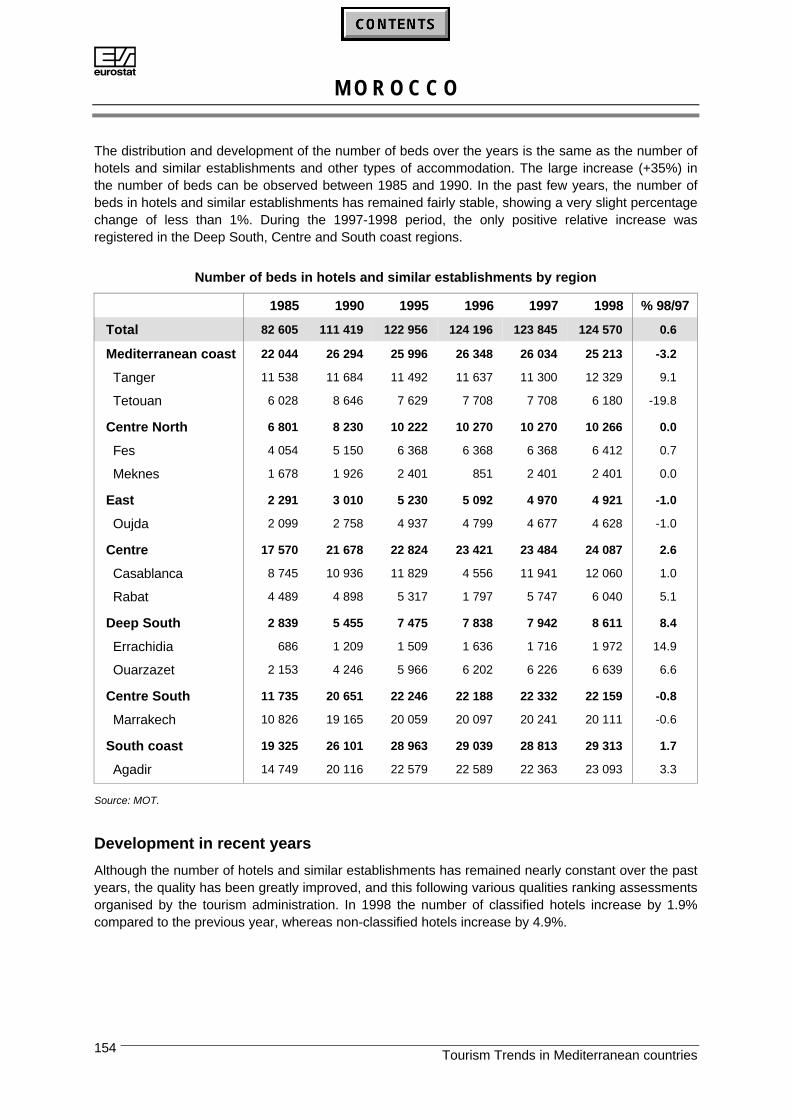
AM O R O C C O
Tourism Trends in Mediterranean countries154
The distribution and development of the number of beds over the years is the same as the number ofhotels and similar establishments and other types of accommodation. The large increase (+35%) inthe number of beds can be observed between 1985 and 1990. In the past few years, the number ofbeds in hotels and similar establishments has remained fairly stable, showing a very slight percentagechange of less than 1%. During the 1997-1998 period, the only positive relative increase wasregistered in the Deep South, Centre and South coast regions.
Number of beds in hotels and similar establishments by region
1985 1990 1995 1996 1997 1998 % 98/97
Total 82 605 111 419 122 956 124 196 123 845 124 570 0.6
Mediterranean coast 22 044 26 294 25 996 26 348 26 034 25 213 -3.2
Tanger 11 538 11 684 11 492 11 637 11 300 12 329 9.1
Tetouan 6 028 8 646 7 629 7 708 7 708 6 180 -19.8
Centre North 6 801 8 230 10 222 10 270 10 270 10 266 0.0
Fes 4 054 5 150 6 368 6 368 6 368 6 412 0.7
Meknes 1 678 1 926 2 401 851 2 401 2 401 0.0
East 2 291 3 010 5 230 5 092 4 970 4 921 -1.0
Oujda 2 099 2 758 4 937 4 799 4 677 4 628 -1.0
Centre 17 570 21 678 22 824 23 421 23 484 24 087 2.6
Casablanca 8 745 10 936 11 829 4 556 11 941 12 060 1.0
Rabat 4 489 4 898 5 317 1 797 5 747 6 040 5.1
Deep South 2 839 5 455 7 475 7 838 7 942 8 611 8.4
Errachidia 686 1 209 1 509 1 636 1 716 1 972 14.9
Ouarzazet 2 153 4 246 5 966 6 202 6 226 6 639 6.6
Centre South 11 735 20 651 22 246 22 188 22 332 22 159 -0.8
Marrakech 10 826 19 165 20 059 20 097 20 241 20 111 -0.6
South coast 19 325 26 101 28 963 29 039 28 813 29 313 1.7
Agadir 14 749 20 116 22 579 22 589 22 363 23 093 3.3
Source: MOT.
Development in recent years
Although the number of hotels and similar establishments has remained nearly constant over the pastyears, the quality has been greatly improved, and this following various qualities ranking assessmentsorganised by the tourism administration. In 1998 the number of classified hotels increase by 1.9%compared to the previous year, whereas non-classified hotels increase by 4.9%.

AM O R O C C O
Tourism Trends in Mediterranean countries 155
Number of establishments by category
1985 1990 1995 1996 1997 1998 1999 1 % 99/98
Total 1 216 1 500 1 638 1 655 1 659 1 720 1 671 -2.8
Hotels and similarestablishments
1 133 1 415 1 553 1 570 1 574 1 635 1 586 -3.0
Classified Hotels 422 511 526 533 532 542 568 4.8
Non classified Hotels 711 904 1 027 1 037 1 042 1 093 1 018 -6.9
Camping sites 85 85 85 85 85 85 85 0.0
(1) Provisional figures.
Source: MOT.
Number of hotels and similar establishments
0
200
400
600
800
1 000
1 200
1 400
1 600
1 800
1985 1990 1991 1992 1993 1994 1995 1996 1997 1998 1999
Non Classified Hotels Classified Hotels
Source: MOT.
Number of hotels and similar establishments by quality category
1985 1990 1995 1996 1997 1998 % 98/97
Hotels and similarestablishments
1 133 1 415 1 553 1 570 1 574 1 635 3.9
Classified Hotels 422 511 526 533 532 542 1.9
1 star 81 89 87 95 91 92 1.1
2 star 93 107 125 118 118 122 3.4
3 star 79 100 121 124 128 130 1.6
4 star 94 115 101 102 101 103 2.0
5 star 26 33 32 33 33 33 0.0
Tourist villages 19 27 23 25 25 25 0.0
Appart-hotels 30 40 37 36 36 37 2.8
Non classified Hotels 711 904 1 027 1 037 1 042 1 093 4.9
Source: MOT.
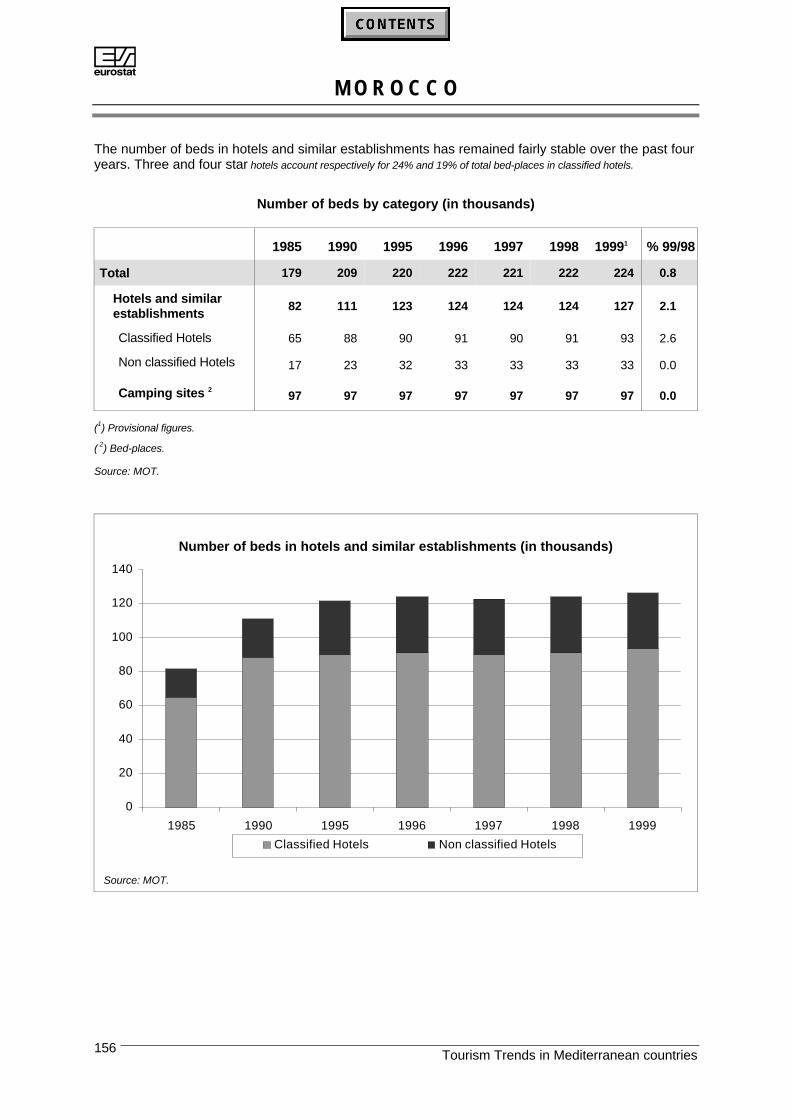
AM O R O C C O
Tourism Trends in Mediterranean countries156
The number of beds in hotels and similar establishments has remained fairly stable over the past fouryears. Three and four star hotels account respectively for 24% and 19% of total bed-places in classified hotels.
Number of beds by category (in thousands)
1985 1990 1995 1996 1997 1998 19991 % 99/98
Total 179 209 220 222 221 222 224 0.8
Hotels and similarestablishments
82 111 123 124 124 124 127 2.1
Classified Hotels 65 88 90 91 90 91 93 2.6
Non classified Hotels 17 23 32 33 33 33 33 0.0
Camping sites 297 97 97 97 97 97 97 0.0
(1) Provisional figures.
( 2) Bed-places.
Source: MOT.
Number of beds in hotels and similar establishments (in thousands)
0
20
40
60
80
100
120
140
1985 1990 1995 1996 1997 1998 1999
Classified Hotels Non classified Hotels
Source: MOT.
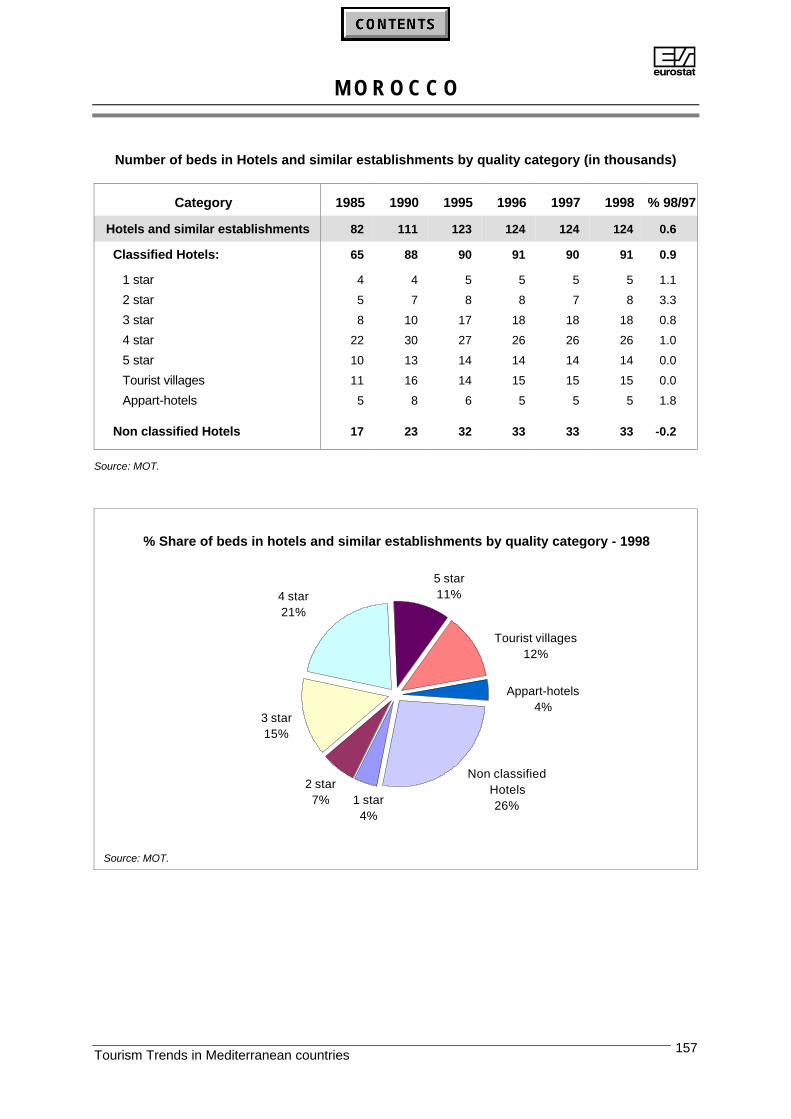
AM O R O C C O
Tourism Trends in Mediterranean countries 157
Number of beds in Hotels and similar establishments by quality category (in thousands)
Category 1985 1990 1995 1996 1997 1998 % 98/97
Hotels and similar establishments 82 111 123 124 124 124 0.6
Classified Hotels: 65 88 90 91 90 91 0.9
1 star 4 4 5 5 5 5 1.1
2 star 5 7 8 8 7 8 3.3
3 star 8 10 17 18 18 18 0.8
4 star 22 30 27 26 26 26 1.0
5 star 10 13 14 14 14 14 0.0
Tourist villages 11 16 14 15 15 15 0.0
Appart-hotels 5 8 6 5 5 5 1.8
Non classified Hotels 17 23 32 33 33 33 -0.2
Source: MOT.
% Share of beds in hotels and similar establishments by quality category - 1998
Non classified Hotels26%1 star
4%
3 star 15%
4 star21%
5 star11%
2 star 7%
Appart-hotels4%
Tourist villages12%
Source: MOT.
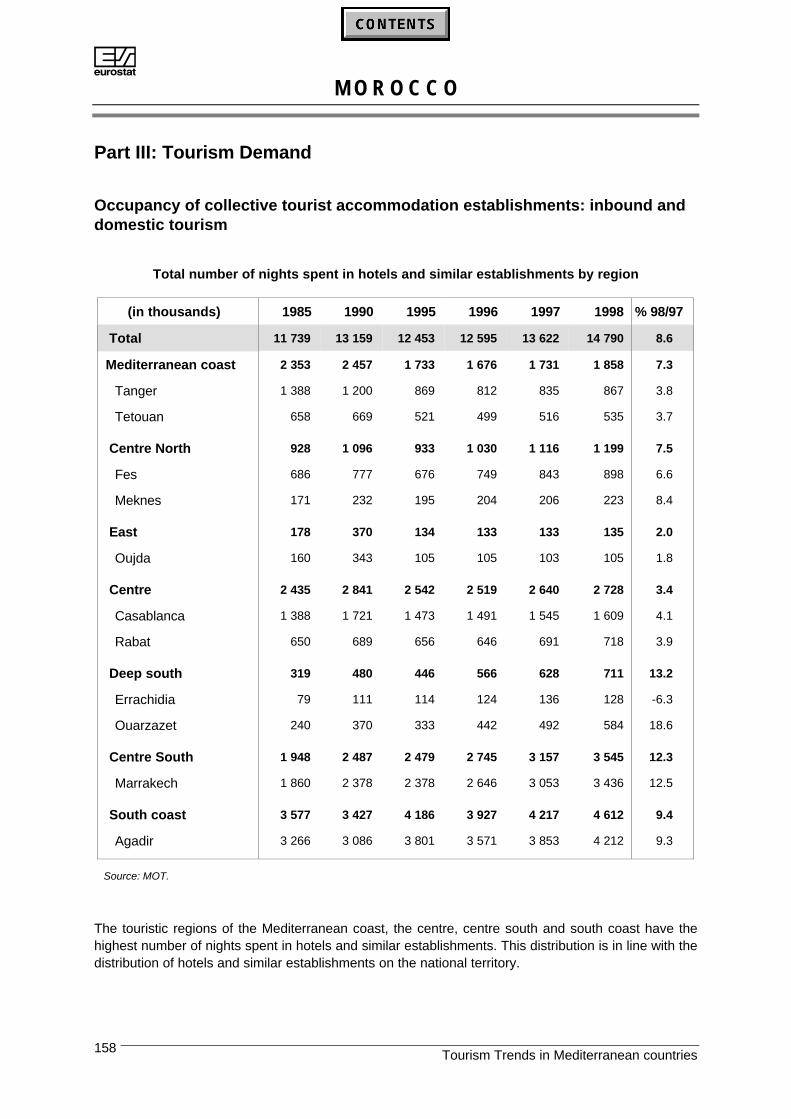
AM O R O C C O
Tourism Trends in Mediterranean countries158
Part III: Tourism Demand
Occupancy of collective tourist accommodation establishments: inbound anddomestic tourism
Total number of nights spent in hotels and similar establishments by region
(in thousands) 1985 1990 1995 1996 1997 1998 % 98/97
Total 11 739 13 159 12 453 12 595 13 622 14 790 8.6
Mediterranean coast 2 353 2 457 1 733 1 676 1 731 1 858 7.3
Tanger 1 388 1 200 869 812 835 867 3.8
Tetouan 658 669 521 499 516 535 3.7
Centre North 928 1 096 933 1 030 1 116 1 199 7.5
Fes 686 777 676 749 843 898 6.6
Meknes 171 232 195 204 206 223 8.4
East 178 370 134 133 133 135 2.0
Oujda 160 343 105 105 103 105 1.8
Centre 2 435 2 841 2 542 2 519 2 640 2 728 3.4
Casablanca 1 388 1 721 1 473 1 491 1 545 1 609 4.1
Rabat 650 689 656 646 691 718 3.9
Deep south 319 480 446 566 628 711 13.2
Errachidia 79 111 114 124 136 128 -6.3
Ouarzazet 240 370 333 442 492 584 18.6
Centre South 1 948 2 487 2 479 2 745 3 157 3 545 12.3
Marrakech 1 860 2 378 2 378 2 646 3 053 3 436 12.5
South coast 3 577 3 427 4 186 3 927 4 217 4 612 9.4
Agadir 3 266 3 086 3 801 3 571 3 853 4 212 9.3
Source: MOT.
The touristic regions of the Mediterranean coast, the centre, centre south and south coast have thehighest number of nights spent in hotels and similar establishments. This distribution is in line with thedistribution of hotels and similar establishments on the national territory.
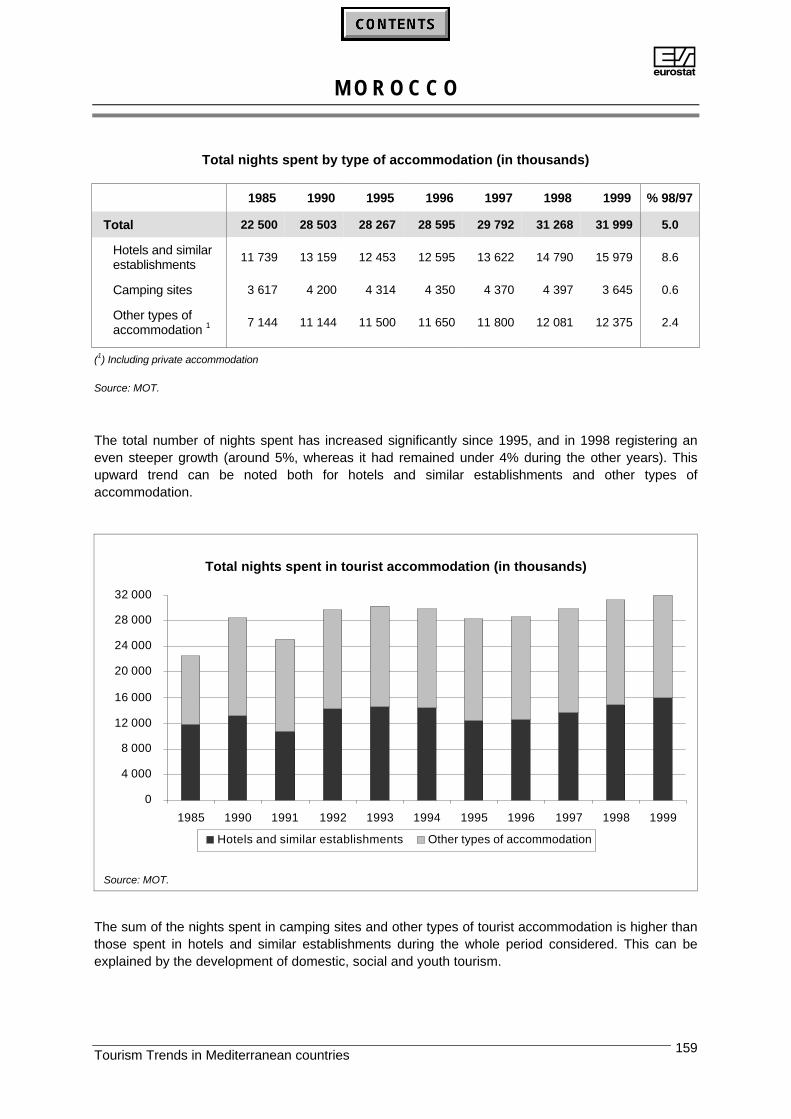
AM O R O C C O
Tourism Trends in Mediterranean countries 159
Total nights spent by type of accommodation (in thousands)
1985 1990 1995 1996 1997 1998 1999 % 98/97
Total 22 500 28 503 28 267 28 595 29 792 31 268 31 999 5.0
Hotels and similarestablishments
11 739 13 159 12 453 12 595 13 622 14 790 15 979 8.6
Camping sites 3 617 4 200 4 314 4 350 4 370 4 397 3 645 0.6
Other types ofaccommodation 1
7 144 11 144 11 500 11 650 11 800 12 081 12 375 2.4
(1) Including private accommodation
Source: MOT.
The total number of nights spent has increased significantly since 1995, and in 1998 registering aneven steeper growth (around 5%, whereas it had remained under 4% during the other years). Thisupward trend can be noted both for hotels and similar establishments and other types ofaccommodation.
Total nights spent in tourist accommodation (in thousands)
0
4 000
8 000
12 000
16 000
20 000
24 000
28 000
32 000
1985 1990 1991 1992 1993 1994 1995 1996 1997 1998 1999
Hotels and similar establishments Other types of accommodation
Source: MOT.
The sum of the nights spent in camping sites and other types of tourist accommodation is higher thanthose spent in hotels and similar establishments during the whole period considered. This can beexplained by the development of domestic, social and youth tourism.
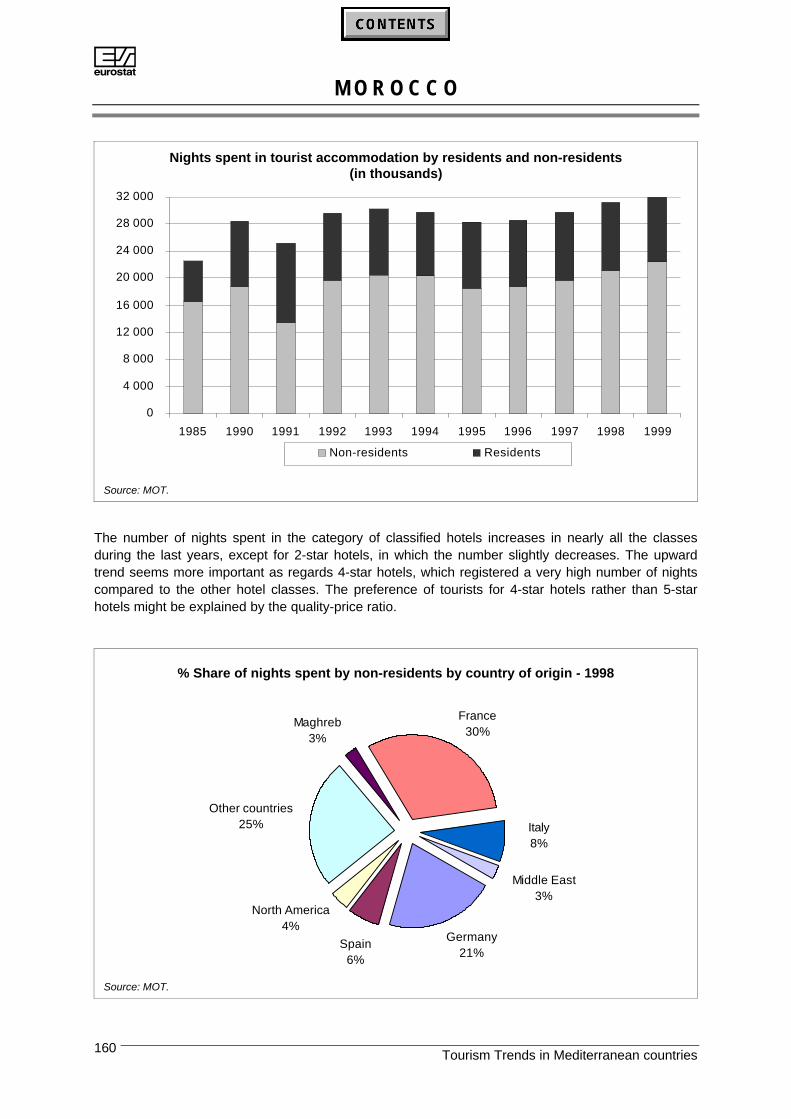
AM O R O C C O
Tourism Trends in Mediterranean countries160
Nights spent in tourist accommodation by residents and non-residents(in thousands)
0
4 000
8 000
12 000
16 000
20 000
24 000
28 000
32 000
1985 1990 1991 1992 1993 1994 1995 1996 1997 1998 1999
Non-residents Residents
Source: MOT.
The number of nights spent in the category of classified hotels increases in nearly all the classesduring the last years, except for 2-star hotels, in which the number slightly decreases. The upwardtrend seems more important as regards 4-star hotels, which registered a very high number of nightscompared to the other hotel classes. The preference of tourists for 4-star hotels rather than 5-starhotels might be explained by the quality-price ratio.
% Share of nights spent by non-residents by country of origin - 1998
Germany21%
France30%
Maghreb3%
Middle East3%
Spain6%
Italy8%
Other countries25%
North America4%
Source: MOT.
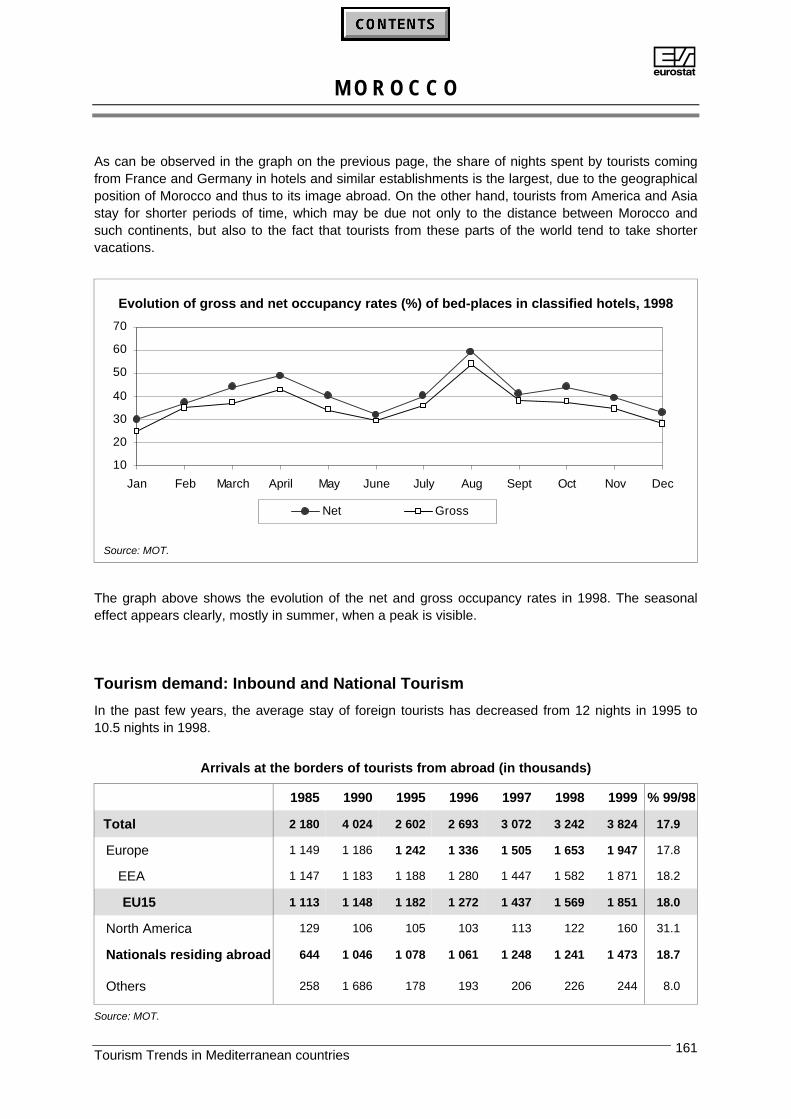
AM O R O C C O
Tourism Trends in Mediterranean countries 161
As can be observed in the graph on the previous page, the share of nights spent by tourists comingfrom France and Germany in hotels and similar establishments is the largest, due to the geographicalposition of Morocco and thus to its image abroad. On the other hand, tourists from America and Asiastay for shorter periods of time, which may be due not only to the distance between Morocco andsuch continents, but also to the fact that tourists from these parts of the world tend to take shortervacations.
Evolution of gross and net occupancy rates (%) of bed-places in classified hotels, 1998
10
20
30
40
50
60
70
Jan Feb March April May June July Aug Sept Oct Nov Dec
Net Gross
Source: MOT.
The graph above shows the evolution of the net and gross occupancy rates in 1998. The seasonaleffect appears clearly, mostly in summer, when a peak is visible.
Tourism demand: Inbound and National Tourism
In the past few years, the average stay of foreign tourists has decreased from 12 nights in 1995 to10.5 nights in 1998.
Arrivals at the borders of tourists from abroad (in thousands)
1985 1990 1995 1996 1997 1998 1999 % 99/98
Total 2 180 4 024 2 602 2 693 3 072 3 242 3 824 17.9
Europe 1 149 1 186 1 242 1 336 1 505 1 653 1 947 17.8
EEA 1 147 1 183 1 188 1 280 1 447 1 582 1 871 18.2
EU15 1 113 1 148 1 182 1 272 1 437 1 569 1 851 18.0
North America 129 106 105 103 113 122 160 31.1
Nationals residing abroad 644 1 046 1 078 1 061 1 248 1 241 1 473 18.7
Others 258 1 686 178 193 206 226 244 8.0
Source: MOT.
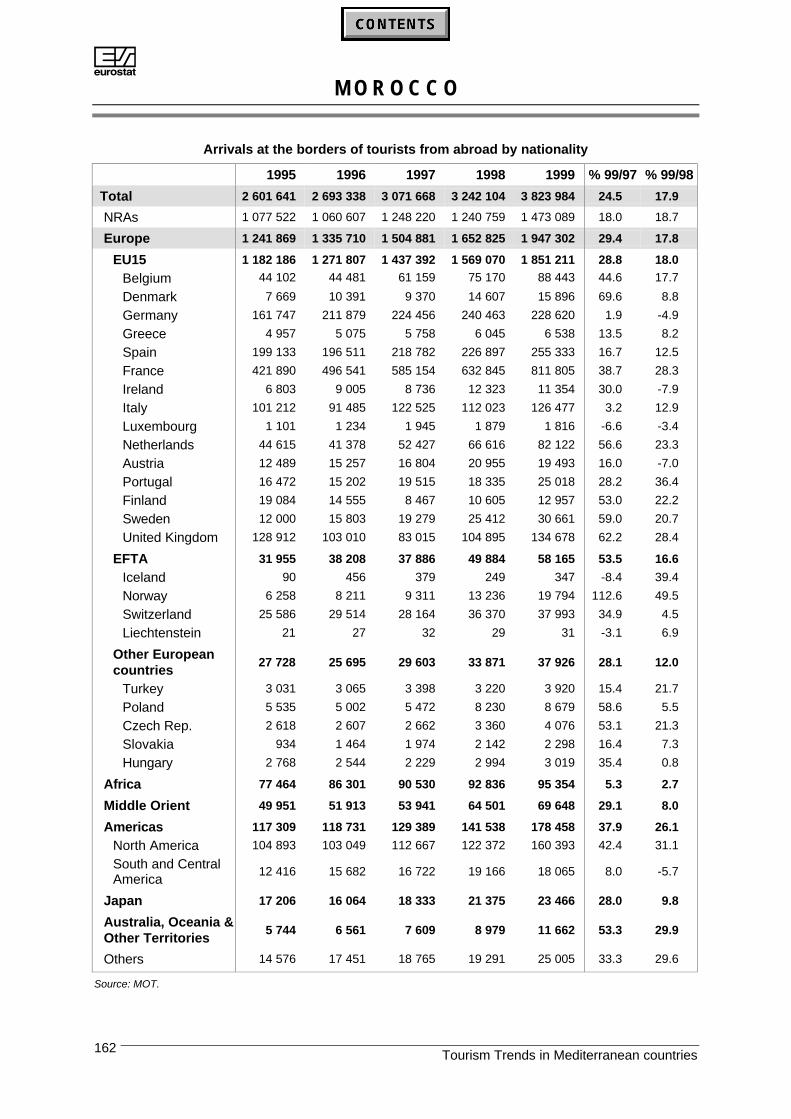
AM O R O C C O
Tourism Trends in Mediterranean countries162
Arrivals at the borders of tourists from abroad by nationality
1995 1996 1997 1998 1999 % 99/97 % 99/98
Total 2 601 641 2 693 338 3 071 668 3 242 104 3 823 984 24.5 17.9
NRAs 1 077 522 1 060 607 1 248 220 1 240 759 1 473 089 18.0 18.7
Europe 1 241 869 1 335 710 1 504 881 1 652 825 1 947 302 29.4 17.8
EU15 1 182 186 1 271 807 1 437 392 1 569 070 1 851 211 28.8 18.0
Belgium 44 102 44 481 61 159 75 170 88 443 44.6 17.7
Denmark 7 669 10 391 9 370 14 607 15 896 69.6 8.8
Germany 161 747 211 879 224 456 240 463 228 620 1.9 -4.9
Greece 4 957 5 075 5 758 6 045 6 538 13.5 8.2
Spain 199 133 196 511 218 782 226 897 255 333 16.7 12.5
France 421 890 496 541 585 154 632 845 811 805 38.7 28.3
Ireland 6 803 9 005 8 736 12 323 11 354 30.0 -7.9
Italy 101 212 91 485 122 525 112 023 126 477 3.2 12.9
Luxembourg 1 101 1 234 1 945 1 879 1 816 -6.6 -3.4
Netherlands 44 615 41 378 52 427 66 616 82 122 56.6 23.3
Austria 12 489 15 257 16 804 20 955 19 493 16.0 -7.0
Portugal 16 472 15 202 19 515 18 335 25 018 28.2 36.4
Finland 19 084 14 555 8 467 10 605 12 957 53.0 22.2
Sweden 12 000 15 803 19 279 25 412 30 661 59.0 20.7
United Kingdom 128 912 103 010 83 015 104 895 134 678 62.2 28.4
EFTA 31 955 38 208 37 886 49 884 58 165 53.5 16.6
Iceland 90 456 379 249 347 -8.4 39.4
Norway 6 258 8 211 9 311 13 236 19 794 112.6 49.5
Switzerland 25 586 29 514 28 164 36 370 37 993 34.9 4.5
Liechtenstein 21 27 32 29 31 -3.1 6.9
Other Europeancountries
27 728 25 695 29 603 33 871 37 926 28.1 12.0
Turkey 3 031 3 065 3 398 3 220 3 920 15.4 21.7
Poland 5 535 5 002 5 472 8 230 8 679 58.6 5.5
Czech Rep. 2 618 2 607 2 662 3 360 4 076 53.1 21.3
Slovakia 934 1 464 1 974 2 142 2 298 16.4 7.3
Hungary 2 768 2 544 2 229 2 994 3 019 35.4 0.8
Africa 77 464 86 301 90 530 92 836 95 354 5.3 2.7
Middle Orient 49 951 51 913 53 941 64 501 69 648 29.1 8.0
Americas 117 309 118 731 129 389 141 538 178 458 37.9 26.1
North America 104 893 103 049 112 667 122 372 160 393 42.4 31.1
South and CentralAmerica
12 416 15 682 16 722 19 166 18 065 8.0 -5.7
Japan 17 206 16 064 18 333 21 375 23 466 28.0 9.8
Australia, Oceania &Other Territories
5 744 6 561 7 609 8 979 11 662 53.3 29.9
Others 14 576 17 451 18 765 19 291 25 005 33.3 29.6
Source: MOT.

AM O R O C C O
Tourism Trends in Mediterranean countries 163
As a whole, the number of arrivals of foreign tourists increased in the early 90’s. It was followed by asevere reversal in the trend from 1994 to 1996. It finally resumed a regular upward tendency after1997. Yet, the disparities registered among the regions of origin of tourists do not always reflect thegeneral trend.
As a matter of fact, the number of arrivals of foreign tourists coming from Europe, Africa and NorthAmerica steeply decreased in 1991. The same happened regarding Nationals Residing abroad. Thiscan be partly explained by the Gulf events. In 1995, the number of tourists coming from Europe andNorth America went through a slight decrease.
As for nationals residing abroad, the number of arrivals goes through ups and downs, although astrong upward trend has been noted since 1996.
Distribution of inbound tourists according to:
The main purpose of the visit
Family4%
Other3%
Business9%
Leisure Trips 84%
Source: MOT
Mode of transport used
Road11%
Sea23%
Air66%
The graphs above show that 84% of the tourists coming from abroad come to Morocco for leisurepurposes. Business trips rank second. 66% of tourists come by air, 23% use sea transportation and11% come by road.
Outbound tourism trips (in thousands)
0
200
400
600
800
1 000
1 200
1 400
1 600
1985 1990 1991 1992 1993 1994 1995 1996 1997 1998
Source: MOT
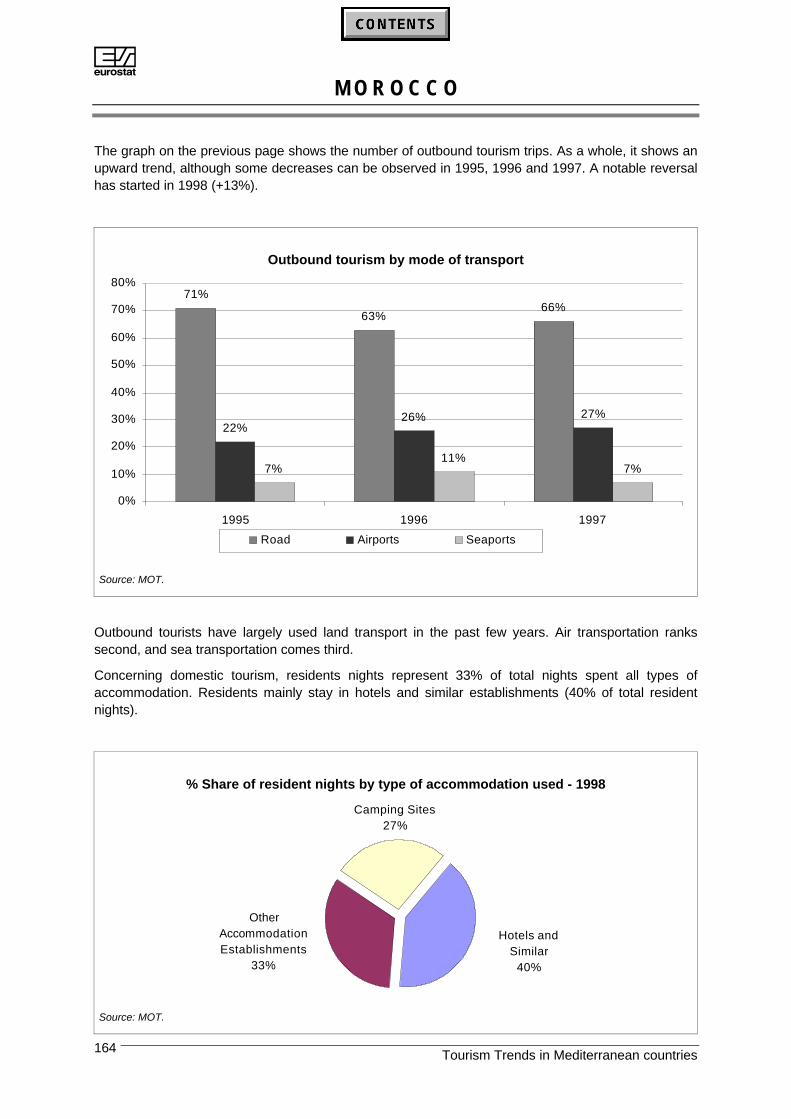
AM O R O C C O
Tourism Trends in Mediterranean countries164
The graph on the previous page shows the number of outbound tourism trips. As a whole, it shows anupward trend, although some decreases can be observed in 1995, 1996 and 1997. A notable reversalhas started in 1998 (+13%).
Outbound tourism by mode of transport
71%
63%66%
22%26% 27%
7%11%
7%
0%
10%
20%
30%
40%
50%
60%
70%
80%
1995 1996 1997
Road Airports Seaports
Source: MOT.
Outbound tourists have largely used land transport in the past few years. Air transportation rankssecond, and sea transportation comes third.
Concerning domestic tourism, residents nights represent 33% of total nights spent all types ofaccommodation. Residents mainly stay in hotels and similar establishments (40% of total residentnights).
% Share of resident nights by type of accommodation used - 1998
Hotels and Similar
40%
Other Accommodation Establishments
33%
Camping Sites27%
Source: MOT.
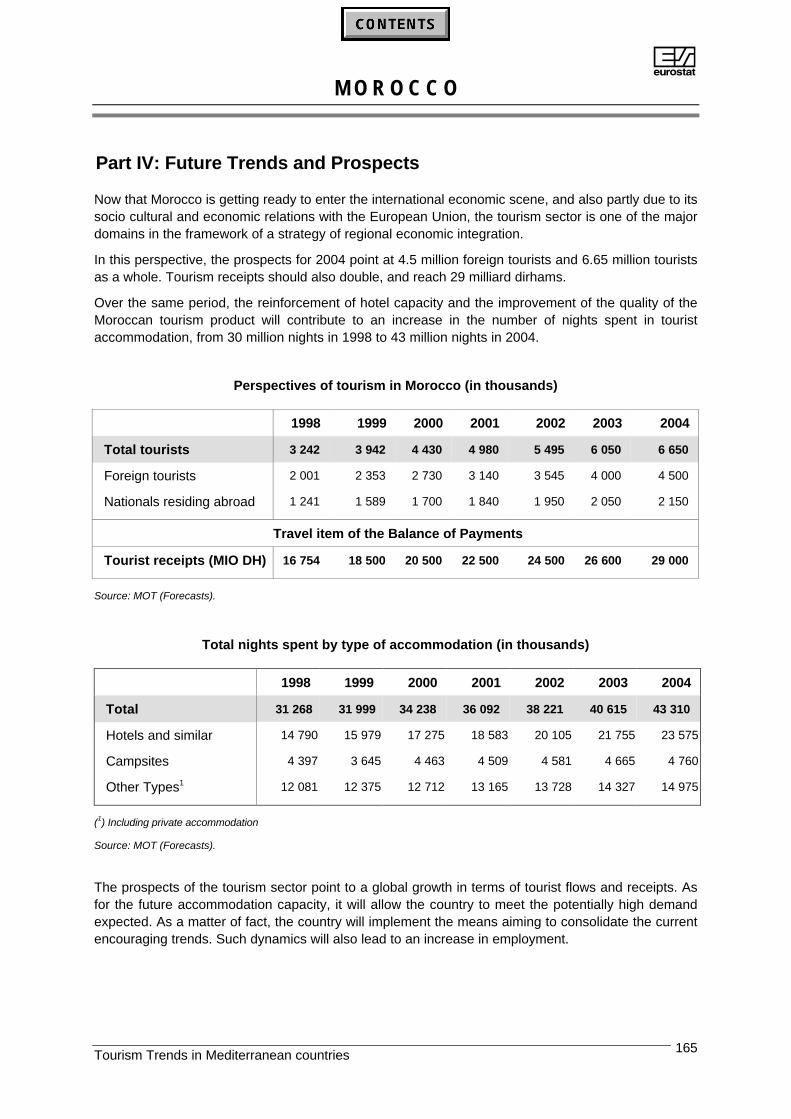
AM O R O C C O
Tourism Trends in Mediterranean countries 165
Part IV: Future Trends and Prospects
Now that Morocco is getting ready to enter the international economic scene, and also partly due to itssocio cultural and economic relations with the European Union, the tourism sector is one of the majordomains in the framework of a strategy of regional economic integration.
In this perspective, the prospects for 2004 point at 4.5 million foreign tourists and 6.65 million touristsas a whole. Tourism receipts should also double, and reach 29 milliard dirhams.
Over the same period, the reinforcement of hotel capacity and the improvement of the quality of theMoroccan tourism product will contribute to an increase in the number of nights spent in touristaccommodation, from 30 million nights in 1998 to 43 million nights in 2004.
Perspectives of tourism in Morocco (in thousands)
1998 1999 2000 2001 2002 2003 2004
Total tourists 3 242 3 942 4 430 4 980 5 495 6 050 6 650
Foreign tourists 2 001 2 353 2 730 3 140 3 545 4 000 4 500
Nationals residing abroad 1 241 1 589 1 700 1 840 1 950 2 050 2 150
Travel item of the Balance of Payments
Tourist receipts (MIO DH) 16 754 18 500 20 500 22 500 24 500 26 600 29 000
Source: MOT (Forecasts).
Total nights spent by type of accommodation (in thousands)
1998 1999 2000 2001 2002 2003 2004
Total 31 268 31 999 34 238 36 092 38 221 40 615 43 310
Hotels and similar 14 790 15 979 17 275 18 583 20 105 21 755 23 575
Campsites 4 397 3 645 4 463 4 509 4 581 4 665 4 760
Other Types1 12 081 12 375 12 712 13 165 13 728 14 327 14 975
(1) Including private accommodation
Source: MOT (Forecasts).
The prospects of the tourism sector point to a global growth in terms of tourist flows and receipts. Asfor the future accommodation capacity, it will allow the country to meet the potentially high demandexpected. As a matter of fact, the country will implement the means aiming to consolidate the currentencouraging trends. Such dynamics will also lead to an increase in employment.
AM O R O C C O
Tourism Trends in Mediterranean countries166
Regarding national and regional development, some semi-public organisms have been assigned bythe State the task to promote tourism. The creation of companies such as the SNABT and theSONABA, dedicated to land acquisition in their respective regions, has initiated the investments in thefield of hotels and related businesses.
According to the Socio-economic Development Plan for the Tourism Sector 2000-2004, the 30,000bed-places provided for should result in 204,000 new direct and indirect jobs, of which 141,000 willrespond to international tourism demand.
One of the objectives of the plan is to apply a coherent and active tourism strategy, which willhighlight a competitive and attractive product. The aim is thus to develop a high standard seaside andcultural tourism, a diversified tourism (desert, mountains, thematic products, etc.) that will meet thelatest trends in international and national tourism demand. In order to achieve this, the main actionsprovided for will include:
(i) Reception and transport
(ii) Several reception measures have been implemented:
§ general improvement in the condition of entry points, such as airports, railway stations,ports, surface borders
§ simplification of checking-in procedures and border controls
§ abolition of visa requirements regarding many countries
§ mere presentation of the national identity card for tourists from some countries
§ better facilities in tourist accommodation establishments
§ quality tourist transport bus services
As for transport, Royal Air Maroc intends to increase its plane fleet and to keep up with the modernrequirements of international tourism.
(iii) In order to further promote the tourist sector, the main actions will evolve around:
§ the emphasis on the unique characteristics of Morocco compared to others.
§ cuts in production and distribution costs.
§ the implementation of a new reduced and truly encouraging fiscal framework.
§ the valorisation of the products Morocco is specialised in.
§ the reinforcement of promotional actions by products and regions.
§ the increase in tourist accommodation capacity
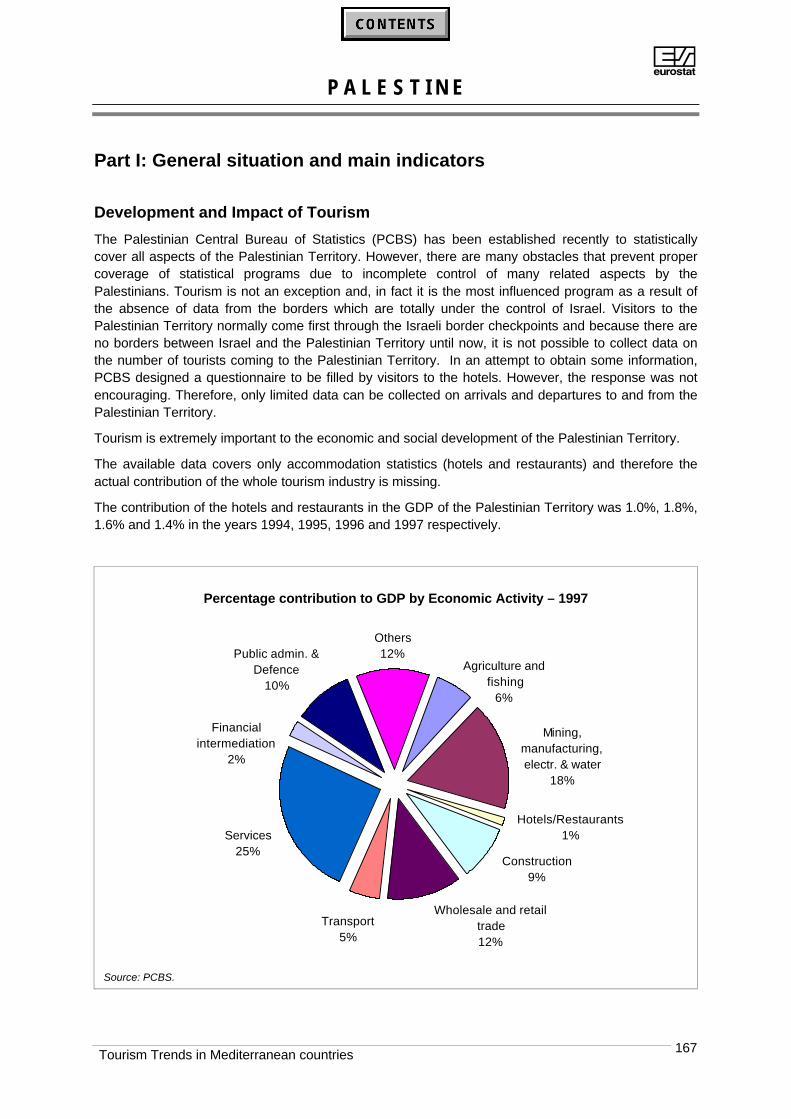
AP A L E S T I N E
Tourism Trends in Mediterranean countries 167
Part I: General situation and main indicators
Development and Impact of Tourism
The Palestinian Central Bureau of Statistics (PCBS) has been established recently to statisticallycover all aspects of the Palestinian Territory. However, there are many obstacles that prevent propercoverage of statistical programs due to incomplete control of many related aspects by thePalestinians. Tourism is not an exception and, in fact it is the most influenced program as a result ofthe absence of data from the borders which are totally under the control of Israel. Visitors to thePalestinian Territory normally come first through the Israeli border checkpoints and because there areno borders between Israel and the Palestinian Territory until now, it is not possible to collect data onthe number of tourists coming to the Palestinian Territory. In an attempt to obtain some information,PCBS designed a questionnaire to be filled by visitors to the hotels. However, the response was notencouraging. Therefore, only limited data can be collected on arrivals and departures to and from thePalestinian Territory.
Tourism is extremely important to the economic and social development of the Palestinian Territory.
The available data covers only accommodation statistics (hotels and restaurants) and therefore theactual contribution of the whole tourism industry is missing.
The contribution of the hotels and restaurants in the GDP of the Palestinian Territory was 1.0%, 1.8%,1.6% and 1.4% in the years 1994, 1995, 1996 and 1997 respectively.
Percentage contribution to GDP by Economic Activity – 1997
Hotels/Restaurants1%
Construction9%
Services25%
Financial intermediation
2%
Public admin. & Defence
10%
Others12%
Mining, manufacturing, electr. & water
18%
Transport5%
Wholesale and retail trade12%
Agriculture and fishing
6%
Source: PCBS.
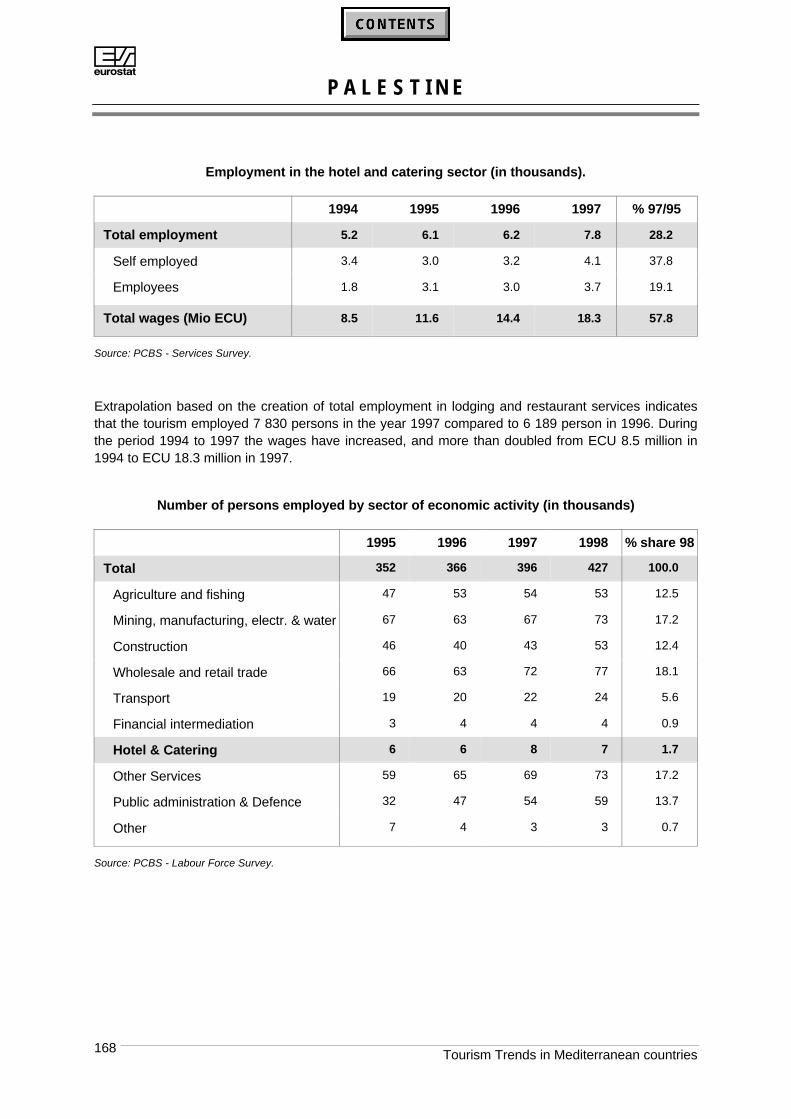
AP A L E S T I N E
Tourism Trends in Mediterranean countries168
Employment in the hotel and catering sector (in thousands).
1994 1995 1996 1997 % 97/95
Total employment 5.2 6.1 6.2 7.8 28.2
Self employed 3.4 3.0 3.2 4.1 37.8
Employees 1.8 3.1 3.0 3.7 19.1
Total wages (Mio ECU) 8.5 11.6 14.4 18.3 57.8
Source: PCBS - Services Survey.
Extrapolation based on the creation of total employment in lodging and restaurant services indicatesthat the tourism employed 7 830 persons in the year 1997 compared to 6 189 person in 1996. Duringthe period 1994 to 1997 the wages have increased, and more than doubled from ECU 8.5 million in1994 to ECU 18.3 million in 1997.
Number of persons employed by sector of economic activity (in thousands)
1995 1996 1997 1998 % share 98
Total 352 366 396 427 100.0
Agriculture and fishing 47 53 54 53 12.5
Mining, manufacturing, electr. & water 67 63 67 73 17.2
Construction 46 40 43 53 12.4
Wholesale and retail trade 66 63 72 77 18.1
Transport 19 20 22 24 5.6
Financial intermediation 3 4 4 4 0.9
Hotel & Catering 6 6 8 7 1.7
Other Services 59 65 69 73 17.2
Public administration & Defence 32 47 54 59 13.7
Other 7 4 3 3 0.7
Source: PCBS - Labour Force Survey.
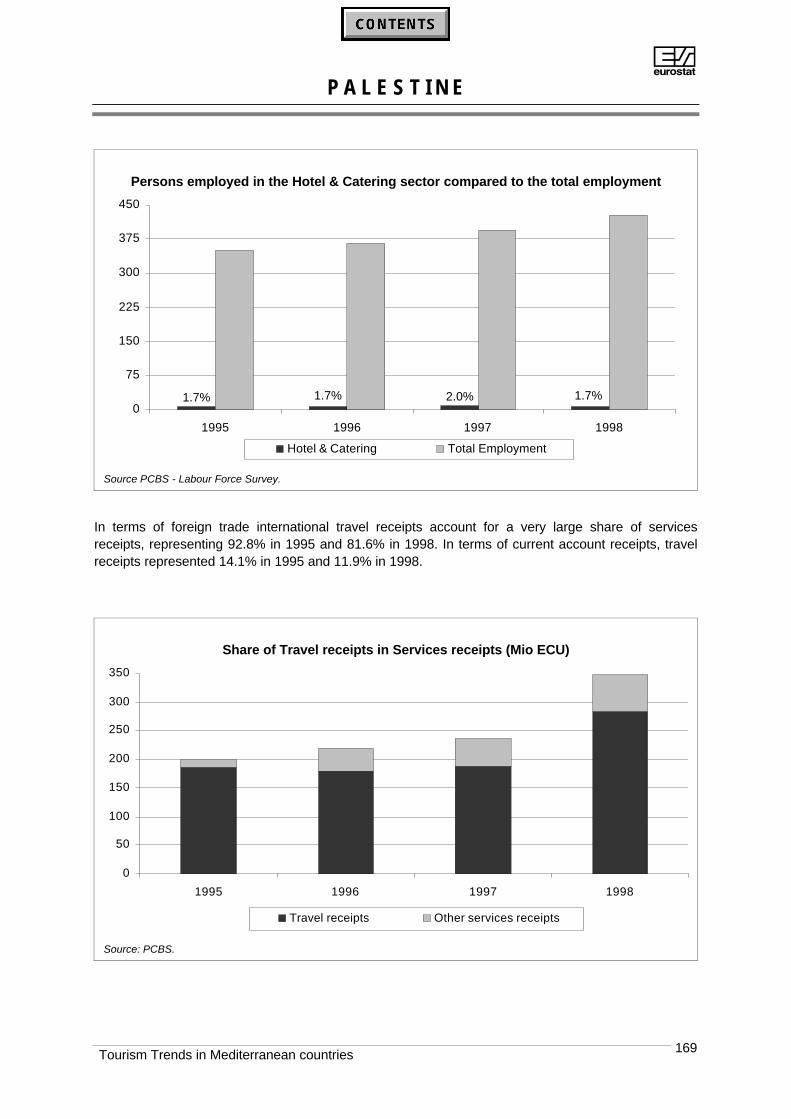
AP A L E S T I N E
Tourism Trends in Mediterranean countries 169
Persons employed in the Hotel & Catering sector compared to the total employment
1.7%2.0%1.7%1.7%0
75
150
225
300
375
450
1995 1996 1997 1998
Hotel & Catering Total Employment
Source PCBS - Labour Force Survey.
In terms of foreign trade international travel receipts account for a very large share of servicesreceipts, representing 92.8% in 1995 and 81.6% in 1998. In terms of current account receipts, travelreceipts represented 14.1% in 1995 and 11.9% in 1998.
Share of Travel receipts in Services receipts (Mio ECU)
0
50
100
150
200
250
300
350
1995 1996 1997 1998
Travel receipts Other services receipts
Source: PCBS.
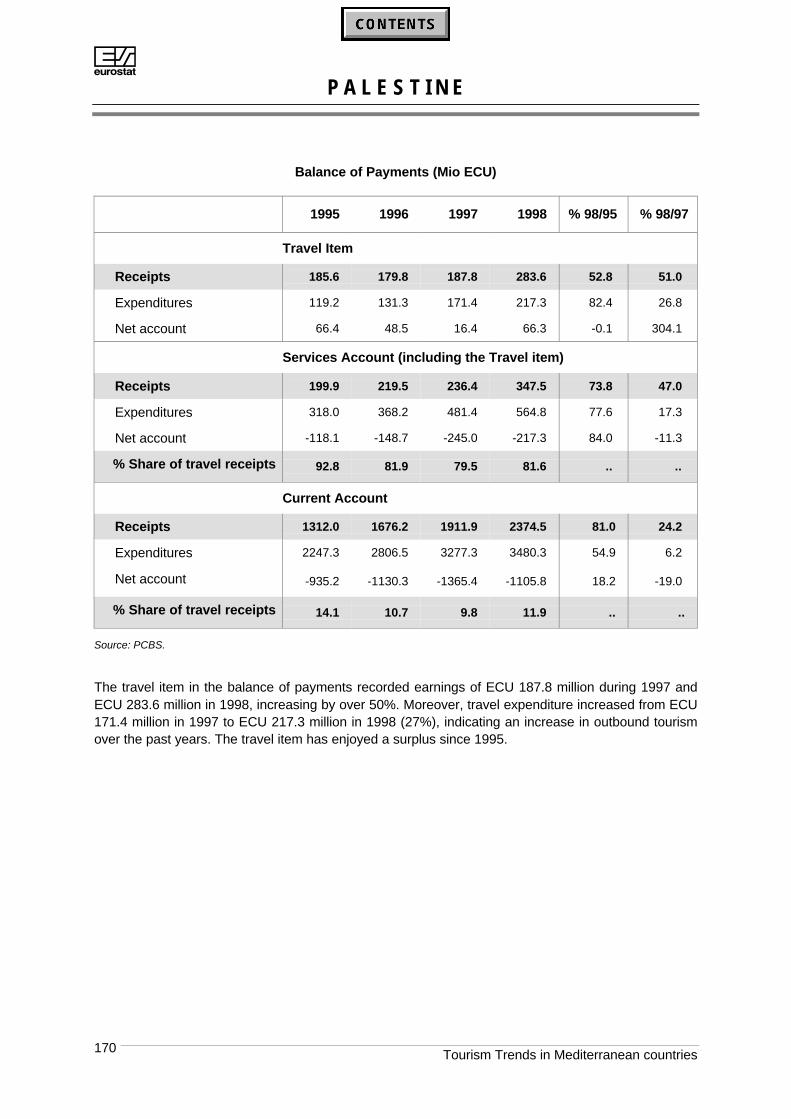
AP A L E S T I N E
Tourism Trends in Mediterranean countries170
Balance of Payments (Mio ECU)
1995 1996 1997 1998 % 98/95 % 98/97
Travel Item
Receipts 185.6 179.8 187.8 283.6 52.8 51.0
Expenditures 119.2 131.3 171.4 217.3 82.4 26.8
Net account 66.4 48.5 16.4 66.3 -0.1 304.1
Services Account (including the Travel item)
Receipts 199.9 219.5 236.4 347.5 73.8 47.0
Expenditures 318.0 368.2 481.4 564.8 77.6 17.3
Net account -118.1 -148.7 -245.0 -217.3 84.0 -11.3
% Share of travel receipts 92.8 81.9 79.5 81.6 .. ..
Current Account
Receipts 1312.0 1676.2 1911.9 2374.5 81.0 24.2
Expenditures 2247.3 2806.5 3277.3 3480.3 54.9 6.2
Net account -935.2 -1130.3 -1365.4 -1105.8 18.2 -19.0
% Share of travel receipts 14.1 10.7 9.8 11.9 .. ..
Source: PCBS.
The travel item in the balance of payments recorded earnings of ECU 187.8 million during 1997 andECU 283.6 million in 1998, increasing by over 50%. Moreover, travel expenditure increased from ECU171.4 million in 1997 to ECU 217.3 million in 1998 (27%), indicating an increase in outbound tourismover the past years. The travel item has enjoyed a surplus since 1995.
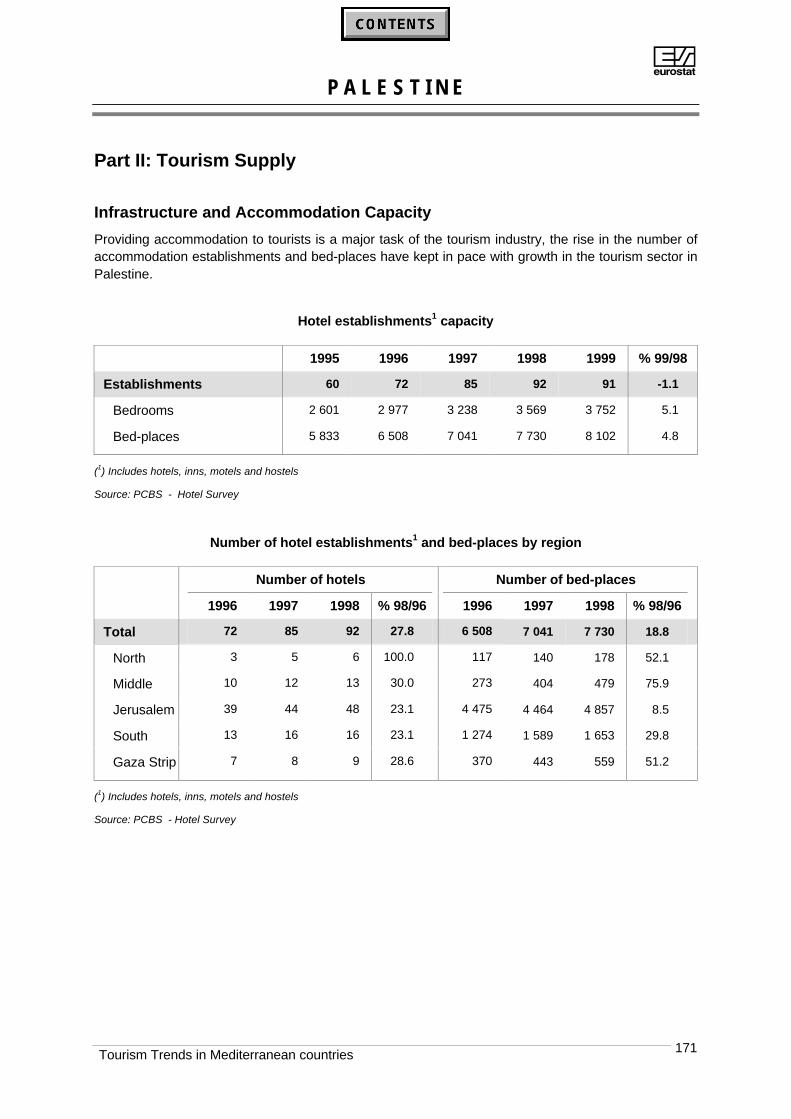
AP A L E S T I N E
Tourism Trends in Mediterranean countries 171
Part II: Tourism Supply
Infrastructure and Accommodation Capacity
Providing accommodation to tourists is a major task of the tourism industry, the rise in the number ofaccommodation establishments and bed-places have kept in pace with growth in the tourism sector inPalestine.
Hotel establishments1 capacity
1995 1996 1997 1998 1999 % 99/98
Establishments 60 72 85 92 91 -1.1
Bedrooms 2 601 2 977 3 238 3 569 3 752 5.1
Bed-places 5 833 6 508 7 041 7 730 8 102 4.8
(1) Includes hotels, inns, motels and hostels
Source: PCBS - Hotel Survey
Number of hotel establishments1 and bed-places by region
Number of hotels Number of bed-places
1996 1997 1998 % 98/96 1996 1997 1998 % 98/96
Total 72 85 92 27.8 6 508 7 041 7 730 18.8
North 3 5 6 100.0 117 140 178 52.1
Middle 10 12 13 30.0 273 404 479 75.9
Jerusalem 39 44 48 23.1 4 475 4 464 4 857 8.5
South 13 16 16 23.1 1 274 1 589 1 653 29.8
Gaza Strip 7 8 9 28.6 370 443 559 51.2
(1) Includes hotels, inns, motels and hostels
Source: PCBS - Hotel Survey
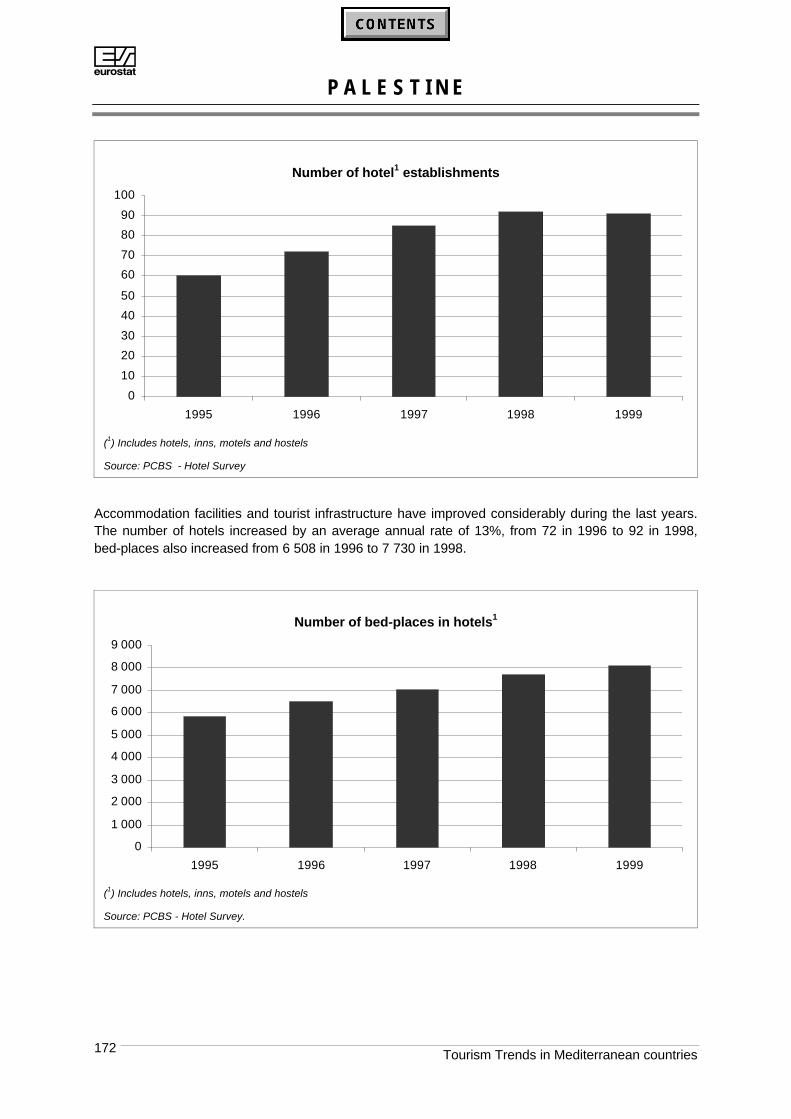
AP A L E S T I N E
Tourism Trends in Mediterranean countries172
Number of hotel1 establishments
0
10
20
30
40
50
60
70
80
90
100
1995 1996 1997 1998 1999
(1) Includes hotels, inns, motels and hostels
Source: PCBS - Hotel Survey
Accommodation facilities and tourist infrastructure have improved considerably during the last years.The number of hotels increased by an average annual rate of 13%, from 72 in 1996 to 92 in 1998,bed-places also increased from 6 508 in 1996 to 7 730 in 1998.
Number of bed-places in hotels1
0
1 000
2 000
3 000
4 000
5 000
6 000
7 000
8 000
9 000
1995 1996 1997 1998 1999
(1) Includes hotels, inns, motels and hostels
Source: PCBS - Hotel Survey.
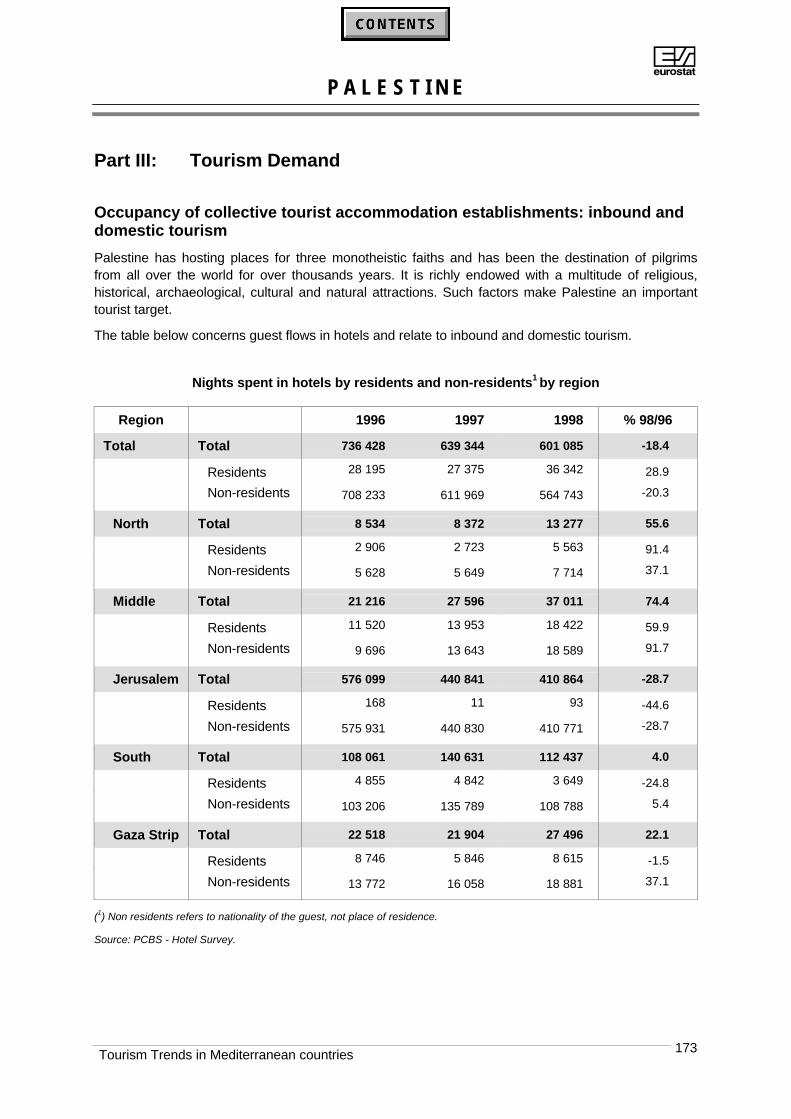
AP A L E S T I N E
Tourism Trends in Mediterranean countries 173
Part III: Tourism Demand
Occupancy of collective tourist accommodation establishments: inbound anddomestic tourism
Palestine has hosting places for three monotheistic faiths and has been the destination of pilgrimsfrom all over the world for over thousands years. It is richly endowed with a multitude of religious,historical, archaeological, cultural and natural attractions. Such factors make Palestine an importanttourist target.
The table below concerns guest flows in hotels and relate to inbound and domestic tourism.
Nights spent in hotels by residents and non-residents1 by region
Region 1996 1997 1998 % 98/96
Total Total 736 428 639 344 601 085 -18.4
Residents 28 195 27 375 36 342 28.9
Non-residents 708 233 611 969 564 743 -20.3
North Total 8 534 8 372 13 277 55.6
Residents 2 906 2 723 5 563 91.4
Non-residents 5 628 5 649 7 714 37.1
Middle Total 21 216 27 596 37 011 74.4
Residents 11 520 13 953 18 422 59.9
Non-residents 9 696 13 643 18 589 91.7
Jerusalem Total 576 099 440 841 410 864 -28.7
Residents 168 11 93 -44.6
Non-residents 575 931 440 830 410 771 -28.7
South Total 108 061 140 631 112 437 4.0
Residents 4 855 4 842 3 649 -24.8
Non-residents 103 206 135 789 108 788 5.4
Gaza Strip Total 22 518 21 904 27 496 22.1
Residents 8 746 5 846 8 615 -1.5
Non-residents 13 772 16 058 18 881 37.1
(1) Non residents refers to nationality of the guest, not place of residence.
Source: PCBS - Hotel Survey.
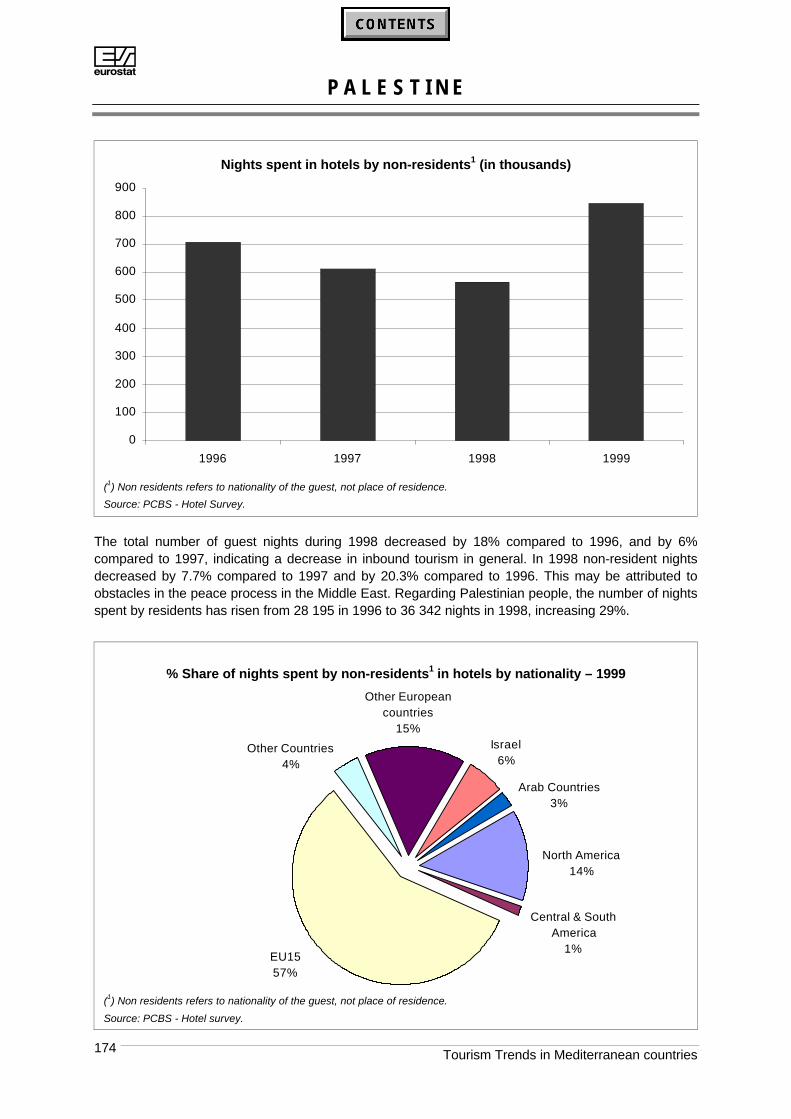
AP A L E S T I N E
Tourism Trends in Mediterranean countries174
Nights spent in hotels by non-residents1 (in thousands)
0
100
200
300
400
500
600
700
800
900
1996 1997 1998 1999
(1) Non residents refers to nationality of the guest, not place of residence.
Source: PCBS - Hotel Survey.
The total number of guest nights during 1998 decreased by 18% compared to 1996, and by 6%compared to 1997, indicating a decrease in inbound tourism in general. In 1998 non-resident nightsdecreased by 7.7% compared to 1997 and by 20.3% compared to 1996. This may be attributed toobstacles in the peace process in the Middle East. Regarding Palestinian people, the number of nightsspent by residents has risen from 28 195 in 1996 to 36 342 nights in 1998, increasing 29%.
% Share of nights spent by non-residents1 in hotels by nationality – 1999
Other European countries
15%
Other Countries4%
EU1557%
Israel6%
North America14%
Arab Countries3%
Central & South America
1%
(1) Non residents refers to nationality of the guest, not place of residence.
Source: PCBS - Hotel survey.
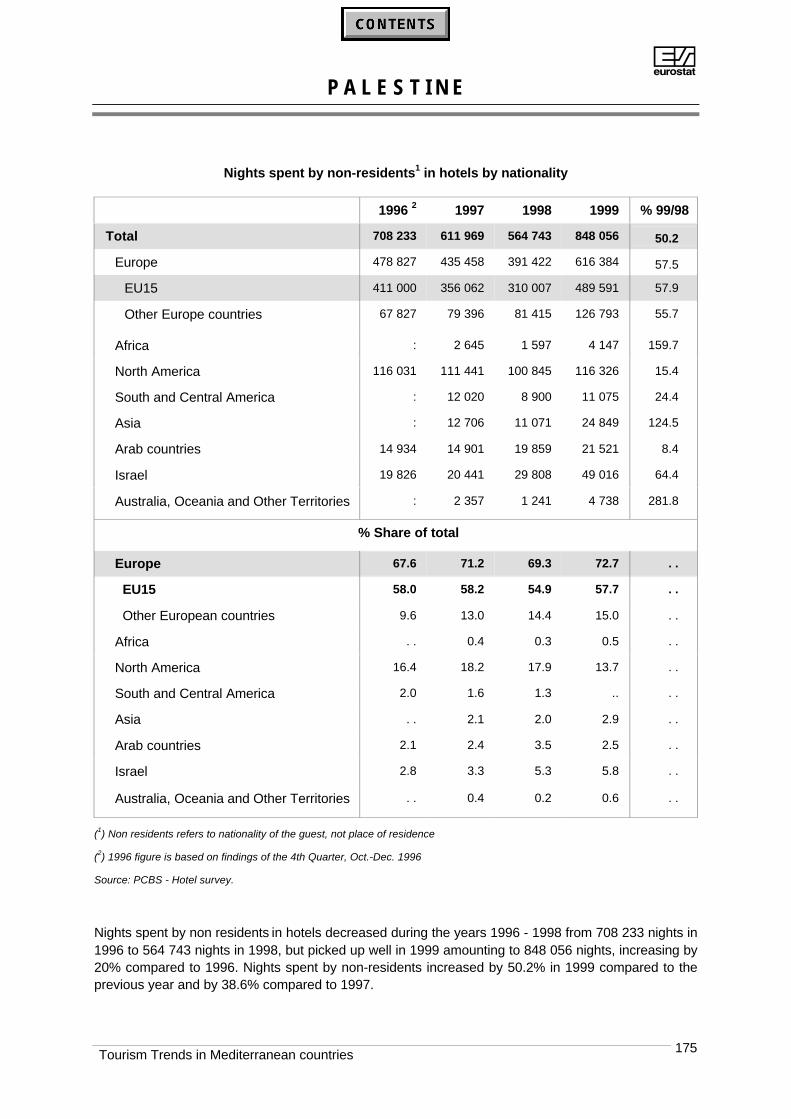
AP A L E S T I N E
Tourism Trends in Mediterranean countries 175
Nights spent by non-residents1 in hotels by nationality
1996 2 1997 1998 1999 % 99/98
Total 708 233 611 969 564 743 848 056 50.2
Europe 478 827 435 458 391 422 616 384 57.5
EU15 411 000 356 062 310 007 489 591 57.9
Other Europe countries 67 827 79 396 81 415 126 793 55.7
Africa : 2 645 1 597 4 147 159.7
North America 116 031 111 441 100 845 116 326 15.4
South and Central America : 12 020 8 900 11 075 24.4
Asia : 12 706 11 071 24 849 124.5
Arab countries 14 934 14 901 19 859 21 521 8.4
Israel 19 826 20 441 29 808 49 016 64.4
Australia, Oceania and Other Territories : 2 357 1 241 4 738 281.8
% Share of total
Europe 67.6 71.2 69.3 72.7 . .
EU15 58.0 58.2 54.9 57.7 . .
Other European countries 9.6 13.0 14.4 15.0 . .
Africa . . 0.4 0.3 0.5 . .
North America 16.4 18.2 17.9 13.7 . .
South and Central America 2.0 1.6 1.3 .. . .
Asia . . 2.1 2.0 2.9 . .
Arab countries 2.1 2.4 3.5 2.5 . .
Israel 2.8 3.3 5.3 5.8 . .
Australia, Oceania and Other Territories . . 0.4 0.2 0.6 . .
(1) Non residents refers to nationality of the guest, not place of residence
(2) 1996 figure is based on findings of the 4th Quarter, Oct.-Dec. 1996
Source: PCBS - Hotel survey.
Nights spent by non residents in hotels decreased during the years 1996 - 1998 from 708 233 nights in1996 to 564 743 nights in 1998, but picked up well in 1999 amounting to 848 056 nights, increasing by20% compared to 1996. Nights spent by non-residents increased by 50.2% in 1999 compared to theprevious year and by 38.6% compared to 1997.
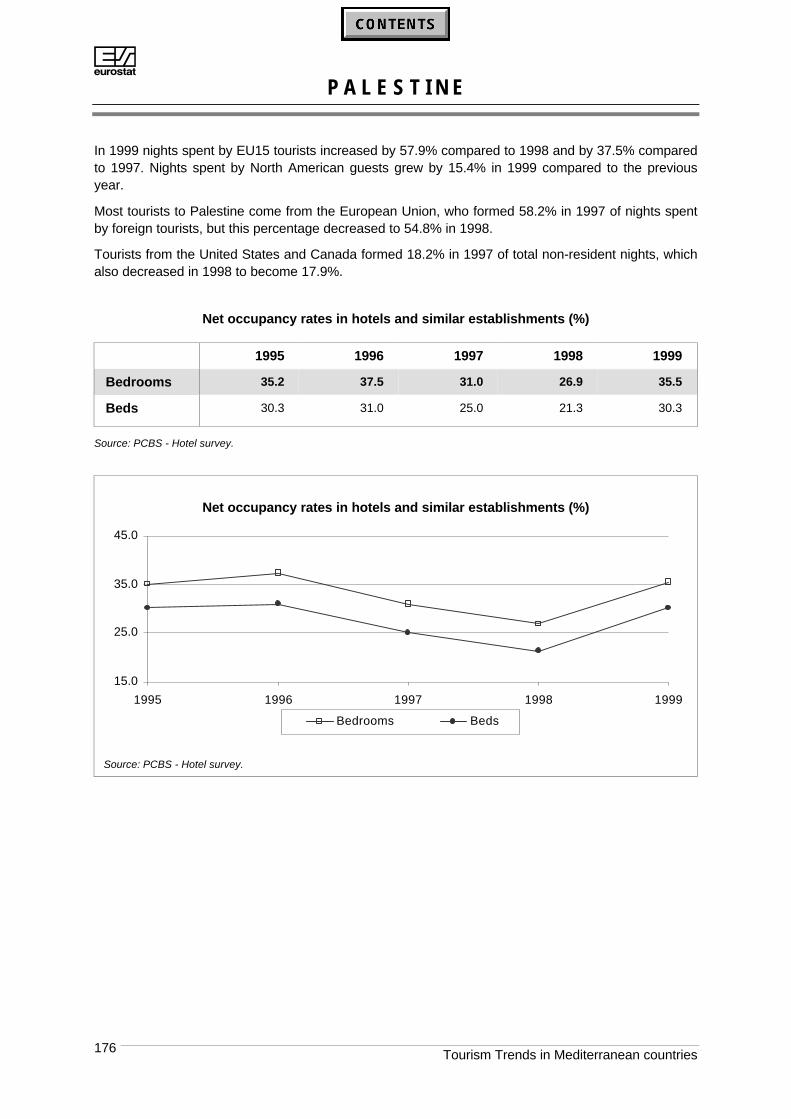
AP A L E S T I N E
Tourism Trends in Mediterranean countries176
In 1999 nights spent by EU15 tourists increased by 57.9% compared to 1998 and by 37.5% comparedto 1997. Nights spent by North American guests grew by 15.4% in 1999 compared to the previousyear.
Most tourists to Palestine come from the European Union, who formed 58.2% in 1997 of nights spentby foreign tourists, but this percentage decreased to 54.8% in 1998.
Tourists from the United States and Canada formed 18.2% in 1997 of total non-resident nights, whichalso decreased in 1998 to become 17.9%.
Net occupancy rates in hotels and similar establishments (%)
1995 1996 1997 1998 1999
Bedrooms 35.2 37.5 31.0 26.9 35.5
Beds 30.3 31.0 25.0 21.3 30.3
Source: PCBS - Hotel survey.
Net occupancy rates in hotels and similar establishments (%)
15.0
25.0
35.0
45.0
1995 1996 1997 1998 1999
Bedrooms Beds
Source: PCBS - Hotel survey.
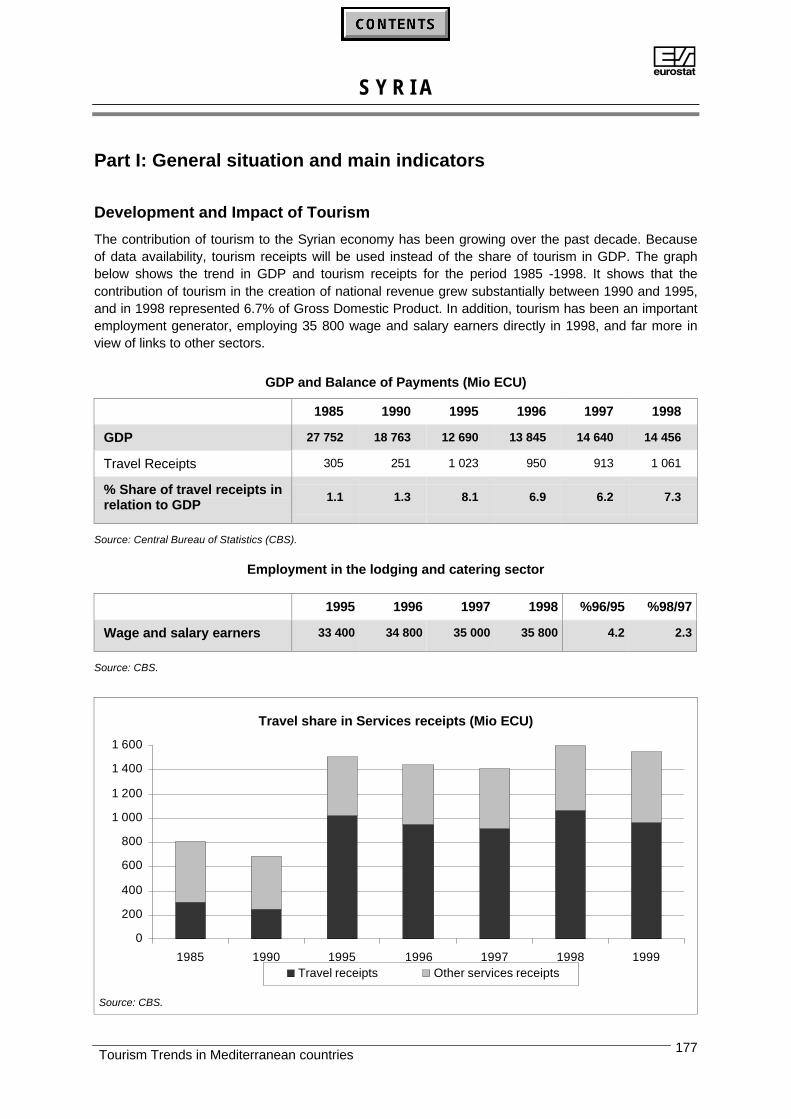
AS Y R I A
Tourism Trends in Mediterranean countries 177
Part I: General situation and main indicators
Development and Impact of Tourism
The contribution of tourism to the Syrian economy has been growing over the past decade. Becauseof data availability, tourism receipts will be used instead of the share of tourism in GDP. The graphbelow shows the trend in GDP and tourism receipts for the period 1985 -1998. It shows that thecontribution of tourism in the creation of national revenue grew substantially between 1990 and 1995,and in 1998 represented 6.7% of Gross Domestic Product. In addition, tourism has been an importantemployment generator, employing 35 800 wage and salary earners directly in 1998, and far more inview of links to other sectors.
GDP and Balance of Payments (Mio ECU)
1985 1990 1995 1996 1997 1998
GDP 27 752 18 763 12 690 13 845 14 640 14 456
Travel Receipts 305 251 1 023 950 913 1 061
% Share of travel receipts inrelation to GDP
1.1 1.3 8.1 6.9 6.2 7.3
Source: Central Bureau of Statistics (CBS).
Employment in the lodging and catering sector
1995 1996 1997 1998 %96/95 %98/97
Wage and salary earners 33 400 34 800 35 000 35 800 4.2 2.3
Source: CBS.
Travel share in Services receipts (Mio ECU)
0
200
400
600
800
1 000
1 200
1 400
1 600
1985 1990 1995 1996 1997 1998 1999Travel receipts Other services receipts
Source: CBS.
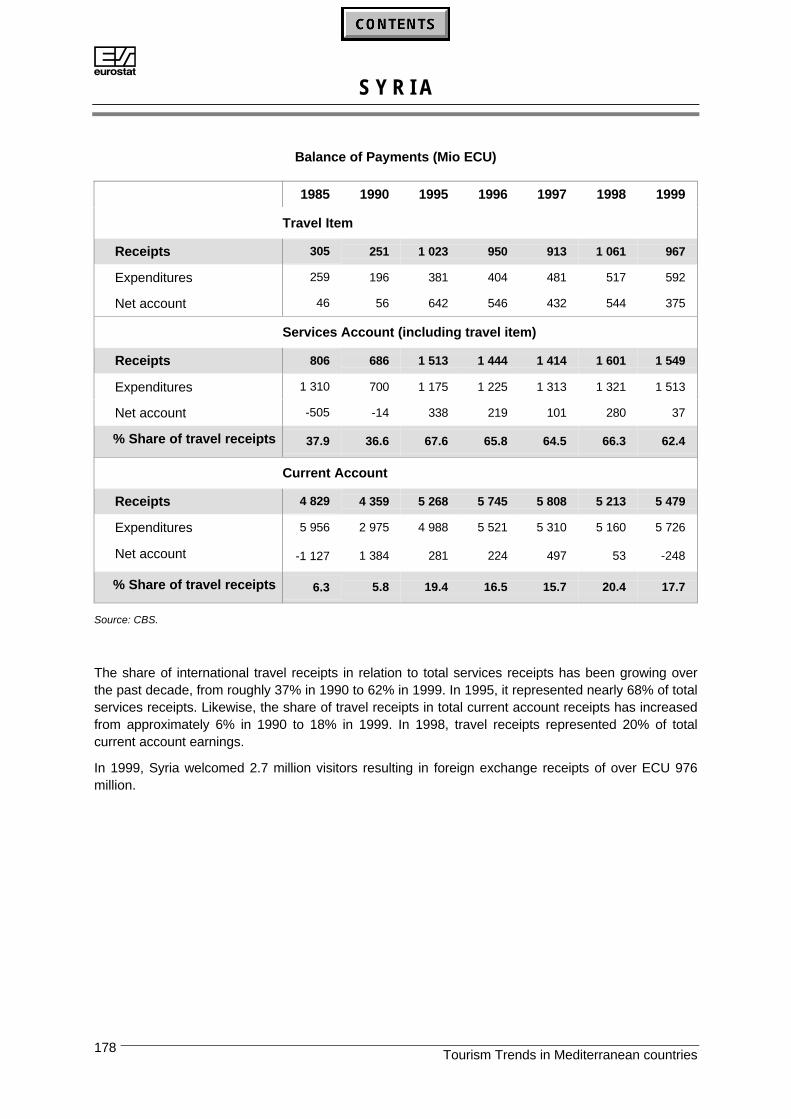
AS Y R I A
Tourism Trends in Mediterranean countries178
Balance of Payments (Mio ECU)
1985 1990 1995 1996 1997 1998 1999
Travel Item
Receipts 305 251 1 023 950 913 1 061 967
Expenditures 259 196 381 404 481 517 592
Net account 46 56 642 546 432 544 375
Services Account (including travel item)
Receipts 806 686 1 513 1 444 1 414 1 601 1 549
Expenditures 1 310 700 1 175 1 225 1 313 1 321 1 513
Net account -505 -14 338 219 101 280 37
% Share of travel receipts 37.9 36.6 67.6 65.8 64.5 66.3 62.4
Current Account
Receipts 4 829 4 359 5 268 5 745 5 808 5 213 5 479
Expenditures 5 956 2 975 4 988 5 521 5 310 5 160 5 726
Net account -1 127 1 384 281 224 497 53 -248
% Share of travel receipts 6.3 5.8 19.4 16.5 15.7 20.4 17.7
Source: CBS.
The share of international travel receipts in relation to total services receipts has been growing overthe past decade, from roughly 37% in 1990 to 62% in 1999. In 1995, it represented nearly 68% of totalservices receipts. Likewise, the share of travel receipts in total current account receipts has increasedfrom approximately 6% in 1990 to 18% in 1999. In 1998, travel receipts represented 20% of totalcurrent account earnings.
In 1999, Syria welcomed 2.7 million visitors resulting in foreign exchange receipts of over ECU 976million.
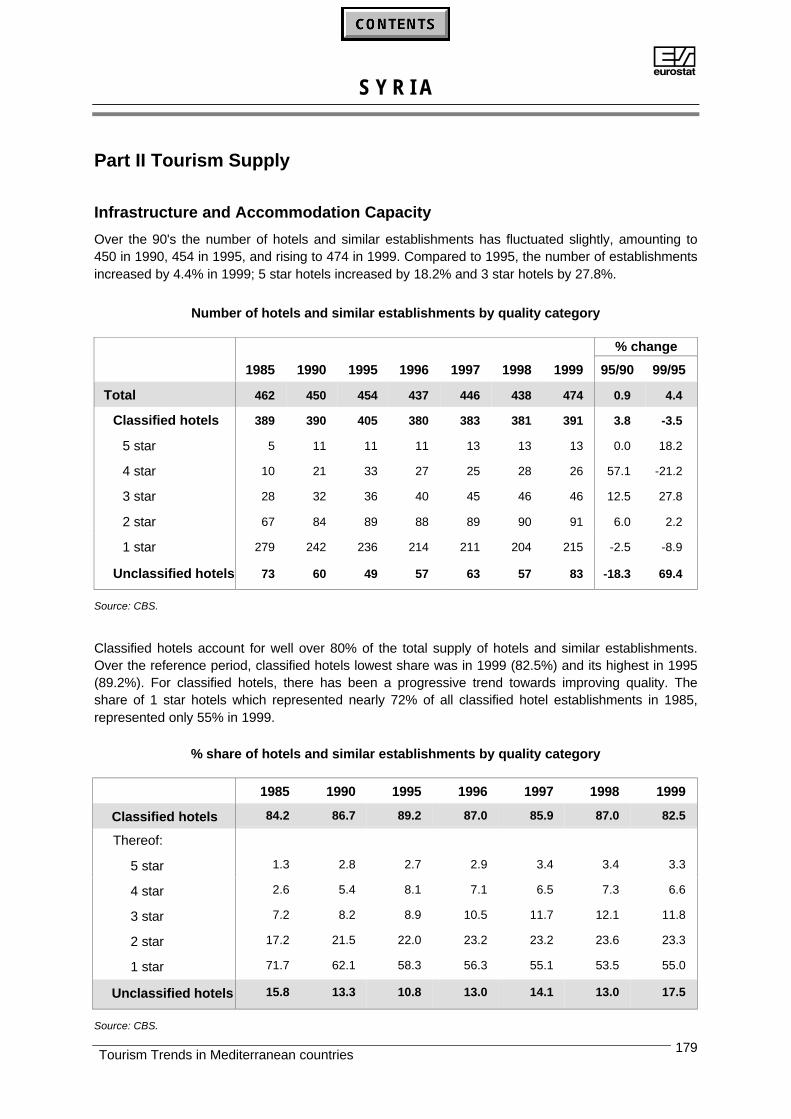
AS Y R I A
Tourism Trends in Mediterranean countries 179
Part II Tourism Supply
Infrastructure and Accommodation Capacity
Over the 90's the number of hotels and similar establishments has fluctuated slightly, amounting to450 in 1990, 454 in 1995, and rising to 474 in 1999. Compared to 1995, the number of establishmentsincreased by 4.4% in 1999; 5 star hotels increased by 18.2% and 3 star hotels by 27.8%.
Number of hotels and similar establishments by quality category
% change
1985 1990 1995 1996 1997 1998 1999 95/90 99/95
Total 462 450 454 437 446 438 474 0.9 4.4
Classified hotels 389 390 405 380 383 381 391 3.8 -3.5
5 star 5 11 11 11 13 13 13 0.0 18.2
4 star 10 21 33 27 25 28 26 57.1 -21.2
3 star 28 32 36 40 45 46 46 12.5 27.8
2 star 67 84 89 88 89 90 91 6.0 2.2
1 star 279 242 236 214 211 204 215 -2.5 -8.9
Unclassified hotels 73 60 49 57 63 57 83 -18.3 69.4
Source: CBS.
Classified hotels account for well over 80% of the total supply of hotels and similar establishments.Over the reference period, classified hotels lowest share was in 1999 (82.5%) and its highest in 1995(89.2%). For classified hotels, there has been a progressive trend towards improving quality. Theshare of 1 star hotels which represented nearly 72% of all classified hotel establishments in 1985,represented only 55% in 1999.
% share of hotels and similar establishments by quality category
1985 1990 1995 1996 1997 1998 1999
Classified hotels 84.2 86.7 89.2 87.0 85.9 87.0 82.5
Thereof:
5 star 1.3 2.8 2.7 2.9 3.4 3.4 3.3
4 star 2.6 5.4 8.1 7.1 6.5 7.3 6.6
3 star 7.2 8.2 8.9 10.5 11.7 12.1 11.8
2 star 17.2 21.5 22.0 23.2 23.2 23.6 23.3
1 star 71.7 62.1 58.3 56.3 55.1 53.5 55.0
Unclassified hotels 15.8 13.3 10.8 13.0 14.1 13.0 17.5
Source: CBS.
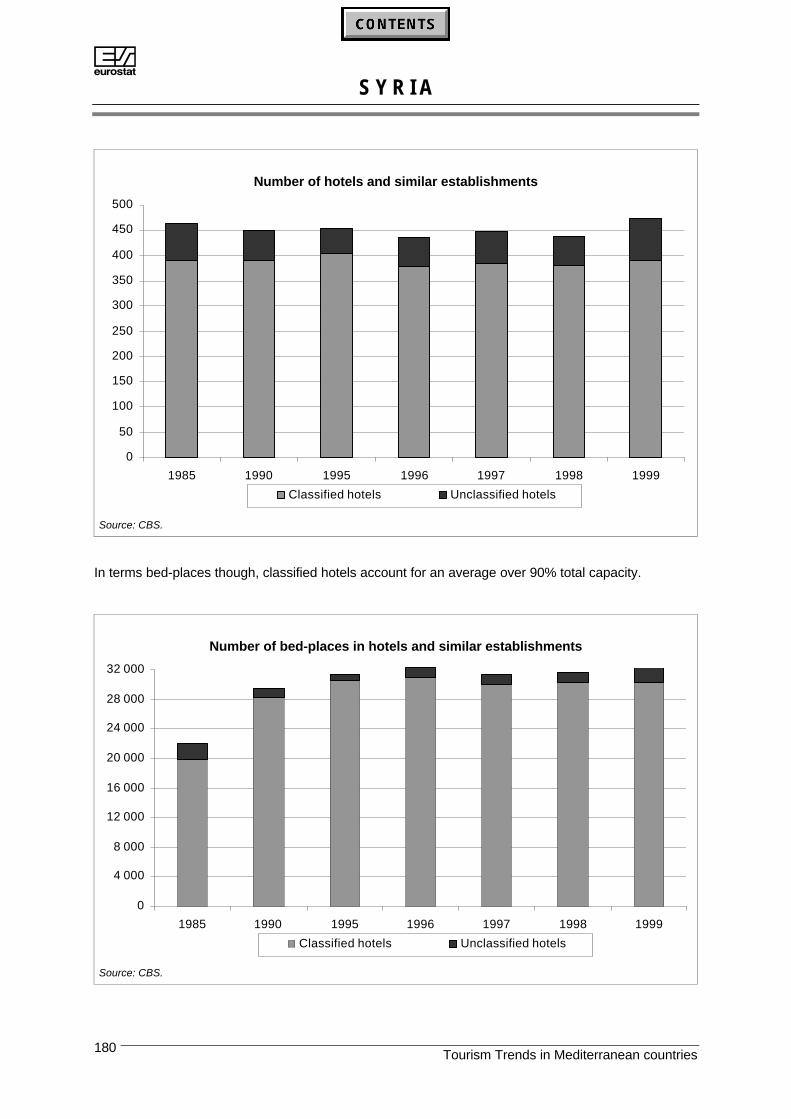
AS Y R I A
Tourism Trends in Mediterranean countries180
Number of hotels and similar establishments
0
50
100
150
200
250
300
350
400
450
500
1985 1990 1995 1996 1997 1998 1999
Classified hotels Unclassified hotels
Source: CBS.
In terms bed-places though, classified hotels account for an average over 90% total capacity.
Number of bed-places in hotels and similar establishments
0
4 000
8 000
12 000
16 000
20 000
24 000
28 000
32 000
1985 1990 1995 1996 1997 1998 1999
Classified hotels Unclassified hotels
Source: CBS.
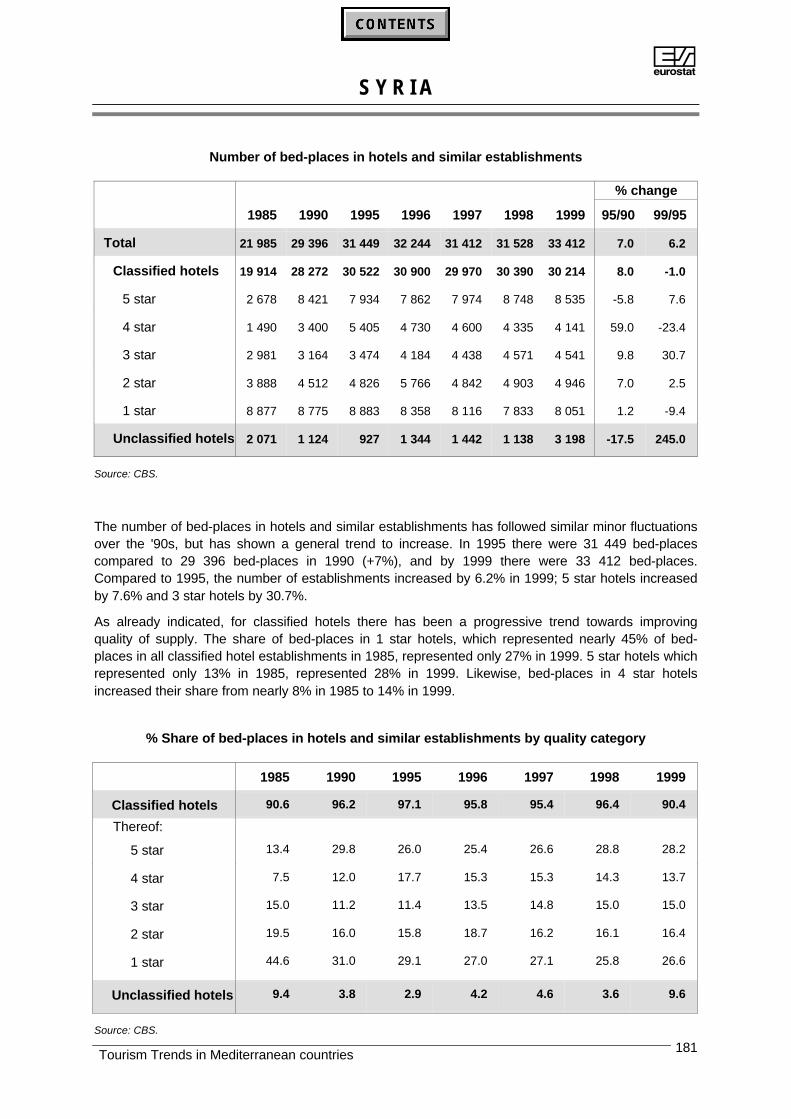
AS Y R I A
Tourism Trends in Mediterranean countries 181
Number of bed-places in hotels and similar establishments
% change
1985 1990 1995 1996 1997 1998 1999 95/90 99/95
Total 21 985 29 396 31 449 32 244 31 412 31 528 33 412 7.0 6.2
Classified hotels 19 914 28 272 30 522 30 900 29 970 30 390 30 214 8.0 -1.0
5 star 2 678 8 421 7 934 7 862 7 974 8 748 8 535 -5.8 7.6
4 star 1 490 3 400 5 405 4 730 4 600 4 335 4 141 59.0 -23.4
3 star 2 981 3 164 3 474 4 184 4 438 4 571 4 541 9.8 30.7
2 star 3 888 4 512 4 826 5 766 4 842 4 903 4 946 7.0 2.5
1 star 8 877 8 775 8 883 8 358 8 116 7 833 8 051 1.2 -9.4
Unclassified hotels 2 071 1 124 927 1 344 1 442 1 138 3 198 -17.5 245.0
Source: CBS.
The number of bed-places in hotels and similar establishments has followed similar minor fluctuationsover the '90s, but has shown a general trend to increase. In 1995 there were 31 449 bed-placescompared to 29 396 bed-places in 1990 (+7%), and by 1999 there were 33 412 bed-places.Compared to 1995, the number of establishments increased by 6.2% in 1999; 5 star hotels increasedby 7.6% and 3 star hotels by 30.7%.
As already indicated, for classified hotels there has been a progressive trend towards improvingquality of supply. The share of bed-places in 1 star hotels, which represented nearly 45% of bed-places in all classified hotel establishments in 1985, represented only 27% in 1999. 5 star hotels whichrepresented only 13% in 1985, represented 28% in 1999. Likewise, bed-places in 4 star hotelsincreased their share from nearly 8% in 1985 to 14% in 1999.
% Share of bed-places in hotels and similar establishments by quality category
1985 1990 1995 1996 1997 1998 1999
Classified hotels 90.6 96.2 97.1 95.8 95.4 96.4 90.4
Thereof:
5 star 13.4 29.8 26.0 25.4 26.6 28.8 28.2
4 star 7.5 12.0 17.7 15.3 15.3 14.3 13.7
3 star 15.0 11.2 11.4 13.5 14.8 15.0 15.0
2 star 19.5 16.0 15.8 18.7 16.2 16.1 16.4
1 star 44.6 31.0 29.1 27.0 27.1 25.8 26.6
Unclassified hotels 9.4 3.8 2.9 4.2 4.6 3.6 9.6
Source: CBS.
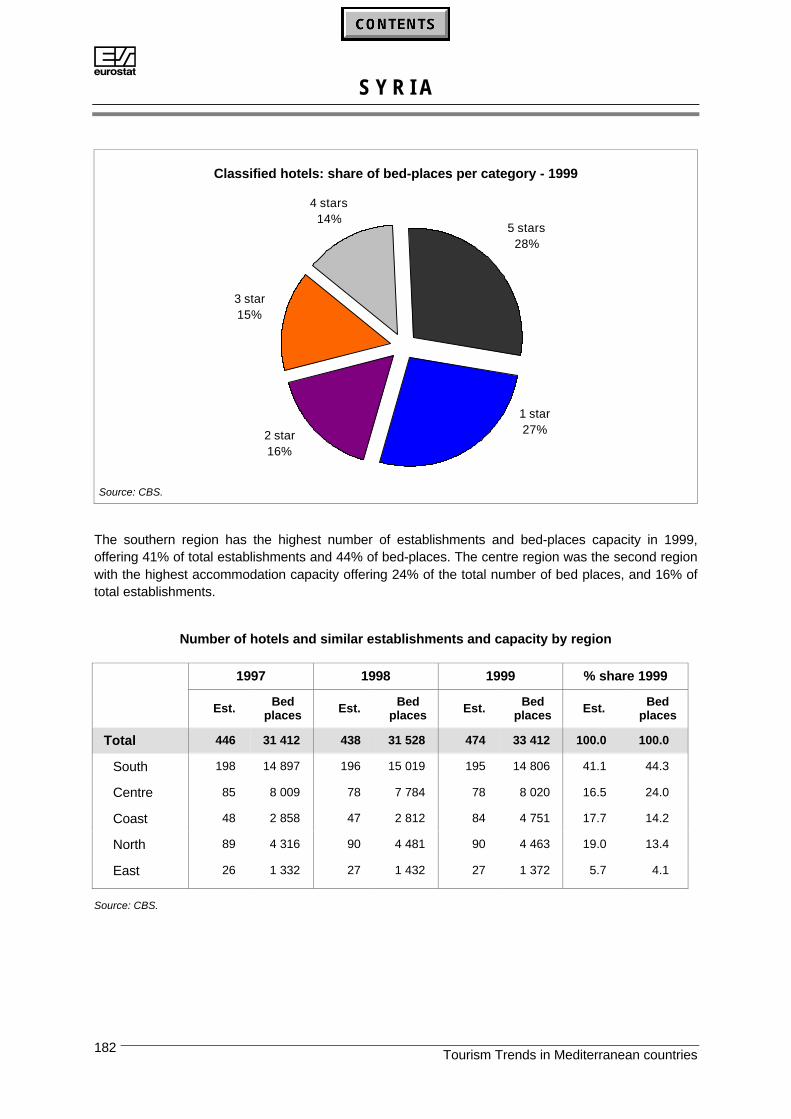
AS Y R I A
Tourism Trends in Mediterranean countries182
Classified hotels: share of bed-places per category - 1999
1 star27%
5 stars28%
4 stars14%
3 star15%
2 star16%
Source: CBS.
The southern region has the highest number of establishments and bed-places capacity in 1999,offering 41% of total establishments and 44% of bed-places. The centre region was the second regionwith the highest accommodation capacity offering 24% of the total number of bed places, and 16% oftotal establishments.
Number of hotels and similar establishments and capacity by region
1997 1998 1999 % share 1999
Est. Bedplaces Est. Bed
places Est. Bedplaces Est. Bed
places
Total 446 31 412 438 31 528 474 33 412 100.0 100.0
South 198 14 897 196 15 019 195 14 806 41.1 44.3
Centre 85 8 009 78 7 784 78 8 020 16.5 24.0
Coast 48 2 858 47 2 812 84 4 751 17.7 14.2
North 89 4 316 90 4 481 90 4 463 19.0 13.4
East 26 1 332 27 1 432 27 1 372 5.7 4.1
Source: CBS.
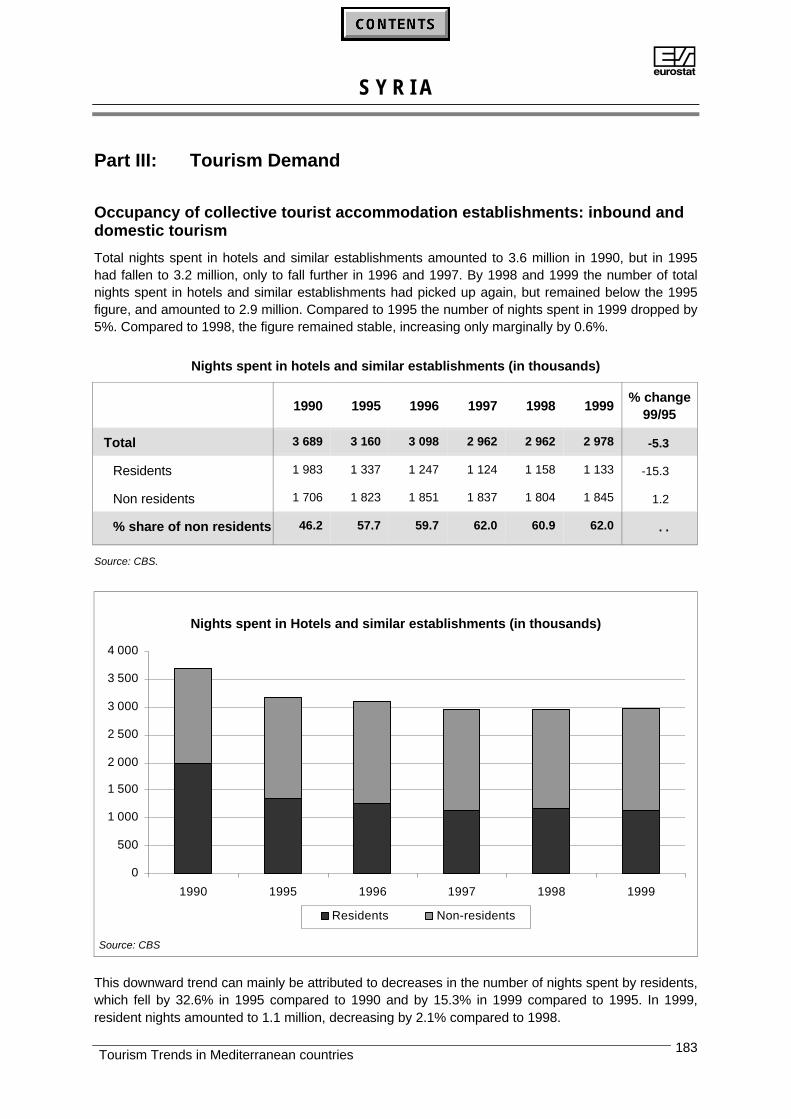
AS Y R I A
Tourism Trends in Mediterranean countries 183
Part III: Tourism Demand
Occupancy of collective tourist accommodation establishments: inbound anddomestic tourism
Total nights spent in hotels and similar establishments amounted to 3.6 million in 1990, but in 1995had fallen to 3.2 million, only to fall further in 1996 and 1997. By 1998 and 1999 the number of totalnights spent in hotels and similar establishments had picked up again, but remained below the 1995figure, and amounted to 2.9 million. Compared to 1995 the number of nights spent in 1999 dropped by5%. Compared to 1998, the figure remained stable, increasing only marginally by 0.6%.
Nights spent in hotels and similar establishments (in thousands)
1990 1995 1996 1997 1998 1999% change
99/95
Total 3 689 3 160 3 098 2 962 2 962 2 978 -5.3
Residents 1 983 1 337 1 247 1 124 1 158 1 133 -15.3
Non residents 1 706 1 823 1 851 1 837 1 804 1 845 1.2
% share of non residents 46.2 57.7 59.7 62.0 60.9 62.0 . .
Source: CBS.
Nights spent in Hotels and similar establishments (in thousands)
0
500
1 000
1 500
2 000
2 500
3 000
3 500
4 000
1990 1995 1996 1997 1998 1999
Residents Non-residents
Source: CBS
This downward trend can mainly be attributed to decreases in the number of nights spent by residents,which fell by 32.6% in 1995 compared to 1990 and by 15.3% in 1999 compared to 1995. In 1999,resident nights amounted to 1.1 million, decreasing by 2.1% compared to 1998.
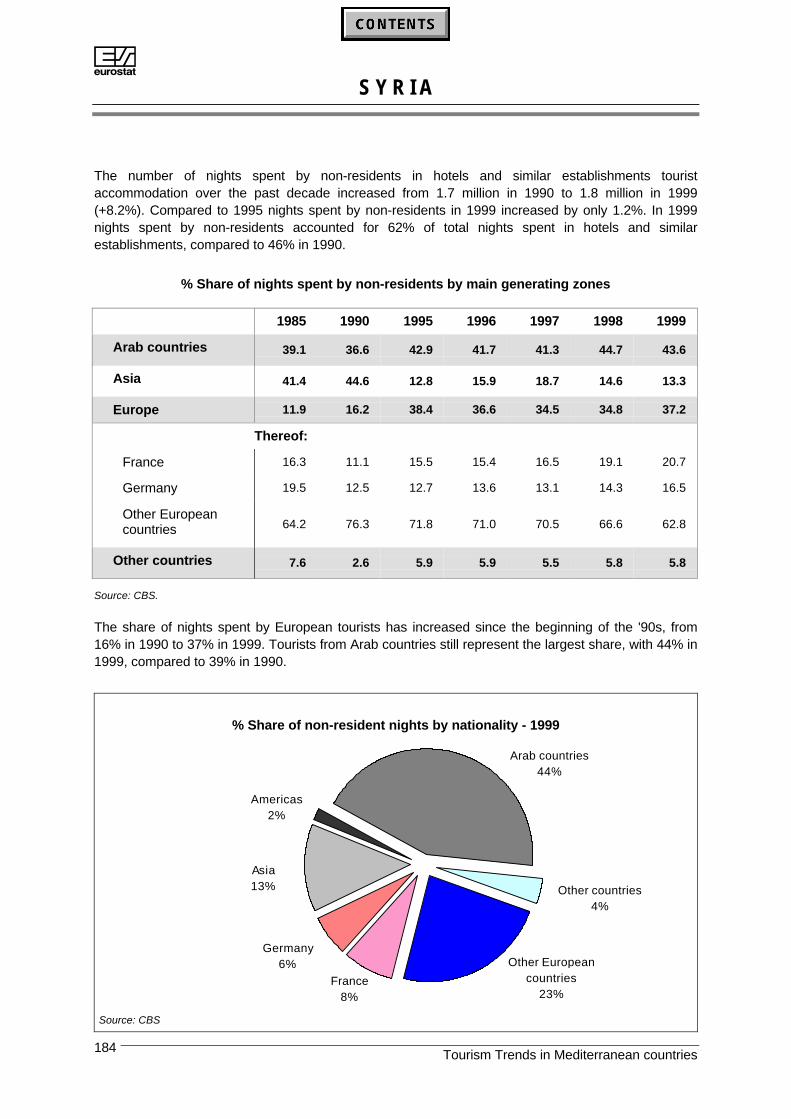
AS Y R I A
Tourism Trends in Mediterranean countries184
The number of nights spent by non-residents in hotels and similar establishments touristaccommodation over the past decade increased from 1.7 million in 1990 to 1.8 million in 1999(+8.2%). Compared to 1995 nights spent by non-residents in 1999 increased by only 1.2%. In 1999nights spent by non-residents accounted for 62% of total nights spent in hotels and similarestablishments, compared to 46% in 1990.
% Share of nights spent by non-residents by main generating zones
1985 1990 1995 1996 1997 1998 1999
Arab countries 39.1 36.6 42.9 41.7 41.3 44.7 43.6
Asia 41.4 44.6 12.8 15.9 18.7 14.6 13.3
Europe 11.9 16.2 38.4 36.6 34.5 34.8 37.2
Thereof:
France 16.3 11.1 15.5 15.4 16.5 19.1 20.7
Germany 19.5 12.5 12.7 13.6 13.1 14.3 16.5
Other Europeancountries 64.2 76.3 71.8 71.0 70.5 66.6 62.8
Other countries 7.6 2.6 5.9 5.9 5.5 5.8 5.8
Source: CBS.
The share of nights spent by European tourists has increased since the beginning of the '90s, from16% in 1990 to 37% in 1999. Tourists from Arab countries still represent the largest share, with 44% in1999, compared to 39% in 1990.
% Share of non-resident nights by nationality - 1999
Other European countries
23%
Other countries4%
Arab countries44%
Americas2%
Asia13%
Germany6%
France8%
Source: CBS
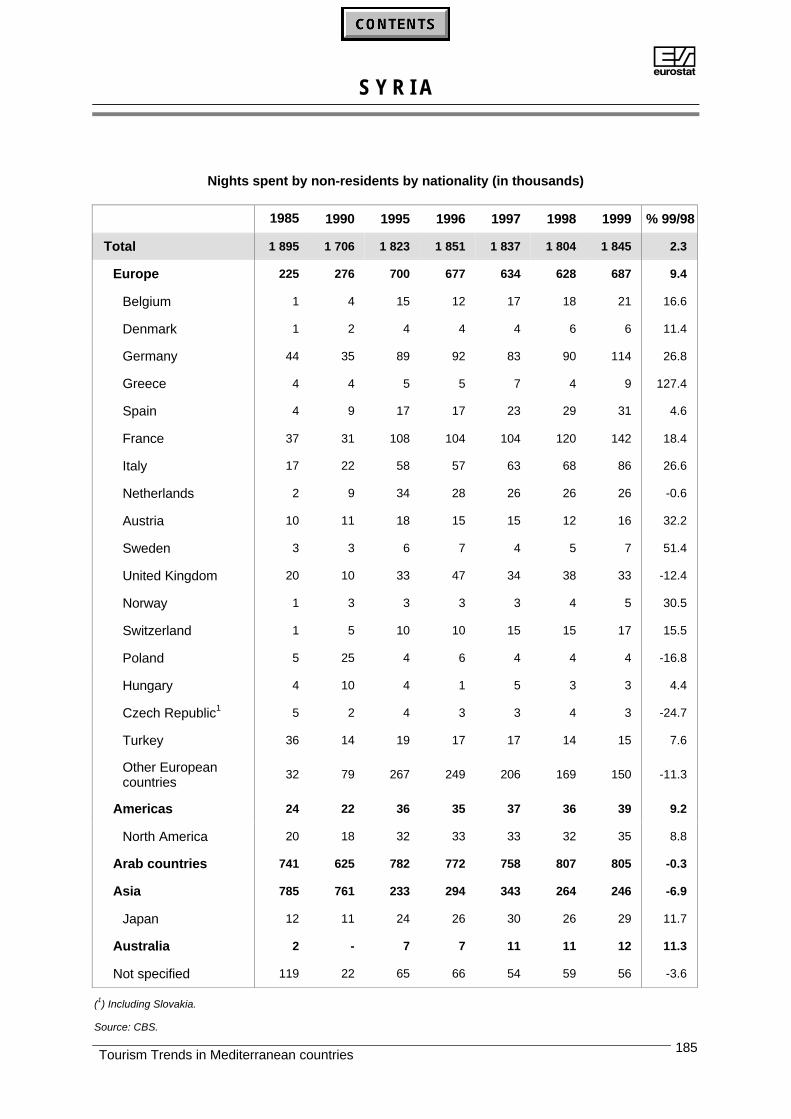
AS Y R I A
Tourism Trends in Mediterranean countries 185
Nights spent by non-residents by nationality (in thousands)
1985 1990 1995 1996 1997 1998 1999 % 99/98
Total 1 895 1 706 1 823 1 851 1 837 1 804 1 845 2.3
Europe 225 276 700 677 634 628 687 9.4
Belgium 1 4 15 12 17 18 21 16.6
Denmark 1 2 4 4 4 6 6 11.4
Germany 44 35 89 92 83 90 114 26.8
Greece 4 4 5 5 7 4 9 127.4
Spain 4 9 17 17 23 29 31 4.6
France 37 31 108 104 104 120 142 18.4
Italy 17 22 58 57 63 68 86 26.6
Netherlands 2 9 34 28 26 26 26 -0.6
Austria 10 11 18 15 15 12 16 32.2
Sweden 3 3 6 7 4 5 7 51.4
United Kingdom 20 10 33 47 34 38 33 -12.4
Norway 1 3 3 3 3 4 5 30.5
Switzerland 1 5 10 10 15 15 17 15.5
Poland 5 25 4 6 4 4 4 -16.8
Hungary 4 10 4 1 5 3 3 4.4
Czech Republic1 5 2 4 3 3 4 3 -24.7
Turkey 36 14 19 17 17 14 15 7.6
Other Europeancountries
32 79 267 249 206 169 150 -11.3
Americas 24 22 36 35 37 36 39 9.2
North America 20 18 32 33 33 32 35 8.8
Arab countries 741 625 782 772 758 807 805 -0.3
Asia 785 761 233 294 343 264 246 -6.9
Japan 12 11 24 26 30 26 29 11.7
Australia 2 - 7 7 11 11 12 11.3
Not specified 119 22 65 66 54 59 56 -3.6
(1) Including Slovakia.
Source: CBS.
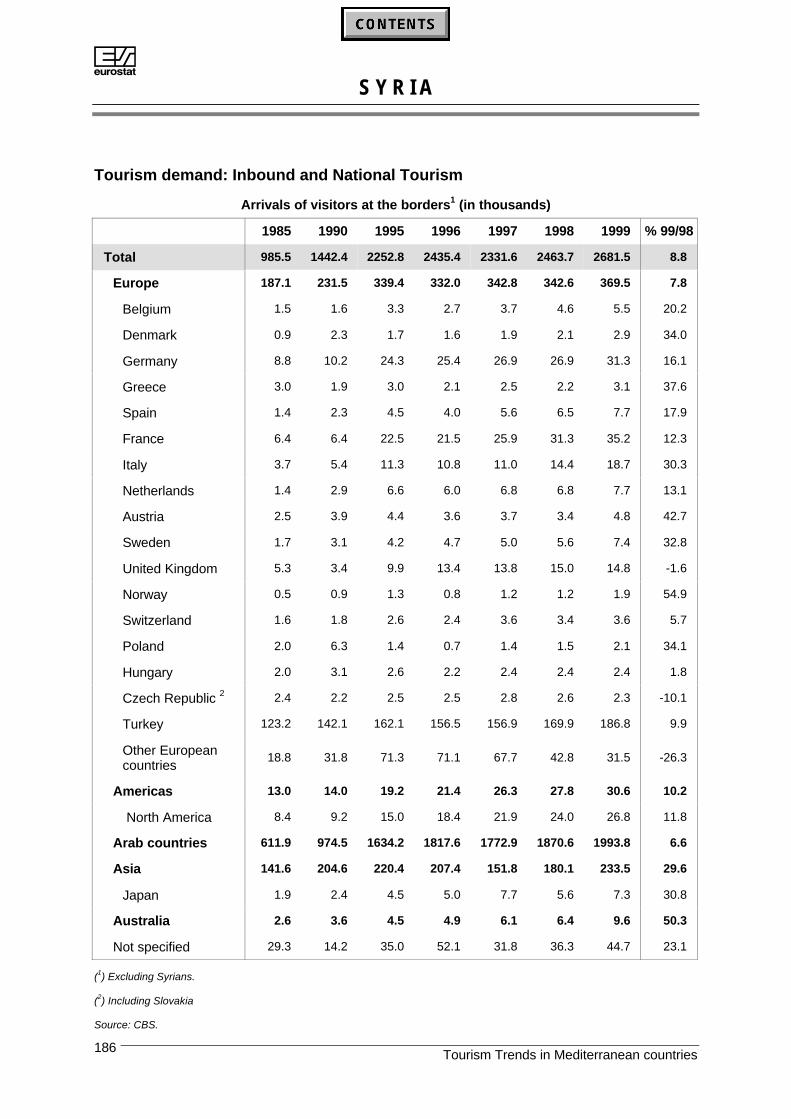
AS Y R I A
Tourism Trends in Mediterranean countries186
Tourism demand: Inbound and National Tourism
Arrivals of visitors at the borders1 (in thousands)
1985 1990 1995 1996 1997 1998 1999 % 99/98
Total 985.5 1442.4 2252.8 2435.4 2331.6 2463.7 2681.5 8.8
Europe 187.1 231.5 339.4 332.0 342.8 342.6 369.5 7.8
Belgium 1.5 1.6 3.3 2.7 3.7 4.6 5.5 20.2
Denmark 0.9 2.3 1.7 1.6 1.9 2.1 2.9 34.0
Germany 8.8 10.2 24.3 25.4 26.9 26.9 31.3 16.1
Greece 3.0 1.9 3.0 2.1 2.5 2.2 3.1 37.6
Spain 1.4 2.3 4.5 4.0 5.6 6.5 7.7 17.9
France 6.4 6.4 22.5 21.5 25.9 31.3 35.2 12.3
Italy 3.7 5.4 11.3 10.8 11.0 14.4 18.7 30.3
Netherlands 1.4 2.9 6.6 6.0 6.8 6.8 7.7 13.1
Austria 2.5 3.9 4.4 3.6 3.7 3.4 4.8 42.7
Sweden 1.7 3.1 4.2 4.7 5.0 5.6 7.4 32.8
United Kingdom 5.3 3.4 9.9 13.4 13.8 15.0 14.8 -1.6
Norway 0.5 0.9 1.3 0.8 1.2 1.2 1.9 54.9
Switzerland 1.6 1.8 2.6 2.4 3.6 3.4 3.6 5.7
Poland 2.0 6.3 1.4 0.7 1.4 1.5 2.1 34.1
Hungary 2.0 3.1 2.6 2.2 2.4 2.4 2.4 1.8
Czech Republic 2 2.4 2.2 2.5 2.5 2.8 2.6 2.3 -10.1
Turkey 123.2 142.1 162.1 156.5 156.9 169.9 186.8 9.9
Other Europeancountries
18.8 31.8 71.3 71.1 67.7 42.8 31.5 -26.3
Americas 13.0 14.0 19.2 21.4 26.3 27.8 30.6 10.2
North America 8.4 9.2 15.0 18.4 21.9 24.0 26.8 11.8
Arab countries 611.9 974.5 1634.2 1817.6 1772.9 1870.6 1993.8 6.6
Asia 141.6 204.6 220.4 207.4 151.8 180.1 233.5 29.6
Japan 1.9 2.4 4.5 5.0 7.7 5.6 7.3 30.8
Australia 2.6 3.6 4.5 4.9 6.1 6.4 9.6 50.3
Not specified 29.3 14.2 35.0 52.1 31.8 36.3 44.7 23.1
(1) Excluding Syrians.
(2) Including Slovakia
Source: CBS.

AS Y R I A
Tourism Trends in Mediterranean countries 187
Total arrivals of visitors significantly increased over the period 1985 to 1999. In 1985 there were 985.5thousand visitor arrivals at the borders, of which 486.6 thousand were tourists (overnight visitors). By1990, there were 1.4 million visitors of which 561.8 thousand were tourists. During the first half of the'90s the number of visitor arrivals continued to grow and peaked in 1996 at 2.4 million. In 1997 thenumber dropped to 2.3 million (-4%), but remained higher than the figure for 1995. Despite the drop innumbers in total visitor arrivals in 1997, tourist arrivals that year had increased by 7% compared to1996. In 1998 compared to the previous record year of 1996, arrivals of visitors increased by 1.2%and tourist arrivals by 7.2%. In 1999, Syria witnessed another record year with visitor arrivalsamounting to nearly 2.7 million and tourist arrivals to 916.2 thousand increasing respectively by 9%and 3%.
Arrivals at the borders (in thousands) and % share of tourists
34%36%38%34%36%
39%49%
0
500
1 000
1 500
2 000
2 500
3 000
1985 1990 1995 1996 1997 1998 1999
Visitors Tourists
Source: CBS.
The majority of visitors come from Arab countries: 74% in 1999 compared to 62% in 1985. In 1999,arrivals of visitors from Europe accounted for 14% of the total, compared to 19% in 1985. Arrivals fromAsian countries accounted for 9% in 1999 compared to 14% in 1985.
% Share of arrivals of visitors by main generating zones
1985 1990 1995 1996 1997 1998 1999
Arab countries 62.1 67.6 72.5 74.6 76.0 75.9 74.4
Asia 14.4 14.2 9.8 8.5 6.5 7.3 8.7
Europe 19.0 16.1 15.1 13.6 14.7 13.9 13.8
Other countries 4.6 2.2 2.6 3.2 2.8 2.9 3.2
Source: CBS.
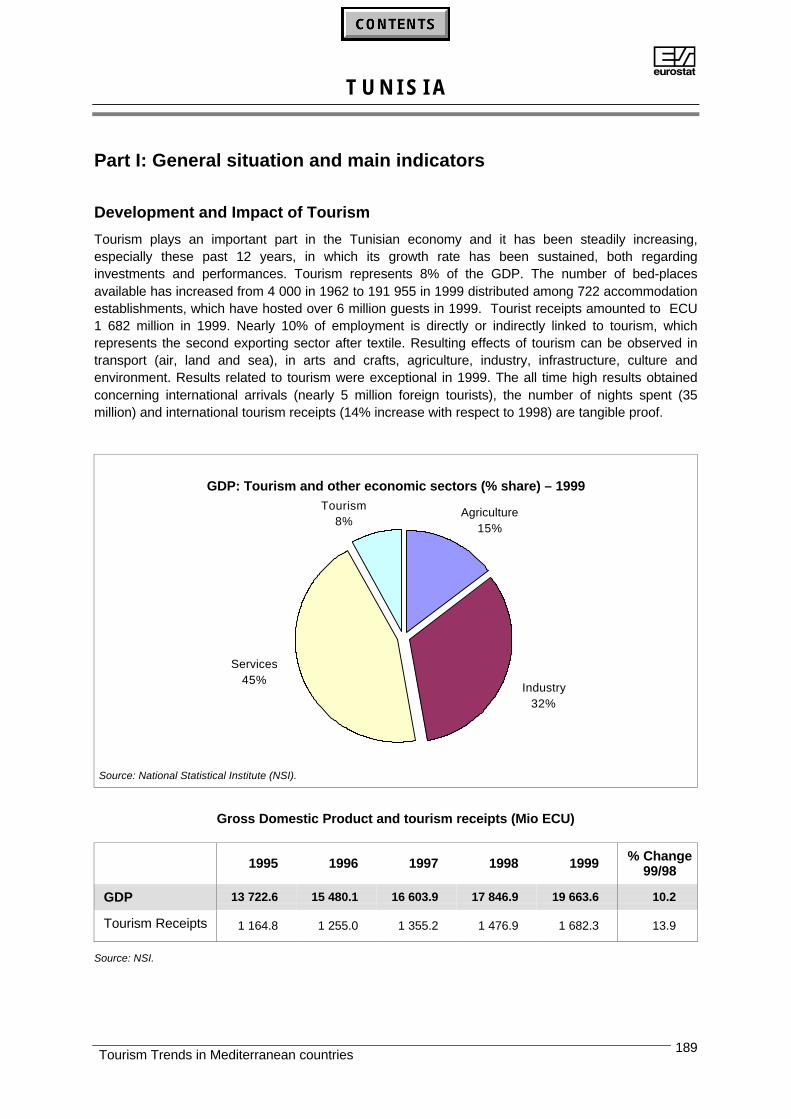
AT U N I S I A
Tourism Trends in Mediterranean countries 189
Part I: General situation and main indicators
Development and Impact of Tourism
Tourism plays an important part in the Tunisian economy and it has been steadily increasing,especially these past 12 years, in which its growth rate has been sustained, both regardinginvestments and performances. Tourism represents 8% of the GDP. The number of bed-placesavailable has increased from 4 000 in 1962 to 191 955 in 1999 distributed among 722 accommodationestablishments, which have hosted over 6 million guests in 1999. Tourist receipts amounted to ECU1 682 million in 1999. Nearly 10% of employment is directly or indirectly linked to tourism, whichrepresents the second exporting sector after textile. Resulting effects of tourism can be observed intransport (air, land and sea), in arts and crafts, agriculture, industry, infrastructure, culture andenvironment. Results related to tourism were exceptional in 1999. The all time high results obtainedconcerning international arrivals (nearly 5 million foreign tourists), the number of nights spent (35million) and international tourism receipts (14% increase with respect to 1998) are tangible proof.
GDP: Tourism and other economic sectors (% share) – 1999
Industry 32%
Agriculture15%
Services45%
Tourism8%
Source: National Statistical Institute (NSI).
Gross Domestic Product and tourism receipts (Mio ECU)
1995 1996 1997 1998 1999 % Change99/98
GDP 13 722.6 15 480.1 16 603.9 17 846.9 19 663.6 10.2
Tourism Receipts 1 164.8 1 255.0 1 355.2 1 476.9 1 682.3 13.9
Source: NSI.
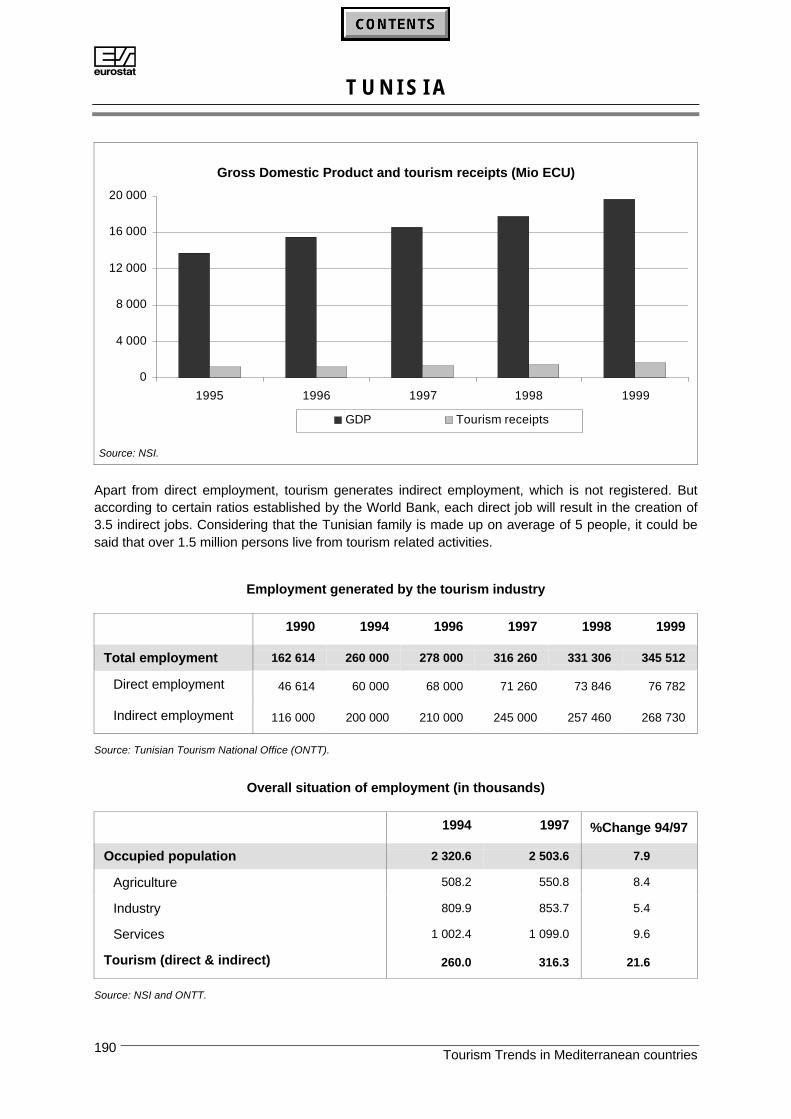
AT U N I S I A
Tourism Trends in Mediterranean countries190
Gross Domestic Product and tourism receipts (Mio ECU)
0
4 000
8 000
12 000
16 000
20 000
1995 1996 1997 1998 1999
GDP Tourism receipts
Source: NSI.
Apart from direct employment, tourism generates indirect employment, which is not registered. Butaccording to certain ratios established by the World Bank, each direct job will result in the creation of3.5 indirect jobs. Considering that the Tunisian family is made up on average of 5 people, it could besaid that over 1.5 million persons live from tourism related activities.
Employment generated by the tourism industry
1990 1994 1996 1997 1998 1999
Total employment 162 614 260 000 278 000 316 260 331 306 345 512
Direct employment 46 614 60 000 68 000 71 260 73 846 76 782
Indirect employment 116 000 200 000 210 000 245 000 257 460 268 730
Source: Tunisian Tourism National Office (ONTT).
Overall situation of employment (in thousands)
1994 1997 %Change 94/97
Occupied population 2 320.6 2 503.6 7.9
Agriculture 508.2 550.8 8.4
Industry 809.9 853.7 5.4
Services 1 002.4 1 099.0 9.6
Tourism (direct & indirect) 260.0 316.3 21.6
Source: NSI and ONTT.
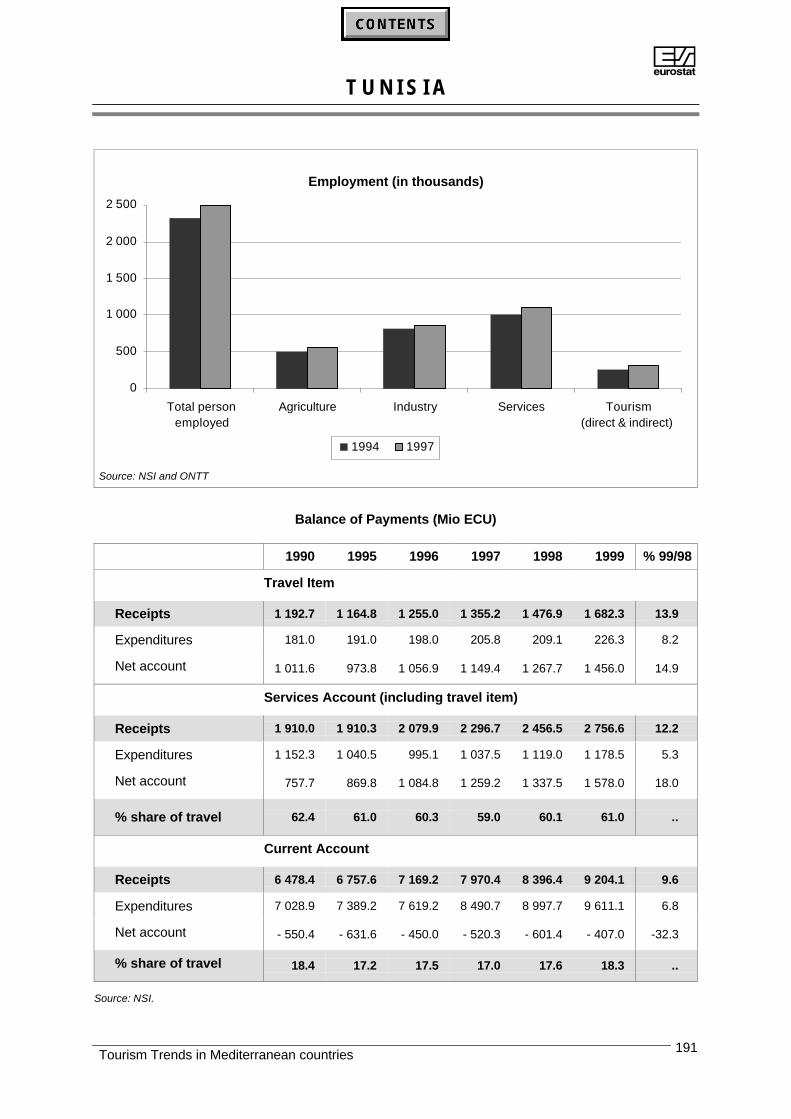
AT U N I S I A
Tourism Trends in Mediterranean countries 191
Employment (in thousands)
0
500
1 000
1 500
2 000
2 500
Total personemployed
Agriculture Industry Services Tourism(direct & indirect)
1994 1997
Source: NSI and ONTT
Balance of Payments (Mio ECU)
1990 1995 1996 1997 1998 1999 % 99/98
Travel Item
Receipts 1 192.7 1 164.8 1 255.0 1 355.2 1 476.9 1 682.3 13.9
Expenditures 181.0 191.0 198.0 205.8 209.1 226.3 8.2
Net account 1 011.6 973.8 1 056.9 1 149.4 1 267.7 1 456.0 14.9
Services Account (including travel item)
Receipts 1 910.0 1 910.3 2 079.9 2 296.7 2 456.5 2 756.6 12.2
Expenditures 1 152.3 1 040.5 995.1 1 037.5 1 119.0 1 178.5 5.3
Net account 757.7 869.8 1 084.8 1 259.2 1 337.5 1 578.0 18.0
% share of travel 62.4 61.0 60.3 59.0 60.1 61.0 ..
Current Account
Receipts 6 478.4 6 757.6 7 169.2 7 970.4 8 396.4 9 204.1 9.6
Expenditures 7 028.9 7 389.2 7 619.2 8 490.7 8 997.7 9 611.1 6.8
Net account - 550.4 - 631.6 - 450.0 - 520.3 - 601.4 - 407.0 -32.3
% share of travel 18.4 17.2 17.5 17.0 17.6 18.3 ..
Source: NSI.
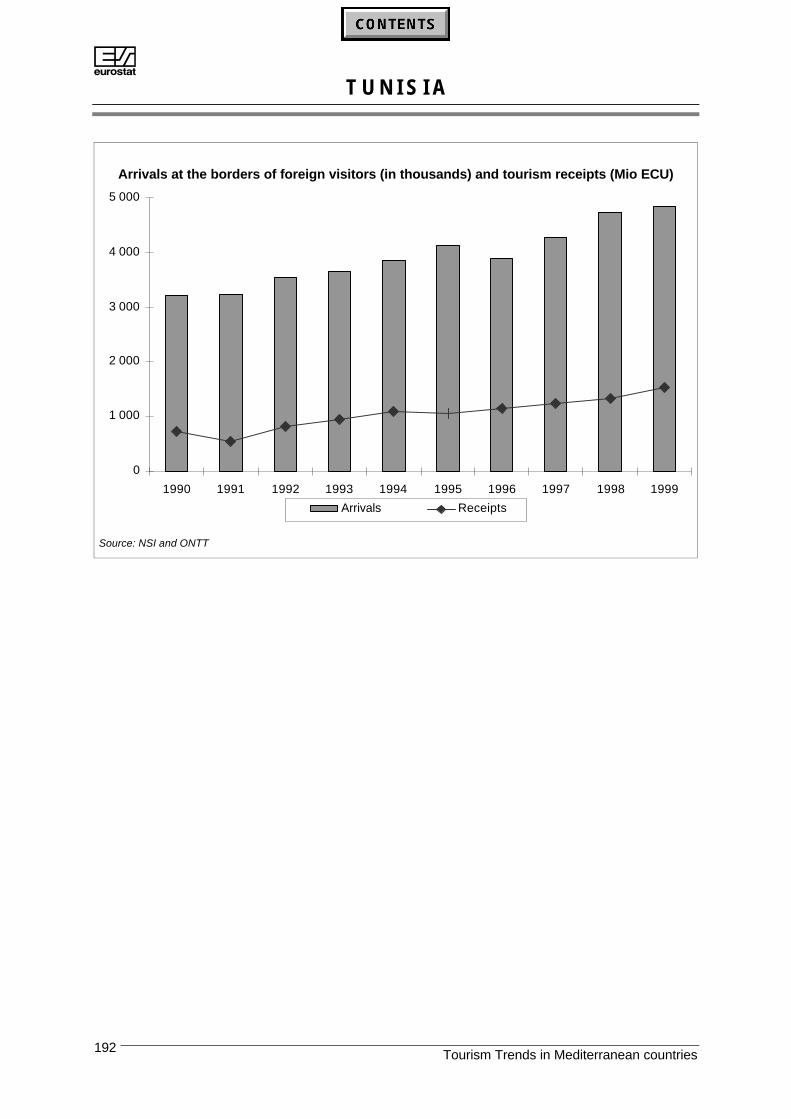
AT U N I S I A
Tourism Trends in Mediterranean countries192
Arrivals at the borders of foreign visitors (in thousands) and tourism receipts (Mio ECU)
0
1 000
2 000
3 000
4 000
5 000
1990 1991 1992 1993 1994 1995 1996 1997 1998 1999
Arrivals Receipts
Source: NSI and ONTT
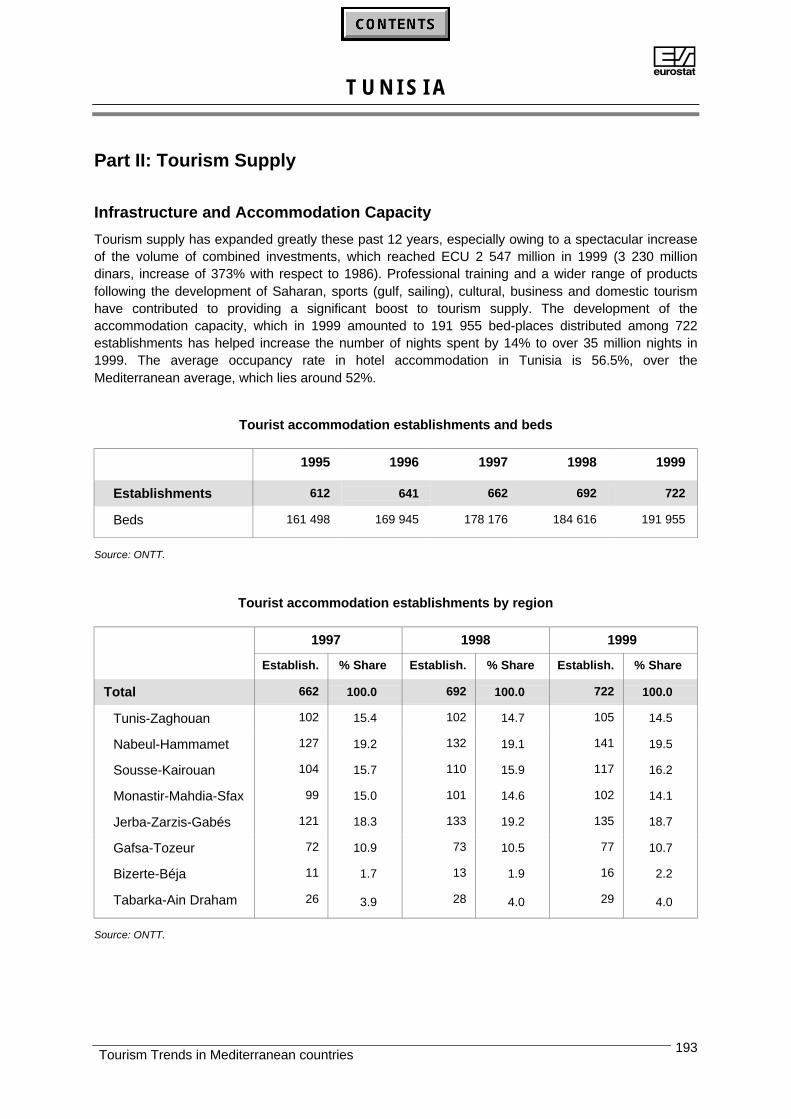
AT U N I S I A
Tourism Trends in Mediterranean countries 193
Part II: Tourism Supply
Infrastructure and Accommodation Capacity
Tourism supply has expanded greatly these past 12 years, especially owing to a spectacular increaseof the volume of combined investments, which reached ECU 2 547 million in 1999 (3 230 milliondinars, increase of 373% with respect to 1986). Professional training and a wider range of productsfollowing the development of Saharan, sports (gulf, sailing), cultural, business and domestic tourismhave contributed to providing a significant boost to tourism supply. The development of theaccommodation capacity, which in 1999 amounted to 191 955 bed-places distributed among 722establishments has helped increase the number of nights spent by 14% to over 35 million nights in1999. The average occupancy rate in hotel accommodation in Tunisia is 56.5%, over theMediterranean average, which lies around 52%.
Tourist accommodation establishments and beds
1995 1996 1997 1998 1999
Establishments 612 641 662 692 722
Beds 161 498 169 945 178 176 184 616 191 955
Source: ONTT.
Tourist accommodation establishments by region
1997 1998 1999
Establish. % Share Establish. % Share Establish. % Share
Total 662 100.0 692 100.0 722 100.0
Tunis-Zaghouan 102 15.4 102 14.7 105 14.5
Nabeul-Hammamet 127 19.2 132 19.1 141 19.5
Sousse-Kairouan 104 15.7 110 15.9 117 16.2
Monastir-Mahdia-Sfax 99 15.0 101 14.6 102 14.1
Jerba-Zarzis-Gabés 121 18.3 133 19.2 135 18.7
Gafsa-Tozeur 72 10.9 73 10.5 77 10.7
Bizerte-Béja 11 1.7 13 1.9 16 2.2
Tabarka-Ain Draham 26 3.9 28 4.0 29 4.0
Source: ONTT.
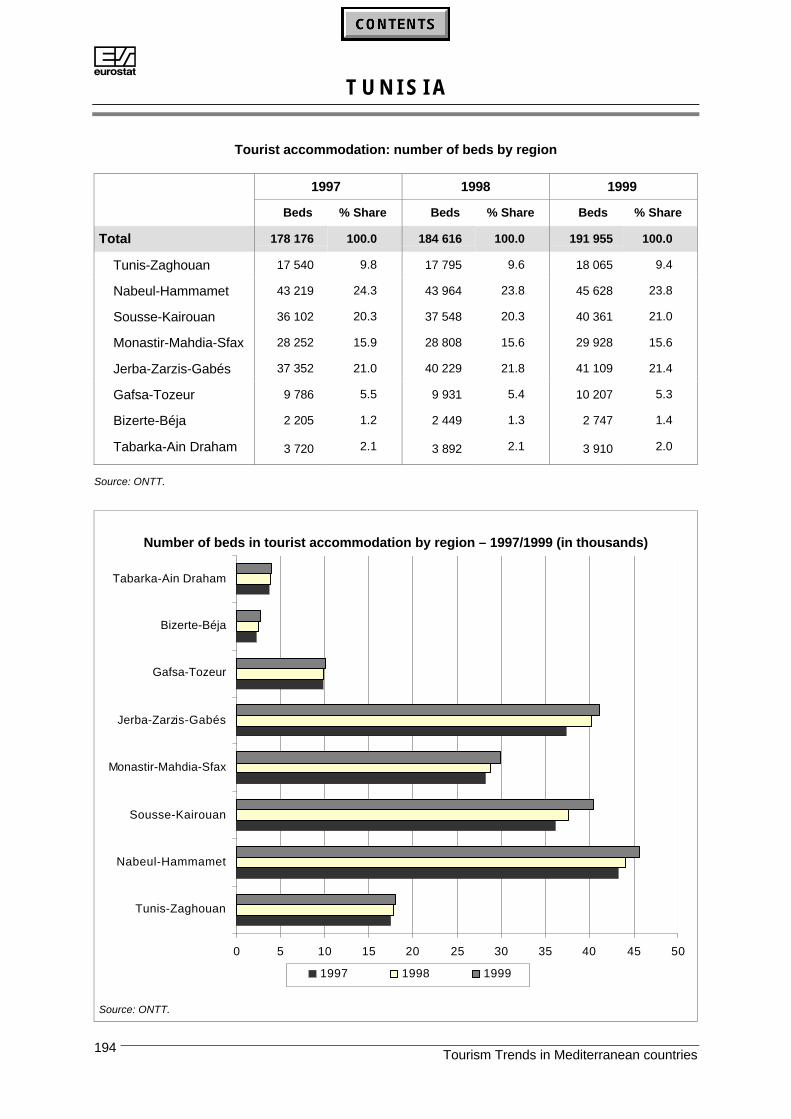
AT U N I S I A
Tourism Trends in Mediterranean countries194
Tourist accommodation: number of beds by region
1997 1998 1999
Beds % Share Beds % Share Beds % Share
Total 178 176 100.0 184 616 100.0 191 955 100.0
Tunis-Zaghouan 17 540 9.8 17 795 9.6 18 065 9.4
Nabeul-Hammamet 43 219 24.3 43 964 23.8 45 628 23.8
Sousse-Kairouan 36 102 20.3 37 548 20.3 40 361 21.0
Monastir-Mahdia-Sfax 28 252 15.9 28 808 15.6 29 928 15.6
Jerba-Zarzis-Gabés 37 352 21.0 40 229 21.8 41 109 21.4
Gafsa-Tozeur 9 786 5.5 9 931 5.4 10 207 5.3
Bizerte-Béja 2 205 1.2 2 449 1.3 2 747 1.4
Tabarka-Ain Draham 3 720 2.1 3 892 2.1 3 910 2.0
Source: ONTT.
Number of beds in tourist accommodation by region – 1997/1999 (in thousands)
0 5 10 15 20 25 30 35 40 45 50
Tunis-Zaghouan
Nabeul-Hammamet
Sousse-Kairouan
Monastir-Mahdia-Sfax
Jerba-Zarzis-Gabés
Gafsa-Tozeur
Bizerte-Béja
Tabarka-Ain Draham
1997 1998 1999
Source: ONTT.
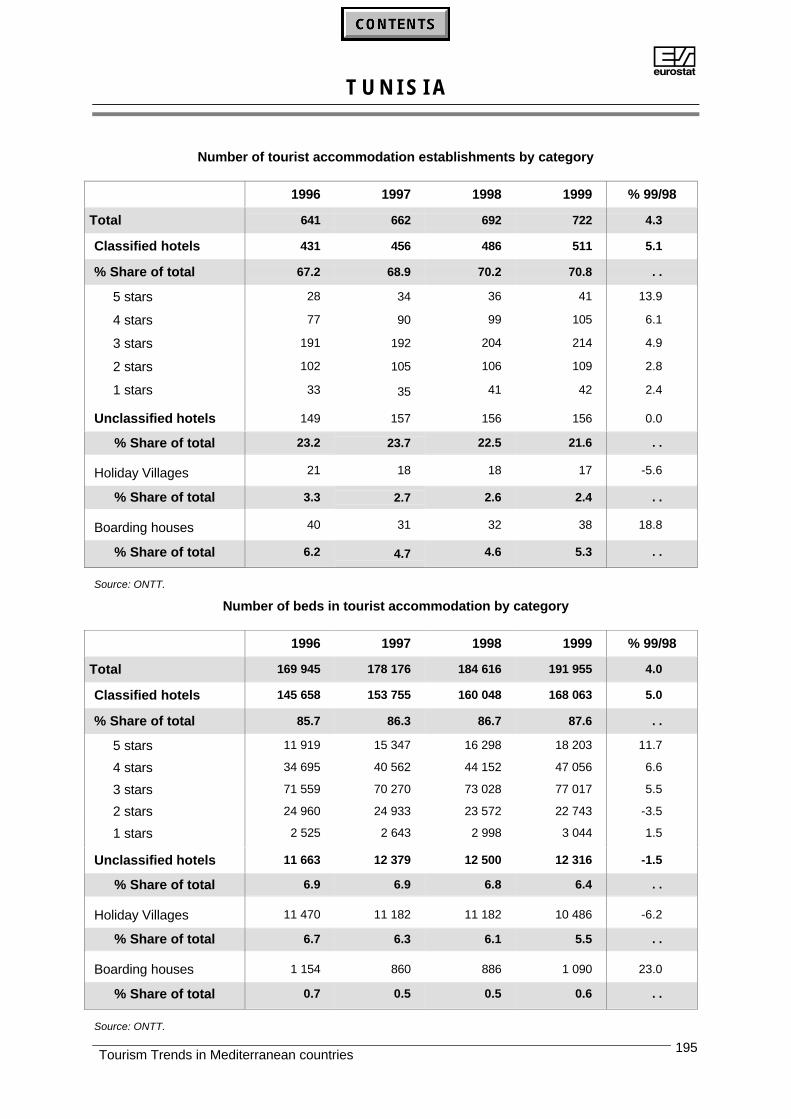
AT U N I S I A
Tourism Trends in Mediterranean countries 195
Number of tourist accommodation establishments by category
1996 1997 1998 1999 % 99/98
Total 641 662 692 722 4.3
Classified hotels 431 456 486 511 5.1
% Share of total 67.2 68.9 70.2 70.8 . .
5 stars 28 34 36 41 13.9
4 stars 77 90 99 105 6.1
3 stars 191 192 204 214 4.9
2 stars 102 105 106 109 2.8
1 stars 33 35 41 42 2.4
Unclassified hotels 149 157 156 156 0.0
% Share of total 23.2 23.7 22.5 21.6 . .
Holiday Villages 21 18 18 17 -5.6
% Share of total 3.3 2.7 2.6 2.4 . .
Boarding houses 40 31 32 38 18.8
% Share of total 6.2 4.7 4.6 5.3 . .
Source: ONTT.
Number of beds in tourist accommodation by category
1996 1997 1998 1999 % 99/98
Total 169 945 178 176 184 616 191 955 4.0
Classified hotels 145 658 153 755 160 048 168 063 5.0
% Share of total 85.7 86.3 86.7 87.6 . .
5 stars 11 919 15 347 16 298 18 203 11.7
4 stars 34 695 40 562 44 152 47 056 6.6
3 stars 71 559 70 270 73 028 77 017 5.5
2 stars 24 960 24 933 23 572 22 743 -3.5
1 stars 2 525 2 643 2 998 3 044 1.5
Unclassified hotels 11 663 12 379 12 500 12 316 -1.5
% Share of total 6.9 6.9 6.8 6.4 . .
Holiday Villages 11 470 11 182 11 182 10 486 -6.2
% Share of total 6.7 6.3 6.1 5.5 . .
Boarding houses 1 154 860 886 1 090 23.0
% Share of total 0.7 0.5 0.5 0.6 . .
Source: ONTT.

AT U N I S I A
Tourism Trends in Mediterranean countries196
The distribution of the accommodation capacity by category shows a clear improvement in thestandard of Tunisian hotels: the share of 4 and 5 star establishments has gone up from 32.7% in 1998to 34% in 1999.
Distributions of beds in tourist accommodation by category – 1997/1999 (in thousands)
0 5 10 15 20 25 30 35 40 45 50 55 60 65 70 75 80
5 Star
4 Star
3 Star
2 Star
1 Star
Unclassified hotels
Holiday villages
Boarding houses
1997 1998 1999
Source: ONTT.
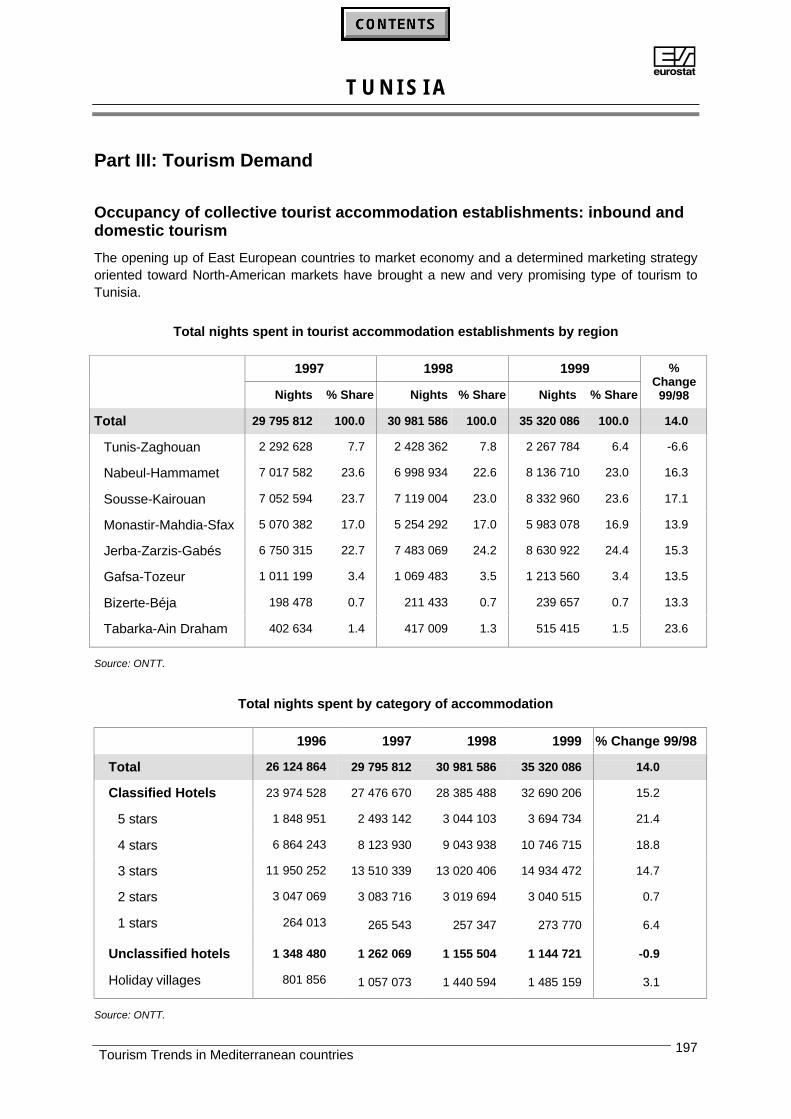
AT U N I S I A
Tourism Trends in Mediterranean countries 197
Part III: Tourism Demand
Occupancy of collective tourist accommodation establishments: inbound anddomestic tourism
The opening up of East European countries to market economy and a determined marketing strategyoriented toward North-American markets have brought a new and very promising type of tourism toTunisia.
Total nights spent in tourist accommodation establishments by region
1997 1998 1999
Nights % Share Nights % Share Nights % Share
%Change99/98
Total 29 795 812 100.0 30 981 586 100.0 35 320 086 100.0 14.0
Tunis-Zaghouan 2 292 628 7.7 2 428 362 7.8 2 267 784 6.4 -6.6
Nabeul-Hammamet 7 017 582 23.6 6 998 934 22.6 8 136 710 23.0 16.3
Sousse-Kairouan 7 052 594 23.7 7 119 004 23.0 8 332 960 23.6 17.1
Monastir-Mahdia-Sfax 5 070 382 17.0 5 254 292 17.0 5 983 078 16.9 13.9
Jerba-Zarzis-Gabés 6 750 315 22.7 7 483 069 24.2 8 630 922 24.4 15.3
Gafsa-Tozeur 1 011 199 3.4 1 069 483 3.5 1 213 560 3.4 13.5
Bizerte-Béja 198 478 0.7 211 433 0.7 239 657 0.7 13.3
Tabarka-Ain Draham 402 634 1.4 417 009 1.3 515 415 1.5 23.6
Source: ONTT.
Total nights spent by category of accommodation
1996 1997 1998 1999 % Change 99/98
Total 26 124 864 29 795 812 30 981 586 35 320 086 14.0
Classified Hotels 23 974 528 27 476 670 28 385 488 32 690 206 15.2
5 stars 1 848 951 2 493 142 3 044 103 3 694 734 21.4
4 stars 6 864 243 8 123 930 9 043 938 10 746 715 18.8
3 stars 11 950 252 13 510 339 13 020 406 14 934 472 14.7
2 stars 3 047 069 3 083 716 3 019 694 3 040 515 0.7
1 stars 264 013 265 543 257 347 273 770 6.4
Unclassified hotels 1 348 480 1 262 069 1 155 504 1 144 721 -0.9
Holiday villages 801 856 1 057 073 1 440 594 1 485 159 3.1
Source: ONTT.
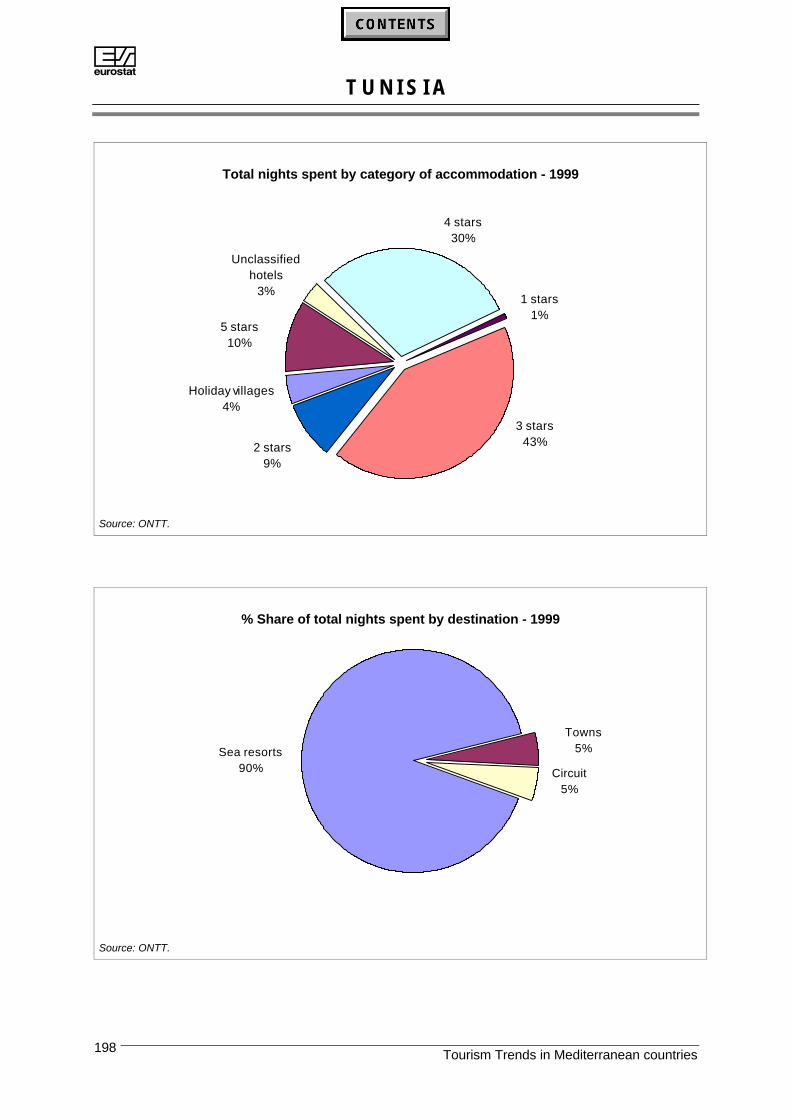
AT U N I S I A
Tourism Trends in Mediterranean countries198
Total nights spent by category of accommodation - 1999
5 stars10%
Holiday villages4%
Unclassified hotels
3%
4 stars30%
1 stars1%
3 stars43%2 stars
9%
Source: ONTT.
% Share of total nights spent by destination - 1999
Circuit5%
Sea resorts90%
Towns5%
Source: ONTT.
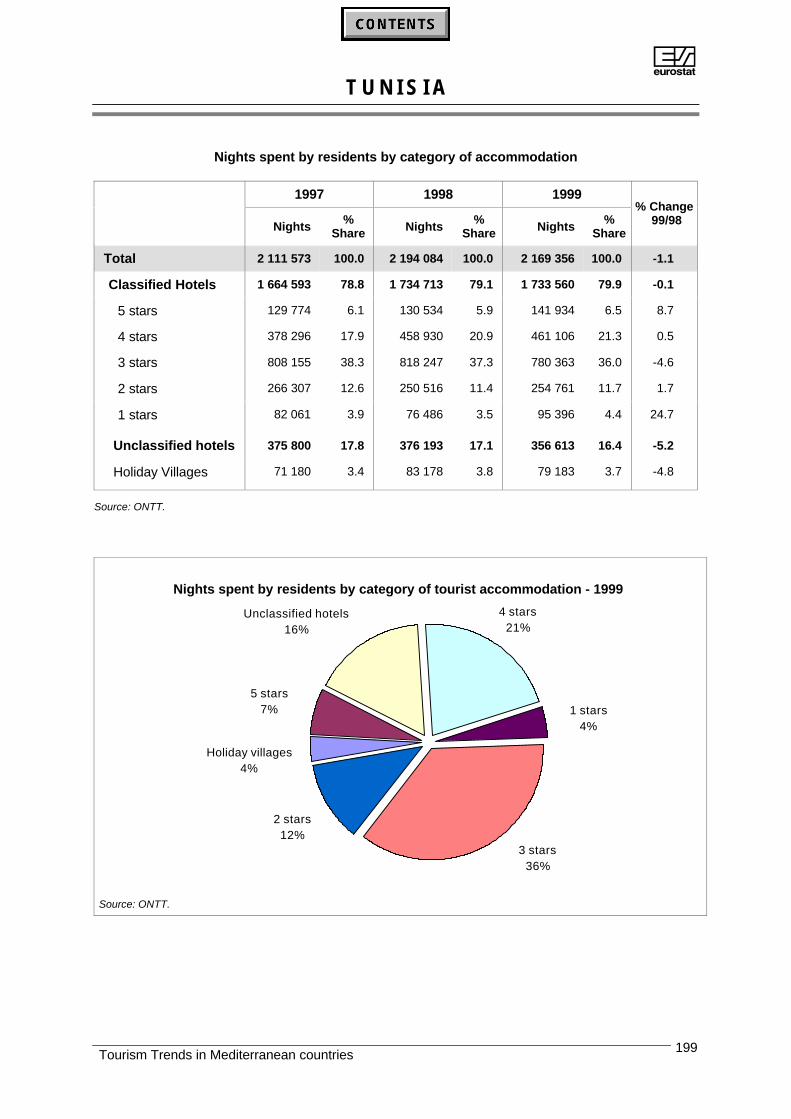
AT U N I S I A
Tourism Trends in Mediterranean countries 199
Nights spent by residents by category of accommodation
1997 1998 1999
Nights %Share Nights %
Share Nights %Share
% Change99/98
Total 2 111 573 100.0 2 194 084 100.0 2 169 356 100.0 -1.1
Classified Hotels 1 664 593 78.8 1 734 713 79.1 1 733 560 79.9 -0.1
5 stars 129 774 6.1 130 534 5.9 141 934 6.5 8.7
4 stars 378 296 17.9 458 930 20.9 461 106 21.3 0.5
3 stars 808 155 38.3 818 247 37.3 780 363 36.0 -4.6
2 stars 266 307 12.6 250 516 11.4 254 761 11.7 1.7
1 stars 82 061 3.9 76 486 3.5 95 396 4.4 24.7
Unclassified hotels 375 800 17.8 376 193 17.1 356 613 16.4 -5.2
Holiday Villages 71 180 3.4 83 178 3.8 79 183 3.7 -4.8
Source: ONTT.
Nights spent by residents by category of tourist accommodation - 1999
2 stars12%
3 stars36%
1 stars4%
4 stars21%
Unclassified hotels16%
Holiday villages4%
5 stars7%
Source: ONTT.
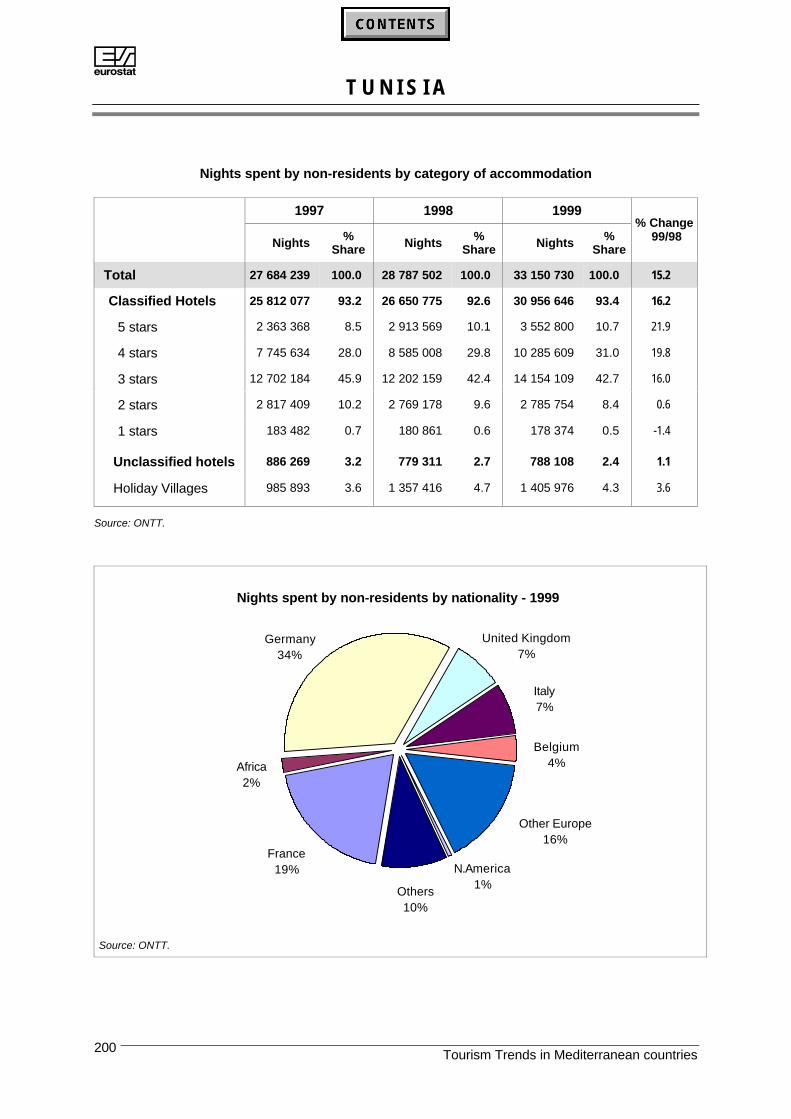
AT U N I S I A
Tourism Trends in Mediterranean countries200
Nights spent by non-residents by category of accommodation
1997 1998 1999
Nights %Share Nights %
Share Nights %Share
% Change99/98
Total 27 684 239 100.0 28 787 502 100.0 33 150 730 100.0 15.2
Classified Hotels 25 812 077 93.2 26 650 775 92.6 30 956 646 93.4 16.2
5 stars 2 363 368 8.5 2 913 569 10.1 3 552 800 10.7 21.9
4 stars 7 745 634 28.0 8 585 008 29.8 10 285 609 31.0 19.8
3 stars 12 702 184 45.9 12 202 159 42.4 14 154 109 42.7 16.0
2 stars 2 817 409 10.2 2 769 178 9.6 2 785 754 8.4 0.6
1 stars 183 482 0.7 180 861 0.6 178 374 0.5 -1.4
Unclassified hotels 886 269 3.2 779 311 2.7 788 108 2.4 1.1
Holiday Villages 985 893 3.6 1 357 416 4.7 1 405 976 4.3 3.6
Source: ONTT.
Nights spent by non-residents by nationality - 1999
Africa2%
France19%
Germany34%
United Kingdom7%
Italy7%
Belgium4%
Other Europe16%
N.America1%
Others10%
Source: ONTT.
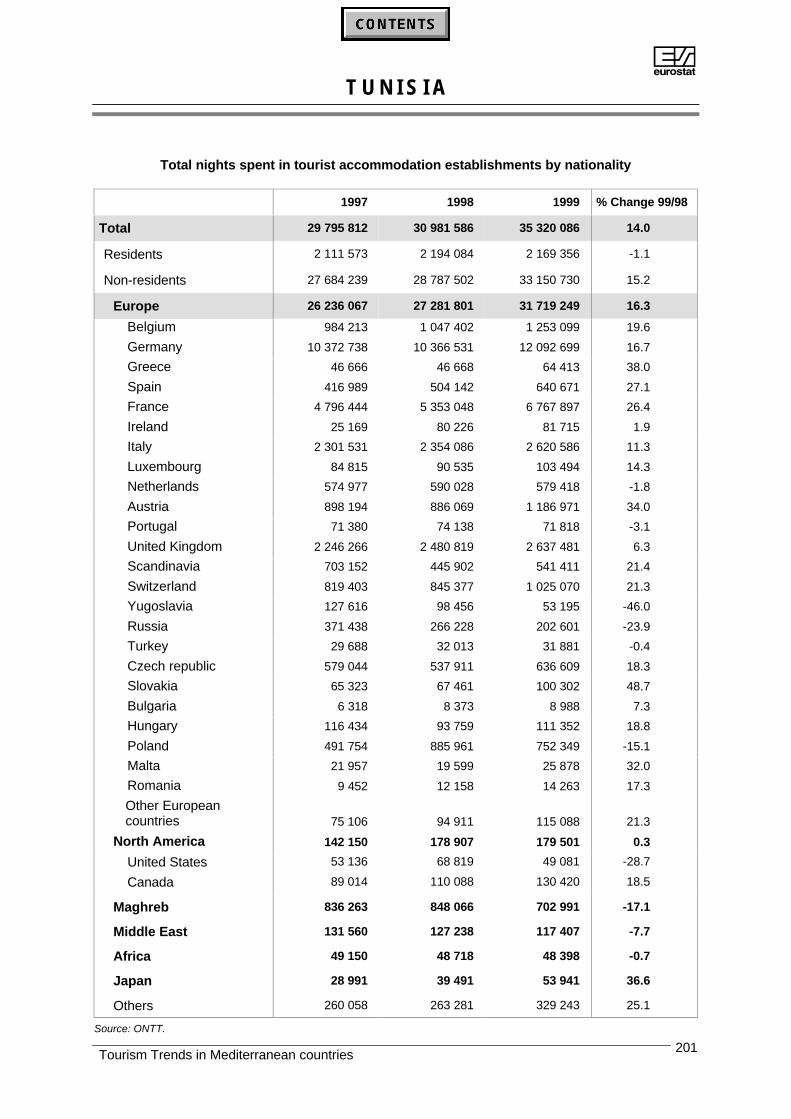
AT U N I S I A
Tourism Trends in Mediterranean countries 201
Total nights spent in tourist accommodation establishments by nationality
1997 1998 1999 % Change 99/98
Total 29 795 812 30 981 586 35 320 086 14.0
Residents 2 111 573 2 194 084 2 169 356 -1.1
Non-residents 27 684 239 28 787 502 33 150 730 15.2
Europe 26 236 067 27 281 801 31 719 249 16.3
Belgium 984 213 1 047 402 1 253 099 19.6
Germany 10 372 738 10 366 531 12 092 699 16.7
Greece 46 666 46 668 64 413 38.0
Spain 416 989 504 142 640 671 27.1
France 4 796 444 5 353 048 6 767 897 26.4
Ireland 25 169 80 226 81 715 1.9
Italy 2 301 531 2 354 086 2 620 586 11.3
Luxembourg 84 815 90 535 103 494 14.3
Netherlands 574 977 590 028 579 418 -1.8
Austria 898 194 886 069 1 186 971 34.0
Portugal 71 380 74 138 71 818 -3.1
United Kingdom 2 246 266 2 480 819 2 637 481 6.3
Scandinavia 703 152 445 902 541 411 21.4
Switzerland 819 403 845 377 1 025 070 21.3
Yugoslavia 127 616 98 456 53 195 -46.0
Russia 371 438 266 228 202 601 -23.9
Turkey 29 688 32 013 31 881 -0.4
Czech republic 579 044 537 911 636 609 18.3
Slovakia 65 323 67 461 100 302 48.7
Bulgaria 6 318 8 373 8 988 7.3
Hungary 116 434 93 759 111 352 18.8
Poland 491 754 885 961 752 349 -15.1
Malta 21 957 19 599 25 878 32.0
Romania 9 452 12 158 14 263 17.3
Other Europeancountries 75 106 94 911 115 088 21.3
North America 142 150 178 907 179 501 0.3
United States 53 136 68 819 49 081 -28.7
Canada 89 014 110 088 130 420 18.5
Maghreb 836 263 848 066 702 991 -17.1
Middle East 131 560 127 238 117 407 -7.7
Africa 49 150 48 718 48 398 -0.7
Japan 28 991 39 491 53 941 36.6
Others 260 058 263 281 329 243 25.1
Source: ONTT.
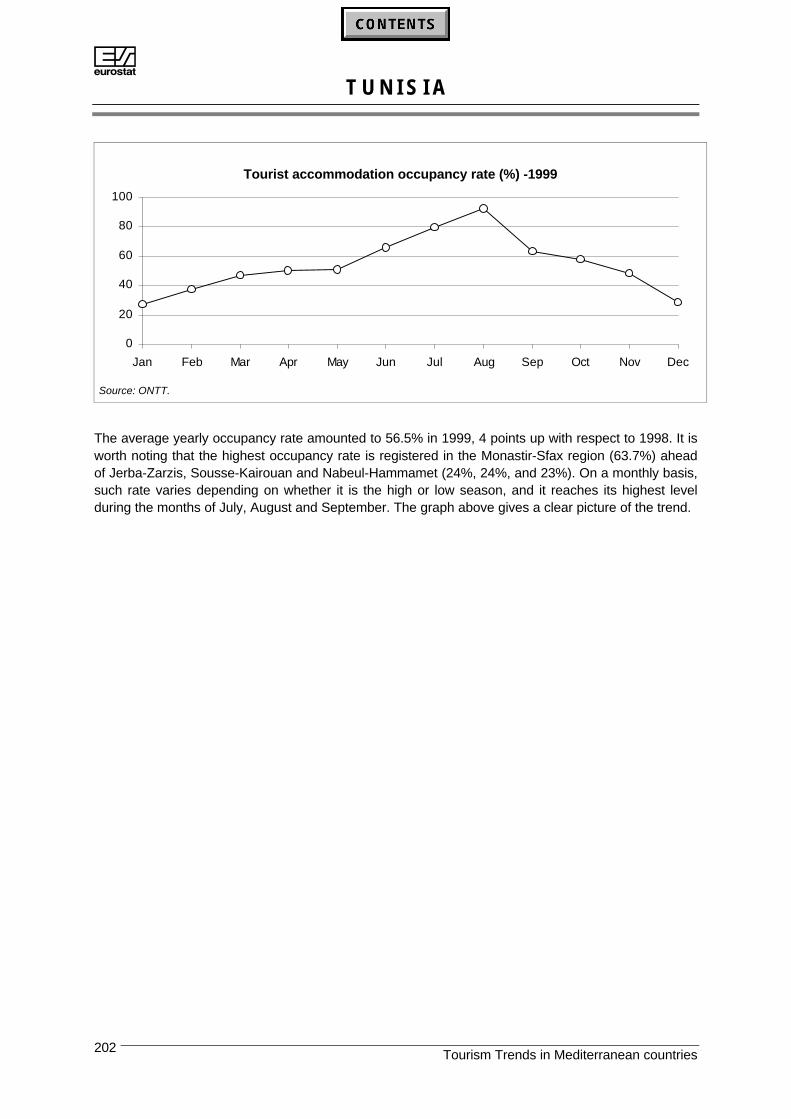
AT U N I S I A
Tourism Trends in Mediterranean countries202
Tourist accommodation occupancy rate (%) -1999
0
20
40
60
80
100
Jan Feb Mar Apr May Jun Jul Aug Sep Oct Nov Dec
Source: ONTT.
The average yearly occupancy rate amounted to 56.5% in 1999, 4 points up with respect to 1998. It isworth noting that the highest occupancy rate is registered in the Monastir-Sfax region (63.7%) aheadof Jerba-Zarzis, Sousse-Kairouan and Nabeul-Hammamet (24%, 24%, and 23%). On a monthly basis,such rate varies depending on whether it is the high or low season, and it reaches its highest levelduring the months of July, August and September. The graph above gives a clear picture of the trend.
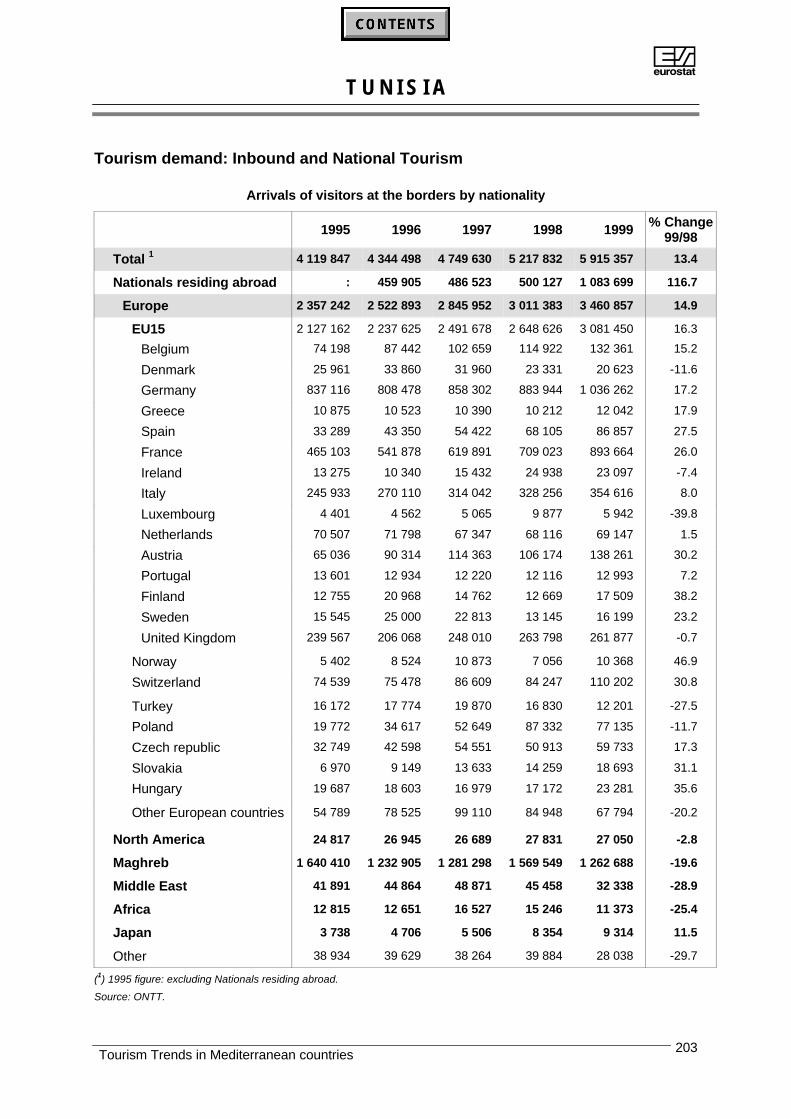
AT U N I S I A
Tourism Trends in Mediterranean countries 203
Tourism demand: Inbound and National Tourism
Arrivals of visitors at the borders by nationality
1995 1996 1997 1998 1999 % Change99/98
Total 1 4 119 847 4 344 498 4 749 630 5 217 832 5 915 357 13.4
Nationals residing abroad : 459 905 486 523 500 127 1 083 699 116.7
Europe 2 357 242 2 522 893 2 845 952 3 011 383 3 460 857 14.9
EU15 2 127 162 2 237 625 2 491 678 2 648 626 3 081 450 16.3
Belgium 74 198 87 442 102 659 114 922 132 361 15.2
Denmark 25 961 33 860 31 960 23 331 20 623 -11.6
Germany 837 116 808 478 858 302 883 944 1 036 262 17.2
Greece 10 875 10 523 10 390 10 212 12 042 17.9
Spain 33 289 43 350 54 422 68 105 86 857 27.5
France 465 103 541 878 619 891 709 023 893 664 26.0
Ireland 13 275 10 340 15 432 24 938 23 097 -7.4
Italy 245 933 270 110 314 042 328 256 354 616 8.0
Luxembourg 4 401 4 562 5 065 9 877 5 942 -39.8
Netherlands 70 507 71 798 67 347 68 116 69 147 1.5
Austria 65 036 90 314 114 363 106 174 138 261 30.2
Portugal 13 601 12 934 12 220 12 116 12 993 7.2
Finland 12 755 20 968 14 762 12 669 17 509 38.2
Sweden 15 545 25 000 22 813 13 145 16 199 23.2
United Kingdom 239 567 206 068 248 010 263 798 261 877 -0.7
Norway 5 402 8 524 10 873 7 056 10 368 46.9
Switzerland 74 539 75 478 86 609 84 247 110 202 30.8
Turkey 16 172 17 774 19 870 16 830 12 201 -27.5
Poland 19 772 34 617 52 649 87 332 77 135 -11.7
Czech republic 32 749 42 598 54 551 50 913 59 733 17.3
Slovakia 6 970 9 149 13 633 14 259 18 693 31.1
Hungary 19 687 18 603 16 979 17 172 23 281 35.6
Other European countries 54 789 78 525 99 110 84 948 67 794 -20.2
North America 24 817 26 945 26 689 27 831 27 050 -2.8
Maghreb 1 640 410 1 232 905 1 281 298 1 569 549 1 262 688 -19.6
Middle East 41 891 44 864 48 871 45 458 32 338 -28.9
Africa 12 815 12 651 16 527 15 246 11 373 -25.4
Japan 3 738 4 706 5 506 8 354 9 314 11.5
Other 38 934 39 629 38 264 39 884 28 038 -29.7
(1) 1995 figure: excluding Nationals residing abroad.
Source: ONTT.
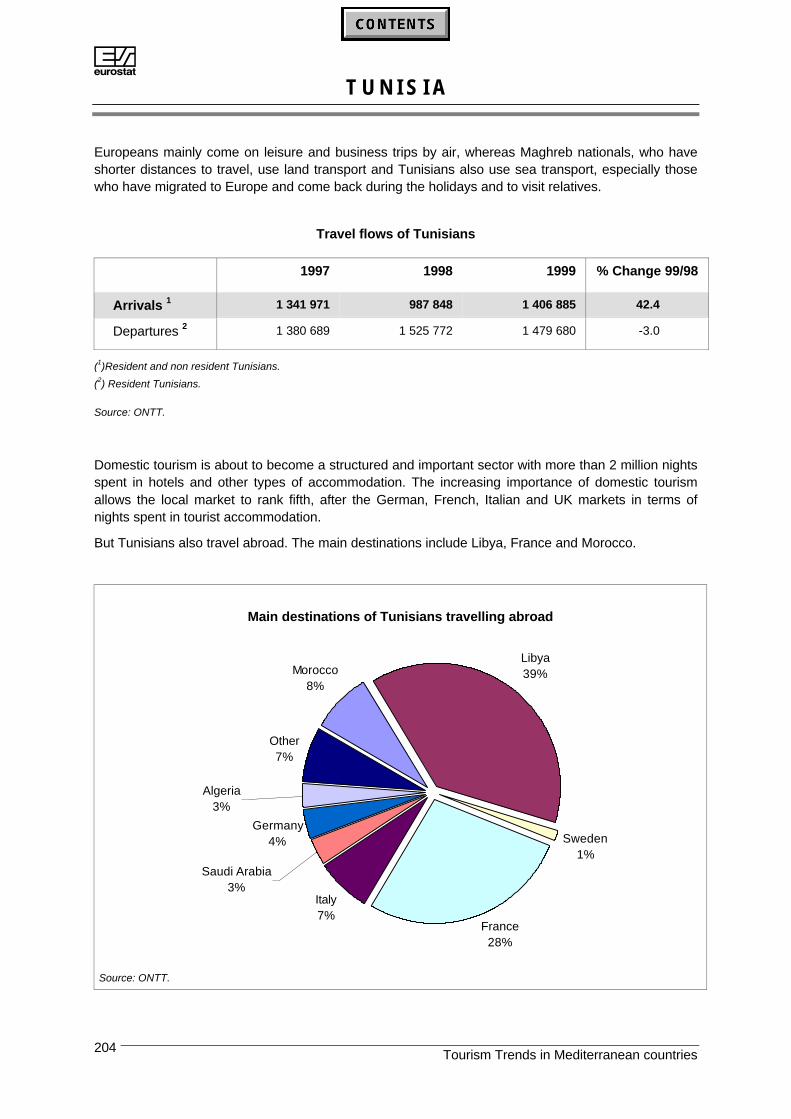
AT U N I S I A
Tourism Trends in Mediterranean countries204
Europeans mainly come on leisure and business trips by air, whereas Maghreb nationals, who haveshorter distances to travel, use land transport and Tunisians also use sea transport, especially thosewho have migrated to Europe and come back during the holidays and to visit relatives.
Travel flows of Tunisians
1997 1998 1999 % Change 99/98
Arrivals 1 1 341 971 987 848 1 406 885 42.4
Departures 2 1 380 689 1 525 772 1 479 680 -3.0
(1)Resident and non resident Tunisians.
(2) Resident Tunisians.
Source: ONTT.
Domestic tourism is about to become a structured and important sector with more than 2 million nightsspent in hotels and other types of accommodation. The increasing importance of domestic tourismallows the local market to rank fifth, after the German, French, Italian and UK markets in terms ofnights spent in tourist accommodation.
But Tunisians also travel abroad. The main destinations include Libya, France and Morocco.
Main destinations of Tunisians travelling abroad
Other7%
Algeria3%
Germany4%
Saudi Arabia3%
Italy7%
France28%
Sweden1%
Morocco8%
Libya39%
Source: ONTT.
AT U N I S I A
Tourism Trends in Mediterranean countries 205
PART IV: Future Perspectives
Tourism plays an important part in the Tunisian economy, and thus, special attention will be given to itin the forthcoming years, especially within the next development plan. Investments of about 271.8million dinars per year are planned for 2000 and 2001, along with infrastructure investmentsamounting to 43.5 million US dollars. The aim is to increase tourism supply, among others by creating7 000 bed-places this year and another 7 000 in 2001, by developing new tourist areas, in the South,in the Kerkenna islands, in the North in Tabarka, and by opening up towards new American, Europeanand Asian markets.
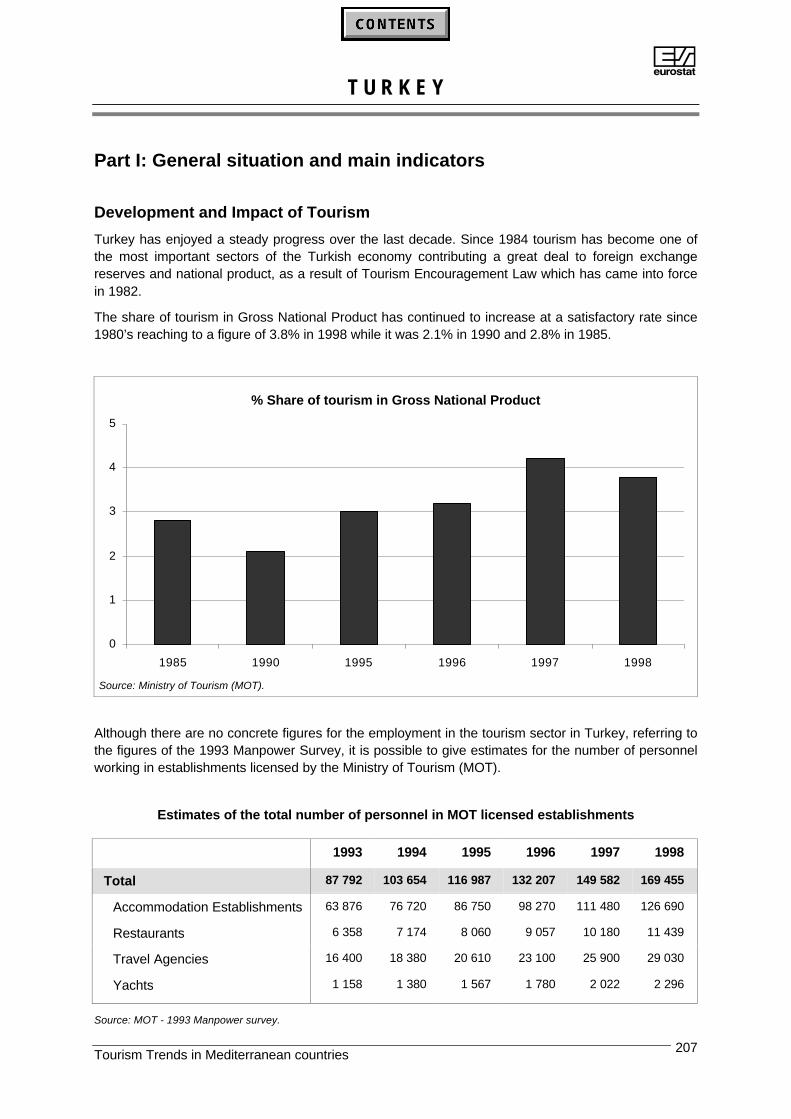
AT U R K E Y
Tourism Trends in Mediterranean countries 207
Part I: General situation and main indicators
Development and Impact of Tourism
Turkey has enjoyed a steady progress over the last decade. Since 1984 tourism has become one ofthe most important sectors of the Turkish economy contributing a great deal to foreign exchangereserves and national product, as a result of Tourism Encouragement Law which has came into forcein 1982.
The share of tourism in Gross National Product has continued to increase at a satisfactory rate since1980’s reaching to a figure of 3.8% in 1998 while it was 2.1% in 1990 and 2.8% in 1985.
% Share of tourism in Gross National Product
0
1
2
3
4
5
1985 1990 1995 1996 1997 1998
Source: Ministry of Tourism (MOT).
Although there are no concrete figures for the employment in the tourism sector in Turkey, referring tothe figures of the 1993 Manpower Survey, it is possible to give estimates for the number of personnelworking in establishments licensed by the Ministry of Tourism (MOT).
Estimates of the total number of personnel in MOT licensed establishments
1993 1994 1995 1996 1997 1998
Total 87 792 103 654 116 987 132 207 149 582 169 455
Accommodation Establishments 63 876 76 720 86 750 98 270 111 480 126 690
Restaurants 6 358 7 174 8 060 9 057 10 180 11 439
Travel Agencies 16 400 18 380 20 610 23 100 25 900 29 030
Yachts 1 158 1 380 1 567 1 780 2 022 2 296
Source: MOT - 1993 Manpower survey.
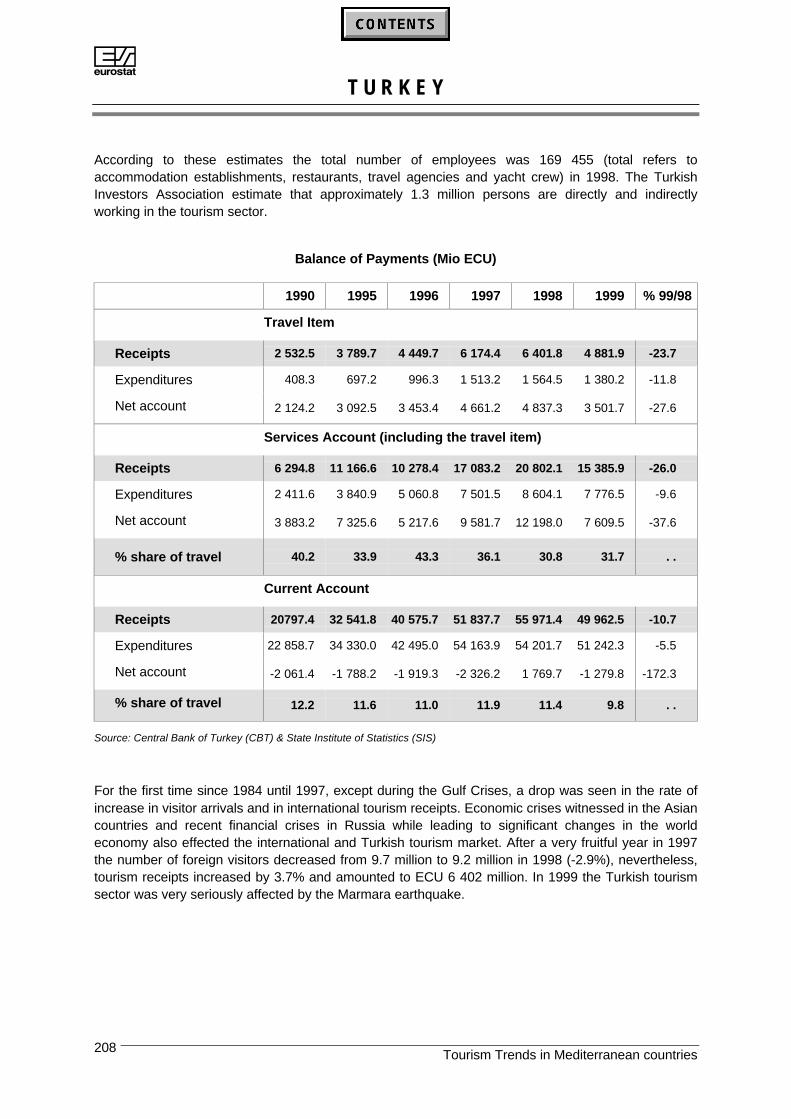
AT U R K E Y
Tourism Trends in Mediterranean countries208
According to these estimates the total number of employees was 169 455 (total refers toaccommodation establishments, restaurants, travel agencies and yacht crew) in 1998. The TurkishInvestors Association estimate that approximately 1.3 million persons are directly and indirectlyworking in the tourism sector.
Balance of Payments (Mio ECU)
1990 1995 1996 1997 1998 1999 % 99/98
Travel Item
Receipts 2 532.5 3 789.7 4 449.7 6 174.4 6 401.8 4 881.9 -23.7
Expenditures 408.3 697.2 996.3 1 513.2 1 564.5 1 380.2 -11.8
Net account 2 124.2 3 092.5 3 453.4 4 661.2 4 837.3 3 501.7 -27.6
Services Account (including the travel item)
Receipts 6 294.8 11 166.6 10 278.4 17 083.2 20 802.1 15 385.9 -26.0
Expenditures 2 411.6 3 840.9 5 060.8 7 501.5 8 604.1 7 776.5 -9.6
Net account 3 883.2 7 325.6 5 217.6 9 581.7 12 198.0 7 609.5 -37.6
% share of travel 40.2 33.9 43.3 36.1 30.8 31.7 . .
Current Account
Receipts 20797.4 32 541.8 40 575.7 51 837.7 55 971.4 49 962.5 -10.7
Expenditures 22 858.7 34 330.0 42 495.0 54 163.9 54 201.7 51 242.3 -5.5
Net account -2 061.4 -1 788.2 -1 919.3 -2 326.2 1 769.7 -1 279.8 -172.3
% share of travel 12.2 11.6 11.0 11.9 11.4 9.8 . .
Source: Central Bank of Turkey (CBT) & State Institute of Statistics (SIS)
For the first time since 1984 until 1997, except during the Gulf Crises, a drop was seen in the rate ofincrease in visitor arrivals and in international tourism receipts. Economic crises witnessed in the Asiancountries and recent financial crises in Russia while leading to significant changes in the worldeconomy also effected the international and Turkish tourism market. After a very fruitful year in 1997the number of foreign visitors decreased from 9.7 million to 9.2 million in 1998 (-2.9%), nevertheless,tourism receipts increased by 3.7% and amounted to ECU 6 402 million. In 1999 the Turkish tourismsector was very seriously affected by the Marmara earthquake.
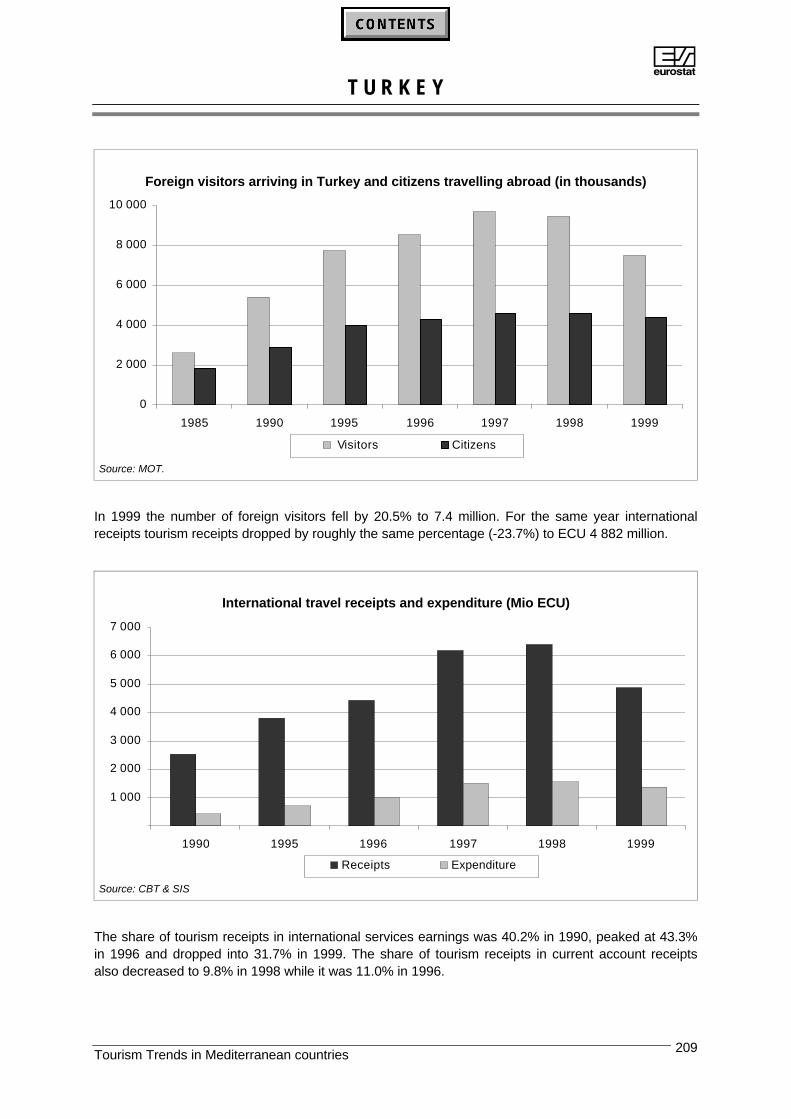
AT U R K E Y
Tourism Trends in Mediterranean countries 209
Foreign visitors arriving in Turkey and citizens travelling abroad (in thousands)
0
2 000
4 000
6 000
8 000
10 000
1985 1990 1995 1996 1997 1998 1999
Visitors Citizens
Source: MOT.
In 1999 the number of foreign visitors fell by 20.5% to 7.4 million. For the same year internationalreceipts tourism receipts dropped by roughly the same percentage (-23.7%) to ECU 4 882 million.
International travel receipts and expenditure (Mio ECU)
1 000
2 000
3 000
4 000
5 000
6 000
7 000
1990 1995 1996 1997 1998 1999
Receipts Expenditure
Source: CBT & SIS
The share of tourism receipts in international services earnings was 40.2% in 1990, peaked at 43.3%in 1996 and dropped into 31.7% in 1999. The share of tourism receipts in current account receiptsalso decreased to 9.8% in 1998 while it was 11.0% in 1996.
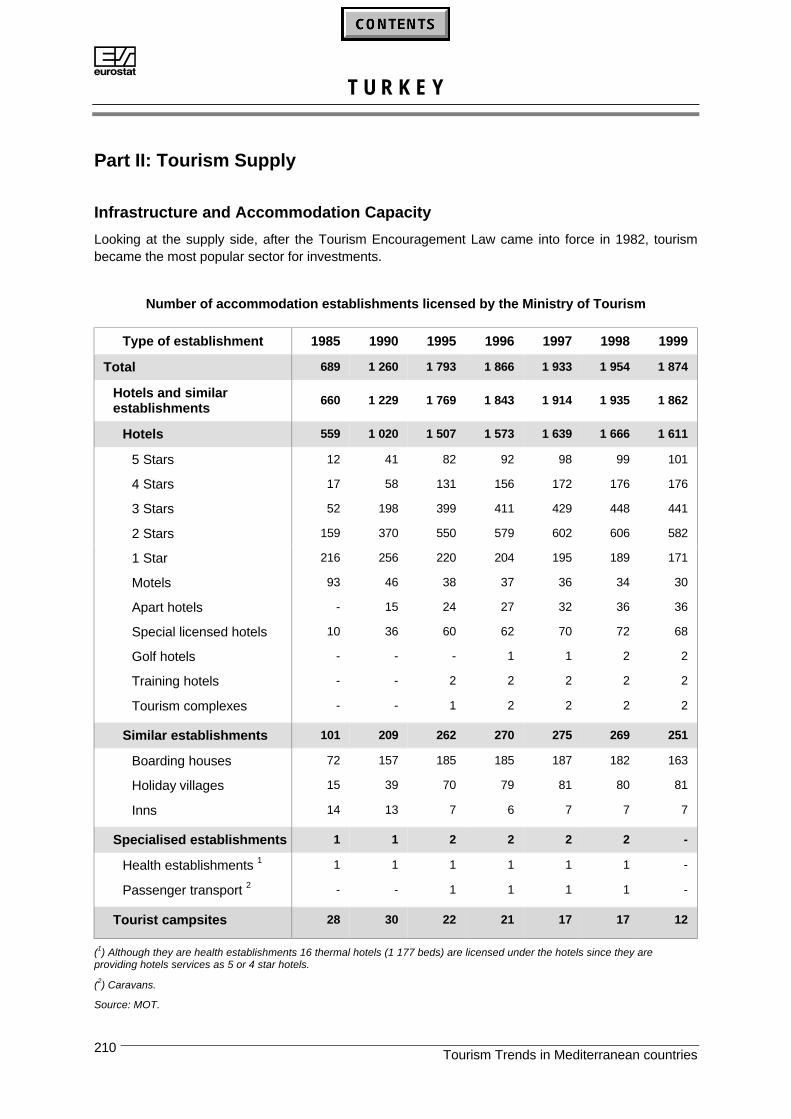
AT U R K E Y
Tourism Trends in Mediterranean countries210
Part II: Tourism Supply
Infrastructure and Accommodation Capacity
Looking at the supply side, after the Tourism Encouragement Law came into force in 1982, tourismbecame the most popular sector for investments.
Number of accommodation establishments licensed by the Ministry of Tourism
Type of establishment 1985 1990 1995 1996 1997 1998 1999
Total 689 1 260 1 793 1 866 1 933 1 954 1 874
Hotels and similarestablishments
660 1 229 1 769 1 843 1 914 1 935 1 862
Hotels 559 1 020 1 507 1 573 1 639 1 666 1 611
5 Stars 12 41 82 92 98 99 101
4 Stars 17 58 131 156 172 176 176
3 Stars 52 198 399 411 429 448 441
2 Stars 159 370 550 579 602 606 582
1 Star 216 256 220 204 195 189 171
Motels 93 46 38 37 36 34 30
Apart hotels - 15 24 27 32 36 36
Special licensed hotels 10 36 60 62 70 72 68
Golf hotels - - - 1 1 2 2
Training hotels - - 2 2 2 2 2
Tourism complexes - - 1 2 2 2 2
Similar establishments 101 209 262 270 275 269 251
Boarding houses 72 157 185 185 187 182 163
Holiday villages 15 39 70 79 81 80 81
Inns 14 13 7 6 7 7 7
Specialised establishments 1 1 2 2 2 2 -
Health establishments 1 1 1 1 1 1 1 -
Passenger transport 2 - - 1 1 1 1 -
Tourist campsites 28 30 22 21 17 17 12
(1) Although they are health establishments 16 thermal hotels (1 177 beds) are licensed under the hotels since they areproviding hotels services as 5 or 4 star hotels.
(2) Caravans.
Source: MOT.
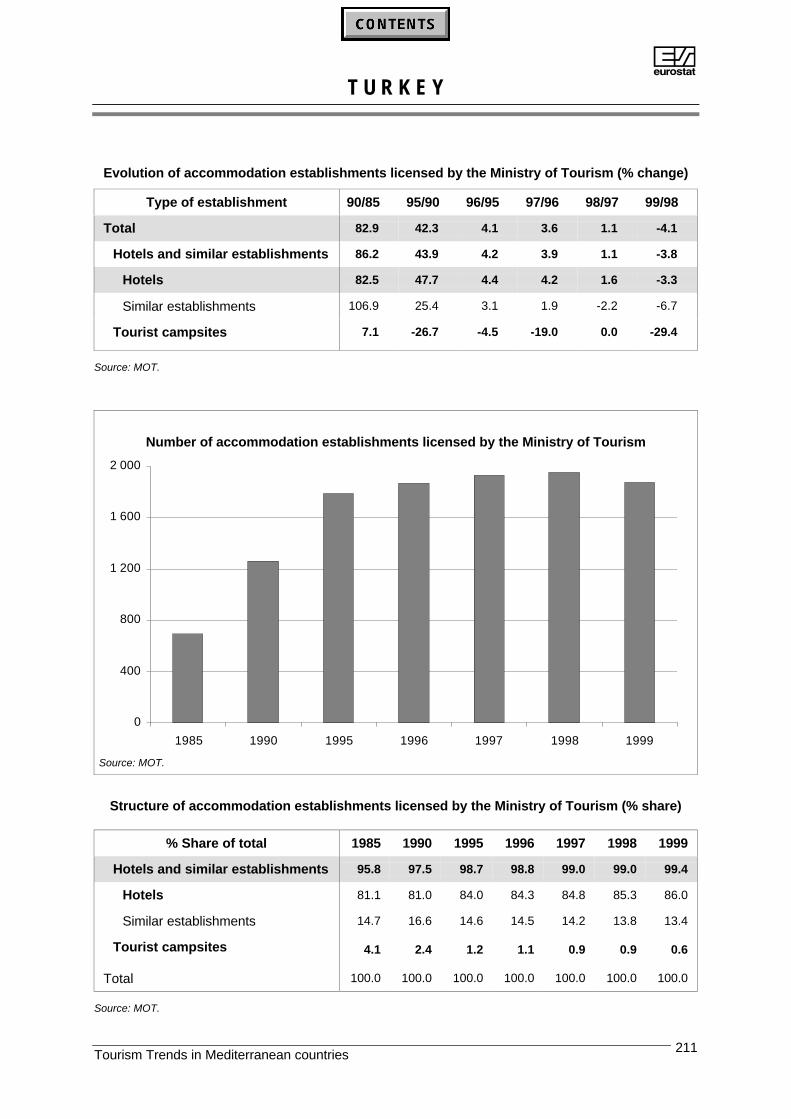
AT U R K E Y
Tourism Trends in Mediterranean countries 211
Evolution of accommodation establishments licensed by the Ministry of Tourism (% change)
Type of establishment 90/85 95/90 96/95 97/96 98/97 99/98
Total 82.9 42.3 4.1 3.6 1.1 -4.1
Hotels and similar establishments 86.2 43.9 4.2 3.9 1.1 -3.8
Hotels 82.5 47.7 4.4 4.2 1.6 -3.3
Similar establishments 106.9 25.4 3.1 1.9 -2.2 -6.7
Tourist campsites 7.1 -26.7 -4.5 -19.0 0.0 -29.4
Source: MOT.
Number of accommodation establishments licensed by the Ministry of Tourism
0
400
800
1 200
1 600
2 000
1985 1990 1995 1996 1997 1998 1999
Source: MOT.
Structure of accommodation establishments licensed by the Ministry of Tourism (% share)
% Share of total 1985 1990 1995 1996 1997 1998 1999
Hotels and similar establishments 95.8 97.5 98.7 98.8 99.0 99.0 99.4
Hotels 81.1 81.0 84.0 84.3 84.8 85.3 86.0
Similar establishments 14.7 16.6 14.6 14.5 14.2 13.8 13.4
Tourist campsites 4.1 2.4 1.2 1.1 0.9 0.9 0.6
Total 100.0 100.0 100.0 100.0 100.0 100.0 100.0
Source: MOT.
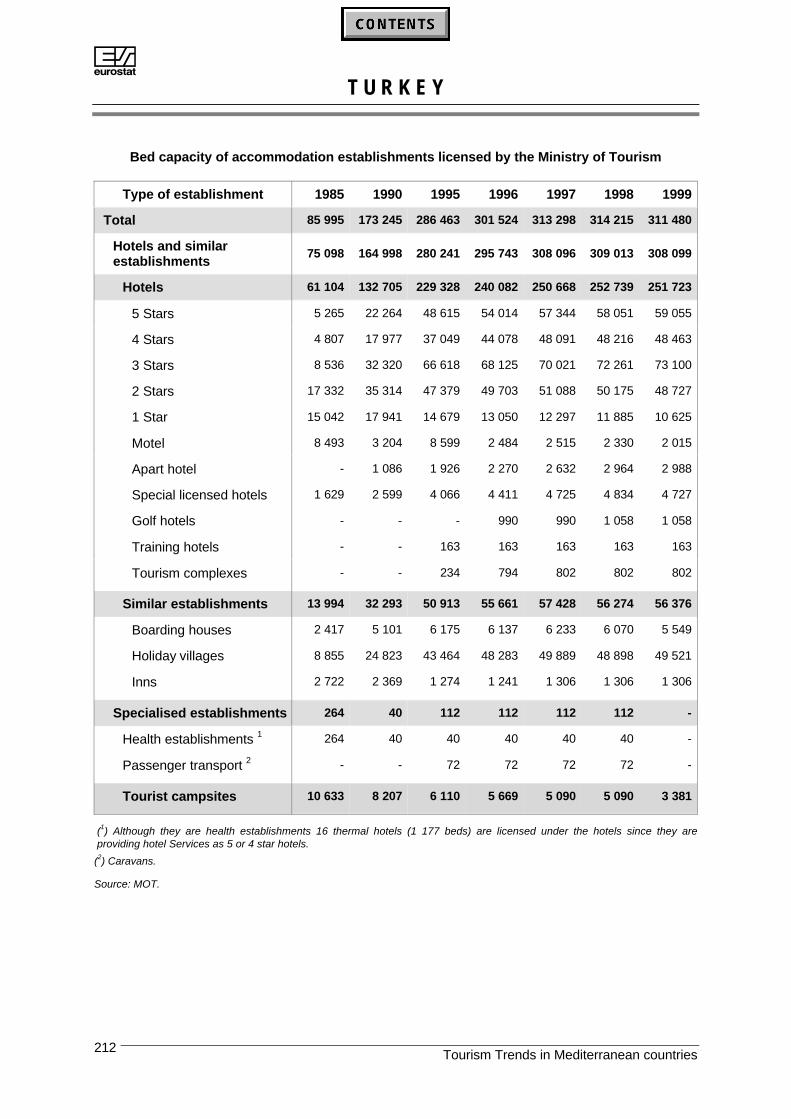
AT U R K E Y
Tourism Trends in Mediterranean countries212
Bed capacity of accommodation establishments licensed by the Ministry of Tourism
Type of establishment 1985 1990 1995 1996 1997 1998 1999
Total 85 995 173 245 286 463 301 524 313 298 314 215 311 480
Hotels and similarestablishments
75 098 164 998 280 241 295 743 308 096 309 013 308 099
Hotels 61 104 132 705 229 328 240 082 250 668 252 739 251 723
5 Stars 5 265 22 264 48 615 54 014 57 344 58 051 59 055
4 Stars 4 807 17 977 37 049 44 078 48 091 48 216 48 463
3 Stars 8 536 32 320 66 618 68 125 70 021 72 261 73 100
2 Stars 17 332 35 314 47 379 49 703 51 088 50 175 48 727
1 Star 15 042 17 941 14 679 13 050 12 297 11 885 10 625
Motel 8 493 3 204 8 599 2 484 2 515 2 330 2 015
Apart hotel - 1 086 1 926 2 270 2 632 2 964 2 988
Special licensed hotels 1 629 2 599 4 066 4 411 4 725 4 834 4 727
Golf hotels - - - 990 990 1 058 1 058
Training hotels - - 163 163 163 163 163
Tourism complexes - - 234 794 802 802 802
Similar establishments 13 994 32 293 50 913 55 661 57 428 56 274 56 376
Boarding houses 2 417 5 101 6 175 6 137 6 233 6 070 5 549
Holiday villages 8 855 24 823 43 464 48 283 49 889 48 898 49 521
Inns 2 722 2 369 1 274 1 241 1 306 1 306 1 306
Specialised establishments 264 40 112 112 112 112 -
Health establishments 1 264 40 40 40 40 40 -
Passenger transport 2 - - 72 72 72 72 -
Tourist campsites 10 633 8 207 6 110 5 669 5 090 5 090 3 381
(1) Although they are health establishments 16 thermal hotels (1 177 beds) are licensed under the hotels since they areproviding hotel Services as 5 or 4 star hotels.
(2) Caravans.
Source: MOT.

AT U R K E Y
Tourism Trends in Mediterranean countries 213
Evolution of bed capacity in accommodation establishments licensed by the Ministry ofTourism
Type of establishments % 90/85 % 95/90 % 96/95 % 97/96 % 98/97 % 99/98
Total 101.5 65.4 5.3 3.9 0.3 -0.9
Hotel and similarestablishments
119.7 69.8 5.5 4.2 0.3 -0.3
Hotel 117.2 72.8 4.7 4.4 0.8 -0.4
Similar establishments 30.8 57.7 9.3 3.2 -2.0 0.2
Tourist campsites -22.8 -25.6 -7.2 -10.2 0.0 -33.6
Source: MOT.
Number of beds in accommodation establishments licensed by the Ministry of Tourism
0
40 000
80 000
120 000
160 000
200 000
240 000
280 000
320 000
1985 1990 1995 1996 1997 1998 1999
Source: MOT.
The bed capacity registered by the Ministry of Tourism (MOT) increased by 101.5% from 1985 to 1990and amounted to 314 215 bed-places in 1998. On the other hand, bed capacity of municipalityregistered qualified establishments increased by 248.3% in the ten year period, accounting for 272477 bed-places in 1997.
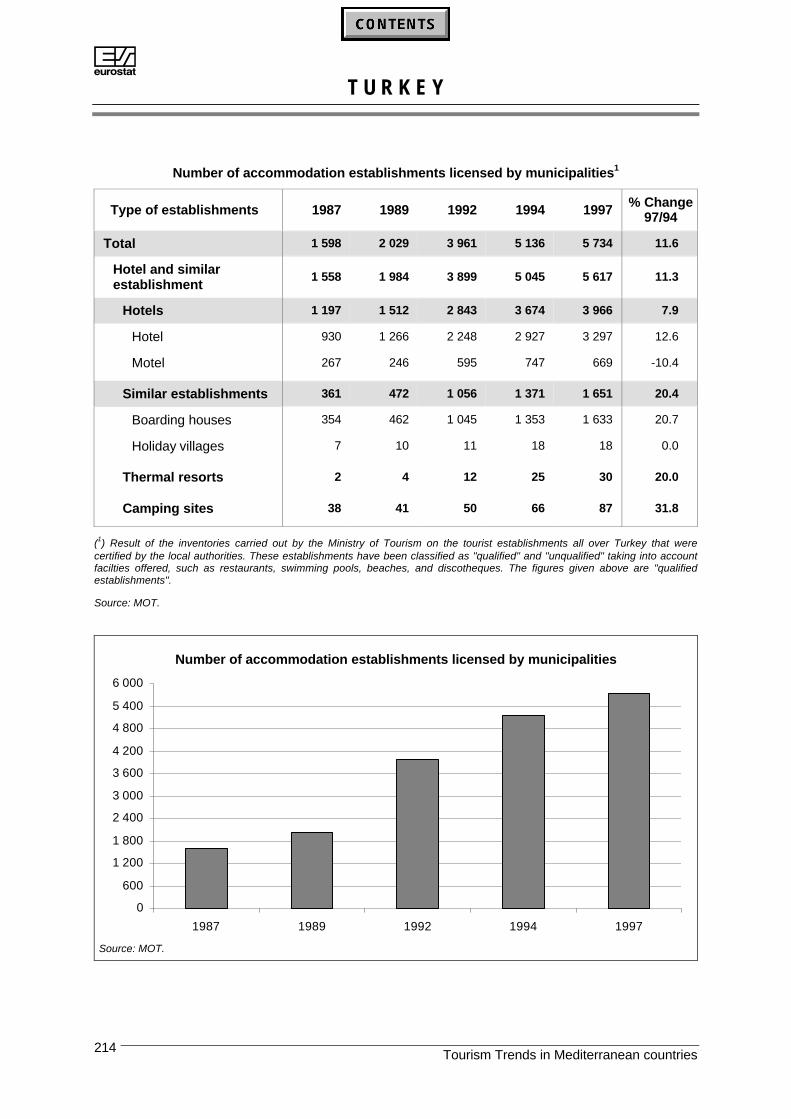
AT U R K E Y
Tourism Trends in Mediterranean countries214
Number of accommodation establishments licensed by municipalities1
Type of establishments 1987 1989 1992 1994 1997 % Change97/94
Total 1 598 2 029 3 961 5 136 5 734 11.6
Hotel and similarestablishment
1 558 1 984 3 899 5 045 5 617 11.3
Hotels 1 197 1 512 2 843 3 674 3 966 7.9
Hotel 930 1 266 2 248 2 927 3 297 12.6
Motel 267 246 595 747 669 -10.4
Similar establishments 361 472 1 056 1 371 1 651 20.4
Boarding houses 354 462 1 045 1 353 1 633 20.7
Holiday villages 7 10 11 18 18 0.0
Thermal resorts 2 4 12 25 30 20.0
Camping sites 38 41 50 66 87 31.8
(1) Result of the inventories carried out by the Ministry of Tourism on the tourist establishments all over Turkey that werecertified by the local authorities. These establishments have been classified as "qualified" and "unqualified" taking into accountfacilties offered, such as restaurants, swimming pools, beaches, and discotheques. The figures given above are "qualifiedestablishments".
Source: MOT.
Number of accommodation establishments licensed by municipalities
0
600
1 200
1 800
2 400
3 000
3 600
4 200
4 800
5 400
6 000
1987 1989 1992 1994 1997
Source: MOT.
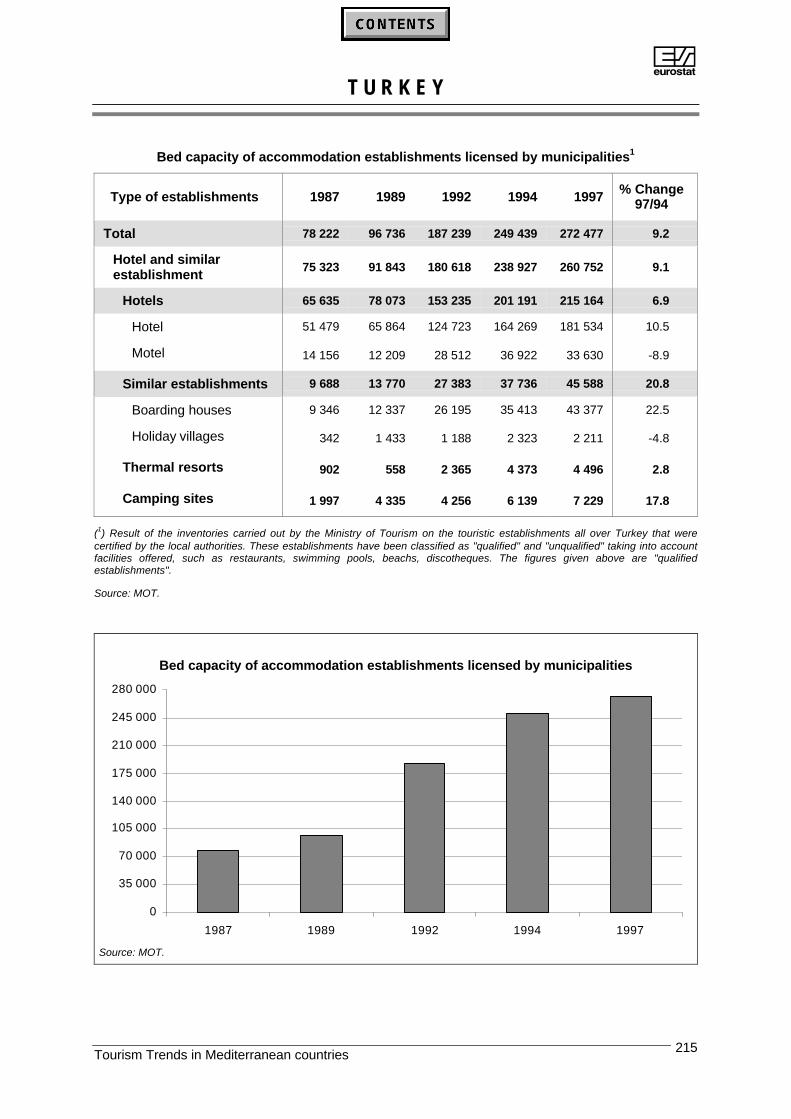
AT U R K E Y
Tourism Trends in Mediterranean countries 215
Bed capacity of accommodation establishments licensed by municipalities1
Type of establishments 1987 1989 1992 1994 1997 % Change97/94
Total 78 222 96 736 187 239 249 439 272 477 9.2
Hotel and similarestablishment
75 323 91 843 180 618 238 927 260 752 9.1
Hotels 65 635 78 073 153 235 201 191 215 164 6.9
Hotel 51 479 65 864 124 723 164 269 181 534 10.5
Motel 14 156 12 209 28 512 36 922 33 630 -8.9
Similar establishments 9 688 13 770 27 383 37 736 45 588 20.8
Boarding houses 9 346 12 337 26 195 35 413 43 377 22.5
Holiday villages 342 1 433 1 188 2 323 2 211 -4.8
Thermal resorts 902 558 2 365 4 373 4 496 2.8
Camping sites 1 997 4 335 4 256 6 139 7 229 17.8
(1) Result of the inventories carried out by the Ministry of Tourism on the touristic establishments all over Turkey that werecertified by the local authorities. These establishments have been classified as "qualified" and "unqualified" taking into accountfacilities offered, such as restaurants, swimming pools, beachs, discotheques. The figures given above are "qualifiedestablishments".
Source: MOT.
Bed capacity of accommodation establishments licensed by municipalities
0
35 000
70 000
105 000
140 000
175 000
210 000
245 000
280 000
1987 1989 1992 1994 1997
Source: MOT.
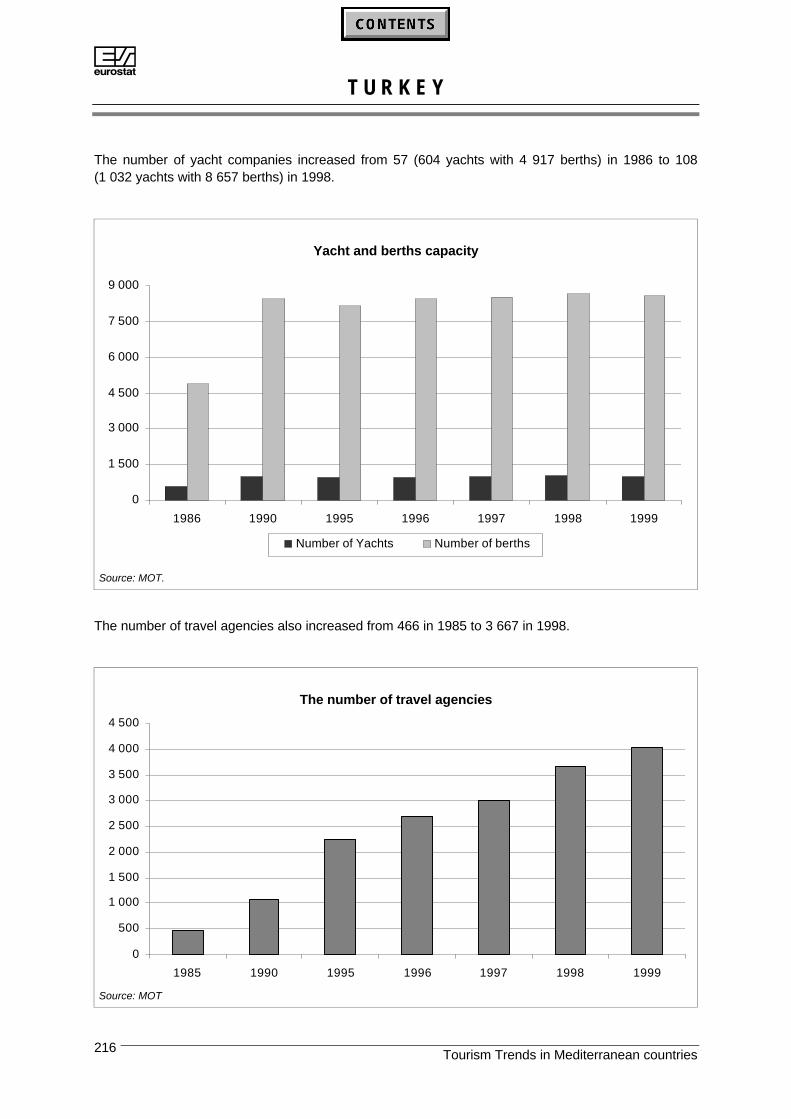
AT U R K E Y
Tourism Trends in Mediterranean countries216
The number of yacht companies increased from 57 (604 yachts with 4 917 berths) in 1986 to 108(1 032 yachts with 8 657 berths) in 1998.
Yacht and berths capacity
0
1 500
3 000
4 500
6 000
7 500
9 000
1986 1990 1995 1996 1997 1998 1999
Number of Yachts Number of berths
Source: MOT.
The number of travel agencies also increased from 466 in 1985 to 3 667 in 1998.
The number of travel agencies
0
500
1 000
1 500
2 000
2 500
3 000
3 500
4 000
4 500
1985 1990 1995 1996 1997 1998 1999
Source: MOT

AT U R K E Y
Tourism Trends in Mediterranean countries 217
Part III: Tourism Demand
Occupancy of collective tourist accommodation establishments: inbound anddomestic tourism
Number of nights spent in the Ministry of Tourism and Municipality1 licensed establishments(in thousands)
1995 1996 1997 1998 1999 %99/95 %99/98
Total
Total 57 808 67 723 80 314 71 553 53 150 -8.1 -25.7
Foreigners 26 262 36 055 46 774 37 618 20 457 -22.1 -45.6
Citizens 31 546 31 668 33 540 33 935 32 693 3.6 -3.7
Establishments licensed by the Ministry of Tourism
Total 28 155 37 038 51 108 45 946 32 297 14.7 -29.7
Foreigners 18 477 25 548 36 167 30 433 15 514 -16.0 -49.0
Citizens 9 678 11 490 14 941 15 513 16 783 73.4 8.2
Establishments licensed by the municipality
Total 29 653 30 685 29 206 25 607 20 853 -29.7 -18.6
Foreigners 7 785 10 507 10 607 7 185 4 943 -36.5 -31.2
Citizens 21 868 20 178 18 599 18 422 15 910 -27.2 -13.6
(1) Result of the inventories carried out by the Ministry of Tourism on the tourisc establishments all over Turkey that werecertified by the local authorities. These establishments have been classified as "qualified" and "unqualified" taking intoconsideration of their services such as restaurants, swimming pools, beachs, and discotheques. The figures given above are"qualified establishments" which have been taken under survey by sampling for the information on nights spent.
Source: MOT (Surveys on MOT licensed and municipality licensed establishments).
According to the “Foreign Visitors Survey”, total nights spent by foreign visitors were evaluated at89.5 million in 1997, while it was 18.8 million in 1987. The share of European countries was 85.3% ofthe total overnights while EU countries share was 65.7%.
Out of above mentioned number of nights spent by foreign visitors, 40.4% was realised in the MOTlicensed accommodation and 11.9% was in municipality registered establishments, which amounts to52.3% of total nights spent in all types of accommodation establishments in 1997.Nevertheless, whenevaluating these figures one should keep in mind that the establishments surveyed, especially forthose who own the municipality licence, may refrain from reflecting the exact number of arrivals andnights spent.
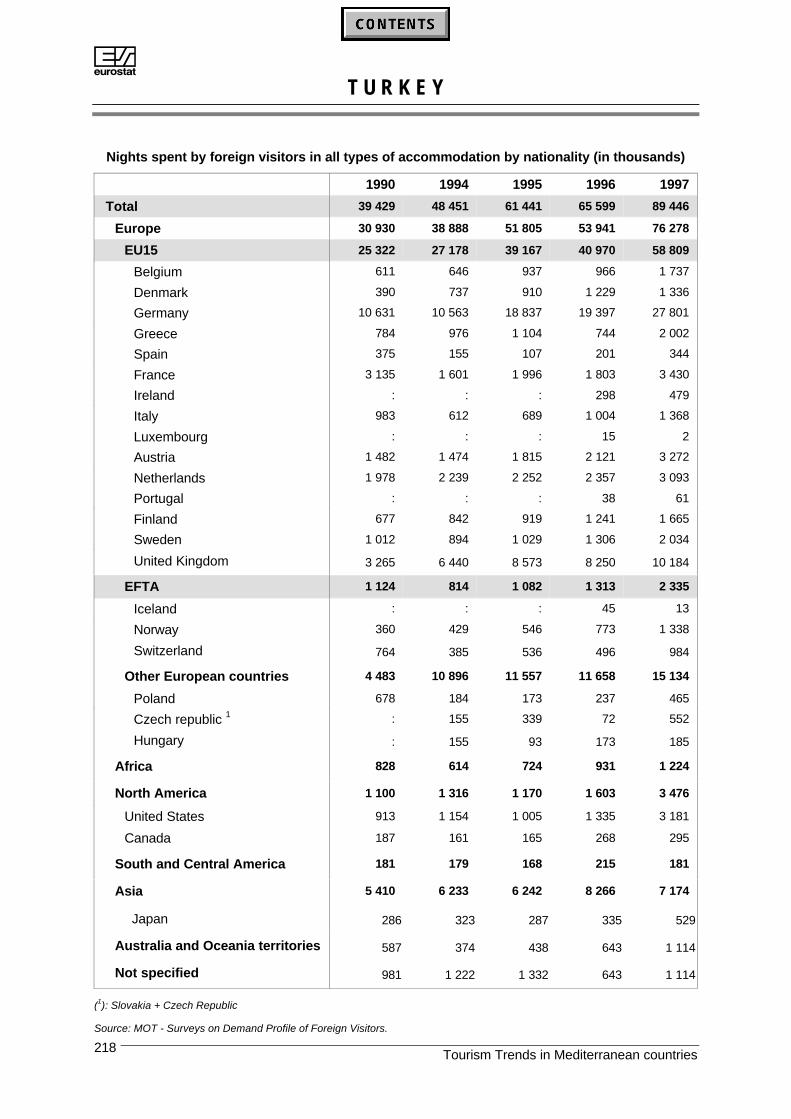
AT U R K E Y
Tourism Trends in Mediterranean countries218
Nights spent by foreign visitors in all types of accommodation by nationality (in thousands)
1990 1994 1995 1996 1997
Total 39 429 48 451 61 441 65 599 89 446
Europe 30 930 38 888 51 805 53 941 76 278
EU15 25 322 27 178 39 167 40 970 58 809
Belgium 611 646 937 966 1 737
Denmark 390 737 910 1 229 1 336
Germany 10 631 10 563 18 837 19 397 27 801
Greece 784 976 1 104 744 2 002
Spain 375 155 107 201 344
France 3 135 1 601 1 996 1 803 3 430
Ireland : : : 298 479
Italy 983 612 689 1 004 1 368
Luxembourg : : : 15 2
Austria 1 482 1 474 1 815 2 121 3 272
Netherlands 1 978 2 239 2 252 2 357 3 093
Portugal : : : 38 61
Finland 677 842 919 1 241 1 665
Sweden 1 012 894 1 029 1 306 2 034
United Kingdom 3 265 6 440 8 573 8 250 10 184
EFTA 1 124 814 1 082 1 313 2 335
Iceland : : : 45 13
Norway 360 429 546 773 1 338
Switzerland 764 385 536 496 984
Other European countries 4 483 10 896 11 557 11 658 15 134
Poland 678 184 173 237 465
Czech republic 1 : 155 339 72 552
Hungary : 155 93 173 185
Africa 828 614 724 931 1 224
North America 1 100 1 316 1 170 1 603 3 476
United States 913 1 154 1 005 1 335 3 181
Canada 187 161 165 268 295
South and Central America 181 179 168 215 181
Asia 5 410 6 233 6 242 8 266 7 174
Japan 286 323 287 335 529
Australia and Oceania territories 587 374 438 643 1 114
Not specified 981 1 222 1 332 643 1 114
(1): Slovakia + Czech Republic
Source: MOT - Surveys on Demand Profile of Foreign Visitors.
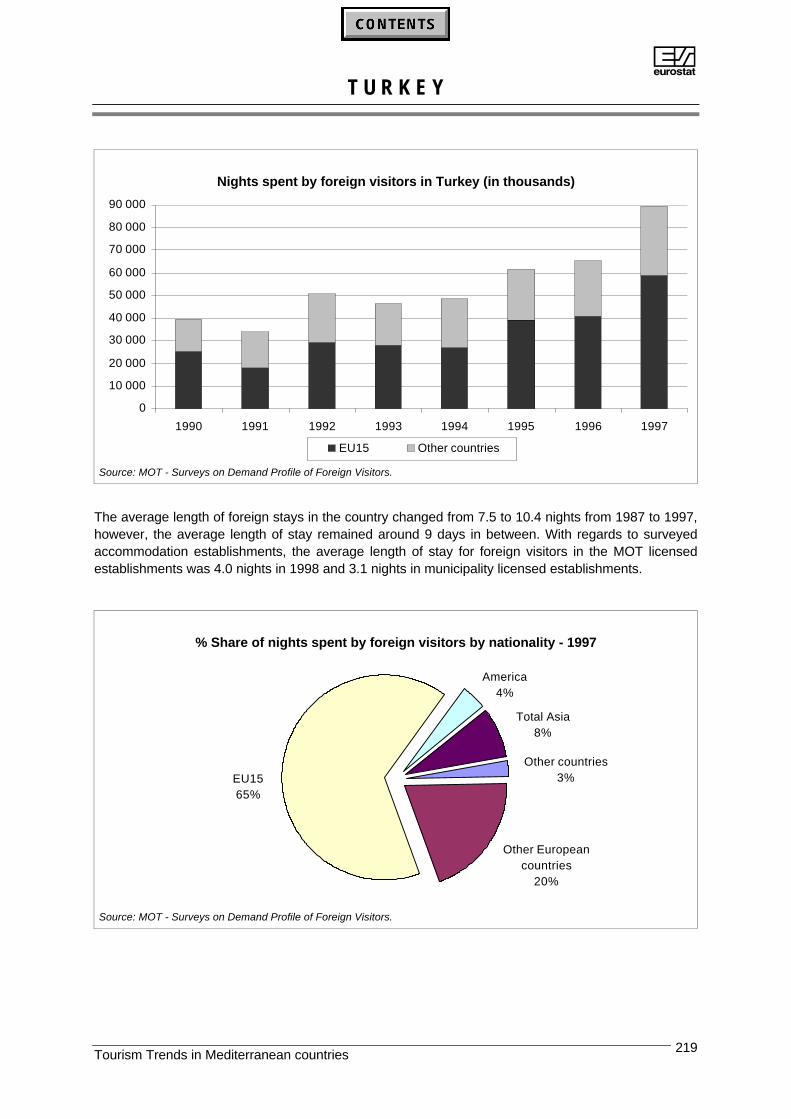
AT U R K E Y
Tourism Trends in Mediterranean countries 219
Nights spent by foreign visitors in Turkey (in thousands)
0
10 000
20 000
30 000
40 000
50 000
60 000
70 000
80 000
90 000
1990 1991 1992 1993 1994 1995 1996 1997
EU15 Other countries
Source: MOT - Surveys on Demand Profile of Foreign Visitors.
The average length of foreign stays in the country changed from 7.5 to 10.4 nights from 1987 to 1997,however, the average length of stay remained around 9 days in between. With regards to surveyedaccommodation establishments, the average length of stay for foreign visitors in the MOT licensedestablishments was 4.0 nights in 1998 and 3.1 nights in municipality licensed establishments.
% Share of nights spent by foreign visitors by nationality - 1997
Other European countries
20%
Total Asia8%
America4%
EU1565%
Other countries3%
Source: MOT - Surveys on Demand Profile of Foreign Visitors.
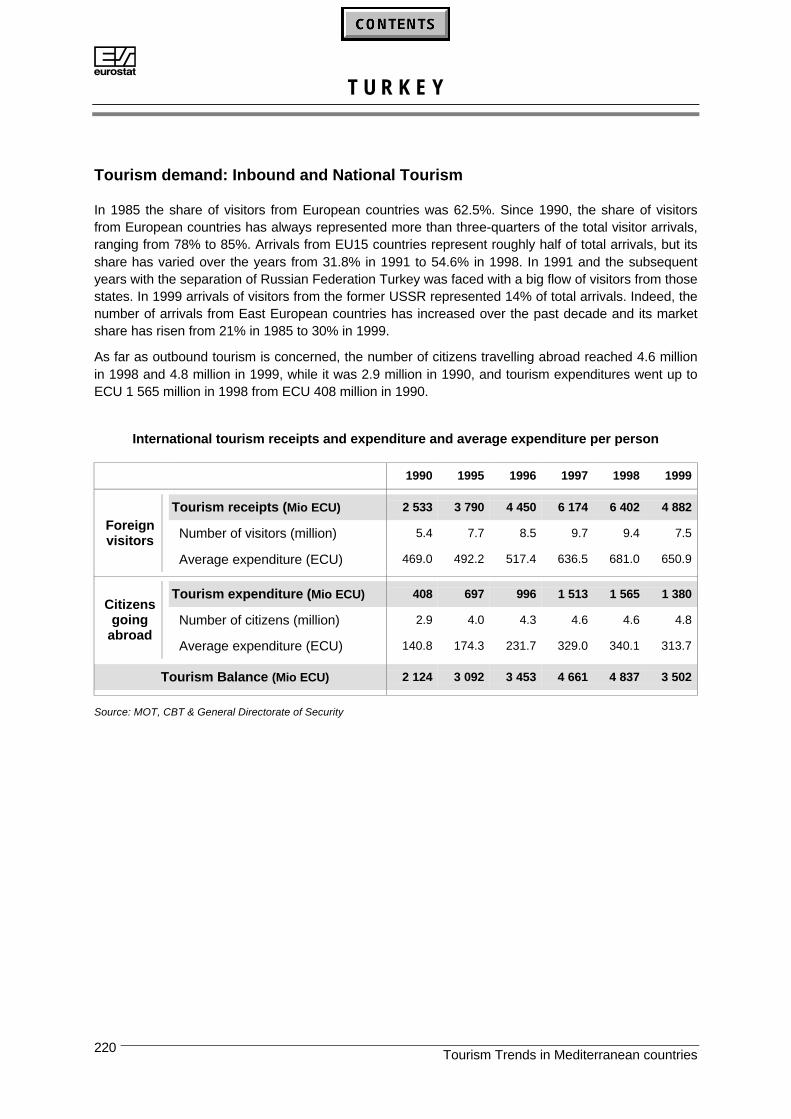
AT U R K E Y
Tourism Trends in Mediterranean countries220
Tourism demand: Inbound and National Tourism
In 1985 the share of visitors from European countries was 62.5%. Since 1990, the share of visitorsfrom European countries has always represented more than three-quarters of the total visitor arrivals,ranging from 78% to 85%. Arrivals from EU15 countries represent roughly half of total arrivals, but itsshare has varied over the years from 31.8% in 1991 to 54.6% in 1998. In 1991 and the subsequentyears with the separation of Russian Federation Turkey was faced with a big flow of visitors from thosestates. In 1999 arrivals of visitors from the former USSR represented 14% of total arrivals. Indeed, thenumber of arrivals from East European countries has increased over the past decade and its marketshare has risen from 21% in 1985 to 30% in 1999.
As far as outbound tourism is concerned, the number of citizens travelling abroad reached 4.6 millionin 1998 and 4.8 million in 1999, while it was 2.9 million in 1990, and tourism expenditures went up toECU 1 565 million in 1998 from ECU 408 million in 1990.
International tourism receipts and expenditure and average expenditure per person
1990 1995 1996 1997 1998 1999
Tourism receipts (Mio ECU) 2 533 3 790 4 450 6 174 6 402 4 882
Number of visitors (million) 5.4 7.7 8.5 9.7 9.4 7.5Foreignvisitors
Average expenditure (ECU) 469.0 492.2 517.4 636.5 681.0 650.9
Tourism expenditure (Mio ECU) 408 697 996 1 513 1 565 1 380
Number of citizens (million) 2.9 4.0 4.3 4.6 4.6 4.8Citizensgoing
abroadAverage expenditure (ECU) 140.8 174.3 231.7 329.0 340.1 313.7
Tourism Balance (Mio ECU) 2 124 3 092 3 453 4 661 4 837 3 502
Source: MOT, CBT & General Directorate of Security
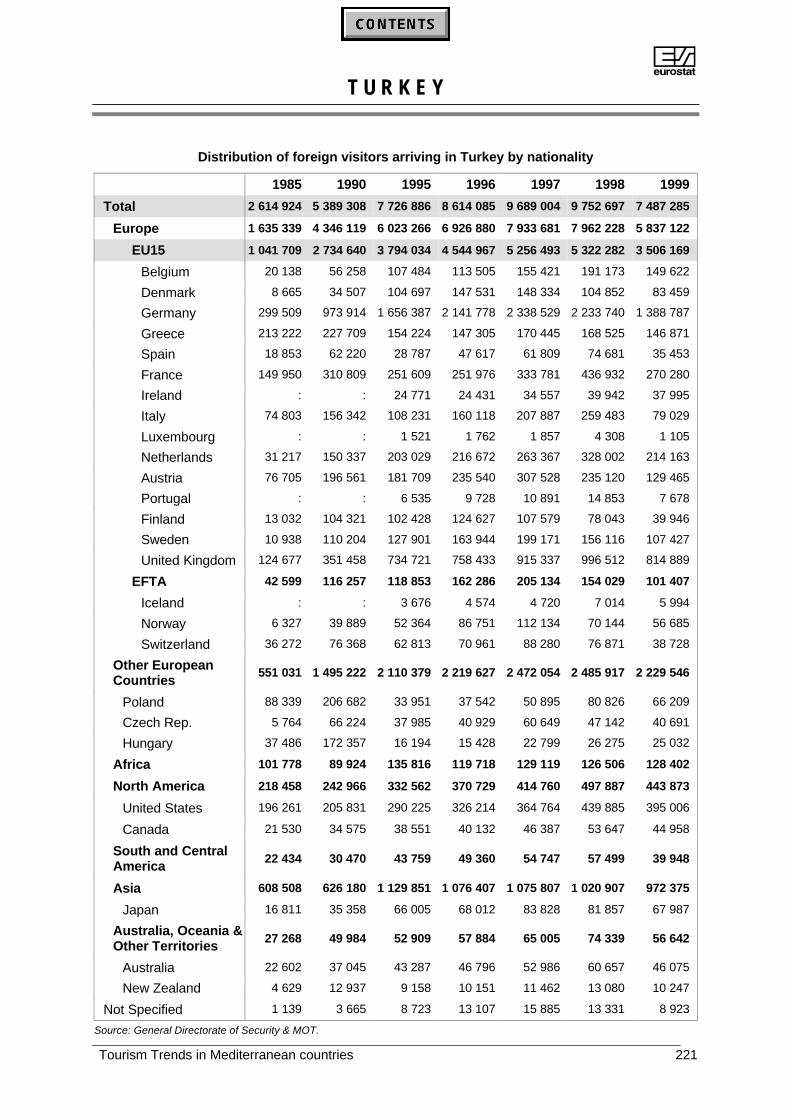
AT U R K E Y
Tourism Trends in Mediterranean countries 221
Distribution of foreign visitors arriving in Turkey by nationality
1985 1990 1995 1996 1997 1998 1999
Total 2 614 924 5 389 308 7 726 886 8 614 085 9 689 004 9 752 697 7 487 285
Europe 1 635 339 4 346 119 6 023 266 6 926 880 7 933 681 7 962 228 5 837 122
EU15 1 041 709 2 734 640 3 794 034 4 544 967 5 256 493 5 322 282 3 506 169
Belgium 20 138 56 258 107 484 113 505 155 421 191 173 149 622
Denmark 8 665 34 507 104 697 147 531 148 334 104 852 83 459
Germany 299 509 973 914 1 656 387 2 141 778 2 338 529 2 233 740 1 388 787
Greece 213 222 227 709 154 224 147 305 170 445 168 525 146 871
Spain 18 853 62 220 28 787 47 617 61 809 74 681 35 453
France 149 950 310 809 251 609 251 976 333 781 436 932 270 280
Ireland : : 24 771 24 431 34 557 39 942 37 995
Italy 74 803 156 342 108 231 160 118 207 887 259 483 79 029
Luxembourg : : 1 521 1 762 1 857 4 308 1 105
Netherlands 31 217 150 337 203 029 216 672 263 367 328 002 214 163
Austria 76 705 196 561 181 709 235 540 307 528 235 120 129 465
Portugal : : 6 535 9 728 10 891 14 853 7 678
Finland 13 032 104 321 102 428 124 627 107 579 78 043 39 946
Sweden 10 938 110 204 127 901 163 944 199 171 156 116 107 427
United Kingdom 124 677 351 458 734 721 758 433 915 337 996 512 814 889
EFTA 42 599 116 257 118 853 162 286 205 134 154 029 101 407
Iceland : : 3 676 4 574 4 720 7 014 5 994
Norway 6 327 39 889 52 364 86 751 112 134 70 144 56 685
Switzerland 36 272 76 368 62 813 70 961 88 280 76 871 38 728
Other EuropeanCountries
551 031 1 495 222 2 110 379 2 219 627 2 472 054 2 485 917 2 229 546
Poland 88 339 206 682 33 951 37 542 50 895 80 826 66 209
Czech Rep. 5 764 66 224 37 985 40 929 60 649 47 142 40 691
Hungary 37 486 172 357 16 194 15 428 22 799 26 275 25 032
Africa 101 778 89 924 135 816 119 718 129 119 126 506 128 402
North America 218 458 242 966 332 562 370 729 414 760 497 887 443 873
United States 196 261 205 831 290 225 326 214 364 764 439 885 395 006
Canada 21 530 34 575 38 551 40 132 46 387 53 647 44 958
South and CentralAmerica
22 434 30 470 43 759 49 360 54 747 57 499 39 948
Asia 608 508 626 180 1 129 851 1 076 407 1 075 807 1 020 907 972 375
Japan 16 811 35 358 66 005 68 012 83 828 81 857 67 987
Australia, Oceania &Other Territories
27 268 49 984 52 909 57 884 65 005 74 339 56 642
Australia 22 602 37 045 43 287 46 796 52 986 60 657 46 075
New Zealand 4 629 12 937 9 158 10 151 11 462 13 080 10 247
Not Specified 1 139 3 665 8 723 13 107 15 885 13 331 8 923
Source: General Directorate of Security & MOT.
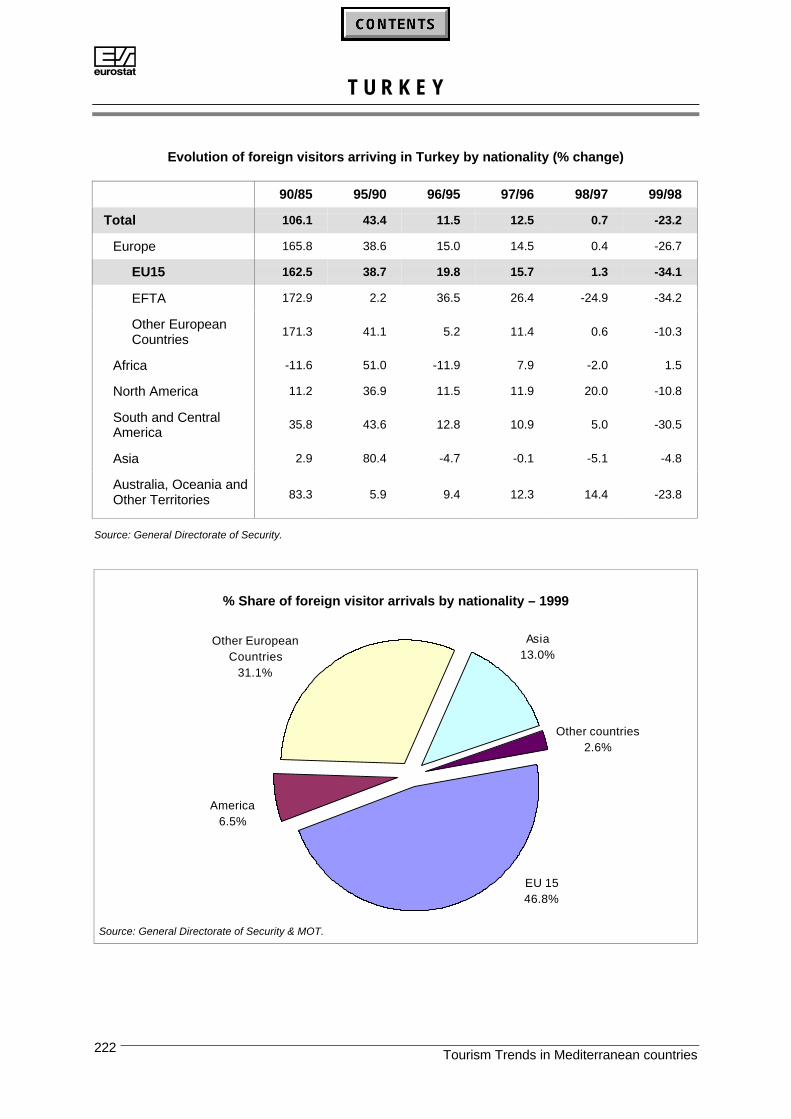
AT U R K E Y
Tourism Trends in Mediterranean countries222
Evolution of foreign visitors arriving in Turkey by nationality (% change)
90/85 95/90 96/95 97/96 98/97 99/98
Total 106.1 43.4 11.5 12.5 0.7 -23.2
Europe 165.8 38.6 15.0 14.5 0.4 -26.7
EU15 162.5 38.7 19.8 15.7 1.3 -34.1
EFTA 172.9 2.2 36.5 26.4 -24.9 -34.2
Other EuropeanCountries
171.3 41.1 5.2 11.4 0.6 -10.3
Africa -11.6 51.0 -11.9 7.9 -2.0 1.5
North America 11.2 36.9 11.5 11.9 20.0 -10.8
South and CentralAmerica
35.8 43.6 12.8 10.9 5.0 -30.5
Asia 2.9 80.4 -4.7 -0.1 -5.1 -4.8
Australia, Oceania andOther Territories 83.3 5.9 9.4 12.3 14.4 -23.8
Source: General Directorate of Security.
% Share of foreign visitor arrivals by nationality – 1999
America6.5%
Other countries2.6%
Asia13.0%
Other European Countries
31.1%
EU 1546.8%
Source: General Directorate of Security & MOT.
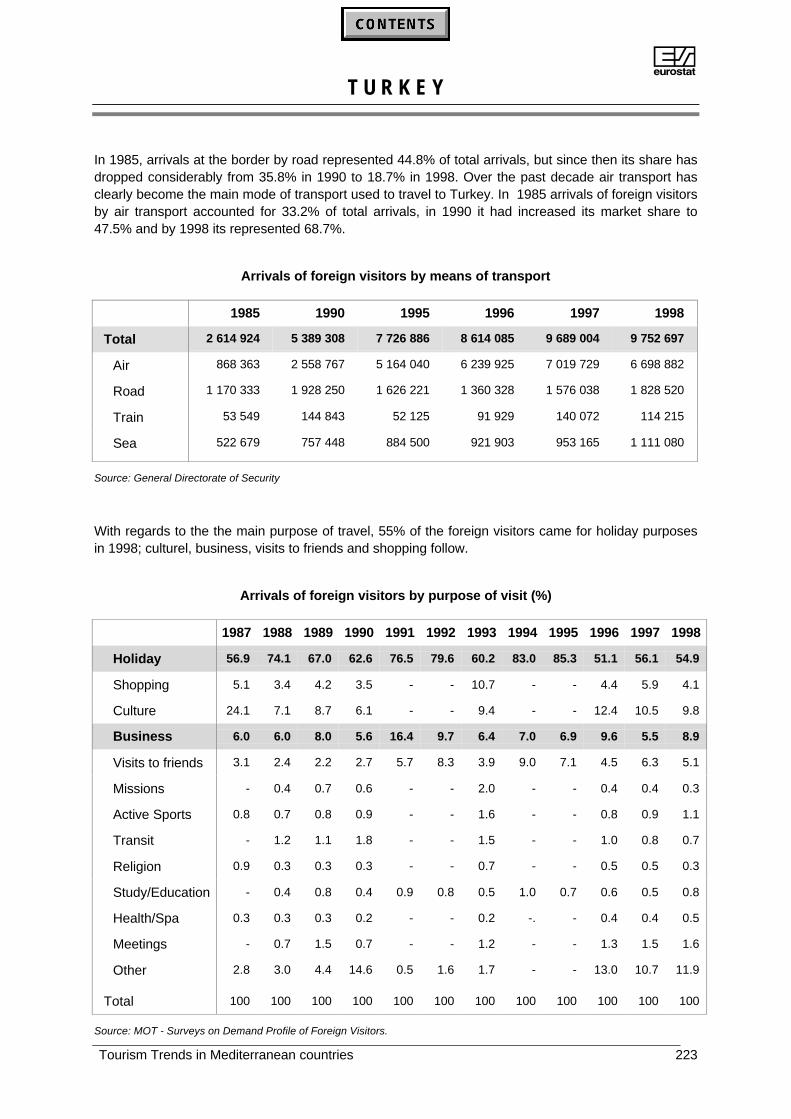
AT U R K E Y
Tourism Trends in Mediterranean countries 223
In 1985, arrivals at the border by road represented 44.8% of total arrivals, but since then its share hasdropped considerably from 35.8% in 1990 to 18.7% in 1998. Over the past decade air transport hasclearly become the main mode of transport used to travel to Turkey. In 1985 arrivals of foreign visitorsby air transport accounted for 33.2% of total arrivals, in 1990 it had increased its market share to47.5% and by 1998 its represented 68.7%.
Arrivals of foreign visitors by means of transport
1985 1990 1995 1996 1997 1998
Total 2 614 924 5 389 308 7 726 886 8 614 085 9 689 004 9 752 697
Air 868 363 2 558 767 5 164 040 6 239 925 7 019 729 6 698 882
Road 1 170 333 1 928 250 1 626 221 1 360 328 1 576 038 1 828 520
Train 53 549 144 843 52 125 91 929 140 072 114 215
Sea 522 679 757 448 884 500 921 903 953 165 1 111 080
Source: General Directorate of Security
With regards to the the main purpose of travel, 55% of the foreign visitors came for holiday purposesin 1998; culturel, business, visits to friends and shopping follow.
Arrivals of foreign visitors by purpose of visit (%)
1987 1988 1989 1990 1991 1992 1993 1994 1995 1996 1997 1998
Holiday 56.9 74.1 67.0 62.6 76.5 79.6 60.2 83.0 85.3 51.1 56.1 54.9
Shopping 5.1 3.4 4.2 3.5 - - 10.7 - - 4.4 5.9 4.1
Culture 24.1 7.1 8.7 6.1 - - 9.4 - - 12.4 10.5 9.8
Business 6.0 6.0 8.0 5.6 16.4 9.7 6.4 7.0 6.9 9.6 5.5 8.9
Visits to friends 3.1 2.4 2.2 2.7 5.7 8.3 3.9 9.0 7.1 4.5 6.3 5.1
Missions - 0.4 0.7 0.6 - - 2.0 - - 0.4 0.4 0.3
Active Sports 0.8 0.7 0.8 0.9 - - 1.6 - - 0.8 0.9 1.1
Transit - 1.2 1.1 1.8 - - 1.5 - - 1.0 0.8 0.7
Religion 0.9 0.3 0.3 0.3 - - 0.7 - - 0.5 0.5 0.3
Study/Education - 0.4 0.8 0.4 0.9 0.8 0.5 1.0 0.7 0.6 0.5 0.8
Health/Spa 0.3 0.3 0.3 0.2 - - 0.2 -. - 0.4 0.4 0.5
Meetings - 0.7 1.5 0.7 - - 1.2 - - 1.3 1.5 1.6
Other 2.8 3.0 4.4 14.6 0.5 1.6 1.7 - - 13.0 10.7 11.9
Total 100 100 100 100 100 100 100 100 100 100 100 100
Source: MOT - Surveys on Demand Profile of Foreign Visitors.
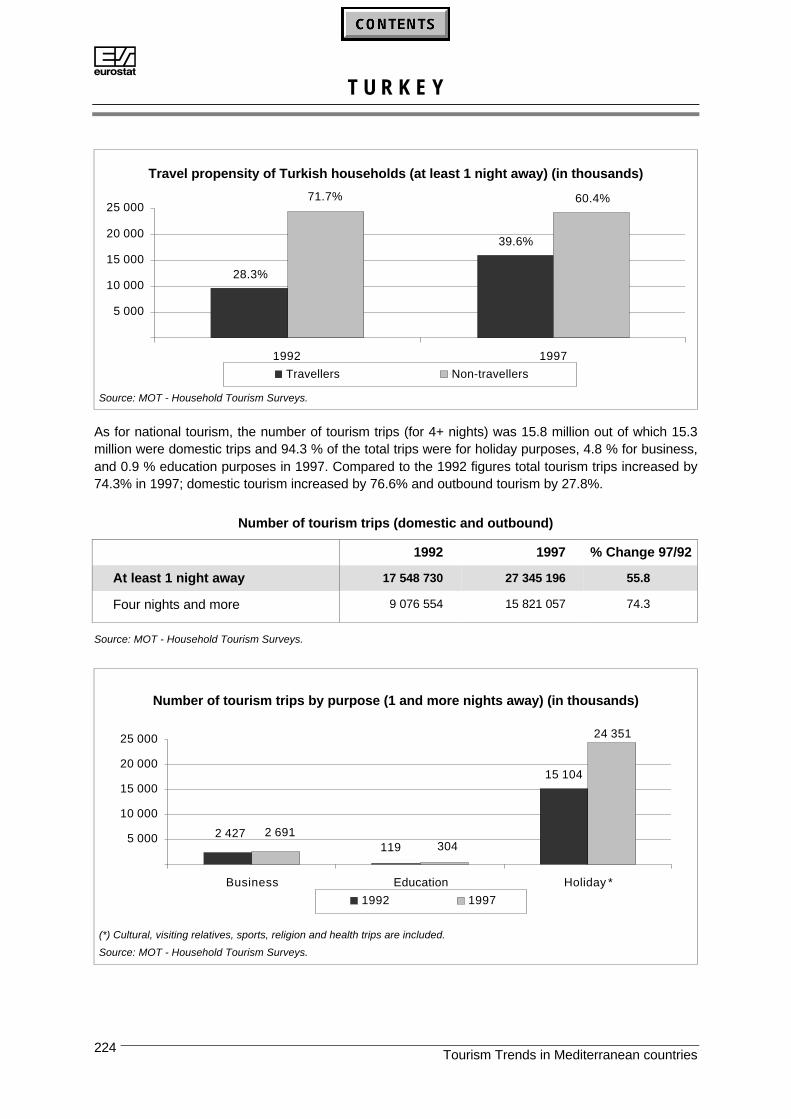
AT U R K E Y
Tourism Trends in Mediterranean countries224
Travel propensity of Turkish households (at least 1 night away) (in thousands)
39.6%
28.3%
60.4% 71.7%
5 000
10 000
15 000
20 000
25 000
1992 1997
Travellers Non-travellers
Source: MOT - Household Tourism Surveys.
As for national tourism, the number of tourism trips (for 4+ nights) was 15.8 million out of which 15.3million were domestic trips and 94.3 % of the total trips were for holiday purposes, 4.8 % for business,and 0.9 % education purposes in 1997. Compared to the 1992 figures total tourism trips increased by74.3% in 1997; domestic tourism increased by 76.6% and outbound tourism by 27.8%.
Number of tourism trips (domestic and outbound)
1992 1997 % Change 97/92
At least 1 night away 17 548 730 27 345 196 55.8
Four nights and more 9 076 554 15 821 057 74.3
Source: MOT - Household Tourism Surveys.
Number of tourism trips by purpose (1 and more nights away) (in thousands)
2 427 119
15 104
2 691 304
24 351
5 000
10 000
15 000
20 000
25 000
Business Education Holiday *
1992 1997
(*) Cultural, visiting relatives, sports, religion and health trips are included.
Source: MOT - Household Tourism Surveys.
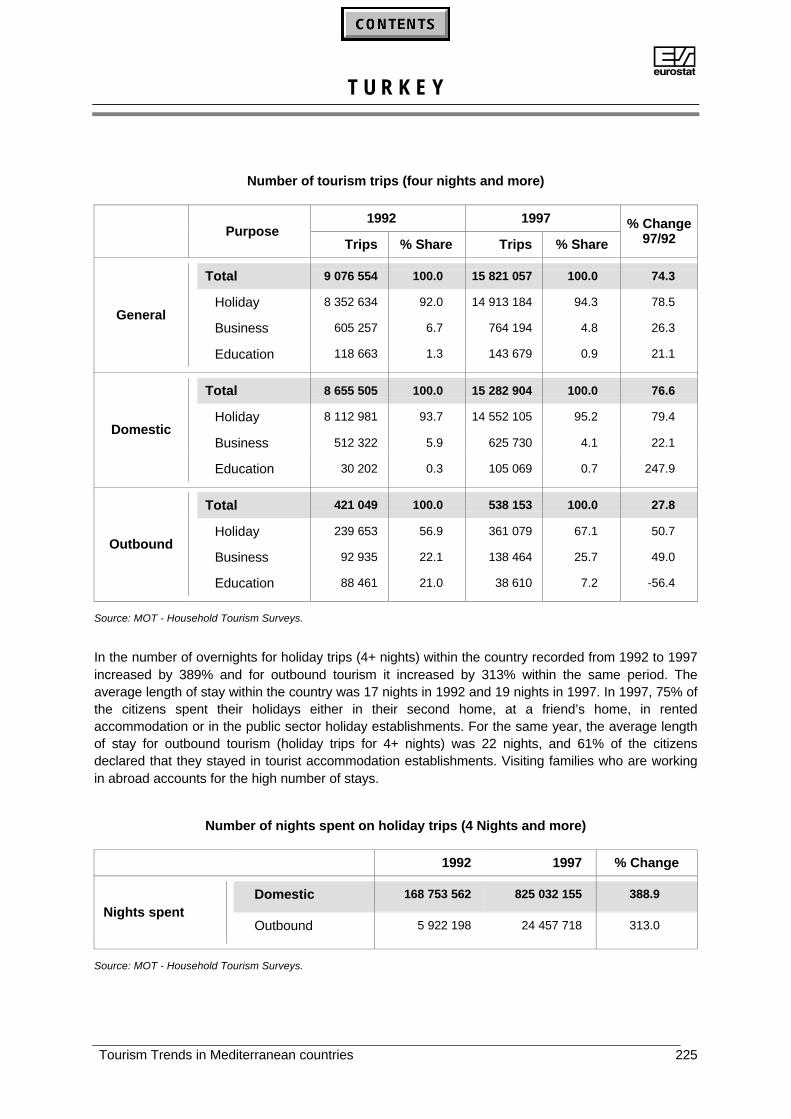
AT U R K E Y
Tourism Trends in Mediterranean countries 225
Number of tourism trips (four nights and more)
1992 1997Purpose
Trips % Share Trips % Share
% Change97/92
Total 9 076 554 100.0 15 821 057 100.0 74.3
Holiday 8 352 634 92.0 14 913 184 94.3 78.5
Business 605 257 6.7 764 194 4.8 26.3General
Education 118 663 1.3 143 679 0.9 21.1
Total 8 655 505 100.0 15 282 904 100.0 76.6
Holiday 8 112 981 93.7 14 552 105 95.2 79.4
Business 512 322 5.9 625 730 4.1 22.1Domestic
Education 30 202 0.3 105 069 0.7 247.9
Total 421 049 100.0 538 153 100.0 27.8
Holiday 239 653 56.9 361 079 67.1 50.7
Business 92 935 22.1 138 464 25.7 49.0Outbound
Education 88 461 21.0 38 610 7.2 -56.4
Source: MOT - Household Tourism Surveys.
In the number of overnights for holiday trips (4+ nights) within the country recorded from 1992 to 1997increased by 389% and for outbound tourism it increased by 313% within the same period. Theaverage length of stay within the country was 17 nights in 1992 and 19 nights in 1997. In 1997, 75% ofthe citizens spent their holidays either in their second home, at a friend’s home, in rentedaccommodation or in the public sector holiday establishments. For the same year, the average lengthof stay for outbound tourism (holiday trips for 4+ nights) was 22 nights, and 61% of the citizensdeclared that they stayed in tourist accommodation establishments. Visiting families who are workingin abroad accounts for the high number of stays.
Number of nights spent on holiday trips (4 Nights and more)
1992 1997 % Change
Domestic 168 753 562 825 032 155 388.9
Nights spentOutbound 5 922 198 24 457 718 313.0
Source: MOT - Household Tourism Surveys.

AT U R K E Y
Tourism Trends in Mediterranean countries226
PART IV: Future Perspectives
The Ministry of Tourism has created many scenarios according to the major criteria of tourism demandand supply. When the trends of 1998 are taken into the consideration, it is forecasted that the numberof foreign visitors will reach up to 12.7 million in the year 2005, with an average expenditure ofUS$ 863 per foreign visitor, amounting to US$ 10.9 billion in international tourism receipts.

ANNEXES
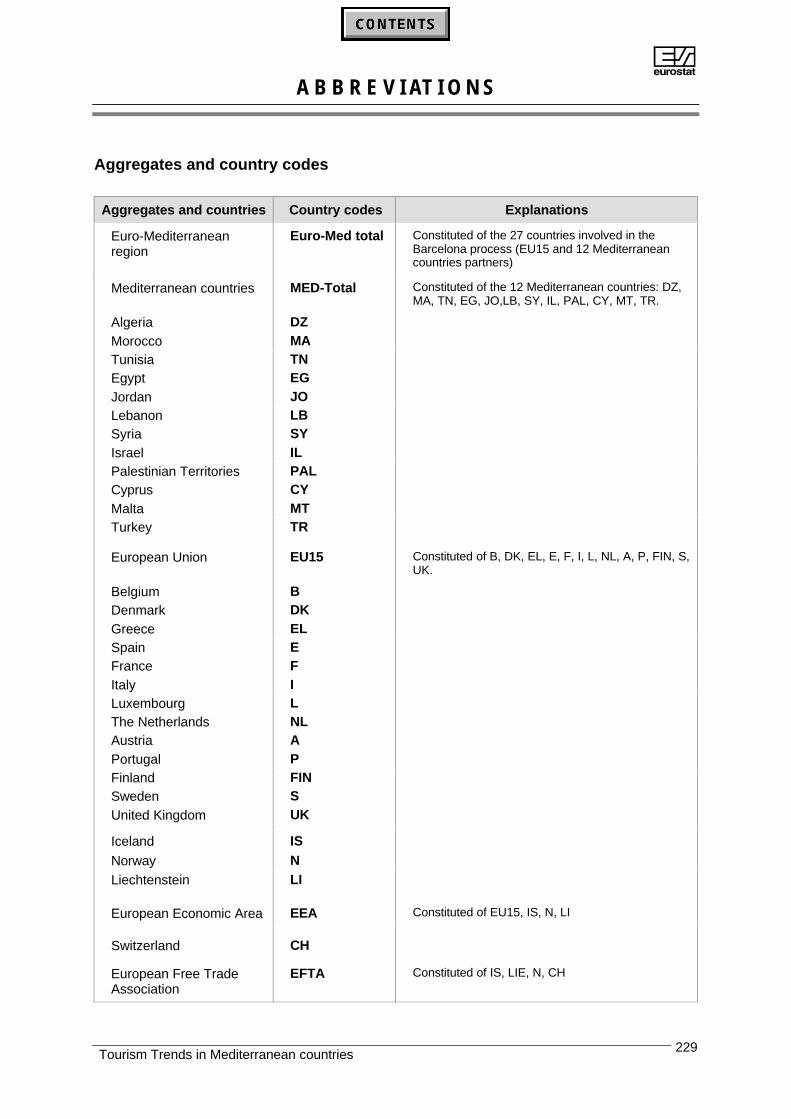
AA B B R E V I AT I O N S
Tourism Trends in Mediterranean countries 229
Aggregates and country codes
Aggregates and countries Country codes Explanations
Euro-Mediterraneanregion
Euro-Med total Constituted of the 27 countries involved in theBarcelona process (EU15 and 12 Mediterraneancountries partners)
Mediterranean countries MED-Total Constituted of the 12 Mediterranean countries: DZ,MA, TN, EG, JO,LB, SY, IL, PAL, CY, MT, TR.
Algeria DZMorocco MATunisia TNEgypt EGJordan JOLebanon LBSyria SYIsrael ILPalestinian Territories PALCyprus CYMalta MTTurkey TR
European Union EU15 Constituted of B, DK, EL, E, F, I, L, NL, A, P, FIN, S,UK.
Belgium BDenmark DKGreece ELSpain EFrance FItaly ILuxembourg LThe Netherlands NLAustria APortugal PFinland FINSweden SUnited Kingdom UK
Iceland ISNorway NLiechtenstein LI
European Economic Area EEA Constituted of EU15, IS, N, LI
Switzerland CH
European Free TradeAssociation
EFTA Constituted of IS, LIE, N, CH
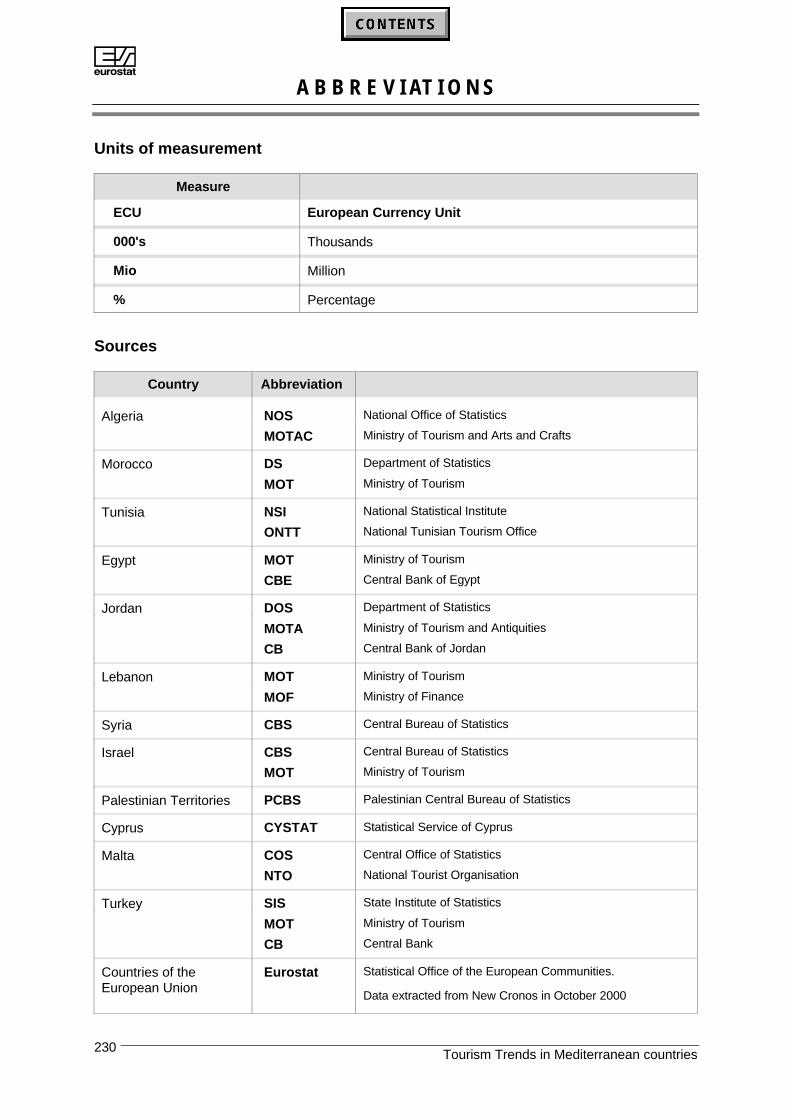
AA B B R E V I AT I O N S
Tourism Trends in Mediterranean countries230
Units of measurement
Measure
ECU European Currency Unit
000's Thousands
Mio Million
% Percentage
Sources
Country Abbreviation
Algeria NOS National Office of Statistics
MOTAC Ministry of Tourism and Arts and Crafts
Morocco DS Department of Statistics
MOT Ministry of Tourism
Tunisia NSI National Statistical Institute
ONTT National Tunisian Tourism Office
Egypt MOT Ministry of Tourism
CBE Central Bank of Egypt
Jordan DOS Department of Statistics
MOTA Ministry of Tourism and Antiquities
CB Central Bank of Jordan
Lebanon MOT Ministry of Tourism
MOF Ministry of Finance
Syria CBS Central Bureau of Statistics
Israel CBS Central Bureau of Statistics
MOT Ministry of Tourism
Palestinian Territories PCBS Palestinian Central Bureau of Statistics
Cyprus CYSTAT Statistical Service of Cyprus
Malta COS Central Office of Statistics
NTO National Tourist Organisation
Turkey SIS State Institute of Statistics
MOT Ministry of Tourism
CB Central Bank
Countries of theEuropean Union
Eurostat Statistical Office of the European Communities.
Data extracted from New Cronos in October 2000

AT E C H N I C A L N O T E S
Tourism Trends in Mediterranean countries 231
The availability and comparability of data vary from country to country. Due to differences in datacollection methods and methodological approaches used by the 12 non EU Mediterranean countriesdata are not fully harmonised.
For the countries of the European Union the tourism statistics used in this publication are part of thosecollected at European level in accordance with the Council Directive 95/57/EC of 23 November 1995.This Directive provides for comparable and harmonised statistics.
The geographical groupings refer generally to that used by the World Tourism Organisation.
Monetary figures are presented in ECU calculated according to the respective average annualexchange rates. In most cases the conversion into ECU has been made using the US$ exchange rate.In the case of Egypt for monetary figures presented according to the fiscal year (1 July to 30 June), thecorresponding monthly annual exchange rates have been used to calculate the average annualexchange rate for that period.
Balance of Payments data are in line with the definitions in the Balance of Payments Manual by theInternational Monetary Fund. The "Balance of Payments" is defined as the record of a country'sinternational transactions with the rest of the world (or, in other words, transactions of its residents withnon-residents). Data in this publication mainly focus on transactions concerning "Travel". "Travel"covers goods and services acquired from an economy by non-resident travellers during their stay onthe territory of that economy and for their own use. It excludes receipts and expenditures forinternational passenger transport.
The terminology specific to tourism used in this publication is fully in line with the definitions developedby the World Tourism Organisation and Eurostat’s Community Methodology on Tourism Statistics(ISBN 92-828-1921-38).
Terms and definitions:
TOURISM is the activities of persons travelling to and staying in places outside their usual environment
for not more than one consecutive year for leisure, business and other purposes.
DOMESTIC TOURISM1 comprises the activities of residents of a given area travelling only within thatarea, but outside their usual environment;
INBOUND TOURISM as comprises the activities of non-residents travelling in a given area that is outsidetheir usual environment;
OUTBOUND TOURISM comprises the activities of residents of a given area travelling to and staying inplaces outside that area (and outside their usual environment).
NATIONAL TOURISM comprises "domestic tourism" and "outbound tourism".
VISITORS: persons travelling to a place other than that of his/her usual environment for less thantwelve consecutive months and whose main purpose of travel is other than the exercise of an activityremunerated from within the place visited.
TOURISTS: overnight visitors
INTERNATIONAL TOURISTS: international visitors who stay at least one night in collective or privateaccommodation in the country visited.
1 The term "Domestic" in the tourism context differs from its use in the System of National Accounts. In the national accounts context it refers to activities
and expenditures of both residents and non- residents travelling within the given area, which in tourism terms is domestic and inbound tourism.

AT E C H N I C A L N O T E S
Tourism Trends in Mediterranean countries232
TOURIST ACCOMMODATION is any facility that regularly or occasionally provides overnightaccommodation for visitors.
COLLECTIVE TOURIST ACCOMMODATION ESTABLISHMENTS: Establishments which provide overnightlodging for the traveller in a room or some other unit. The number of places it provides must be greaterthan a specified minimum amount for groups of person exceeding a single family unit and all theplaces in the establishments must come under a common commercial-type management, even if it isnon-profit making.
HOTELS AND SIMILAR ESTABLISHMENTS are collective accommodation establishments typified as beingarranged in rooms, in numbers exceeding a specified minimum, and as providing certain servicesincluding room services and daily bed-making and cleaning of the sanitary facilities.
HOTELS: comprise hotels, apartment hotels, motels, roadside inns, beach hotels, residential clubs andsimilar establishments providing hotel services including more than daily bed-making and cleaning ofthe room and sanitary facilities.
SIMILAR ESTABLISHMENTS: comprise rooming and boarding houses, tourist residence and similaraccommodation arranged in rooms and providing limited hotel services including daily bed-making andcleaning of the room and sanitary facilities. This group also includes guesthouses, Bed & Breakfastand farmhouse accommodation.
OTHER COLLECTIVE ESTABLISHMENTS AND SPECIALISED ESTABLISHMENTS: are any establishment,intended for tourists, which may be non-profit making, coming under a common management,providing minimum common services (not including daily bed-making) and not necessarily beingarranged in rooms but perhaps in dwelling-type units, campsites or collective dormitories and oftenengaging in some activity besides the provision of accommodation, such as health care, social welfareor transport.
HOLIDAY DWELLINGS: include collective facilities under common management, such as clusters ofhouses or bungalows arranged as dwelling-type accommodation and providing limited hotel services(not including daily bed-making and cleaning).
TOURIST CAMPSITES: consists of collective facilities in enclosed areas for tents, caravans, trailers andmobile homes. All come under common management and provide some tourist services (shop,information, and recreational activities).
OTHER COLLECTIVE ESTABLISHMENTS N.E.C.: comprise youth hostels, tourist dormitories, groupaccommodation, holiday homes for the elderly, holiday accommodation for employees and workers'hotels, halls of residence for students and school dormitories, and other similar facilities that comeunder common management, have a social interest and are often subsidised.
PRIVATE TOURIST ACCOMMODATION: private tourist accommodation provides, for rent or without charge alimited number of places. Each accommodation unit (room, dwelling) is independent and is occupiedby tourists, usually by week or weekend, fortnight or month, or by its owners as a second home orholiday home.
ESTABLISHMENTS: the local unit is an enterprise or part thereof situated in a geographically identifiedplace. At or from this place economic activity is carried out for which - save for certain exceptions - oneor more persons work (even if only part-time) for one and the same enterprise.
BEDROOMS: A bedroom is the unit formed by one room or groups of rooms constituting an indivisiblerental whole in an accommodation establishment or dwelling.
BED-PLACES: The number of bed-places in an establishment or dwelling is determined by the numberof persons who can stay overnight in the beds set up in the establishment (dwelling), ignoring anyextra beds that may be set up by customer request. The term bed-place applies to a single bed,double bed being counted as two bed-places. The unit serves to measure the capacity of any type of

AT E C H N I C A L N O T E S
Tourism Trends in Mediterranean countries 233
accommodation. A bed-place is also a place on a pitch or in a boat on a mooring to accommodate oneperson. One camping pitch should equal four bed-places if the actual number of bed-places is notknown.
NIGHTS SPENT BY RESIDENTS AND NON-RESIDENTS: a night spent (or overnight stay) is each night that aguest actually spends (sleeps or stays) or is registered (his/her physical presence there beingunnecessary) in a collective accommodation establishment or in private tourism accommodation.
NET USE OF BEDPLACES: the net occupancy rate of bed-places in one month is obtained by dividing totalovernight stays by the product of the bed-places on offer and the number of days when the bed-placesare actually available for use (net of seasonal closures and other temporary closures for decoration, bypolice order, etc.) for the same group of establishments, multiplying the quotient by 100 to express theresult as a percentage.
GROSS USE OF BEDPLACES: the gross occupancy rate of bed-places in one month is obtained bydividing total overnight stays by the product of the bed-places and the number of days in thecorresponding month (sometimes termed bed-nights) for the same group of establishments,multiplying the quotient by 100 to express the result as a percentage.
AVERAGE SIZE OF ACCOMMODATION ESTABLISHMENTS: this is calculated by dividing the number ofaccommodation establishment (e.g. hotels, hotels and similar establishments) by the correspondingnumber of bed-places. When making cross-country comparisons this indicator can be subject to biasbecause of the statistical coverage applied in the individual countries. Establishments are usuallyconsidered in statistics only if they reach a minimum number of bed-places, and these thresholds canvary from country to country. Thus the exclusion of small establishments inflates the average of eachcountry and the use of different thresholds affects the comparison among the countries.
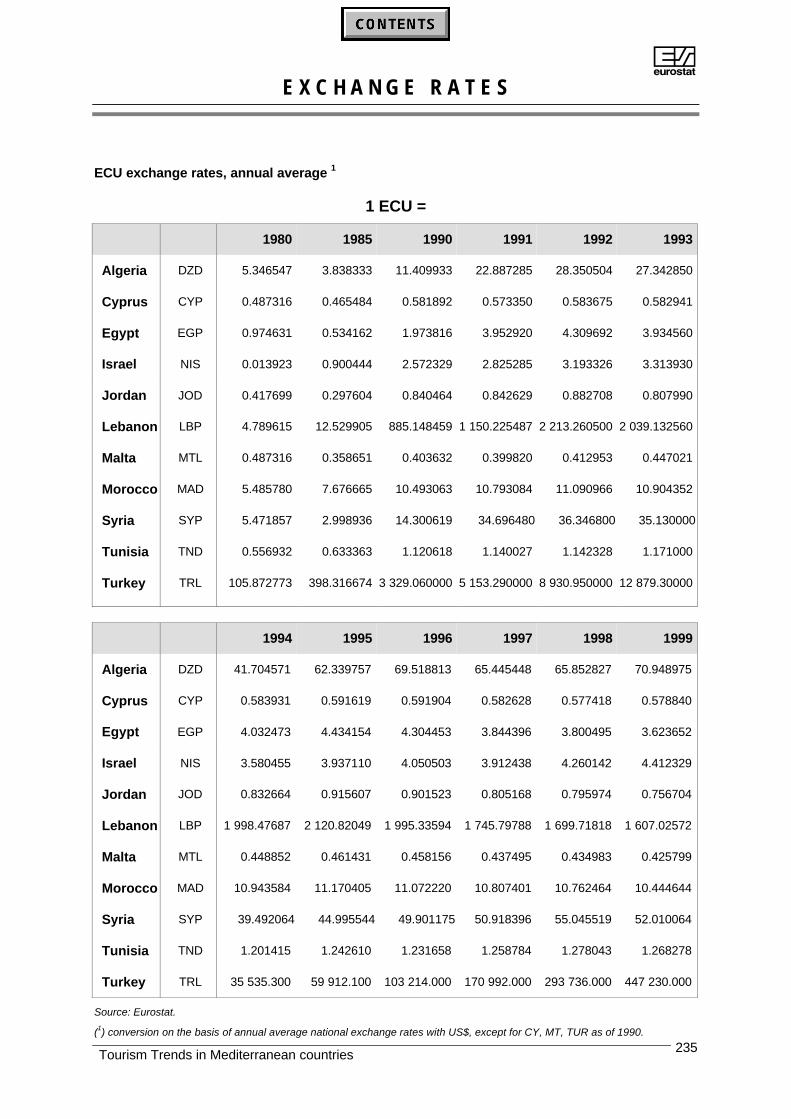
AE X C H A N G E R A T E S
Tourism Trends in Mediterranean countries 235
ECU exchange rates, annual average 1
1 ECU =
1980 1985 1990 1991 1992 1993
Algeria DZD 5.346547 3.838333 11.409933 22.887285 28.350504 27.342850
Cyprus CYP 0.487316 0.465484 0.581892 0.573350 0.583675 0.582941
Egypt EGP 0.974631 0.534162 1.973816 3.952920 4.309692 3.934560
Israel NIS 0.013923 0.900444 2.572329 2.825285 3.193326 3.313930
Jordan JOD 0.417699 0.297604 0.840464 0.842629 0.882708 0.807990
Lebanon LBP 4.789615 12.529905 885.148459 1 150.225487 2 213.260500 2 039.132560
Malta MTL 0.487316 0.358651 0.403632 0.399820 0.412953 0.447021
Morocco MAD 5.485780 7.676665 10.493063 10.793084 11.090966 10.904352
Syria SYP 5.471857 2.998936 14.300619 34.696480 36.346800 35.130000
Tunisia TND 0.556932 0.633363 1.120618 1.140027 1.142328 1.171000
Turkey TRL 105.872773 398.316674 3 329.060000 5 153.290000 8 930.950000 12 879.30000
1994 1995 1996 1997 1998 1999
Algeria DZD 41.704571 62.339757 69.518813 65.445448 65.852827 70.948975
Cyprus CYP 0.583931 0.591619 0.591904 0.582628 0.577418 0.578840
Egypt EGP 4.032473 4.434154 4.304453 3.844396 3.800495 3.623652
Israel NIS 3.580455 3.937110 4.050503 3.912438 4.260142 4.412329
Jordan JOD 0.832664 0.915607 0.901523 0.805168 0.795974 0.756704
Lebanon LBP 1 998.47687 2 120.82049 1 995.33594 1 745.79788 1 699.71818 1 607.02572
Malta MTL 0.448852 0.461431 0.458156 0.437495 0.434983 0.425799
Morocco MAD 10.943584 11.170405 11.072220 10.807401 10.762464 10.444644
Syria SYP 39.492064 44.995544 49.901175 50.918396 55.045519 52.010064
Tunisia TND 1.201415 1.242610 1.231658 1.258784 1.278043 1.268278
Turkey TRL 35 535.300 59 912.100 103 214.000 170 992.000 293 736.000 447 230.000
Source: Eurostat.
(1) conversion on the basis of annual average national exchange rates with US$, except for CY, MT, TUR as of 1990.
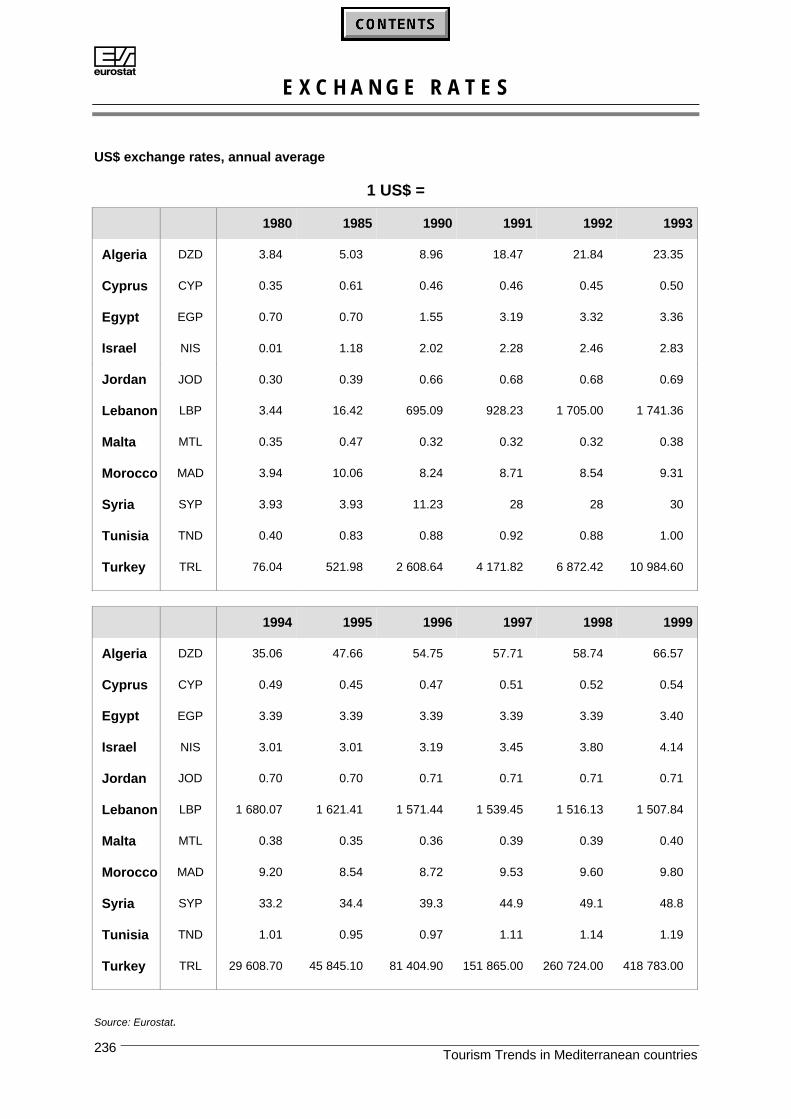
AE X C H A N G E R A T E S
Tourism Trends in Mediterranean countries236
US$ exchange rates, annual average
1 US$ =
1980 1985 1990 1991 1992 1993
Algeria DZD 3.84 5.03 8.96 18.47 21.84 23.35
Cyprus CYP 0.35 0.61 0.46 0.46 0.45 0.50
Egypt EGP 0.70 0.70 1.55 3.19 3.32 3.36
Israel NIS 0.01 1.18 2.02 2.28 2.46 2.83
Jordan JOD 0.30 0.39 0.66 0.68 0.68 0.69
Lebanon LBP 3.44 16.42 695.09 928.23 1 705.00 1 741.36
Malta MTL 0.35 0.47 0.32 0.32 0.32 0.38
Morocco MAD 3.94 10.06 8.24 8.71 8.54 9.31
Syria SYP 3.93 3.93 11.23 28 28 30
Tunisia TND 0.40 0.83 0.88 0.92 0.88 1.00
Turkey TRL 76.04 521.98 2 608.64 4 171.82 6 872.42 10 984.60
1994 1995 1996 1997 1998 1999
Algeria DZD 35.06 47.66 54.75 57.71 58.74 66.57
Cyprus CYP 0.49 0.45 0.47 0.51 0.52 0.54
Egypt EGP 3.39 3.39 3.39 3.39 3.39 3.40
Israel NIS 3.01 3.01 3.19 3.45 3.80 4.14
Jordan JOD 0.70 0.70 0.71 0.71 0.71 0.71
Lebanon LBP 1 680.07 1 621.41 1 571.44 1 539.45 1 516.13 1 507.84
Malta MTL 0.38 0.35 0.36 0.39 0.39 0.40
Morocco MAD 9.20 8.54 8.72 9.53 9.60 9.80
Syria SYP 33.2 34.4 39.3 44.9 49.1 48.8
Tunisia TND 1.01 0.95 0.97 1.11 1.14 1.19
Turkey TRL 29 608.70 45 845.10 81 404.90 151 865.00 260 724.00 418 783.00
Source: Eurostat.