Embed Size (px)
Citation preview

helmstargroup.com
Economic Outlook
The Helmstar Group is a Registered Investment Advisory Firm
When Rates Go Up, Do Stocks Go Down?
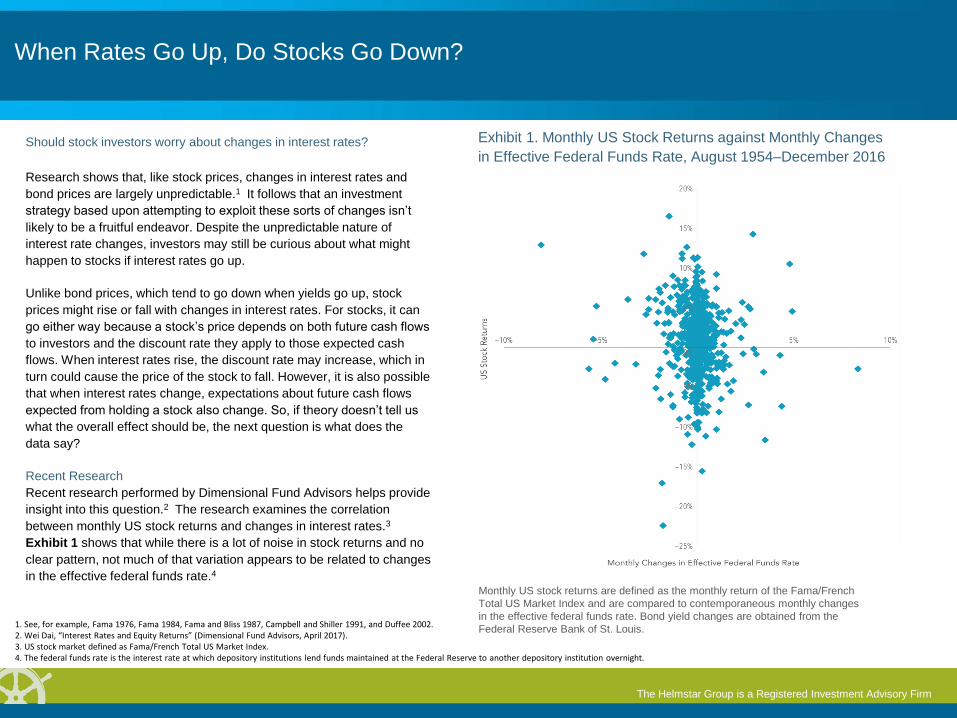
Should stock investors worry about changes in interest rates?
Research shows that, like stock prices, changes in interest rates and
bond prices are largely unpredictable.1 It follows that an investment
strategy based upon attempting to exploit these sorts of changes isn’t
likely to be a fruitful endeavor. Despite the unpredictable nature of
interest rate changes, investors may still be curious about what might
happen to stocks if interest rates go up.
Unlike bond prices, which tend to go down when yields go up, stock
prices might rise or fall with changes in interest rates. For stocks, it can
go either way because a stock’s price depends on both future cash flows
to investors and the discount rate they apply to those expected cash
flows. When interest rates rise, the discount rate may increase, which in
turn could cause the price of the stock to fall. However, it is also possible
that when interest rates change, expectations about future cash flows
expected from holding a stock also change. So, if theory doesn’t tell us
what the overall effect should be, the next question is what does the
data say?
Recent Research
Recent research performed by Dimensional Fund Advisors helps provide
insight into this question.2 The research examines the correlation
between monthly US stock returns and changes in interest rates.3
Exhibit 1 shows that while there is a lot of noise in stock returns and no
clear pattern, not much of that variation appears to be related to changes
in the effective federal funds rate.4
Monthly US stock returns are defined as the monthly return of the Fama/French
Total US Market Index and are compared to contemporaneous monthly changes
in the effective federal funds rate. Bond yield changes are obtained from the
Federal Reserve Bank of St. Louis.
Exhibit 1. Monthly US Stock Returns against Monthly Changes
in Effective Federal Funds Rate, August 1954–December 2016
1. See, for example, Fama 1976, Fama 1984, Fama and Bliss 1987, Campbell and Shiller 1991, and Duffee 2002. 2. Wei Dai, “Interest Rates and Equity Returns” (Dimensional Fund Advisors, April 2017). 3. US stock market defined as Fama/French Total US Market Index. 4. The federal funds rate is the interest rate at which depository institutions lend funds maintained at the Federal Reserve to another depository institution overnight.
1. See, for example, Fama 1976, Fama 1984, Fama and Bliss 1987, Campbell and Shiller 1991, and Duffee 2002. 2. Wei Dai, “Interest Rates and Equity Returns” (Dimensional Fund Advisors, April 2017). 3. US stock market defined as Fama/French Total US Market Index. 4. The federal funds rate is the interest rate at which depository institutions lend funds maintained at the Federal Reserve to another depository institution overnight.
The Helmstar Group is a Registered Investment Advisory Firm
When Rates Go Up, Do Stocks Go Down?
For example, in months when the federal funds rate rose, stock returns
were as low as –15.56% and as high as 14.27%. In months when rates
fell, returns ranged from –22.41% to 16.52%. Given that there are many
other interest rates besides just the federal funds rate, Dai also examined
longer-term interest rates and found similar results.
So to address our initial question: when rates go up, do stock prices go
down? The answer is yes, but only about 40% of the time. In the
remaining 60% of months, stock returns were positive. This split between
positive and negative returns was about the same when examining all
months, not just those in which rates went up. In other words, there is not
a clear link between stock returns and interest rate changes.
CONCLUSION
There’s no evidence that investors can reliably predict changes in interest
rates. Even with perfect knowledge of what will happen with future
interest rate changes, this information provides little guidance about
subsequent stock returns. Instead, staying invested and avoiding the
temptation to make changes based on short-term predictions may
increase the likelihood of consistently capturing what the stock market
has to offer.
GLOSSARY
Discount Rate: Also known as the “required rate of return,” this is the
expected return investors demand for holding a stock.
Correlation: A statistical measure that indicates the extent to which two
variables are related or move together. Correlation is positive when two
variables tend to move in the same direction and negative when they tend
to move in opposite directions.
INDEX DESCRIPTIONS
Fama/French Total US Market Index: Provided by Fama/French from
CRSP securities data. Includes all US operating companies trading on the
NYSE, AMEX, or Nasdaq NMS. Excludes ADRs, investment companies,
tracking stocks, non-US incorporated companies, closed-end funds,
certificates, shares of beneficial interests, and Berkshire Hathaway Inc.
(Permco 540).
Source: Dimensional Fund Advisors LP. Results shown during periods prior to each Index’s index inception date do not represent actual returns of the respective index. Other periods selected may have different results, including losses. Backtested index performance is hypothetical and is provided for informational purposes only to indicate historical performance had the index been calculated over the relevant time periods. Backtested performance results assume the reinvestment of dividends and capital gains. Eugene Fama and Ken French are members of the Board of Directors for and provide consulting services to Dimensional Fund Advisors LP. There is no guarantee investment strategies will be successful. Investing involves risks including possible loss of principal. All expressions of opinion are subject to change. This article is distributed for informational purposes, and it is not to be construed as an offer, solicitation, recommendation, or endorsement of any particular security, products, or services.
The Helmstar Group is a Registered Investment Advisory Firm
Market Summary
US Stock
Market
International
Developed
Stocks
Emerging
Markets
Stocks
Global
Real
Estate
US Bond
Market
Global
Bond
Market
ex US
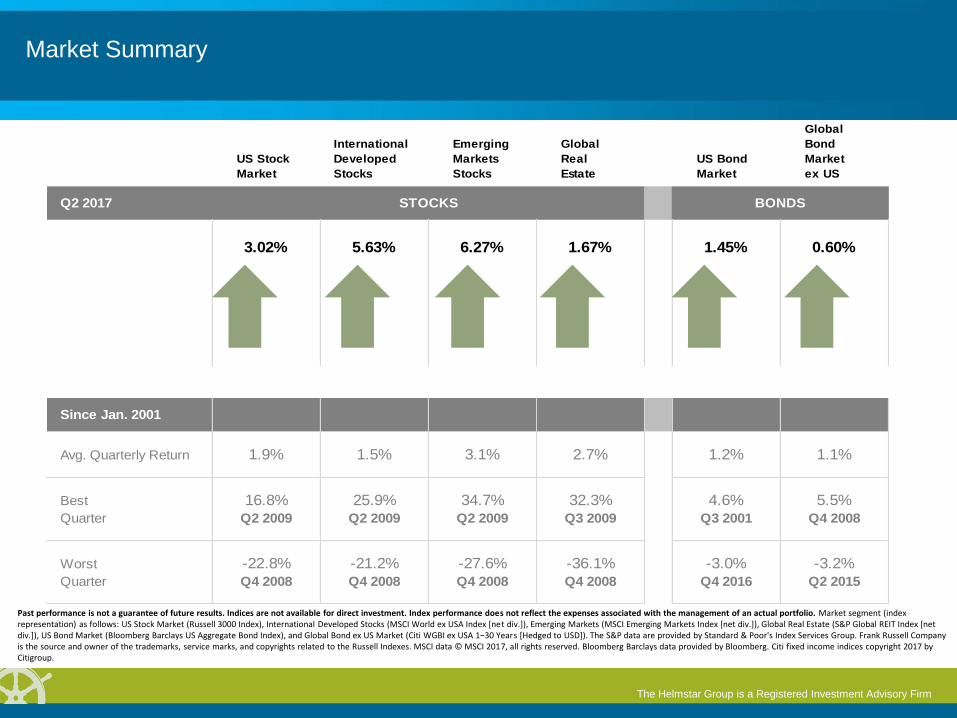
Q2 2017 STOCKS BONDS
3.02% 5.63% 6.27% 1.67% 1.45% 0.60%
Since Jan. 2001
Avg. Quarterly Return 1.9% 1.5% 3.1% 2.7% 1.2% 1.1%
Best 16.8% 25.9% 34.7% 32.3% 4.6% 5.5%
Quarter Q2 2009 Q2 2009 Q2 2009 Q3 2009 Q3 2001 Q4 2008
Worst -22.8% -21.2% -27.6% -36.1% -3.0% -3.2%
Quarter Q4 2008 Q4 2008 Q4 2008 Q4 2008 Q4 2016 Q2 2015
Past performance is not a guarantee of future results. Indices are not available for direct investment. Index performance does not reflect the expenses associated with the management of an actual portfolio. Market segment (index representation) as follows: US Stock Market (Russell 3000 Index), International Developed Stocks (MSCI World ex USA Index [net div.]), Emerging Markets (MSCI Emerging Markets Index [net div.]), Global Real Estate (S&P Global REIT Index [net div.]), US Bond Market (Bloomberg Barclays US Aggregate Bond Index), and Global Bond ex US Market (Citi WGBI ex USA 1−30 Years [Hedged to USD]). The S&P data are provided by Standard & Poor's Index Services Group. Frank Russell Company is the source and owner of the trademarks, service marks, and copyrights related to the Russell Indexes. MSCI data © MSCI 2017, all rights reserved. Bloomberg Barclays data provided by Bloomberg. Citi fixed income indices copyright 2017 by Citigroup.
The Helmstar Group is a Registered Investment Advisory Firm
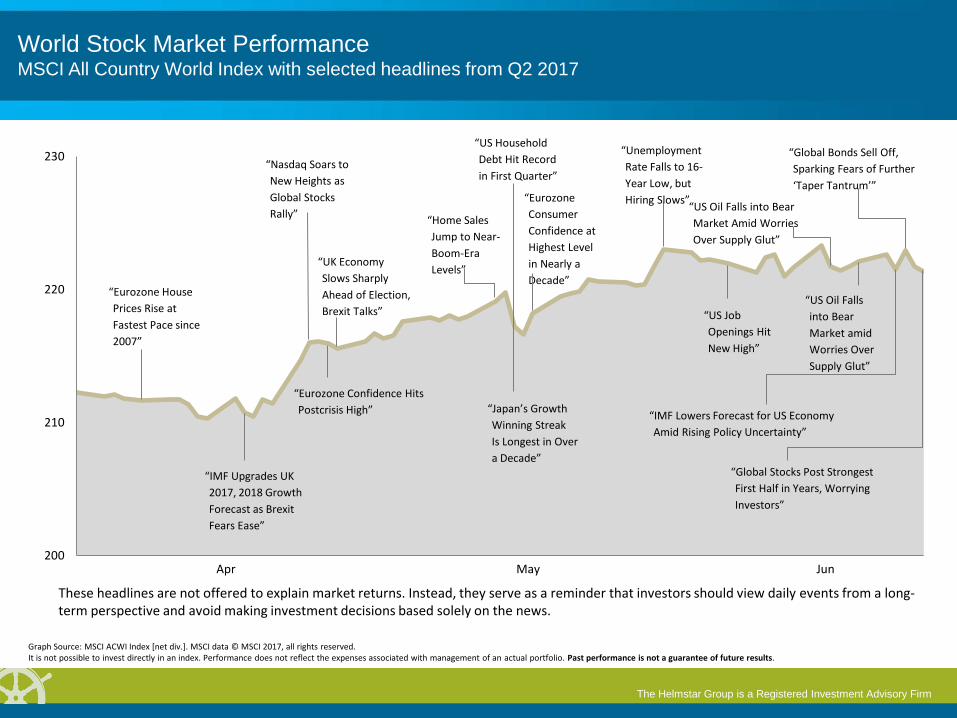
World Stock Market Performance MSCI All Country World Index with selected headlines from Q2 2017
200
210
220
230
These headlines are not offered to explain market returns. Instead, they serve as a reminder that investors should view daily events from a long-term perspective and avoid making investment decisions based solely on the news.
“US Job
Openings Hit
New High”
“Eurozone House
Prices Rise at
Fastest Pace since
2007”
“Nasdaq Soars to
New Heights as
Global Stocks
Rally”
“UK Economy
Slows Sharply
Ahead of Election,
Brexit Talks”
“US Oil Falls into Bear
Market Amid Worries
Over Supply Glut”
“Japan’s Growth
Winning Streak
Is Longest in Over
a Decade”
“Global Bonds Sell Off,
Sparking Fears of Further
‘Taper Tantrum’”
Apr May Jun
“Eurozone Confidence Hits
Postcrisis High”
“Eurozone
Consumer
Confidence at
Highest Level
in Nearly a
Decade”
“Unemployment
Rate Falls to 16-
Year Low, but
Hiring Slows”
“IMF Upgrades UK
2017, 2018 Growth
Forecast as Brexit
Fears Ease”
“Home Sales
Jump to Near-
Boom-Era
Levels”
“US Oil Falls
into Bear
Market amid
Worries Over
Supply Glut”
“IMF Lowers Forecast for US Economy
Amid Rising Policy Uncertainty”
“US Household
Debt Hit Record
in First Quarter”
“Global Stocks Post Strongest
First Half in Years, Worrying
Investors”
Graph Source: MSCI ACWI Index [net div.]. MSCI data © MSCI 2017, all rights reserved. It is not possible to invest directly in an index. Performance does not reflect the expenses associated with management of an actual portfolio. Past performance is not a guarantee of future results.
The Helmstar Group is a Registered Investment Advisory Firm
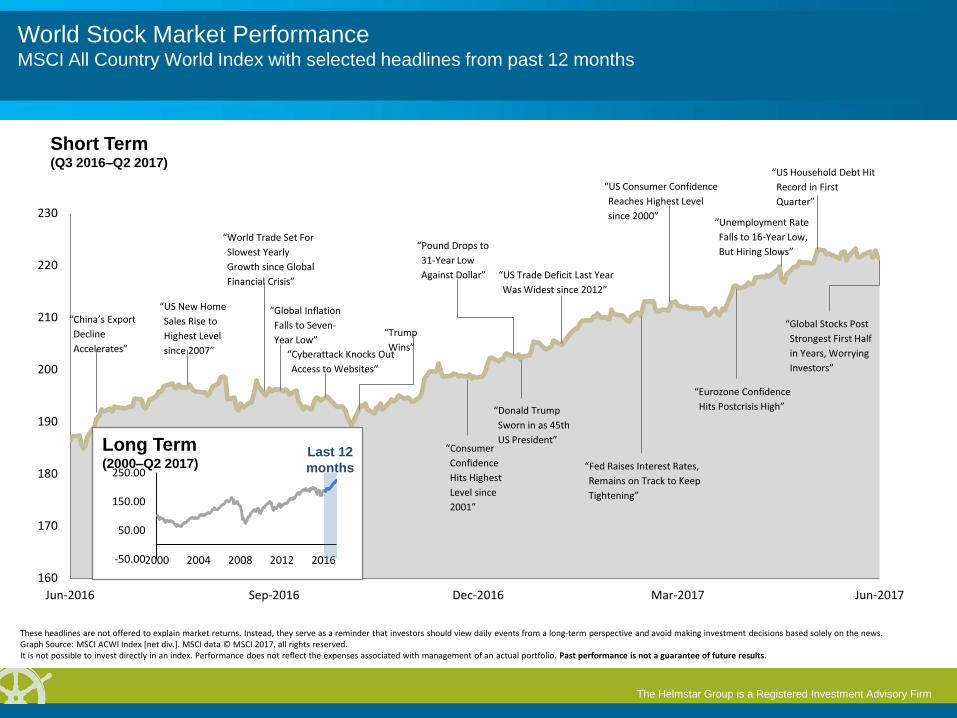
World Stock Market Performance MSCI All Country World Index with selected headlines from past 12 months
160
170
180
190
200
210
220
230
Jun-2016 Sep-2016 Dec-2016 Mar-2017 Jun-2017
“Pound Drops to
31-Year Low
Against Dollar”
“Trump
Wins”
“Global Inflation
Falls to Seven-
Year Low”
“US New Home
Sales Rise to
Highest Level
since 2007”
“China’s Export
Decline
Accelerates”
“US Consumer Confidence
Reaches Highest Level
since 2000”
“Fed Raises Interest Rates,
Remains on Track to Keep
Tightening”
Short Term (Q3 2016–Q2 2017)
“Consumer
Confidence
Hits Highest
Level since
2001”
“Cyberattack Knocks Out
Access to Websites”
“World Trade Set For
Slowest Yearly
Growth since Global
Financial Crisis” “US Trade Deficit Last Year
Was Widest since 2012”
“Donald Trump
Sworn in as 45th
US President” Long Term (2000–Q2 2017)
-50.00
50.00
150.00
250.00
2000 2004 2008 2012 2016
Last 12
months
“Eurozone Confidence
Hits Postcrisis High”
“US Household Debt Hit
Record in First
Quarter”
“Global Stocks Post
Strongest First Half
in Years, Worrying
Investors”
“Unemployment Rate
Falls to 16-Year Low,
But Hiring Slows”
These headlines are not offered to explain market returns. Instead, they serve as a reminder that investors should view daily events from a long-term perspective and avoid making investment decisions based solely on the news. Graph Source: MSCI ACWI Index [net div.]. MSCI data © MSCI 2017, all rights reserved. It is not possible to invest directly in an index. Performance does not reflect the expenses associated with management of an actual portfolio. Past performance is not a guarantee of future results.
The Helmstar Group is a Registered Investment Advisory Firm
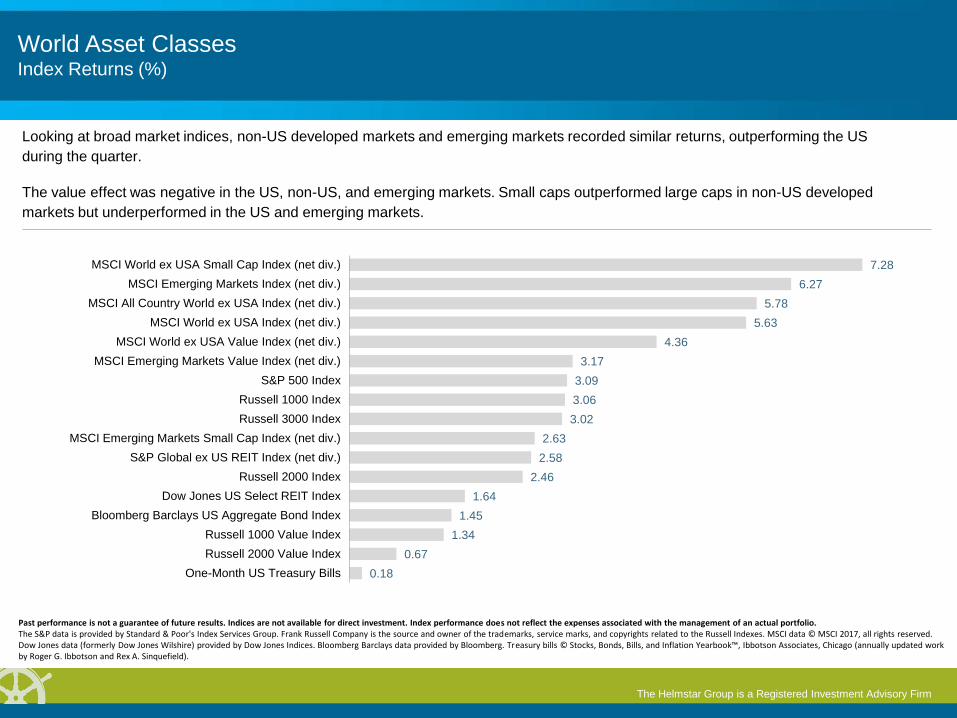
World Asset Classes Index Returns (%)
Looking at broad market indices, non-US developed markets and emerging markets recorded similar returns, outperforming the US
during the quarter.
The value effect was negative in the US, non-US, and emerging markets. Small caps outperformed large caps in non-US developed
markets but underperformed in the US and emerging markets.
7.28
6.27
5.78
5.63
4.36
3.17
3.09
3.06
3.02
2.63
2.58
2.46
1.64
1.45
1.34
0.67
0.18
MSCI World ex USA Small Cap Index (net div.)
MSCI Emerging Markets Index (net div.)
MSCI All Country World ex USA Index (net div.)
MSCI World ex USA Index (net div.)
MSCI World ex USA Value Index (net div.)
MSCI Emerging Markets Value Index (net div.)
S&P 500 Index
Russell 1000 Index
Russell 3000 Index
MSCI Emerging Markets Small Cap Index (net div.)
S&P Global ex US REIT Index (net div.)
Russell 2000 Index
Dow Jones US Select REIT Index
Bloomberg Barclays US Aggregate Bond Index
Russell 1000 Value Index
Russell 2000 Value Index
One-Month US Treasury Bills
Past performance is not a guarantee of future results. Indices are not available for direct investment. Index performance does not reflect the expenses associated with the management of an actual portfolio. The S&P data is provided by Standard & Poor's Index Services Group. Frank Russell Company is the source and owner of the trademarks, service marks, and copyrights related to the Russell Indexes. MSCI data © MSCI 2017, all rights reserved. Dow Jones data (formerly Dow Jones Wilshire) provided by Dow Jones Indices. Bloomberg Barclays data provided by Bloomberg. Treasury bills © Stocks, Bonds, Bills, and Inflation Yearbook™, Ibbotson Associates, Chicago (annually updated work by Roger G. Ibbotson and Rex A. Sinquefield).
The Helmstar Group is a Registered Investment Advisory Firm
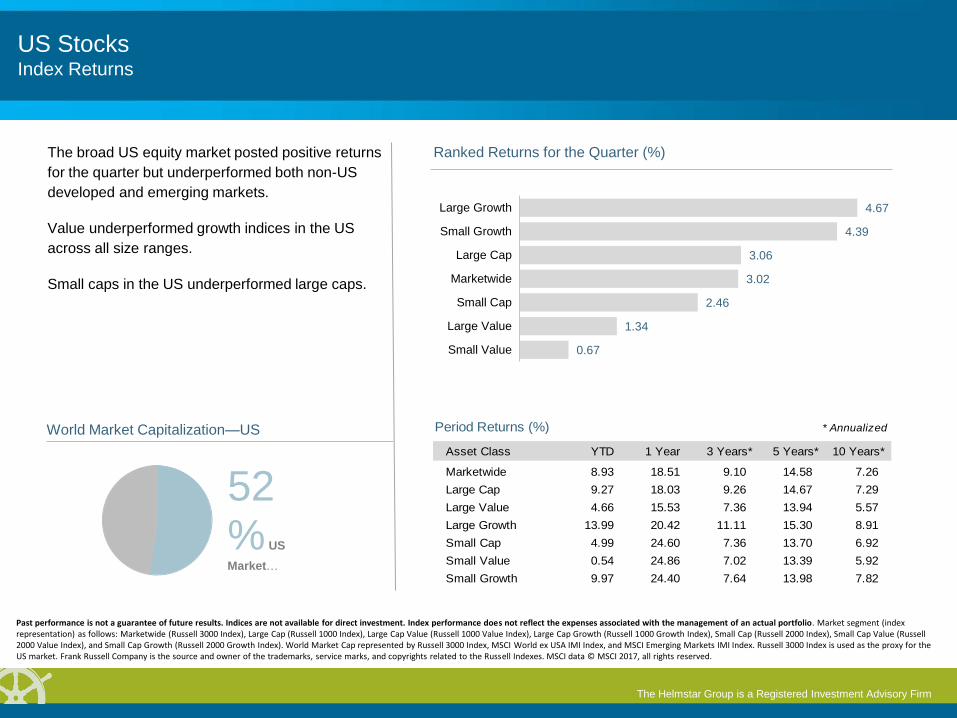
The broad US equity market posted positive returns
for the quarter but underperformed both non-US
developed and emerging markets.
Value underperformed growth indices in the US
across all size ranges.
Small caps in the US underperformed large caps.
World Market Capitalization—US
52% US
Market …
Period Returns (%) * Annualized
Asset Class YTD 1 Year 3 Years** 5 Years** 10 Years**
Marketwide 8.93 18.51 9.10 14.58 7.26
Large Cap 9.27 18.03 9.26 14.67 7.29
Large Value 4.66 15.53 7.36 13.94 5.57
Large Growth 13.99 20.42 11.11 15.30 8.91
Small Cap 4.99 24.60 7.36 13.70 6.92
Small Value 0.54 24.86 7.02 13.39 5.92
Small Growth 9.97 24.40 7.64 13.98 7.82
4.67
4.39
3.06
3.02
2.46
1.34
0.67
Large Growth
Small Growth
Large Cap
Marketwide
Small Cap
Large Value
Small Value
Ranked Returns for the Quarter (%)
US Stocks Index Returns
Past performance is not a guarantee of future results. Indices are not available for direct investment. Index performance does not reflect the expenses associated with the management of an actual portfolio. Market segment (index representation) as follows: Marketwide (Russell 3000 Index), Large Cap (Russell 1000 Index), Large Cap Value (Russell 1000 Value Index), Large Cap Growth (Russell 1000 Growth Index), Small Cap (Russell 2000 Index), Small Cap Value (Russell 2000 Value Index), and Small Cap Growth (Russell 2000 Growth Index). World Market Cap represented by Russell 3000 Index, MSCI World ex USA IMI Index, and MSCI Emerging Markets IMI Index. Russell 3000 Index is used as the proxy for the US market. Frank Russell Company is the source and owner of the trademarks, service marks, and copyrights related to the Russell Indexes. MSCI data © MSCI 2017, all rights reserved.
The Helmstar Group is a Registered Investment Advisory Firm
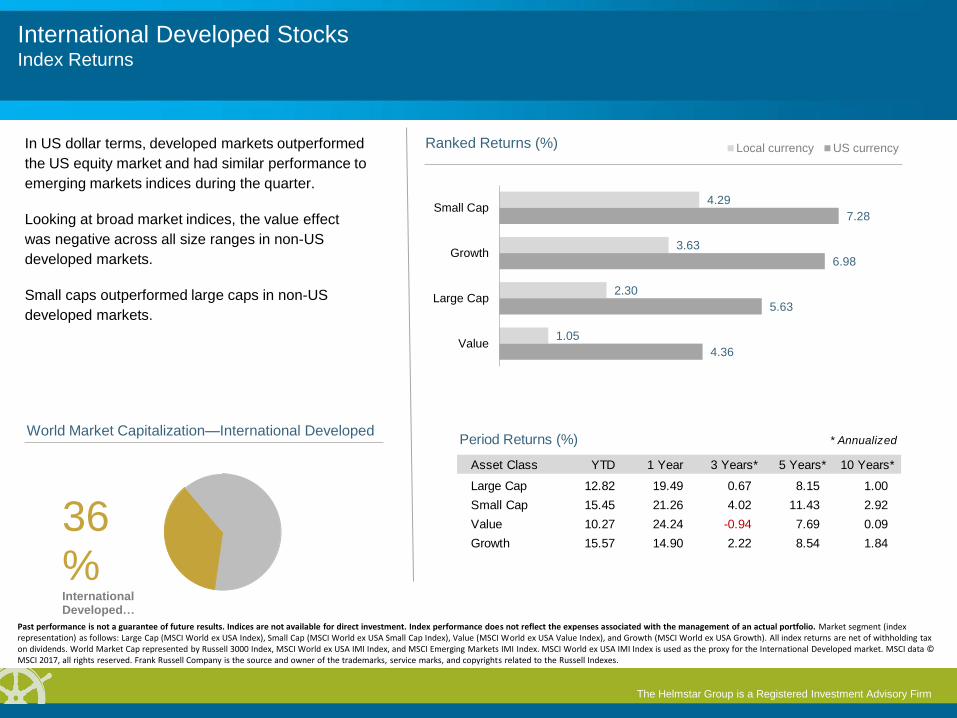
International Developed Stocks Index Returns
In US dollar terms, developed markets outperformed
the US equity market and had similar performance to
emerging markets indices during the quarter.
Looking at broad market indices, the value effect
was negative across all size ranges in non-US
developed markets.
Small caps outperformed large caps in non-US
developed markets.
Period Returns (%) * Annualized
Asset Class YTD 1 Year 3 Years** 5 Years** 10 Years**
Large Cap 12.82 19.49 0.67 8.15 1.00
Small Cap 15.45 21.26 4.02 11.43 2.92
Value 10.27 24.24 -0.94 7.69 0.09
Growth 15.57 14.90 2.22 8.54 1.84
36% International Developed …
World Market Capitalization—International Developed
4.29
3.63
2.30
1.05
7.28
6.98
5.63
4.36
Small Cap
Growth
Large Cap
Value
Ranked Returns (%) Local currency US currency
Past performance is not a guarantee of future results. Indices are not available for direct investment. Index performance does not reflect the expenses associated with the management of an actual portfolio. Market segment (index representation) as follows: Large Cap (MSCI World ex USA Index), Small Cap (MSCI World ex USA Small Cap Index), Value (MSCI World ex USA Value Index), and Growth (MSCI World ex USA Growth). All index returns are net of withholding tax on dividends. World Market Cap represented by Russell 3000 Index, MSCI World ex USA IMI Index, and MSCI Emerging Markets IMI Index. MSCI World ex USA IMI Index is used as the proxy for the International Developed market. MSCI data © MSCI 2017, all rights reserved. Frank Russell Company is the source and owner of the trademarks, service marks, and copyrights related to the Russell Indexes.
The Helmstar Group is a Registered Investment Advisory Firm
Emerging Markets Stocks Index Returns
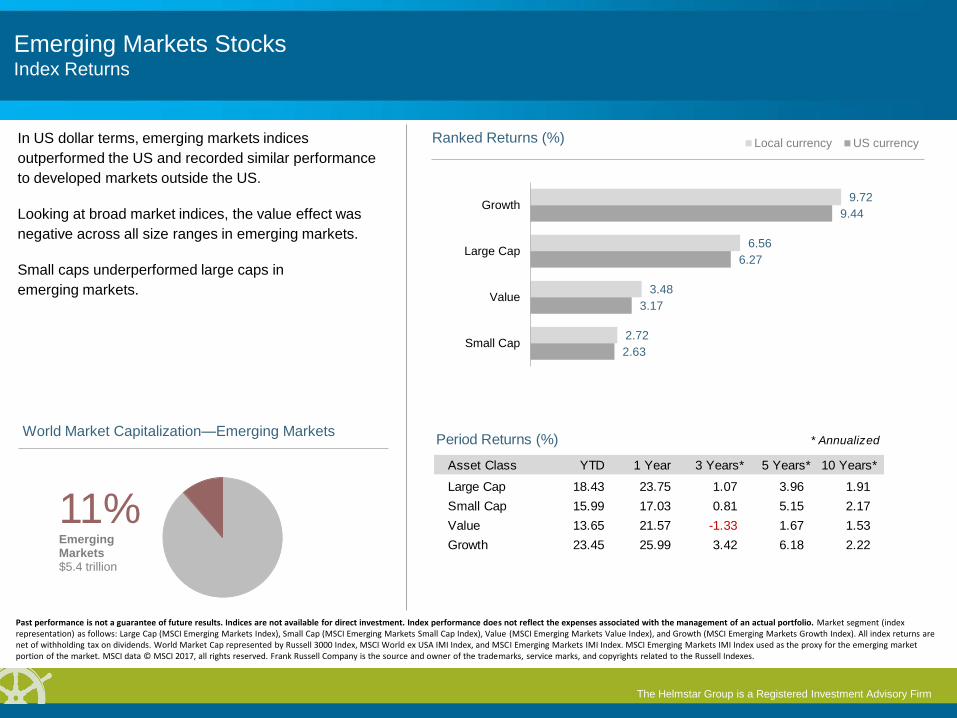
In US dollar terms, emerging markets indices
outperformed the US and recorded similar performance
to developed markets outside the US.
Looking at broad market indices, the value effect was
negative across all size ranges in emerging markets.
Small caps underperformed large caps in
emerging markets.
9.72
6.56
3.48
2.72
9.44
6.27
3.17
2.63
Growth
Large Cap
Value
Small Cap
Ranked Returns (%) Local currency US currency
Period Returns (%) * Annualized
Asset Class YTD 1 Year 3 Years** 5 Years** 10 Years**
Large Cap 18.43 23.75 1.07 3.96 1.91
Small Cap 15.99 17.03 0.81 5.15 2.17
Value 13.65 21.57 -1.33 1.67 1.53
Growth 23.45 25.99 3.42 6.18 2.22
11% Emerging Markets $5.4 trillion
World Market Capitalization—Emerging Markets
Past performance is not a guarantee of future results. Indices are not available for direct investment. Index performance does not reflect the expenses associated with the management of an actual portfolio. Market segment (index representation) as follows: Large Cap (MSCI Emerging Markets Index), Small Cap (MSCI Emerging Markets Small Cap Index), Value (MSCI Emerging Markets Value Index), and Growth (MSCI Emerging Markets Growth Index). All index returns are net of withholding tax on dividends. World Market Cap represented by Russell 3000 Index, MSCI World ex USA IMI Index, and MSCI Emerging Markets IMI Index. MSCI Emerging Markets IMI Index used as the proxy for the emerging market portion of the market. MSCI data © MSCI 2017, all rights reserved. Frank Russell Company is the source and owner of the trademarks, service marks, and copyrights related to the Russell Indexes.
The Helmstar Group is a Registered Investment Advisory Firm
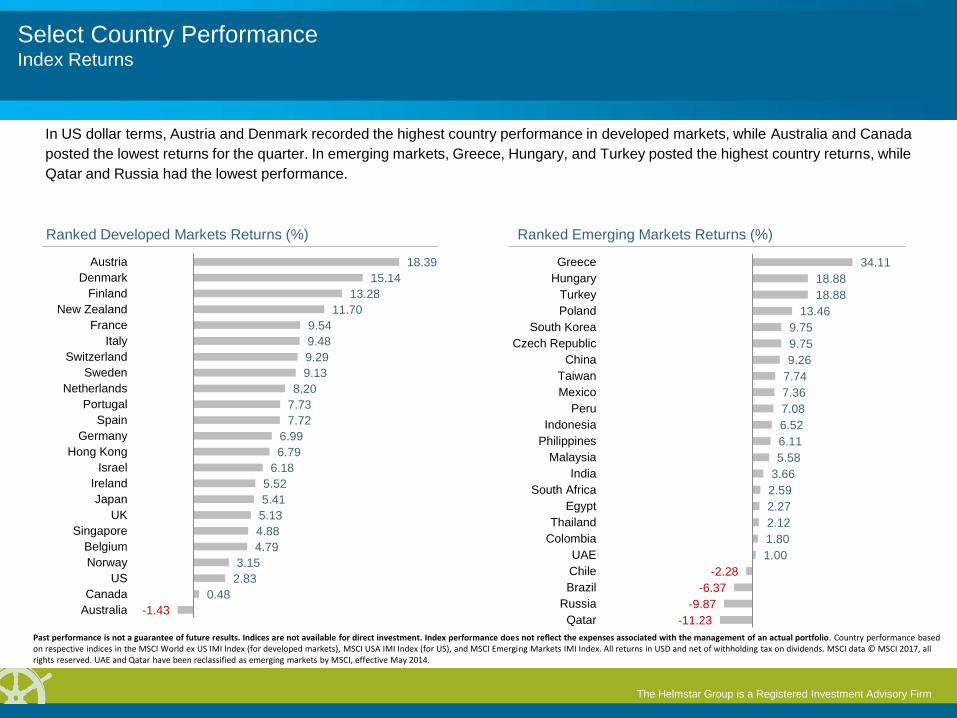
Select Country Performance Index Returns
-2.28
-6.37
-9.87
-11.23
34.11
18.88
18.88
13.46
9.75
9.75
9.26
7.74
7.36
7.08
6.52
6.11
5.58
3.66
2.59
2.27
2.12
1.80
1.00
Greece
Hungary
Turkey
Poland
South Korea
Czech Republic
China
Taiwan
Mexico
Peru
Indonesia
Philippines
Malaysia
India
South Africa
Egypt
Thailand
Colombia
UAE
Chile
Brazil
Russia
Qatar
Ranked Emerging Markets Returns (%)
-1.43
18.39
15.14
13.28
11.70
9.54
9.48
9.29
9.13
8.20
7.73
7.72
6.99
6.79
6.18
5.52
5.41
5.13
4.88
4.79
3.15
2.83
0.48
Austria
Denmark
Finland
New Zealand
France
Italy
Switzerland
Sweden
Netherlands
Portugal
Spain
Germany
Hong Kong
Israel
Ireland
Japan
UK
Singapore
Belgium
Norway
US
Canada
Australia
Ranked Developed Markets Returns (%)
In US dollar terms, Austria and Denmark recorded the highest country performance in developed markets, while Australia and Canada
posted the lowest returns for the quarter. In emerging markets, Greece, Hungary, and Turkey posted the highest country returns, while
Qatar and Russia had the lowest performance.
Past performance is not a guarantee of future results. Indices are not available for direct investment. Index performance does not reflect the expenses associated with the management of an actual portfolio. Country performance based on respective indices in the MSCI World ex US IMI Index (for developed markets), MSCI USA IMI Index (for US), and MSCI Emerging Markets IMI Index. All returns in USD and net of withholding tax on dividends. MSCI data © MSCI 2017, all rights reserved. UAE and Qatar have been reclassified as emerging markets by MSCI, effective May 2014.
The Helmstar Group is a Registered Investment Advisory Firm
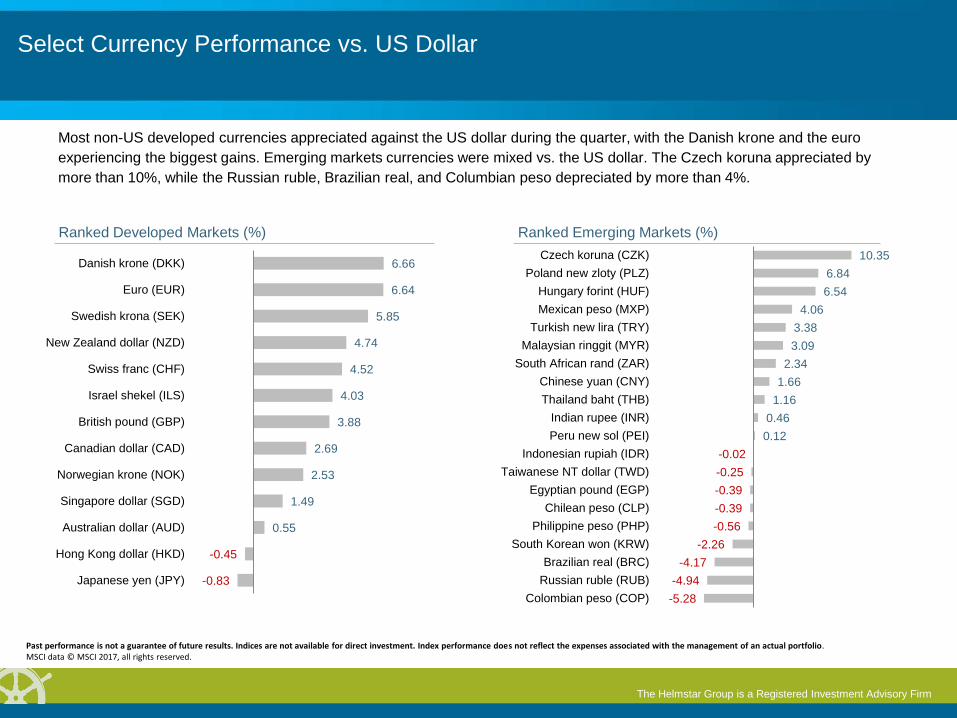
Select Currency Performance vs. US Dollar
-0.02
-0.25
-0.39
-0.39
-0.56
-2.26
-4.17
-4.94
-5.28
10.35
6.84
6.54
4.06
3.38
3.09
2.34
1.66
1.16
0.46
0.12
Czech koruna (CZK)
Poland new zloty (PLZ)
Hungary forint (HUF)
Mexican peso (MXP)
Turkish new lira (TRY)
Malaysian ringgit (MYR)
South African rand (ZAR)
Chinese yuan (CNY)
Thailand baht (THB)
Indian rupee (INR)
Peru new sol (PEI)
Indonesian rupiah (IDR)
Taiwanese NT dollar (TWD)
Egyptian pound (EGP)
Chilean peso (CLP)
Philippine peso (PHP)
South Korean won (KRW)
Brazilian real (BRC)
Russian ruble (RUB)
Colombian peso (COP)
Ranked Emerging Markets (%)
-0.45
-0.83
6.66
6.64
5.85
4.74
4.52
4.03
3.88
2.69
2.53
1.49
0.55
Danish krone (DKK)
Euro (EUR)
Swedish krona (SEK)
New Zealand dollar (NZD)
Swiss franc (CHF)
Israel shekel (ILS)
British pound (GBP)
Canadian dollar (CAD)
Norwegian krone (NOK)
Singapore dollar (SGD)
Australian dollar (AUD)
Hong Kong dollar (HKD)
Japanese yen (JPY)
Ranked Developed Markets (%)
Most non-US developed currencies appreciated against the US dollar during the quarter, with the Danish krone and the euro
experiencing the biggest gains. Emerging markets currencies were mixed vs. the US dollar. The Czech koruna appreciated by
more than 10%, while the Russian ruble, Brazilian real, and Columbian peso depreciated by more than 4%.
Past performance is not a guarantee of future results. Indices are not available for direct investment. Index performance does not reflect the expenses associated with the management of an actual portfolio. MSCI data © MSCI 2017, all rights reserved.
The Helmstar Group is a Registered Investment Advisory Firm
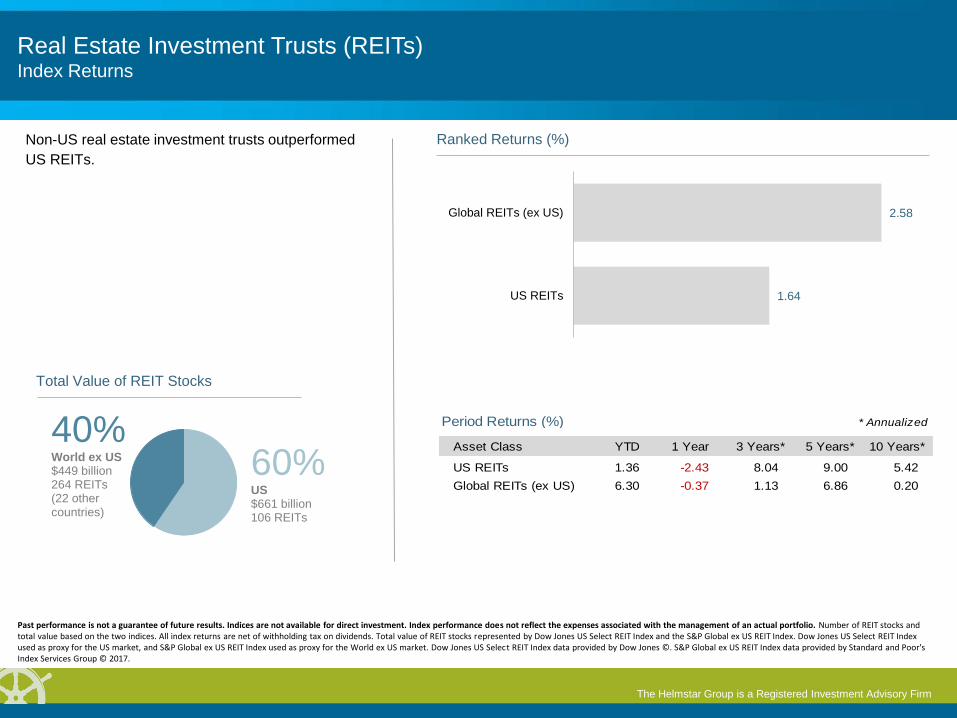
Real Estate Investment Trusts (REITs) Index Returns
Non-US real estate investment trusts outperformed
US REITs.
2.58
1.64
Global REITs (ex US)
US REITs
Ranked Returns (%)
Period Returns (%) * Annualized
Asset Class YTD 1 Year 3 Years** 5 Years** 10 Years**
US REITs 1.36 -2.43 8.04 9.00 5.42
Global REITs (ex US) 6.30 -0.37 1.13 6.86 0.20
60% US $661 billion 106 REITs
40% World ex US $449 billion 264 REITs (22 other countries)
Total Value of REIT Stocks
Past performance is not a guarantee of future results. Indices are not available for direct investment. Index performance does not reflect the expenses associated with the management of an actual portfolio. Number of REIT stocks and total value based on the two indices. All index returns are net of withholding tax on dividends. Total value of REIT stocks represented by Dow Jones US Select REIT Index and the S&P Global ex US REIT Index. Dow Jones US Select REIT Index used as proxy for the US market, and S&P Global ex US REIT Index used as proxy for the World ex US market. Dow Jones US Select REIT Index data provided by Dow Jones ©. S&P Global ex US REIT Index data provided by Standard and Poor's Index Services Group © 2017.

The Helmstar Group is a Registered Investment Advisory Firm
Commodities Index Returns
The Bloomberg Commodity Index Total Return
declined 3.00% during the second quarter.
The livestock and grains complexes led quarterly
performance, with lean hogs returning 14.44%, live
cattle 8.59%, wheat (Chicago) 15.95%, and wheat
(Kansas) 17.82%.
Softs was the worst-performing complex, with sugar
and coffee declining 18.76% and 12.79%, respectively.
Cotton also experienced a decline, decreasing 9.44%.
Period Returns (%)
Asset Class YTD 1 Year 3 Years** 5 Years** 10 Years**
Commodities -5.26 -6.50 -14.81 -9.25 -6.49
* Annualized
-0.91
-0.99
-1.05
-1.89
-2.93
-6.90
-7.46
-9.44
-9.60
-9.69
-10.41
-10.51
-10.68
-12.79
-18.76
17.82
15.95
14.44
8.59
2.58
1.17
0.53
Kansas wheat
Wheat
Lean hogs
Live cattle
Soybean oil
Copper
Corn
Soybeans
Gold
Zinc
Soybean meal
Aluminum
Nickel
Heating oil
Cotton
Natural gas
Silver
Brent oil
Unleaded gas
WTI crude oil
Coffee
Sugar
Ranked Returns for Individual Commodities (%)
Past performance is not a guarantee of future results. Index is not available for direct investment. Index performance does not reflect the expenses associated with the management of an actual portfolio. All index returns are net of withholding tax on dividends. Securities and commodities data provided by Bloomberg.
The Helmstar Group is a Registered Investment Advisory Firm
Fixed Income Index Returns
2.31
2.95 2.73
3.32
10-Year USTreasury
Municipals AAA-AACorporates
A-BBBCorporates
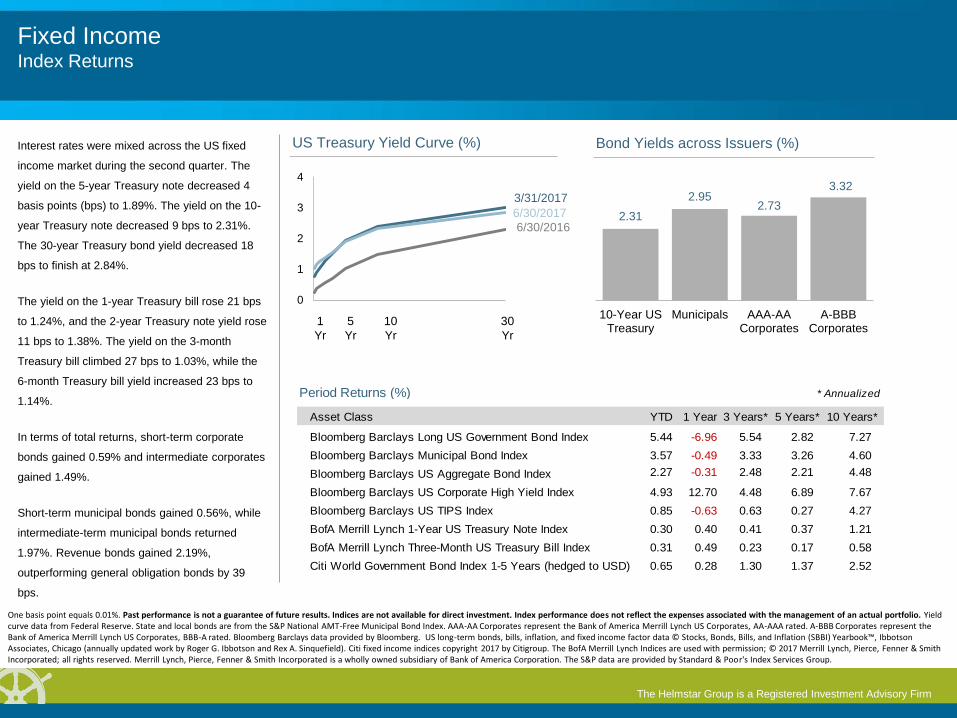
Bond Yields across Issuers (%) Interest rates were mixed across the US fixed
income market during the second quarter. The
yield on the 5-year Treasury note decreased 4
basis points (bps) to 1.89%. The yield on the 10-
year Treasury note decreased 9 bps to 2.31%.
The 30-year Treasury bond yield decreased 18
bps to finish at 2.84%.
The yield on the 1-year Treasury bill rose 21 bps
to 1.24%, and the 2-year Treasury note yield rose
11 bps to 1.38%. The yield on the 3-month
Treasury bill climbed 27 bps to 1.03%, while the
6-month Treasury bill yield increased 23 bps to
1.14%.
In terms of total returns, short-term corporate
bonds gained 0.59% and intermediate corporates
gained 1.49%.
Short-term municipal bonds gained 0.56%, while
intermediate-term municipal bonds returned
1.97%. Revenue bonds gained 2.19%,
outperforming general obligation bonds by 39
bps.
Period Returns (%)
Asset Class YTD 1 Year 3 Years** 5 Years** 10 Years**
Bloomberg Barclays Long US Government Bond Index 5.44 -6.96 5.54 2.82 7.27
Bloomberg Barclays Municipal Bond Index 3.57 -0.49 3.33 3.26 4.60
Bloomberg Barclays US Aggregate Bond Index 2.27 -0.31 2.48 2.21 4.48
Bloomberg Barclays US Corporate High Yield Index 4.93 12.70 4.48 6.89 7.67
Bloomberg Barclays US TIPS Index 0.85 -0.63 0.63 0.27 4.27
BofA Merrill Lynch 1-Year US Treasury Note Index 0.30 0.40 0.41 0.37 1.21
BofA Merrill Lynch Three-Month US Treasury Bill Index 0.31 0.49 0.23 0.17 0.58
Citi World Government Bond Index 1-5 Years (hedged to USD) 0.65 0.28 1.30 1.37 2.52
* Annualized
6/30/2016
3/31/2017
6/30/2017
0
1
2
3
4
US Treasury Yield Curve (%)
1
Yr
5
Yr
10
Yr
30
Yr
One basis point equals 0.01%. Past performance is not a guarantee of future results. Indices are not available for direct investment. Index performance does not reflect the expenses associated with the management of an actual portfolio. Yield curve data from Federal Reserve. State and local bonds are from the S&P National AMT-Free Municipal Bond Index. AAA-AA Corporates represent the Bank of America Merrill Lynch US Corporates, AA-AAA rated. A-BBB Corporates represent the Bank of America Merrill Lynch US Corporates, BBB-A rated. Bloomberg Barclays data provided by Bloomberg. US long-term bonds, bills, inflation, and fixed income factor data © Stocks, Bonds, Bills, and Inflation (SBBI) Yearbook™, Ibbotson Associates, Chicago (annually updated work by Roger G. Ibbotson and Rex A. Sinquefield). Citi fixed income indices copyright 2017 by Citigroup. The BofA Merrill Lynch Indices are used with permission; © 2017 Merrill Lynch, Pierce, Fenner & Smith Incorporated; all rights reserved. Merrill Lynch, Pierce, Fenner & Smith Incorporated is a wholly owned subsidiary of Bank of America Corporation. The S&P data are provided by Standard & Poor's Index Services Group.
The Helmstar Group is a Registered Investment Advisory Firm
Impact of Diversification Index Returns
$0
$20,000
$40,000
$60,000
$80,000
$100,000
12/1988 12/1993 12/1998 12/2003 12/2008 12/2013
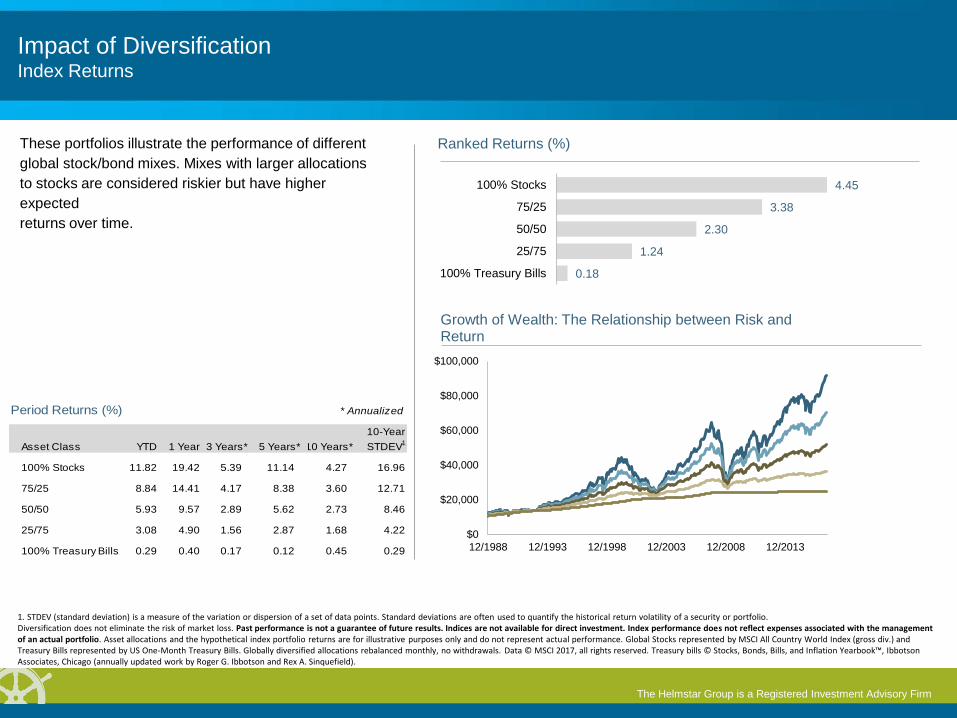
Growth of Wealth: The Relationship between Risk and Return
These portfolios illustrate the performance of different
global stock/bond mixes. Mixes with larger allocations
to stocks are considered riskier but have higher
expected
returns over time.
0.18
1.24
2.30
3.38
4.45
100% Treasury Bills
25/75
50/50
75/25
100% Stocks
Ranked Returns (%)
Asset Class YTD 1 Year 3 Years** 5 Years**10 Years**
10-Year
STDEV1
100% Stocks 11.82 19.42 5.39 11.14 4.27 16.96
75/25 8.84 14.41 4.17 8.38 3.60 12.71
50/50 5.93 9.57 2.89 5.62 2.73 8.46
25/75 3.08 4.90 1.56 2.87 1.68 4.22
100% Treasury Bills 0.29 0.40 0.17 0.12 0.45 0.29
Period Returns (%) * Annualized
1. STDEV (standard deviation) is a measure of the variation or dispersion of a set of data points. Standard deviations are often used to quantify the historical return volatility of a security or portfolio. Diversification does not eliminate the risk of market loss. Past performance is not a guarantee of future results. Indices are not available for direct investment. Index performance does not reflect expenses associated with the management of an actual portfolio. Asset allocations and the hypothetical index portfolio returns are for illustrative purposes only and do not represent actual performance. Global Stocks represented by MSCI All Country World Index (gross div.) and Treasury Bills represented by US One-Month Treasury Bills. Globally diversified allocations rebalanced monthly, no withdrawals. Data © MSCI 2017, all rights reserved. Treasury bills © Stocks, Bonds, Bills, and Inflation Yearbook™, Ibbotson Associates, Chicago (annually updated work by Roger G. Ibbotson and Rex A. Sinquefield).
The Helmstar Group is a Registered Investment Advisory Firm
Dancing to a Song with a Bad Beat By: James R. Solloway, CFA, Managing Director and Senior Portfolio Manager
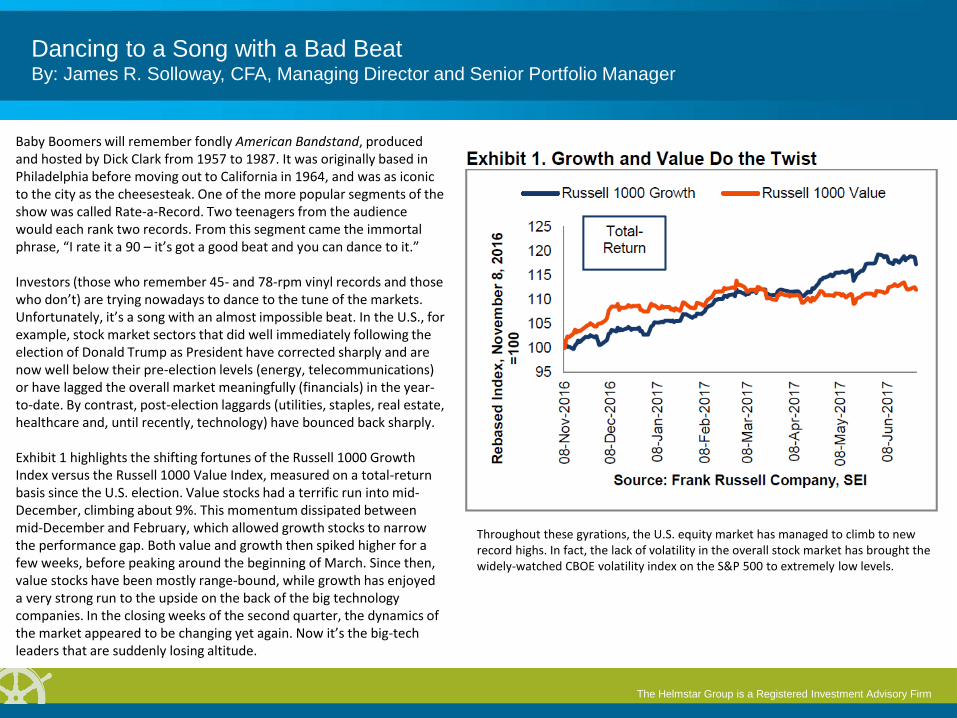
Baby Boomers will remember fondly American Bandstand, produced and hosted by Dick Clark from 1957 to 1987. It was originally based in Philadelphia before moving out to California in 1964, and was as iconic to the city as the cheesesteak. One of the more popular segments of the show was called Rate-a-Record. Two teenagers from the audience would each rank two records. From this segment came the immortal phrase, “I rate it a 90 – it’s got a good beat and you can dance to it.” Investors (those who remember 45- and 78-rpm vinyl records and those who don’t) are trying nowadays to dance to the tune of the markets. Unfortunately, it’s a song with an almost impossible beat. In the U.S., for example, stock market sectors that did well immediately following the election of Donald Trump as President have corrected sharply and are now well below their pre-election levels (energy, telecommunications) or have lagged the overall market meaningfully (financials) in the year-to-date. By contrast, post-election laggards (utilities, staples, real estate, healthcare and, until recently, technology) have bounced back sharply. Exhibit 1 highlights the shifting fortunes of the Russell 1000 Growth Index versus the Russell 1000 Value Index, measured on a total-return basis since the U.S. election. Value stocks had a terrific run into mid-December, climbing about 9%. This momentum dissipated between mid-December and February, which allowed growth stocks to narrow the performance gap. Both value and growth then spiked higher for a few weeks, before peaking around the beginning of March. Since then, value stocks have been mostly range-bound, while growth has enjoyed a very strong run to the upside on the back of the big technology companies. In the closing weeks of the second quarter, the dynamics of the market appeared to be changing yet again. Now it’s the big-tech leaders that are suddenly losing altitude.
Throughout these gyrations, the U.S. equity market has managed to climb to new record highs. In fact, the lack of volatility in the overall stock market has brought the widely-watched CBOE volatility index on the S&P 500 to extremely low levels.
The Helmstar Group is a Registered Investment Advisory Firm
Dancing to a Song with a Bad Beat By: James R. Solloway, CFA, Managing Director and Senior Portfolio Manager
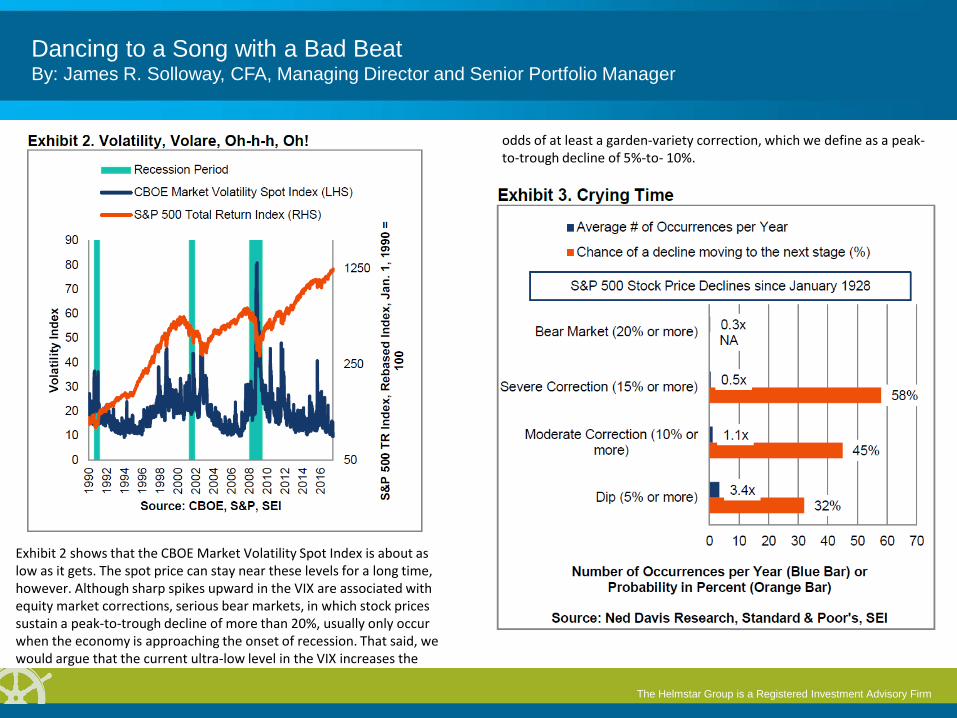
Exhibit 2 shows that the CBOE Market Volatility Spot Index is about as low as it gets. The spot price can stay near these levels for a long time, however. Although sharp spikes upward in the VIX are associated with equity market corrections, serious bear markets, in which stock prices sustain a peak-to-trough decline of more than 20%, usually only occur when the economy is approaching the onset of recession. That said, we would argue that the current ultra-low level in the VIX increases the
odds of at least a garden-variety correction, which we define as a peak-to-trough decline of 5%-to- 10%.
The Helmstar Group is a Registered Investment Advisory Firm
Dancing to a Song with a Bad Beat By: James R. Solloway, CFA, Managing Director and Senior Portfolio Manager
One can certainly make the argument that this market is overdue for some sort of pullback. Ned Davis Research (NDR) recently updated a study of all price corrections of at least 5% in the S&P 500 since 1928. Exhibit 3 breaks down the corrections by the size of their peak-to-trough decline using NDR’s nomenclature – a “dip” (a price drop of 5% or more), a “moderate correction” (a 10%-plus decline), a “severe correction” (15% or more) and a “bear market” (more than 20%). Since 1928, there have been 303 corrections in total that have exceeded 5%. That works out to an average of 3.4 per year. The last dip in the S&P 500 of 5% or more occurred as a result of the Brexit vote in the U.K. back in June of 2017. If you blinked, you missed it, since it lasted only two sessions. Exhibit 3 also highlights the probabilities of a correction moving to the next, more serious, stage (for example, a dip of 5%-to- 10% has turned into a moderate correction of 10% or more almost a third of the time). The last correction of more than 10% occurred during the November 2015-February 2016 time frame. Moderate corrections have occurred about once per year on average. In some ways, stock market can be likened to earthquakes and volcanic eruptions. Despite the outward calm, there can be plenty of activity below the surface, with stresses building up over time. It’s not a question of whether a correction will take place; it’s simply a matter of timing and magnitude. The pressure below the surface of the equity market is starting to build, in our opinion. These stresses, however, haven’t built up to the point where a major market quake is likely. Rather, we would expect a trembler of a more modest magnitude, with the timing not at all certain.
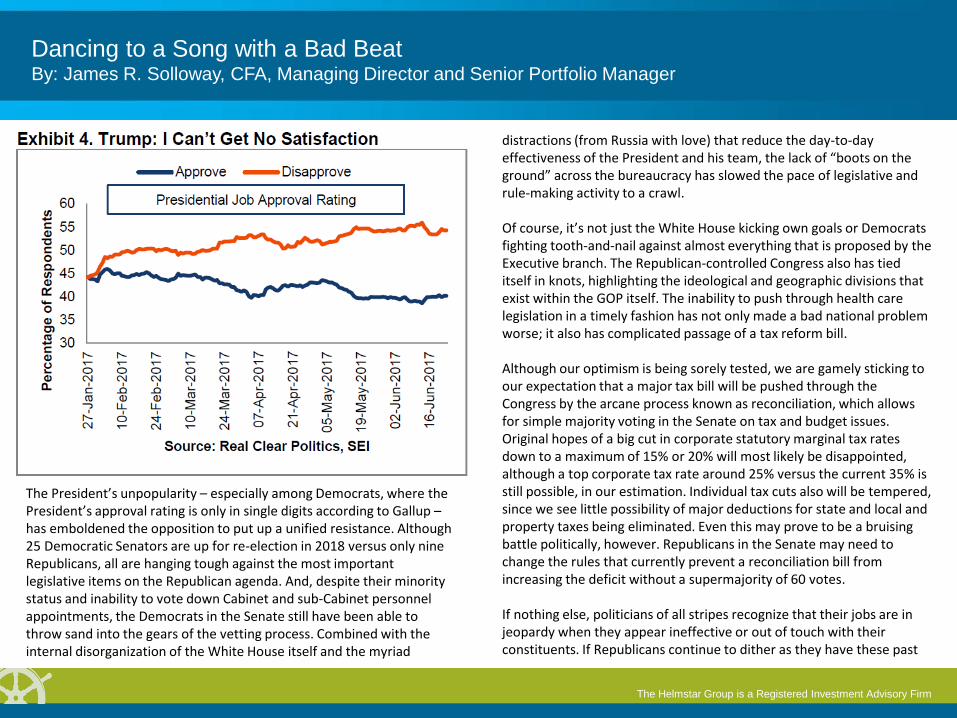
The Outlook Isn’t Bad -- It’s Just Not as Good as It Was At the start of this year, SEI held an optimistic view regarding the path of the U.S. economy, corporate profits and, by extension, the stock market. We saw a great opportunity as a result of Donald Trump’s electoral victory to break the legislative logjam that had prevented the passage of business-friendly tax and regulatory reforms during the Obama years. We thought the U.S. and global economy would accelerate and we anticipated a continuation of the strong performance in equities and other risk-oriented financial assets that was sparked by the election outcome. Our hopes on legislative policy now appear naïve, to put it nicely. We recognized from the beginning that Donald Trump would be one of the most controversial personalities ever to be elevated to the Presidency and that the goodwill extended to Presidents at the start of their first term would not be given to POTUS 45. When Donald Trump entered office, his approval/disapproval numbers were even at about 44%. Most Presidents since Harry Truman have begun their first terms on Inauguration Day with at least a 60% approval rating, although that sometimes turned out to be the high-water mark, as it did for Barak Obama. But the deterioration in those numbers for the current occupant has been stunning, as Exhibit 4 illustrates. According to the Real Clear Politics average of Presidential approval polls, less than 40% of respondents approve of the job President Trump is doing, while 54% disapprove. These are the kind of readings that might be seen toward the end of a second term of an unpopular President or during those periods when the economy is performing quite badly.
The Helmstar Group is a Registered Investment Advisory Firm
Dancing to a Song with a Bad Beat By: James R. Solloway, CFA, Managing Director and Senior Portfolio Manager
The President’s unpopularity – especially among Democrats, where the President’s approval rating is only in single digits according to Gallup – has emboldened the opposition to put up a unified resistance. Although 25 Democratic Senators are up for re-election in 2018 versus only nine Republicans, all are hanging tough against the most important legislative items on the Republican agenda. And, despite their minority status and inability to vote down Cabinet and sub-Cabinet personnel appointments, the Democrats in the Senate still have been able to throw sand into the gears of the vetting process. Combined with the internal disorganization of the White House itself and the myriad
distractions (from Russia with love) that reduce the day-to-day effectiveness of the President and his team, the lack of “boots on the ground” across the bureaucracy has slowed the pace of legislative and rule-making activity to a crawl. Of course, it’s not just the White House kicking own goals or Democrats fighting tooth-and-nail against almost everything that is proposed by the Executive branch. The Republican-controlled Congress also has tied itself in knots, highlighting the ideological and geographic divisions that exist within the GOP itself. The inability to push through health care legislation in a timely fashion has not only made a bad national problem worse; it also has complicated passage of a tax reform bill. Although our optimism is being sorely tested, we are gamely sticking to our expectation that a major tax bill will be pushed through the Congress by the arcane process known as reconciliation, which allows for simple majority voting in the Senate on tax and budget issues. Original hopes of a big cut in corporate statutory marginal tax rates down to a maximum of 15% or 20% will most likely be disappointed, although a top corporate tax rate around 25% versus the current 35% is still possible, in our estimation. Individual tax cuts also will be tempered, since we see little possibility of major deductions for state and local and property taxes being eliminated. Even this may prove to be a bruising battle politically, however. Republicans in the Senate may need to change the rules that currently prevent a reconciliation bill from increasing the deficit without a supermajority of 60 votes. If nothing else, politicians of all stripes recognize that their jobs are in jeopardy when they appear ineffective or out of touch with their constituents. If Republicans continue to dither as they have these past
The Helmstar Group is a Registered Investment Advisory Firm
Dancing to a Song with a Bad Beat By: James R. Solloway, CFA, Managing Director and Senior Portfolio Manager
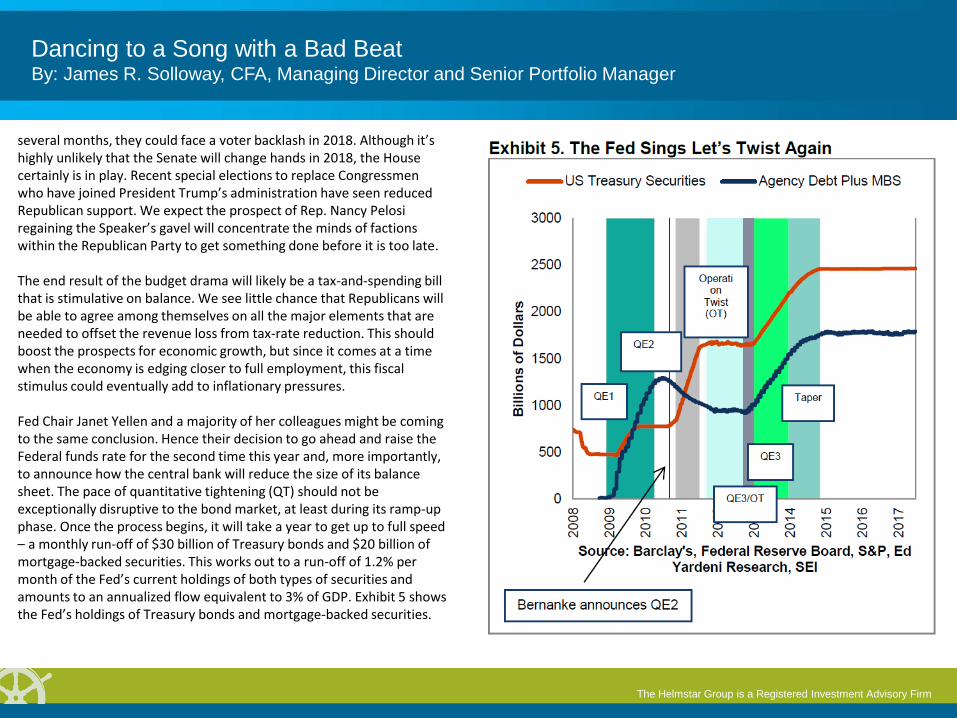
several months, they could face a voter backlash in 2018. Although it’s highly unlikely that the Senate will change hands in 2018, the House certainly is in play. Recent special elections to replace Congressmen who have joined President Trump’s administration have seen reduced Republican support. We expect the prospect of Rep. Nancy Pelosi regaining the Speaker’s gavel will concentrate the minds of factions within the Republican Party to get something done before it is too late. The end result of the budget drama will likely be a tax-and-spending bill that is stimulative on balance. We see little chance that Republicans will be able to agree among themselves on all the major elements that are needed to offset the revenue loss from tax-rate reduction. This should boost the prospects for economic growth, but since it comes at a time when the economy is edging closer to full employment, this fiscal stimulus could eventually add to inflationary pressures. Fed Chair Janet Yellen and a majority of her colleagues might be coming to the same conclusion. Hence their decision to go ahead and raise the Federal funds rate for the second time this year and, more importantly, to announce how the central bank will reduce the size of its balance sheet. The pace of quantitative tightening (QT) should not be exceptionally disruptive to the bond market, at least during its ramp-up phase. Once the process begins, it will take a year to get up to full speed – a monthly run-off of $30 billion of Treasury bonds and $20 billion of mortgage-backed securities. This works out to a run-off of 1.2% per month of the Fed’s current holdings of both types of securities and amounts to an annualized flow equivalent to 3% of GDP. Exhibit 5 shows the Fed’s holdings of Treasury bonds and mortgage-backed securities.
The Helmstar Group is a Registered Investment Advisory Firm
Dancing to a Song with a Bad Beat By: James R. Solloway, CFA, Managing Director and Senior Portfolio Manager
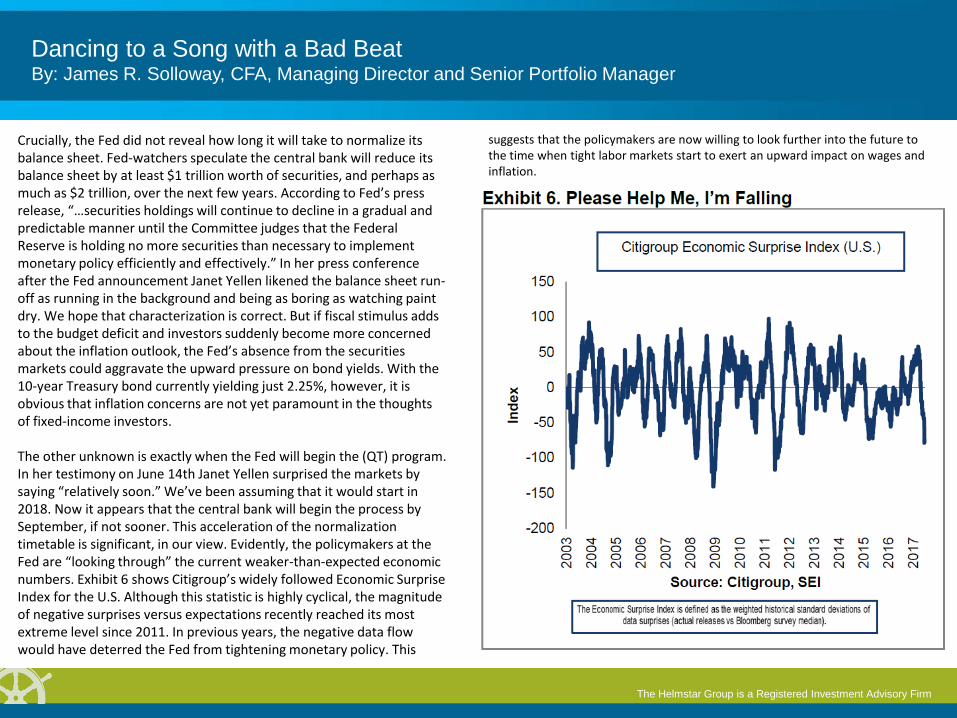
Crucially, the Fed did not reveal how long it will take to normalize its balance sheet. Fed-watchers speculate the central bank will reduce its balance sheet by at least $1 trillion worth of securities, and perhaps as much as $2 trillion, over the next few years. According to Fed’s press release, “…securities holdings will continue to decline in a gradual and predictable manner until the Committee judges that the Federal Reserve is holding no more securities than necessary to implement monetary policy efficiently and effectively.” In her press conference after the Fed announcement Janet Yellen likened the balance sheet run-off as running in the background and being as boring as watching paint dry. We hope that characterization is correct. But if fiscal stimulus adds to the budget deficit and investors suddenly become more concerned about the inflation outlook, the Fed’s absence from the securities markets could aggravate the upward pressure on bond yields. With the 10-year Treasury bond currently yielding just 2.25%, however, it is obvious that inflation concerns are not yet paramount in the thoughts of fixed-income investors. The other unknown is exactly when the Fed will begin the (QT) program. In her testimony on June 14th Janet Yellen surprised the markets by saying “relatively soon.” We’ve been assuming that it would start in 2018. Now it appears that the central bank will begin the process by September, if not sooner. This acceleration of the normalization timetable is significant, in our view. Evidently, the policymakers at the Fed are “looking through” the current weaker-than-expected economic numbers. Exhibit 6 shows Citigroup’s widely followed Economic Surprise Index for the U.S. Although this statistic is highly cyclical, the magnitude of negative surprises versus expectations recently reached its most extreme level since 2011. In previous years, the negative data flow would have deterred the Fed from tightening monetary policy. This
suggests that the policymakers are now willing to look further into the future to the time when tight labor markets start to exert an upward impact on wages and inflation.
The Helmstar Group is a Registered Investment Advisory Firm
Dancing to a Song with a Bad Beat By: James R. Solloway, CFA, Managing Director and Senior Portfolio Manager
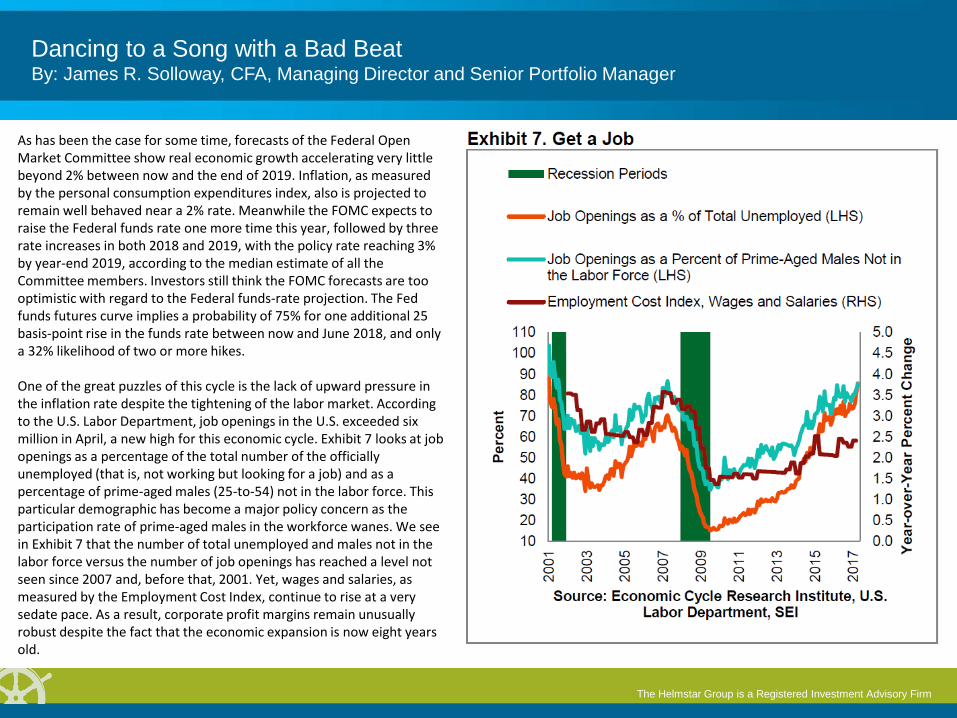
As has been the case for some time, forecasts of the Federal Open Market Committee show real economic growth accelerating very little beyond 2% between now and the end of 2019. Inflation, as measured by the personal consumption expenditures index, also is projected to remain well behaved near a 2% rate. Meanwhile the FOMC expects to raise the Federal funds rate one more time this year, followed by three rate increases in both 2018 and 2019, with the policy rate reaching 3% by year-end 2019, according to the median estimate of all the Committee members. Investors still think the FOMC forecasts are too optimistic with regard to the Federal funds-rate projection. The Fed funds futures curve implies a probability of 75% for one additional 25 basis-point rise in the funds rate between now and June 2018, and only a 32% likelihood of two or more hikes. One of the great puzzles of this cycle is the lack of upward pressure in the inflation rate despite the tightening of the labor market. According to the U.S. Labor Department, job openings in the U.S. exceeded six million in April, a new high for this economic cycle. Exhibit 7 looks at job openings as a percentage of the total number of the officially unemployed (that is, not working but looking for a job) and as a percentage of prime-aged males (25-to-54) not in the labor force. This particular demographic has become a major policy concern as the participation rate of prime-aged males in the workforce wanes. We see in Exhibit 7 that the number of total unemployed and males not in the labor force versus the number of job openings has reached a level not seen since 2007 and, before that, 2001. Yet, wages and salaries, as measured by the Employment Cost Index, continue to rise at a very sedate pace. As a result, corporate profit margins remain unusually robust despite the fact that the economic expansion is now eight years old.
The Helmstar Group is a Registered Investment Advisory Firm
Dancing to a Song with a Bad Beat By: James R. Solloway, CFA, Managing Director and Senior Portfolio Manager
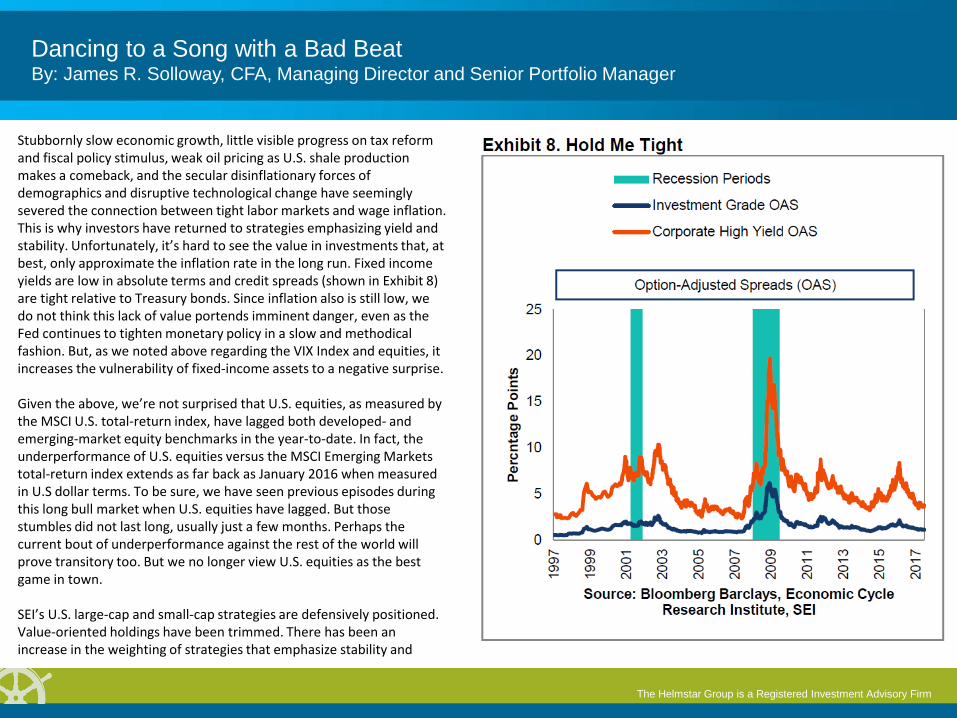
Stubbornly slow economic growth, little visible progress on tax reform and fiscal policy stimulus, weak oil pricing as U.S. shale production makes a comeback, and the secular disinflationary forces of demographics and disruptive technological change have seemingly severed the connection between tight labor markets and wage inflation. This is why investors have returned to strategies emphasizing yield and stability. Unfortunately, it’s hard to see the value in investments that, at best, only approximate the inflation rate in the long run. Fixed income yields are low in absolute terms and credit spreads (shown in Exhibit 8) are tight relative to Treasury bonds. Since inflation also is still low, we do not think this lack of value portends imminent danger, even as the Fed continues to tighten monetary policy in a slow and methodical fashion. But, as we noted above regarding the VIX Index and equities, it increases the vulnerability of fixed-income assets to a negative surprise. Given the above, we’re not surprised that U.S. equities, as measured by the MSCI U.S. total-return index, have lagged both developed- and emerging-market equity benchmarks in the year-to-date. In fact, the underperformance of U.S. equities versus the MSCI Emerging Markets total-return index extends as far back as January 2016 when measured in U.S dollar terms. To be sure, we have seen previous episodes during this long bull market when U.S. equities have lagged. But those stumbles did not last long, usually just a few months. Perhaps the current bout of underperformance against the rest of the world will prove transitory too. But we no longer view U.S. equities as the best game in town. SEI’s U.S. large-cap and small-cap strategies are defensively positioned. Value-oriented holdings have been trimmed. There has been an increase in the weighting of strategies that emphasize stability and
The Helmstar Group is a Registered Investment Advisory Firm
Dancing to a Song with a Bad Beat By: James R. Solloway, CFA, Managing Director and Senior Portfolio Manager
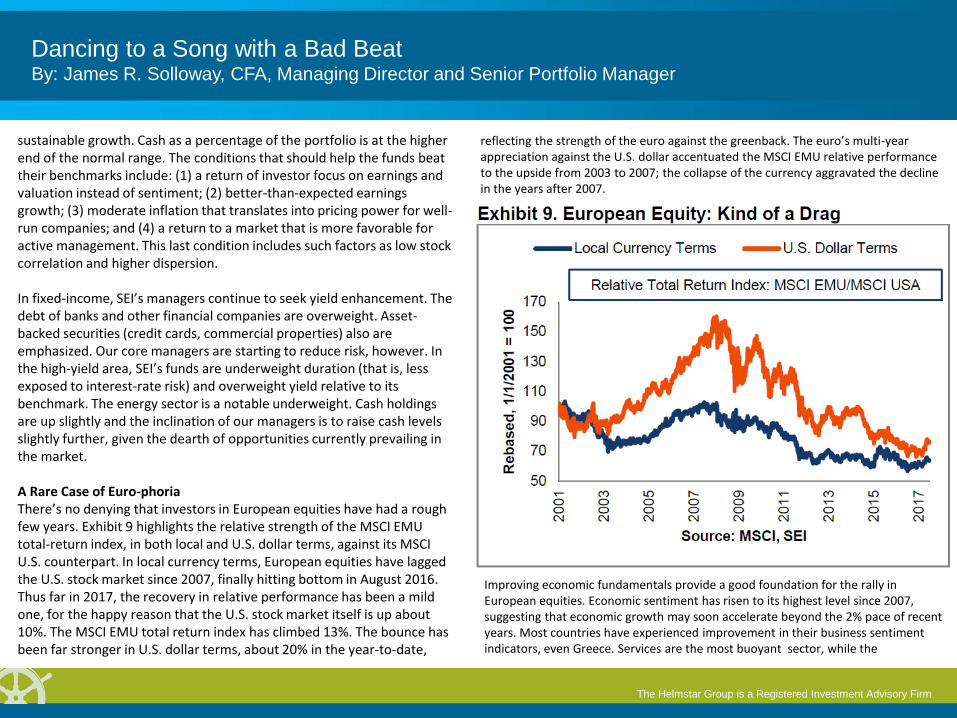
sustainable growth. Cash as a percentage of the portfolio is at the higher end of the normal range. The conditions that should help the funds beat their benchmarks include: (1) a return of investor focus on earnings and valuation instead of sentiment; (2) better-than-expected earnings growth; (3) moderate inflation that translates into pricing power for well-run companies; and (4) a return to a market that is more favorable for active management. This last condition includes such factors as low stock correlation and higher dispersion. In fixed-income, SEI’s managers continue to seek yield enhancement. The debt of banks and other financial companies are overweight. Asset-backed securities (credit cards, commercial properties) also are emphasized. Our core managers are starting to reduce risk, however. In the high-yield area, SEI’s funds are underweight duration (that is, less exposed to interest-rate risk) and overweight yield relative to its benchmark. The energy sector is a notable underweight. Cash holdings are up slightly and the inclination of our managers is to raise cash levels slightly further, given the dearth of opportunities currently prevailing in the market. A Rare Case of Euro-phoria There’s no denying that investors in European equities have had a rough few years. Exhibit 9 highlights the relative strength of the MSCI EMU total-return index, in both local and U.S. dollar terms, against its MSCI U.S. counterpart. In local currency terms, European equities have lagged the U.S. stock market since 2007, finally hitting bottom in August 2016. Thus far in 2017, the recovery in relative performance has been a mild one, for the happy reason that the U.S. stock market itself is up about 10%. The MSCI EMU total return index has climbed 13%. The bounce has been far stronger in U.S. dollar terms, about 20% in the year-to-date,
reflecting the strength of the euro against the greenback. The euro’s multi-year appreciation against the U.S. dollar accentuated the MSCI EMU relative performance to the upside from 2003 to 2007; the collapse of the currency aggravated the decline in the years after 2007.
Improving economic fundamentals provide a good foundation for the rally in European equities. Economic sentiment has risen to its highest level since 2007, suggesting that economic growth may soon accelerate beyond the 2% pace of recent years. Most countries have experienced improvement in their business sentiment indicators, even Greece. Services are the most buoyant sector, while the
The Helmstar Group is a Registered Investment Advisory Firm
Dancing to a Song with a Bad Beat By: James R. Solloway, CFA, Managing Director and Senior Portfolio Manager
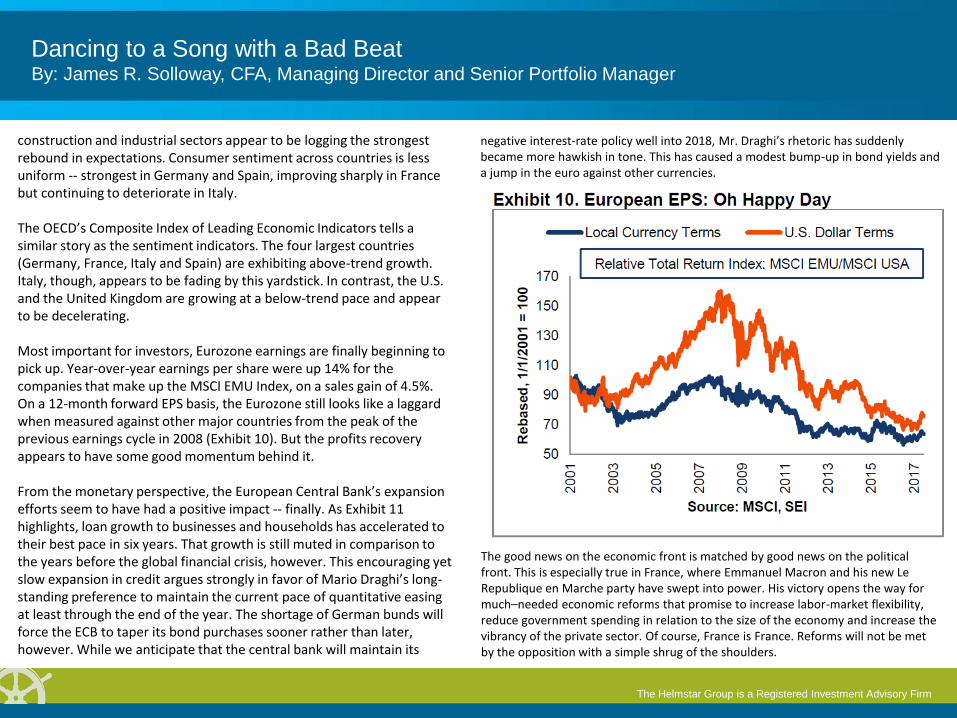
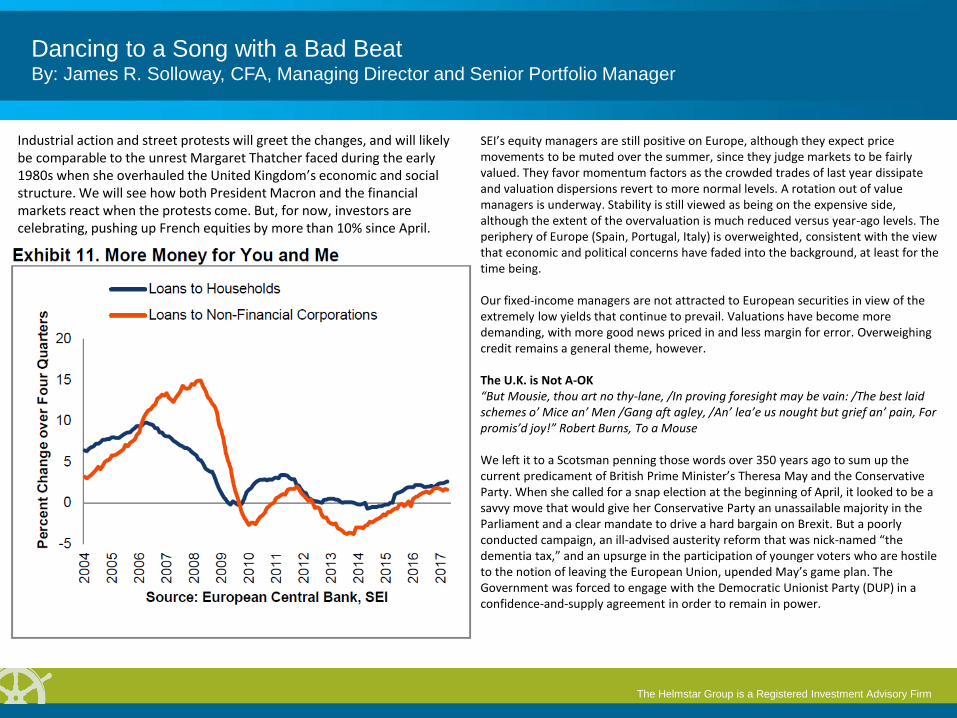
construction and industrial sectors appear to be logging the strongest rebound in expectations. Consumer sentiment across countries is less uniform -- strongest in Germany and Spain, improving sharply in France but continuing to deteriorate in Italy. The OECD’s Composite Index of Leading Economic Indicators tells a similar story as the sentiment indicators. The four largest countries (Germany, France, Italy and Spain) are exhibiting above-trend growth. Italy, though, appears to be fading by this yardstick. In contrast, the U.S. and the United Kingdom are growing at a below-trend pace and appear to be decelerating. Most important for investors, Eurozone earnings are finally beginning to pick up. Year-over-year earnings per share were up 14% for the companies that make up the MSCI EMU Index, on a sales gain of 4.5%. On a 12-month forward EPS basis, the Eurozone still looks like a laggard when measured against other major countries from the peak of the previous earnings cycle in 2008 (Exhibit 10). But the profits recovery appears to have some good momentum behind it. From the monetary perspective, the European Central Bank’s expansion efforts seem to have had a positive impact -- finally. As Exhibit 11 highlights, loan growth to businesses and households has accelerated to their best pace in six years. That growth is still muted in comparison to the years before the global financial crisis, however. This encouraging yet slow expansion in credit argues strongly in favor of Mario Draghi’s long-standing preference to maintain the current pace of quantitative easing at least through the end of the year. The shortage of German bunds will force the ECB to taper its bond purchases sooner rather than later, however. While we anticipate that the central bank will maintain its
negative interest-rate policy well into 2018, Mr. Draghi’s rhetoric has suddenly became more hawkish in tone. This has caused a modest bump-up in bond yields and a jump in the euro against other currencies.
The good news on the economic front is matched by good news on the political front. This is especially true in France, where Emmanuel Macron and his new Le Republique en Marche party have swept into power. His victory opens the way for much–needed economic reforms that promise to increase labor-market flexibility, reduce government spending in relation to the size of the economy and increase the vibrancy of the private sector. Of course, France is France. Reforms will not be met by the opposition with a simple shrug of the shoulders.
The Helmstar Group is a Registered Investment Advisory Firm
Dancing to a Song with a Bad Beat By: James R. Solloway, CFA, Managing Director and Senior Portfolio Manager
Industrial action and street protests will greet the changes, and will likely be comparable to the unrest Margaret Thatcher faced during the early 1980s when she overhauled the United Kingdom’s economic and social structure. We will see how both President Macron and the financial markets react when the protests come. But, for now, investors are celebrating, pushing up French equities by more than 10% since April.
SEI’s equity managers are still positive on Europe, although they expect price movements to be muted over the summer, since they judge markets to be fairly valued. They favor momentum factors as the crowded trades of last year dissipate and valuation dispersions revert to more normal levels. A rotation out of value managers is underway. Stability is still viewed as being on the expensive side, although the extent of the overvaluation is much reduced versus year-ago levels. The periphery of Europe (Spain, Portugal, Italy) is overweighted, consistent with the view that economic and political concerns have faded into the background, at least for the time being. Our fixed-income managers are not attracted to European securities in view of the extremely low yields that continue to prevail. Valuations have become more demanding, with more good news priced in and less margin for error. Overweighing credit remains a general theme, however. The U.K. is Not A-OK “But Mousie, thou art no thy-lane, /In proving foresight may be vain: /The best laid schemes o’ Mice an’ Men /Gang aft agley, /An’ lea’e us nought but grief an’ pain, For promis’d joy!” Robert Burns, To a Mouse We left it to a Scotsman penning those words over 350 years ago to sum up the current predicament of British Prime Minister’s Theresa May and the Conservative Party. When she called for a snap election at the beginning of April, it looked to be a savvy move that would give her Conservative Party an unassailable majority in the Parliament and a clear mandate to drive a hard bargain on Brexit. But a poorly conducted campaign, an ill-advised austerity reform that was nick-named “the dementia tax,” and an upsurge in the participation of younger voters who are hostile to the notion of leaving the European Union, upended May’s game plan. The Government was forced to engage with the Democratic Unionist Party (DUP) in a confidence-and-supply agreement in order to remain in power.
The Helmstar Group is a Registered Investment Advisory Firm
Dancing to a Song with a Bad Beat By: James R. Solloway, CFA, Managing Director and Senior Portfolio Manager
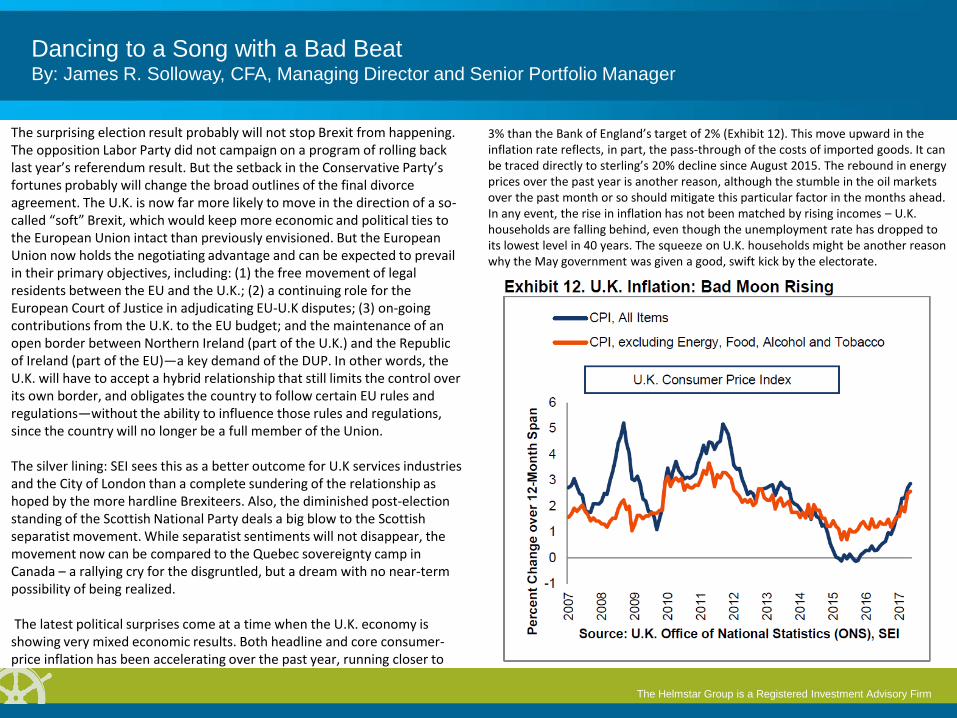
The surprising election result probably will not stop Brexit from happening. The opposition Labor Party did not campaign on a program of rolling back last year’s referendum result. But the setback in the Conservative Party’s fortunes probably will change the broad outlines of the final divorce agreement. The U.K. is now far more likely to move in the direction of a so-called “soft” Brexit, which would keep more economic and political ties to the European Union intact than previously envisioned. But the European Union now holds the negotiating advantage and can be expected to prevail in their primary objectives, including: (1) the free movement of legal residents between the EU and the U.K.; (2) a continuing role for the European Court of Justice in adjudicating EU-U.K disputes; (3) on-going contributions from the U.K. to the EU budget; and the maintenance of an open border between Northern Ireland (part of the U.K.) and the Republic of Ireland (part of the EU)—a key demand of the DUP. In other words, the U.K. will have to accept a hybrid relationship that still limits the control over its own border, and obligates the country to follow certain EU rules and regulations—without the ability to influence those rules and regulations, since the country will no longer be a full member of the Union. The silver lining: SEI sees this as a better outcome for U.K services industries and the City of London than a complete sundering of the relationship as hoped by the more hardline Brexiteers. Also, the diminished post-election standing of the Scottish National Party deals a big blow to the Scottish separatist movement. While separatist sentiments will not disappear, the movement now can be compared to the Quebec sovereignty camp in Canada – a rallying cry for the disgruntled, but a dream with no near-term possibility of being realized. The latest political surprises come at a time when the U.K. economy is showing very mixed economic results. Both headline and core consumer-price inflation has been accelerating over the past year, running closer to
3% than the Bank of England’s target of 2% (Exhibit 12). This move upward in the inflation rate reflects, in part, the pass-through of the costs of imported goods. It can be traced directly to sterling’s 20% decline since August 2015. The rebound in energy prices over the past year is another reason, although the stumble in the oil markets over the past month or so should mitigate this particular factor in the months ahead. In any event, the rise in inflation has not been matched by rising incomes – U.K. households are falling behind, even though the unemployment rate has dropped to its lowest level in 40 years. The squeeze on U.K. households might be another reason why the May government was given a good, swift kick by the electorate.
The Helmstar Group is a Registered Investment Advisory Firm
Dancing to a Song with a Bad Beat By: James R. Solloway, CFA, Managing Director and Senior Portfolio Manager
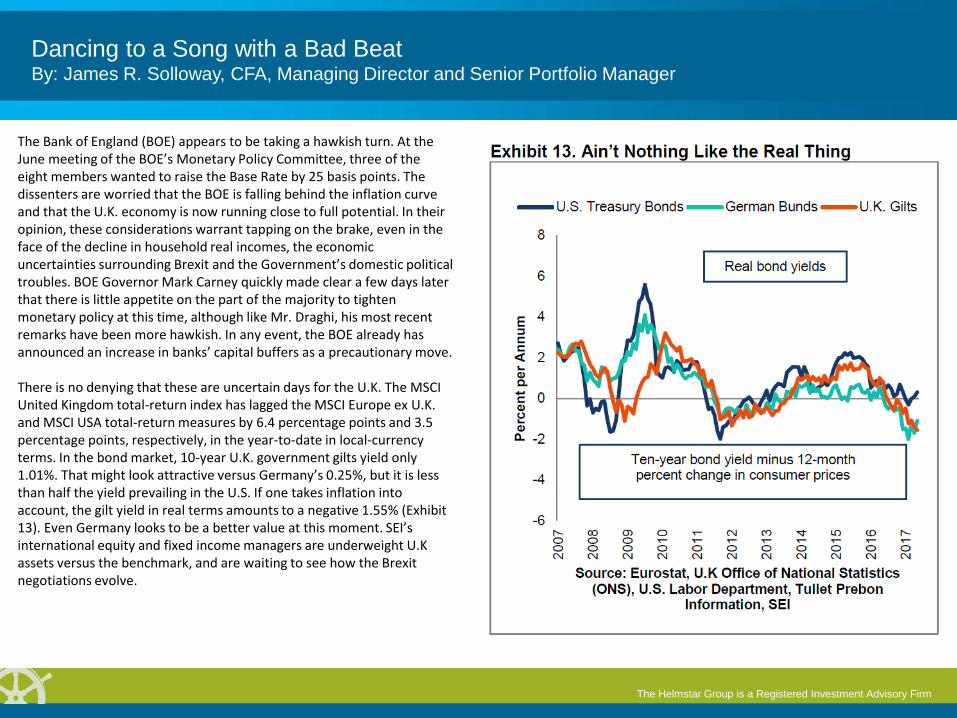
The Bank of England (BOE) appears to be taking a hawkish turn. At the June meeting of the BOE’s Monetary Policy Committee, three of the eight members wanted to raise the Base Rate by 25 basis points. The dissenters are worried that the BOE is falling behind the inflation curve and that the U.K. economy is now running close to full potential. In their opinion, these considerations warrant tapping on the brake, even in the face of the decline in household real incomes, the economic uncertainties surrounding Brexit and the Government’s domestic political troubles. BOE Governor Mark Carney quickly made clear a few days later that there is little appetite on the part of the majority to tighten monetary policy at this time, although like Mr. Draghi, his most recent remarks have been more hawkish. In any event, the BOE already has announced an increase in banks’ capital buffers as a precautionary move. There is no denying that these are uncertain days for the U.K. The MSCI United Kingdom total-return index has lagged the MSCI Europe ex U.K. and MSCI USA total-return measures by 6.4 percentage points and 3.5 percentage points, respectively, in the year-to-date in local-currency terms. In the bond market, 10-year U.K. government gilts yield only 1.01%. That might look attractive versus Germany’s 0.25%, but it is less than half the yield prevailing in the U.S. If one takes inflation into account, the gilt yield in real terms amounts to a negative 1.55% (Exhibit 13). Even Germany looks to be a better value at this moment. SEI’s international equity and fixed income managers are underweight U.K assets versus the benchmark, and are waiting to see how the Brexit negotiations evolve.
The Helmstar Group is a Registered Investment Advisory Firm
Dancing to a Song with a Bad Beat By: James R. Solloway, CFA, Managing Director and Senior Portfolio Manager
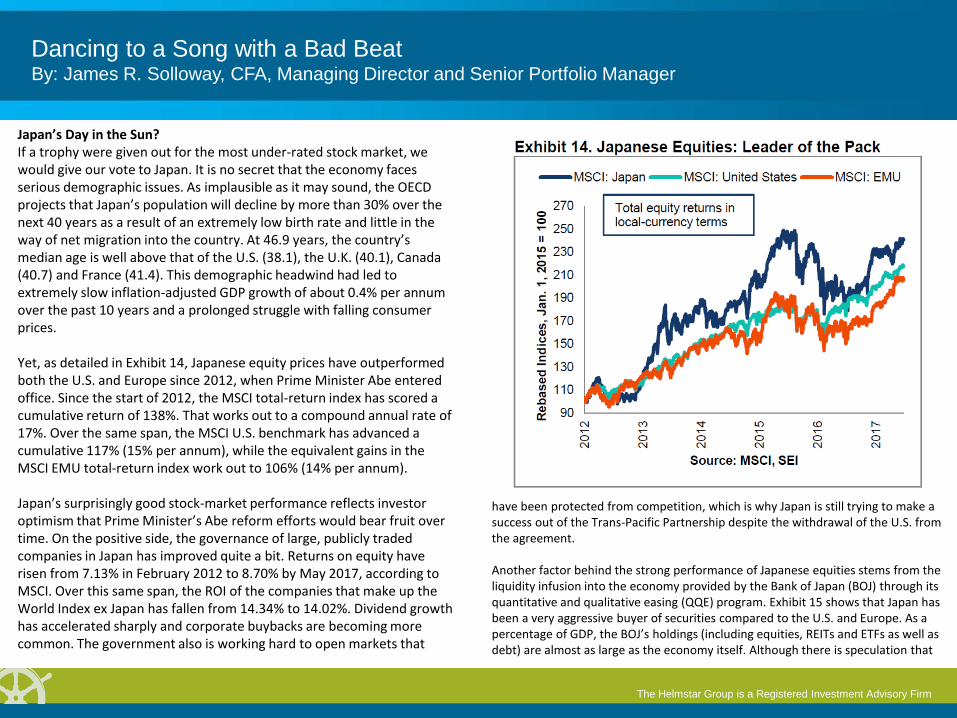
Japan’s Day in the Sun? If a trophy were given out for the most under-rated stock market, we would give our vote to Japan. It is no secret that the economy faces serious demographic issues. As implausible as it may sound, the OECD projects that Japan’s population will decline by more than 30% over the next 40 years as a result of an extremely low birth rate and little in the way of net migration into the country. At 46.9 years, the country’s median age is well above that of the U.S. (38.1), the U.K. (40.1), Canada (40.7) and France (41.4). This demographic headwind had led to extremely slow inflation-adjusted GDP growth of about 0.4% per annum over the past 10 years and a prolonged struggle with falling consumer prices. Yet, as detailed in Exhibit 14, Japanese equity prices have outperformed both the U.S. and Europe since 2012, when Prime Minister Abe entered office. Since the start of 2012, the MSCI total-return index has scored a cumulative return of 138%. That works out to a compound annual rate of 17%. Over the same span, the MSCI U.S. benchmark has advanced a cumulative 117% (15% per annum), while the equivalent gains in the MSCI EMU total-return index work out to 106% (14% per annum). Japan’s surprisingly good stock-market performance reflects investor optimism that Prime Minister’s Abe reform efforts would bear fruit over time. On the positive side, the governance of large, publicly traded companies in Japan has improved quite a bit. Returns on equity have risen from 7.13% in February 2012 to 8.70% by May 2017, according to MSCI. Over this same span, the ROI of the companies that make up the World Index ex Japan has fallen from 14.34% to 14.02%. Dividend growth has accelerated sharply and corporate buybacks are becoming more common. The government also is working hard to open markets that
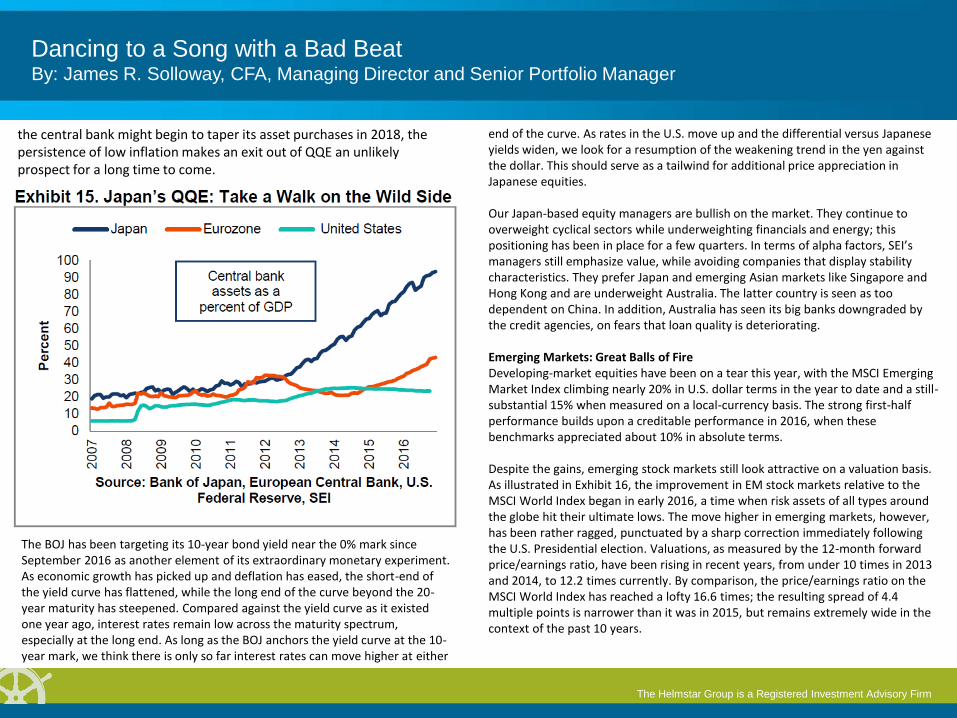
have been protected from competition, which is why Japan is still trying to make a success out of the Trans-Pacific Partnership despite the withdrawal of the U.S. from the agreement. Another factor behind the strong performance of Japanese equities stems from the liquidity infusion into the economy provided by the Bank of Japan (BOJ) through its quantitative and qualitative easing (QQE) program. Exhibit 15 shows that Japan has been a very aggressive buyer of securities compared to the U.S. and Europe. As a percentage of GDP, the BOJ’s holdings (including equities, REITs and ETFs as well as debt) are almost as large as the economy itself. Although there is speculation that
The Helmstar Group is a Registered Investment Advisory Firm
Dancing to a Song with a Bad Beat By: James R. Solloway, CFA, Managing Director and Senior Portfolio Manager
the central bank might begin to taper its asset purchases in 2018, the persistence of low inflation makes an exit out of QQE an unlikely prospect for a long time to come.
The BOJ has been targeting its 10-year bond yield near the 0% mark since September 2016 as another element of its extraordinary monetary experiment. As economic growth has picked up and deflation has eased, the short-end of the yield curve has flattened, while the long end of the curve beyond the 20-year maturity has steepened. Compared against the yield curve as it existed one year ago, interest rates remain low across the maturity spectrum, especially at the long end. As long as the BOJ anchors the yield curve at the 10-year mark, we think there is only so far interest rates can move higher at either
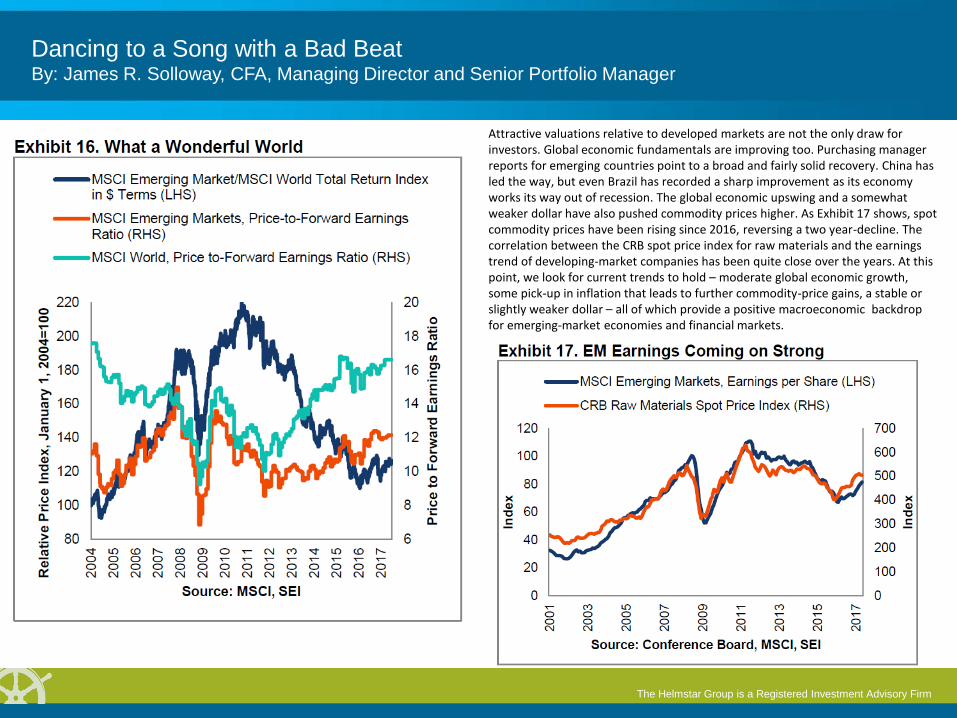
end of the curve. As rates in the U.S. move up and the differential versus Japanese yields widen, we look for a resumption of the weakening trend in the yen against the dollar. This should serve as a tailwind for additional price appreciation in Japanese equities. Our Japan-based equity managers are bullish on the market. They continue to overweight cyclical sectors while underweighting financials and energy; this positioning has been in place for a few quarters. In terms of alpha factors, SEI’s managers still emphasize value, while avoiding companies that display stability characteristics. They prefer Japan and emerging Asian markets like Singapore and Hong Kong and are underweight Australia. The latter country is seen as too dependent on China. In addition, Australia has seen its big banks downgraded by the credit agencies, on fears that loan quality is deteriorating. Emerging Markets: Great Balls of Fire Developing-market equities have been on a tear this year, with the MSCI Emerging Market Index climbing nearly 20% in U.S. dollar terms in the year to date and a still-substantial 15% when measured on a local-currency basis. The strong first-half performance builds upon a creditable performance in 2016, when these benchmarks appreciated about 10% in absolute terms. Despite the gains, emerging stock markets still look attractive on a valuation basis. As illustrated in Exhibit 16, the improvement in EM stock markets relative to the MSCI World Index began in early 2016, a time when risk assets of all types around the globe hit their ultimate lows. The move higher in emerging markets, however, has been rather ragged, punctuated by a sharp correction immediately following the U.S. Presidential election. Valuations, as measured by the 12-month forward price/earnings ratio, have been rising in recent years, from under 10 times in 2013 and 2014, to 12.2 times currently. By comparison, the price/earnings ratio on the MSCI World Index has reached a lofty 16.6 times; the resulting spread of 4.4 multiple points is narrower than it was in 2015, but remains extremely wide in the context of the past 10 years.
The Helmstar Group is a Registered Investment Advisory Firm
Dancing to a Song with a Bad Beat By: James R. Solloway, CFA, Managing Director and Senior Portfolio Manager
Attractive valuations relative to developed markets are not the only draw for investors. Global economic fundamentals are improving too. Purchasing manager reports for emerging countries point to a broad and fairly solid recovery. China has led the way, but even Brazil has recorded a sharp improvement as its economy works its way out of recession. The global economic upswing and a somewhat weaker dollar have also pushed commodity prices higher. As Exhibit 17 shows, spot commodity prices have been rising since 2016, reversing a two year-decline. The correlation between the CRB spot price index for raw materials and the earnings trend of developing-market companies has been quite close over the years. At this point, we look for current trends to hold – moderate global economic growth, some pick-up in inflation that leads to further commodity-price gains, a stable or slightly weaker dollar – all of which provide a positive macroeconomic backdrop for emerging-market economies and financial markets.
The Helmstar Group is a Registered Investment Advisory Firm
Dancing to a Song with a Bad Beat By: James R. Solloway, CFA, Managing Director and Senior Portfolio Manager
Emerging-market bond investors are still dancing, however. The option-adjusted spread on dollar-denominated bonds is down to 2.72 percentage points, a sharp contraction from its recent cyclical high of 4.79 percentage points in February 2016. That is about as narrow as this spread has gotten outside of the 2006-to-early 2007 period. At this point, our managers favor local-currency debt over the dollar-denominated variety. Argentina, a serial defaulter throughout its history, recently scored a major coup by selling a high-yielding 100-year dollar-denominated bond. Perhaps this obligation will be paid off in full when it matures. We hope to be around to see that day. We also hope that we age as gracefully as Dick Clark did during his life while we are waiting.
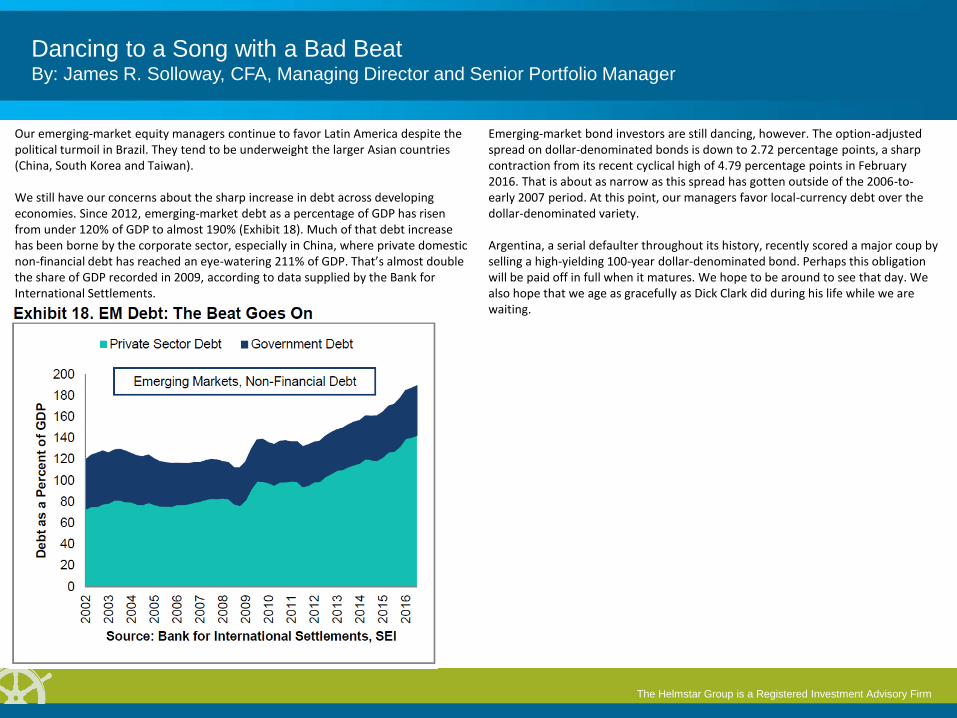
Our emerging-market equity managers continue to favor Latin America despite the political turmoil in Brazil. They tend to be underweight the larger Asian countries (China, South Korea and Taiwan). We still have our concerns about the sharp increase in debt across developing economies. Since 2012, emerging-market debt as a percentage of GDP has risen from under 120% of GDP to almost 190% (Exhibit 18). Much of that debt increase has been borne by the corporate sector, especially in China, where private domestic non-financial debt has reached an eye-watering 211% of GDP. That’s almost double the share of GDP recorded in 2009, according to data supplied by the Bank for International Settlements.

The Helmstar Group is a Registered Investment Advisory Firm
Dancing to a Song with a Bad Beat By: James R. Solloway, CFA, Managing Director and Senior Portfolio Manager
This material represents an assessment of the market environment at a specific point in time and is not intended to be a forecast of future events, or a guarantee of future results. This information should not be relied upon by the reader as research or investment advice regarding the Funds or any stock in particular, nor should it be construed as a recommendation to purchase or sell a security, including futures contracts. There is no assurance as of the date of this material that the securities mentioned remain in or out of SEI Funds. There are risks involved with investing, including loss of principal. Current and future portfolio holdings are subject to risks as well. International investments may involve risk of capital loss from unfavorable fluctuation in currency values, from differences in generally accepted accounting principles or from economic or political instability in other nations. Emerging markets involve heightened risks related to the same factors as well as increased volatility and lower trading volume. Narrowly focused investments and smaller companies typically exhibit higher volatility. Bonds and bond funds will decrease in value as interest rates rise. High-yield bonds involve greater risks of default or downgrade and are more volatile than investment-grade securities, due to the speculative nature of their investments. Past performance does not guarantee future results Index returns are for illustrative purposes only and do not represent actual portfolio performance. Index returns do not reflect any management fees, transaction costs or expenses. One cannot invest directly in an index.
Certain economic and market information contained herein has been obtained from published sources prepared by other parties, which in certain cases have not been updated through the date hereof. While such sources are believed to be reliable, neither SEI nor its affiliates assumes any responsibility for the accuracy or completeness of such information and such information has not been independently verified by SEI. Neither SEI, nor its affiliates provide tax advice. Please note that (i) any discussion of U.S. tax matters contained in this communication cannot be used by you for the purpose of avoiding tax penalties; (ii) this communication was written to support the promotion or marketing of the matters addressed herein; and (iii) you should seek advice based on your particular circumstances from an independent tax advisor. Information provided by SEI Investments Management Corporation, a wholly owned subsidiary of SEI Investments Company. Neither SEI nor its subsidiaries is affiliated with your financial advisor.