Embed Size (px)
Citation preview

Journal of Legislation
Volume 6 | Issue 1 Article 14
1-1-1979
Economic Modelling: Its Role in State Policy-Making;NoteWalter J. Zukowski
Follow this and additional works at: http://scholarship.law.nd.edu/jleg
This Note is brought to you for free and open access by the Journal of Legislation at NDLScholarship. It has been accepted for inclusion in Journal ofLegislation by an authorized administrator of NDLScholarship. For more information, please contact [email protected].
Recommended CitationZukowski, Walter J. (1979) "Economic Modelling: Its Role in State Policy-Making;Note," Journal of Legislation: Vol. 6: Iss. 1, Article14.Available at: http://scholarship.law.nd.edu/jleg/vol6/iss1/14

ECONOMIC MODELLING:ITS ROLE IN STATE POLICY-MAKING
Countless programs and periodicals have documented the enormous increasein state government revenues over the past decade. With this growth havecome increased problems of state fiscal management. For instance, it isconsiderably more difficult today to efficiently allocate current revenues aswell as accurately predict what variables will influence state operations in thenear future. A working knowledge of both areas is essential for a state whichnot only wishes to be financially efficient but also a front-runner in statemanagement. One tool which can be of vital significance in both of theseareas is a form of economic modelling called Input-Output Analysis. "1-0" isessentially a blueprint of the structure of the different parts of an economy.
The essentials of modern input-output analysis were devised by WassilyLeontief of Harvard University in the 1930's. Since that time input-outputanalysis has undergone considerable conceptual refinement and elaboration, butthe basic elements are still as Leontief conceived them. Presently, input-outputanalysis has become one of the most widely applied tools of economic analysis.Because of its great usefulness as a practical analytical tool, input-outputeconomics has been characterized as "one of the most fundamental and fruitfulinnovations in economic analysis in recent decades."'
Although 1-0 has been used by foreign governments such as France,Norway and England, as well as the United States, 2 its use on the state leveluntil recently has been severely limited.3 Within the past several years, however,more than one hundred 1-0 studies have been developed for sub-nationaleconomies in the United States.4 These studies evidence the growing interestin 1-0, which is founded upon its great flexibility as a planning device. Beforefurther exploring the advantages of 1-0, a more explicit explanation is inorder.
Like all economic models, the 1-0 attempts to reflect the major factorsin an economy. It strives to roughly simulate the workings of an economy sothat the impact of future events can be predicted based on past responses.Initially, the economy must be disassembled so that each important variablecan be considered independently. Each variable is called a sector. Once thesectors are established data for each is collected. This is done primarily throughindustry survey, but it can also be collected from previously existing state andfederal sources. After considering this data, economists construct equations torepresent the impact each industry has upon the economy in general as well
1. Robert Dorfman, Wassily Leontiefs Contributioh to Economics, 75, No. 2 Swedish Journal of Economics440 (1973).
2. Chiou-shuang Yan, Introduction to Input-Output Economics 736 (1969).3. D. Allensworth, Public Administration 41-2 (1973).4. M. Jarvin Emerson & F. Charles Lamphear, Urban and Regional Economics 11 (1975).
Journal of Legislation
as the impact it has on all other industries. 5 These operations and data arethen fed into a computer which evaluates the relationships between each sectorof the economy.
1-0 MATRIX
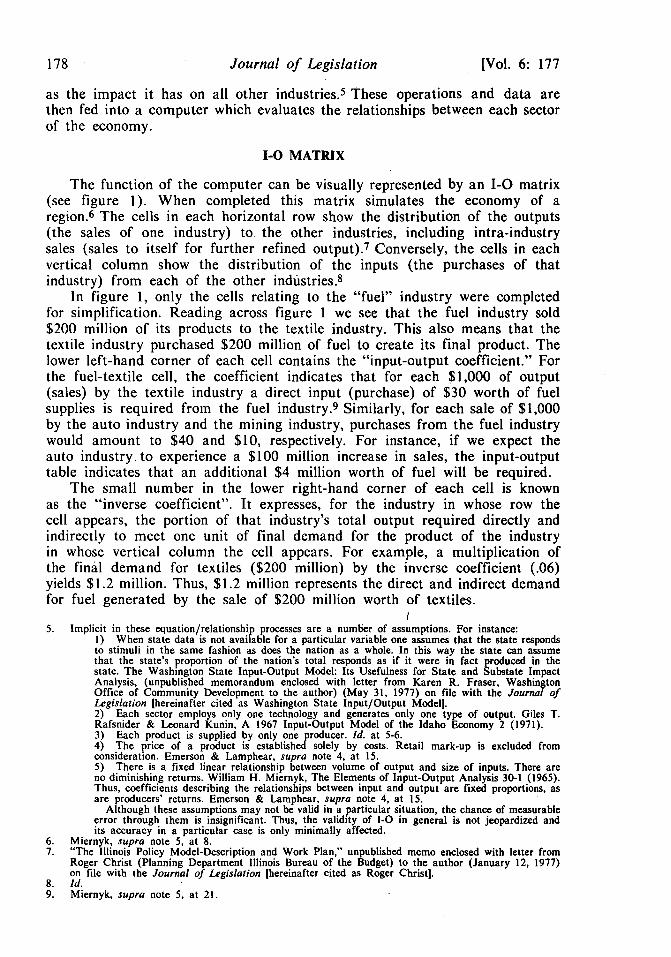
The function of the computer can be visually represented by an 1-0 matrix(see figure 1). When completed this matrix simulates the economy of aregion. 6 The cells in each horizontal row show the distribution of the outputs(the sales of one industry) to the other industries, including intra-industrysales (sales to itself for further refined output). 7 Conversely, the cells in eachvertical column show the distribution of the inputs (the purchases of thatindustry) from each of the other industries. 8
In figure 1, only the cells relating to the "fuel" industry were completedfor simplification. Reading across figure 1 we see that the fuel industry sold$200 million of its products to the textile industry. This also means that thetextile industry purchased $200 million of fuel to create its final product. Thelower left-hand corner of each cell contains the "input-output coefficient." Forthe fuel-textile cell, the coefficient indicates that for each $1,000 of output(sales) by the textile industry a direct input (purchase) of $30 worth of fuelsupplies is required from the fuel industry.9 Similarly, for each sale of $1,000by the auto industry and the mining industry, purchases from the fuel industrywould amount to $40 and $10, respectively. For instance, if we expect theauto industry to experience a $100 million increase in sales, the input-outputtable indicates that an additional $4 million worth of fuel will be required.
The small number in the lower right-hand corner of each cell is knownas the "inverse coefficient". It expresses, for the industry in whose row thecell appears, the portion of that industry's total output required directly andindirectly to meet one unit of final demand for the product of the industryin whose vertical column the cell appears. For example, a multiplication ofthe final demand for textiles ($200 million) by the inverse coefficient (.06)yields $1.2 million. Thus, $1.2 million represents the direct and indirect demandfor fuel generated by the sale of $200 million worth of textiles.
15. Implicit in these equation/relationship processes are a number of assumptions. For instance:
1) When state data is not available for a particular variable one assumes that the state respondsto stimuli in the same fashion as does the nation as a whole. In this way the state can assumethat the state's proportion of the nation's total responds as if it were in fact produced in thestate. The Washington State Input-Output Model: Its Usefulness for State and Substate ImpactAnalysis, (unpublished memorandum enclosed with letter from Karen R. Fraser, WashingtonOffice of Community Development to the author) (May 31, 1977) on file with the Journal ofLegislation [hereinafter cited as Washington State Input/Output Model].2) Each sector employs only one technology and generates only one type of output. Giles T.Rafsnider & Leonard Kunin, A 1967 Input-Output Model of the Idaho Economy 2 (1971).3) Each product is supplied by only one producer. Id. at 5-6.4) The price of a product is established solely by costs. Retail mark-up is excluded fromconsideration. Emerson & Lamphear, supra note 4, at 15.5) There is a fixed linear relationship between volume of output and size of inputs. There areno diminishing returns. William H. Miernyk, The Elements of Input-Output Analysis 30-1 (1965).Thus, coefficients describing the relationships between input and output are fixed proportions, asare producers' returns. Emerson & Lamphear, supra note 4, at 15.
Although these assumptions may not be valid in a particular situation, the chance of measurableerror through them is insignificant. Thus, the validity of 1-0 in general is not jeopardized andits accuracy in a particular case is only minimally affected.
6. Miernyk, supra note 5, at 8.7. "The Illinois Policy Model-Description and Work Plan," unpublished memo enclosed with letter from
Roger Christ (Planning Department Illinois Bureau of the Budget) to the author (January 12, 1977)on file with the Journal of Legislation [hereinafter cited as Roger Christ].
8. Id.9. Miernyk, supra note 5, at 21.
[Vol. 6: 177
Economic Modelling
FIGURE I
00
-('
00
C
Co .2.
L
o
- 0)
Pal C:
0.! !
~00Buuw .L'0
otnV
Ce
an~nl 0 E -o *
oaas c o°
CO C
a~hiC!B a0
00o CL .E - ,.
1:10133S E)NISS33Od UO133S LIN3WAVd
DNi3flUOld AuISflINI
19791

Journal of Legislation
Summing these inverse coefficients in a column provides an output multiplierwhich shows the total expenditure generated in an economy by the sale of anadditional one dollar of goods or services by the industry designated at thetop of the column.10 For example, since the sum of inverse coefficients forfuel is 1.24, an additional one dollar sale by the fuel sector eventually producesa $1.24 worth of transactions in the entire economy.
APPLICATION OF 1-0
To illustrate how the model may be used statewide as one tool in policydecisions, consider the following examplo. State "A" is underdeveloped. Itspecializes in manufacturing heavy machinery and agriculture. Further assumethat a large proportion of its people work at low-pay, low-skill jobs. Thelegislature of state "A", wishing to increase the well-being of the public andto stimulate total production, decides to stimulate the economy. But whichspecific measure should it use? Should it decrease corporate or individualtaxes? Should it supplement personal wages or install a jobs program? Priorto the introduction of 1-0, selection of the proper tool would have been arduous.Legislators were primarily dependent upon their knowledge of economic theoryand their recollection of historical reactions in that region to previous economicpolicy devices. Many legislators, with a minimum of economic training, wouldhave customarily leaned toward the use of an income redistribution plan. Thisentails monetary aid to less economically fortunate families at the expense(higher taxes) of the more affluent.
The income redistribution plan usually draws support because it is extremelypopular with the voting public. It is believed that since all of the abovementioned alternatives would produce the same effect, the one which is mostvisible to the voter should be used. However, all the alternatives do not producethe same result. In fact, given an economy of this type, some of the alternatives,including the income redistribution plan, would be counterproductive." 1
The crux of an income-transfer plan revolves around the hypothesis thatabove a certain level of income the added benefit to the consumer providedby additional income is minimal. Thus, people with extra money save it,keeping the total level of spending low. By taxing the higher income levelsand transferring the surplus funds to lower-income individuals who need money,the total level of spending is increased. This, in turn, would lead to moredemand for goods and increased employment.
The conditions in state "A", however, are such that an income transferplan would reinforce rather than offset the original problem. Given the needsof the low-wage classes, their added income would inevitably be spent onproducts such as clothing, televisions, or furniture (which, in this instance, areproduced by other areas). They would not demand appreciably more of locallyproduced goods such as corn, butter or earth moving machines. Since themoney would go to goods produced in other areas, firms of state "A" wouldnot experience a permanent increase in demand. Likewise, the loss of income
10. Dean Schreiner, Arthur Ekholm & James Chang, A Guide to Input-Output Analysis for the OklahomaEconomy 4-5 (1977).
11. F. Galladay and R. Haveman, Regional and Distributional Effects of a Negative Income Tax, 66The American Economic Review 640 (1976).
[Vol. 6: 177

Economic Modelling
by the high-wage classes in state "A" via higher taxes would cause theseclasses to reduce their purchases of those goods typically produced by state"A", increasing income and employment in other states while leaving theunderlying economic conditions in state "A" unchanged. Though undetectedby typical analysis, the lure created by the high-wage job regions could alsoinfluence the migration of the labor supply from state "A" to other states,further contributing to the economic dilemma of state "A". The 1-0 wouldpoint out that an income-transfer program, as mentioned above, in a low-skilllow-wage region would not have the impact anticipated. 12
Under the conditions mentioned, the 1-0 would show that a skills developmentprogram (job training) would produce the optimum benefit for state "A". 13 Theeconomic policy of training people to perform highly skilled labor would reducetraining costs to prospective corporations, inducing them to locate in state"A". This would also eventually create a ready labor pool. The well-trainedlabor pool also would induce a greater variety of producers to locate in state"A". As they do so, the employment-based income would rise. Just as important,among the new firms would be companies which produce consumer goods(i.e., clothing, televisions and furniture). Thus, rather than having incomesiphened off to other economies to meet consumer needs, the income wouldremain in the indigenous economy where it would have the greatest multipliereffect. Eventually, the income from the jobs created would be plowed backinto the economy of state "A" since consumer demand could be satiated byconsumer-oriented firms that had located in state "A".
GROWTH AND USE OF 1-0
Some form of 1-0 has been used in at least twenty-five states. 14 1-0 isnot necessarily being used for economy-wide projects, but it is at least beingused by assorted agencies within those states.
At least four additional states are still in the planning or constructionstages with I-O, 15 which points to the ever-increasing interest in the area. Evenmore states wish to expand the existing uses of 1-0 analysis when fiscallyfeasible. 16
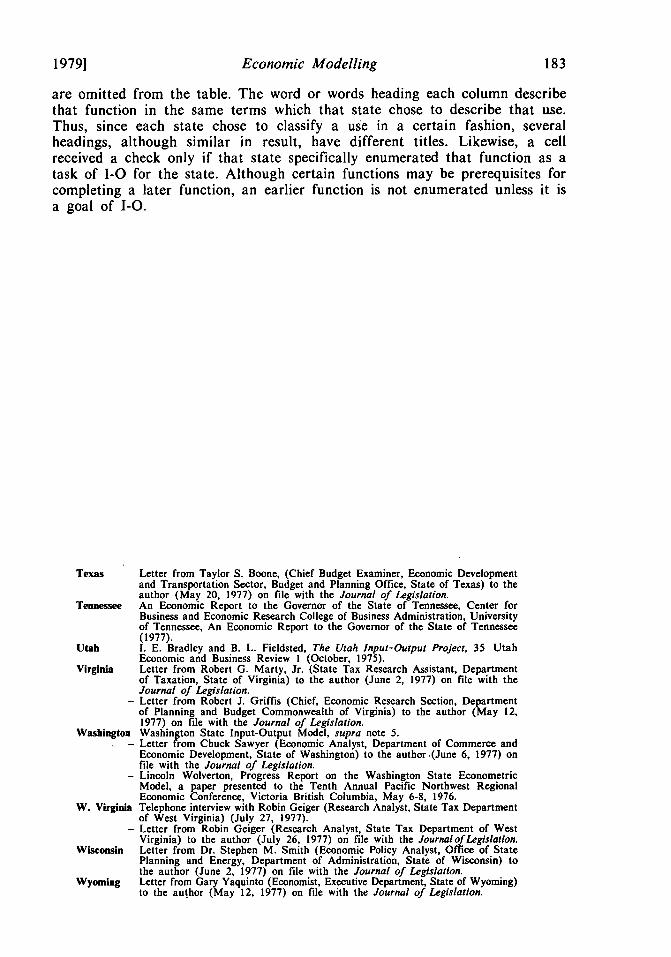
Possibly the best way to illustrate the recent growth and interest of 1-0would be to analyze the state-by-state uses of 1-0. The following table, figure2, is a compilation of the current and proposed uses of 1-0 by various stategovernments. 17 Uses which are feasible but unsupported by at least one state
12. Id. at 634.13. Id.14. The states with at least some use of 1-0 are: Alaska, Arizona, California, Connecticut, Florida,
Georgia, Idaho, Illinois, Kansas, Kentucky, Maryland, Michigan, Minnesota, Montana, Nevada, NewJersey, New York, North Carolina, Oregon, Rhode Island, Texas, Utah, Washington, W. Virginia andWyoming.
15. Alabama, Delaware, Oklahoma and South Carolina.16. The states wishing to expand 1-0 use are Alabama, Florida, Kansas, Oklahoma and Pennsylvania.17. The information or Figure 2 comes from the following sources:
Alabama Wayne C. Curtis, "A Research Proposal for an Input-Output Study of theEconomy of Alabama with Implications of Alternative Energy Policies," (Alabama:Center for Business and Economic Services, 1977) p. 3 .
Alaska Letter from David L. Gale (State of Alaska, Department of Labor, Chief ofResearch and Analysis) to the author (May 19, 1977) on file with theJournal of Legislation.
19791

182 Journal of Legislation [Vol. 6: 177
- David M. Reavme, Studying the Impact of Potential Development - The AlaskaPolicy Planning Model, a paper presented at the meetings of the WesternEconomics Association, June 23, 1977.
Arizona Letter from Eric J. Anderson (Economist, Office of Economic Planning andDevelopment, State of Arizona) to the author (June 14, 1977) on file with theJournal of Legislation.
Arkansas Letter from Robert K. Middleton III (Director, Economic Development PlanningProgram, Arkansas Industrial Development Commission) to the author (June2, 1977) on file with the Journal of Legislation.
- Letter from Frank H. Troutman (Head, Industrial Research and ExtensionCenter, Univ. of Arkansas) to the author (June 9, 1977) on file with theJournal of Legislation.
Connecticut Letter from Raymond S. Peterson (Director of Economic Planning, Office ofthe Governor, State of New Jersey) to the author (June 13, 1977) on file withthe Journal of Legislation.
California Letter from Patricia Landingham (Assistant Economist, Department of Finance,State of California) to the author (July 19, 1977) on file with the Journal ofLegislation.
Delaware Letter from Helen Gelof (Principal Planner, Economic and Statistical Unit,Office of Management - Budget and Planning, State of Delaware) to the author(May 12, 1977) on file with the Journal of Legislation.
Florida Letter from Richard J. Welsh (Planning Officer, Office of Management andBudget, State of Florida Department of Commerce) to the author (June 3,1977) on file with the Journal of Legislation.
Georgia Letter from Clark T. Stevens (Office of Planning and Budget, State of Georgia)to the author (May 18, 1977) on file with the Journal of Legislation.
Hawaii M. Norman and R. Russell, The Personal Income Model for Hawaii, 23National Tax Journal 429 (1970).
Idaho Letter from John T. Sahlberg (Economist, Division of Budget: Policy Planningand Coordination, State of Idaho) to the author (May 24, 1977) on file withthe Journal of Legislation.
- Rafsnider and Kunin, supra note 5.Illinois Roger Christ, supra note 7.
- The designations represent the options available under the IPM. It is not limitedto the state's current uses of 1-0.
Kansas Letter from A. Edwin Riemann (Economic Development Representative, KansasDepartment of Economic Development) to the author (May 12, 1977) on filewith the Journal of Legislation.
Kentucky Letter from William L. Short (Office of the Secretary, Development Cabinet,State of Kentucky) to the author (May 27, 1977) on file with the Journal ofLegislation.
Maryland John H. Cumberland, Design for a Maryland State Planning Model withEconomic-Environmental Linkages 3 (1971).
- Curtis C. Harris, 1970 Interindustry Model of the Maryland Economy 1 (1971).Michigan Letter from Jorge M. Ipina (Department of Management and Budget, State
of Michigan) to the author (June 29, 1977) on file with the Journal ofLegislation.
Minnesota Letter from James E. Moore (Director of Research, Department of EconomicDevelopment, State of Minnesota to the author (May 10, 1977) on file withthe Journal of Legislation.
Montana Letter from Bruce Finnie (Montana Department of Community Affairs) to theauthor (May 26, 1977) on file with the Journal of Legislation.
Nevada Letter from Victor R. Hill (Special Projects Engineer, State of Nevada,Department of Conservation and Natural Resources) to the author (July 15,1977), on file with the Journal of Legislation.
New Jersey Letter from Raymond S. Peterson, supra note 17 - Connecticut.New Mexico Letter from Eleanor V. Reed (Librarian, State Planning Office, State of New
Mexico) to the author (June 1, 1977), on file with the Journal of Legislation.New York Letter from Raymond S. Peterson, supra note 17 - Connecticut.N. Carolina Letter from Ken Flynt (Chief Economic Advisor to the Governor, North Carolina
Department of Administration) to the author (May 25, 1977) on file with theJournal of Legislation.
Oklahoma Letter from Harley Lingerfelt (Economic Planner, Department of Economicand Community Affairs, State of Oklahoma) to the author (May 11, 1977)on file with the Journal of Legislation.
- Schreiner, Ekholm, and Chang, supra note 10.Oregon Letter from Donald A. Watson (Professor of Finance, University of Oregon)
to the author (July 19, 1977) on file with the Journal of Legislation.Pennsylvania Telephone interview with Robert Lembke (Office of State Planning and
Development, Office of the- Governor, State of Pennsylvania) (May 19, 1977).Rhode Island Letter from Beatrice C. Frazer (Assistant Budget Analyst, Division of the
Budget, State of Rhode Island) to the author (May 13, 1977) on file with theJournal of Legislation.
S. Carolina Letter from Harry W. Miley, Jr. (Senior Economist, Division of Research andStatistical Services, State of S. Carolina) to the author (June 8, 1977) on filewith the Journal of Legislation.
19791 Economic Modelling
are omitted from the table. The word or words heading each column describethat function in the same terms which that state chose to describe that use.Thus, since each state chose to classify a use in a certain fashion, severalheadings, although similar in result, have different titles. Likewise, a cellreceived a check only if that state specifically enumerated that function as atask of 1-0 for the state. Although certain functions may be prerequisites forcompleting a later function, an earlier function is not enumerated unless it isa goal of 1-0.
Texas Letter from Taylor S. Boone, (Chief Budget Examiner, Economic Developmentand Transportation Sector, Budget and Planning Office, State of Texas) to theauthor (May 20, 1977) on file with the Journal of Legislation.
Tennessee An Economic Report to the Governor of the State of Tennessee, Center forBusiness and Economic Research College of Business Administration, Universityof Tennessee, An Economic Report to the Governor of the State of Tennessee(1977).
Utah I. E. Bradley and B. L. Fieldsted, The Utah Input-Output Project, 35 UtahEconomic and Business Review 1 (October, 1975).
Virginia Letter from Robert G. Marty, Jr. (State Tax Research Assistant, Departmentof Taxation, State of Virginia) to the author (June 2, 1977) on file with theJournal of Legislation.
- Letter from Robert J. Griffis (Chief, Economic Research Section, Departmentof Planning and Budget Commonwealth of Virginia) to the author (May 12,1977) on file with the Journal of Legislation.
Washington Washington State Input-Output Model, supra note 5.- Letter from Chuck Sawyer (Economic Analyst, Department of Commerce and
Economic Development, State of Washington) to the author (June 6, 1977) onfile with the Journal of Legislation.
- Lincoln Wolverton, Progress Report on the Washington State EconometricModel, a paper presented to the Tenth Annual Pacific Northwest RegionalEconomic Conference, Victoria British Columbia, May 6-8, 1976.
W. Virginia Telephone interview with Robin Geiger (Research Analyst, State Tax Departmentof West Virginia) (July 27, 1977).
- Letter from Robin Geiger (Research Analyst, State Tax Department of WestVirginia) to the author (July 26, 1977) on file with the Journal of Legislation.
Wisconsin Letter from Dr. Stephen M. Smith (Economic Policy Analyst, Office of StatePlanning and Energy, Department of Administration, State of Wisconsin) tothe author (June 2, 1977) on file with the Journal of Legislation.
Wyoming Letter from Gary Yaquinto (Economist, Executive Department, State of Wyoming)to the author (May 12, 1977) on file with the Journal of Legislation.

Journal of Legislation [Vol. 6: 177
FIGURE 2
NATIONWIDE USES OF 1-0 BY STATE GOVERNMENTS OR AGENCIES
R. 0
0 E
Alabama _ * l * I I IAlaska 1 1Arizona *I 1 _ I IArkansasCalifornia 0 0ColoradoConnecticut 0 0 • • _ 0 0 0DelawareFlorida 0 0 0 0 0Georgia 0Hawaii
Idaho 0O 0 _ 0 _ 000Illinois 0 000 0 , 0S 0000000 00Indiana
IowaKansas 0 0 _ _ 0 _ 0 0 00 0Kentucky 0 0 0LouisianaMaine
Maryland 00 0 01 0 0 0 10 1 1 0 0 0 00Massachusetts
Michigan 0 0Minnesota 0 0MissOuriMontana 0 0 0 0 0 0 0 0 0 _ 0Nebraska
Nevada S 0 -0
N. Hampshire
N. Jersey 0 00 0 0 00 0N. MexicoN. York 0 0 00 0 1 0 0 N. Carolina -N. Dakota
Ohio
Oklahoma 0 0 0 1Oregon •0 0PennsylvaniaA. Island 0 0S. Carolina 00 0 1 0 0
S. DakotaTennessee
Texas 0 0Utah 0 0 0 0 0 0VermontVirginiaWashington 0 0 0 0 ** 0
W. Virginia 0 0 0 0 •
WisconsinWyoming 0 0 •
Economic Modelling
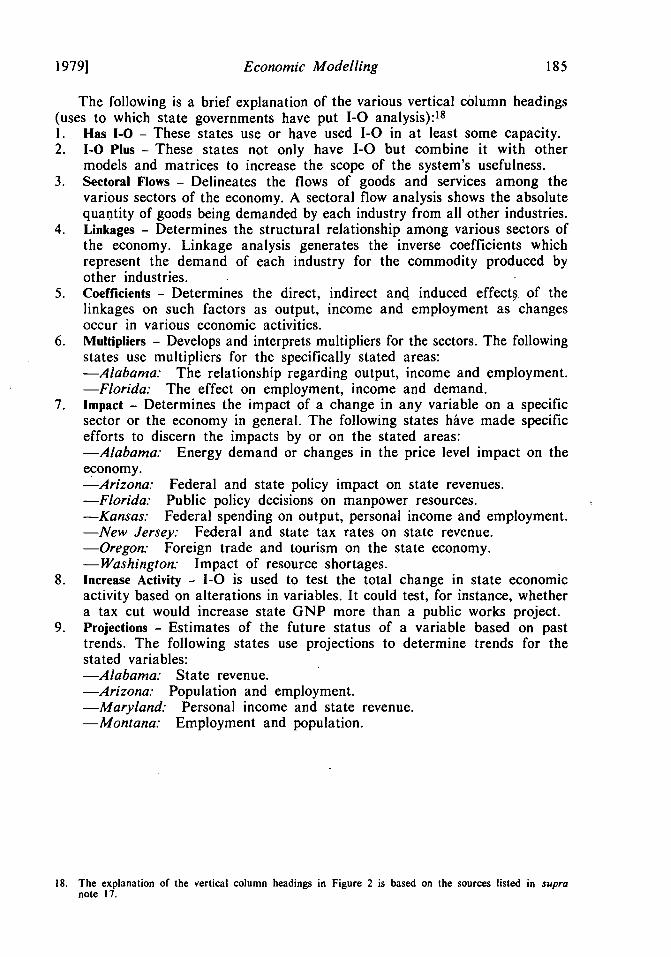
The following is a brief explanation of the various vertical column headings(uses to which state governments have put 1-0 analysis): 18
L Has I-0 - These states use or have used 1-0 in at least some capacity.2. 1-0 Plus- These states not only have 1-0 but combine it with other
models and matrices to increase the scope of the system's usefulness.3. Sectoral Flows - Delineates the flows of goods and services among the
various sectors of the economy. A sectoral flow analysis shows the absolutequantity of goods being demanded by each industry from all other industries.
4. Linkages - Determines the structural relationship among various sectors ofthe economy. Linkage analysis generates the inverse coefficients whichrepresent the demand of each industry for the commodity produced byother industries.
5. Coefficients - Determines the direct, indirect and induced effect§ of thelinkages on such factors as output, income and employment as changesoccur in various economic activities.
6. Multipliers - Develops and interprets multipliers for the sectors. The followingstates use multipliers for the specifically stated areas:-Alabama: The relationship regarding output, income and employment.-Florida: The effect on employment, income and demand.
7. Impact - Determines the impact of a change in any variable on a specificsector or the economy in general. The following states hAve made specificefforts to discern the impacts by or on the stated areas:-Alabama: Energy demand or changes in the price level impact on theeconomy.-Arizona: Federal and state policy impact on state revenues.-Florida: Public policy decisions on manpower resources.-Kansas: Federal spending on output, personal income and employment.-New Jersey: Federal and state tax rates on state revenue.-Oregon: Foreign trade and tourism on the state economy.-Washington: Impact of resource shortages.
8. Increase Activity - 1-0 is used to test the total change in state economicactivity based on alterations in variables. It could test, for instance, whethera tax cut would increase state GNP more than a public works project.
9. Projections - Estimates of the future status of a variable based on pasttrends. The following states use projections to determine trends for thestated variables:-Alabama: State revenue.-Arizona: Population and employment.-Maryland.- Personal income and state revenue.-Montana: Employment and population.
18. The explanation of the vertical column headings in Figure 2 is based on the sources listed in supranote 17.
19791

Journal of Legislation
10. Forecasting - Predicts sector levels and conditions based on past relationships.The following states make forecasts for the stated variables:-Idaho: Population and employment.-Kansas: State revenue.-Maryland: State revenue and pollution.-Michigan: Employment and labor.-Washington: Employment, wages, and personal income.
11. Simulations - Involves establishing long-run growth paths under alternativesets of assumptions and varying potential developments. The followingstates use simulation to specifically project the growth paths of the statedvariables:-Arizona: Population, labor supply, employment and income.-Montana: Income, employment and population.-Washington: Federal and state fiscal policies on the state's economy.(For example, state officials could simulate the effect of a ten-year revenuesharing program on the economy of the state.)
12. Strategy - Develops strategies for state economic development with specialemphasis on selected target industries.
13. Planning - Uses 1-0 as one tool to help determine the appropriate courseof future action for an area. Texas, for example, uses 1-0 to help planwater conservation.
14. Priorities - Establish a priority system for economic development. Certainindustries are crucial to expanding income and employment opportunitiesin a state. A few of these industries will continue to grow withoutextraordinary development efforts because of the locational advantagesavailable in the state. By channeling funds into other select industries,greater returns will be realized, and through an adequate study of thedeterminants of "family" industry development, these select industries canbe identified. Certain industries are structurally related in their inputs andin their product markets; thus, the existing structure of an economyencourages the growth of certain industries while virtually blocking entrancefor others. A rigorous identification of these structural relations in a state'seconomy would direct development efforts into proper channels.
15. Alternatives - Evaluates different governmental programs for achievingmaximum desired results with the least adverse effect. It also may beused to establish an acceptable range of impact. The following states testalternatives for the stated areas:-Idaho: Demand, income, employment, and output.-Illinois: Public policy decisions. /
16. Conservation - Assesses the economic cost of various parameters such asrationing or substitution. It also allows for the construction of alternativestrategies. The following states develop conservation strategies for thestates' resources using 1-0:-Idaho: Forestry.-Kansas: Energy and water.-Utah: Energy and water.
17. Resource Allocation - Determines a strategy or set of strategies for themost efficient resource use given state needs and conditions. The followingstates have constructed resource allocation policies regarding state resourcesusing 1-0:
[Vol. 6: 177

Economic Modelling
-California: Water.-Minnesota: Energy.-Oregon: Energy.
18. Current Services - Establishes current and future trends in the amount ofstate revenue spent on keeping governmental machinery operating. 1-0also determines the effect of changing the level of revenue spent on currentservices.
19. Marketing - Puts the state's industrial attraction efforts in the most favorablelight possible, via a detailed marketing package. All of the major factorsregarding location and an analysis of market availabilities are presentedin this type of 1-0 analysis.
20. Taxes - Projects current and future tax levels, as well as tax trends, andthe impact of alternative tax proposals.
21. Housing - Establishes statewide housing needs by geographic area.22. Income Transfer - Establishes the long-run costs and caseload volume of
state income transfer programs.23. Transportation - Determines flows of goods into, through and out of the
state, thereby illustrating where transportation departments should concentratetheir funds.
24. Manpower - Translates employment impacts of a change in one of themodel's input variables into occupational demand impacts, indicating thetype, number and location of various manpower needs.
25. Consumer Spending - Compares how households of different income categoriesallocate their consumer spending among the various kinds of goods andservices.
26. Employment - Estimates current and future employment levels, as well asemployment trends.
27. Income - Determines current and future income levels as well as incometrends.
28. Demand- Estimates demand stemming from the magnitude and mix ofstate industries and population characteristics.
29. Population - Estimates current and future population levels as well aspopulation trends.
ONE STATE'S PROPOSAL FOR 1-0
Although Illinois is a relative newcomer to 1-0 use, it has extensivelyresearched the use of such analysis. The result of this research was the IllinoisPolicy Model (IPM), a "work program" listing possible elements of an integrated1-0 system for the state. Portions of the IPM have not been implemented dueto limitations on manpower and financial resources. Nonetheless, the sophisticationand relevancy of the model warrant its further consideration. The IllinoisPolicy Model (IPM), as proposed, could be used to measure the direct, indirect,and induced changes in the final demand for goods and services. IPM is ageneralized policy-simulation model that is given a specific structure wheneverit is used to analyze a particular issue. As the result of being interfaced, IPMcould coordinate the modelling efforts of state agencies and makes themconsistent with not only IPM, but also with each other. In this way, interagencyplanning and impact analysis possibilities are expanded. For example, IPMcould be used to tie environmental, labor and energy variables together so
19791

Journal of Legislation
that analysis is consistent on fundamental interdependent issues. IPM couldalso structure the agencies' collection and exchange of information to minimizeduplication and increase the usefulness of data.
The Illinois Policy Model could be used independently or as a componentof a larger system. This flexibility of use with large data bases is a majorattribute of IPM. It is demonstrated by the following current or proposed usesof the IPM:
1. Multiplier Analysis 19
Increased production by any industry in the state will create new demandfor goods and services in the state. This increased production stimulates demandfor goods causing a multiplier effect throughout the state's economy. Themultiplier itself is the factor by which the dollar increase in production ismultiplied to obtain the sum of the additional demand caused by the increasedproduction. The industries represented in the Illinois 1-0 model would be rankordered according to their income and employment multipliers so that a betterunderstanding of the relative contribution of different industries to income andemployment could be obtained. These orderings can then be used as a guidein identifying industries which can maximize either employment or incomeimpacts of industrial development efforts.
2. Analysis of the Impacts of Industrial Location 20
The employment, income and income distribution impacts of the additionor loss of a manufacturing plant on the economy of the state could be examinedto identify any market adjustments which should be facilitated by publicinstitutions. For example, the impacts of locating solar energy testing plantsin Illinois can be analyzed.
3. Marketing Package 2'Efforts to attract new industrial activity into the state usually begin with
.the provision of general information on the living and operating conditions inthe state to potential investors. This type of information unfortunately is oflittle value to a firm interested in selecting a new plant site. The initial locationscreening process requires knowledge of the supply availabilities and marketpotentials of the region. To provide the state's industrial-attraction efforts witha competitive advantage over the information dissemination activities of economicdevelopment agencies of other states, a detailed marketing package whichspecifies the profile and amounts of inputs available and an analysis of marketavailabilities by industry could be designed. The major component of thisinformation package is the Illinois Interindustry Model. By making releventinformation readily available, the state would have a valuable tool for promotingeconomic development through encouraging new firms to locate in Illinois.
4. Analysis of Pollution Control Regulations 22
The Illinois Institute for Environmental Quality is mandated by law toassess the economic impacts of state pollution control regulations. The 1-0Model is currently being used to assess the output and employment impacts
19. Roger Christ, supra note 7, at 4.20. Id.21. Id. at 5.22. Id.
[Vol. 6: 177
Economic Modelling
of these regulations. It can further be used to assess the income distributionand occupational impacts. If IPM is interfaced with an effluent matrix, i.e.,a matrix of the pollutants by type and industry, this larger model would assessthe pollution impacts of alternative regulations and levels of industrial production.
5. Sales Tax and Household Income Tax Analysis 23
An associated matrix (TRIM) yields estimates of state and federal incometax payments by Illinois income classes. Price - sensitive sales tax analysiscould also be done if the requisite Consumer Expenditure System becomesavailable. When interfaced with the Consumer Expenditure System, TRIMcould yield estimates of sales tax payments by income class and commodity.By incorporating the analyses in IPM, employment, output, and incomedistribution impacts can also be estimated.
6. Costs and Caseloads of Income Transfer Programs24
IPM could estimate the eligibility costs and caseloads of various incometransfer programs. Specifically, an anlysis has been undertaken of the historicalcaseloads to estimate participation rates and reveal discrepancies between actualand estimated eligible caseloads. This analysis could form the foundation ofcaseload and cost projections for the next five years.
7. Housing Needs 25
The Department of Local Government Affairs' Housing Needs Model isbased, in part, upon Illinois population estimates and their household characteristics.Needs estimates are calculated on a state-wide basis by matching changedhousehold characteristics against changes in the housing stock.
8. Energy Conservation 26
The Illinois 1-0 matrix could be benchmarked to duplicate the state-wideenergy survey of 1971. Upon interfacing, IPM would serve as an integratingmodel to assess the economic impacts of capital expenditures by the energyindustry, the effects of energy costs and substitution of energy forms by variousindustries, and industry rationing.
9. State Budget Line Item Impacts27
Alternative state budgets could be examined for their employment, incomeand income distribution impacts. The various budgets could then be analyzedfor their occupational impacts to determine which occupations are most affected.IPM may be used to outline how each alternative might compete with privateindustry for labor. For example, state projects which impact high unemploymentoccupations could be given high priority or projects which affect recessionsensitive occupations can be initiated toward the end of a cyclical expansion.
10. Population and Employment Projections 28The population projections now prepared by the state could be used to
update the micro-date base of TRIM. Eventually, employment projectionswould be formally tied to the 1-0 matrix which indicates the interrelatednessof the Illinois economy.
23. Id.24. Id. at 6.25. Id.26. Id.27. Id.28. Id.
19791

Journal of Legislation [Vol. 6: 177
11. Manpower Planning 29
IPM would include the Bureau of the Budget's Occupational Model, and,therefore, all employment needs of industry could be translated into occupationaldemand impacts. Given information about labor supply, the Labor MarketModel would indicate occupations for which training would not be re-dundant. 30
29. Id. at 7.30. There are still other states, represented in column 2 of Figure 2 which use I-0 in conjunction with
other models or matrices. These states either use their systems in conjunction with the 1-0 or as analternative for comparison to it. The following briefly explains several of these expanded systems;
Arizona has developed an 1-0 table for the state, using secondary data, and employed itas part of economic submodel of the Arizona Trade-Off Model 3 (ATOM 3). See Anderson,supra note 17-Arizona, at 1. The 1-0 methodology was combined with other projection techniquesto project population and employment by county for the state.
The next step in this process was the design of the Arizona Economic-Demographic ProjectionModel (EDPM). See Id. Projections of population and employment generated by EDPM are usedin many aspects of state planning as well as input for various federally-sponsored programs.EDPM is also used to determine the impact of specific governmental projects.
In addition, Arizona has designed and now operates the Arizona Econometric Model (AEM),formerly the Arizona Revenue Forecasting Model. See Id. This is a regression model composedof approximately 80 equations and relationships. It is used to provide state-level projections ofGross State Product, employment, personal income and various state tax revenues. AEM is alsoused to analyze the impact of various events on tax revenue.
Florida has combined 1-0 with a very small occupational matrix to demonstrate the use of1-0 in forecasting employment. See Welsh, supra note 17-Florida, at 2. This process involvesstandard mathematical manipulation of the two matrices which may be set up in a variety ofways. Florida likewise has developed all of the various employment, output, final damand andincome multipliers which are normally part and parcel of 1-0 modelling. See Id. They havedemonstrated:
Self-sufficiency analysisImport substitution strategiesAgglomeration strategiesApplication to industrial incentive programsApplication to new industry analysisTourism income/employment applicationsEstimation of final demand (Gross State Product) from sales estimates.
The major application of input-output analysis in Idaho is resource allocation to maximize economicwell-being and to plan for needs deemed most socially significant. This necessitates combining themodel with a maximizing function constrained by internal needs. See Rafsnider and Kunin, supra note5, at 8. For state planning purposes, this application in large measure necessitates disaggregation ofthe model into another model composed of economic regions in the state with their correspondinglinkages. Once disaggregated, it is possible to plan development in each region to meet explicit policygoals. With similar intent, the Idaho legislature has sponsored development of an Idaho specific energydemand model (See Sahlberg, supra note 17-Idaho, at 1) and an Idaho specific model to project staterevenue. See Id., at 2.
The Idaho Department of Water Resources has recently completed, in cooperation with BoiseState University, an Interactive Population Employment (IPEF) econometric model for each of Idaho's44 counties. See Id. These models predict employment and population by county at five-year intervals.
Maryland has proposed an economic-environmental planning model to provide a consistentframework within which to evaluate the possible benefits and costs resulting from alternative developmentproposals. See Cumberland, supra note 17-Maryland. The research programs designed in this plan areoriented towards identifying opportunities to achieve desired rates of economic development with minimalenvironmental damage and finding opportunities to improve the overall quality of economic development.
South Carolina is planning to incorporate an input-output model with its econometric model.See Miley, supra note 17-South Carolina, at 1. The plan's goal is to link the input-output modeldesigned at Clemson University. with the present model to reduce the overall maintenance expensesconsiderably. This approach will enable South Carolina to obtain the aggregate forecasts from theeconometric model and at the same time analyze the interindustry impacts available from the input-outputmodel.

Economic Modelling
PROBLEMS REGARDING 1-0 USE
Despite the advantages, 1-0 has several obvious limitations. The majordrawbacks of 1-0 are as follows:
1) Since 1-0 looks at an economy as of a particular point in time, itgenerates constant coefficients. This reduces the possibilities for thesubstitution of input variables. The model fails to accurately reflectthe dynamic nature of a state's economy. 31
2) As an economy changes, matrices must be recalculated, which is avery time consuming job.32
3) The cost to construct and maintain an 1-0 can be economicallyprohibitive in these days of state fiscal austerity. 33
4) Since 1-0 is relatively new on the state level there has been very littlesubstantive data collected. 34 With an insufficient data base accuratecalculations are attenuated at best. 35 -
5) Since there is a lack of first hand data, planners must occasionallyrely on the federal coefficients for the industry in question. They assumethat the state economy mirrors the national economy. 36
6) Even if primary data is used, it is necessary to use only certain data.Planners include only those industries which they feel will have ameasurable effect on the model. Although deletion and aggregation isnecessary to make a model more manageable, a certain amount ofaccuracy is sacrificed. 37
7) The model represents an average pattern for each sector. Certainindustries may deviate substantially from the average pattern. 38
8) 1-0 is based on the assumption that relationships are linear. Thus,variations in one variable are matched by proportional variations inanother variable. Since this is not always the case in the real worldthe linear functions do not accurately reflect the changing economicpressures. 39
9) Since the model is static it fails to account for temporary imbalances(short run) created by the relocation of inputs. 40 For instance, thoughan increase in an interest rate may eventually lead to a reduction ininflation, in the short run it may decrease demand in the constructionindustry.
10) It is also important to note that the model, although appearing objective,is actually subject to the beliefs of. the planners. In actuality, the factorswhich go into the model are subjective determinations.
Despite these drawbacks, 1-0 is gaining more acceptance each year as aviable state planning tool. This is evidenced by the widespread use of 1-0 bymany states for different programs as discussed above. One of the major
31. Miernyk, supra note 5, at 105-6.32. Miernyk, supra note 5, at 33.33. Curtis, supra note 17-Alabama, at 11. To construct even an elementary 1-0 system as of 1974, initial
fiscal outlays can easily run close to $90,000. This figure includes personnel costs ($6,000), operatingexpenses - i.e., computer time ($4,550) and indirect costs - miscellaneous ($15,750).
34. Gale, supra note 7-Alaska.35. Emerson and Lamphear, supra note 4, at 350.36. Miernyk, supra note 5, at 66-8.37. Walter D. Fisher, Criteria for Aggregation in Input-Output Analysis, XL, Review of Economics and
Statistics 250 (1958).38. Washington State Input-Output Model, supra note 5, at 2.39. Id.40. Galladay and Haveman, supra note 11, at 638.
19791

Journal of Legislation
reasons for this is that 1-0 provides a formal analytical framework for economicanalysis. 41 In addition, it explicitly shows inter-industry relationships and portraysrelationships in a consistent manner.42 1-0 also provides a disaggregated viewof the economy; giving the flexibility needed for evaluating different alternativesin state government decision-making. 43 Finally, due to improved technol-ogy, model construction costs appear to be less of a problem than onceexpected. 44
CONCLUSION
Over the past decade, state governments have become increasingly moreaware that a major determinant of state fiscal security is organized economicgrowth which can only be accomplished through a mature planning mechanism.For orderly economic development to occur at any level, some means ofquantitatively assessing the impact of alternative developmental approachesmust be employed. One technique which has been successfully used to estimatethe total effects of given changes in economic activity is the input-outputmodel, a form of interindustry analysis.
1-0 is essentially a blueprint of the relationships among different parts ofan economy. It simulates an economy so that the impact of certain eventscan be roughly predicted. 1-0 has been used by numerous states for a widerange of problems. It has been most frequently used to forecast, simulate andplan. These uses, however, barely scratch the surface of I-0 potential. Giventhe proper funding and organization an 1-0 can quickly and efficiently solvedozens of tasks for a state.
A strong appeal of input-output models for planning purposes is theinterdependency captured by the model. A change in one area will eventuallylead to changes in other areas. Likewise, changes in other areas eventuallyaffect local industries. Input-output models facilitate impact evaluation andprojections that consider these interactions. Long-run economic trends becomeclearer so that the need for capital investment (such as changes in technologyor equipment) and diversification can be seen far enough in advance to preventmajor problems. In essence, this means that states can attain greater controlover cyclical fluctuations in their economies. Despite its inability to adapt tochanges in the economy, 1-0 has proven to be an effective tool of analysisfor evaluating different state economic planning devices. Thus, the versatilityand usefulness of 1-0 make it a boon to the statesman as well as the economist.
Walter J. Zukowski
B.A., Sangamon State University, 1976; J.D. Candidate, University ofNotre Dame Law School, 1980; M.B.A. Candidate University of Notre Dame, 1980.
41. Washington State Input-Output Model, supra note 5, at 2.42. Id.43. Id.44. This can be partially attributed to the cost-cutting measures such as state-university joint ventures.
The states constructing models in conjunction with .state universities are: Alabama, Arizona, Arkansas,Delaware, Florida, Idaho, Montana, Nevada, New Mexico, Oklahoma, South Carolina, Washington,Wisconsin, and Wyoming. Grant monies, federal and private, also reduce cost. The states which havereceived grants from the EDA or HUD are: Arkansas, Florida, Kansas, Maryland, Oklahoma, Delaware,West Virginia, and Washington. The Andrew W. Mellon Foundation has contributed to the developmentof a regional 1-0 for the New York Urban Region. The Kerr Foundation has contributed to theefforts in Oklahoma. Costs can also be minimized by a "modular" construction. Emerson, supra note17-Kansas. The advantage of such a system is the construction of the model in stages after the initial1-0 matrix is completed. A state may add other matrices such as employment, population and revenuesas desired.
[Vol. 6: 177