Embed Size (px)
Citation preview

James Philip Caldwell– Senior Industry Analyst
Economic Insights: COVID-19 and the NZ Economy
Agenda:
- Macroeconomic update- Most exposed industries- International trade- Government response

Macroeconomic Update
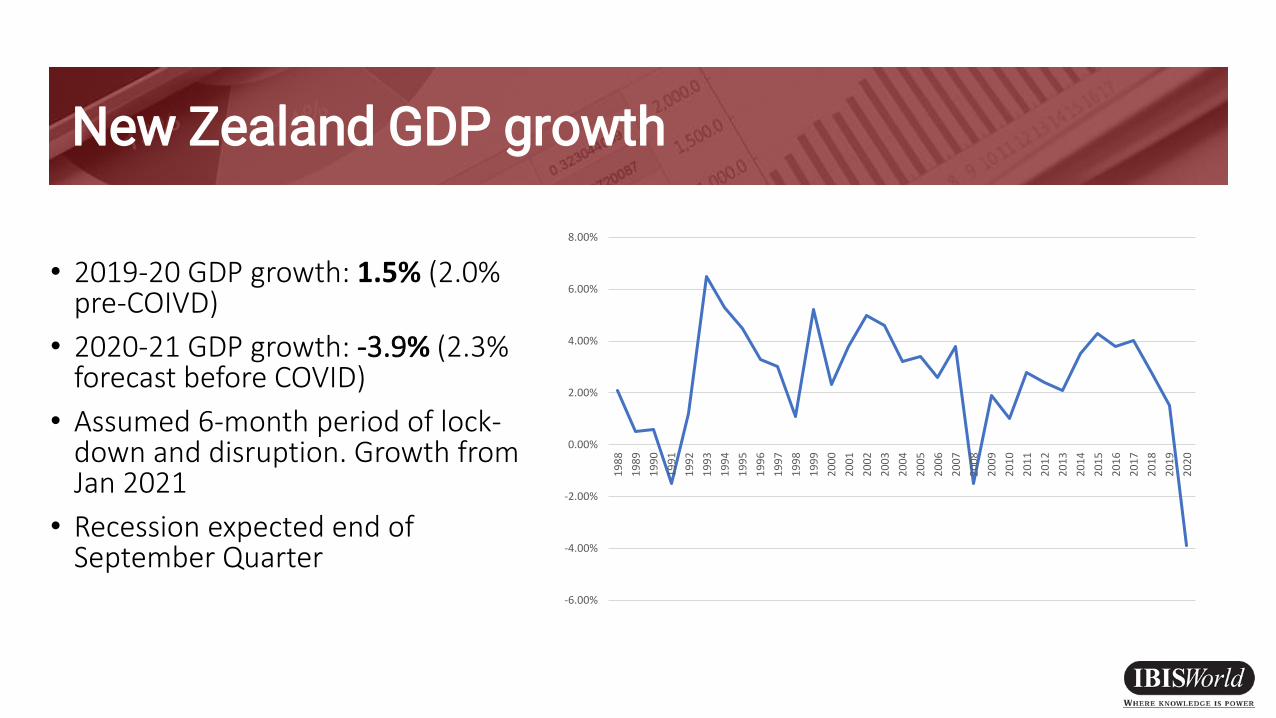
New Zealand GDP growth
• 2019-20 GDP growth: 1.5% (2.0% pre-COIVD)
• 2020-21 GDP growth: -3.9% (2.3% forecast before COVID)
• Assumed 6-month period of lock-down and disruption. Growth from Jan 2021
• Recession expected end of September Quarter
-6.00%
-4.00%
-2.00%
0.00%
2.00%
4.00%
6.00%
8.00%
19
88
19
89
19
90
19
91
19
92
19
93
19
94
19
95
19
96
19
97
19
98
19
99
20
00
20
01
20
02
20
03
20
04
20
05
20
06
20
07
20
08
20
09
20
10
20
11
20
12
20
13
20
14
20
15
20
16
20
17
20
18
20
19
20
20

Unemployment rate
• Rise from 4.1% in 2019-20 to 7.5% in 2020-21.
• Annual average of monthly results, which understates the peak
• Peak unemployment of 9.5% (in June Quarter)
• Partially contained by the Government’s Wage Subsidy
0.00%
1.00%
2.00%
3.00%
4.00%
5.00%
6.00%
7.00%
8.00%
2000 2001 2002 2003 2004 2005 2006 2007 2008 2009 2010 2011 2012 2013 2014 2015 2016 2017 2018 2019 2020 2021

Household discretionary income
• 2019-20: -0.2% decline
• 2020-21: -8.2% decline
• and insurance costs rising.
• Weak wage growth was already limiting consumer spending power.
-15.0%
-10.0%
-5.0%
0.0%
5.0%
10.0%
15.0%
20.0%
19
88
19
89
19
90
19
91
19
92
19
93
19
94
19
95
19
96
19
97
19
98
19
99
20
00
20
01
20
02
20
03
20
04
20
05
20
06
20
07
20
08
20
09
20
10
20
11
20
12
20
13
20
14
20
15
20
16
20
17
20
18
20
19
20
20
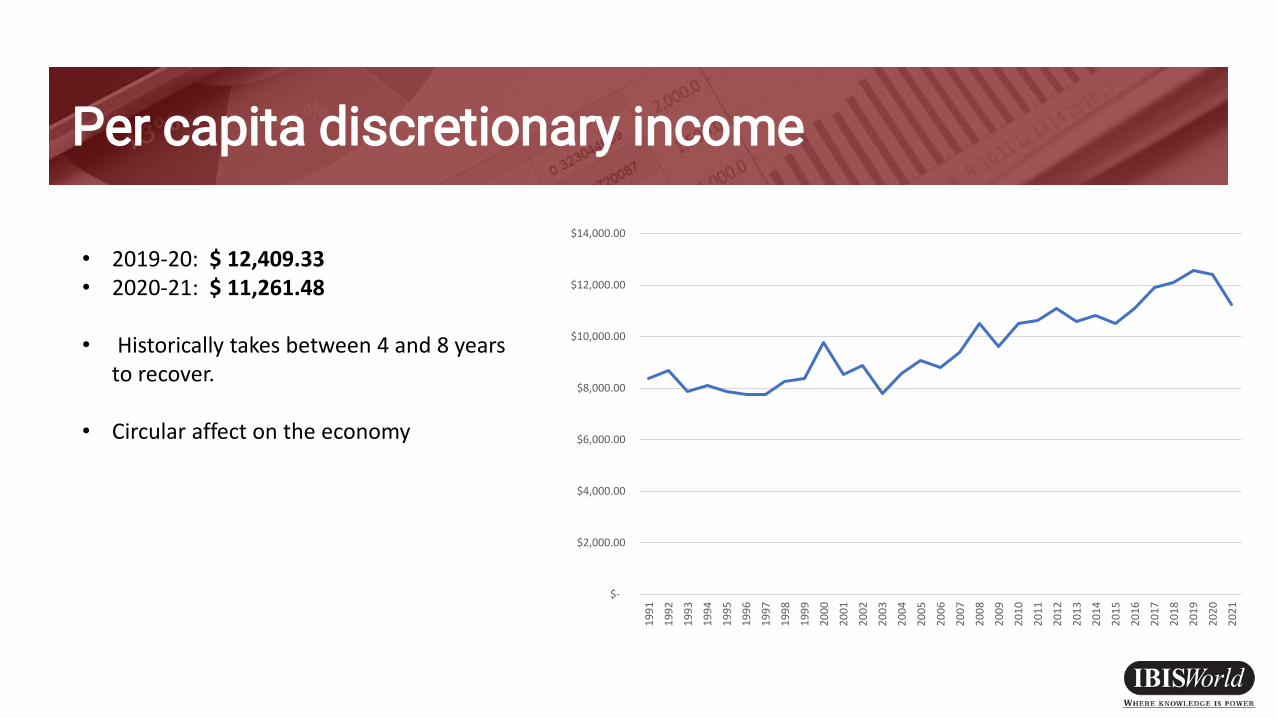
Per capita discretionary income
$-
$2,000.00
$4,000.00
$6,000.00
$8,000.00
$10,000.00
$12,000.00
$14,000.00
19
91
19
92
19
93
19
94
19
95
19
96
19
97
19
98
19
99
20
00
20
01
20
02
20
03
20
04
20
05
20
06
20
07
20
08
20
09
20
10
20
11
20
12
20
13
20
14
20
15
20
16
20
17
20
18
20
19
20
20
20
21
• 2019-20: $ 12,409.33 • 2020-21: $ 11,261.48
• Historically takes between 4 and 8 years to recover.
• Circular affect on the economy

Tourism & Hospitality

International travel to New Zealand
GFC
COVID-19
• Strongest fall since the GFC outbreak (-4%)
• Factors:
• Border Closures
• Deterioration of Global Economy
• Trans-Tasman Bubble
• International travel by New Zealanders is also expected to fall
• Both inbound and outbound tourism expected to rebound strongly in 2021-22
-30.00%
-25.00%
-20.00%
-15.00%
-10.00%
-5.00%
0.00%
5.00%
10.00%
15.00%
19
91
19
92
19
93
19
94
19
95
19
96
19
97
19
98
19
99
20
00
20
01
20
02
20
03
20
04
20
05
20
06
20
07
20
08
20
09
20
10
20
11
20
12
20
13
20
14
20
15
20
16
20
17
20
18
20
19
20
20
20
21

Weak demand
• Australia is the largest market in terms of tourism expenditure
• The travel ban has put pressure on tourism businesses across Australia
• High impact:• Airlines• Accommodation providers• Travel agencies
• IBISWorld expects that rev + profit will fall for all these three industries in 2020-21.
• Moderate impact:• Restaurants/food-service• Recreational and cultural sites• Local transport services
Australia55%
China, People's Republic of
16%
United States of America
13%
United Kingdom8%
Germany4%
Japan4%

Domestic Demand
-25%
-20%
-15%
-10%
-5%
0%
5%
10%
15%
20
01
20
02
20
03
20
04
20
05
20
06
20
07
20
08
20
09
20
10
20
11
20
12
20
13
20
14
20
15
20
16
20
17
20
18
20
19
20
20
20
21
20
22
20
23
20
24
20
25
20
26
20
27
• Domestic tourism worth approximately $23 billion in 2018-19.
• Expected to decline by 14.2% in the current year, recovering in 2023-24.
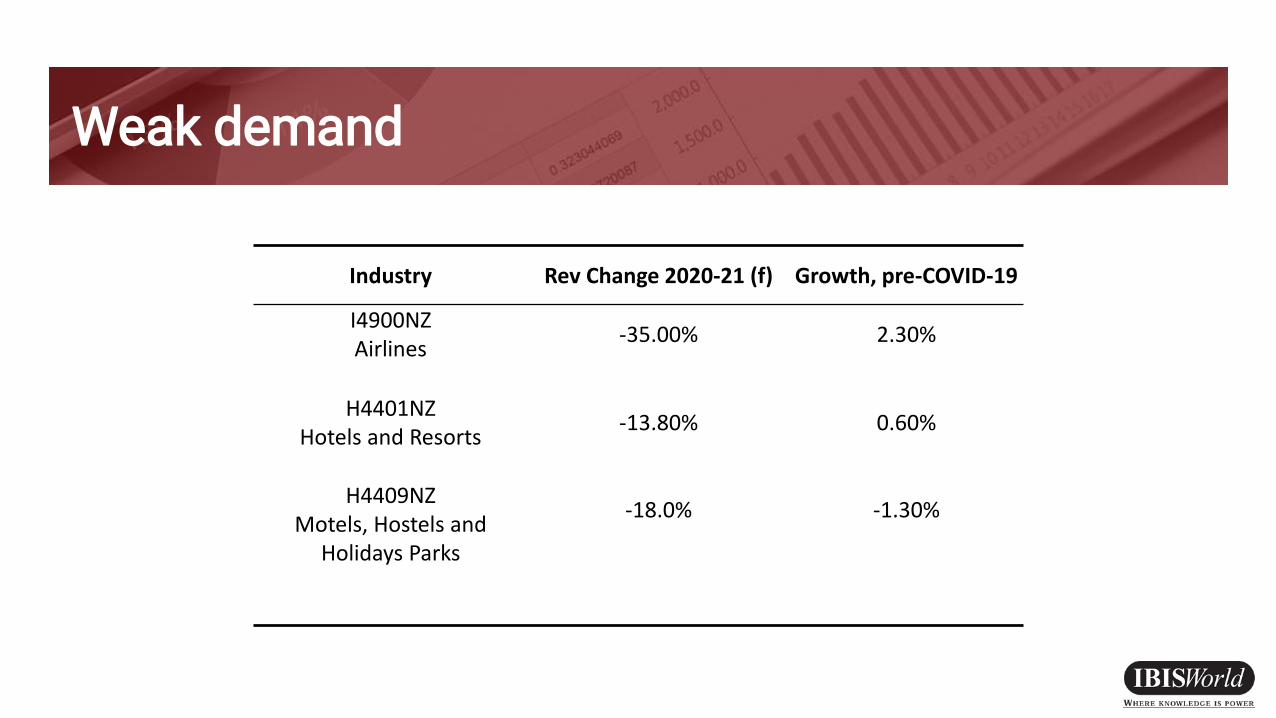
Weak demand
Industry Rev Change 2020-21 (f) Growth, pre-COVID-19
I4900NZAirlines
-35.00% 2.30%
H4401NZ Hotels and Resorts
-13.80% 0.60%
H4409NZMotels, Hostels and
Holidays Parks
-18.0% -1.30%
Hospitality
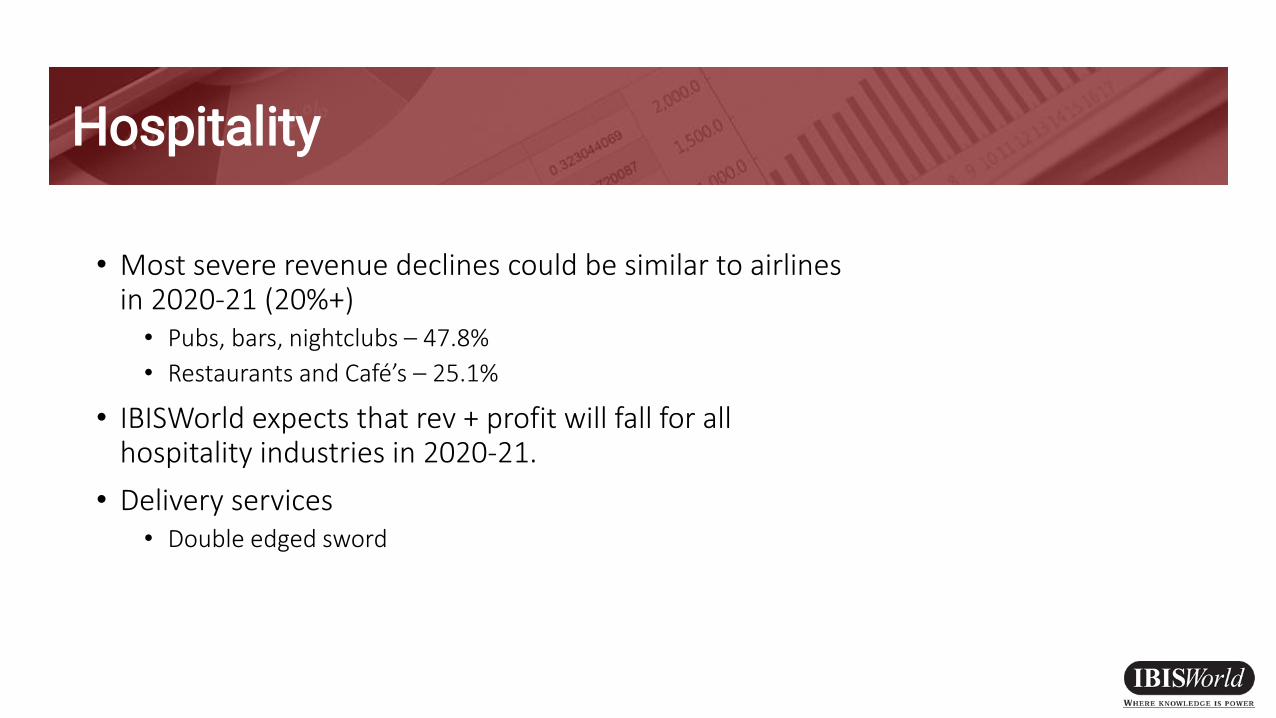
• Most severe revenue declines could be similar to airlines in 2020-21 (20%+)• Pubs, bars, nightclubs – 47.8%
• Restaurants and Café’s – 25.1%
• IBISWorld expects that rev + profit will fall for all hospitality industries in 2020-21.
• Delivery services• Double edged sword
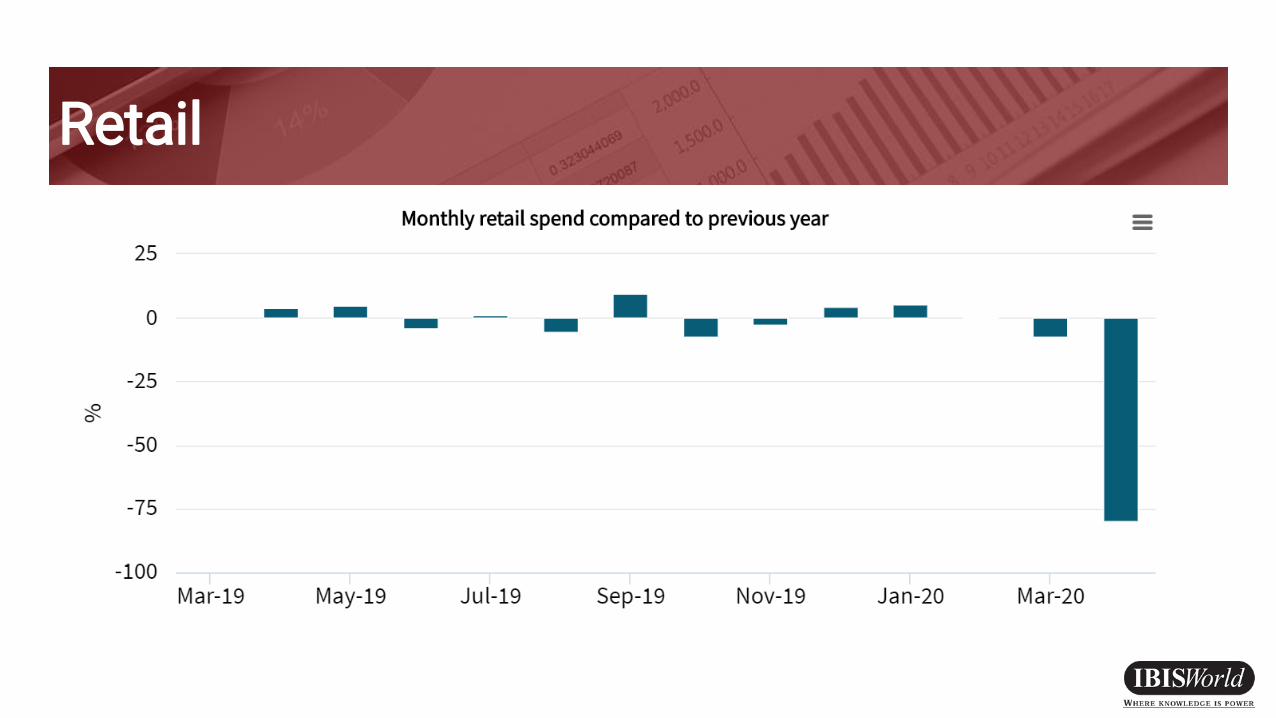
Retail

Supermarkets
• Supermarket store traffic surged during the rush to stockpile (mid-march)• Drove growth in industry
revenue in 2019-20 FY
• Forecast decline of 2.3% in current year

Postal Services
• Growth in online shopping is expected to lead to a surge in parcel’s requiring delivery.
• Forecast growth of 2.4%, revised upwards from -0.3%

International Trade

Exports: Country of Destination
• Highly exposed to China
• Australia has had some success in ‘flattening the curve.’• Tourism expected to limit decline in exports.
• United States and European Union• Struggling to contain the outbreak
• Overall: Highly exposed with a sustained downturn predicted.
Country of final destination2019 (NZ$ Millions) Share
TOTAL 77,961
China, Peoples Republic of 15,329 19.7%
Australia 13,852 17,8%
European Union (including United Kingdom) 8,835 11.3%
United States of America 8,517 10.0%
Japan 4,167 5.3%
Korea, Republic of 2,122 2.7%
India 1,862 2.4%
Singapore 1,615 2.1%
Hong Kong, SAR 1,584 2.0%
Other 20,080 25.8%

Government response

Wage Subsidy Scheme
• Initial cost of $12 billion
• Payment rates• $585.80 (gross) per week for full-time employees,
where full-time is 20 hours or more per week.
• $350.00 (gross) per week for part-time employees, where part-time is less than 20 hours per week.
• Estimated to save 140,00 jobs – limiting the decline in unemployment.

Cash rate
• Currently: 0.25%
• Quantitative Easing
• Factors:• Soft economic growth
• Below-target inflation (potential deflation from 2021)
• Rising unemployment
• Weak wage growth
• Negative consumer sentiment
• COVID-19 0.00%
1.00%
2.00%
3.00%
4.00%
5.00%
6.00%
7.00%
8.00%
9.00%
2000 2001 2002 2003 2004 2005 2006 2007 2008 2009 2010 2011 2012 2013 2014 2015 2016 2017 2018 2019 2020 2021

Thank you!


![Mer for optimum allocation accross investment alternatives [autosaved]-gfc-office-gfc-office-gfc-office-gfc-office](https://img.pdfslide.us/doc/110x75/58e91bcf1a28ab6e0e8b5dbd/mer-for-optimum-allocation-accross-investment-alternatives-autosaved-gfc-office-gfc-office-gfc-office-gfc-office.jpg)