Embed Size (px)
Citation preview

Roland Berger Institute
May 2017
Economic Indicators

2 Roland Berger Economic Indicators May 2017 External version.pptx
Overview
Economic Indicators A publication, compiled by the Roland Berger Institute, that provides you with the most important macroeconomic facts and figures. The presentation is updated regularly.
Sources We screen the insights of the most important economic research institutes, think tanks and corporate research units around the world. These include IMF, OECD, WTO, Consensus as well as databases such as Bloomberg and Oxford Economics.
Real economic indicators > Economic indicators promise a brightening outlook, but there
is a multitude of risks
> With GDP growth of 3.5% in 2017 and 3.6% in 2018 global growth is back on track, however below pre-crisis levels
> Due to the uptick of commodity prices an increase in inflation rates is expected for 2017
Financial indicators > Equities all around the world reach new heights
> Fed rate expected to rise to 1.75% by end-2018, while ECB's expected to stay at zero – Euro slightly gaining on the Dollar
> Bond yields still on very low levels – CDS indices with downward trend indicating a decline of implied risk
Other indicators > Sentiment in the world economy and major regions
is recovering
> Especially in China, the economic climate improved
> Consumer sentiment in in the US approaches new heights
1
2
3
Key points

3 Roland Berger Economic Indicators May 2017 External version.pptx
Economic indicators promise a brightening outlook, but there is a multitude of risks potentially destabilizing the global path of growth
Development of the world economy
Potential risk factors for the world economy
> Inward shift in policies towards protectionism
> A faster-than-expected pace of interest rate hikes in the US, possibly triggering a more rapid tightening in global financial conditions
> An aggressive rollback of financial regulation
> Financial tightening in emerging market economies
> Adverse feedback loops among weak demand, low inflation, weak balance sheets, and anemic productivity growth
> Noneconomic factors such as geopolitical factors, political discord or risks from weak governance and corruption
> Average global economic growth is expected to increase to 3.5% in 2017, but longer-term potential growth rates remain subdued in advanced economies
> Prospects are brightening for many countries, but growth for a sizeable number of commodity exporters remains modest
> According to the IMF, the global economy seems to "be gaining momentum" and could be at a turning point. However, IMF advises policymakers to invest in their economies, particularly in people, to build up greater resilience to structural changes, including the changing modalities of globalization
> Among the reforms suggested by the IMF are: "active labor market policies, greater tax progressivity where helpful, more effective investment in education and changes to housing and credit markets that facilitate worker mobility". In addition, growing inequalities within countries should be addressed "to ensure the stability of an open, collaborative trading system"
Source: IMF

4 Roland Berger Economic Indicators May 2017 External version.pptx
Global growth is back on track, however below pre-crisis levels
2008 2010 2012 2014 2016 2018
3.6 3.5
3.1 3.4
5.4
3.5 3.5
4.2
-0.1
3.4
3.0
2017
World
2015
3.4
2016
Advanced economies2) 2.1
US 2.6 1.6
Eurozone 1.7 2.0 1.7 (0.2)
Germany 1.6 1.5 1.8 (0.2)
France 1.4 1.3 1.2 (0.1)
Japan 1.2 1.2 1.0
Emerging/dev. economies
China 6.6 6.9 6.7 (0.4)
Russia 1.4 -2.8 -0.2 (0.3)
Spain 2.6 3.2 3.2 (0.4)
(change in forecast)1)
Italy 0.8 0.8 0.9 (-0.1)
4.2
2018
2.5 (0.4)
1.6 (0.0)
1.5 (0.1)
1.7 (0.0)
6.2 (0.2)
1.4 (0.2)
2.1 (0.2)
0.8 (-0.3)
3.1
1.7
4.1
(change in forecast)1)
2.3 (0.1)
2. Financial indicators 3. Other indicators 1. Real economic indicators
2.0 (0.2)
3.5
2.0 (0.2)
(0.1) 3.6 (0.0)
(0.6) 0.6 (0.1)
4.5 (-0.1) 4.8 (0.0)
World
1) Change related to previous forecast (October 2016) indicates stability of the forecast; All 2017 and 2018 figures on the following slides are forecasts 2) Advanced economies is the term used by IMF to describe developed countries
Real GDP growth [%]
Source: IMF

5 Roland Berger Economic Indicators May 2017 External version.pptx
Brazil, Russia and Nigeria coming out of recession in 2017 – India's GDP growth increases, while China's declines but still above 6%
2016
Brazil
Russia
India
China
2017 2016 2018 2017 2016 2018
Bangladesh
Egypt
Iran
Mexico
Nigeria
Pakistan
6.9
4.3
6.5
2.3
4.7
South Korea
Turkey
2.8
2.9
7.0
4.5
4.3
2.0
5.2
2.8
3.3
6.9
3.5
3.3
1.7
Indonesia
Malaysia
Philippines
Thailand
Vietnam
5.0
4.2
6.8
3.2
6.2
5.3
4.7
6.9
3.3
6.3
5.1
4.5
6.8
3.0
6.5 Weighted avg.3)
Weighted avg.3)
Weighted avg.3)
2017 2016 2018
Weighted avg.3)
Real GDP growth [%]
1.9
BRIC NEXT-112) ASEAN-5
MIST1)
5.0
2.7
2.5
2018
1) The MIST states include Mexico, Indonesia, South Korea and Turkey 2) Except for the Asean-5 countries Indonesia, Philippines and Vietnam. However the weighted average includes all countries of the aggregate Next 11, not only the ones listed 3) Average weighted via GDP in PPP current international dollar
2017
5.7 5.7 5.1
3.6 3.2 3.4
5.2 5.0 4.9
3.9 4.1 3.6
Source: IMF
2. Financial indicators 3. Other indicators 1. Real economic indicators
1.7 0.2
1.4
-3.6
1.4 -0.2
0.8 -1.5
6.8 7.7 7.2
6.7 6.2 6.6

6 Roland Berger Economic Indicators May 2017 External version.pptx
The risk of recession has declined in most regions worldwide in comparison to the October 2016 forecast – Japan is an exception
2. Financial indicators 3. Other indicators 1. Real economic indicators
> Probability of a recession over a four-quarter horizon till Q1 2018 declined in most regions compared to the October 2016 report
> Japan shows the highest recession risk with 44% up until the first quarter of 2018. Within the Eurozone, the risk is estimated at 30% while the United States face only 22%
> Growth outlook in advanced economies is lifted due to a stronger cyclical momentum and the anticipated US fiscal stimulus, external demand and commodity prices boosting growth perspectives in emerging Asia
Comments
22
30
44
2933
10
5
10
15
20
25
30
35
40
45
Emerging Asia
Latin America
Rest of the World
Japan Eurozone United States
October 2016 WEO: Probability of recession within the period 2016 Q4 – 2017 Q3
Probability of recession within the period 2017 Q2 – 2018 Q1 [% ]
Source: IMF

7 Roland Berger Economic Indicators May 2017 External version.pptx
Global investment levels remain constant – Relative to GDP China invests 2.5 times more than the US and the Eurozone
2. Financial indicators 3. Other indicators 1. Real economic indicators
2008 2010 2012 2014 2016 2018
25.2 25.6 25.2 24.3
23.0
25.1 25.6
US
Eurozone
Germany
Italy
Japan
China
Russia
20.6 19.7
20.2 19.9
19.2 19.1
17.6
23.7 23.4
22.9 25.6
Advanced economies 21.4
20.0
20.0
19.1
17.3
23.5
22.2
World 25.6
Spain 20.6 20.5
(0.2)
(-0.1)
(-0.3)
(1.9)
(0.1)
(0.7)
(-0.1)
(-0.4)
(0.5)
(2.0)
(0.4)
(-0.7)
France 21.9 22.2 (-0.2)
Emerging/dev. economies
20.3
19.9
19.2
23.9
25.8
32.0 32.2 32.0 (0.1) (0.0)
22.1
32.9
22.8 (0.0) 22.4
17.0
20.4
(0.6)
(-0.7)
17.3
20.1
21.1 21.1 (0.3) (0.5)
25.2 (0.2) 25.4 (0.3)
World
2017 2015 2016 (change in forecast)1)
2018 (change in forecast)1)
20.8
43.4 44.1 44.0 (0.9) (0.8) 44.7
Total investment [% of GDP]
Source: IMF
1) Change related to previous forecast (October 2016) indicates stability of the forecast
8 Roland Berger Economic Indicators May 2017 External version.pptx
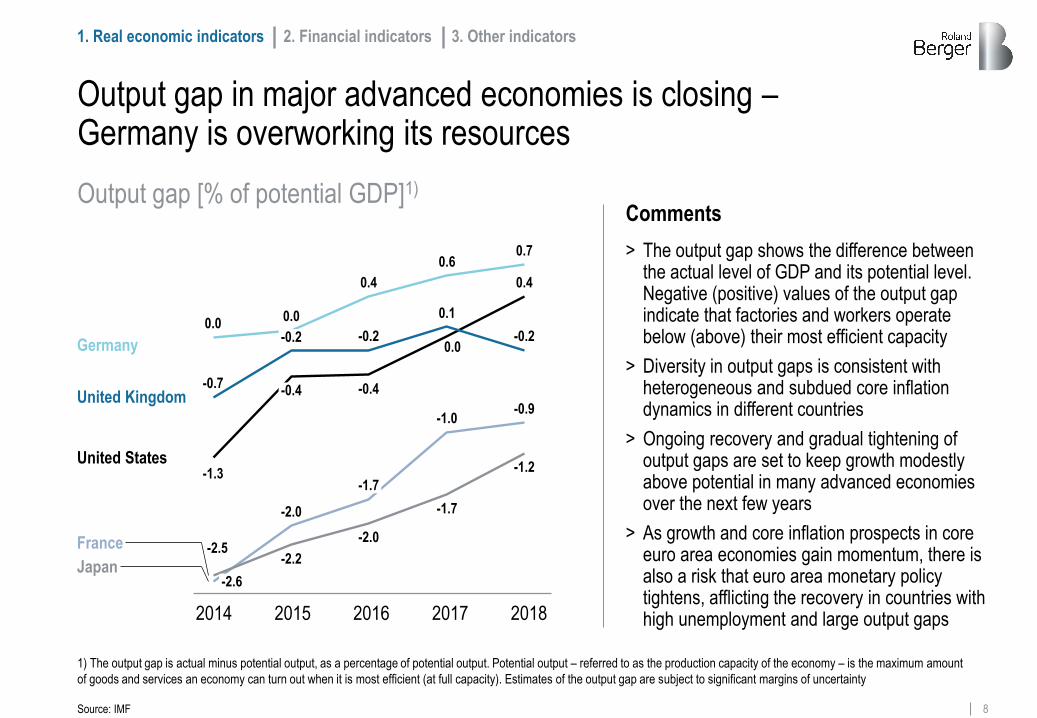
Output gap in major advanced economies is closing – Germany is overworking its resources
-0.2
United Kingdom
France
Japan
Germany
United States
-1.0
0.1
0.4
-1.2
-1.7
0.7
-2.0
-0.9
-0.2 0.0
-1.3
0.0
-2.6
-2.5
-0.7 -0.4
0.0
-2.0
-2.2
-0.2
-0.4
0.4
-1.7
0.6
2. Financial indicators 3. Other indicators 1. Real economic indicators
Source: IMF
1) The output gap is actual minus potential output, as a percentage of potential output. Potential output – referred to as the production capacity of the economy – is the maximum amount
of goods and services an economy can turn out when it is most efficient (at full capacity). Estimates of the output gap are subject to significant margins of uncertainty
Output gap [% of potential GDP]1)
> The output gap shows the difference between the actual level of GDP and its potential level. Negative (positive) values of the output gap indicate that factories and workers operate below (above) their most efficient capacity
> Diversity in output gaps is consistent with heterogeneous and subdued core inflation dynamics in different countries
> Ongoing recovery and gradual tightening of output gaps are set to keep growth modestly above potential in many advanced economies over the next few years
> As growth and core inflation prospects in core euro area economies gain momentum, there is also a risk that euro area monetary policy tightens, afflicting the recovery in countries with high unemployment and large output gaps
Comments
2014 2015 2016 2017 2018

9 Roland Berger Economic Indicators May 2017 External version.pptx
53.9
66.8
53.0
112.4
97.8
122.9 125.9
87.4
45.6
57.4
75.2
Oil price doubled since its low in January 2016, but declined in the first months of 2017 – Forward curve remains flat
Oil price (Brent) [USD/barrel]1) Forward curve and forecast2)
52.1
39.0
76.0
52.2
37.0
80.0
52.4
35.0
75.0
52.5
39.0
70.0
52.3
43.0
66.0
52.2
47.0
66.0
Jan 2006 May 2017 Jan 2008 Jan 2010 Jan 2012
Highest value Jul 2008
147.5 +26.8
Lowest value Jan 2016
-120.4
Jan 2014 Q2 17 Q3 17 Q4 17 Q1 18 Q2 18 Q3 18
1) All values (except highest, lowest and latest) are end-of-month based; highest and lowest values are the max-/minimum on a daily basis, latest value is end-of-day value of May 22nd 2017 2) The blue dashed lines indicate a forecast range of highest and lowest values; the black dashed line is the forward curve
Source: Bloomberg
61.8
2. Financial indicators 3. Other indicators 1. Real economic indicators
27.1
+85.7

10 Roland Berger Economic Indicators May 2017 External version.pptx
1,260.6
1,152.3
1,351.0
724.6
974.2
1,293.0
1,061.4
1,327.3
1,234.6
1,179.6
10
Gold price is volatile around 1,200 USD since mid-2013 – Commodity prices on an upward trend, but still relatively low
Highest value Sep 2011
Lowest value Jan 2006
-660.5 1,921.2
516.9
+121.9
+1,404.3
Highest value Jul 2008
-618.5
Jan 2008 Jan 2006 Jan 2010 May 2017 Jan 2012 Jan 2008 Jan 2006 May 2017
Gold price [USD per ounce]1) S&P GSCI [Index value]1) 2)
Source: Bloomberg
Jan 2014 Jan 2014
271.8
Jan 2010
Lowest value Jan 2016
Jan 2012
890.3
393.7
445.6
703.5
591.0
658.6
758.8
549.9
336.2
599.3
453.9
1) All values (except highest, lowest and latest) are end-of-month based, highest and lowest values are on a daily end-of-day basis, latest value is end-of-day value of May 22nd 2017 2) S&P GSCI (formerly Goldman Sachs Commodity Index): serves as a benchmark for investment in the commodity markets and as a measure of commodity performance over time
2. Financial indicators 3. Other indicators 1. Real economic indicators
+436.4

11 Roland Berger Economic Indicators May 2017 External version.pptx
52.8 50.5
53.2
48.6
51.3 52.9
49.1
193.5
181.8
165.6
143.0
148.9 146.6
139.3
180.7
Highest value Jul 2006
In the US, housing market continues its upward trend towards its 2006 high – Global manufacturing index also on a positive trend
-72.4
Lowest value Dec 2008
Highest value April 2010 and Feb 2011
-4.6
34.3
54.6
+23.1
+59.4
Jan 2008 Jan 2006 Jan 2010 Feb 2017 Jan 2012 Jan 2008 Jan 2006 Jan 2010 April 2017 Jan 2012
206.5
Case Shiller Index [Index]1) 3) JPM Global Manufacturing PMI [Index]2) 3)
Jan 2014 Jan 2014
202.0
57.4
1) Measure for the US residential housing market 2) JP Morgan's Purchasing Managers' Index is based on surveys covering purchasing executives in 40 countries accounting for an estimated 95% of global manufacturing output; 50 = neutral mark (no change on prior month) values above 50 indicate rising and below falling values 3) All values are end-of-month based
2. Financial indicators 3. Other indicators 1. Real economic indicators
Lowest value March 2012
134.1
Source: Bloomberg
+4.5
-20.3

12 Roland Berger Economic Indicators May 2017 External version.pptx
With the uptick of commodity prices, an increase in inflation rates is expected for 2017, particularly in advanced economies
2008 2010 2012 2014 2016 2018
3.4 3.5
2.8 2.8
3.2
3.7
4.1
5.0
3.7
2.7
6.3
US
Eurozone
Germany
Italy
Japan
China
Russia
0.1 2.7
0.0 1.7
0.1 2.0
0.1
0.8 1.0
1.4 2.4
15.5 4.5
Advanced economies 0.3
2.4
1.5
1.7
1.3
0.6
2.3
4.2
World 2.8
Spain -0.5 1.4
(0.3)
(0.6)
(0.5)
(0.5)
(0.1)
(-0.6)
(-0.3)
(0.2)
(0.0)
(0.5)
(0.0)
(-0.1)
(-0.3)
(0.4)
France 0.1 1.2 (0.1)
Emerging/dev. economies
1.3
0.2
0.4
-0.1
2.8
4.7 4.7 4.4 (0.2) (0.2)
2.0
7.0
4.4
1.4 (0.4) 0.3
1.3
2.4
(0.8)
(1.4)
-0.1
-0.2
0.8 2.0 1.9 (0.3) (-0.1)
3.5 (0.3) 3.4 (0.1)
2. Financial indicators 3. Other indicators 1. Real economic indicators
World
2017 2015 2016 (change in forecast)1)
2018 (change in forecast)1)
Inflation rate [%]
Source: IMF
1) Annual change in average consumer prices (headline inflation) 2) Change from previous forecast (October 2016) indicates instability of the forecast

13 Roland Berger Economic Indicators May 2017 External version.pptx
2008 2010 2012 2014 2016 2018
4.6
9.1
4.7
9.4
4.9
10.0
5.3
10.9
6.2
11.6
7.4
12.0
8.1
11.4
8.9
10.2
9.6
10.2
9.3
9.7
5.8
7.6
US
Eurozone
Unemployment rates are further decreasing, but still high in Spain, Italy and France and above pre-crisis level in Eurozone
US
Eurozone
Germany
France
Japan
5.3
10.9
4.6
10.4
3.1 3.4 3.1
Advanced economies 6.2 6.7
3.1
Spain 22.1
China
Russia
4.0 4.1 4.0
5.5 5.6 5.5
4.0
5.5
(-0.1)
(0.0)
(-0.4)
(-0.1)
(0.0)
(0.0)
Italy 11.9
4.7 4.6 (-0.1) (-0.1) 4.9
10.0
4.2 4.2 4.2 (-0.3) (-0.4)
10.0
11.7
19.6
9.6 9.3 (0.0) (0.0)
11.4 11.0 (0.2) (0.2)
17.7 16.6 (-0.3) (-0.3)
Source: IMF
1) Change from previous forecast (October 2016) indicates instability of the forecast
2. Financial indicators 3. Other indicators 1. Real economic indicators
2017 2015 2016 (change in forecast)1)
2018 (change in forecast)1)
9.4 9.1 (-0.2) (-0.2)
6.0 5.8 (-0.1) (-0.2)
Unemployment rate [%]

14 Roland Berger Economic Indicators May 2017 External version.pptx
1,871
3,076
4,612
3,235
2,048
3,412
12,811
13,930
10,913
16,285
18,308
20,895
+14,699
US and German equities reach new heights …
Jan 2006 May 2017
Highest value March 2017
Highest value May 2017
Highest value Oct 2007
+9,253
-3,048
May 2017
10,865
Dow Jones [Index value]1) DAX [Index value]1) Shanghai Composite [Index value]1)
-274
6,124 12,842
Lowest value Mar 2009 6,470
Lowest value Jan 2006
-4,395 -2,085
+4,962
Jan 2006
1,162
Jan 2006 May 2017
Lowest value Mar 2009
-223
5,674
12,619
9,495
5,502
7,376
8,067
3,589
1) All values (except highest, lowest and latest) are end-of-month based; highest and lowest values are the max-/minimum on a daily basis, latest value is end-of-day value of May 22nd 2017
Source: Bloomberg
2. Financial indicators 3. Other indicators 1. Real economic indicators
21,169

15 Roland Berger Economic Indicators May 2017 External version.pptx
19,678
15,576
16,291
8,928
11,090
18,262
16,650
3,577
2,865
3,697
2,119
3,013
Highest value Jun 2007
… a positive trend all around the globe
+1,812
+13,958 +2,857
Jan 2006 May 2017 Jan 2006 May 2017
-2,807
Jan 2006
6,168 Highest value Jun 2007
3,692
Highest value June 2015
4,948
-3,703
May 2017
4,573
EURO STOXX [Index value]1) Nikkei [Index value]1) CAC 40 [Index value]1)
Lowest value Mar 2009 1,765
Lowest value Oct 2008
20,953
-1,274
-9,655
+881 5,323
4,110
3,017
5,083
4,237
Lowest value Mar 2009
2,465
2. Financial indicators 3. Other indicators 1. Real economic indicators
+1,220
Source: Bloomberg
1) All values (except highest, lowest and latest) are end-of-month based; highest and lowest values are the max-/minimum on a daily basis, latest value is end-of-day value of May 22nd 2017
6,995

16 Roland Berger Economic Indicators May 2017 External version.pptx
1.12 1.15
1.25
1.39
1.23
1.45
1.50
1.18
0.00
0.50 0.25
1.50
1.00
0.25
2.00
4.25
5.25
4.50
2.25
Fed interest rate expected to rise to 1.75% by end of 2018, while ECB's expected to stay at zero – Euro slightly gaining on the Dollar
Source: Bloomberg, Commerzbank
Highest value Apr 2008
Lowest value Jan 2017 1.03
1.60
Jan 2006 May 2017 Jan 2006 May 2017
Fed
1.75
0.00
Q1 2018
1.12
0.90
1.19
1.11
0.99
1.15
ECB
Q2 2018
Interest rates [%]1) EUR/USD exchange rate [EUR/USD]1) Forecast2) Forecast3)
1.23
1) All values (except highest, lowest and latest) are end-of-month based; highest and lowest values are the max-/minimum on a daily basis, latest value is end-of-day value of May 22nd 2017 2) The forecast shows the medium line "consensus" 3) The blue dashed lines indicate a forecast range of highest and lowest values; the black dashed line is the forward curve
1.00
2. Financial indicators 3. Other indicators 1. Real economic indicators
1.25 1.50

17 Roland Berger Economic Indicators May 2017 External version.pptx
-5
0
5
10
15
20
25
30
35
Bond yields still on very low levels – CDS indices with downward trend indicating a decline of implied risk
May 2017 Jan 2008
0
50
100
150
200
First 36 month LTRO2) announcement 21 Dec 2011
Eurozone 70
US 72
Asia 87
Jan 2010 Jan 2012 Jan 2014
Yields of 10y government bonds [%]1) Credit default swaps [Index 01/11=100]1)
Source: Bloomberg
May 2017 Jan 2011 Jan 2013 Jan 2015
1) All values (except latest) are end-of-month based; latest value is for May 22nd 2017 2) LTRO: Long Term Refinancing Operations. ECB lends money to Eurozone banks at a very low interest rate
2. Financial indicators 3. Other indicators 1. Real economic indicators
LATEST VALUES LATEST VALUES
Greece 5.7
Italy 2.1
France 0.8
Germany 0.4
Spain 1.6
Portugal 3.2
China 3.7

18 Roland Berger Economic Indicators May 2017 External version.pptx
2016 2015 2017 2018
Fiscal balance [% of GDP]1)
-3.9
-2.7
-4.8
-2.9
-1.6
-3.6
-0.9
-6.2
-3.7
-8.6
1.3
-1.4 -1.0
-3.3
Austerity efforts in EU and Eurozone continue, while in developing countries lowering fiscal debt is expected for 2017 and 2018
0.6
-1.5
-0.9
-2.4
-4.0
-1.9
-3.3
-2.8
-4.0
-3.2
-9.1
-3.7
-6.4
-2.9
-2.6
0.7
-3.4
-2.7
-3.5
-4.4
-5.1
-4.4
-3.5
-3.5
-10.3
-2.8
-7.1
-4.0
-3.4
0.8
0.0
-1.9
-2.4
-4.2
-2.3
-4.6
-3.1
-4.4
-3.3
-9.0
-3.7
-6.6
-2.9
-3.7
-2.8
0.6
-1.0
-0.5
-1.4
-3.3
-2.2
-2.7
-2.1
-4.5
-7.5
-3.4
-6.3
-2.5
-1.9
-0.3
Advanced economies2)
Emerging & developing economies2)
1) Fiscal balance is represented by the IMF indicator "general government net lending/borrowing" 2) Average of all advanced and emerging & developing countries in line with the following chart (general government gross debt)
Source: IMF
2. Financial indicators 3. Other indicators 1. Real economic indicators
2004 2006 2008 2010 2012 2014 2016 2018
Selected advanced economies
Selected emerging economies
EU-28
Eurozone
Germany
Greece
Ireland
Italy
Japan
Portugal
Spain
United Kingdom
United States
France
Brazil
China
India
Mexico
Russia
-1.8
-1.5 -2.1
-2.3
-1.7
-1.7
-1.2
-1.3

19 Roland Berger Economic Indicators May 2017 External version.pptx
2016 2015 2017 2018
General government gross debt [% of GDP]1)
5047
403738
3437
47
79
106107105107
98
7477
2004 2006 2008 2010 2012 2014 2016 2018
Government debt in advanced economies set to stay at a high level with total annual GDP not sufficient to pay off
Emerging & developing economies
Advanced economies
180.7
132.8
239.2
90.1
84.7
64.7
74.8
128.6
98.5
89.0
108.3
97.4
92.6
86.7
71.2
179.4
78.7
132.0
238.0
129.0
99.8
89.0
105.6
96.2
91.3
85.8
67.6
181.3
76.4
132.6
239.2
130.3
99.3
89.2
107.4
96.6
81.2
49.3
67.8
57.2
17.1
72.5
42.6
69.6
53.7
15.9
78.3
46.2
69.5
58.1
17.0
97.4
62.0
181.5
73.4
131.6
239.4
127.1
97.9
88.7
108.9
88.6
83.4
82.7
52.0
66.1
56.8
17.3
1) Gross debt consists of all liabilities that require payments of interest and/or principal by the debtor to the creditor in the future. No financial assets of a state, such as gold, currency reserves, loans and other accounts receivables are deducted
2. Financial indicators 3. Other indicators 1. Real economic indicators
EU-28
Eurozone
Germany
Greece
Ireland
Italy
Japan
Portugal
Spain
United Kingdom
United States
France
Brazil
China
India
Mexico
Russia
Advanced economies
Emerging economies
Source: IMF

20 Roland Berger Economic Indicators May 2017 External version.pptx
-10
-9
-8
-7
-6
-5
-4
-3
-2
-1
0
1
2
3
0 10 20 30 40 50 60 70 80 90 100 110 120 130 140 150 160 170 180 190 200 210 220 230 240
Russia Mexico
India
China
Brazil
Eurozone
EU-28
United States
UK
Spain
Portugal
Japan
Italy
Ireland
Greece
Germany
France
Germany is the only big EU country coming within reach of the original Maastricht criteria of 60% government debt
Fiscal balance
General government gross debt
Former Maastricht criteria: max. 60%
Former Maastricht criteria: max. 3%
2. Financial indicators 3. Other indicators 1. Real economic indicators
Public finances 2017 – Fiscal balance and general government gross debt [% of GDP]
Source: IMF

21 Roland Berger Economic Indicators May 2017 External version.pptx
14.9 26.8
-14.7
17.2 13.0
-7.5
Sentiment in the world economy and major regions is recovering …
Q1 2006 Q2 2017 Q1 2006 Q2 2017 Q1 2006 Q2 2017
World economic climate [Balances]1) Economic climate – EU [Balances]1) Economic climate – Asia [Balances]1)
1) Arithmetic mean of judgment about the present and the expected economic situation. As of the first quarter 2017 the Ifo Institute uses "balances" to illustrate the economic climate instead of indices. The balances range between − 100 and + 100 points.
Highest value Q3 2007 30.2
+3.4
Lowest value Q1 2009 -52.7
-82.9
24.8
-28.9
-0.4
-28.9
17.0 10.1
27.8
Highest value Q3 2007 32.4
+15.4
Lowest value Q1 2009 -61.2
-93.6
14.8
22.5
-8.8
17.6
-7.2
33.4 32.2
Highest value Q2 2010 33.4
Lowest value Q1 2009 -47.4
-79.6
2. Financial indicators 3. Other indicators 1. Real economic indicators
+80.8
Source: Ifo Institute
+65.7 -18.6 +86.0
0 0 0
22 Roland Berger Economic Indicators May 2017 External version.pptx
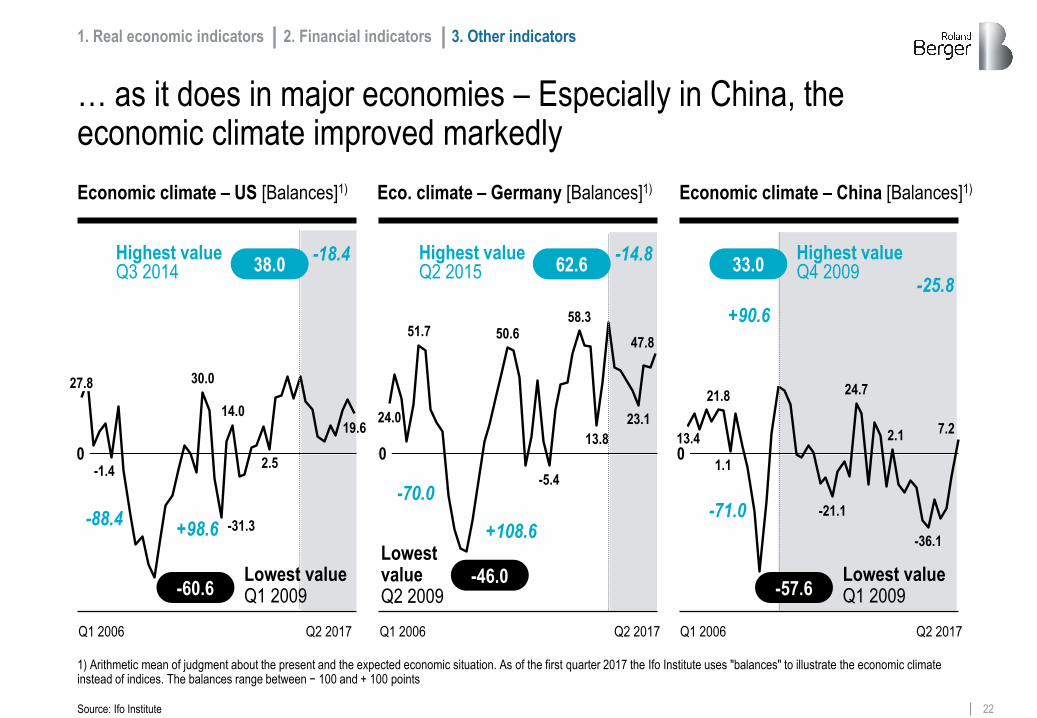
27.8
2.5
30.0
-1.4
-31.3
14.0 19.6
… as it does in major economies – Especially in China, the economic climate improved markedly
Q1 2006 Q2 2017 Q1 2006 Q2 2017 Q1 2006 Q2 2017
Economic climate – US [Balances]1) Eco. climate – Germany [Balances]1) Economic climate – China [Balances]1)
Highest value Q3 2014 38.0
Lowest value Q1 2009 -60.6
-88.4
51.7
24.0 23.1
47.8
13.8
58.3 50.6
-5.4
13.4
21.8
1.1
-21.1
24.7
-36.1
7.2 2.1
Highest value Q4 2009 33.0
+90.6
Lowest value Q1 2009 -57.6
-71.0
2. Financial indicators 3. Other indicators 1. Real economic indicators
Lowest value Q2 2009
Highest value Q2 2015
-46.0
62.6 -14.8
+108.6
-70.0
-18.4
+98.6
Source: Ifo Institute
-25.8
0 0 0
1) Arithmetic mean of judgment about the present and the expected economic situation. As of the first quarter 2017 the Ifo Institute uses "balances" to illustrate the economic climate instead of indices. The balances range between − 100 and + 100 points

23 Roland Berger Economic Indicators May 2017 External version.pptx
10.2
9.8 8.9
5.7
6.0
4.2
4.6
8.4
9.1
97.7
87.2
94.7
73.2
85.1 82.7
55.7
77.5
70.3
90.4
96.9
79.1
91.2
Consumer confidence in Germany again at highest level – US sentiment strongly improved lately, heading to its January 2015 high
Highest value Jan 2015
Lowest value Nov 2008
4.0
Lowest value Sep 2008
Highest value June 2015, Sep. 2016 Feb. 2017 and May 2017
1.5 55.3
98.1
Jan 2006 Jan 2008 May 2017 Jan 2010 Jan 2012
+8.7 +42.8
Consumer index – Germany1) [Indicator] Consumer sentiment – US [Index; 1966=100]
-0.4
Jan 2014 Jan 2006 Jan 2008 May 2017 Jan 2010 Jan 2012 Jan 2014
-2.5
-35.9
1) Indicates change in real private consumption compared to the year before divided by 10; value of 10 indicates consumption growth of 1%
Source: GFK, University of Michigan
2. Financial indicators 3. Other indicators 1. Real economic indicators
10.2

24 Roland Berger Economic Indicators May 2017 External version.pptx
24
Contacts & selected resources for further reading
Klaus Fuest +49 (211) 4389-2231
Christian Krys +49 (211) 4389-2917
Eurostat Data for short term economic analysis (April 2017) Link
OECD Economic outlook and interim economic outlook (March 2017) Link
Contacts Further reading IMF World Economic Outlook (April 2017)
Link