Embed Size (px)
Citation preview
104th Congress, 2d Session
Economic Indicators
AUGUST 1996(Includes data available as of August 30, 1996)
Prepared for the Joint Economic Committee by the
Council of Economic Advisers
L I B R A It Y
•qcp 9 o««IG.F ,'j sj lyjOv
FEDERAL RESERVEBANK OF CHICAGO
UNITED STATES
GOVERNMENT PRINTING OFFICE
WASHINGTON : 1996
Digitized for FRASER http://fraser.stlouisfed.org/ Federal Reserve Bank of St. Louis
JOINT ECONOMIC COMMITTEE(Created pursuant to Sec. 5(a) of Public Law 304, 79th Cong.)
CONNIE MACK, Florida, ChairmanJIM SAXTON, New Jersey, Vice Chairman
SENATEWILLIAM V. ROTH, JR. (Delaware)LARRY E. CRAIG (Idaho)ROBERT F. BENNETT (Utah)RICK SANTORUM (Pennsylvania)RODNEY D. GRAMS (Minnesota)JEFF BINGAMAN (New Mexico)PAUL S. SARBANES (Maryland)EDWARD M. KENNEDY (Massachusetts)CHARLES S. ROBB (Virginia)
HOUSE OF REPRESENTATIVESTHOMAS W. EWING (Illinois)JACK QUINN (New York)DONALD A. MANZULLO (Illinois)MARSHALL (MARK) SANFORD (South Carolina)WILLIAM M. (MAC) THORNBERRY (Texas)FORTNEY H. (PETE) STARK (California)LEE H. HAMILTON (Indiana)MAURICE D. HINCHEY (New York)CAROLYN B. MALONEY (New York)
ROBERT N. MOTTICE, Executive Director
COUNCIL OF ECONOMIC ADVISERS
JOSEPH E. STIGLITZ, ChairmanMARTIN N. BAILY, Member
ALICIA H. MUNNELL, Member
{PUBLIC LAW 120—81ST CONGRESS; CHAPTER 237—IST SESSION]
JOINT RESOLUTION [SJ. Res. 55]
To print the monthly publication entitled "Economic Indicators"
Resolved by the Senate and House of Representatives of the United States of America in Congress assembled, That theJoint Economic Committee be authorized to issue a monthly publication entitled "Economic Indicators," and thata sufficient quantity be printed to furnish one copy to each Member of Congress; the Secretary and the Sergeantat Arms of the Senate; the Clerk, Sergeant at Arms, and Doorkeeper of the House of Representatives; two copiesto the libraries of the Senate and House, and the Congressional Library; seven hundred copies to the Joint EconomicCommittee; and the required numbers of copies to the Superintendent of Documents for distribution to depositorylibraries; and that the Superintendent of Documents be authorized to have copies printed for sale to the public.
Approved June 23, 1949-
Charts prepared by the Art Production Section, Design and Graphics Branch,Office of the Secretary, Department of Commerce.
Economic Indicators, published monthly, is available at $3.00 a single copy($3.75 foreign), or by subscription at $33.00 per year ($41.25 for foreign mailing)from:
SUPERINTENDENT OF DOCUMENTSGOVERNMENT PRINTING OFFICE
WASHINGTON, D.C. 20402
For sale by the U.S. Government Printing OfficeSuperintendent of Documents, Mail Stop: SSOP, Washington, DC 20402-9328
ISBN 0-16-053445-3
11
Digitized for FRASER http://fraser.stlouisfed.org/ Federal Reserve Bank of St. Louis
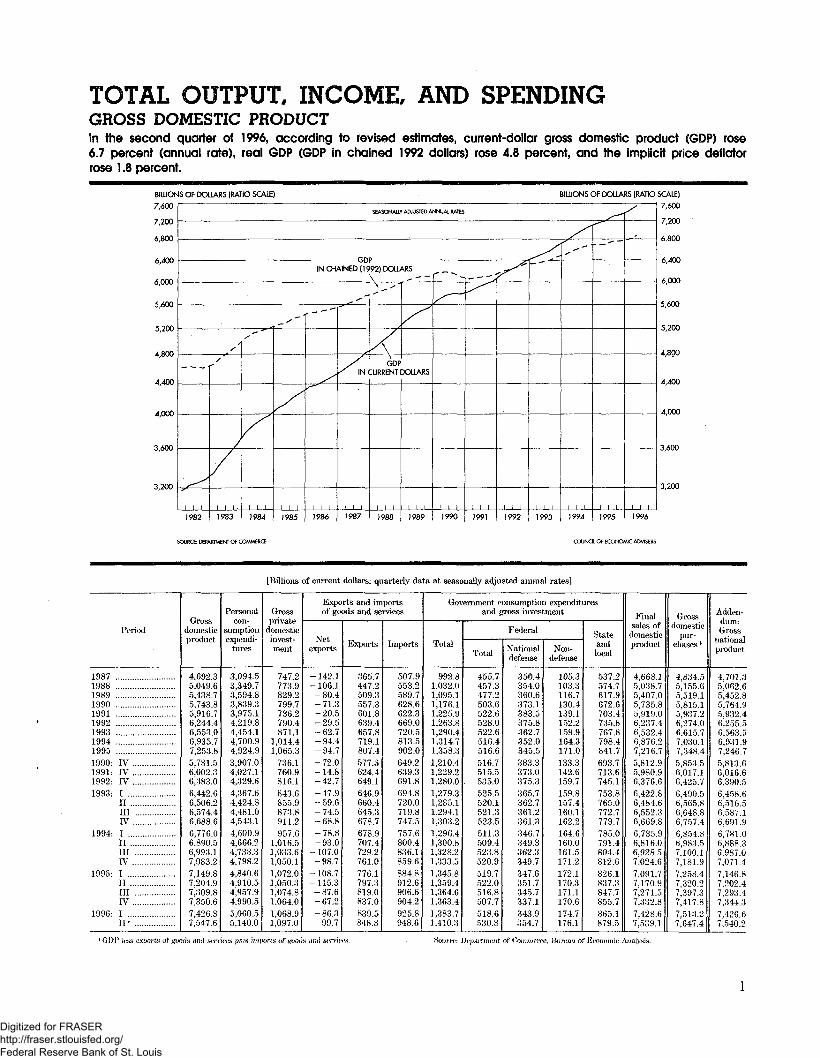
TOTAL OUTPUT, INCOME AND SPENDINGGROSS DOMESTIC PRODUCTIn the second quarter of 1996, according to revised estimates, current-dollar gross domestic product (GDP) rose6.7 percent (annual rate), real GDP (GDP in chained 1992 dollars) rose 4.8 percent, and the implicit price deflatorrose 1.8 percent.
BILLIONS OF DOLLARS (RATIO SCALE) BILLIONS OF DOLLARS (RATIO SCALE)
7,600
7,200
6,800
6,400
6,000
5,600
5,200
4,800
4,400
4,000
3,600
3,200
SEASONAliY ADJUSTED ANNUM. RATES ^^,
/*
INCHGDP
MNED( 1992) DOLL.\
--'
X
I i t
1982
x
/v\I I I -1983
s
V^
1 i i
1984
— ̂ ""
/
I i i1985
r — ~"
s/
1 1 !
1986
^"'
*
SJiS
x^
X GDP..\ CURRENT DOLLARS
i i I1987 1988
1 1 11989
f---^
^—
\ \ {
1990
_ —
^
\ \ \1991
^
\ \ \
1992
^<!
1993
>*
1994
- —
\ I i1995
^
1996
7,600
7,200
6,800
6,400
6,000
5,600
5,200
4,800
4,400
4,000
3,600
3,200
SOURCE: DEPARTMENT OF COMMERCE COUNCIL OF ECONOMIC ADVISERS
[Billions of current dollars; quarterly data at seasonally adjusted annual rates]
Period
1987 ..19881989 ..19901991 ..19921993 . .199419951990- IV1991: IV1992- IV1993: I
IIinrv
1994: IIIIIIrv
1995- IIIIIIIV
1996- III'
Grossdomesticproduct
4,692.35,049.65,438.75,743.85,916.76,244.46,553.06,935.77,253.85,781.56,002.36,383.06,442.66,506.26,574.46,688.66,776.06,890.56,993.17,083.27,149.87.204.97,309.87,350.67,426.87,547.6
Personal
sumptionexpendi-
tures
3,094.53,349.73,594.83,839.33,975.14,219.84,454.14,700.94,924.93,907.04,027.14,329.64,367.64,424.84,481.04,543.14,600.94,666.24,738.34,798.24,840.64,910.54,957.94,990.55,060.55,140.0
Grossprivate
domesticinvest-ment
747.2773.9829.2799.7736.2790.4871.1
1,014.41,065.3
736.1760.9816.1843.6855.9873.8911.2957.6
1,016.51,033.61,050.11,072.01,050.31,074.81,064.01,068.91,097.0
Exports and importsof goods and services
Netexports
-142.1-106.1-80.4-71.3-20.5-29.5-62.7-94.4-94.7-72.0-14.8-42.7-47.9- 59.6- 74.5-68.8-78.8-93.0
-107.0-98.7
-108.7-115.3-87.6-67.2-86.3-99.7
Exports
365.7447.2509.3557.3601.8639.4657.8719.1807.4577.3624.4649.1646.9660.4645.3678.7678.9707.4729.2761.0776.1797.3819.0837.0839.5848.8
Imports
507.9553.2589.7628.6622.3669.0720.5813.5902.0649.2639.3691.8694.8720.0719.8747.5757.6800.4836.1859.6884.8912.6906.6904.2925.8948.6
Government consumption expendituresand gross investment
Total
992.81,032.01,095.11,176.11,225.91,263.81,290.41,314.71,358.31,210.41,229.21,280.01.279.31,285.11,294.11,303.21,296.41,300.81,328.21,333.51,345.81,359.41,364.61,363.41,383.71,410.3
Federal
Total
455.7457.3477.2503.6522.6528.0522.6516.4516.6516.7515.5
- 535.0525.5520.1521.3523.5511.3509.4523.8520.9519.7522.0516.8507.7518.6530.8
Nationaldefense
350.4354.0360.6373.1383.5375.8362.7352.0345.5383.3373.0375.3365.7362.7361.2361.3346.7349.3362.3349.7347.6351.7345.7337.1343.9354.7
Non-defense
105.3103.3116.7130.4139.1152.2159.9164.3171.0133.3142.6159.7159.8157.4160.1162.2164.6160.0161.5171.2172.1170.3171.1170.6174.7176.1
Stateandlocal
537.2574.7617.9672.6703.4735,8767.8798.4841.7693.7713.6745.1753.8765.0772.7779.7785.0791.4804.4812.6826.1837.3847.7855.7865.1879.5
Finalsales of
domesticproduct
4,668.15,038.75,407.05,735.85,919.06,237.46,532.46,876.27,216.75,812.95,980.96,376.66,422.86,484.66,552.36,669.86,735.96,816.06,928.57,024.67,091.77,170.97,271.57,332.87,428.67,539.1
Grossdomestic
pur-chases '
4,834.55,155.65,519.15,815.15,937.26,274.06,615.77,030.17,348.45,853.56,017.16,425.76,490.56,565.86,648.86,757.46,854.86,983.57,100.17,181.97,258.47,320.27,397.37,417.87,513.27,647.4
Adden-dum:Gross
nationalproduct
4,701.35,062.65,452.85,764.95,932.46,255.56,563.56,931.97,246.75,813.66,016.66,390.56,458.66,516.56.587.16,691.96,781.06,888.36,987.07,071.47,146.87,202.47,293.47,344.37,426.67,540.2
1 OOP jess exfjort-s of frowis and xecvi«;s jilus im K»t.s of grcods ami .services. Souree: Department of < >0)m» , Bureau of Kcouojnje Analysis.
Digitized for FRASER http://fraser.stlouisfed.org/ Federal Reserve Bank of St. Louis
REAL GROSS DOMESTIC PRODUCT| Billions of chained (1992) dollars; quarterly data at seasonally adjusted annual rates j
Period
198719881989199019911992199319941995
1990- IV1991: IV .1992: IV
1993- III ...mIV
1994: IIIin ...IV
1995- IIIin .rv
1996: III "
Grossdomesticproduct
5,648.45,862.96,060.46,138.76,079.06,244.46,386.46,608.76,742.9
6,081.06,104.46,327.3
6,326.46,356.56,393.46,469.16,508.56,587.66,644.96,693.9
6,701.06,713.56,776.46,780.76,814.36,894.5
Personalcon-
sumptionexpendi-
tures
3,822.33,972.74,064.64,132.24,105.84,219.84,339.54,473.24,577.8
4,116.44,109.14,282.3
4,289.74,318.84,359.54,390.04,420.54,458.74,489.44,524.0
4,534.84,569.94,597.34,609.44,649.14,688.1
Gross privatedomestic investment
Nonresi-dentia!fixed
invest-ment
542.4566.0588.8585.2547.7557.9593.6652.1714.3
573.9539.5569.1
577.5586.4593.1617.6628.5639.5660.5679.7
704.4710.5719.0723.3743.5750.9
Resi-dentialfixed
invest-ment
257.6252.5243.2220.6193.4225.6242.7268.9262.8
200.3202.4236.7
237.9234.8242.2255.8263.6271.6270.3270.3
265.9256.5262.2266.3271.1281.3
Changein busi-
nessinven-tories
26.211.633.310.4
-3.07.3
19.158.933.1
-28.221.45.8
18.520.819.517.440.574.564.556.1
54.530.533.014.6-3.0
7.2
Exports and imports ofgoods and services
Netexports
-1562-114.4-82.7-61.9-22.3-29.5-72.0
-105.7-107.6
-42.5-17.9-40.0
-56.0-64.4-86.2-81.5-99.3
-107.3-111.7- 104.3
-122.5-121.4-101.6-84.9- 104.0-115.2
Exports
402.0465.8520.2564.4599.9639.4658.2712.0775.4
573.9623.5649.1
647.1660.0645.5680.3677.6703.1719.6747.6
752.3763.2783.0803.1806.7816.2
Imports
558.2580.2603.0626.3622.2669.0730.2817.6883.0
616.4641.4689.1
703.1724.4731.7761.8777.0810.4831.3851.9
874.9884.6884.5888.0910.7931.4
Government consumption expendituresand gross investment
Total
1,165.91,180.91,213.91,250.41,258.01,263.81,261.01,260.01,260.2
1,259.91,250.71,272.5
1,257.71,258.41,261.61,266.21,252.41,249.81,271.21,266.6
1,262.71,265.11,263.41,249.61,254.71,279.8
Federal
Total
534.4524.6531.5541.9539.4528.0509.2489.8472.3
543.5526.9534.0
516.1509.7505.9505.0489.9483.3496.7489.2
481.0479.4472.5456.2462.9474.8
Nationaldefense
409.2405.5401.6401.5397.5375.8355.4337.0319.6
403.1381.7376.8
361.6356.9351.6351.2334.8335.5346.2331.3
325.0325.5319.1308.8311.9320.5
Non-defcnse
125.3119.1130.1140.5142.0152.2153.8152.6152.3
140.5145.3157.1
154.4152.7154.2153.7154.9147.8150.4157.5
155.6153.5153.1147.0150.6153.9
Stateandlocal
631.8656.6682.6708.6718.7735.8751.8770.5788.6
716.5723.8738.5
741.6748.8755.7761.3762.7766.8774.7777.7
782.2786.3791.5794.4792.6805.7
Finalsales ofdomesticproduct
5,626.05,855.16,028.76,126.76,082.66,237.46,365.56,550.76,708.9
6,108.16,083.86,320.7
6,307.16,334.56,371.36,449.26,467.76,514.96,582.16,638.1
6,647.46,682.46,741.46,764.26,815.26,886.4
Grossdomestic
pur-chases l
5,815.75,983.96,146.16,202.16,101.16,274.06,457.66,711.86,847.1
6,124.36,122.36,367.3
6,382.16,420.46,478.66,549.36,605.96,692.36,753.76,795.3
6,819.86,830.96,874.86,862.96,914.67,005.5
Adden-dum:Gross
nationalproduct
5,657.25,876.26,074.06,159.46,094.46,255.56,397.16,606.06,737.1
6,113.46,118.76,334.8
6,342.56,366.96,406.36,472.56,514.06,586.26,640.06,683.5
6,699.16,711.96,762.06,775.66,814.96.888.6
1 GDP less exports of goods and services plus imports of goods and services.Note.—Because of the formula used for calculating real GDI*, the chained (1992) dollar esti-
mates for the detailed components <ti> not tultl to the ehained-dollar value of GDP or to anyintermediate aggregates.
Source: Department of Commerce, Bureau of Economic Analysis.
IMPLICIT PRICE DEFLATORS FOR GROSS DOMESTIC PRODUCT(Index numbers, 1992=100; quarterly data are seasonally adjusted)
Period
19871988198919901991 .1992199319941995
1990: IV1991: IV1992: IV
1993- IIIIllIV
1994- IIIIllIV
1995- IIIinrv
1996- III'
Grossdomesticproduct
83.186.189.793.697.3
100.0102.6104.9107.6
95.198.3
100.9
101.8102.4102.8103.4
104.1104.6105.2105.8
106.7107.3107.9108.4
109.0109.5
Personal consumptionexpenditures
Total
81.084.388.492.996.8
100.0102.6105.1107.6
94.998.0
101.1
101.8102.5102.8103.5
104.1104.7105.5106.1
106.7107.5107.8108.3
108.9109.6
Durablegoods
91.693.395.396.698.5
100.0101.3103.4104.6
97.099.1
100.2
100.5101.1101.5101.9
102.4103.2103.9103.9
104.7104.8104.5104.3
104.3103.6
Nondura-ble goods
81.884.889.394.698.1
100.0101.5102.8104.5
97.498.7
100.7
101.3101.5101.3101.9
102.0102.4103.3103.6
103.9104.5104.7105.0
106.0107.2
Services
78.282.286.691.295.8
100.0103.6106.7109.9
93.197.4
101.5
102.4103.3103.9104.7
105.6106.2107.1107.9
108.8109.7110.3110.9
111.4112.3
Gross >rivatedomestic investment
Nonresi-dent] alfixed
91.393.796.298.499.9
100.0100.9102.3103.4
99.499.9
100.1
100.5100.8101.0101.1
101.6102.2102.7102.7
102.7103.4103.8103.6
103.4103.1
Residen-tial fixed
88.392.195.197.898.8
100.0103.7107.0110.3
98.398.9
101.4
102.3103.6104.3104.7
105.7106.2107.4108.6
109.2109.9110.7111.3
111.3111.6
Exports and imports ofgoods and services
Exports
91.096.097.998.7
100.3100.099.9
101.0104.1
100.6100.2100.0
100.0100.1100.099.8
100.2100.6101.3101.8
103.2104.5104.6104.2
104.1104.0
Imports
91.095.397.8
100.4100.0100.098.799.5
102.2
105.399.7
100.4
98.899.498.498.1
97.598.8
100.6100.9
101.1103.2102.5101.8
101.7101.8
Government consumption expendituresand gross investment
Federal
Total
85.387.289.892.996.9
100.0102.6105.4109.4
95.197.8
100.2
101.8102.0103.0103.6
104.4105.4105.5106.5
108.0108.9109.4111.3
112.0111.8
Nationaldefense
85.687.389.892.996.5
100.0102.1104.5108.1
95.197.799.6
101.1101.6102.7102.9
103.6104.1104.7105.5
106.9108.1108.3109.2
110.3110.7
Non-defeuse
84.086.789.792.897.9
100.0104.0107.7112.3
94.998.1
101.6
103.5103.1103.9105.5
106.3108.3107.4108.7
110.6110.9111.8116.0
116.0114.4
Stateandlocal
85.087.590.594.997.9
100.0102.1103.6106.7
96.898.6
100.9
101.6102.2102.3102.4
102.9103.2103.8104.5
105.6106.5107.1107.7
109.1109.2
Kource: Department of Commerce, Bureau of Economic Analysis.
Digitized for FRASER http://fraser.stlouisfed.org/ Federal Reserve Bank of St. Louis
QUANTITY AND PRICE INDEXES FOR GROSS DOMESTIC PRODUCT ANDPERCENT CHANGES
[Quarterly data are seasonally adjusted]
Index numbers, 1992=100
Currentdollars
Chain-typequantity
index
Chain-tyi>eprice index
Implicitprice
deflator
Percent change from preceding period1
Chain-typequantity
index
Chain-typepriceindex
Implicitprice
deflator
198219831984198519861987198819891990199119921993199419951991: I ...
II ..IllIV .
1992: I ...II ..IllIV .
1993: I ...II ..IllIV .
1994: I ...II ..Illrv .
1995: I ...II ..IllIV .
1996: I ...II'
51.956.362.567.070.875.180.987.192.094.8
100.0104.9
r 111.1116.2
93.294.495.396.198.099.3
100.4102.2103.2104.2105.3107.1108.5110.3112.0113.4114.5115.4117.1117.7118.9120.9
74.077.082.385.387.990.593.997.198.397.3
100.0102.3105.8108.0
96.997.397.597.898.999.5
100.3101.3101.3101.8102.4103.6104.2105.5106.4107.2107.3107.5108.5108.6109.1110.4
70.273.275.978.680.683.186.189.793.697.3
100.0102.6105.0107.6
96.397.097.798.399.199.8
100.2100.9101.8102.4102.8103.4104.1104.6105.2105.8106.7107.3107.9108.4109.0109.6
70.173.175.978.480.683.186.189.793.697.3
100.0102.6104.9107.696.397.097.798.399.199.8
100.2100.9101.8102.4102.8103.4104.1104.6105.2105.8106.7107.3107.9108.4109.0109.5
4.18.4
11.07.15.86.17.67.75.63.05.54.95.84.62.84.94.03.68.25.34.67.33.84.04.37.15.36.96.15.33.83.16.02.34.26.7
-2.14.06.83.73.02.93.83.41.3
-1.02.72.33.52.0
-2.21.71.01.04.72.53.04.3-.11.92.34.82.54.93.53.0
.4
.73.8
.32.04.8
6.34.23.83.42.63.13.74.24.43.92.82.62.32.54.83.22.82.53.42.81.52.83.82.21.82.32.91.92.42.13.32.42.12.12.32.2
6.34.23.93.32.73.13.74.24.34.02.72.62.32.55.13.12.92.53.32.71.52.93.82.11.92.22.81.92.52.23.42.42.12.02.21.8
1 Percent changerates.
'• based on unrounded indoxes. Quarterly !>crcerit changes are at annual Source: Department of Commerce, Bureau of Economic Analysis.
NONFINANCIAL CORPORATE BUSINESS-OUTPUT, COSTS, AND PROFITS[Quarterly data at seasonally adjusted annual rates!
(iross domestic productof rionfinaneial
corporate business(billions of dollars)
Currentdollars
Chained(1992)dollars
Current-dollar cost and profit per unit of real output (dollars)1
Totalcost andprofit 2
Consump-tion offixed
capital
Indirectbusinesstax, cte.»
Com-pensation
of em-ployees
(Corporate profits with inventoryvaluation and capital consumption
adjustments
Profitstax
liability
Profitsafter-tax4
198719881989199019911992199319941995
1993: IIIIllIV
1994: IIIIllIV
1995: IIIIllIV
1996: I
2,589.62,805.22,950.93,084.03,132.13,262.63,437.53,689.43,885.83,344.23,407.33,459.73,538.7
3,601.73,663.03,709.53,783.2
3,803.33,841.93,924.83,973.2
4,011.64,087.3
2,967.03,122.13,175.43,212.53,168.83,262.63,380.03,567.73,692.3
3,302.93,356.73,399.23,461.13,503.93,553.03,577.73,636.3
3,634.13,656.13,719.93,759.1
3,779.23,835.7
0.873.898.929.960.9881.0001.0171.0341.052
1.0121.0151.0181.022
1.0281.0311.0371.040
1.0471.0511.0551.057
1.0621.066
0.100.101.106.110.116.115.115.116.115.116.115.116.114.122.114.114.113
.114
.115
.115
.115
.115
.115
0.083.084.088.092.100.103.105.106.109
.105
.105
.105
.107
.106
.106
.107
.106
.108
.110
.108
.108
.107
.107
0.578.591.614.640.660.673.679.682.697.682.679.679.675
.680
.681
.684
.686
.696
.698
.696
.699
.702
.705
0.076.082.075.072.070.077.088.102.104.079.085.089.098
.092
.103
.105
.108
.100
.100
.109
.108
.111
.113
0.031.033.031.030.027.028.031.036.038
.028
.031
.029
.034
.035
.036
.037
.039
.039
.038
.038
.037
.039
.039
0.044.050.044.042.043.049.057.066.066
.050
.055
.059
.065
.058
.067
.068
.070
.061
.062
.071
.070
.072
.074
0.035.039.046.046.042.032.029.027.027
.031
.030
.029
.028
.027
.027
.028
.027
.028
.028
.027
.027
.026
.026
'Output is mea-sui-ed by 01)]* of rionfinaneial corporate business in chained (1992) dollars.'- This is equal to the deflator for gross domestic product of rionfinaneial corporate business
with the decimal iHtint shifted two places to the left.
•' Indirect business tax and nontax liability plus business transfer payments less sulisidics.4 With inventory valuation and capital consumption adjustments.
Sources: Department of Commerce, Bureau of Economic Analysis.
Digitized for FRASER http://fraser.stlouisfed.org/ Federal Reserve Bank of St. Louis
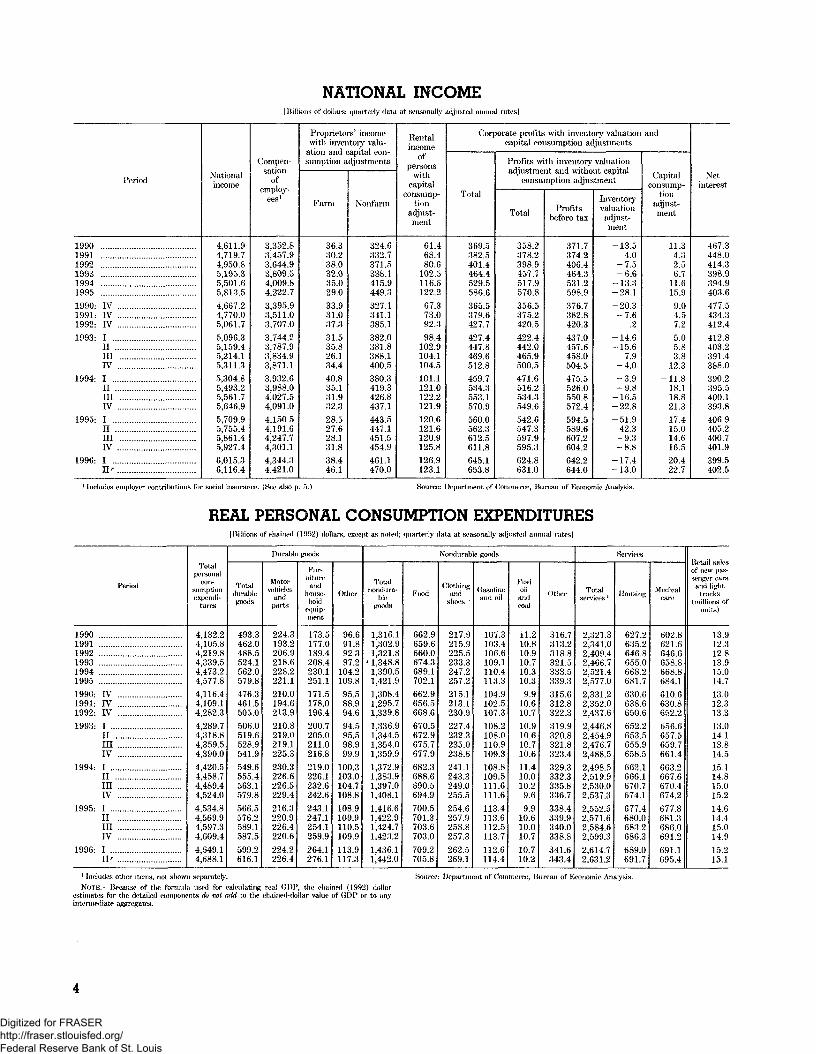
NATIONAL INCOME[Billions of dollars; quarterly data at. seasonally adjusted annual rates|
Period
1990 . . .199119921993 .199419951990- IV1991: IV1992- IV1993: I ..
IIinrv
1994- IIIinIV
1995- IIIin ... .rv
1996- III'
Nationalincome
4,611.94,719.74,950.85,195.35,501.65,813.5
4,667.24,770.05,061.75,096.35,159.45,214.15,311.3
5,304.85,493.25,561.75,646.9
5,709.95,755.45,861.45,927.46,015.36.116.4
Compen-sation
of
ees1
3,352.83,457.93,644.93,809.54,009.84,222.7
3,395.93,511.03,707.0
3,744.23,787.93,834.93,871.13,932.63,988.04,027.54,091.04,150.54,191.64,247.74,301.14,344.34.421.0
Proprietors' incomewith inventory valu-
ation and capital con-sumption adjustments
Farm
36.330.238.032.035.029.033.931.037.331.535.826.134.440.835.131.932.328.527.628.131.838.446.1
Noiifarm
324.6332.7371.5388.1415.9449.3
327.1341.1385.1382.0381.8388.1400.5380.3419.3426.8437.1443.5447.1451.5454.9
461.1470.0
Rentalincome
ofpereons
withcapital
consump-tion
adjust-ment
61.468.480.6
102.5116.6122.2
67.373.092.398.4
102.9104.1104.5101.1121.0122.2121.9120.6121.6120.9125.8126.9123.1
Corporate profits with inventory valuation andcapital consumption adjustments
Total
369.5382.5401.4464.4529.5586.6
365.5379.6427.7
427.4447.8469.6512.8459.7534.3553.1570.9
560.0562.3612.5611.8645.1653.8
Profits with inventor}7 valuationadjustment and without capital
consumption adjustment
Total
358.2378.2398.9457.7517.9570.8356.5375.2420.5422.4442.0465.9500.5
471.6516.2534.3549.6542.6547.3597.9595.3624.8631.0
Profitsbefore tax
371.7374.2406.4464.3531.2598.9
376.7382.8420.3
437.0457.6458.0504.5475.5526.0550.8572.4
594.5589.6607.2604.2
642.2644.0
Inventoryvaluationadjust-ment
-13.54.0
-7.5-6.6
-133-28.1-20.3-7.6
.2-14.6-15.6
7.9-4.0-3.9-9.8
-165-22.8-51 9-42.3-9.3-8.8
-174-13.0
Capitalconsump-
tionadjust-ment
11.34.32.56.7
11.615.99.04.57.25.05.83.8
12.3-11.8
18.118.821.317.415.014.616.520.422.7
Netinterest
467.3448.0414.3398.9394.9403.6
477.5434.3412.4412.8403.2391.4388.0
390.2395.5400.1393.8406.9405.2400.7401.9399.5402.5
1 Includes employer contributions for social insurance. (See also p. 5.) Source: Department of Commerce, Bureau of* Economic Analysis.
REAL PERSONAL CONSUMPTION EXPENDITURES[Billions of chained (1992) dollars, except as noted; quarterly data at seasonally adjusted annual rates)
Period
1990199119921993199419951990- IV1991: IV1992- IV1993- I
IIinIV
1994: IIIinIV
1995- IIIinrv
1996- III'
Total|>crsonal
con-sumptionexpendi-
tures
4,132.24,105.84,219.84,339.54,473.24,577.8
4,116.44,109.14,282.3
4,289.74,318.84,359.54,390.0
4,420.54,458.74,489.44,524.0
4,534.84,569,94,597.34,609.4
4,649.14,688.1
Durable goods
Totaldurablegoods
493.3462.0488.5524.1562.0579.8
476.3461.5505.0
506.0519.6528.9541.9549.6555.4563.1579.8
566.5576.2589.1587.5
599.2616.1
Motorvehicles
andparts
224.3193.2206.9218.6228.2221.1210.0194.6213.9210.8219.0219.1225.3
230.3226.6226.5229.4
216.3220.9226.4220.6
224.2226.4
Fur-nitureand
house-hold
equip-ment
173.5177.0189.4208.4230.1251.1171.5178.0196.4200.7205.0211.0216.8219.0226.1232.6242.6
243.1247.1254.1259.9
264.1276.1
Other
96.691.892.397.2
104.2109.8
95.588.994.694.595.598.999.9
100.3103.0104.7108.8108.9109.9110.5109.9113.9117.3
Nondurable goods
Totalnondura-
blegoods
1,316.11,302.91,321.8
'1,348.81,390.51,421.9
1,308.41,295.71,339.81,336.91,344.51,354.01,359.91,372.91,383.91,397.01,408.1
1,416.61,422.91,424.71,423.2
1,436.11,442.0
Food
662.9659.6660.0674.3689.1702.1662.9656.5668.6
670.5672.9675.7677.9
682.3688.6690.5694.9
700.5701.3703.6703.0
709.2705.8
Clothingand
shoes
217.9215.9225.5233.3247.2257.2
215.1213.1230.9227.4232.3235.0238.6241.1243.3249.0255.5
254.6257.9258.8257.3
262.5269.1
Gasolineand oil
107.3103.4106.6109.1110.4113.3104.9102.5107.3108.2108.0110.9109.3108.8109.5111.6111.6113.4113.6112.5113.7112.6114.4
Fueloilandeoal
11.210.810.910.710.310.3
9.910.610.710.910.610.710.611.410.010.29.69.9
10.610.010.710.710.2
Other
316.7313.2318.8321.5333.5339.3
315.6312.8322.3
319.9320.8321.8323.4
329.3332.3335.8336.7
338.4339.9340.0338.8
341.6343.4
Services
Totalserviees '
2,321.32,341.02,409.42,466.72,521.42,577.0
2,331.22,352.02,437.6
2,446.82,454.92,476.72,488.5
2,498.52,519.92,530.02,537.3
2,552.52,571.62,584.62,599.3
2,614.72,631.2
Housing
627.2635.2646.8655.0668.2681.7630.6638.6650.6652.2653.5655.9658.5
662.1666.1670.7674.1677.4680.0683.2686.3
689.0691.7
Medical
602.8621.6646.6658.8668.8684.1610.6630.8652.2
656.6657.5659.7661.4663.2667.6670.4674.2
677.8681.3686.0691.2691.1695.4
Ketail salesof new pas-senger ears
and lighttrucks
(millions ofunits)
13.912.312.813.915.014.713.012.313.313.014.113.814.5]5.114.815.015.214.614.415.014.915.215.1
1 Includes other items, not shown separately.
NOTE.—Because of the formula used for calculating real GDP, the chained (199*2) dollarestimates for the detailed components do not luiil to the chained-dollar value of GDI* or to anyintermediate aggregates.
Source: Department of Commerce, Bureau of Economic Analysis.
Digitized for FRASER http://fraser.stlouisfed.org/ Federal Reserve Bank of St. Louis
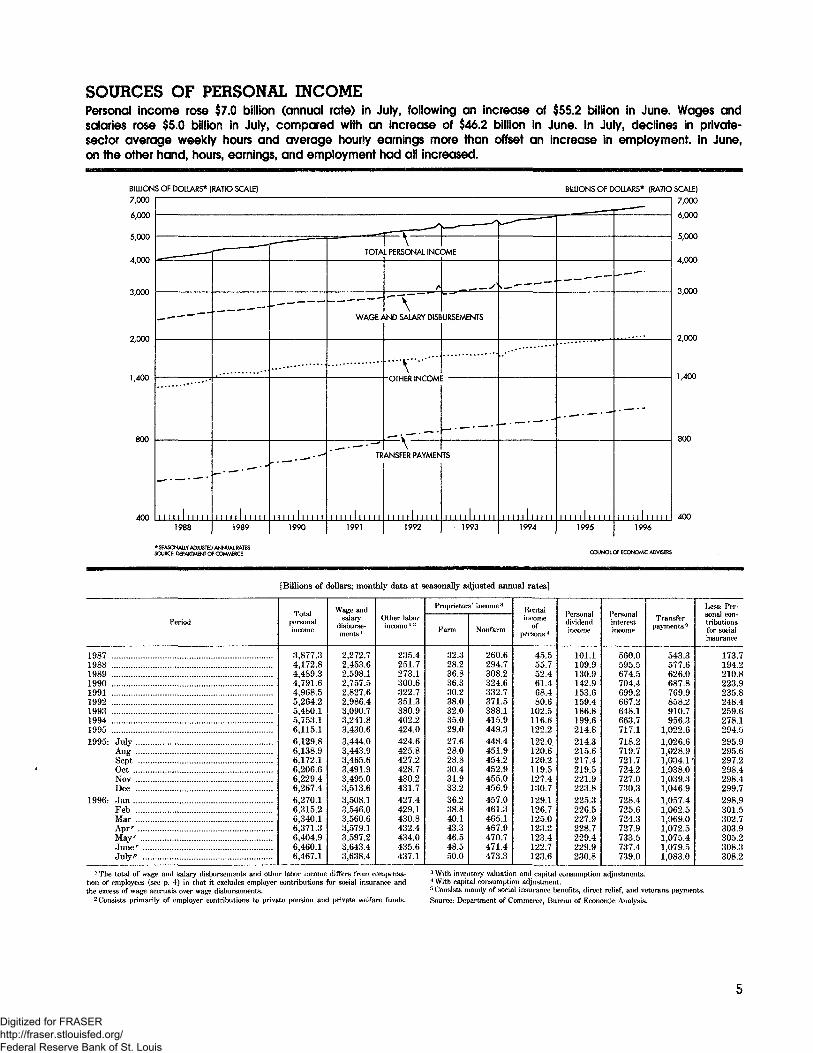
SOURCES OF PERSONAL INCOMEPersonal income rose $7.0 billion (annual rate) in July, following an increase of $55.2 billion in June. Wages andsalaries rose $5.0 billion in July, compared with an increase of $46.2 billion in June. In July, declines in private-sector average weekly hours and average hourly earnings more than offset an increase in employment. In June,on the other hand, hours, earnings, and employment had all increased.
BILLIONS OF DOLLARS* (RATIO SCALE)7,000
4,000
5,000
4,000
3,000
2,000
1,400
800
4001988
I I I I I I I I I I I1989 1990
WAGE AND SALARY DISBURSEMENTS
"T""'OTHER INCOME
TRANSFER PAYMENTS
1991 1992 1993 1994
BILLIONS OF DOLLARS* (RATIO SCALE)
7,000
6,000
5,000
4,000
3,000
2,000
1,400
800
I I I I [ I M I I I
1995
I I I I I I I I I I I 4001996
COUNCIL Of ECONOMIC ADVISERS
[Billions of dollars; monthly data at seasonally adjusted annual rates]
Period
19871988 . ..19891990199119921993199419951995: July
SeptGet
Dec1996- Jan
FebMarApr1"May
July**
Totalpersonalincome
3,877.34,172.84,489.34,791.64,968.55,264.25,480.15,753.16,115.16,129.86,138.96.172.16,206.66,229.46,267.46,270.16,315.26,340.16,371.36,404.96,460.16,467.1
Wage andsalary
disburse-ments '
2,272.72,453.62,598.12,757.52,827.62,986.43,090.73,241.83,430.63,444.03,443.93,465.63,491.93,495.03,513.63,508.13,546.03,560.63,579.13,597.23,643.43,638.4
Other laborincome ' 2
235.4251.7273.1300.6322.7351.3380.9402.2424.0424.6425.8427.2428.7430.2431.7427.4429.1430.8432.4434.0435.6437.1
Proprietors' income3
Farm
32.328.236.836.330.238.032.035.029.027.628.028.830.431.933.236.238.840.143.346.548.550.0
Nonfarm
260.6294.7308.2324.6332.7371.5388.1415.9449.3448.4451.9454.2452.9455.0456.9457.0461.3465.1467.9470.7471.4473.3
Rentalincome
ofpersons4
45.555.752.461.468.480.6
102.5116.6122.2122.0120.6120.2119.5127.4130.7129.1126.7125.0123.2123.4122.7123.6
Personaldividendincome
101.1109.9130.9142.9153.6159.4186.8199.6214.8214.3215.6217.4219.5221.9223.8225.3226.5227.9228.7229.4229.9230.8
Personalinterestincome.
560.0595.5674.5704.4699.2667.2648.1663.7717.1718.2719.7721.7724.2727.0730.3728.4725.6724.3727.9733.5737.4739.0
Transferpayments5
543.3577.6626.0687.8769.9858.2910.7956.3
1,022.61,026.61,028.91,034.1 '1,038.01,039.31,046.91,057.41,062.51,069.01,072.51,075.41,079.51,083.0
Less: Per-sonal con-tributionsfor socialinsurance
173.7194.2210.8223.9235.8248.4259.6278.1294.5295.9295.6297.2298.4298.4299.7298.9301.5302.7303.9305.2308.3308.2
1 The total of wage and salary disbursements and other labor income differs from compensa-tion of employees {see p. 4) in that it excludes employer contributions for social insurance andthe excess of wage accruals over wage disbursements.
2 Consists primarily of employer contributions to private pension and private welfare funds.
3 With inventory valuation and capital consumption a<ljustincnts.*With capita! consumption adjustment.5 Consists mainly of social insurance benefits, direct relief, and veterans payments.
Source: Department of Commerce, Bureau of Economic Analysis.
Digitized for FRASER http://fraser.stlouisfed.org/ Federal Reserve Bank of St. Louis
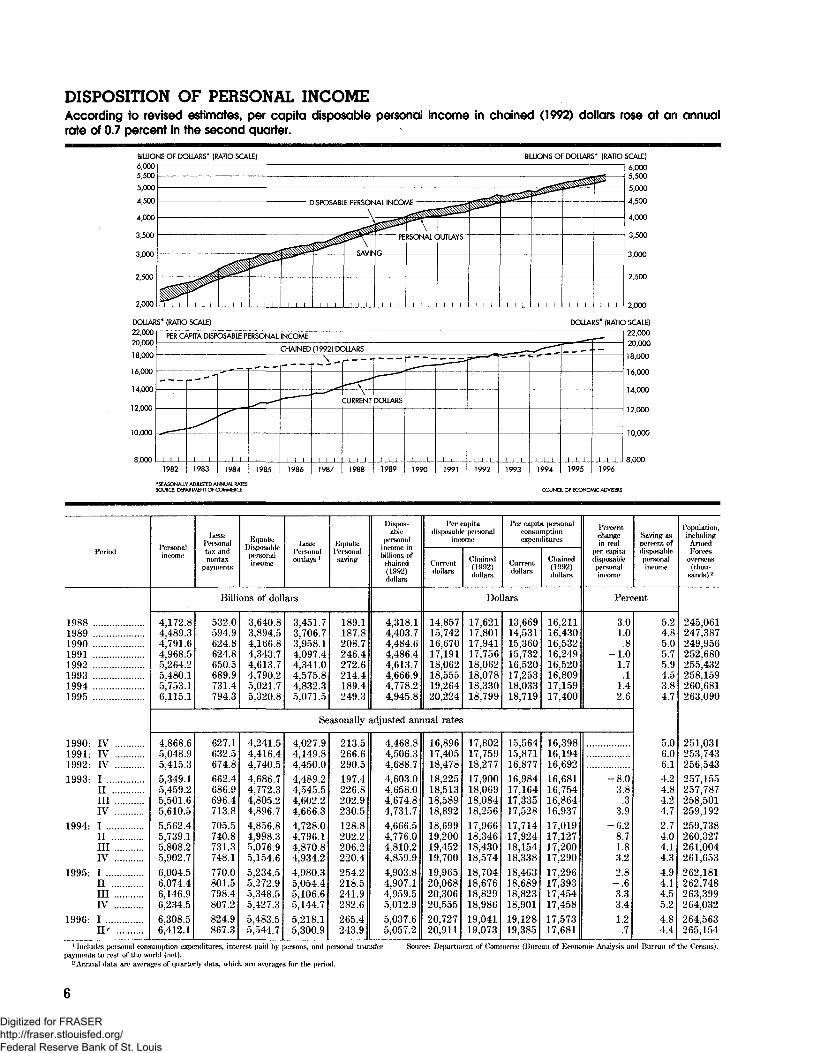
DISPOSITION OF PERSONAL INCOMEAccording to revised estimates, per capita disposable persona! income in chained (1992) dollars rose at an annualrate of 0.7 percent in the second quarter.
BILLIONS OF DOUARS- (RATIO SCALE)6,000
BILLIONS OF DOLLARS' (RATIO SCALE]
2,500
2,000
DOLLARS* (RATIO SCALE)
2,500
2,000
DOUARS* (RATIO SCALE)
20,000
18,000
16,000
14,000
12,000
10,000
8,000
PER CAPITA DISPOSABLE PERSONAL INCOME
CHAINED (1 992) DOLLARS
. • —
i i i
1982
p--"
^
1 1 !
1983
^
i i i1984
r
^-— '
i I i1985
•••
1 1 1
1986
\ _
^*^~
\ 1 !
1987
\\
CURRENT
i i I1988
1 "
XM1ARS
: i i1989
.
I I I1990
— •
! 1 1
19911 1 !
1992
i i i1993
j^**1 ' __.
1 1 !
1994
— — — •
i i i1995
p» ••
.-
I I I1996
22,00020,000
18,000
16,000
14,000
12,000
10,000
8,000
COUNCIL OF ECONOMIC ADVISERS
Period
19881989199019911992199319941995
1990- IV1991- IV1992- IV1993- I
IIIllrv
1994- IIIIllrv
1995- IIIIIIIV
1996: III r
Personalincome
Less:Personaltax aridnontax
payments
Equals:Disposable[wrsonalincome
Less:Personaloutlays '
Equals:Persona!saving
Billions of dollars
4,172.84,489.34,791.64,968.55,264.25,480.15,753.16,115.1
532.0594.9624.8624.8650.5689.9731.4794.3
3,640.83,894.54,166.84,343.74,613.74,790.25,021.75,320.8
3,451.73,706.73,958.14,097.44,341.04,575.84,832.35,071.5
189.1187.8208.7246.4272.6214.4189.4249.3
Dispos-able
|>ersonalincome inbillions ofchained(1992)dollars
4,318.14,403.74,484.64,486.44,613.74,666.94,778.24,945.8
Per capitadisposable persona]
income
Currentdollars
Chained(1992)dollars
Per capitconsuexpen
Currentdollars
a personalmptioriitures
Chained(1992)dollars
Dollars
14,85715,74216,67017,19118,06218,55519,26420,224
17,62117,80117,94117,75618,06218,07818,33018,799
13,66914,53115,36015,73216,52017,25318,03318,719
16,21116,43016,53216,24916,52016,80917,15917,400
Percentchangein real
per capitadisposablepersonalincome
Saving aspercent ofdisposablepersonalincome
Percent
3.01.0
.8-1.0
1.7.1
1.42.6
Seasonally adjusted annual rates
4,868.65,048.95,415.35,349.15,459.25,501.65,610.55,562.45,739.15,808.25,902.76,004.56,074.46,146.96,234.56,308.56,412.1
627.1632.5674.8662.4686.9696.4713.8705.5740.8731.3748.1770.0801.5798.4807.2824.9867.3
4,241.54,416.44,740.54,686.74,772.34,805.24,896.74,856.84,998.35,076.95,154.65,234.55,272.95,348.55,427.35,483.55,544.7
4,027.94,149.84,450.04,489.24,545.54,602.24,666.34,728.04,796.14,870.84,934.24,980.35,054.45,106.65,144.75,218.15,300.9
213.5266.6290.5197.4226.8202.9230.5128.8202.2206.2220.4254.2218.5241.9282.6265.4243.9
4,468.84,506.34,688.74,603.04,658.04,674.84,731.74,666.54,776.04,810.24,859.94,903.84,907.14,959.55,012.95,037.65,057.2
16,89617,40518,47818,22518,51318,58918,89218,69919,20019,45219,70019,96520,06820,30620,55520,72720,911
17,80217,75918,27717,90018,06918,08418,25617,96618,34618,43018,57418,70418,67618,82918,98619,04119,073
15,56415,87116,87716,98417,16417,33517,52817,71417,92418,15418,33818,46318,68918,82318,90119,12819,385
16,39816,19416,69216,68116,75416,86416,93717,01917,12717,20017,29017,29617,39317,45417,45817,57317,681
-8.03.8.3
3.9-6.2
8.71.83.22.8-.63.33.41.2
.7
5.24.85.05.75.94.53.84.7
5.06.06.14.24.84.24.72.74.04.14.34.94.14.55.24.84.4
Population,includingArmedForces
overseas(thou-
sands) 2
245,061247,387249,956252,680255,432258,159260,681263,090
251,031253,743256,543257,155257,787258,501259,192259,738260,327261,004261,653262,181262,748263,399264,032264,563265,154
1 Includes personal (-onsuinption expenditures, interest paid by jwi-sons, and personal transferpayments to rest of the world (net).
2 Annual data are averages of quarterly data, which are averages for the |>eriod.
Source: Department of Commerce {Bureau of Economic Analysis and Bureau of the Census).
Digitized for FRASER http://fraser.stlouisfed.org/ Federal Reserve Bank of St. Louis
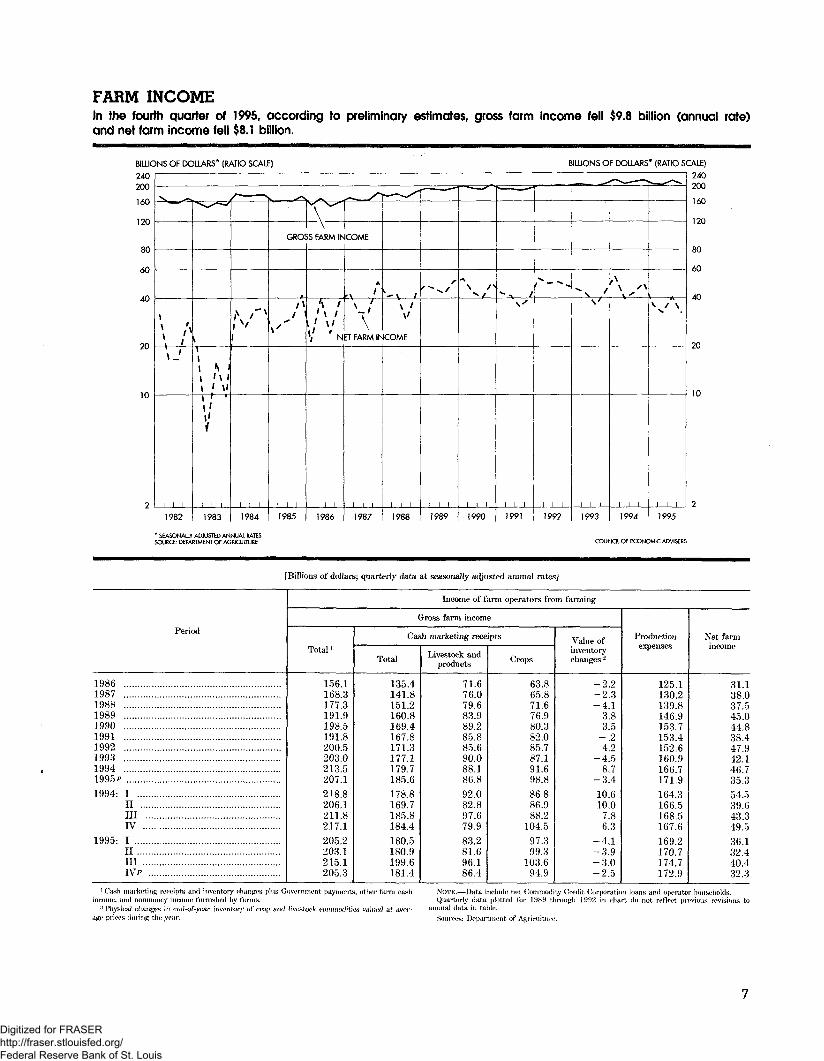
FARM INCOMEIn the fourth quarter of 1995, according to preliminary estimates, gross farm income fell $9.8 billion (annual rate)and net farm income fell $8.1 billion.
BILLIONS OF DOLLARS* (RATIO SCALE) BILLIONS OF DOLLARS" (RATIO SCALE)
240200
160
40
20
10
7
.„ ,-f
v. ^
\\ ',\ '
\J
1 1 1
1982
^v^-'
\1i N ii ' \ ii ' \iI ' 'i'
i
1 ! 1
1983
<y
1 ! 1
1984
\i \GROSS FARM Ir-
.l\
\'~
i i i1985
A '' \ 1
\ ' \l
<! 'N
i i i
1986
COME
'\^ /
\ET FARM IN
1 ! 1
1987
r~*~^"
k~" \ '\ /\/COME
1 ! !
1988
1 '
' *"• /"̂
i i i1989
"
^\ />^ f
i i l
1990
^ /\s
i i i
1991
x1 •*
i i i
1992
\f
i i l
1993
r̂ "~ — *
,\\ ^\. s
1994
r— -̂̂ .
v / \s
i i i
240
160
60
40
20
10
21995
" SEASONALLY ADJUSTED ANNUAL RATESSOURCE: DEPARTMENT Of AGRICULTURE COUNCIL OF ECONOMIC ADVISERS
[Billions of dollars; quarterly data at seasonally adjusted annual rates]
Period
198619871988198919901991 ...199219931994 . . . . .1995?1994: I
IIIIIIV
1995: IIIIllTVf .
Income of farm operators from farming
Gross farm income
Total '
156.1168.3177.3191.9198.5191.8200.5203.0213.5207.1218.8206.1211.8217.1205.2203.1215.1205.3
Cash marketing receipts
Total
135.4141.8151.2160.8169.4167.8171.3177.1179.7185.6178.8169.7185.8184.4180.5180.9199.6181.4
Livestock andproducts
71.676.079.683.989.285.885.690.088.186.892.082.897.679.983.281.696.186.4
Crops
63.865.871.676.980.382.085.787.191.698.886.886.988.2
104.597.399.3
103.694.9
Value ofinventorychanges -
-2.2-2.3-4,1
3.83.5
-.24.2
-4.58.7
-3.410.610.0
7.86.3
-4.1-3.9-3.0-2.5
Productionexpenses
125.1130.2139.8146.9153.7153.4152.6160.9166.7171.9164.3166.5168.5167.6169.2170.7174.7172.9
Net farmincome
31.138.037.545.044.838.447.942.146.735.354.539.643.349.536.132.440.432.3
1 Cash marketing receipts and inventory changes plus Government payments, other farm cashincome, arid nonmoney income furnished by farms.
~ Hrysiea) ehartgvs in (ind-of-y«ar inventory of m>{? ami livestock w>7mrKx)itit\s valjiei) at aver-age prices during the year.
NOTE.—Data include rmt Commodity Credit Corporation loans and operator households.Quarterly data plotted for 1989 through 1992 in chart do not reflect previous revision
annual data in table.Sources: Department of Agriculture.
Digitized for FRASER http://fraser.stlouisfed.org/ Federal Reserve Bank of St. Louis
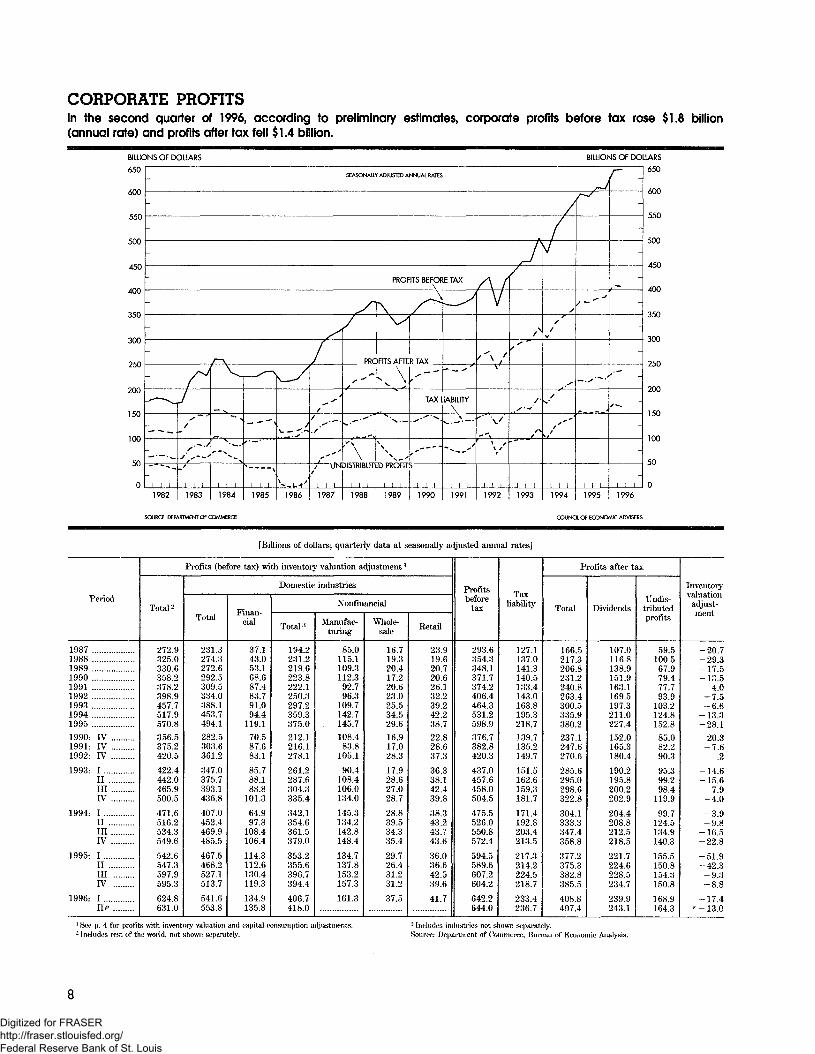
CORPORATE PROFITSIn the second quarter of 1996, according to preliminary estimates, corporate profits before tax rose $1.8 billion(annual rate) and profits after tax fell $1.4 billion.
BILLIONS Of DOLLARS BILLIONS OF DOLLARS
650
600
550
500
450
400
350
300
250
200
150
100
50
0
SEASONAE1Y ADJUSTED ANNUAL RATES
sJ
/
/
J
PROFITS BEFORE TAX /\ /
y
s\1/~^
- — ̂
~ —
~ . ̂
1 1 11982
/
s/
.'•"•'/ -.--'
_/
1 1 i
1983
* •"**~x
1 1 11984
. -̂N
--•">
\
1 I !
1985
^/
/
\_ — •<•"•
N,n'1986^
//
./'
ffr~
,' UN/
i i l1987
/
PRC
s ""
^.**'
"\3ISTRIBUT
I I >
1988
_N,
V
)FITS AFTE
N\
'N. —
\.x
D PROFIT
! ! 1
1989
RTAX
s
TAX
••''" "*'
,'"
S
I 1 I
1990
J
~~ — "̂
JABILITY
l_\\_.
/°*^ •*
1 1 1
1991
V
'V\'
' \/f \ f
\ t
1 1 11992
/
^<s ~~/
/ •S'-*
/\/
i ! 1
1993
7
s
s/
V
^/
r/
1 ! i
1994
/-s
J/ —
'"""•
1 I 11995
r
-
-
-
-
-
-
-,•—
/ —-
-
i i i1996
650
600
550
500
450
400
350
300
250
200
150
100
50
0
SOURCE: DEPARTMENT OF COMMERCE COUNCIL OF ECONOMIC ADVISERS
[Billions of dollars; quarterly data at seasonally acljusted amnial ratesl
Period
198719881989199019911992 ....199319941995
1990: IV1991: IV1992: IV1993- I
IIIllIV
1994: IIIIIIIV
1995: IIIinIV
1996: IHP
Profits (before tax) with inventory valuation adjustment '
Total 2
272.9325.0330.6358.2378.2398.9457.7517.9570.8
356.5375.2420.5
422.4442.0465.9500.5
471.6516.2534.3549.6
542.6547.3597.9595.3
624.8631.0
Domestic industries
Total
231.3274.3272.6292.5309.5334.0388.1453.7494.1
282.5303.6361.2
347.0375.7393.1436.8
407.0452.4469.9485.5
467.5468.2527.1513.7
541.6553.8
Finan-cial
37.143.053.168.687.483.791.094.4
119.1
70.587.683.1
85.788.188.8
101.3
64.997.8
108.4106.4
114.3112.6130.4119.3
134.9135.8
Nonfmancial
Total :'
194.2231.2219.6223.8222.1250.3297.2359.3375.0
212.1216.1278.1
261.2287.6304.3335.4
342.1354.6361.5379.0
353.2355.6396.7394.4
406.7418.0
Manufac-turing
85.0115.1109.3112.3
92.796.3
109.7142.7145.7
108.483.8
105.1
90.4108.4106.0134.0
145.3134.2142.8148.4
134.7137.8153.2157.3
161.3
Whole-sale
16.719.320.417.220.623.025.534.529.6
16.917.028.3
17.928.627.028.7
28.839.534.335.4
29.726.431.231.2
37.5
Retail
23.919.620.720.626.132.239.242.238.7
22.828.637.3
36.338.142.439.8
38.343.243.743.6
36.036.642.539.6
41.7
Profitsbefore
tax
293.6354.3348.1371.7374.2406.4464.3531.2598.9
376.7382.8420.3
437.0457.6458.0504.5
475.5528.0550.8572.4
594.5589.6607.2604.2
642.2644.0
Taxliability
127.1137.0141.3140.5133.4143.0163.8195.3218.7
139.7135.2149.7
151.5162.6159.3181.7
171.4192.8203.4213.5
217.3214.2224.5218.7
233.4236.7
Profits after tax
Total
166.5217.3206.8231.2240.8263.4300.5335.9380.2
237.1247.6270.6
285.6295.0298.6322.8
304.1333.3347.4358.8
377.2375.3382.8385.5
408.8407.4
Dividends
107.0116.8138.9151.9163.1169.5197.3211.0227.4
152.0165.3180.4
190.2195.8200.2202.9
204.4208.8212.5218.5
221.7224.6228.5234.7
239.9243.1
Undis-tributedprofits
59.5100.567.979.477.793.9
103.2124.8152.8
85.082.290.3
95.399.298.4
119.9
99.7124.5134.9140.3
155.5150.8154.3150.8
168.9164.3
Inventoryvaluation
adjust-ment
-20.7-29.3-17.5-13.5
4.0-7.5-6.6
-13.3-28.1
-20.3-7.6
.2
-14.6-15.6
7.9-4.0
-3.9-9.8
-16.5-22.8
-51.9-42.3-9.3-8.8
-17.4'-13.0
1 Sw p, 4 for profits with inventory valuation and capita! consumption ailjustm«nts.2 Includes rest of the world, not shown separately.
:i Includes industries not shown separately.Source: Department of Commerce, Bureau of Economic Analysis.
Digitized for FRASER http://fraser.stlouisfed.org/ Federal Reserve Bank of St. Louis
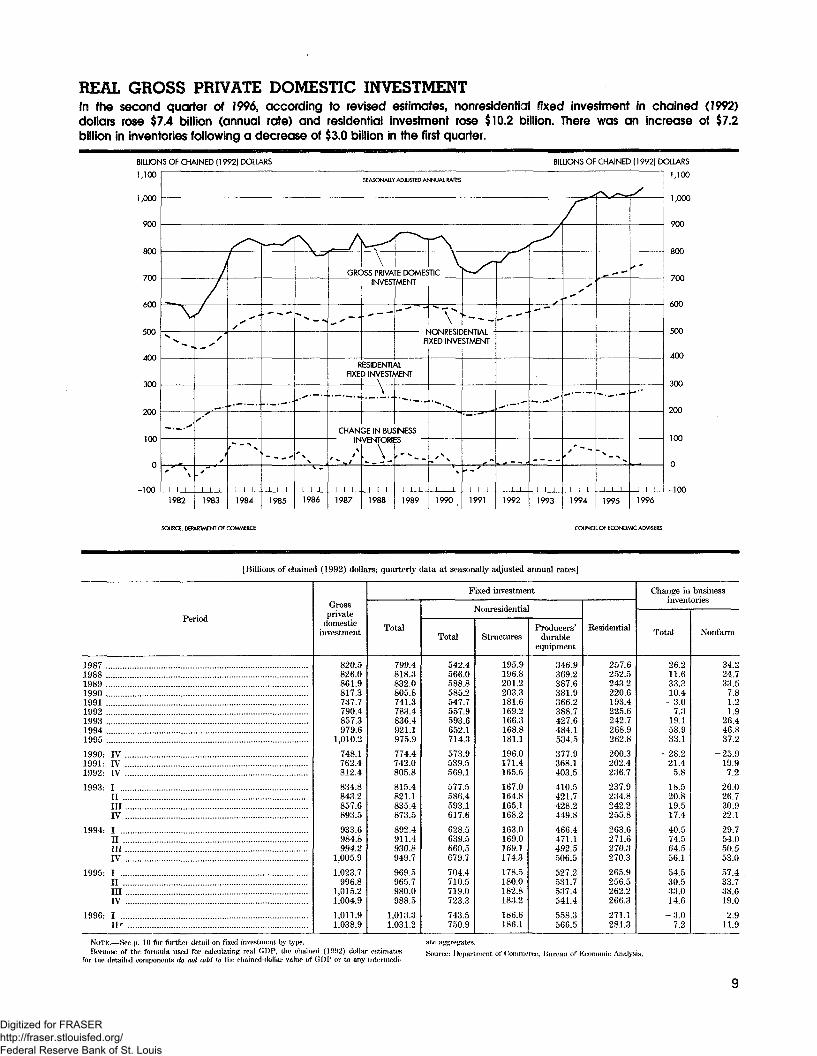
REAL GROSS PRIVATE DOMESTIC INVESTMENTIn the second quarter of 1996, according to revised estimates, nonresidential fixed investment in chained (1992)dollars rose $7.4 billion (annual rate) and residential investment rose $10.2 billion. There was an increase of $7.2billion in inventories following a decrease of $3.0 billion in the First quarter.
BILLIONS OF CHAINED 11992) DOLLARS
1,100
1,000
900
800
700
600
500
400
300
200
100
0
-100
SEASONARY ADJUSTED ANNUAL RATES
^
S^
I
, /
XN.
•V
"
1982
J
/___ s
s*
s
f
1983
/
*> "
s
r --^
1 1 1
1984
r /I
. • —
i
' •• -« - ̂
l i i
1985
[\ _A^T^r\\-s
-*._.^
\\\ w
1 1 11986
GRC
_^~ •
\)SS PRIVA
INVES1
.
"E DOMESMENT
F
RESIDENTIALFIXED INVESTMENT
\
CHAN
\,^ '
i i l
1987
\
3E IN BUSVENTORI
i i i
1988
• — ...
INESS
i i i
1989
VTIC
*Y<•IONRESICXED INVE
•-*,
,'N%,
l ! i
1990
^
STMENT
f __ f
i i i1991
-/
-""'
^._.~
1 ! !
1992
^
"
i l i
1993
r
ss
/ "" —
1994
fV^—
^
** \ — % x
i i i
1995
-/
'-
! 1 !
1996
BILLIONS OF CHAINED (1992) DOLLARS
1,100
1,000
900
800
700
600
500
400
300
200
100
0
-100
SOURCE: DEPARTMENT Of COMMERCE COUNCIL Of ECONOMIC ADVISERS
[Billions of chained (1992) dollars; quarterly data at seasonally adjusted aimual rates]
Period
19871988 .1989199019911992 ..199319941995
1990- IV1991- IV1992- IV
1993- IIIIll .IV
1994- IIIin . ...IV
1995- IIImIV
1996- IIP
Grossprivate
domesticinvestment
820.5826.0861.9817.3737.7790.4857.3979.6
1,010.2
748.1762.4812.4
834.8843.2857.6893.5
933.6984.8994.2
1,005.9
1,023.7996.8
1,015.21,004.9
1,011.91,038.9
Fixed investment
Total
799.4818.3832.0805.8741.3783.4836.4921.1975.9
774.4742.0805.8
815.4821.1835.4873.5
892.4911.4930.8949.7
969.5965.7980.0988.5
1,013.31,031.2
Nonresidential
Total
542.4566.0588.8585.2547.7557.9593.6652.1714.3
573.9539.5569.1
577.5586.4593.1617.6
628.5639.5660.5679.7
704.4710.5719.0723.3
743.5750.9
Structures
195.9196.8201.2203.3181.6169.2166.3168.8181.1
196.0171.4165.6
167.0164.8165.1168.2
163.0169.0169.1174.3
178.5180.0182.8183.2
186.6186.1
Producers'durable
equipment
346.9369.2387.6381.9366.2388.7427.6484.1534.5
377.9368.1403.5
410.5421.7428.2449.8
466.4471.1492.5506.5
527.2531.7537.4541.4
558.3566.5
Residential
257.6252.5243.2220.6193.4225.6242.7268.9262.8
200.3202.4236.7
237.9234.8242.2255.8
263.6271.6270.3270.3
265.9256.5262.2266.3
271.1281.3
Change iu businessinventories
Total
26.211.633.310.4
-3.07.3
19.158.933.1
-28.221.4
5.8
18.520.819.517.4
40.574.564.556.1
54.530.533.014.6
-3.07.2
Nonfarm
34.224.733.5
7.8-1.2
1.926.446.837.2
-25.919.97.2
26.026.730.922.1
29.754.050.553.0
57.433.738.619.0
2.911.9
NOTE.—See p. 10 for further detail on fixed investment by ty|>e.Because of the formula used for ealc-nlating real GDP, the eliained (1992) dollar estimates
for the detailed components do not (i(Ul to the ehained-doltar value of GDP or to any intermedi-Source: Department of (*ornrnerv.e, llureaii of Economic Analysis.
Digitized for FRASER http://fraser.stlouisfed.org/ Federal Reserve Bank of St. Louis
REAL PRIVATE FIXED INVESTMENT BY TYPE[Billions of chained (1992) dollars; quarterly data at seasonally adjusted annual rates]
Period
19871988 .19891990 .19911992 ..19931994 .1995
1990: IV1991: IV1992: IV1993: I
IIinrv
1994: IIIinIV
1995: IIImIV
1996: III'
Nonresident! al
Totalnonresi-dential
542.4566.0588.8585.2547.7557.9593.6652.1714.3
573.9539.5569.1577 5586.4593.1617.6
'6285639.5660.5679.7704.4710.5719.0723.3743.5750.9
Structures
Total '
195.9196.8201.2203.3181.6169.2166.3168.8181.1
196.0171.4165.6167.0164.8165.1168.2163.0169.0169.1174.3178.5180.0182.8183.2186.6186.1
Non-resi-
dentialbuild-ings,
includ-ing
farm
142.4145.3150.2152.0126.9113.2112.8117.7127.9
143.8116.4109.8111.4110.6112.7116.3112.4117.8117.4123.3125.4126.8129.2130.3131.4130.7
Utili-ties
30.730.030.928.132.034.531.131.735.1
28.933.333.932.431.030.730.530.731.232.132.733.734.835.836.036,437.1
Miningexplo-ration,shafts,
andwe s
15.515.813.916.115.713.314.812.611.2
16.314.413.715.215.214.614.213.413.312.211.512.510.711.010.512.812.8
Producers1 durable equipment
Total1
346.9369.2387.6381.9366.2388.7427.6484.1534.5
377.9368.1403.5410.5421.7428.2449.8466.4471.1492.5506.5527.2531.7537.4541.4558.3566.5
Information processingand related equipment
Total
97.5106.6116.2116.2117.8134.2147.1170.4
'201.1
115.7122.5138.9139.5142.2150.7156.0161.2166.6171.6182.4189.1199.7201.4214.4225.5233.7
Com-puters
andpe-
riph-eral
equip-ment 2
21.024.029.429.432.443.956.269.391.5
29.936.647.551.152.958.362.564.567.169.376.380.288.291.9
105.6117.2125.5
Other
80.285.788.188.285.990.291.5
102.6114.2
87.186.291.588.689.693.194.697.8
100.8103.6108.3111.5115.1114.0116.2118.1119.9
In-dus-trial
equip-ment
91.195.3
101.595.088.389.396.3
105.9116.2
91.486.492.693.794.496.3
100.7102.8104.3107.0109.4114.2118.4116.6115.4117.8120.6
Trans-porta-tionand
relatedequip-ment
82.187.178.981.281.786.297.5
111.7118.1
82.881.691.593.099.595.0
102.7109.0105.3115.8116.6121.9114.9120.3115 .4117.5114.5
Residential
Totalresi-den-tial3
257.6252.5243.2220.6193.4225.6242.7268.9262.8
200.3202.4236.7237.9234.8242.2255.8263.6271.6270.3270.3265.9256.5262.2266.3271.1281.3
Structures
Total
251.6246.3237.0214.5187.6219.5236.3262.1255.8
194.4196.6230.5231.7228.5235.7249.2257.0264.8263.5263.2258.9249.6255.3259.3264.1274.1
Singlefamily
128.3126.1121.9110.496.4
116.5'127.1140.5127.7
97.6105.1121.6124.9122.5126.3134.4140.3143.5140.8137.4133.0123.0125.8129.1132.5137.4
Multi-family
28.323.423.319.715.413.110.413.517.6
18.614.211.510.310.010.710.611.212.814.515.616.817.417.818.519.221.0
Other
94.896.891.884.475.789.998.8
108.1110.9
78.177.397.496.596.098.7
104.11054108.4108.2110.4109.3109.8112.2112.4113.0116.3
1 Includes other items, not shown separately.2 Includes new computers and peripheral equipment only.:i includes producers' durable equipment, not shown separately.
NOTE.—Because of the formula used for calculating real GDP, the chained (1992) dollarestimates for the detailed components do not tukl to the chainod-dollar value of GDP or to anyintermediate aggregates.
Sourav. Department of Commerce, Bureau of Kconotmc*. Analysis.
BUSINESS INVESTMENT AND PLANS[Billions of dollars]
Period
1993 '
1994 a
1995:i
1996 4
Totalex-
pendi-tures
489.7
549.9
594.5
603.4
By industry
Total
488.2
547.8
591.7
600.7
Miningandcon-
struc-tion
31.2
36.1
36.0
33.6
Manufacturing
Total
134.1
153.3
172.3
184.8
Dura-ble
goods
66.4
78.9
91.4
100.2
Non-durablegoods
67.7
74.4
80.9
84.6
Trans-porta-tion
30.6
33.3
37.0
35.2
Com-muni-
cations
37.1
41.5
46.0
46.3
Utili-ties
41.3
42.2
42.8
40.6
Whole-saleand
retailtrade
60.3
68.9
75.1
71.9
Fi-nance,insur-ance,andreal
estate
40.2
46.8
57.3
57.7
Serv-ices
111.8
123.5
123.7
129.4
Servingmul-tiple
indus-tries
1.7
2.2
1.5
1.3
Notdistrib-
utedby
indus-try
1.4
2.2
2.8
2.7
1 Estimates collected from the 1993 Annual Capital Hlxpendi turns Survey.2 Revised estimates collected from the 1994 Annual Capital Expenditures Survey. Final data
am scheduled for release in suimner 199(i.3 Revised estimates collected from the March I99ti Investment Plans Survey. Final data will
Ix? available upon release of the 1995 Annual Capital Expenditures Survey.4 Estimates of planned capital expenditures from the March 1996 Investment Plans Survey.
NOTE.—Data for 1994-1996 from Business Investment and Plans released March 28, 1996.Data for 1993 from Annwd Capittd Kxpewliturex: 1<W3.
The Business Investment and Plans release has been discontinued effective with release ofthe March 1996 survey estimates. Estimates of business investment and plans will tx; availableannually with release of the Annual Capital Expenditures Survey.
Sour(*: Department of Commerce, Bureau of the Census.
10
Digitized for FRASER http://fraser.stlouisfed.org/ Federal Reserve Bank of St. Louis
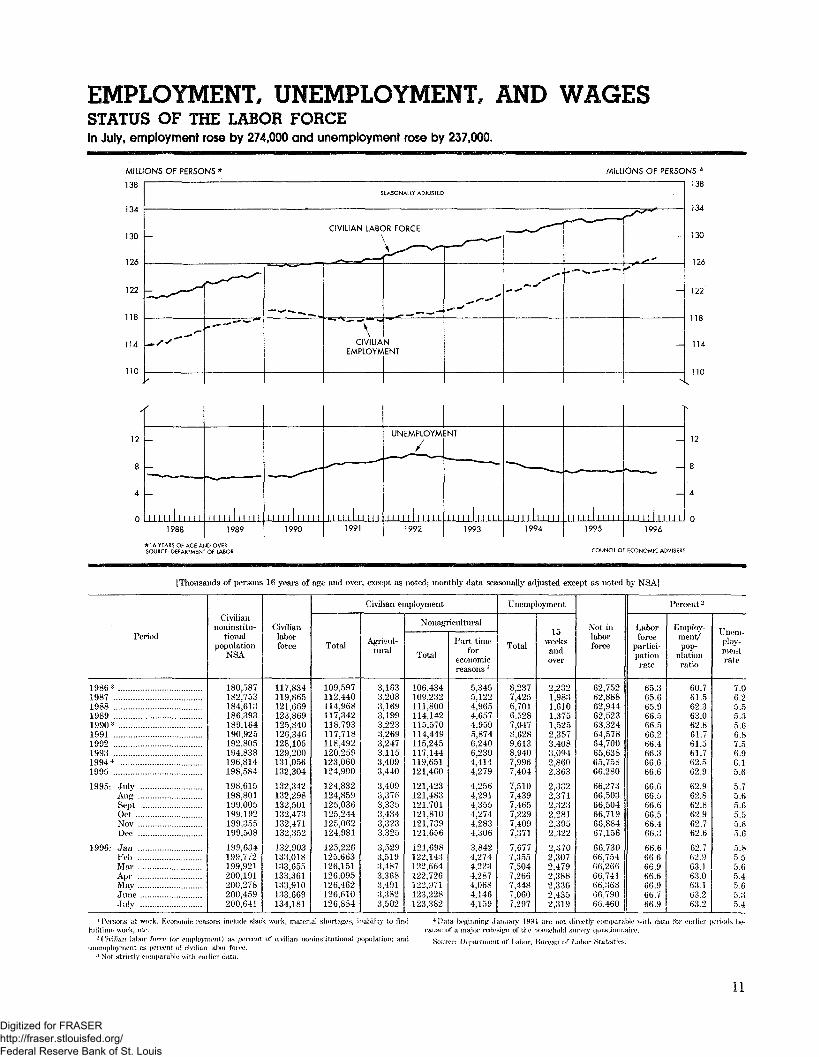
EMPLOYMENT, UNEMPLOYMENT, AND WAGESSTATUS OF THE LABOR FORCEIn July, employment rose by 274,000 and unemployment rose by 237,000.
MILL
138
134
130
126
122
118
114
110
ONS OF PERSONS * MILLIONS OF PERSO
SEASONALLY ADJUSTED
CIVILIAN LABOR FORCE
_)̂ ~1
~~""1
-./•^ "
'
r"~"\\
CIVILIAEMPLOYM
MENT
r"' — "
-'•- "
— x-1
***^4-*S
** -**
~^-^_
-^^+
-
•*
NS*
138
134
130
126
122
118
114
110
SOURCE: DEPARTMENT OF LABOR
1996
COUNCIL OF ECONOMIC ADVISERS
[Thousands of persons 16 years of age and over, except as noted; monthly data seasonally adjusted except as noted by NSA]
Period
1986 3
19871988198919903
199119921993199441995
1995- July
Oct
Dec
1996- JanFeb
AprMavJuneJuly
Civiliannoninstitu-
tionalpopulation
NSA
180,587182,753184,613186,393189,164190,925192,805194,838196,814198,584
198,615198,801199,005199,192199,355199,508
199,634199,772199,921200,101200,278200,459200,641
Civilianlaborforce
117,834119,865121,669123,869125,840126,346128,105129,200131,056132,304
132,342132,298132,501132,473132,471132,352
132,903133,018133,655133,361133,910133,669134,181
Civilian employment
Total
109,597112,440114,968117,342118,793117,718118,492120,259123,060124,900
124,832124,859125,036125,244125,062124,981
125,226125,663126,151126,095126,462126,610126,884
Agricul-tural
3,1633,2083,1693,1993,2233,2693,2473,1153,4093,440
3,4093,3763,3353,4343,3233,325
3,5293,5193,4873,3683,4913.3823,502
Nonagrieultural
Total
106,434109,232111,800114,142115,570114,449115,245117,144119,651121,460
121,423121,483121,701121,810121,739121,656
121.698122,143122,664122,726122,971123,228123,382
Part timefor
economicreasons *
5,3455.1224,9654,6574,9505,8746,2406,2304,4144,279
4,2564,2914,3554,2744,2834,306
3,8424,2744,2234,2874.0684,1464,159
Unemployment
Total
8,2377,4256,7016,5287,0478,6289,6138,9407,9967,404
7,5107,4397,4657.2297,4097,371
7,6777,3557,5047,2667,4487.0607,297
15weeks
andover
2,2321,9831,6101,3751,5252,3573,4083,0942,8602,363
2,3322,3712,3232.2812,3052,322
2,3702,3072,4792,3882,3362,4352,319
Not inlaborforce
62,75262,88862,94462,52363,32464,57864,70065,63865,75866,280
66,27366,50366,50466,71966,88467,156
66,73066,75466,26666,74166,36866,79066.460
Percent -'
Laborforce
partici-pationrate
65.365.665.966.566.566.266.466.366.666.6
66.666.566.666.566.466.3
66.666.666.966.666.966.766.9
Employ-ment/pop-
ulationratio
60.761.562.363.062.861.761.561.762.562.9
62.962.862.862.962.762.6
62.762.963.163.063.163.263.2
Unem-ploy-mentrate
7.06.25.55.35.66.87.56.96.15.6
5.75.65.65.55.65.6
5.85.55.65.45.65.35.4
1 Persons at work. Economic reasons inc.iude slack work, material shortages, inability to findfull time work, etc.
-Civilian Ja!x)r f»m> (or employment) its persist of civilian noni restitution si population; andunemployment as percent of civilian labor force.
;f Not strictly comparable with earlier data.
4 Data beginning January 1994 are not directly comparable with data for earlier periods IHScause of a major rodesi^i of the household survey questionnaire.
Source: Department of Labor, Bureau of Labor Statistic.
11
Digitized for FRASER http://fraser.stlouisfed.org/ Federal Reserve Bank of St. Louis
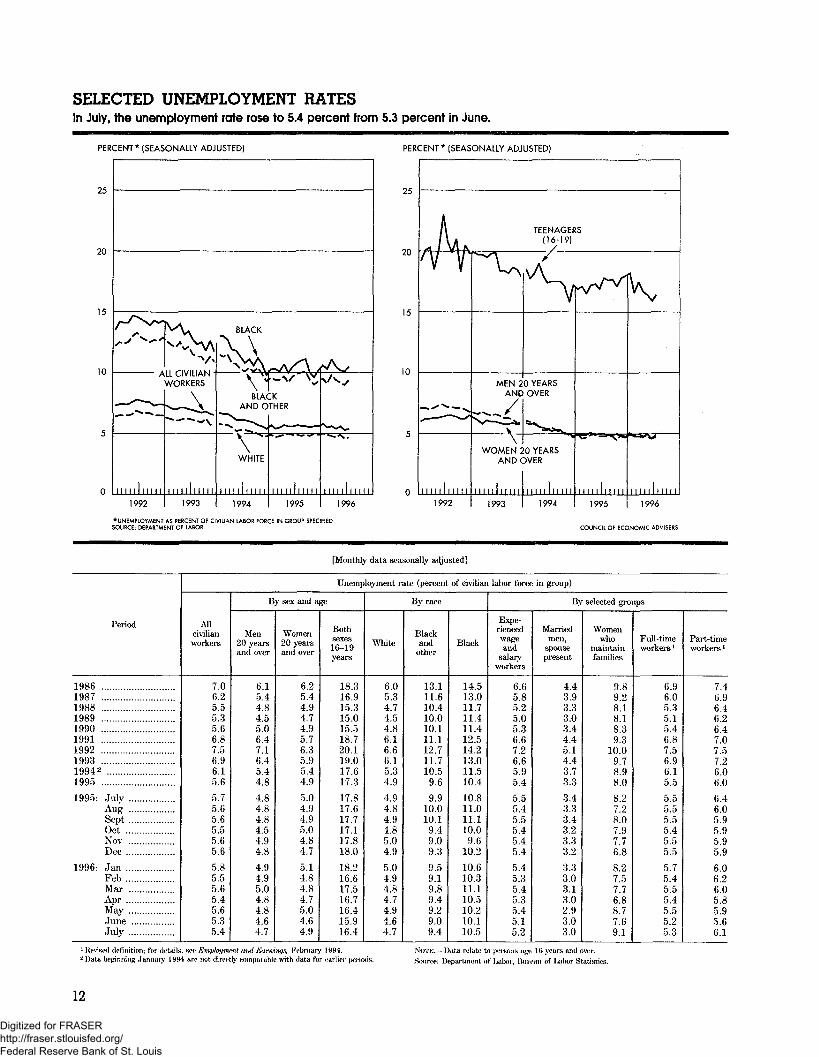
SELECTED UNEMPLOYMENT RATESIn July, the unemployment rote rose to 5.4 percent from 5.3 percent in June.
PERCENT* (SEASONALLY ADJUSTED) PERCENT* (SEASONALLY ADJUSTED)
10
1992 1996 1992
UNEMPLOYMENT AS PERCENT OF CIVILIAN LABOR FORCE IN GROUP SPECIFIEDSOURCE: DEPARTMENT OF LABOR COUNCIL OF ECONOMIC ADVISERS
[Monthly data seasonally adjusted]
Period
19861987198819891990 ...199119921993 . .19942
19951995: July
Aucr
SeptOct ...NovDec
1996- JanFebMar .AprMayJuneJuly ...
Unemployment rate (percent of civilian labor force in group)
Allcivilianworkers
7.06.25.55.35.66.87.56.96.15.6
5.75.65.65.55.65.6
5.85.55.65.45.65.35.4
By sex and age
Men20 yearsand over
6.15.44.84.55.06.47.16.45.44.8
4.84.84.84.54.94.8
4.94.95.04.84.84.64.7
Women20 yearsand over
6.25.44.94.74.95.76.35.95.44.9
5.04.94.95.04.84.7
5.14.84.84.75.04.64.9
Bothsexes16-19years
18.316.915.315.015.518.720.119.017.617.3
17.817.617.717.117.818.0
18.216.617.516.716.415.916.4
By race
White
6.05.34.74.54.86.16.66.15.34.94.94.84.94.85.04.9
5.04.94.84.74.94.64.7
Blackand
other
13.111.610.410.010.111.112.711.710.59.6
9.910.010.19.49.09.3
9.59.19.89.49.29.09.4
Black
14.513.011.711.411.412.514.213.011.510.4
10.811.011.110.0
9.610.2
10.610.311.110.510.210.110.5
By selected groups
Expe-riencedwageand
salaryworkers
6.65.85.25.05.36.67.26.65.95.4
5.55.45.55.45.45.4
5.45.35.45.35.45.15.2
Marriedmen,
spousepresent
4.43.93.33.03.44.45.14.43.73.3
3.43.33.43.23.33.2
3.33.03.13.02.93.03.0
Womenwho
maintainfamilies
9.89.28.18.18.39.3
10.09.78.98.0
8.27.28.07.97.76.8
8.27.57.76.88.77.69.1
Pull-timeworkers ]
6.96.05.35.15.46.87.56.96.15.5
5.55.55.55.45.55.5
5.75.45.55.45.55.25.3
Part-timeworkers '
7.46.96.46.26.47.07.57.26.06.06.46.05.95.95.95.9
6.06.26.05.85.95.66.1
1 Revised definition; for details, see Emphnfnumt awl Kamintjs, February 1994.2 Data beginning January 1994 are not directly comparable with data for earlier periods.
NOTE.—Data relate to persons age 16 years and over.
Source: Department of Lalior, Bureau of Ijalior Statistics.
12
Digitized for FRASER http://fraser.stlouisfed.org/ Federal Reserve Bank of St. Louis
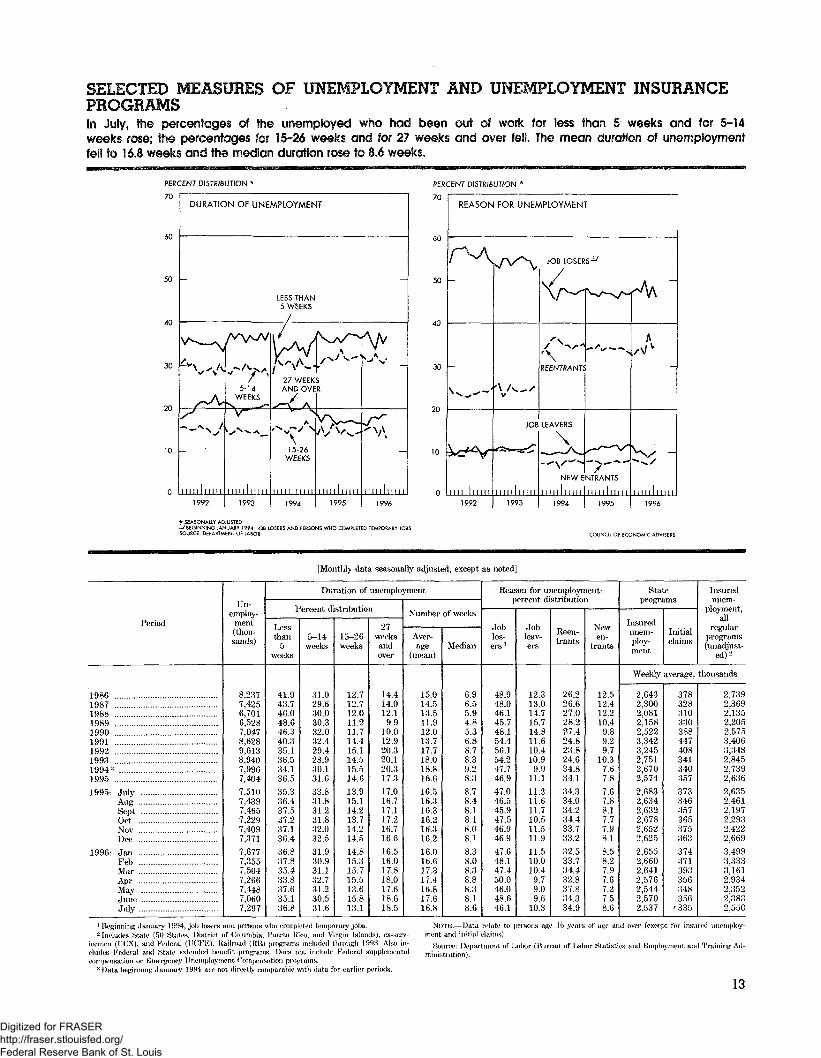
SELECTED MEASURES OF UNEMPLOYMENT AND UNEMPLOYMENT INSURANCEPROGRAMSIn Juiy, the percentages of the unemployed who had been out of work for less than 5 weeks and for 5-14weeks rose; the percentages for 15-26 weeks and for 27 weeks and over feli. The mean duration of unemploymentfell to 16.8 weeks and the median duration rose to 8.6 weeks.
PERCENT DISTRIBUTION
70
50 -
PERCENT DI57RI8UTION '
70
60
- 50
40
P-A
20
- 10
REASON FOR UNEMPLOYMENT
1992
* SEASONAiLY ADJUSTEDI/BEGINNING JANUARY 1994 JOB IOSERS AND PERSONS WHO COMPUTED TEMPOHARY JOBSSOURCE; DEPARTMENT OF LABOR
JOB LOSERS-^
/ X-NX-''\REENTRANTS
JOB LEAVERS
\
NEW ENTRANTS
I l l l l l l l l l
1994
COUNCIl OF ECONOMIC ADVISERS
[Monthly data seasonally adjusted, except as noted]
Period
198619871988198919901991199219931994;i .1995
1995- July
SeptOct
Dec
1996- JanFebMar
May
Julv
Un-employ-
ment(thou-sands)
8,2377,4256,7016,5287,0478,6289,6138,9407,9967,404
7,5107,4397,4657,2297,4097,371
7,6777,3557,5047,2667,4487,0607,297
Duration of unemployment
Percent distribution
Lessthan
5weeks
41.943.746.048.646,340.335.136.534.136.5
35.336.437.537.237.136.4
36.837.835.433.837.635.136.8
5-14weeks
31.029.630.030.332.032.429.428.930.131.6
33.831.831.231.832.032.5
31.930.931.132.731.230.531.6
15-26weeks
12.712.712.011.211.714.415.114.515.514.6
13.915.114.213.714.214.5
14.815.315.715.513.615.813.1
27weeksandover
14.414.012.19.9
10.012.920.320.120.317.3
17.016.717.117.216.71K.6
16.516.017.818.017.618.618.5
Number of weeks
Aver-age
(mean)
15.014.513.511.912.013.717.718.018.816.6
16.516.316.316.216.316.2
16.016.617.317.416.817.616.8
Median
6.96.55.94.85.36.88.78.39.28.3
8.78.48.18.18.08.1
8.38.08.38.88.38.18.6
Reason for unemployment:percent distribution
Joblos-ers '
48.948.046.145.748.154.456.154.247.746.9
47.046.545.947.546.946.9
47.648.147.450.046.048.646.1
Jobleav-ers
12.313.014.715.714.811.610.410.99.9
11.1
11.211.611.710.511.511.9
11.510.010.4
9.79.09.6
10.3
Reen-trants
26.226.627.028.227.424.823.824.634.834.1
34.334.034.234.433.733.2
32.533.734.432.837.834.334.9
Newen-
trants
12.512.412.210.49.89.29.7
10.37.67.8
7.67.88.17.77.98.1
8.58.27.97.67.27.58.6
Stateprograms
Insuredunem-ploy-ment
Initialclaims
Insuredunem-
ployment,all
regularprograms(unadjust-
ed)2
Weekly average, thousands
2,6432,3002,0812,1582,5223,3423,2452,7512,6702,574
2,6832,6342,6322,6782,6522,625
2,6552,6602,6412,5762,5442,5702.537
378328310330388447408341340357
373346357365375363
374371393356348356
'335
2,7392,3692,1352,2052,5753,4063,3482,8452,7392,636
2,6352,4612,1972,2932,4222,669
3,4993,3333,1612,9342,3522,3832,550
1 Beginning January 1994, job losers and [X^rsons who completed temjwrary jobs,'2 Includes State (50 States, District of Columbia, Puerto Rico, and Virgin Islands), ox-serv-
icemen (UCX), and Federal (UOFE). Railroad (RR) programs included through 199:1 Also in-cludes Federal am! State extended I>erier1t programs. Does not include Federal supplementalcompensation or Kmi'rjjoncy Unemployment Compensation programs.
3 Data Iwgirming January 1994 are not- directly comparable with data for earlier periods.
NOTE.—Data relate to persons age If i years of age and over (except for insured unemploy-ment and initial claims).
Source: Department of Labor (Bureau of Labor Statistics and Employment and Training Ad-ministration).
13
Digitized for FRASER http://fraser.stlouisfed.org/ Federal Reserve Bank of St. Louis
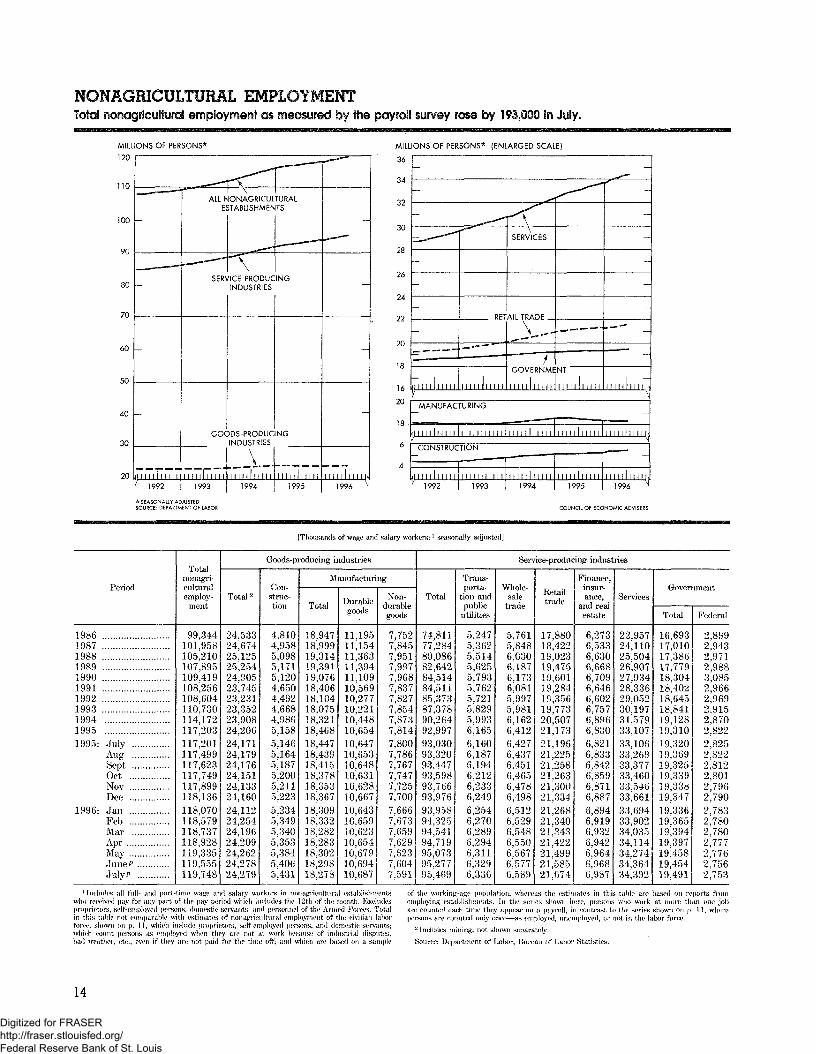
NONAGRICULTURAL EMPLOYMENTTotal nonagricuSfura! employment as measured by the payroll survey rose by 193,000 in Ju!y.
MILLIONS OF PERSONS*
120
110
70
60
50
30
20 iTm1992
SERVICE-PRODUCINGINDUSTRIES
GOODS-PRODUCINGINDUSTRIES
A..1995
MILLIONS OF PERSONS* (ENLARGED SCALE)
SERVICES
RETAIL TRADE .
GOVERNMENT "
II I II I II I I II I II
MANUFACTURING
CONSTRUCTION
1993 1994 1995 1996
COUNCIL OF ECONOMIC ADVISERS
[Thousands of wage and salary workers;' seasonally adjusted]
Period
19861987198819891990 .. .199119921993199419951995: July
SeptOctMen-Dec
1996- JanFebMar
May
Julvf
Totalnonagri-culturalemploy-
ment
99,344101,958105,210107,895109,419108,256108,604110,730114,172117,203117,201117,499117,623117,749117,899118,136118,070118,579118,737118,928119,335119,555119,748
Goods-producing industries
Total2
24,53324,67425.12525,25424,90523,74523,23123,35223,90824,20624,17124,17924,17624,15124,13324,16024,11224,25424,19624.20924,26224,27824,279
Con-struc-tion
4,8104,9585,0985,1715,1204,6504,4924,6684,9865,1585,1465,1645,1875,2005,2115,2235,2345,3495,3405,3535,3845,4065,431
Manufacturing
Total
18,94718,99919,31419,39119,07618,40618,10418,07518,32118,46818,44718,43918,41518,37818,35318,36718,30918,33218,28218,28318,30218,29818.278
Durablegoods
11,19511,15411,36311,39411,10910,56910,27710,22110,44810,65410,64710,65310,64810,63110,62810,66710,64310,65910,62310,65410,67910,69410,687
Non-durablegoods
7,7527,8457,9517,9977,9687,8377,8277,8547,8737,8147,8007,7867,7677,7477,7257,7007,6667,6737,6597,6297,6237,6047,591
Service-producing industries
Total
74,81177.28480,08682,64284,51484,51185,37387,37890,26492,99793,03093,32093,44793,59893,76693,97693,95894,32594,54194,71995,07395,27795,469
Trans-porta-
tion andpublic
utilities
5,2475,3625,5145,6255,7935,7625,7215,8295,9936,1656,1606,1876,1946,2126,2336,2496,2546,2706,2896,2946,3116,3296,336
Whole-sale
trade
5,7615,8486,0306,1876,1736,0815,9975,9816,1626,4126,4276,4376,4516,4656,4786,4986,5126,5296,5486,5506,5676,5776,589
Retailtrade
17,88018,42219,02319,47519,60119,28419,35619,77320,50721,17321.19621,22521,25821,26321.30021,33421,26821,34021,34321,42221,49921,58521,674
Finance,insur-ance,
and realestate
6,2736,5336,6306,6686,7096,6466,6026,7576,8966,8306,8216,8336,8426,8596,8716,8876,8946,9196,9326,9426,9646,9686,987
Services
22,95724,11025,50426,90727,93428,33629,05230,19731,57933,10733,10633,26933,37733,46033,54633,66133,69433,90234,03534,11434,27434.36434^392
Government
Total
16,69317,01017,38617,77918,30418,40218,64518,84119,12819,31019,32019,36919,32519,33919,33819,34719,33619,36519,39419,39719,45819,45419,491
Federal
2,8992,9432,9712,9883,0852,9662,9692,9152,8702,8222,8252,8222,8122,8012,7962,7902,7832,7802,7802,7772,7762,7562,753
Includes all ful l - and part-time wage and salary workers in nona£ncultura establishments) received pay for any part of the pay period which includes the 12th of the month. Exe. udcsprietors, self-employed persons, domestic servants, and personne of the Armed Forces. Totalhis table not comparable with estimates of nona£nc.ultnra] employment of the civilian H!XH--e. shown on p. 11, which include proprietors, self-employed persons, and domestic servants;eh count persons as employe,! when they are not at work l,ecause of in, ustrial disputes,weather. eUr., even if they are not paid for the time off; arid wi ich are based on a sample
of the working-age population, whereas the estimates in this table are based on reports fromemploying establishments. In the series shown here, persons who work at more than one jobare counted each time they appear on a payroll, in contrast to the series shown on p. 11, wherepersons are counted oniy once—as employed, unemployed, or not in the lalx>r force.
- Includes mining, not shown separately.
Source: Department of Labor, Bureau of Labor Statistics.
14
Digitized for FRASER http://fraser.stlouisfed.org/ Federal Reserve Bank of St. Louis
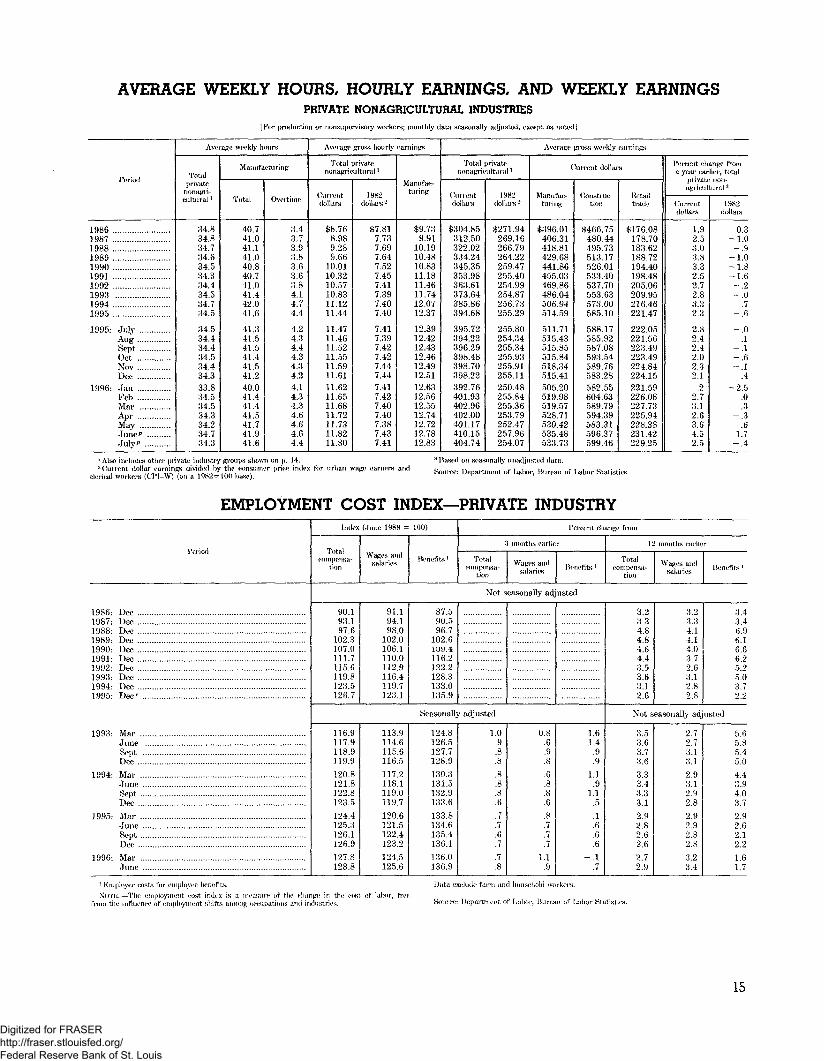
AVERAGE WEEKLY HOURS, HOURLY EARNINGS. AND WEEKLY EARNINGSPRIVATE NONAGRICULTUHAL INDUSTRIES
| For production or non-supervisory workers; monthly data seasonally adjusted, except as noted |
Period
198619871988198919901991 . ..199219931994 . . . . . .1995
1995: July
SeptOctNovDec
1996- JanPebMar
Jiilv**
Average weekly hours
Totalprivate
nonagri-cultural !
34.834.834.734.634.534.334.434.534.734.5
34.534.434.434.534.434.333.834.534.534.334.234.734.3
Manufacturing
Total
40.741.041.141.040.840.741.041.442.041.6
41.341.541.541.441.541.240.041.441.441.541.741.941.6
Overtime
3.43.73.93.83.63.63.84.14.74.4
4.24.34.44.34.34.24.14.34.34.64.64.64.4
Average gross hourly earnings
Total >rivatenonagrieultural '
Currentdollars
$8.768.989.289.66
10.0110.3210.5710.8311.1211.44
11.4711.4611.5211.5511.5911.6111.6211.6511.6811.7211.7311.8211.80
1982dollars'2
$7.817.737.697.647.527.457.417.397.407.40
7.417.397.427.427.447.447.417.427.407.407.387.437.41
Manufac-turing
$9.739.91
10.1910.4810.8311.1811.4611.7412.0712.37
12.3912.4212.4312.4612.4912.5112.6312.5612.5512.7412.7212.7812.83
Average gross weekly earning
Total mvatenonagricultural l
Currentdollars
$304.85312.50322.02334.24345.35353.98363.61373.64385.86394.68
395.72394.22396.29398.48398.70398.22392.76401.93402.96402.00401.17410.15404.74
1982dollars2
$271.94269.16266.79264.22259.47255.40254.99254.87256.73255.29
255.80254.34255.34255.93255.91255.11250.48255.84255.36253.79252.47257.96254.07
Current dollars
Manufac-turing
$396.01406.31418.81429.68441.86455.03469.86486.04506.94514.59
511.71515.43515.85515.84518.34515.41505.20519.98519.57528.71530.42535.48533.73
Construc-tion
$466.75480.44495.73513.17526.01533.40537.70553.63573.00585.10
588.17585.92587.08593.54589.76583.28582.55604.63589.79594.39583.31596.37599.46
Ifctailtrade
$176.08178.70183.62188.72194.40198.48205.06209.95216.46221.47
222.05221.56223.49223.49224.84224.15221.59226.08227.73225.94228.38231.42229.25
Percent change froma year earlier, total
private non-agricultural :i
Currentdollars
1.92.53.03.83.32.52.72.83.32.3
2.82.42.42.02.32.1
.22.73.12.63.64.52.5
1982dollars
0.3-1.0-.9
-1.0-1.8-1.6_ 2-.0
.7-.6
-.0-.1-.1-.6
1
-A-2.5
.0
.3O
.61.7-.4
1 Also indudes other private industry groups shown on p. 14.2 Current dollar earnings divided by the consumer price index ft>r urban wajw earners and
clerical workers (CP1-W) (on a 19S2=100 base).
;1 Based on seasonally unadjusted data.
Source: Department of Lalx>r, Bureau of Labor Statistics.
EMPLOYMENT COST INDEX—PRIVATE INDUSTRY
Period
1986- Dec1987- Deo1988- Dec .iqgq. Dec1990- Dec .1991- Dec1992- Dec1993- Dec1994- Dec1995- Dec7"
1993- Mar
Sept ...Dec
1994- Mar
SeptDec
1995- Mar
SeptDec
1996- Mar
Index (June 1989 = 10(1)
Totalcompensa-
tion
Wages aridsalaries Benefits '
Percent change fi-om
8 months earlier
Totalcompensa-
tion
Wages andsalaries Benefits '
12 montiis earlier
Totalcompensa-
tion
Wages aridsalaries Benefits'
Not seasonally adjusted
90.193.197.6
102.3107.0111.7115.6119.8123.5126.7
91.194.198.0
102.0106.1110.0112.9116.4119.7123.1
87.590.596.7
102.6109.4116.2322.2128.3133.0135.9
Seasonally adjusted
116.9117.9118.9119.9
120.8121.8122.8123.5
124.4125.3]26.1126.9
127.8128.8
113.9114.6115.6116.5
117.2118.1119.0119.7
120.6121.5122.4123.2
124.5125.6
124.8126.5127.7128.9
130.3131.5132.9133.6
133.8134.6135.4136.1
136.0136.9
1.0.9.8.8
.8
.8
.8
.6
.7
.7
.6
.7
.7
.8
0.8.6.9.8
.6
.8
.8
.6
.8
.7
.7
.7
1.1.9
1.61.4.9.9
1.1.9
1.1.5
.1
.6
.6
.6i
3.23.34.84.84.64.43.53.63.12.6
3.23.34.14.14.03.72.63.12.82.8
3.43.46.96.16 66.25.25.03.72.2
Not seasonally adjusted
3.53.63.73.6
3.33.43.33.1
2.92.82.62.6
2.72.9
2.72.73.13.1
2.93.12 92.8
2.92.92.82.8
3.23.4
5.65.85.45.0
4.43.94.03.7
2.92.62.12.2
1.61.7
! Employer costs for employee l>enefits.
NOTE.—The employment cost index is a measure of thefrom the influence of employment shifts antorif j occupations ai
Huinge in the cost, of la!>ord industries.
Data exclude farm and household worker's.
Source: Department of Ijalx>r, Bureau of Labor Statistic
15
Digitized for FRASER http://fraser.stlouisfed.org/ Federal Reserve Bank of St. Louis
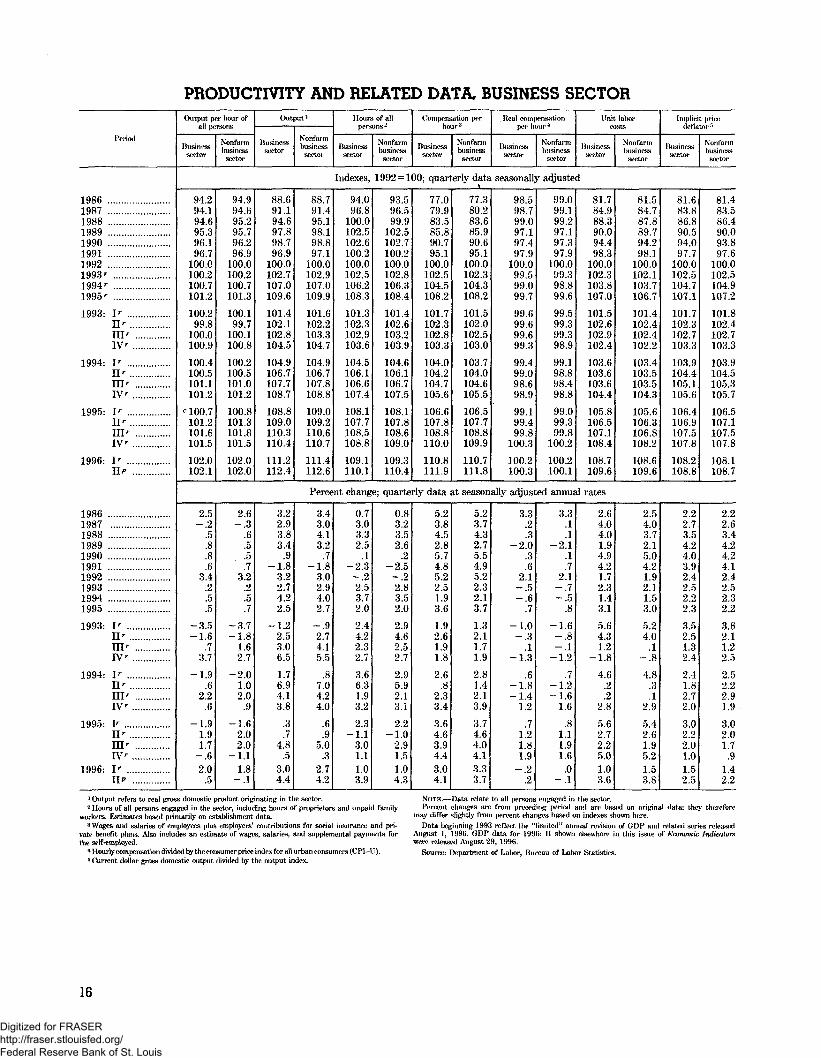
PRODUCTIVITY AND RELATED DATA, BUSINESS SECTOR
Period
19861987198819891990199119921993 r
1994r
1995 r
1993- \r
IPIIPTVr
1994- lr
II r
IIPIVr
1995- Ir
II 'HPIV'
1996- lr
UP
1986198719881989199019911992199319941995
1993- lr
Hr
HPIV '
1994- PII "IIPrv>
1995- lr
IPHPWr
1996- PHP
Output per hour ofall persons
Businesssector
Nonfannbusinesssector
Output'
Businesssector
Nonfarmbusinesssector
Hours of allpersons2
Businesssector
Nonfarmbusinesssector
Compensation perhour3
Businesssector
Nonfarmbusinesssector
Real compensationper hour4
Businesssector
Nonfarmbusiness
sector
Unit laborcosts
Businesssector
Nonfarmbusinesssector
Implicit pricedeflator 5
Businesssector
Nonfarmbusinesssector
Indexes, 1992=100; quarterly data seasonally adjusted\
94.294.194.695.396.196.7
100.0100.2100.7101.2
100.299.8
100.0100.9
100.4100.5101.1101.2
c 100.7101.2101.6101.5
102.0102.1
94.994.695.295.796.296.9
100.0100.2100.7101.3
100.199.7
100.1100.8
100.2100.5101.0101.2
100.8101.3101.8101.5
102.0102.0
88.691.194.697.898.796.9
100.0102.7107.0109.6
101.4102.1102.8104.5
104.9106.7107.7108.7
108.8109.0110.3110.4
111.2112.4
88.791.495.198.198.897.1
100.0102.9107.0109.9
101.6102.2103.3104.7
104.9106.7107.8108.8
109.0109.2110.6110.7
111.4112.6
94.096.8
100.0102.5102.6100.2100.0102.5106.2108.3
101.3102.3102.9103.6
104.5106.1106.6107.4
108.1107.7108.5108.8
109.1110.1
93.596.599.9
102.5102.7100.2100.0102.8106.3108.4
101.4102.6103.2103.9
104.6106.1106.7107.5
108.1107.8108.6109.0
109.3110.4
77.079.983.585.890.795.1
100.0102.5104.5108.2
101.7102.3102.8103.3
104.0104.2104.7105.6
106.6107.8108.8110.0
110.8111.9
77.380.283.685.990.695.1
100.0102.3104.3108.2
101.5102.0102.5103.0
103.7104.0104.6105.5
106.5107.7108.8109.9
110.7111.8
98.598.799.097.197.497.9
100.099.599.099.7
99.699.699.699.3
99.499.098.698.9
99.199.499.8
100.3
100.2100.3
99.099.199.297.197.397.9
100.099.398.899.6
99.599.399.398.9
99.198.898.498.8
99.099.399.8
100.2
100.2100.1
81.784.988.390.094.498.3
100.0102.3103.8107.0
101.5102.6102.9102.4
103.6103.6103.6104.4
105.8106.5107.1108.4
108.7109.6
81.584.787.889.794.298.1
100.0102.1103.7106.7
101.4102.4102.4102.2
103.4103.5103.5104.3
105.6106.3106.8108.2
108.6109.6
81.683.886.890.594.097.7
100.0102.5104.7107.1
101.7102.3102.7103.3
103.9104.4105.1105.6
106.4106.9107.5107.8
108.2108.8
81.483.586.490.093.897.6
100.0102.5104.9107.2
101.8102.4102.7103.3
103.9104.5105.3105.7
106.5107.1107.5107.8
108.1108.7
Percent change; quarterly data at seasonally adjusted annual rates
2.5-.2
.5
.8
.8
.63.4
.2
.5
.5
-3.5-1.6
.73.7
-1.9.6
2.2.6
-1.91.91.7
-.62.0
.5
2.6-.3
.6
.5
.5
.73.2
.2
.5
.7
-3.7-1.8
1.62.7
-2.01.02.0
.9
-1.62.02.0
-1.11.8-.1
3.22.93.83.4
.9-1.8
3.22.74.22.5
-1.22.53.06.5
1.76.94.13.8
.3
.74.8
.53.04.4
3.43.04.13.2
.7-1.8
3.02.94.02.7
-.92.74.15.5
.87.04.24.0
.6
.95.0
.32.74.2
0.73.03.32.5.1
-2.3_ 22.53.72.0
2.44.22.32.7
3.66.31.93.2
2.3-1.1
3.01.11.03.9
0.83.23.52.6
.2-2.5-.22.83.52.0
2.94.62.52.7
2.95.92.13.1
2.2-1.0
2.91.51.04.3
5.23.84.52.85.74.85.22.51.93.6
1.92.61.91.8
2.6.8
2.33.4
3.64.63.94.43.04.1
5.23.74.32.75.54.95.22.32.13.7
1.32.11.71.9
2.81.42.13.9
3.74.64.04.13.33.7
3.3.2.3
-2.0.3.6
2.1-.5-.6
.7
-1.00
.1-1.3
.6-1.8-1.4
1.2
.71.21.81.9
9
.2
3.3.1.1
-2.1.1.7
2.1ij
-.5.8
-1.6-.8-.1
-1.2
.7-1.2-1.6
1.6
.81.11.91.6.0
-.1
2.64.04.01.94.94.21.72.31.43.1
5.64.31.2
-1.8
4.6.2.2
2.8
5.62.72.25.01.03.6
2.54.03.72.15.04.21.92.11.53.0
5.24.0
.1Q
.O
4.8.3.1
2.9
5.42.61.95.21.53.8
2.22.73.54.24.03.92.42.52.22.3
3.52.51.32.4
2.41.82.72.0
3.02.22.01.01.52.5
2.22.63.44.24.24.12.42.52.32.2
3.82.11.22.5
2.52.22.91.9
3.02.01.7
.91.42.2
1 Output refers to real gross domestic product originating in the sector.2 Hours of all persons engaged in the sector, including hours of proprietors and unpaid family
workers. Estimates based primarily on establishment data.3 Wages and salaries of employees plus employers' contributions for social insurance and pri-
vate benefit plans. Also includes an estimate of wages, salaries, and supplemental payments forthe self-employed.
4 Hourly compensation divided by the consumer price index for all urban consumers (CP1-U).5 Current dollar gross domestic output divided by the output index.
NOTE.—Data relate to all persons engaged in the sector.Percent changes are from preceding j>eriod and are based on original data; they therefore
may differ slightly from percent changes based on indexes shown here.Data beginning 1993 reflect the "limited" annual revision of GDI* and related series released
August 1, 1996. GDP data for 1996: II shown elsewhere in this issue of Economic Ii\dicfit0rswere released August 29, 1996.
Source: Department of Ijabor, Bureau of Ijabor Statistics.
16
Digitized for FRASER http://fraser.stlouisfed.org/ Federal Reserve Bank of St. Louis
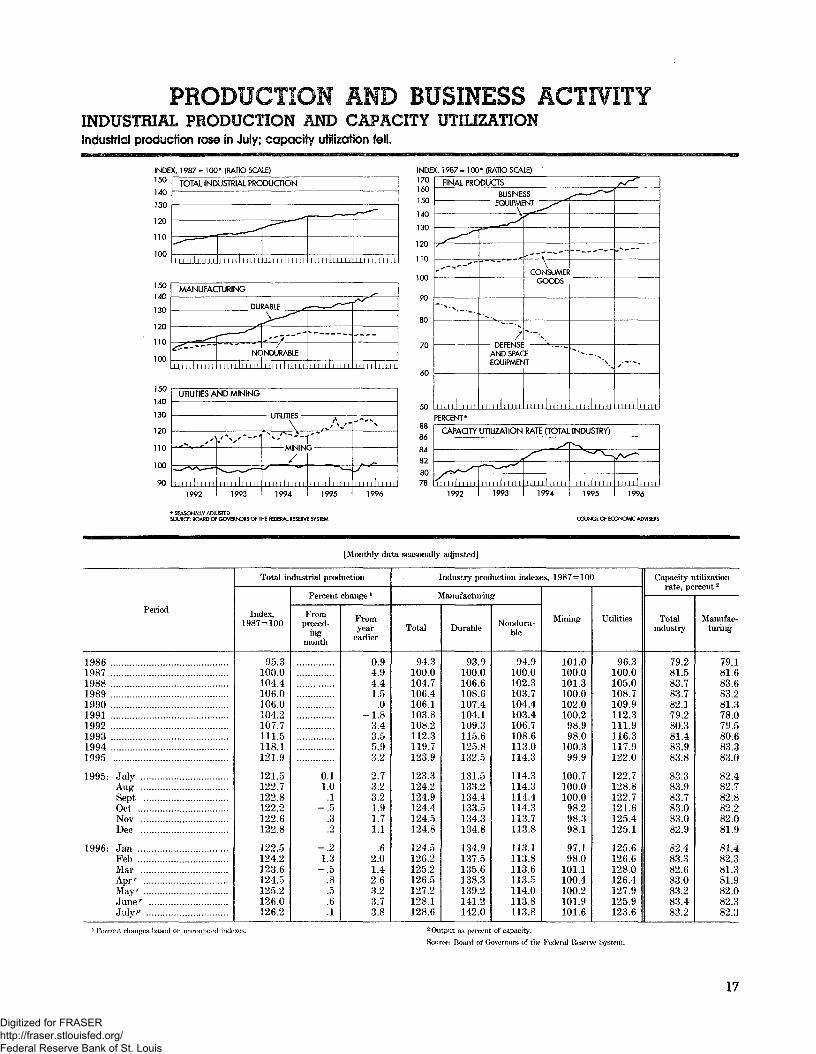
AND ACTIVITYINDUSTRIAL PRODUCTION AND CAPACITY UTILIZATIONIndustrial production rose in July; capacity utilization fell.
INDEX, 1987= 100* (RATIO SCALE)150
100
TOTAL INDUSTRIAL PRODUCTION
-""
1 1 1 1 1 i 1 1 1 1 1
. -i
1 1 1 H i n 1 1 1
^-- —
1 1 M 1 1 II I 1 1
.
1 1 1 1 1 M 1 1 II
f~^~
1 1 1 1 1 1 1 II I 1
120
110
100
130
120
110
90
MANUFACTURING
DURABLE
NONDURABLE
UTILITIES AND MINING
\ .,/V1s*
^^^ —
I I M H 1 1 1 1 1
1992
,'X'"-"1
•V .- —1
1993
|J1 - T"
/y •*•"
I 1 1 it 1 1 1 1 1 11994
1 1 1 I l l l MM
1995
,»^»*NV
s
1996
INDEX, 1987 - 100' (RATIO SCALE)170160150
140
130
120
110
100
90
60
FINAL PRODUCTS /^"BUSINESS ^
tUUIFMENT sS^"
__^-
^_^-^~
^~ ̂ f- — *"
"'"•••v
M i l l i l l 1 1
"/
'
CONSUMERGOODS
"x
AND SPACEEQUIPMENT
r~~^^
's
!
/' """
PERCENT-
CAPACITY UTILIZATION RATE (TOTAL INDUSTRY)
1992 1996
COUNCIL OF ECONOMIC ADVISERS
[Monthly data seasonally adjusted]
Period
198619871988 .19891990 . .199119921993 ....19941995
1995- July
SeptOctNovDec . . .
1996- JanFebMar
MayJune r
July?
Total industrial production
Index,1987=100
95.3100.0104.4106.0106.0104.2107.7111.5118.1121.9
121.5122.7122.8122.2122.6122.8
122.5124.2123.6124.5125.2126.0126.2
Percent change '
Frompreced-
ingmonth
0.11.0.1.t)
.3
.2
-.21.3-.5
.8
.5
.6
.1
Fromyear
earlier
0.94.94.41.5
.0-1.8
3.43.55.93.2
2.73.23.21.91.71.1
.62.01.42.63.23.73.8
Industry production indexes, 1987=100
Manufacturing
Total
94.3100.0104.7106.4106.1103.8108.2112.3119.7123.9
123.3124.2124.9124.4124.5124.8
124.5126.2125.2126.5127.2128.1128.6
Durable
93.9100.0106.6108.6107.4104.1109.3115.6125.8132.5
131.5133.2134.4133.5134.3134.8
134.9137.5135.6138.3139.2141.2142.0
Nondura-ble
94.9100.0102.3103.7104.4103.4106.7108.6113.0114.3
114.3114.3114.4114.3113.7113.8
113.1113.8113.6113.5114.0113.8113.8
Mining
101.0100.0101.3100.0102.0100.2
98.998.0
100.399.9
100.7100.0100.0
98.298.398.1
97.198.0
101.1100.4100.2101.9101.6
Utilities
96.3100.0105.0108.7109.9112.3111.9116.3117.9122.0
122.7128.8122.7121.6125.4125.1
125.6126.6128.0126.4127.9125.9123.6
Capacity utilizationrate, percent2
Totalindustry
79.281.583.783.782.179.280.381.483.983.8
83.383.983.783.083.082.9
82.483.382.683.083.283.483.2
Manufac-turing
79.181.683.683.281.378.079.580.683.383.0
82.482.782.882.282.081.9
81.482.381.381.982.082.382.3
1 Permit changes based on unrounded indexes. a Output as percent of capacity.
Sou re*: Board of Governors of the Federal Ifcserve System.
17
Digitized for FRASER http://fraser.stlouisfed.org/ Federal Reserve Bank of St. Louis
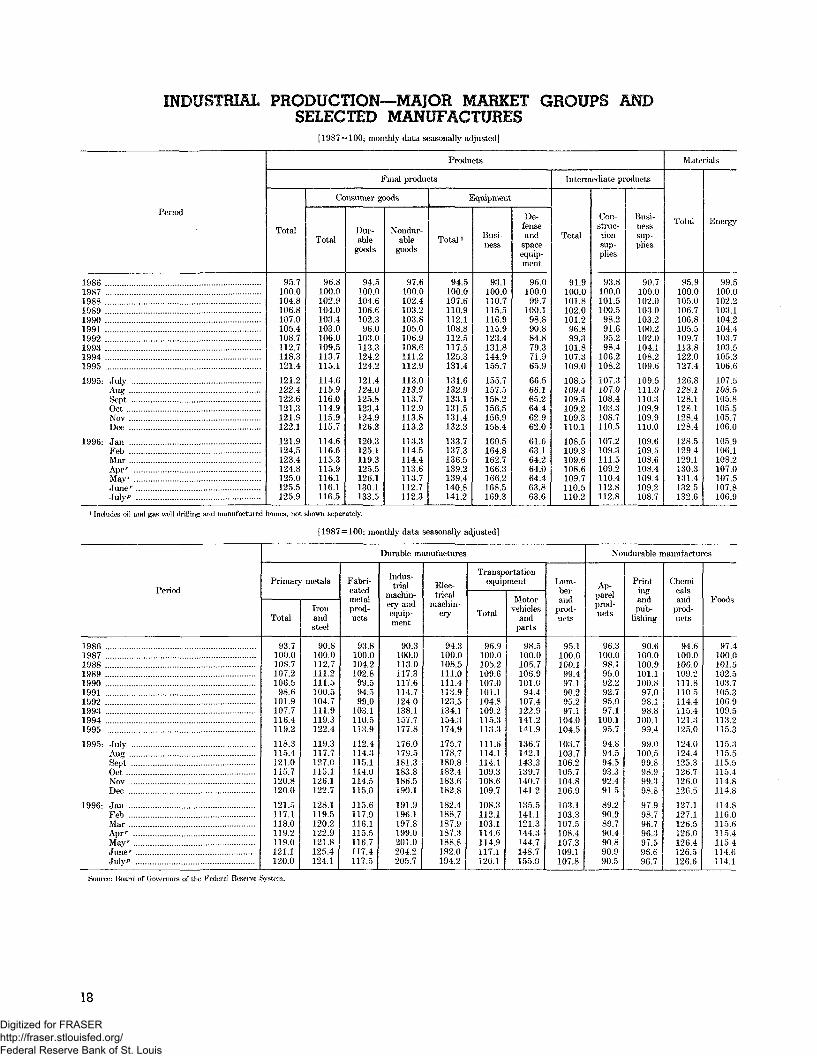
INDUSTRIAL PRODUCTION—MAJOR MARKET GROUPS ANDSELECTED MANUFACTURES
[1987 = 100; montlJy data seasonally adjusted]
Period
1986198719881989199019911992199319941995
1995- July
SeptOctNovDec
1996- JanFeb
Aprr
June''July/5
Products
Final products
Total
95.7100.0104.8106.8107.0105.4108.7112.7118.3121.4
121.2122.4122.6121.3121.9122.1
121.9124.5123.4124.8125.0125.5125.9
Coiisumer goods
Total
96.8100.0102.9104.0103.4103.0106.0109.5113.7115.1
114.6115.9116.0114.9115.9115.7
114.6116.6115.3115.9116.1116.1116,5
Dur-able
goods
94.5100.0104.6106.6102.396.0
103.0113.3124.2124.2
121.4124.0125.8123.4124.9126.3
120.3125.1119.3125.5126.1130.1133.5
Nondur-able
goods
97.6100.0102.4103.2103.8105.0106.9108.6111.2112.9
113.0113.9113.7112.9113.8113.2
113.3114.5114.4113.6113.7112.7112.3
Equipment
Total >
94.5100.0107.6110,9112.1108.8112.5117.5125.3131.4
131.6132.9133.1131.5131.4132.3
133.7137.3136.5139.2139.4140.8141.2
Busi-ness
93.1100.0110.7115.5116.9115.9123.4131.8144.9155.7
155.7157.5158.2156.5156.9158.4
160.5164.8162.7166.3166.2168.5169.3
De-fenseand
spaceequip-ment
96.0100.099.7
100.198.890.884.879.371.965.9
66.566.165.264.462.962.0
61.663.164.264.064.463.863.6
Intermediate products
Total
91.9100.0101.8102.0101.296.899.3
101.8107.3109.0
108.5109.4109.5109.2109.3110.1
108.5109.3109.6108.6109.7110.5110.2
Con-struc-tionsup-plies
93.8100.0101.5100.598.291.695.298.4
106.2108.2
107.3107.0108.4108.3108.7110.5
107.2109.3111.5109.2110.4112.8112.8
Busi-nesssup-plies
90.7100.0102.0103.0103.2100.2102.0104.1108.2109.6
109.5111.0110.3109.9109.9110.0
109.6109.5108.6108.4109.4109.2108.7
Materials
Total
95.9100.0105.0106.7106.8105.5109.7113.8122.0127.4
126.8128. 1128.1128.1128.4128.4
128.5129.4129.1130.3131.4132.5132.6
Energy
99.5100.0102.2103.1104.2104.4103.7103.5105.3106.6
107.5108.5105.8105.5105.7106.0
105.9106.1108.2107.0107.5107.8106.9
1 Includes oil arid R«S well drilling: and manufactured homos, not shown separately.
[1987 = 100; monthly data seasonally adjusted]
Period
19861987 . .19881989199019911992199319941995
1995. July
SeptOct
Dec
1996- JanFeb
May
July/*
Durable manufactures
Primary metals
Total
93.7100.0108.7107.2106.598.6
101.9107.7116.4119.2
118.3115.4121.0115.7120.8120.0
121.5117.1118.0119.2119.0121.1120.0
Ironandsteel
90.8100.0112.7111.2111.5100.5104.7111.9119.3122.4
119.3117.7127.0115.1126.1122.7
128.1119.5120.2122.9121.8125.4124.1
Fabri-catedmetalprod-ucts
93.8100.0104.2102.899.594.599.0
103.1110.5113.9
112.4114.3115.1114.0114.5115.0
115.6117.0116.1115.5116.7117.4117.5
Indus-trial
machin-ery andequip-ment
90.3100.0113.0117.3117.6114.7124.0138.1157.7177.8
176.0179.5181.3183.8186.5190.1
191.9196.1197.8199.0201.0204.2205.7
Elec-trical
maehiii-ery
94.3100.0108.5111.0111.4113.9123.5134.1154.3174.9
175.7178.7180.8182.4183.6182.8
182.4188,7187.9187,3188.8192.0194.2
Transportationequipment
Total
96.9100.0105.2109.6107.0101.1104.8109.2115.3113.3
111.6114.1114.1109.3108.6109.7
108.3112.1103.1114.6114.9117.1120.1
Motorvehicles
andparts
98.5100.0105.7106.9101.094.4
107.4122.9141.2141.9
136.7142.1143.3139.7140.7141.2
135.5141.1121.3144.3144.7148.7155.0
Lum-berand
prod-ucts
95.1100.0100.1
99.497.190.295.297.1
104.0104.5
103.7103.7106.2105.7104.8106.9
103.1103.3107.5108.4107.3109.1107.8
Nondurable manufactures
Ap-parelprod-ucts
96.3100.098.195.092.292.795.097.1
100.195.7
94.894.594.593.392.491.5
89.290.989.790.490.890.990.5
Print-ingandpub-
lishing
90.6100.0100.9101.1100.897.098.198.8
100.199.4
99.0100.599.898.999.398.8
97.998.796.796.397.596.696.7
Chemi-calsand
prod-ucts
94.6100.0106.0109.2111.8110.5114.4115.4121.3125.0
124.0124.4125.3126.7126.0126.5
127.1127.1126.5126.0126.4126.5126.6
Foods
97.4100.0101.5102.5103.7105.3106,9109.5113.2115.3
115.3115.5115.5115.4114.8114.8
114.8116.0115.6115.4115.4114.6114.1
Soum;: lioarti of Governors of the Federal Ileserve System.
18
Digitized for FRASER http://fraser.stlouisfed.org/ Federal Reserve Bank of St. Louis
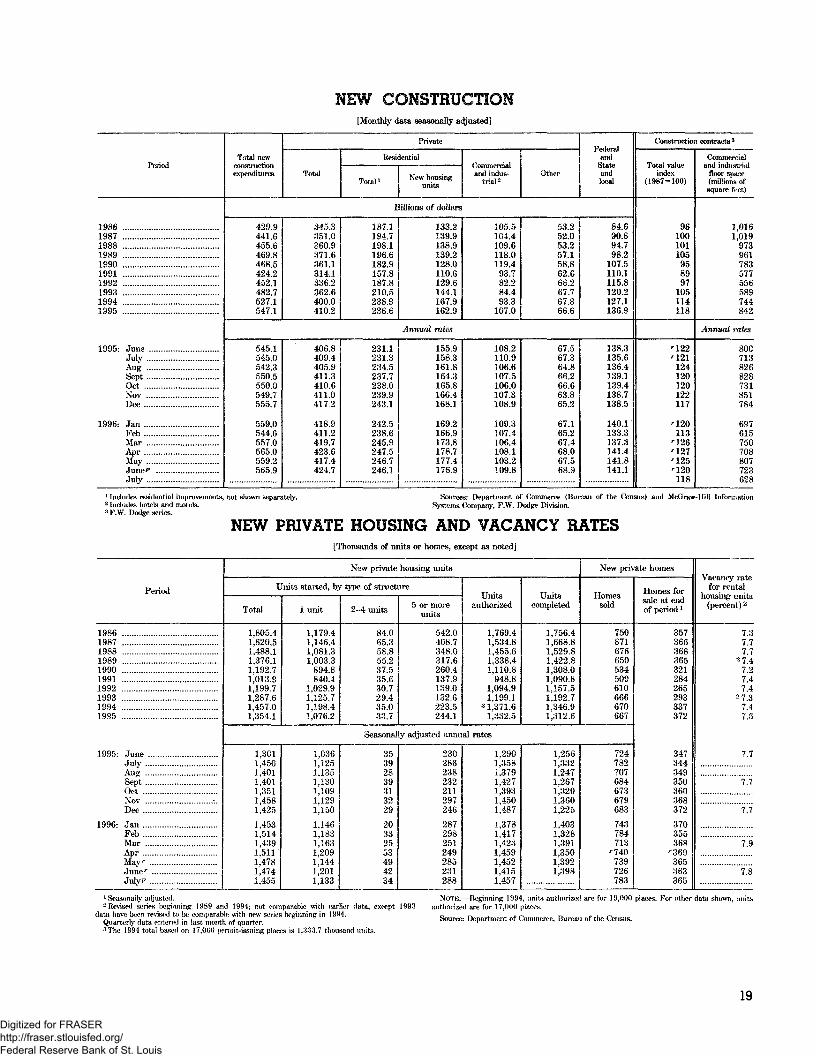
HEW CONSTRUCTION[Monthly data seasonally adjusted]
Period
1986198719881989199019911992199319941995
1995- JuneJuly
SeptOet
Dec
1996- JanFeb
July
Total newconstructionexpenditures
Private
Total
Residential
Total1 New housingunits
Commercialand indus-
trial2Other
Federaland
Stateandlocal
Billions of dollars
429.9441.6455.6469.8468.5424.2452.1482.7527.1547.1
345.3351.0360.9371.6361.1314.1336.2362.6400.0410.2
545.1545.0542.3550,5550.0549.7555.7
559.0544.6557.0565.0559.2565.9
406.8409.4405.9411.3410.6411.0417.2
418.9411.2419.7423.6417.4424.7
187.1194.7198.1196.6182.9157.8187.8210.5238.9236.6
231.1231.3234.5237.7238.0239.9243.1
242.5238.6245.9247.5246.7246.1
133.2139.9138.9139.2128.0110.6129.6144.1167.9162.9
105.5104.4109.6118.0119.493.782.284.493.3
107.0
Annual rates
155.9158.3161.8164.3165.8166.4168.1
169.2166.9173.8178.7177.4176.9
108.2110.9106.6107.5106.0107.3108.9
109.3107.4106.4108.1103.2109.8
53.252.053.257.158.862.666.267.767.866.6
67.567.364.866.266.663.865.2
67.165.267.468.067.568.9
84.690.694.798.2
107.5110.1115.8120.2127.1136.9
138.3135.6136.4139.1139.4138.7138.5
140.1133.3137.3141.4141.8141.1
Construction contracts3
Total valueindex
(1987=100)
96100101105958997
105114118
'122'121124120120122117
'120113
'126'127'125'120118
Commercialand industrial
floor space(millions ofsquare feet)
1,0161,019
973961783577556589744842
Annual rates
800713826828731851784
697615750708807723628
1 Includes residential improvements, not shown separately.2 Includes hotels and motels.3 F.W. Dodge series.
Sources: Department of Commerce (Bureau of the Census) and McGraw-Hill InformationSystems Company, F.W. Dodge Division,
NEW PRIVATE HOUSING AND VACANCY RATES[Thousands of units or homes, except as noted]
Period
1986198719881989199019911992199319941995
1995- JuneJuly
SeptOctNovDec
1996: JanFeb
May'
July*7
New private housing units
Units started, by type of structure
Total
1,805.41,620.51.488.11,376.11,192.71,013.91,199.71,287.61,457.01,354.1
1 unit
1,179.41,146.41,081.31,003.3
894.8840.4
1,029.91,125.71,198.41,076.2
2-4 units
84.065.358.855.237.535.630.729.435.033.7
5 or moreunits
542.0408.7348.0317.6260.4137.9139.0132.6223.5244.1
Unitsauthorized
1,769.41,534.81,455.61,338.41,110.8
948.81,094.91,199.1
:n,371.61,332.5
Unitscompleted
1,756.41,668.81,529.81,422.81,308.01,090.81,157.51,192.71,346.91,312.6
New private homes
Homessold
750671676650534509610666670667
Seasonally adjusted annual rates
1,3011,4501,4011,4011,3511,4581,425
1,4531,5141,4391,5111,4781,4741,455
1,0361,1251,1351,1301,1091,1291,150
1,1461,1831,1631,2091,1441,2011,133
35392839313229
20332553494234
230286238232211297246
287298251249285231288
1,2901,3581,3791,4271,3931,4501,487
1,3781,4171,4231,4591,4521,4151,457
1,2561,3321,2471,2671,3201,3601,225
1,4031,3281,3911,3501,3921,398
724782707684673679683
743784713
'740739726783
Homes forsale at endof period !
357366368365321284265293337372
347344349350360368372
370355368
'369365363365
Vacancy ratefor rental
housing units(percent) 2
7.37.77.7
2 7.47.27.47.4
2 7.37.47.6
7.7
7.7
7.7
7.9
7.8
1 Seasonally adjusted.- Revised series Ixiginning 1989 and 1994; not comparable with earlier data, except 1993
data have been revised to be comparable with new series beginning in 1994.Quarterly data entered in last month of quarter.3 The 1994 total based on 17,000 pmnit-issuing places is 1,333.7 thousand units.
NOTE.—Beginning 1994, units authorized are for 19,000 places. For «>ther data shown, unitsauthorized are for 17,000 places.
Source: Department of Commerce, Bureau of the Census.
19
Digitized for FRASER http://fraser.stlouisfed.org/ Federal Reserve Bank of St. Louis
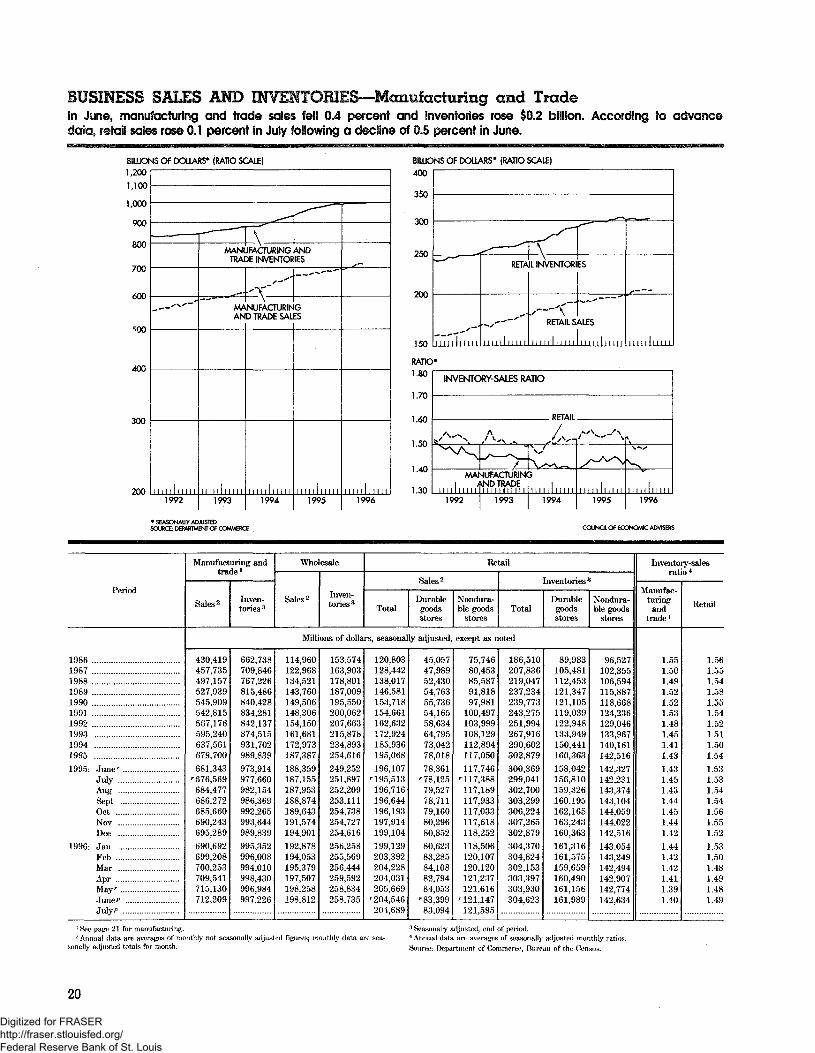
BUSINESS SALES AND INVENTORIES—Manufacturing and TradeIn June, manufacturing and trade safes fail 0.4 percent and inventories rose $0.2 billion. According to advancedata, retail sales rose 0.1 percent in July following a decline of 0.5 percent in June.
BILLIONS OF DOUARS* (RATIO SCALE)1,200
1,100
1,000
900
800
700
600
<00
400
300
200
^
--— *""•"""
1 1 1 1 1 1 1 1 1 1 11992
_- rT lMANUFACTURING AND
TRADE INVENTORIES
4-'-r~~— i \ iMANUFACTURINGAND TRADE SALES
M 1 1 1 1 1 1 1 1 11993
1 1 1 1 1 M i l l1994
1 1 n i i 1 1 i 1 11995
1 1 M 1 1 1 1 1 II
1996
BILLIONS OF DOUARS* (RATIO SCALE)
400
RATIO*1.80
1.70
1.60
1.50
1.40
1.30
INVENTORY-SALES RATIO
MANUFACTURINGAND TRADE
1 1 1 I I I 1 1 1
* SEASONAilY ADJUSTEDSOURCE: DEPARTMENT OF COMMERCE
1992 1993 1994 1995 1996
COUNOL OF ECONOMIC ADVISERS
Period
19861987198819891990199]1992199319941995
1995- Juuer
July
SeptOct
Dec
1996- JanFeb
May
Julyp
Manufacturing andtrade1
Sales2 Inven-tories3
Wholesale
Sales2 Inven-tories3
Retail
Sales2
TotalDurablegoodsstores
Nondura-ble goods
stores
Inventories 3
TotalDurable
goodsstores
Nondura-ble goods
stores
Millions of dollars, seasonally adjusted, except as noted
430,419457,735497,157527,039545,909542,815567,176595,240637,561679,700
681,343'676,569684,477686,272685,660690,243695,289
690,692699,208700,253709,541715,130712,209
662,738709,846767,226815,486840,428834,281842,137874,515931,702989,839
973,914977,660982,154986,369992,265993,644989,839
995,352996,008994,010998,430996,984997,226
114,960122,968134,521143,760149,506148,306154,150161,681172,973187,387
188,359187,155187,953188,874189,643191,574194,901
192,878194,053195,379197,507198,258198,812
153,574163,903178,801187,009195,550200,062207,663215,878234,893254,616
249,252251,897252,209253,111254,738254,727254,616
256,258255,569256,444259,592258,834258,735
120,803128,442138,017146,581153,718154,661162,632172,924185,936195,068
196,107'195,513196,716196,644196,193197,914199,104
199,129203,392204,228204,031205,669
'204,546204,689
45,05747,98952,43054,76355,73654,16558,63464,79573,04278,018
78,361'78,125
79,52778,71179,16080,29680,852
80,62383,28584,10882,79484,053
'83,39983,094
75,74680,45385,58791,81897,981
100,497103,999108,129112,894117,050
117,746'117,388117,189117,933117,033117,618118,252
118,506120,107120,120121,237121,616
'121,147121,595
186,510207,836219,047237,234239,773243,275251,994267,916290,602302,879
300,369299,041302,700303,299306,224307,265302,879
304,370304,824302,153303,397303,930304,623
89,983105,481112,453121,347121,105119,039122,948133,949150,441160,363
158,042156,810159,326160,195162,165163,243160,363
161,316161,575159,659160,490161,156161,989
96,527102,355106,594115,887118,668124,236129,046133,967140,161142,516
142,327142,231143,374143,104144,059144,022142,516
143,054143,249142,494142,907142,774142,634
Inventory-salesratio4
Manufac-turing
andtrade1
1.551.501.491.521.521.531.481.451.411.43
1.431.451.431.441.451.441.42
1.441.421.421.411.391.40
Retail
1.561.551.541.581.551.541.521.511.501.54
1.531.531.541.541.561.551.52
1.531.501.481.491.481.49
] See page 21 for manufacturing.2Annua! data arc averages of monthly not seasonally adjusted figures; monthly data are sea-
sonally adjusted totals for month.
3 Seasonally adjusted, end of period.4 Annual data are averages of seasonally adjusted monthly rati(Source: Department, of Commerce, Bureau of the Census.
20
Digitized for FRASER http://fraser.stlouisfed.org/ Federal Reserve Bank of St. Louis
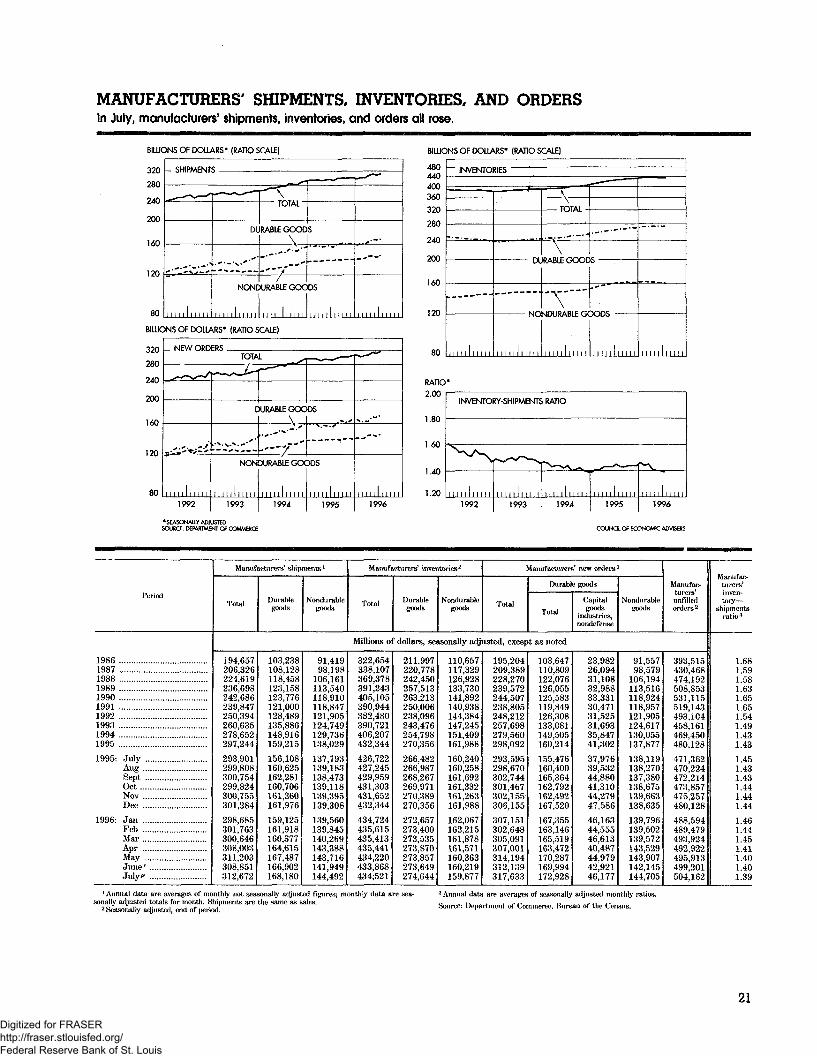
MANUFACTURERS' SHIPMENTS, INVENTORIES, AND ORDERSIn July, manufacturers' shipments, Inventories, and orders all rose.
BILLIONS OF DOLLARS' (RATIO SCALE) BILLIONS OF DOLLARS* (RATIO SCALE)
320
280
240
200
160
120
80
BILUC
320
280
240
200
160
120
80
- SHIPMENTs
^ — '
1 1 1 1 1 1 1 1 1 1 1
" ^-^~
DL
. •%•*'*
NONC
1 1 1 1 1 1 1 1 ! 1 1
^*~\̂TOTAL
RABLEGOOC\
lURABLEGOC
M i l l INN
, . -,*—
S
DS
1 1 1 1 1 1 M 1 1 1
p-—
,--•
1 1 1 1 1 1 1 1 1 1
INS OF DOLLARS' (RATIO SCALE)
_ NEWORD
_ ^-S
3.'&*ti
1 1 1 1 E 1 1 1 1 1 11992
FP,STOTAL ^
^^^^ /̂ »"
C
,-vv.^.-'x
NON
1 1 1 1 1 1 1 M 1
1993
HJRABLEGOC
J* s,*»'^*
-'-—"'DURABLE GOC
HIM 1 1 1 1 1
1994
1 '
OS•».x
"•"'
DOS
Hi l l 1 1 1 M
1995
v--"
N,— '"
•• ̂ *
1 1 1 1 1 1 1 1 1 1
1996
18014000160
20
80
40
•00
60
20
80
- INVENTOKlbb
- — _ i ~\TOTAL
\RABLEGOOD
"V"sIDURABLE GC
| 1 1 M 1 1 I 1 1 I
r — —
•- —
1 1 1 1 1 ! i u 1 1
^ —
1 1 M 1 1 1 1 i ! 1
RAHO2.00
1.80
1.60
1.40
1.20
INVENTORY-SHIPMENTS RATIO
^^
1 1 1 1 1 1 1 1 1 ! 1
1992
~^-v~^
i l 1 1 1 1 1 1 1 11993
•X-^.^ _—+~—*
1 1 1 1 1 1 1 1 1 1 11994
1 1 1 1 1 1 1 1 i 1 11995
r^M ! ! 1 i 1 i ! I !
1996
* SEASONALLY ADJUSTEDSOURCE; DEPARTMENT Of COMMERCE COUNCIL OF ECONOMIC ADVISERS
Period
198619871988198919901991 ... .19921993 . .19941995
1995- July
SeptGetNovDec
1996: JailPebMarApr
Julyp
Manufacturers' shipments '
Total Durablegoods
Nondurablegoods
Manufacturers' inventories2
Total Durablegoods
Millions of dollars, sei
194,657206,326224,619236,698242,686239,847250,394260,635278,652297,244
293,901299,808300,754299,824300,755301,284
298,685301,763300,646308,003311,203308,851312,672
103,238108,128118,458123,158123,776121,000128,489135,886148,916159,215
156,108160,625162,281160,706161,360161,976
159,125161,918160,377164,615167,487166,902168,180
91,41998,198
106,161113,540118,910118,847121,905124,749129,736138,029
137,793139,183138,473139,118139,395139,308
139,560139,845140,269143,388143,716141,949144,492
322,654338,107369,378391,243405,105390,944382,480390,721406,207432,344
426,722427,245429,959431,303431,652432,344
434,724435,615435,413435,441434,220433,868434;521
211,997220,778242,450257,513263,213250,006238,096243,476254,798270,356
266,482266,987268,267269,971270,389270,356
272,657273,400273,535273,870273,857273,649274,644
Nondurablegoods
Manufacturers' new orders '
Total
Durable goods
Total
isonally adjusted, except as noted
110,657117,329126,928133,730141,892140,938144,384147,245151,409161,988
160,240160,258161,692161,332161,263161,988
162,067162,215161,878161,571160,363160,219159,877
195,204209,389228,270239,572244,507238,805248,212257,698279,560298,092
293,595298,670302,744301,467302,155306,155
307,151302,648305,091307,001314,194312,139317,633
103,647110,809122,076126,055125,583119,849126,308133,081149,505160,214
155,476160,400165,364162,792162,492167,520
167,355163,146165,519163,472170,287169,994172,928
Capitalgoods
industries,nondefense
Nondurablegoods
Manufac-turers'unfilledorders2
23,98226,09431,10832,98833,33130,47131,52531,69335,84741,302
37,97639,53244,88041,31044,27947,586
46,16344,55546,61340,48744,97942,92146,177
91,55798,579
106,194113,516118,924118,957121,905124,617130,055137,877
138,119138,270137,380138,675139,663138,635
139,796139,502139,572143,529143,907142,145144,705
393,515430,468474,192508,853531,115519,143493.104458,161469,450480,128
471,362470,224472,214473,857475,257480,128
488,594489,479493,924492,922495,913499,201504,162
Manufac-turers'inven-tory —
shipmentsratio3
1.681.591.581.631.651.651.541.491.431.43
1.451.431.431.441.441.44
1.461.441.451.411.401.401.39
'Annual data are averages of monthly not seasonally adjusted figures; monthly data are sea-sonally adjusted totals for month. Shipments are the same as sales.
2 Seasonally adjusted, end of period.
•''Annual data are averages of seasonally adjusted monthly ratios.Source: Department of Commerce, Bureau of the Census.
21
Digitized for FRASER http://fraser.stlouisfed.org/ Federal Reserve Bank of St. Louis
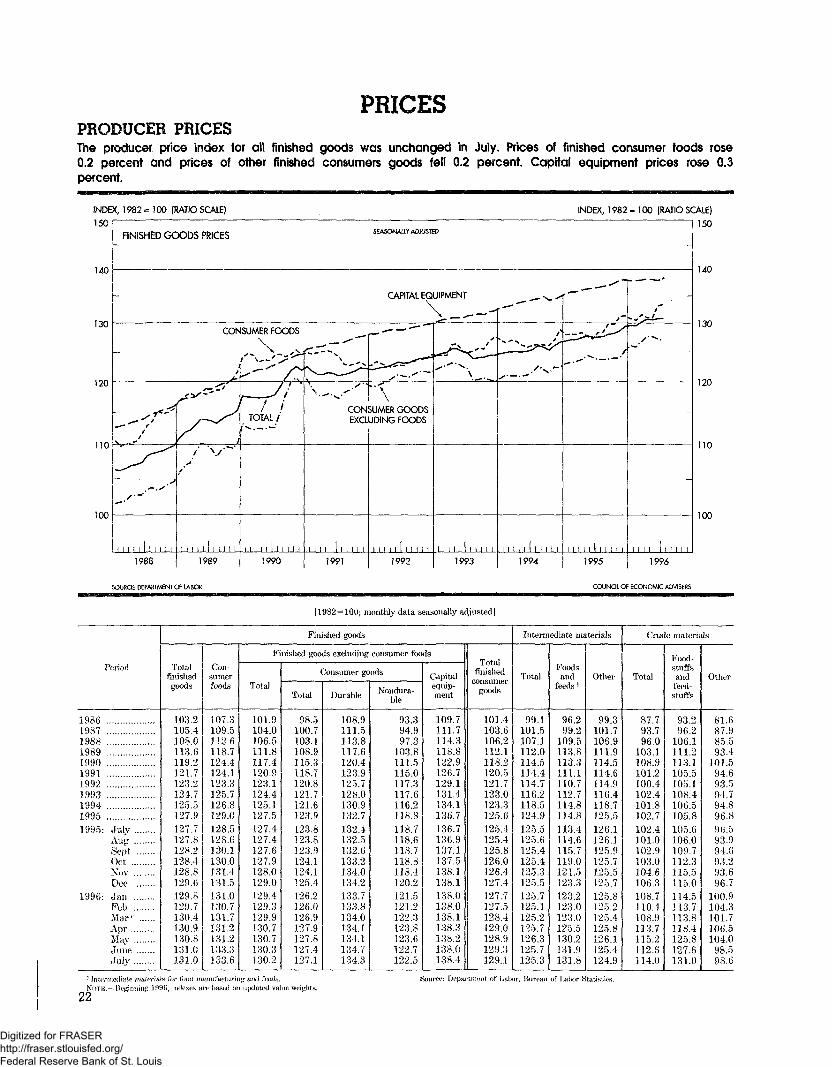
PRICESPRODUCER PRICESThe producer price index for all finished goods was unchanged in July. Prices of finished consumer foods rose0.2 percent and prices of other finished consumers goods fell 0.2 percent. Capital equipment prices rose 0.3percent.
INDEX, 1982= ) 00 (RATIO SCALE)
150
INDEX, 1982 = 100 (RATIO SCALE)
150
CONSUMER GOODSEXCLUDING FOODS
110
!00
1988
SOURCE: DEPARTMENT Of LABOR COUNCIL OF ECONOMIC ADVISERS
(1982 = 100; montlily data seasonally adjusted]
Period
19861987198819891990199119923993199419951995: July
AugSeptOctNovDec
1996: JanFebMar''AprMayJuneJuly
Finished goods
Totalfinishedgoods
103.2105,4108.0113.6119.2121.7123.2124.7125.5127.9127.7127.8128.2128.4128.8129.6129.8129.7130.4130.9130.8131.0131 .0
Con-sumerfoods
107.3109.5112.6118.7124.4124.1123.3125.7126.8129.0128.5128.6130.1130.0131.4131.5131.0130.7131.7131.2131.2133.3133.6
Finished goods excluding consumer foods
Total
101.9104.0106.5111.8117.4120.9123.1124.4125.1127.5127.4127.4127.6127.9128.0129.0129.412.9.3129.9130.7130.7130.3130.2
Consumer goods
Total
98.5100.7103.1108.9115.3118.7120.8121.7121.6123.9123.8123.8123.9124.1124.1125.4126.2126.0126.9127.9127.8127.4127.1
Durable
108.9111.5113.8117.6120.4123.9125.7128.0130.9132.7132.4132.5132.6133.2134.0134.2133.7133.8134.0134.1134.1134.7134.3
Nble
93.394.997.3
103.8111.5115.0117.3117.6116.2118.8118.7118.6118.7118.8118.4120.2121.5121.2122.3123.8123.6122.7122.5
Capitalequip-ment
109.7111.7114.3118.8122.9126.7129.1131.4134.1136.7136.7136.9137.1137.5138.1138.1138.0138.0138.1138.3138.2138.0138.4
Totalfinished
consumergo«s
101.4103.6106.2112.1118.2120.5121.7123.0123.3125.6125.4125.4125.8126.0126.4127.4127.7127.5128.4129.0128.9129.3129.1
Intermediate materials
Total
99.1101.5107.1112.0114.5114.4114.7116.2118.5124.9125.5125.6125.4125.4125.3125.5125.7125.1125.2125.7126.3125.7125.3
Foodsand
feeds '
96.299.2
109.5113.8113.3111.1110.7112.7114.8114.8113.4114.6115.7119.0121.5123.3123.2123.0123.0125.5130.2131.9131.8
Other
99.3101.7106.9111.9114.5114.6114.9116.4118.7125.5126.1126.1125.9125.7125.5125.7125.8125.2125.4125.8126.1125.4124.9
Crude materials
Total
87.793.796.0
103.1108.9101.2100.4102.4101.8102.7102.4101.0102.9103.0104.6106.3108.7110.4108.9113.7115.2112.6114.0
Food-stuffsand
feed-stuffs
93.296.2
106.1111.2113.1105.5105.1108.4106.5105.8105.6106.0109.7112.3115.5115.0114.5113.7113.8118.4125.8127.6131.0
Other
81.687.985.593.4
101.594.693.594.794.896.896.593.994.693.293.696.7
100.9104.3101.7106.5104.0
98,598.6
22liatfi materittKs for food iminiifavtiiring ar ifJ fwils.
NOTK.—Beginning; 1996, indexes an1 based on updated value weights.Source: Department of Lalw, Bureau of I - Statistics.
Digitized for FRASER http://fraser.stlouisfed.org/ Federal Reserve Bank of St. Louis
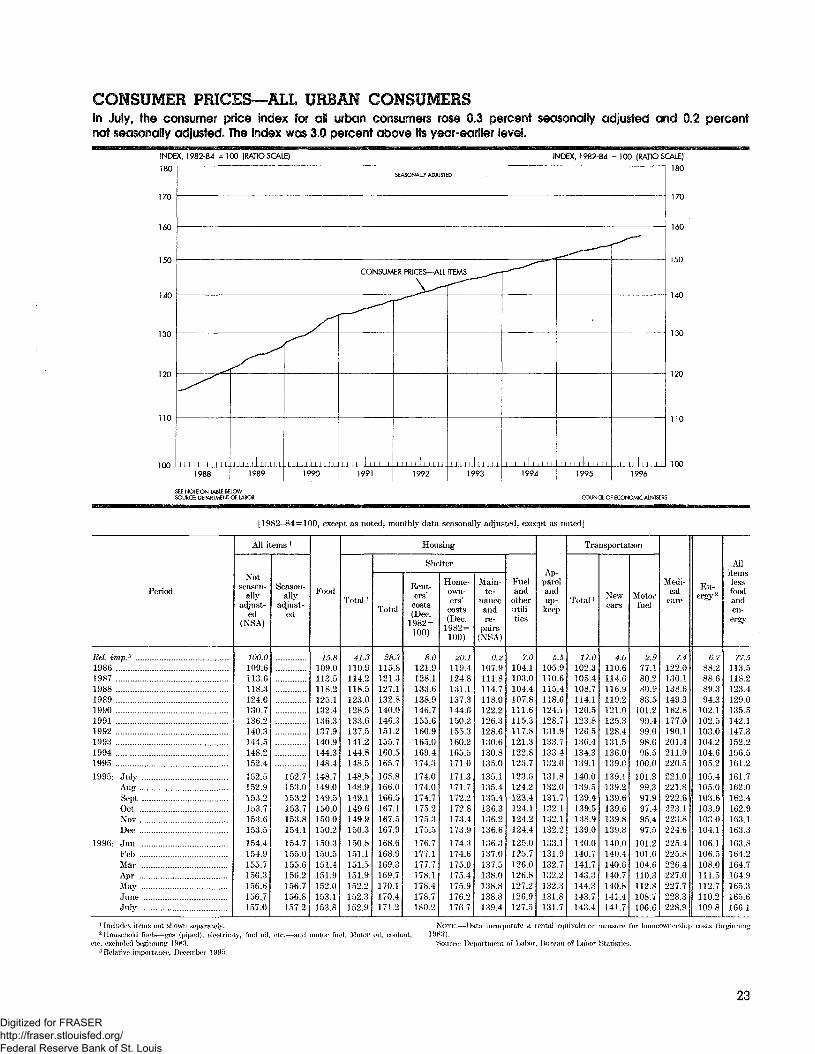
CONSUMER PRICES—ALL URBAN CONSUMERSin July, the consumer price index for aii urban consumers rose 0.3 percent seasonally adjusted and 0.2 percentnot seasonally adjusted. The index was 3.0 percent above its year-earlier level.
INDEX, 1982-84 - 100 (RATIO SCALE)
ISO
170
150
140
130
120
UO
SEASONALLY ADJUSTED
INDEX, 1982-84 = 100 {RATIO SCALE)
180
CONSUMER PRICES—ALL ITEMS
V
1988 1989 1990 1991 1993 1994
170
160
150
130
120
110
100
COUNCIL OF ECONOMIC ADVISERS
[1982-84=100, except as noted; montlily data seasonally adjusted, except as noted]
Period
1986198719881989199019911992199319941995
1995- JulvAugSeptOctNov ..Dec
1996: JanFeb
May
Jnly
All items '
Notseason-
allyadjust-
ed(NSA)
100.0109.6113.6118,3124.0130.7136.2140.3144.5148.2152.4
152.5152.9153.2153.7153.6153.5
154.4154.9155.7156.3156.6156.7157.0
Season-ally
adjust-ed
152.7153.0153.2153.7153.8154.1
154.7155.0155.6156.2156.7156.8157.2
Food
15.8109.0113.5118.2125.1132.4136.3137.9140.9144.3148.4
148.7149.0149.5150.0150.0150.2
150.3150.5151.4151.9152.0153.1153.8
Housing
Total '
41.3110.9114.2118.5123.0128.5133.6137.5141.2144.8148.5
148.5148.9149.1149.6149.9150.3
150.8151.1151.5151.9152.2152.3152.9
Shelter
Total
38.3115.8121.3127.1132.8140.0146.3151.2155.7160.5165.7
165.8166.0166.5167.1167.5167.9
168.6168.9169.3169.7170.1170.4171.2
Rent-ers'
costs(Dec.
1982 =100)
8.0121.9128.1133.6138.9146.7155.6160.9165.0169.4174.3
174.0174.0174.7175.2175.3175.5
176.7177.1177.7178.1178.4178.7180.2
Home-own-ers'
costs(Dec.
1982 =100)
20.1119.4124.8131.1137.3144.6150.2155.3160.2165.5171.0
171.3171.7172.2172.8173.4173.9
174.3174.6175.0175.4175.9176.2176.7
Main-te-
nanceandre-
pairs(NSA)
0.2107.9111.8114.7118.0122.2126.3128.6130.6130.8135.0
135.1135.4135.4136.3136.2136.6
136.3137.0137.5138.0138.8138.8139.4
Fueland
otherutili-ties
7.0104.1103.0104.4107.8111.6115.3117.8121.3122.8123.7
123.6124.2123.4124.1124.2124.4
125.0125.7126.0126.8127.2126.9127.5
Ap-parelandup-
keep
5.5105.9110.6115.4118.6124.1128.7131.9133.7133.4132.0
131.8132.0131.7132.1132.1132.2
133.1131.9132.7132.2132.3131.8131.7
Transportation
Total '
17.0102.3105.4108.7114.1120.5123.8126.5130.4134.3139.1
140.0139.5139.4139.5138.9139.0
140.0140.7141.7143.3144.3143.7143.4
Newcars
4.0110.6114.6116.9119.2121.0125.3128.4131.5136.0139.0
139.1139.2139.6139.6139.8139.8
140.0140.4140.6140.7140.8141.4141.7
Motorfuel
2.977.180.280.988.5
101.299.499.098.098.5
100.0
101.399.397.997.495.497.5
101.2101.0104.6110.3112.8108.7106.6
Medi-cal
care
7.4122.0130.1138.6149.3162.8177.0190.1201.4211.0220.5
221.0221.8222.6223.1223.8224.6
225.4225.8226.4227.0227.7228.3228.9
En-ergy2
S. 788.288.689.394.3
102.1102.5103.0104.2104.6105.2
105.4105.0103.6103.9103.0104.1
106.1106.5108.0111.5112.7110.2109.8
Allitemslessfoodanden-ergy
77.5113.5118.2123.4129.0135.5142.1147.3152.2156.5161.2
161.7162.0162.4162.9163.1163.3
163.8164.2164.7164.9165.3165.6166.1
1 Includes items not. shown separately.-Household fuels— gas (piped), electricity, fuel oil, etc.—-and motor fuel. Motor
etc. excluded beginning 1983.:< Relative importance, DecemlxM- 199;").
NoTK.—Data incorporate a rental equivalence measure for homeowner-ship costs (beginningL-oolant, 1983).
Source: Department of LalK>r, Bureau of Labor Statistics.
23
Digitized for FRASER http://fraser.stlouisfed.org/ Federal Reserve Bank of St. Louis
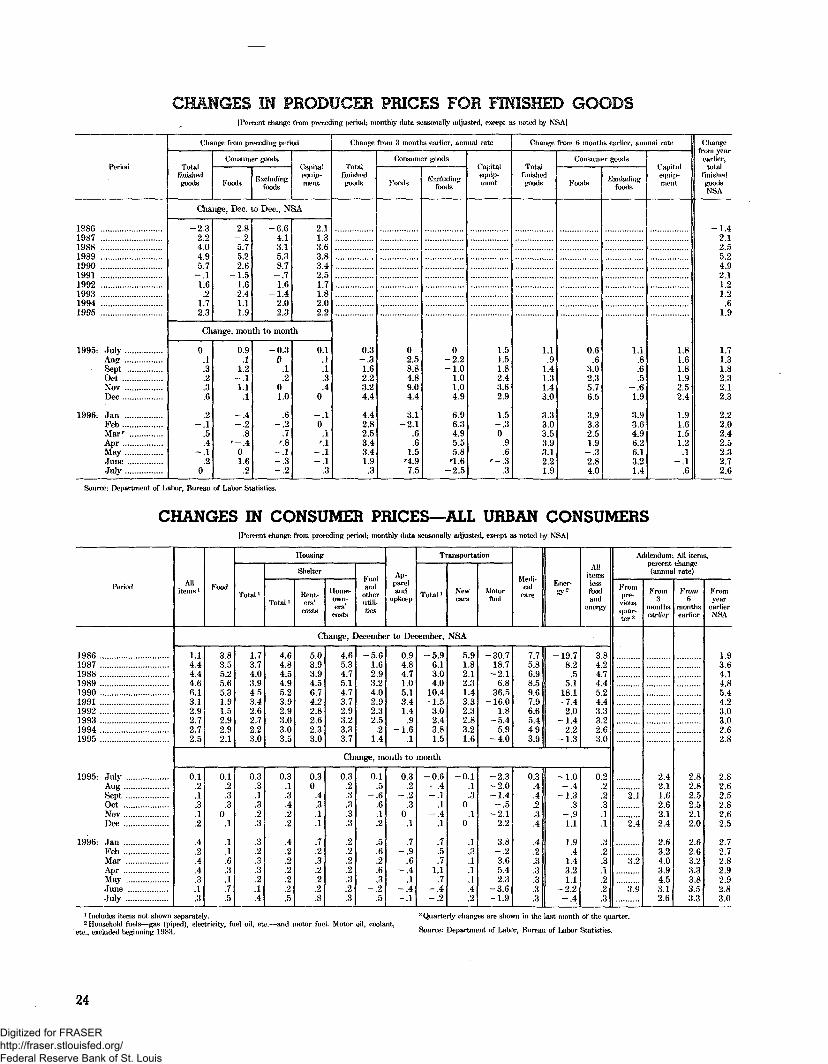
IN PRODUCER PRICES FOR FINISHED GOODSj Percent change from preceding period; monthly data seasonally a<ljusted, except as noted by NSA|
Period
1986198719881989199019911992199319941995
1995- July
SeptOct
Dec
1996- JanFeb .Marr
July
Change from preceding period
Totalfinishedgoods
Consumer goods
Koods Bxel tidingfoods
Capitalequip-ment
Change, Dec. to Dee., NSA
-2.32.24.04.95.7-.11.6.2
1.72.3
2.8-.25.75.22.6
-1.51.6
-2.41.11.9
-6.64.13.15.38.7-.71.6
-1.42.02.3
2.11.33.63.83.42.51.71.82.02.2
Change, month to month
0.1.3.2.3.6
.2-.1
.5
.4-.1
.20
0.9.1
1.2-.11.1.1
-.4- 2
.8'-.4
01.6
.2
-0.30
.1
.201.0
.60
.7'.8
-.1-.3-.2
0.1.1.1.3.4
0
-.10.1'.1
-.11.3
Change from 3 months earlier, annual rate
Totalfinishedgoods
0.3-.31.62.23.24.4
4.42.82.53.43.41.9
.3
Consumer goods
Foods
02.58.84.89.04.4
3.1-2.1
.6
.61.5
'4.97.5
Excludingfoods
0-2.2-1.0
1.01.04.9
6.96.34.95.55.8'1.6
-2.5
Capita!equip-ment
1.51.51.82.43.62.9
1.5-.30
.9
.6r o
'.3
Change from 6 months earlier, annual rate
Totalfinishedgoods
1.1.9
1.41.31.43.0
3.33.03.53.93.12.21.9
Consumer goods
Foods
0.6.6
3.02.35.76.5
3.93.32.51.9-.32.84.0
Excludingfoods
1.1.8.6.5
-.61.9
3.93.64.96.26.13.21.4
Capitalequip-ment
1.81.61.81.92.52.4
1.91.61.51.2.1
-.1.6
Changefrom year
earlier,total
finishedgoodsNSA
-1.42.12.55.24.92.11.21.2
.61.9
1.71.31.82.32.12.3
2.22.02.42.52.32.72.6
Source: Department of Labor, Bureau of Labor Statistics,
CHANGES IN CONSUMER PRICES—ALL URBAN CONSUMERS[Percent change from preceding period; monthly data seasonally atftusted, except as noted by NSAI
Period
1986198719881989199019911992199319941995
1995- July
SeptOctNovDec
1996- JanFebMar
May
July
Allitems ' Food
Housing
Total"
Shelter
Total'Rent-ers'costs
Home-own-ers'costs
Fuelam]
otherutili-ties
Ap-pare!and
upkeep
Transportation
Total' Newcars
Motorfuel
Medi-cal
care
Ener-gy2
Allitemslessfoodand
energy
Change, December to December, NSA
1.14.44.44.66.13.12.92.72.72.5
3.83.55.25.65.31.91.52.92.92.1
1.73.74.03.94.53.42.62,72.23.0
4.64.84.54.95.23.92.93.03.03.5
5.03.93.94.56.74.22.82.62.33.0
4.65.34.75.14.73.72.93.23.33.7
-5.61.62.93.24.02.92.32.5
.21.4
0.94.84.71.05.13.41.4
.9-1 6
.1
-5.96.13.04.0
10.4-1.5
3.02.43.81.5
5.91.82.12.31.43.32.32.83.21.6
-30718.7
-2.16.8
36.5-16.0
1.8-5.4
5.9-4.0
7.75.86.98.59.67.96.65.44.93.9
-19.78.2.5
5.118.1
-7.42.0
-1.42.2
-1.3
3.84.24.74.45.24.43.33.22.63.0
Change, month to month
0.1.2.1.3.1.2
.4
.2
.4
.4
.3
.1
.3
0.1.2.3.3
0.1
.1
.1
.6
.3
.1
.7
.5
0.3.3.1.3.2.3
.3
.2
.3
.3
.2
.1
.4
0.3.1.3.4.2.2
.4
.2
.2
.2
.2
.2
.5
0.30A.3.1.1
.7
.2
.3
.2
.2.2.8
0.3.2.3.3.3.3
.2
.2
.2
.2
.3
.2
.3
0.1.5
- 6.6.1.2
.5
.6
.2
.6
.3-.2
.5
0.3.2
-.2.3
0.1
.7-.9
.6-.4
.1-.4-.1
-0.6-.4-.1
.1-.4
.1
.7
.5
.71.1
.7-.4-.2
-0.1.1.3
0.1
0
.1
.3
.1
.1
.1
.4
.2
-2.3-2.0-1.4
-2^12.2
3.8-.23.65.42.3
-3.6-1.9
0.3.4.4.2.3.4
.4
.2g.3.3.3.3
-1.04
-1.3.3
-.91.1
1.9.4
1.43.21.1
-2.2-.4
0.2.223.1.1
.3
.2
.3
.1
.2
.2
.3
Addendum: All items,percent change(annual rate)
Frompre-
viousquar-ter*
2.1
2.4
£2
3.9
From3
monthsearlier
2.42.11.62.62.12.4
2.63.24.03.94.53.12.6
From6
monthsearlier
2.82.82.52.52.12.0
2.62.63.23.33.83.53.3
Fromyear
earlierNSA
1.93.64.14.85.44.23.03.02.62.8
2.82.62.52.82.62.5
2.72.72.82.92.92.83.0
1 Includes items not shown separately.2 Household fuels—gas (piped), electricity, fuel oil, etc.—and motor fuel. Motor oil, coolant,
etc., excluded beginning 1983.
3 Quarterly changes are shown in the last month of the quarter.
Source: Department of Ijabor, Bureau of Labor Statistics.
24
Digitized for FRASER http://fraser.stlouisfed.org/ Federal Reserve Bank of St. Louis
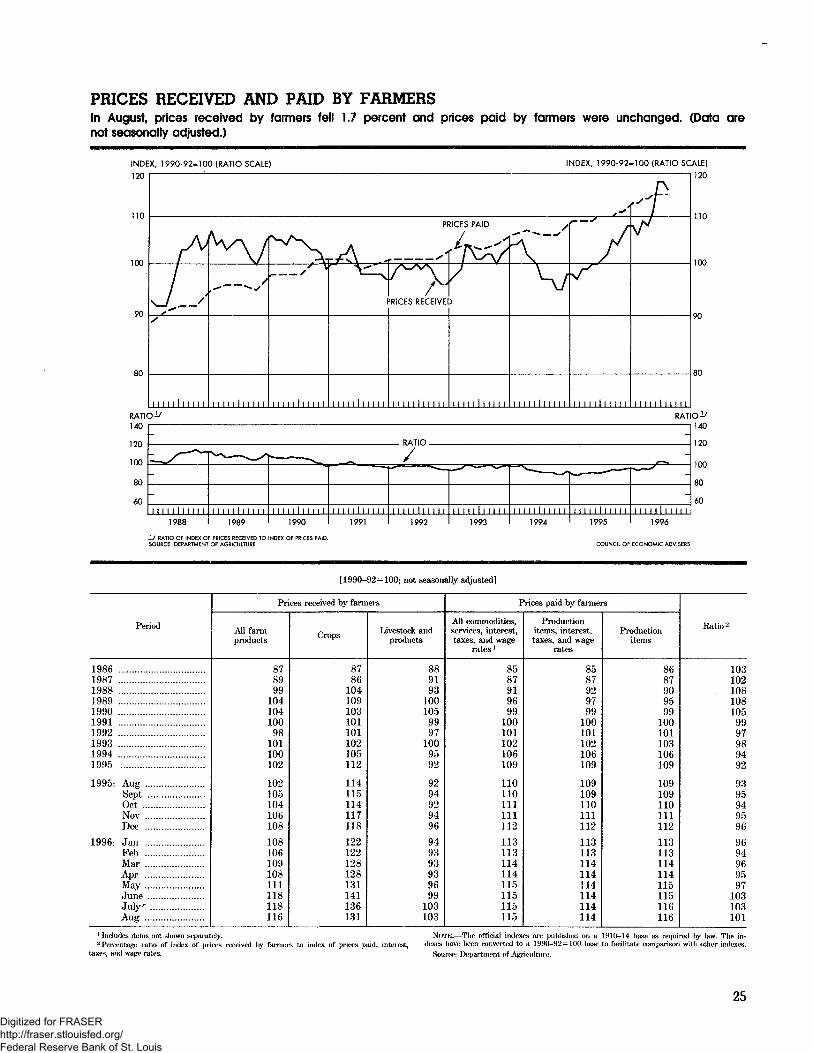
PRICES RECEIVED AND PAID BY FARMERSIn August, prices received by farmers fell 1.7 percent and prices paid by farmers were unchanged. (Data arenot seasonally adjusted.)
INDEX, 1990-92-100 (RATIO SCALE)
120
110
INDEX, 1990-92-100 (RATIO SCALE]
120
SO 80
RATK140
120
100
80
60
D-" RAT
PATin
-
-
1 1 1 1 1 1 1 1 1 1 11988
r^ — "-̂ i1 1 1 1 1 1 1 1 1 1 1
19R9
P S-
1 1 1 1 1 1 1 1 1 1 1
1990
— - * ==
1 1 1 1 1 1 1 1 1 1 11991
/«•"— "-"*• .
1 1 1 1 1 1 1 1 1 1 11999
1 1 1 1 1 1 1 1 1 1 1
1993
~̂ ~
1 1 1 1 1 1 1 1 II 1
1994
r "1 1 1 1 1 1 1 1 1 1 1
1995
•». '
-
1 1 1 1 1 1 1 1 1 1 11996
0-̂140
120
100
80
60
_!/ RATIO OF INDEX OF PRICES RECEIVED TO INDEX OF PRICES PAID.SOURCE: DEPARTMENT OF AGRICULTURE COUNCIL OF ECONOMIC ADVISERS
[1990-92=100; not seasonally adjusted]
Period
198619871988198919901991199219931994 ..1995
1995: AugSeptOctNovDec
1996: JanPebMar
MayJuneJuly
Prices received by farmers
All farmproducts
878999
10410410098
101100102
102105104106108
108106109108111118118116
Crops
8786
104109103101101102105112
114115114117118
122122128128131141136131
Livestock andproducts
889193
1001059997
1009592
9294929496
949393939699
103103
Prices paid by farmers
All commodities,services, interest,taxes, and wage
rates1
8587919699
100101102106109
110110111111112
113113114114115115115115
Productionitems, interest,taxes, and wage
rates
8587929799
100101102106109
109109110111112
113113114114114114114114
Productionitems
8687909599
100101103106109
109109110111112
113113114114115115116116
Ratio2
103102108108105
9997989492
9395949596
9694969597
103103101
1 Includes items not shown separately.2 Percentage ratio of index of prices received by farmer
taxes, and wage rates.to index of prices paid, interest.
NOTE.—The official indexes are published on a 1910-14 base as required by law. The in-dexes have been converted to a 1990-92=100 base to facilitate comparison with other indexes.
Source: Department of Agriculture.
25
Digitized for FRASER http://fraser.stlouisfed.org/ Federal Reserve Bank of St. Louis
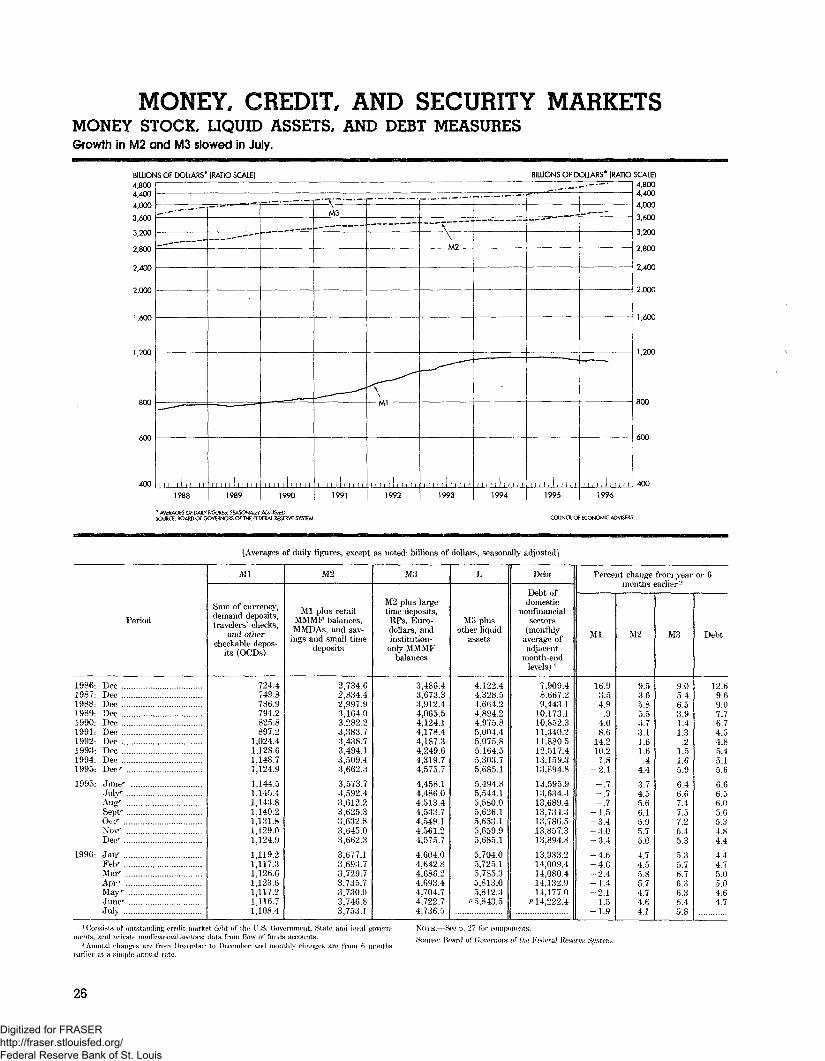
MONEY, CREDIT, AND SECURITY MARKETSMONEY STOCK, LIQUID ASSETS, AND DEBT MEASURESGrowth in M2 and M3 slowed in July.
2,000
1,600
800
600
BILLIONS OF DOLLARS* (RATIO SCALE)4,8004,400
4,000
3,600
3,200
2,800
2,400
1988 1990
M3
1991 1992 1993
BILLIONS OF COLLARS* (RATIO SCALE)4,8004,400
4,000
3,600
3,200
1994 1995
2,800
2,400
2,000
1,600
1,200
800
400
1996
COUNCIL OF ECONOMIC ADVISESS
[Averages of daily figures, except as noted; billions of dollars, seasonally adjusted]
Period
1986- Dec1987: Dee1988- Dec1989- Dec1990- Dee1991- Dec1992: Dec1993- Dec1994: Dec1995- Dec'
1995- June'JulyA\lg'
Sept'Octr
NovDec'
1996- Jan'Feb'Mar'Apr'May'June'July
Ml
Sum of currency,demand deposits,travelers' checks,
aud othercheckable depos-
its (OCDs)
724.4749.8786.9794.2825.8897.2
1,024.41,128.61,148.71,124.9
1,144.51,145.41,143.81,140.21,131.81,129.01,124.9
1,119.21,117.31,126.61,123.61,117.21,116.71,108.4
M2
Ml plus retailMMMF balances,MMDAs, and sav-
ings and small timedeposits
2,734.62,834.42,997.93,164.03,282.23,383.73,438.73,494.13,509.43,662.3
3,573.73,592.43,612.23,625.33,632.83,645.03,662.3
3,677.13,693.73.729.73,735.73,730.03,746.83,753.1
M3
M2 plus largetime deposits,RPs, Euro-dollars, andinstitution-
only MMMFbalances
3,486.43,673.33,912.44,065.54,124.14,178.44,187.34,249.64,319.74,575.7
4,458.14,486.04,513.44,533.74,549.14,561.24,575.7
4,604.04,642.84,686.24,693.44,704.74,722.74,736.5
L
M3 plusother liquid
assets
4,122.44,328.54,664.24,894.24,975.85,004.45.075.85,164.55,303.75,685.1
5,494.85,544.15,580.05,626.15,653.15,659.95,685.1
5,704.05,725.15.785.35,813.05,812.3
f 5,843.5
Debt
Debt ofdomestic
nonfinancialsectors
(monthlyaverage ofadjacent
month-endlevels) '
7,909.48,667.29,443.1
10,173.110,852.311,340.211,880.512,517.413,159.313,894.8
13,595.913,634.313.689.413,734.313,786.513.857.313,894.8
13,933.214,009.414,080.414,132.914,177.0
!• 14,222.4
Percent change from year or 6months earlier2
Ml
16.93.54.9
.94.08.6
14.210.21.8
-2.1
-.7rj
-.7-1.5-3.4-3.0-3.4
-4.6-4.6-2.4-1.4-2.1-1.5-l.S
M2
9.53.65.85.53.73.11.61.6.4
4.4
3.74.55.66.15.95.75.0
4.74.55.85.74.74.64.1
M3
9.05.46.53.91.41.3
.21.51.65.9
6.46.67.47.57.26.45.3
5.35.76.76.36.36.45.8
Debt
12.69.69.07.76.74.54.85.45.15.6
6.66.56.05.65.34.84.4
4.44.75.05.04.64.7
1 Consists' of outstanding m-dit market dobt of the U.S. Govern incut, State and local govi'rn-/mvif.s, arid private nojjfimmi-JiiJ scrtoj-s; data from flow of funds accounts.
-Annual dian^es are from Doc<>m!>er to l)wmilx*r and monthly changes art; from 6 monthsoarl'nT at a simple annual rate.
NOTE.—Si>c p. 27 for components.
.S;wra:: Board of Gowrnors of thv Fedora) Ifcsswve
26
Digitized for FRASER http://fraser.stlouisfed.org/ Federal Reserve Bank of St. Louis
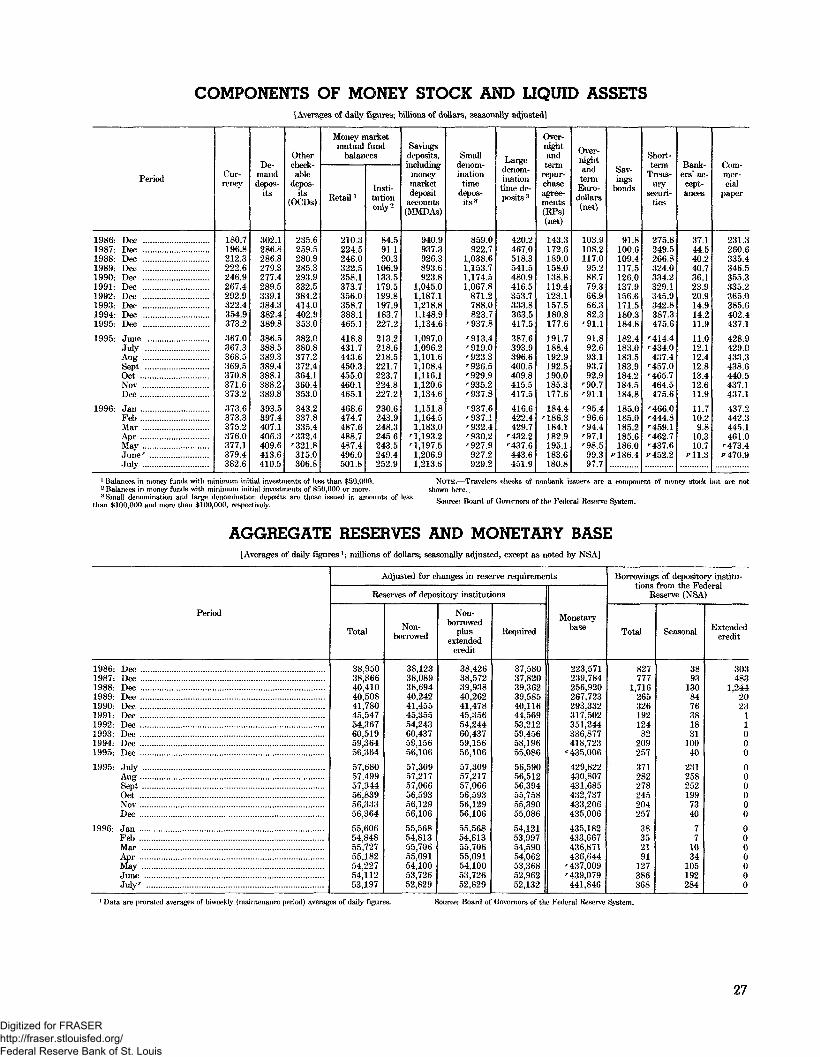
COMPONENTS OF MONEY STOCK AND LIQUID ASSETS[Averages of daily figures; billions of dollars, seasonally adjusted]
Period
1986- Dec .1987: Dec1988- Dee1989- Dec .1990- Dec1991- Dec1992- Dee1993- Dee1994- Dec1995- Dec
1995- JuneJuly
SeptOctNovDee
1996- Jan .FebMar
July
Cur-rency
180.7196.8212.3222.6246.9267.4292.9322.4354.9373.2
367.0367.3368.5369.5370.8371.6373.2
373.6373.3375.2376.0377.1379.4382.6
De-manddepos-
its
302.1286.8286.8279.3277.4289.5339.1384.3382.4389.8
386.5388.5389.3389.4388.1388.2389.8
393.5397.4407.1406.3409.6413.6410.5
Othercheck-able
depos-its
(OCDs)
235.6259.5280.9285.3293.9332.5384.2414.0402.9353.0
382.0380.8377.2372.4364.1360.4353.0
343.2337.8335.4
'332.4'321.8315.0306.8
Money marketmutual fund
balances
Retail i
210.3224.5246.0322.5358.1373.7356.0358.7388.1465.1
418.8431.7443.6450.3455.0460.1465.1
468.6474.7487.fr488.7487.4496.0501.8
Insti-tutiononly2
84.591.190.3
106.9133.5179.5199.8197.9183.7227.2
213.2218.6218.5221.7223.7224.8227.2
230.6243.9248.3245.6243.5249.4252.9
Savingsdeposits,including
moneymarketdeposit
accounts(MMDAs)
940.9937.3926.3893.6923.8
1,045.01,187.11,218.81,148.91,134.6
1,097.01,096.21,101.61,108.41,116.11,120.61,134.6
1,151.81,164.51,183.0
'1,193.2'1,197.51,206.91,213.6
Smalldenom-inationtime
depos-its3
859.0922.7
1,038.61,153.71,174.51,067.8
871.2788.0823.7
'937.8
'913.4'919.0'923.3'926.5'929.9'935.2'937.8
'937.6'937.1'932.4'930.2'927.9927.2929.2
Largedenom-ination
time de-posits 3
420.2467.0518.3541.5480.9416.5353.7333.8363.5417.5
387.6393.9396.6400.5409.8415.5417.5
416.6422.4429.7
'432.2'437.6443.6451.9
Over-nightandterm
repur-chaseagree-ments(BPs)(net)
143.3172.6189.0158.0138.8119.4128.1157.5180.8177.6
191.7188.4192.9192.5190.0185.3177.6
184.4'186.3184.1182.9195.1183.6180.8
Over-nightandtermEuro-dollars(net)
103.9108.2117.095.288.779.366.966.382.3
'91.1
91.892.693.193.792.9
'90.7'91.1
'95.4'96.6'94.4'97.1'98.599.397.7
Sav-ings
bonds
91.8100.6109.4117.5126.0137.9156.6171.5180.3184.8
182.4183.0183.5183.9184.2184.5184.8
185.0185.0185.2185.6186.0
f 186.4
Short-term
Treas-ury
securi-ties
275.8249.5266.8324.0334.2329.1345.9342.8387.3475.6
'414.4'434.0437.4
'457.0'465.7464.5475.6
'466.0'444.8'459.1'462.7'437.6P 452.2
Bank-ers' ac-cept-ances
37.144.540.240.736.123.920.914.914.211.9
11.012.112.412.813.412.611.9
11.710.29.8
10.310.7
fll.3
Com-mer-cial
paper
231.3260.6335.4346.5355.3335.2365.0385.6402.4437.1
428.9429.0433.3438.6440.5437.1437.1
437.2442.3445.1461.0
'473.4P 470.9
' Balances in money funds with minimum initial investments of less than $50,000.2 Balances in money funds with minimum initial investments of $50,000 or more.3 Small denomination and large denomination deposits are those issued in amounts of less
than $100,000 and more than $100,000, respectively.
NOTE.—Travelers cheeks of nonbank issuers are a w>nipoiient of money stock but are notshown here.
Source: Board of Governors of the Federal Reserve System.
AGGREGATE RESERVES AND MONETARY BASE[Averages of daily figures'; millions of dollars; seasonally adjusted, except as noted by NSA)
Period
1986: Dee1987- Dec1988- Dec1989- Dec1990- Dec1991- Dec1992- Dee1993- Dec1994- Dec .1995: Dee
1995- July
SeptGet
Dec
1996- JanPeb
July
Adjusted for changes in reserve requirements
Reserves of depository institutions
Total
38,95038,86640,41040,50841,78045,54754,36760,51959,36456,364
57,68057,49957,34456,83956,33356,364
55,60654,84855,72755,18254,22754,11253,197
Non-borrowed
38,12338,08938,69440,24241,45545,35554,24360,43759,15656,106
57,30957,21757,06656,59356,12956,106
55,56854,81355,70655,09154,10053,72652,829
Non-borrowed
plusextended
credit
38,42638,57239,93840,26241,47845,35654,24460,43759,15656,106
57,30957,21757,06656,59356,12956,106
55,56854,81355,70655,09154,10053,72652,829
Required
37,58037,82039,36239,58540,11644,56953,21259,45658,19655,086
56,59056,51256,39455,75855,39055,086
54,12153,99754,59054,06253,36852,96252,132
Monetarybase
223,571239,784256,920267,723293,332317,502351,244386,877418,723
'435,006
429,822430,807431,685432,737433,206435,006
435,182433,667436,871436,644
'437,009'439,079441,846
Borrowings of depository institu-tions from the Federal
Reserve (NSA)
Total
827777
1,71626532619212482
209257
371282278245204257
38352191
127386368
Seasonal
3893
1308476381831
10040
2312582521997340
77
1034
105192284
Extendedcredit
303483
1,244202311000
000000
0000000
1 Data are prorated averages of biweekly (maintenance period) averages of daily figures. Source; Board of Governors of the Federal Reserve System.
27
Digitized for FRASER http://fraser.stlouisfed.org/ Federal Reserve Bank of St. Louis
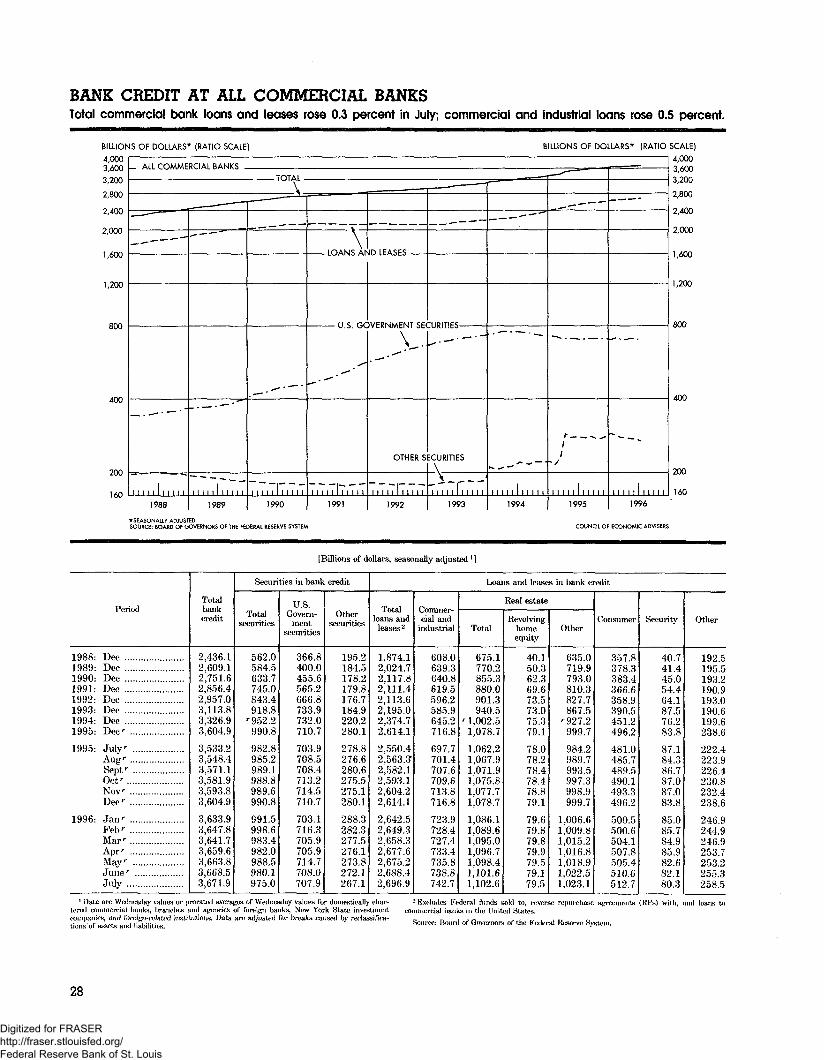
BANK CREDIT AT ALL COMMERCIAL BANKSTotal commercial bank loans and leases rose 0.3 percent in July; commercial and industrial loans rose 0.5 percent.
I- ALL COMMERCIAL BANKS
BILLIONS OF DOLLARS* (RATIO SCALE)
4,0003,600
3,200
2,800
2,400
2,000
1,600
1,200
800
400
200
1601988 1989 1990
• U.S. GOVERNMENT SECURITIES-
\ .
1991
OTHER SECURITIES
1 M I I I 1
1992
\H I I I 1 I
1993
BILLIONS OF DOLLARS* {RATIO SCALE)
4,0003,6003,200
2,800
2,400
2,000
1,600
1,200
800
I I i I I I M I I 1
1994
I I I I I I I t M 1
1995
400
200
1601996
*SEASONALLY ADJUSTEDSOURCE: BOARD OF GOVERNORS OF THE FEDERAL RESERVE SYSTEM COUNCIL OF ECONOMIC ADVISERS
[Billions of dollars, seasonally adjusted'
Period
1988- Dec1989- Dec1990- Dec1991: Dec1992: Dec1993- Dec ...1994: Dec1995- Decr
1995- July'Augr ...SepfOetr
Nov ...Decr
1996: Janr
Feb'Marr
Apr' ...May ..Juner
July
Totalbankcredit
2,436.12,609.12,751.62,856.42,957.03,113.83,326.93,604.9
3,533.23,548.43,571.13,581.93,593.83,604.9
3,633.93,647.83,641.73,659.63,663.83,668.53,671.9
Securities in bank credit
Totalsecurities
562.0584.5633.7745.0843.4918.8
r952.2990.8
982.8985.2989.1988.8989.6990.8
991.5998.6983.4982.0988.5980.1975.0
U.S.Govern-
mentsecurities
366.8400.0455.6565.2666.8733.9732.0710.7
703.9708.5708.4713.2714.5710.7
703.1716.3705.9705.9714.7708.0707.9
Othersecurities
195.2184.5178.2179.8176.7184.9220.2280.1
278.8276.6280.6275.5275.1280.1
288.3282.3277.5276.1273.8272.1267.1
Loans and leases in bank credit
Totalloans andleases 2
1,874.12,024.72,117.82,111.42,113.62,195.02,374.72,614.1
2,550.42,563.32,582.12,593.12,604.22,614.1
2,642.52,649.32,658.32,677.62,675.22,688.42,696.9
Commer-cial and
industrial
608.0639.3640.8619.5596.2585.9645.2716.8
697.7701.4707.6709.6713.8716.8
723.9728.4727.4733.4735.8738.8742.7
Real estate
Total
675.1770.2855.3880.0901.3940.5
••1,002.51,078.7
1,062.21,067.91,071.91,075.81,077.71,078.7
1,086.11,089.61,095.01,096.71,098.41,101.61,102.6
Revolvinghomeequity
40.150.362.369.673.573.075.379.1
78.078.278.478.478.879.1
79.679.879.879.979.579.179.5
Other
635.0719.9793.0810.3827.7867.5
r 927.2999.7
984.2989.7993.5997.3998.9999.7
1,006.61,009.81,015.21,016.81,018.91,022.51,023.1
Consumer
357.8378.3383.4366.6358.9390.5451.2496.2
481.0485.7489.5490.1493.3496.2
500.5500.6504.1507.8505.4510.6512.7
Security
40.741.445.054.464.187.576.283.8
87.184.386.787.087.083.8
85.085.784.985.982.682.180.3
Oilier
192.5195.5193.2190.9193.0190.6199.6238.6
222.4223.9226.4230.8232.4238.6
246.9244.9246.9253.7253.2255.3258.5
1 Data are Wednesday values or prorated averages of Wednesday values for domestically char-tered commercial banks, brandies and agencies of foreign banks, New York State investmentcompanies, and foreign-related institutions. Data an* adjusted for breaks caused by rcdassifj«a-tions of assets and liabilities.
2 Excludes Federal fluids sold to, reverse repurchase agreements (Ill's) with, and loans tocommercial hanks in the United States.
Source: Board of Governors of the Federal Reserve System.
28
Digitized for FRASER http://fraser.stlouisfed.org/ Federal Reserve Bank of St. Louis
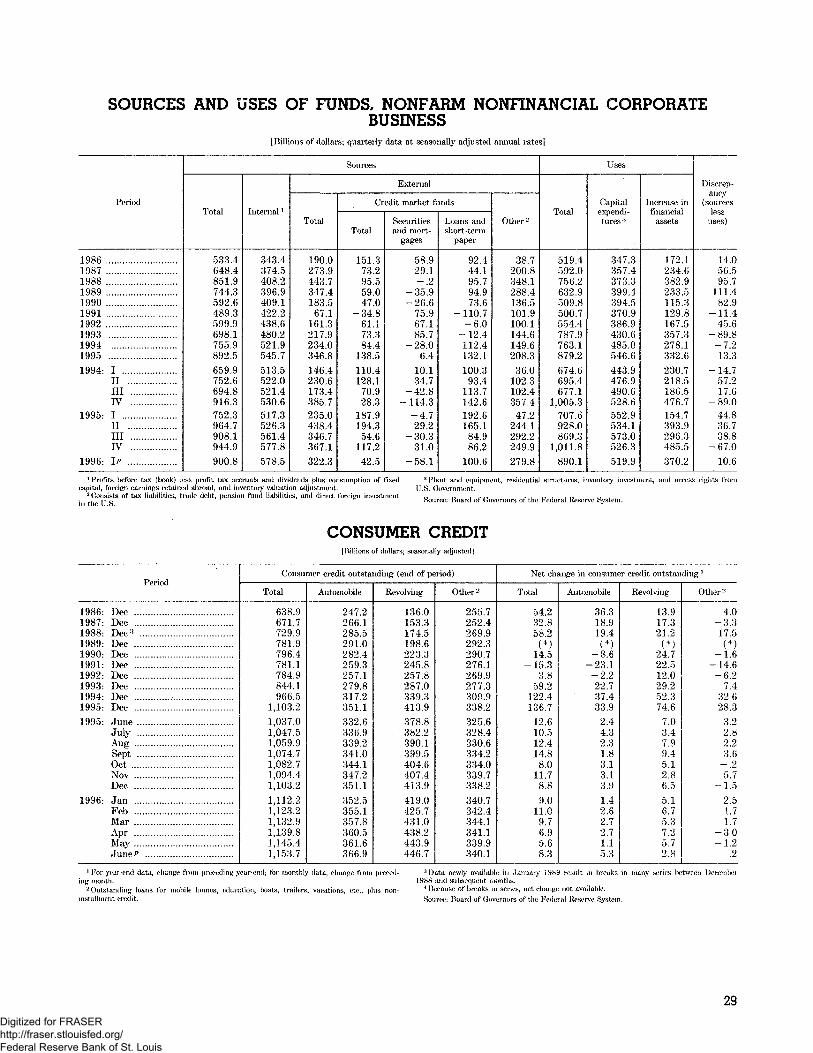
SOURCES AND USES OF FUNDS, NONFARM NONFINANCIAL CORPORATEBUSINESS
[Billions of dollars; quarterly data at seasonally adjusted animal rates]
Period
1986198719881989199019911992199319941995
1994- IIIIIIIV
1995- IIIIllIV
1996: IP
Sources
Total
533.4648.4851.9744.3592.6489.3599.9698.1755.9892.5659,9752.6694.8916.3752.3964.7908.1944.9900.8
Internal '
343.4374.5408.2396.9409.1422.2438.6480.2521.9545.7513.5522.0521.4530.6517.3526.3561.4577.8578.5
External
Total
190.0273.9443.7347.4183.567.1
161.3217.9234.0346.8146.4230.6173.4385.7235.0438.4346.7367.1322.3
Credit market funds
Total
151.373.295.559.047.0
-34.861.173.384.4
138.5110.4128.1
70,928.3
187.9194.3
54.6117.242.5
Securitiesand mort-
gages
58.929.1
0
35 9-26.6
75.967.185.7280
6.410.134.7
-42.8-114.3
-4.729.230 331.0
-58,1
Loans andshort-term
paper
92.444.195.794.973.6
-110.7-6.0
-12.4112.4132.1100.393.4
113.7142.6192.6165.184.986.2
100.6
Other2
38.7200.8348.1288.4136.5101.9100.1144.6149.6208.336.0
102.3102.4357.447.2
244.1292.2249.9279.8
Uses
Total
519.4592.0756.2632.9509.8500.7554.4787.9763.1879.2
674.6695.4677.1
1,005.3707.6928.0869.3
1,011.8890.1
Capitalexpendi-tures :i
347.3357.4373.3399.4394.5370.9386.9430.6485.0546.6
443.9476.9490.6528.6552.9534.1573.0526.3519.9
Increase infinancialassets
172.1234.6382.9233.5115.3129.8167.5357.3278.1332.6230.7218.5186.5476.7154.7393.9296.3485.5370.2
Discrep-ancy
(sourcesless
uses)
14.056.595.7
111.482.9
-11.445.6
-89.8-7.213.3
-14.757.217.6
-89.044.836.738.8
-67.010.6
1 Profits bofore tax (book) less profit tax accruals and dividends plus consumption of fixedcapital, foreign earnings retained abroad, arid inventory valuation adjustment
2 Consists of tax liabilities, trade debt, pension fund liabilities, and direct foreign investmentin the U.S.
:t Plant and equipment, residential structures, inventory investment, arid access rights fromU.S. Government.
Source: Hoard of Governors of the Federal Reserve System.
CONSUMER CREDITj Hi I lions of dollars; seasonally adjusted |
Period
1986- Dec1987- Dee1988- Dee3
1989- Dee .1990: Dee1991- Dec1992: Dec1993- Dec1994- Dee . .1995: Dec1995- June
JulyAugSeptOctNovDec
1996- JanFebMarApr
June p
Consumer credit outstanding (end of period)
Total
638.9671.7729.9781.9796.4781.1784.9844.1966.5
1,103.21,037.01,047.51,059.91,074.71,082.71,094.41,103.21,112.21,123.21,132.91,139.81,145.41,153.7
Automobile
247.2266.1285.5291.0282.4259.3257.1279.8317.2351.1332.6336.9339.2341.0344.1347.2351.1352.5355.1357.8360.5361.6366.9
Revolving
136.0153.3174.5198.6223.3245.8257.8287.0339.3413.9378.8382.2390.1399.5404.6407.4413.9419.0425.7431.0438.2443.9446.7
Other2
255.7252.4269.9292.3290.7276.1269.9277.3309.9338.2325.6328.4330.6334.2334.0339.7338.2340.7342.4344.1341.1339.9340.1
Net change in consumer credit outstanding '
Total
54.232.858.2( 4 )
14.5-15.3
3.859.2
122.4136.7
12.610.512.414.88.0
11.78.89.0
11.09.76.95.68.3
Automobile
36.318.919.4( 4 )
-8.6-23.1-2.222.737.433.92.44.32.31.83.13.13.91.42.62.72.71.15.3
Revolving
13.917.321.2
( 4 )24.722.512.029.252.374.67.03.47.99.45.12.86.5
5.16.75.37.25.72.8
Other2
4.0-3.317.5( 4 )
-1.6-14.6
-6.27.4
32.628.3
3.22.82.23.6-.25.7
-1.52.51.71.7
-3.01 9_L .£i
.21 For year-end data, change from preceding year-end; for monthly data, change from preced-
ing month.2 Outstanding loans for mobile homes, education, boats, trailers, vacations, eta., plus non-
installment credit.
:s Data newly available in January 1989 result in breaks in many series between Dece1988 and subsequent months.
4 Because of breaks in series, net change not available.Source: Hoard of Governors of the Federal Reserve System.
29Digitized for FRASER http://fraser.stlouisfed.org/ Federal Reserve Bank of St. Louis
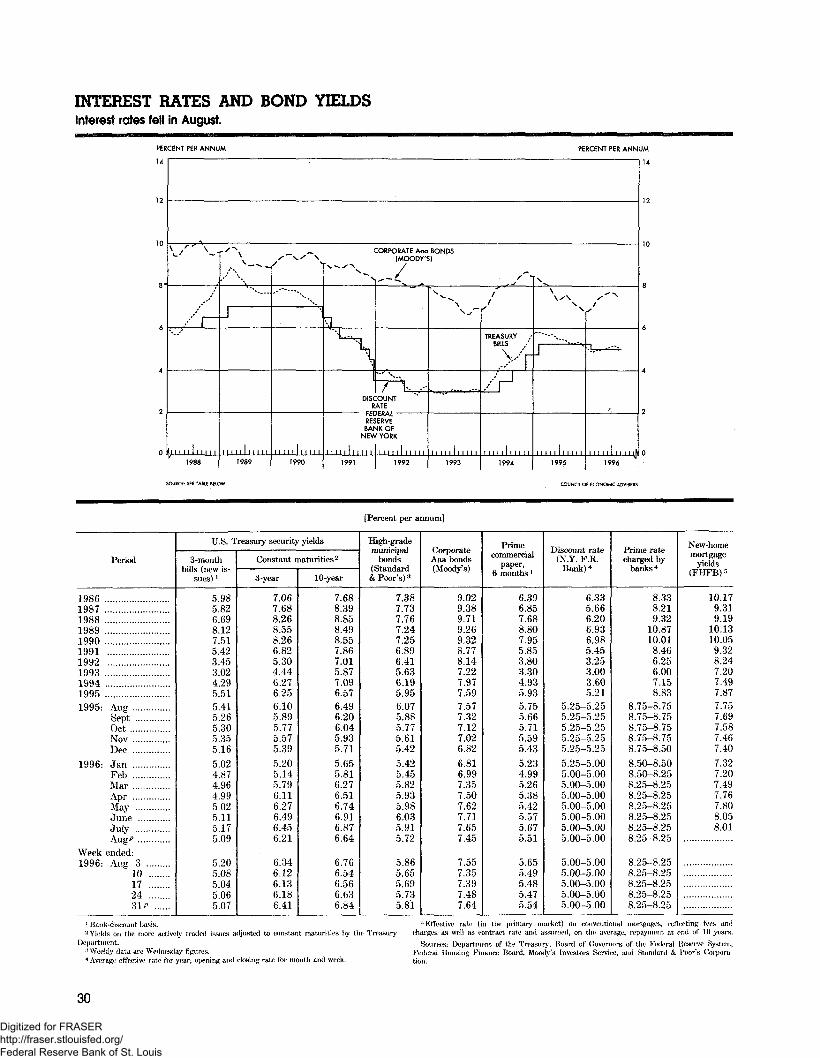
INTEREST RATES AND BOND YIELDSinterest rotes fell in August.
PER
14
12
10
8'
6
4
2
0
s
CENT PER ANNUM PERCENT PER ANN
v./ — -
/ r~
1 M 1 1 1 1 M 1 1
1988
OUSCE: SEE TABLE &EiC
"'\__
•-....
J
1 | 1 1 M 1 M M
1989
w
>• *-
"""•--,
t 1 I 1 1 1 t 1 1 M
1990
CORPORATE Aaa BONDS(MOODY'S)
\l
'/ K •"
DISCOUNTRATE
RESBAI-
NE^
1 M 1 1 ! 1 1 1 1 1
1991
ERVEJKOFYORK
M It 1 1 M 1 M
1992
^~-N
1993
!
TREASURYBILLS
>t/H
1994
\
X
""—-,.
J
M M , I
1995
COUNCIL O
.S
'••
l l l l. l j1996
f ECONOMIC ADVISERS
UM
14
12
10
8
6
4
2
0
[Percent per annum]
Period
198619871988198919901991 ..19921993199419951995- Aug
SeptOctNovDec
1996: JanPebMarApr
July
Week ended:1996: Aug 3
101724ZIP
U.S. Treasury security yields
3-monthbills (new is-
sues) '
5.985.826.698.127.515.423.453.024.295.515.415.265.305.355.165.024.874.964.995.025.115.175.09
5.205.085.045.065.07
Constant maturities2
3-year
7.067.688.268.558.266.825.304.446.276.256.105.895.775.575.395.205.145.796.116.276.496.456.21
6.346.126.136.186.41
10-year
7.688.398.858.498.557.867.015.877.096.576.496.206.045.935.715.655.816.276.516.746.916.876.64
6.766.546.566.636.84
High-grademunicipal
bonds(Standard& Poor's)3
7.387.737.767.247.256.896.415.636.195.956.075.885.775.615.425.425.455.825.935.986.035.915.72
5.865.655.695.735.81
CorporateAaa bonds(Mood/si
9.029.389.719.269.328.778.147.227.977.597.577.327.127.026.826.816.997.357.507.627.717.657.45
7.557.357.397.487.64
Primecommercial
paper,6 months '
6.396.857.688.807.955.853.803.304.935.935.755.665.715.595.435.234.995.265.385.425.575.675.51
5.655.495.485.475.54
Discount rate(N.Y. F.R.
Bank)4
6.335.666.206.936,985.453.253.003.605.21
5.25-5.255.25-5.255.25-5.255.25-5.255.25-5.255.25-5.005.00-5.005.00-5.005.00-5.005.00-5.005.00-5.005.00-5.005.00-5.00
5.00-5.005.00-5.005.00-5.005.00-5.005.00-5.00
Prime ratecharged by
banks 4
8.338.219.32
10.8710.018.466.256.007.158.83
8.75-8.758.75-8.758.75-8.758.75-8.758.75-8.508.50-8.508.50-8.258.25-8.258.25-8.258.25-8.258.25-8.258.25-8.258.25-8.25
8.25-8.258.25-8.258.25-8.258.25-8.258.25-8.25
New-homemortgage
yields(PHFB) s
10.179.319.19
10.1310.059.328.247.207.497.877.757.697.587.467.407.327.207.497.767.808.058.01
1 Hank-discount basis.2 Yields on the more actively traded issues acljusted to constant maturities by the Treasury
Department.3 Weekly data are Wednesday figures.4 Average effective rate for year; opening and closing rate for month and week.
5 Effective rate (in the primary market) on conventional mortgages, reflecting fees andcharges as well as contract rate anil assumed, on the average, repayment at end of 10 years.
Sources: Department of the Treasury, Board of Governors of the Federal Reserve System,Federal Housing Finance Board, Moody's Investors Service, and Standard & Poor's Corpora-tion.
30
Digitized for FRASER http://fraser.stlouisfed.org/ Federal Reserve Bank of St. Louis
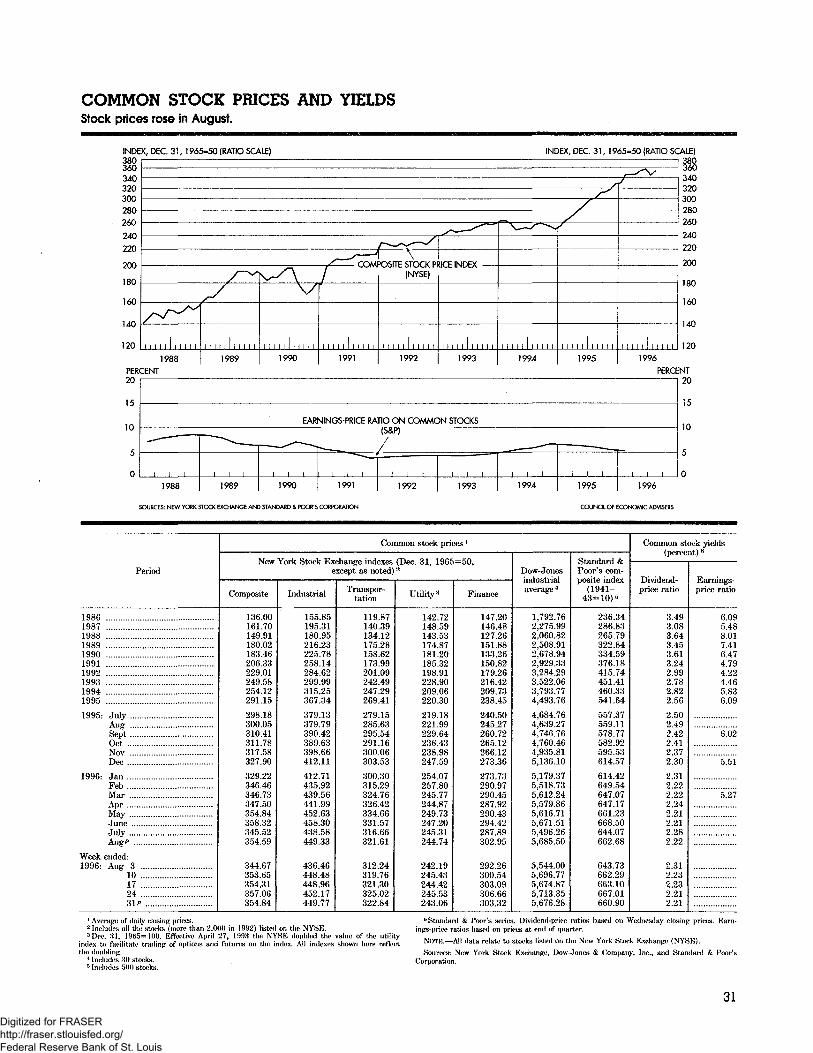
COMMON STOCK PRICES AND YIELDSStock prices rose in August.
INDEX, DEC. 31,1965=50 (RATO SCALE) INDEX, DEC. 31, 1965=50 (RATIO SCALE)JBU360340320300280260
240
220
200
180
160
140
120
PER20
15
10
5
0
r-^\S
f
y-'/
_ /
•̂~— — "*"
s~^^/
/~^r^^
MI 1 1 1 1 1 11988
:ENT
i i i i i l l l l l1989
\^
/
A /\s
1 1 1 1 1
1990
/->
s (COM
i i i i i 1 : 1 1 11991
*^~*s\
OSITE STOCK Pf(NYSE)
M i l l l l l l l1992
ilCE 1NDEX
i i i i i INN
1993
"N — -/ -v-
l l l l l i i i i i
1994
'
i i M i 1 i i i i i
1995
J
M I N I M .
1996
PERCE
—
i i i1988
i
' — | ^-
i
1989
i
EARNINGS-P
' ^—
i
1990
i
RICE RATIO ON(S&P)/
""" — Ti
1991
COMMON STOCKS
„
l i i
1992
l
"•
1
1993
. . '
i i1994
i i i
1995
Ka
I 1 1
1996
J8U360340320300280260
240220
200
180
160
140
120
NT20
15
10
5
0
SOURCES: NEW YORK STOCK EXCHANGE AND STANDARD & POOR'S CORPORATION COUNCIL Of ECONOMIC ADVISERS
Period
1986198719881989199019911992199319941995
1995- July
SeptOct
Dec
1996- JanFebMar
July
Week ended:1996- Aug 3
1017243lP
Common stock prices '
New York Stock Exchange indexes (Dec. 31, 1965except as noted) 2
Composite
136.00161.70149.91180.02183.46206.33229.01249.58254.12291.15
298.18300.05310.41311.78317.58327.90
329.22346.46346.73347.50354.84358.32345.52354.59
344.67353.65354.31357.06354.84
Industrial
155.85195.31180.95216.23225.78258.14284.62299.99315.25367.34
379.13379.79390.42389.63398.66412.11
412.71435.92439.56441.99452.63458.30438.58449.33
436.46448.48448.96452.17449.77
Transpor-tation
119.87140.39134.12175.28158.62173.99201.09242.49247.29269.41
279.15285.63295.54291.16300.06303.53
300.30315.29324.76326.42334.66331.57316.66321.61
312.24319.76321.30325.02322.84
Utility3
142.72148.59143.53174.87181.20185.32198.91228.90209.06220.30
219.18221.99229.64236.43238.98247.59
254.07257.80245.77244.87249.73247.20245.31244.74
242.19245.43244.42245.53243.06
Finance
147.20146.48127.26151.88133.26150.82179.26216.42209.73238.45
240.50245.27260.72265.12266.12273.36
273.73290.97290.45287.92290.43294.42287.89302.95
292.26300.54303.09306.66303.32
Dow-Jonesindustrialaverage4
1,792.762,275.992,060.822,508.912,678.942,929.333,284.293,522.063,793.774,493.76
4,684.764,639.274,746.764,760.464,935.815,136.10
5,179.375,518.735,612.245,579.865,616.715,671.515,496.265,685.50
5,544.005,696.775,674.875,713.355,676.28
Standard &Poor's com-posite index
(1941-43=10)0
236.34286.83265.79322.84334.59376.18415.74451 .41460.33541.64
557.37559.11578.77582.92595.53614.57
614.42649.54647.07647.17661.23668.50644.07662.68
643.73662.29663.10667.01660.90
Common stock yields(percent) 6
Dividend-price ratio
3.493.083.643.453.613.242.992.782.822.56
2.502.492.422.412.372.30
2.312.222.222.242.212.212.282.22
2.312.232.232.212.21
Eaniings-priee ratio
6.095.488.017.416.474.794.224.465.836.09
6.02
5.51
5.27
1 Average of daily closing prices.* Includes ail th« stocks (more than 2,000 in 1992) listed on the NYSE.3 Due. 31, 1965=100. Effective April 27, 1993 the NYSE doubled the value of the utility
index to facilitate trading of options and futures on the index. All indexes shown here reflectthe doubling.
4 Includes 30 stocks.•"'Includes 500 stocks.
6 Standard & Poor's series. Dividend-price ratios based on Wednesday closing prices. Karn-ings-priee ratios based on prices at end of quarter.
NOTE.—All data relate to stocks listed on the New York Stock Exchange (NYSE).
Sources: New York Stock Exchange, Dow-Jones & CTompany, Inc., and Stand an! & Poor's(Corporation.
31
Digitized for FRASER http://fraser.stlouisfed.org/ Federal Reserve Bank of St. Louis
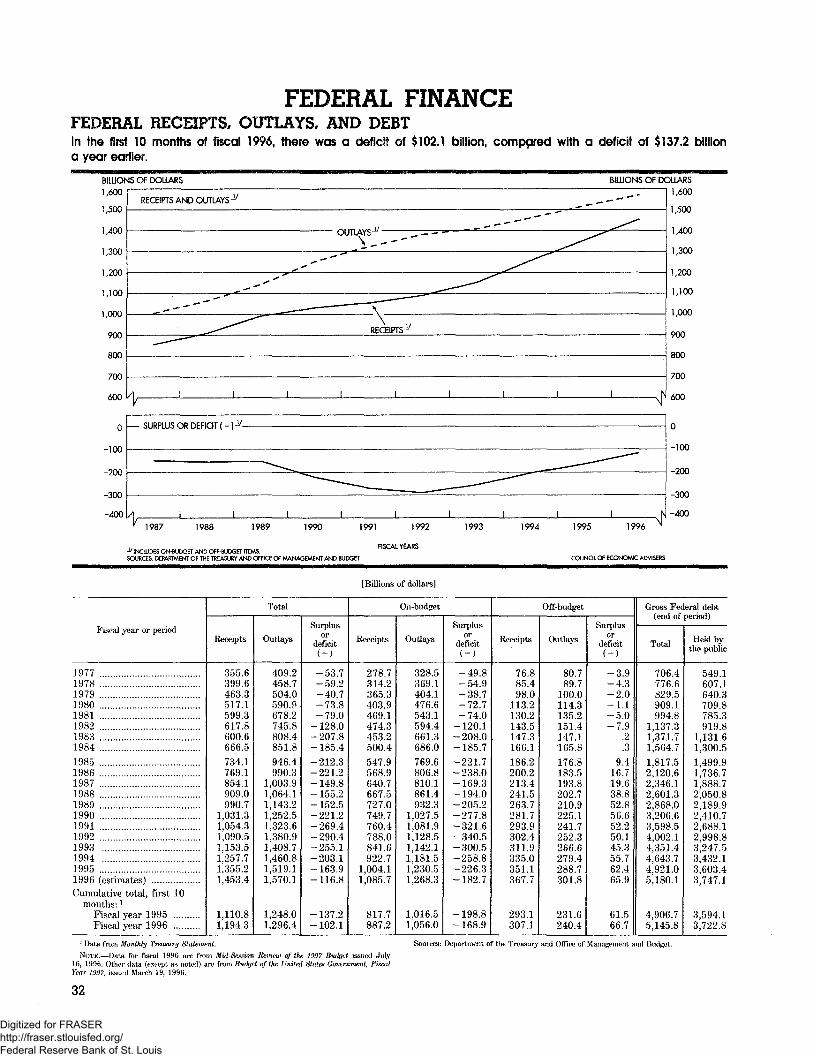
FEDERAL FINANCEFEDERAL RECEIPTS, OUTLAYS, AND DEBTIn the first 10 months of fiscal 1996, there was a deficit of $102.1 billion, compared with a deficit of $137.2 billiona year earlier.
BILLIONS OF DOLLARS
1,600
1,500
1,400
1,300
1,200
1,100
1,000
900
800
700
600
-100
-200
-300
-400
RECEIPTS AND OUTLAYS ̂
BILLIONS OF DOLLARS
1,600
1,500
OUTLAYS J/
RECEIPTS ~
— SURPLUS OR DEFICIT ( -)J/-
_L
1,400
1,300
1,200
1,100
1,000
900
800
700
600
-100
-200
-300
-400
1987 1988 1989 1990
-" INOJUDES ON-BUOOET AND OF F-BUDGET ITEMS.SOURCES: DEPARTMENT OF THE TREASURY AND OFFICE Of MANAGEMENT AND BUDGET
1991 1992
FISCAL YEARS
1993 1994 1995 1996
COUNCIL OF ECONOMIC ADVISERS
[Billions of dollars]
Fiscal year or period
1977197819791980198119821983198419851986198719881989199019911992199319941995 . . .1996 (estimates)Cumulative total, first 10
months: 'Fiscal year 1995Fiscal vear 1996 ..
Total
Receipts
355.6399.6463.3517.1599.3617.8600.6666.5
734.1769.1854.1909.0990.7
1,031.31,054.31,090.51,153.51,257.71,355.21,453.4
1,110.81,194.3
Outlays
409.2458.7504.0590.9678.2745.8808.4851.8946.4990.3
1,003.91,064.11,143.21,252.51,323.61,380.91,408.71,460.81,519.11,570.1
1,248.01,296.4
Surplusor
deficit(-)
-53.7-59.2-40.7-73.8-79.0
-128.0-207.8-185.4
-212.3-221.2-149.8- 155.2-152.5-221.2-269.4-290.4-255.1-203.1-163.9-116.8
-137.2-102.1
On-budget
Receipts
278.7314.2365.3403.9469.1474.3453.2500.4
547.9568.9640.7667.5727.0749.7760.4788.0841.6922.7
1,004.11,085.7
817.7887.2
Outlays
328.5369.1404.1476.6543.1594.4661.3686.0
769.6806.8810.1861.4932.3
1,027.51,081.91,128.51,142.11,181.51,230.51,268.3
1,016.51,056.0
Surplusor
deficit(-)
-49.8549
-38.7-72.7-74.0
-120.1-208.0-185.7
-221.7-238.0-169.3-194.0-205.2-277.8-321.6-340.5-300.5-258.8-226.3-182.7
-198.8-168.9
Off-budget
Receipts
76.885.498.0
113.2130.2143.5147.3166.1186.2200.2213.4241.5263.7281.7293.9302.4311.9335.0351.1367.7
293.1307.1
Outlays
80.789.7
100.0114.3135.2151.4147.1165.8176.8183.5193.8202.7210.9225.1241.7252.3266.6279.4288.7301.8
231.6240.4
Surplusor
deficit(-)
-3.9-4.3-2.0-1.1
50-7.9
.2
.39.4
16.719.638.852.856.652.250.145.355.762.465.9
61.566.7
Gross Federal debt(end of period)
Total
706.4776.6829.5909.1994.8
1,137.31,371.71,564.7
1,817.52,120.62,346.12,601.32,868.03,206.63,598.54,002.14,351.44,643.74,921.05,180.1
4,906.75,145.8
Held bythe public
549.1607.1640.3709.8785.3919.8
1,131.61,300.5
1,499.91,736.71,888.72,050.82,189.92,410.72,688.12,998.83,247.53,432.13,603.43,747.1
3,594.13,722.8
1 Data from Monthly Treaxury Statement.
NOTK.—Data for fiscal 1996 are from Mifl-Sejudon Retnew of the, 1!)!)7 Budget issued July16, 1996. Other data (except as noted) are from Budget tfthe United Stntat (Jwernment, FiscalYear 1997, issued March 19, 1996.
32
Sources: Department of the Treasury and Office of Management arid Budget
Digitized for FRASER http://fraser.stlouisfed.org/ Federal Reserve Bank of St. Louis
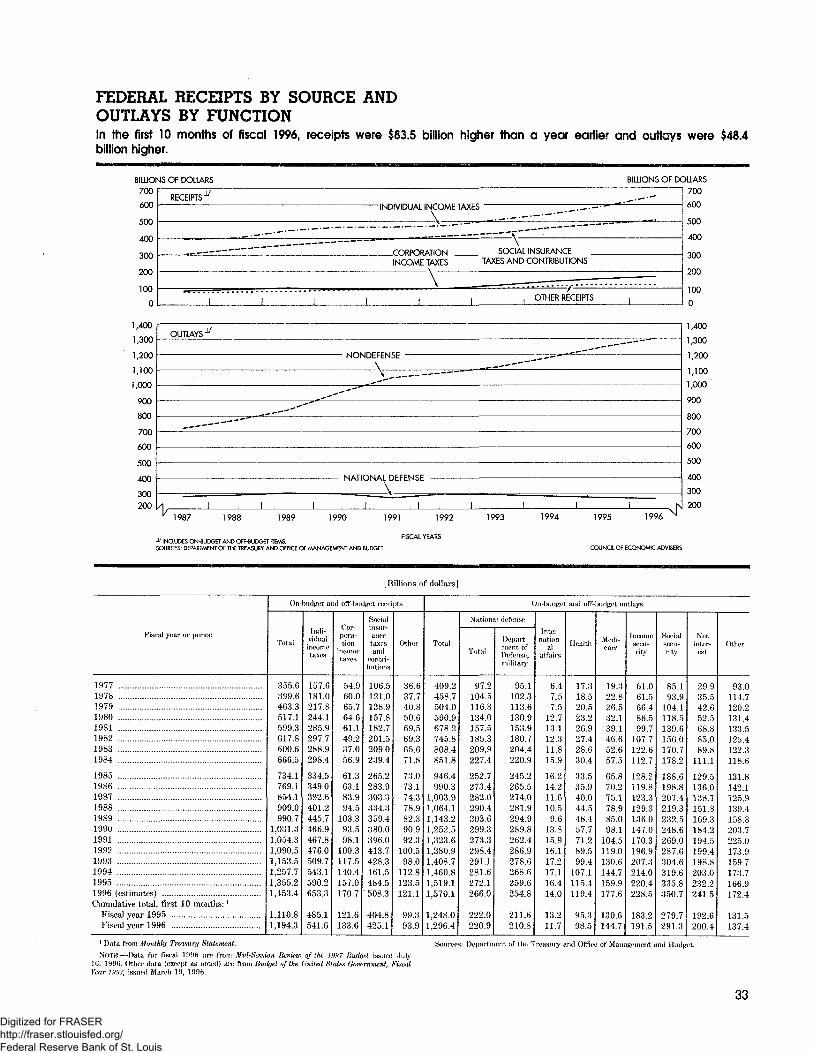
FEDERAL RECEIPTS BY SOURCE ANDOUTLAYS BY FUNCTIONIn the first 10 months of fiscal 1996, receipts were $83.5 billion higher than a year earlier and outlays were $48.4billion higher.
BILLIONS OF DOLLARS/oo
'SOO
n
RECEIPTS^INDIVIDUAL INCOME TAXES
rnpprwATpnNINCOME TAXES
-
1 1 1 1 1
•
r—\
SOCIAL INSURANCETAXES AND CONTRIBUTIONS
, OTHER RECEIPTS ,
BILLIONS OF DOLLARS700
600
500
400
300
200
100
0
1,400
1,300
1,200
1,100
1,000
900
800
700
600
500
400
300
200
OUTLAYS^
\
__ •—*""
„,--'''
'
A \ \ 1 1 1
" 1987 1988 1989 1990 1991 1992
1 1 1 1 N1993 1994 1995 1996 ̂
1,400
1,300
1,200
1,100
1,000
900
800
700
600
500
400
300
200
-^ INCLUDES ON-BUDGET AND OFF-BUDGET ITEMS.SOURCES: DEPARTMENT OF THE TREASURY AND OFFICE OF MANAGEMENT AND BUDGET COUNCIL OF ECONOMIC ADVISERS
[Billions of dollars]
Fiscal year or period
19771978197919801981198219831984
198519861987198819891990199119921993199419951996 (estimates)Cumulative total, first 10 months: J
Fiscal year 1995Fiscal year 1996
On-bud{jet arid off-budget rcec >ts
Total
355.6399.6463.3517.1599.3617.8600.6666.5
734.1769.1854.1909.0990.7
1,031.31,054.31,090.51,153.51,257.71,355.21,453.4
1,110.81,194.3
Indi-vidualincometaxes
157.6181.0217.8244.1285.9297.7288.9298.4
334.5349.0392.6401.2445.7466.9467.8476.0509.7543.1590.2653.3
485.1541.6
Cor-pora-tion
incometaxes
54.960.065.764.661.149.237.056.9
61.363.183.994.5
103.393.598.1
100.3117.5140.4157.0170.7
121.6133.6
Socialinsur-ance
tjiXCS
andcontri-butions
106.5121.0138.9157.8182.7201.5209.0239.4
265.2283.9303.3334.3359.4380.0396.0413.7428.3461.5484.5508.3
404.8425.1
Other
36.637.740.850.669.569.365.671.8
73.073.174.378.982.390.992.3
100.598.0
112.8123.5121.1
99.393.9
On-budget arid off-budget outlays
Total
409.2458.7504.0590.9678.2745.8808.4851.8
946.4990.3
1,003.91,064.11,143.21,252.51,323.61,380.91,408.71,460.81,519.11,570.1
1,248.01,296.4
National defense
Total
97.2104.5116.3134.0157.5185.3209.9227.4
252.7273.4282.0290.4303.6299.3273.3298.4291.1281.6272.1266.0
222.0220.9
Depart-ment ofDefense,military
95.1102.3113.6130.9153.9180.7204.4220.9
245.2265.5274.0281.9294.9289.8262.4286.9278.6268.6259.6254.8
211.6210.8
Inter-nation-
alaffairs
6.47.57.5
12.713.112.311.815.9
16.214.211.610.59.6
13.815.916.117.217.116.414.0
13.211.7
Health
17.318.520.523.226.927.428.630.4
33.535.940.044.548.457.771.289.599.4
107.1115.4119.4
95.398.5
Medi-care
19.322.826.532.139.146.652.657.5
65.870.275.178.985.098.1
104.5119.0130.6144.7159.9177.6
130.6144.7
Incomesecu-rity
61.061.566.486.599.7
107.7122.6112.7
128.2119.8123.3129.3136.0147.0170.3196.9207.3214.0220.4228.5
183.2191.5
Socialsecu-rity
85.193.9
104.1118.5139.6156.0170.7178.2
188.6198.8207.4219.3232.5248.6269.0287.6304.6319.6335.8350.7
279.7291.3
Netinter-est
29.935.542.652.568.885.089.8
111.1
129.5136.0138.7151.8169.3184.2194.5199.4198.8203.0232.2241.5
192.6200.4
Other
93.0114.7120.2131.4133.5125.4122.3118.6
131.8142.1125.9139.4158.8203.7225.0173.9159.7173.7166.9172.4
131.5137.4
1 Data from Monthly Tmtumry Strttummt.
NOTE.—Data for fiscal 199fi are from Mid-fiction K&nKw of thr, 1!)!)7 Budget issued July16, 1996. Other data (except as rioted) aw from liutlget of the, Unital State* Gomrnnwnt, FixadYear 1997, issued March 19, 1996.
Sources: Department of the Treasury and Offiw of Management and Bud<ji>t.
33
Digitized for FRASER http://fraser.stlouisfed.org/ Federal Reserve Bank of St. Louis
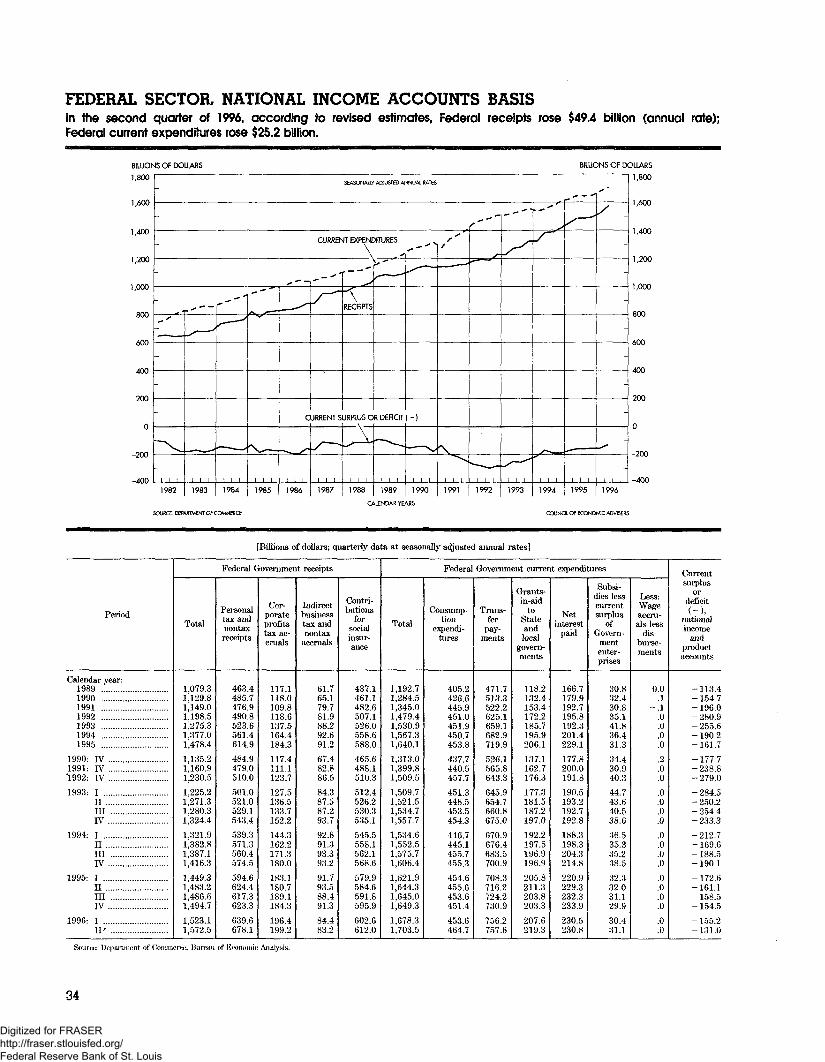
FEDERAL SECTOR, NATIONAL INCOME ACCOUNTS BASISIn the second quarter of 1996, according to revised estimates, Federal receipts rose $49.4 billion (annual rate);Federal current expenditures rose $25.2 billion.
BlUJOh
!,800
1,600
1,400
1,200
1,000
800
600
400
200
0
-400
IS OF DOUARS BILUONS OF CX
SEASONALLY ADJUSTED ANNUAL RATES
-
CURRENT EXPENDITURES
\ -
-
^ s
- -.
-
-
-
^J1 1 1
1982
SOURCE: OEP
-* — —
^ '
— ~^*
1 1 1
1983
yjTMENTOf1
_ —
'"""''
^— -~^^
1 1 1
1984
OMMERCE
"*
iA" ^* *"*
^ —
1 ! 1
1985
^
C
-. s-
\ 1 1
1986
_ _ - • "
S^~
LIRRENT S
-/ 1
! 1 !
1987
^
RECEIPTS
URPlUS O
1 ! 1
1988
O
f •
R DEFICIT
~ -̂
1 1 1
1989
UfNDARYE,
— •** N**•
^
(-)
^
i i i1990
«,RS
sf
/
• •
'\
1 1 !
1991
s
^—~/~
' --
i i i
1992
_ - - •
^
^^\ 1 1
1993
^ **• ""
I/""
>"-N™-
1 1 1
1994
COUNC
x- — **
/-^
1 1 1
1995
LOFECONO
-' -
/
-
-
-
-
-
-
-
-^
! I t
1996
M3C ADVCER,
OLLARS
1,800
1,600
1,400
1,200
1,000
800
600
400
200
0
-200
-400
[Billions of dollars; quarterly data at seasonally adjusted annual rates]
Period
Calendar year:1989199019911992199319941995
1990- IV1991: IV1992: IV
1993: IIIIIIIV
1994: IIImIV
1995: IIIinrv
1996: IIP
Federal Government receipts
Total
1,079.31,129.81,149.01,198.51,275.31,377.01,478.4
1,135.21,160.91,230.5
1,225.21,271.31,280.31,324.4
1,321.91,382.81,387.11,416.3
1,449.31,483.21,486.61,494.7
1,523.11,572.5
Personaltax andnontaxreceipts
463.4485.7476.9490.8523.6561.4614.9
484.9479.0510.0
501.0521.0529.1543.4
539.3571.3560.4574.5
594.6624.4617.3623.3
639.6678.1
Cor-porateprofitstax ac-cruals
117.1118.0109.8118.6137.5164.4184.3
117.4111.1123.7
127.5136.5133.7152.2
144.3162.2171.3180.0
183.1180.7189.1184.3
196.4199.2
Indirectbusinesstax andnontax
accruals
61.765.179.781.988.292.691.2
67.482.886.5
84.387.587.293.7
92.891.393.393.2
91.793.588.491.3
84.483.2
Contri-butions
forsocialinsur-ance
437.1461.1482.6507.1526.0558.6588.0
465.6488.1510.3
512.4526.2530.3535.1
545.5558.1562.1568.6
579.9584.6591.8595.9
602.6612.0
Federal Government current expenditures
Total
1,192.71,284.51,345.01,479.41,530.91,567.31,640.1
1,313.01,399.81,509.5
1,509.71,521.51,534.71,557.7
1,534.61,552.51,575.71,606.4
1,621.91,644.31,645.01,649.3
1,678.31,703.5
Consump-tion
expendi-tures
405.2426.6445.9451.0451.9450.7453.8
437.7440.5457.7
451.3448.5453.5454.3
446.7445.1455.7455.3
454.6455.6453.6451.4
453.6464.7
Trans-fer
pay-ments
471.7513.3522.2625.1659.1682.9719,9
526.1565.8643.3
645.9654.7660.8675.0
670.9676.4683.5700.9
708.3716.2724.2730.9
756.2757.6
Grants-in-aid
toStateandlocal
govern-ments
118.2132.4153.4172.2185.7195.9206.1
137.1162.7176.3
177.3181.5187.2197.0
192.2197.5196.9196.9
205.8211.3203.8203.3
207.6219.3
Netinterest
paid
166.7179.9192.7195.8192.3201.4229.1
177.8200.0191.8
190.5193.2192.7192.8
188.3198.3204.3214.8
220.9229.3232.3233.9
230.5230.8
Subsi-dies lesscurrentsurplus
ofGovern-
mententer-prises
30.832.430.835.141.836.431.3
34.430.940.3
44.743.640.538.6
36.535.335.238.5
32.332.031.129.9
30.431.1
Less:Wageaccru-als less
dis-burse-ments
0.0.1I
'o.0.0.02.0.0
.0
.0
.0
.0
.0
.0
.0
.0
.0
.0
.0
.0
.0
.0
Currentsurplus
ordeficit(-),
nationalincome
andproductaccounts
-113.4-154.7- 196.0-280.9-255.6- 190.2-161.7
-177.7-238.8-279.0
- 284.5-250.2-254.4- 233.3
-212.7-169.6- 188.5-190.1
-172.6-161.1-158.5-154.5
-155.2-131.0
Source: Department of Commerce., Bureau of Economic Analysis.
34
Digitized for FRASER http://fraser.stlouisfed.org/ Federal Reserve Bank of St. Louis
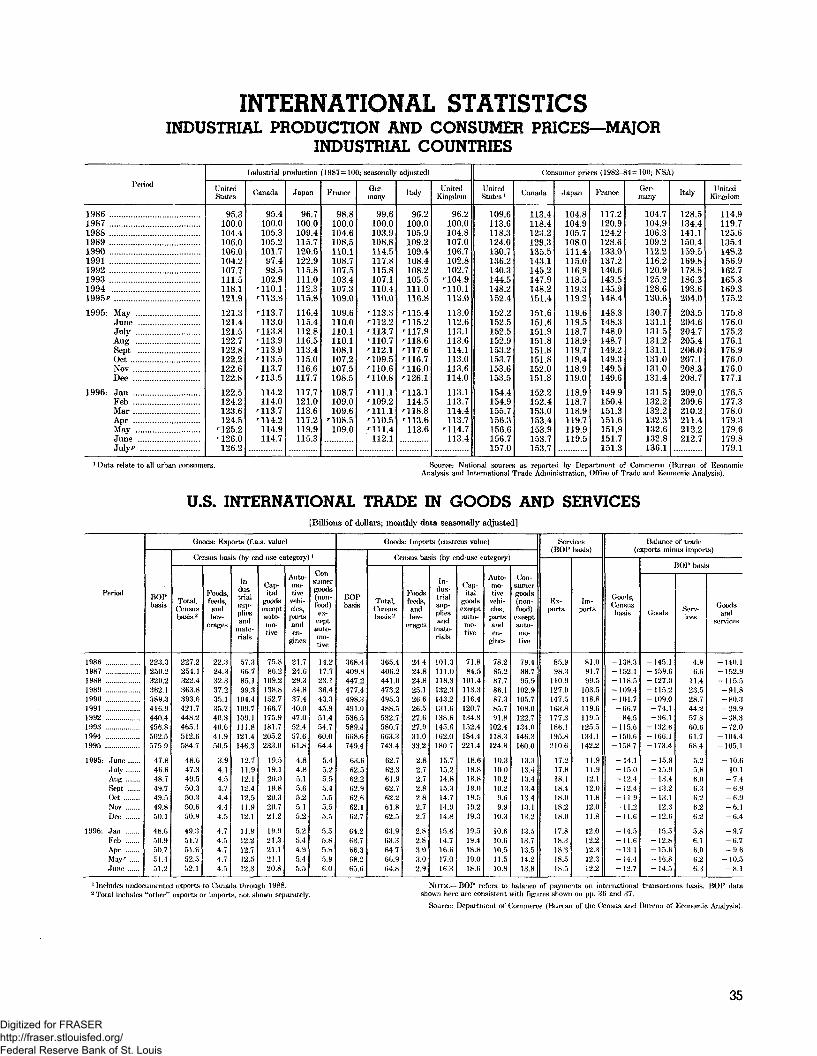
INTERNATIONAL STATISTICSINDUSTRIAL PRODUCTION AND CONSUMER PRICES—MAJOR
INDUSTRIAL COUNTRIES
Period
1986198719881989 . .199019911992199319941995P
1995: May
July
SeptOct
Dec
1996- JanFebMar
May
July/7
Industrial production (1987=100; seasonally adjusted)
UnitedStates
95.3100.0104.4106.0106.0104.2107.7111.5118.1121.9
121.3121.4121.5122.7122.8122.2122.6122.8
122.5124.2123.6124.5
'125.2'126.0
126.2
Canada
95.4100.0105.3105.2101.7
97.498.5
102.9'110.1'113.8
'113.7113.0
'113.8'113.9'113.9'113.5113.7
'113.5
114.2114.0
'113.7'114.2
114.9114.7
Japan
96.7100.0109.4115.7120.6122.9115.8111.0112.3115.8
116.4115.4112.8116.5113.4115.0116.6117.7
117.7121.0113.6117.2119.9115.3
France
98.8100.0104.6108.5110.1108.7107.5103.4107.3109.0
109.6110.0110.1110.1108.1107.2107.5108.5
108.7109.0109.6
'108.5109.0
Ger-many
99.6100.0103.9108.8114.5117.8115.8107.1110.4110.0
'113.3'112.2'113.7'110.7'112.1'109.5'110.6'110.8
'111.1'109.2'111.1'110.5'111.4112.1
Italy
96.2100.0105.9109.2109.4108.4108.2105.5111.0116.8
'115.4'115.2'117.9'118.6'117.6'116.7'116.0'126.1
'113.1114.5
'118.8'113.6113.6
UnitedKingdom
96.2100.0104.8107.0106.7102.8102.7
'104.9'110.1113.0
113.0112.6113.1113.6114.1113.0113.6114.0
113.1113.7114.4113.7
'114.7113.4
Consumer prices (1982-84=10(1; NSA)
UnitedStates '
109.6113.6118.3124.0130.7136.2140.3144.5148.2152.4
152.2152.5152.5152.9153.2153.7153.6153.5
154.4154.9155.7156.3156.6156.7157.0
Canada
113.4118.4123.2129.3135.5143.1145.2147.9148.2151.4
151.6151.6151.9151.8151.8151.8152.0151.8
152.2152.4153.0153.4153.9153.7153.7
Japan
104.8104.9105.7108.0111.4115.0116.9118.5119.3119.2
119.6119.5118.7118.9119.7119.4118.9119.0
118.9118.7118.9119.7119.9119.5
France
117.2120.9124.2128.6133.0137.2140.6143.5145.9148.4
148.3148.3148.0148.7149.2149.3149.5149.6
149.9150.4151.3151.6151.9151.7151.3
Ger-mariy
104.7104.9106.3109.2112.2116.2120.9125.2128.6130.8
130.7131.1131.5131.2131.1131.0131.0131.4
131.5132.2132.2132.3132.6132.8136.1
Italy
128.5134.4141.1150.4159.5169.8178.8186.3193.6204.0
203.5204.6204.7205.4206.0207.1208.3208.7
209.0209.6210.2211.4212.2212.7
UnitedKingdom
114.9119.7125.6135.4148.2156.9162.7165.3169.3175.2
175.8176.0175.2176.1176.9176.0176.0177.1
176.5177.3178.0179.3179.6179.8179.1
1 Data relate to all urban (Consumers. Scum;: National sources as reported by Department of (Commerce (Bureau of EconomicAnalysis and International Trade Administration, Office of Trade and Economic Analysis).
U.S. INTERNATIONAL TRADE IN GOODS AND SERVICES[Billions of dollars; monthly data seasonally adjusted]
Period
1986198719881989199019911992199319941995
1995: JuneJulyAugSept(X*NovDec
1996: JanFcbAprMay'June
Goods: Exports (f.a.s. value)
BOPbasis
223 3250.2320.2362.1389.3416.9440.4456.8502.5575.9
47.846.648.749.749.549.850.1
48.650.950.751.451.2
(Census basis (by end-use category) '
Total,Censusbasis*
2272254.1322.4363.8393.6421.7448.2465.1512.6584.7
48.647.349.550.350.350.650.9
49.351.751.652.552.1
Foods,feeds,andbev-
erages
22324.332.337.235.135.740.340.641.950.5
3.94.14.54.74.44.44.5
4.74.54.74.74.5
In-dus-trialsup-pliesand
mate-rials
57 366.785.)99.3
104.4109.7109.1111.8121.4146.3
12.711.912.112.412.511.912.1
11.912.212.712.512.3
Cap-ital
goodsexceptauto-mo-tive
75.886.2
109.2138.8152.7166.7175.9181.7205.2233.0
19.519.120.019.820.320.721.2
19.921.321.121.120.8
Auto-mo-tive
velii-clcs,partsanden-
gines
21.724.629.334.837.440.047.052.457.661.8
4.84.85.15.65.25.15.2
5.25.44.95.45.5
Con-sumergoods(non-food)ex-
raptauto-mo-tive
14.217.723.136.443.345.951.454.760.064.4
.42.5.4.5.5.5
.5
.8
.8
.96.0
Goods: Imports (customs value)
BOPbasis
368.4409.8447.2477.4498.3491.0536.5589.4668.6749.4
63.662.562.262.962.662.162.7
64.263.766.368.265.6
Census basis (by end-use category)
Total,Censusbasis2
365.4406.2441.0473.2495.3488.5532.7580.7663.3743.4
62.762.361.962.762.261.862.5
63.963.364.766.964.8
Foodsfeeds,and|X!V-
erages
24.424.824.825.126.626.527.627.931.033.2
2.82.72.72.82.82.72.7
2.82.83.03.02.9
In-dus-trialsup-pliesand
mate-rials
101.3111.0118.3132.3143.2131.6138.6145.6162.0180.7
15.715.214.815.314.714.914.8
15.614.716.617.016.3
Cap-ital
goodsexceptauto-mo-tive
71.884.5
101.4113.3116.4120.7134.3152.4184.4221.4
18.618.818.819.019.519.219.3
19.519.418.819.018.6
Auto-mo-tive
vehi-cles,partsandenr
gines
78.285.287.786.187.385.791.8
102.4118.3124.8
10.310.010.210.29.69.9
10.3
10.610.610.511.510.8
Con-sumergoods(non-food)
exceptauto-mo-tive
79.488.795.9
102.9105.7108.0122.7134.0146.3160.0
13.313.413.413.413.413.113.2
13.513.713.514.213.8
Serviecs(BOP basis)
Ex-ports
85.998.3
110.9127.0147.51 63.8177.3186.1195.8210.6
17.217.818.118.418.018.218.0
17.818.318.318.518.5
Im-ports
81.091.799.5
103.5118.8119.61 19.5125.5134.1142.2
11.911.912.112.011.812.011.8
12.012.212.312.312.2
Balance of trade(expo s minus imports)
Goo-Is,Censusbasis
- 138.3- 152.1-118.5-109.4-101.7-66.7— 84.5
-115.6-150.6-158.7
-14.1-15.0-12.4-12.4-11.9-11.2-11.6
-14.5-11.6-13.1-14.4-12.7
BOP basis
Goods
-145.1-159.6- 127.0-115.2- 109.0-74.1-96.1
-132.6-166.1-173.4
-15.9-15.9-13.4-13.2-13.1- 12.3-12.6
-15.5-12.8-15.6-16.8-14.5
Serv-ices
4.96.6
11.423.528.744.257.860.661.768.4
5.25.86.06.36.26.26.2
5.86.16.06.26.3
Goodsand
services
— 140.1-152.9- 1 15.5-91.8-80.3-29.9— 38.3-72.0
-104.4-105.1
-10.6-10.1-7.4-6.9-6.9-6.1-6.4
-9.7-6.7-9.6
-10.5-8.1
1 Includes undocumented exports to Canada through 1988.2 Total includes "other" exports or imports, not shown separately.
NOTE.—BO!' refers to balance of payments on international transactions basis. HOI* datashown here are consistent with figures shown oil pp. 36 and 37.
Source: Department of Commerce (Bureau of t!ie Census and Bureau of Economic Analysis).
35
Digitized for FRASER http://fraser.stlouisfed.org/ Federal Reserve Bank of St. Louis
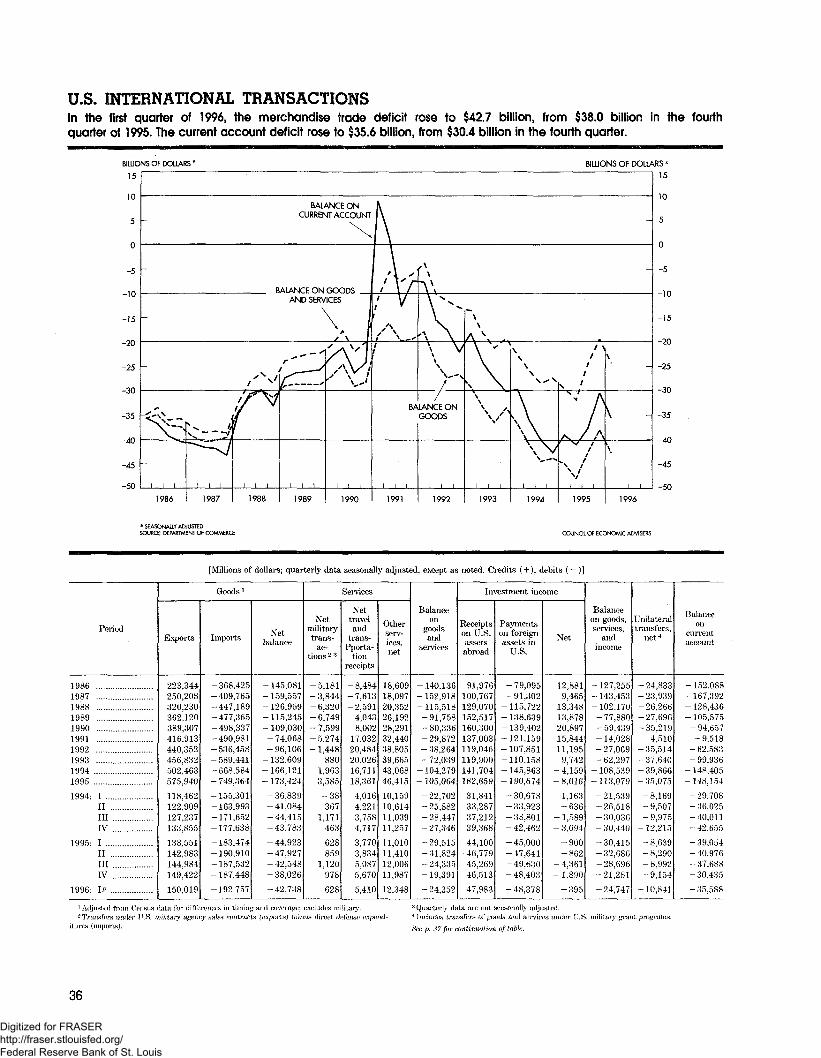
U.S. INTERNATIONAL TRANSACTIONSIn the first quarter of 1996, the merchandise trade deficit rose to $42.7 billion, from $38.0 billion in the fourthquarter of 1995. The current account deficit rose to $35.6 billion, from $30.4 billion in the fourth quarter.
BILLIONS OF DOLLARS* BILLIONS OF DOLLARS *
-45 ~
-50
-40
45
-50198«
* SEASONALLY ADJUSTEDSOURCE: DEPARTMENT Of COMMERCE COUNCIL OF ECONOMIC ADVISERS
[Millions of dollars; quarterly data seasonally adjusted, except as noted. Credits ( + ), debits ( — ) ]
Period
19861987198819891990199119921993 ....19941995
1994- IIIIIIIV
1995: IIIIllIV . ..
1996: IP . ..
Goods '
Exports
223,344250,208320,230362,120389,307416,913440,352456,832502,463575,940
118,462122,909127,237133,855
138,551142,983144,984149,422
150,019
Imports
-368,425-409,765-447,189-477,365-498,337-490,981-536,458-589,441-668,584- 749,364
-155,301-163,993-171,652-177,638
- 183,474-190,910-187,532-187,448
-192,757
Netbalance
- 145,081- 159,557-126,959-115,245- 109,030- 74,068-96,106
-132,609-166,121-173,424
-36,839-41,084-44,415-43,783
-44,923-47,927-42,548- 38,026
-42,738
Services
Netmilitarytrans-
ac-tions 2 *
-5,181-3,844- 6,320-6,749-7,599-5,274-1,448
8801,9633,585
-38367
1,171463
628859
1,120978
628
Nettraveland
trans-Pporta-
tionreceipts
- 8,484-7,613-2,591
4,0438,002
17,03220,48420,02616,71118,361
4,0164,2213,7584,717
3,7703,8345,0875,670
5,410
Otherserv-ices,net
18,60918,09720,35226,19228,29132,44038,80539,66543,06846,415
10,15910,61411,03911,257
11,01011,41012,00611,987
12,348
Balanceon
goodsand
services
-140,136-152,918-115,518-91,758- 80,336-29,872-38,264- 72,039
-104,379- 105,064
- 22,702-25,882-28,447- 27,346
-29,515-31,824-24,335-19,391
-24,352
Investment income
Receiptson U.S.assetsabroad
91,976100,767129,070152,517160,300137,003119,046119,900141,704182,659
31,84133,28737,21239,368
44,10046,77945,26946,513
47,983
Paymentson foreignassets in
U.S.
-79,095-91,302
-115,722-138,639-139,402-121,159- 107,851-110,158- 145,863-190,674
-30,678-33,923-38,801-42,462
-45,000-47,641-49,630-48,403
-48,378
Net
12,8819,465
13,34813,87820,89715,84411,195
9,742- 4,159-8,016
1,163-636
- 1,589- 3,094
-900-862
- 4,361-1,890
-395
Balanceon goods,services,
andincome
- 127,255- 143,453-102,170-77,880-59,439-14,028-27,069-62,297
-108,539-113,079
-21,539-26,518-30,036-30,440
-30,415-32,686-28,696-21,281
-24,747
Unilateraltransfers,
net4
-24,833-23,939-26,266-27,696-35,219
4,510-35,514-37,640-39,866- 35,075
-8,169-9,507-9,975
-12,215
-8,639-8.290- 8,992-9,154
-10,841
Balanceon
currentaccount
-152,088-167,392- 128,436-105,575-94,657-9,518
-62,583- 99,936- 148,405-148,254
-29,708- 36,025-40,011-42,655
- 39,054- 40,976-37,688- 30,435
-35,5881 Adjnstod from Census data for diffm;n(*s in timing and coverage; excludes military.2 Transfers under H..S. mifi ta/y agtwty saltw wntrarts (exacts) minus tiircc.t <M«nsft <!xp«ri<J-
itim>s (imports).
36
Digitized for FRASER http://fraser.stlouisfed.org/ Federal Reserve Bank of St. Louis
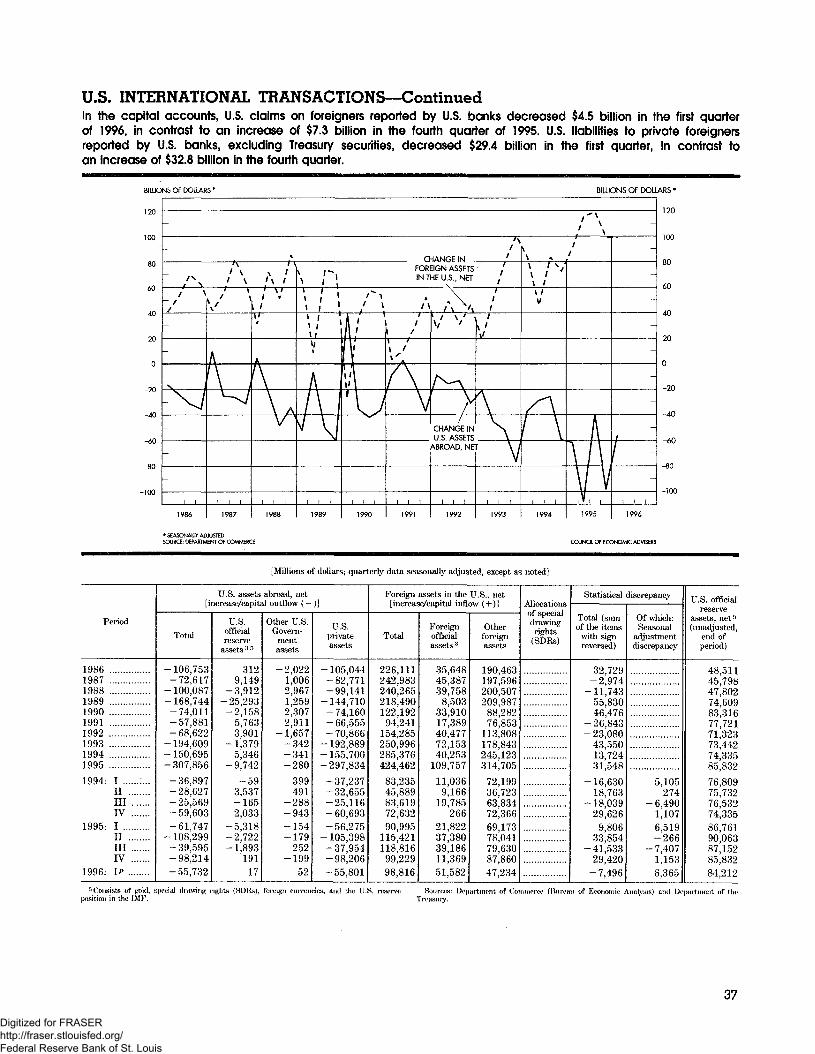
U.S. INTERNATIONAL TRANSACTIONS—ContinuedIn the capital accounts, U.S. claims on foreigners reported by U.S. banks decreased $4.5 billion in the first quarterof 1996, in contrast to an increase of $7.3 billion in the fourth quarter of 1995. U.S. liabilities to private foreignersreported by U.S. banks, excluding Treasury securities, decreased $29.4 billion in the first quarter, in contrast toan increase of $32.8 billion in the fourth quarter.
BILLIONS OF DOLLARS* BILLIONS OF DOLLARS *
COUNCIL OF ECONOMIC ADVISERS
[Millions of dollars; quarterly data seasonally adjusted, except as noted]
Period
19861987198819891990199119921993199419951994: I
IIIllrv
1995: IIIIllIV
1996: IP
U.S. assets[inerease/capit
Total
-106,753-72,617
-100,087-168,744-74,011-57,881-68,622
-194,609-150,695-307,856
-36,897-28,627-25,569-59,603-61,747
-108,299-39,595-98,214-55,732
U.S.officialreserve
assets ;i f)
3129,149
-3,912-25,293-2,158
5,7633,901
-1,3795,346
-9,742
-593,537-1652,033t),o .10
-2,722-1,893
19117
abroad, net
Other U.S.Govern-
mentassets
-2,0221,0062,9671,2592,3072,911
-1,657-342-341-280
399491
-288-943-154-179
252-199
52
)]
U.S.privateassets
-105,044-82,771-99,141
-144,710-74,160- 66 555- 70,866
-192,889-155 700-297,834
-37,237-32,655-25 116-60,693-56,275- 105,398-37,954-98,206-55,801
Foreign assets in the U.S., net[increase/capital inflow ( + )]
Total
226,111242,983240,265218,490122,19294,241
154,285250,996285,376424,462
83,23545,88983,61972,63290,995
115,421118,816
99,22998,816
Foreignofficialassets :J
35,64845,38739,7588,503
33,91017,38940,47772,15340,253
109,757
11,0369,166
19,785266
21,82237,38039,18611,36951,582
Otherforeignassets
190,463197,596200,507209,987
88,28276,853
113,808178,843245,123314,705
72,19936,72363,83472,36669,17378,04179,63087,86047,234
Allocationsof specialdrawingrights
(SDRs)
Statistical discrepancy
Total (sumof the items
with signreversed)
32,729-2,974
-11,74355,83046.476
-26,843-23,080
43,55013,72431,548
-16,63018,763
-18,03929,626
9,80633,854
-41,53329,420
-7,496
Of which:Seasonal
adjustmentdiscrepancy
5,105274
- 6,4901,1076,519-266
-7,4071,1536,365
U.S. officialreserve
assets, net-1"'(unadjusted,
end ofperiod)
48,51145,79847,80274,60983,31677,72171,32373,44274,33585,832
76,80975,73276,53274,33586,76190,06387,15285,83284,212
f) Consists of gold, special drawing rights (SDlls), foreign currencies, and the U.S. reserveposition in the IMF.
Sources: Department of Commerce (Bureau of Economic Analysis) and Department of theTreasury.
37
Digitized for FRASER http://fraser.stlouisfed.org/ Federal Reserve Bank of St. Louis
ContentsTOTAL OUTPUT. INCOME, AND SPENDING Page
Gross Domestic Product 1Real Gross Domestic Product 2Implicit Price Deflators for Gross Domestic Product 2Quantity and Price Indexes for GDP and Percent Changes , 3Nonfinancial Corporate Business—Output, Costs, and Profits 3National Income 4Real Personal Consumption Expenditures 4Sources of Personal Income 5Disposition of Personal Income 6Farm Income 7Corporate Profits 8Real Gross Private Domestic Investment 9Real Private Fixed Investment by Type 10Business Investment and Plans 10
EMPLOYMENT. UNEMPLOYMENT, AND WAGESStatus of the Labor Force 11Selected Unemployment Rates 12Selected Measures of Unemployment and Unemployment Insurance Programs 13Nonagricultural Employment 14Average Weekly Hours, Hourly Earnings, and Weekly Earnings—Private Nonagricultural Industries 15Employment Cost Index—Private Industry 15Productivity and Related Data, Business Sector 16
PRODUCTION AND BUSINESS ACTIVITYIndustrial Production and Capacity Utilization 17Industrial Production—Major Market Groups and Selected Manufactures 18New Construction ., 19New Private Housing and Vacancy Rates 19Business Sales and Inventories—Manufacturing and Trade 20Manufacturers' Shipments, Inventories, and Orders 21
PRICESProducer Prices 22Consumer Prices—All Urban Consumers 23Changes in Producer Prices for Finished Goods 24Changes in Consumer Prices—All Urban Consumers 24Prices Received and Paid by Farmers 25
MONEY, CREDIT, AND SECURITY MARKETSMoney Stock, Liquid Assets, and Debt Measures 26Components of Money Stock and Liquid Assets , 27Aggregate Reserves and Monetary Base 27Bank Credit at All Commercial Banks 28Sources and Uses of Funds, Nonfarm Nonfinancial Corporate Business 29Consumer Credit 29Interest Rates and Bond Yields 30Common Stock Prices and Yields 31
FEDERAL FINANCEFederal Receipts, Outlays, and Debt 32Federal Receipts by Source and Outlays by Function 33Federal Sector, National Income Accounts Basis 34
INTERNATIONAL STATISTICSIndustrial Production and Consumer Prices—Major Industrial Countries 35U.S. International Trade in Goods and Services 35U.S. International Transactions 36
General Notes
Detail in these tables may not add to totals because of rounding.Unless otherwise noted, all dollar figures are in current dollars.Symbols used:
P Preliminary.r Revised.c Corrected.... Not available (also, not applicable).NSA not seasonally adjusted.
For sale by the Superintendent of Documents. U.S. Government Printing Office,Washington, D.C. 20402. Price $3.00 (single copy) ($3.75 foreign).
nr. Subscription price: $33.00 per year; $41.25 for foreign mailing.38 U.S. GOVERNMENT PRINTING OFFICE : 1996 26-822
Digitized for FRASER http://fraser.stlouisfed.org/ Federal Reserve Bank of St. Louis