Embed Size (px)
Citation preview
Economic Implications ofEconomic Implications ofEconomic Implications of Economic Implications of Renewed Timber Renewed Timber
Harvesting on a Federal Harvesting on a Federal F t i W t OF t i W t OForest in Western OregonForest in Western Oregon
Ted L. HelvoigtTed L. HelvoigtggECONorthwestECONorthwestMay 8, 2007May 8, 2007
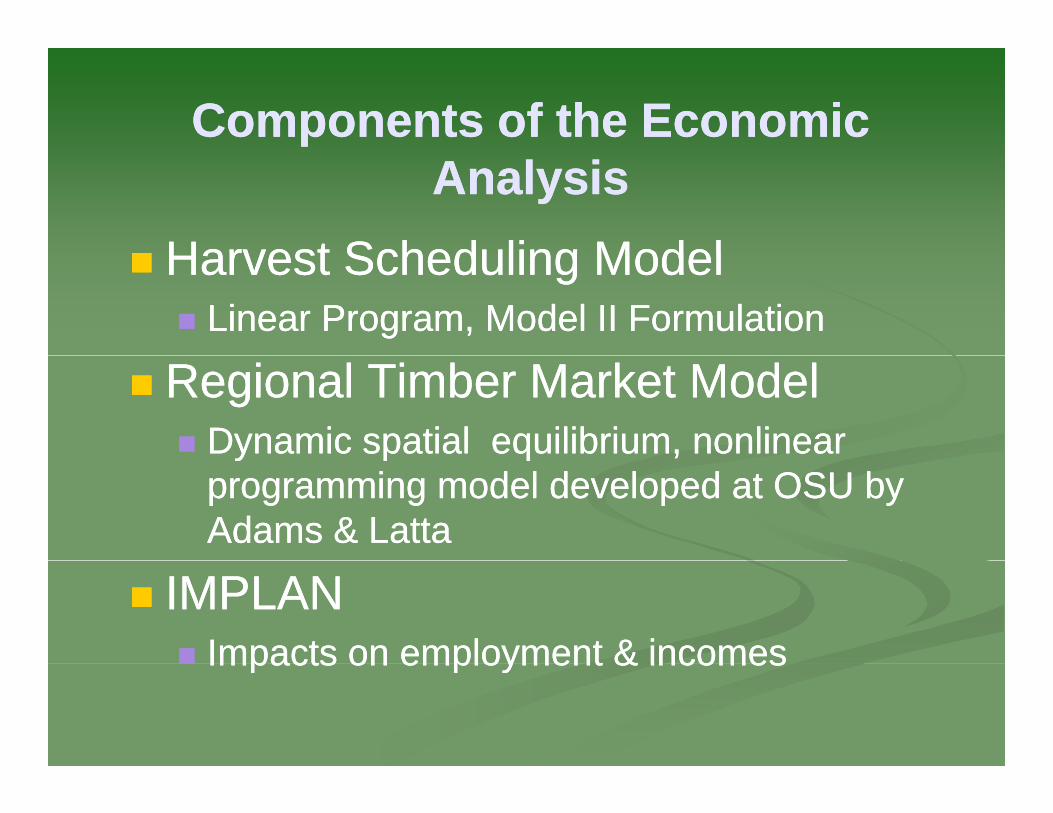
Components of the Economic Components of the Economic AnalysisAnalysis
Harvest Scheduling ModelHarvest Scheduling ModelHarvest Scheduling ModelHarvest Scheduling ModelLinear Program, Model II FormulationLinear Program, Model II Formulation
Regional Timber Market ModelRegional Timber Market ModelDynamic spatial equilibrium, nonlinear Dynamic spatial equilibrium, nonlinear y p q ,y p q ,programming model developed at OSU by programming model developed at OSU by Adams & LattaAdams & Latta
IMPLANIMPLANImpacts on employment & incomesImpacts on employment & incomesImpacts on employment & incomesImpacts on employment & incomes
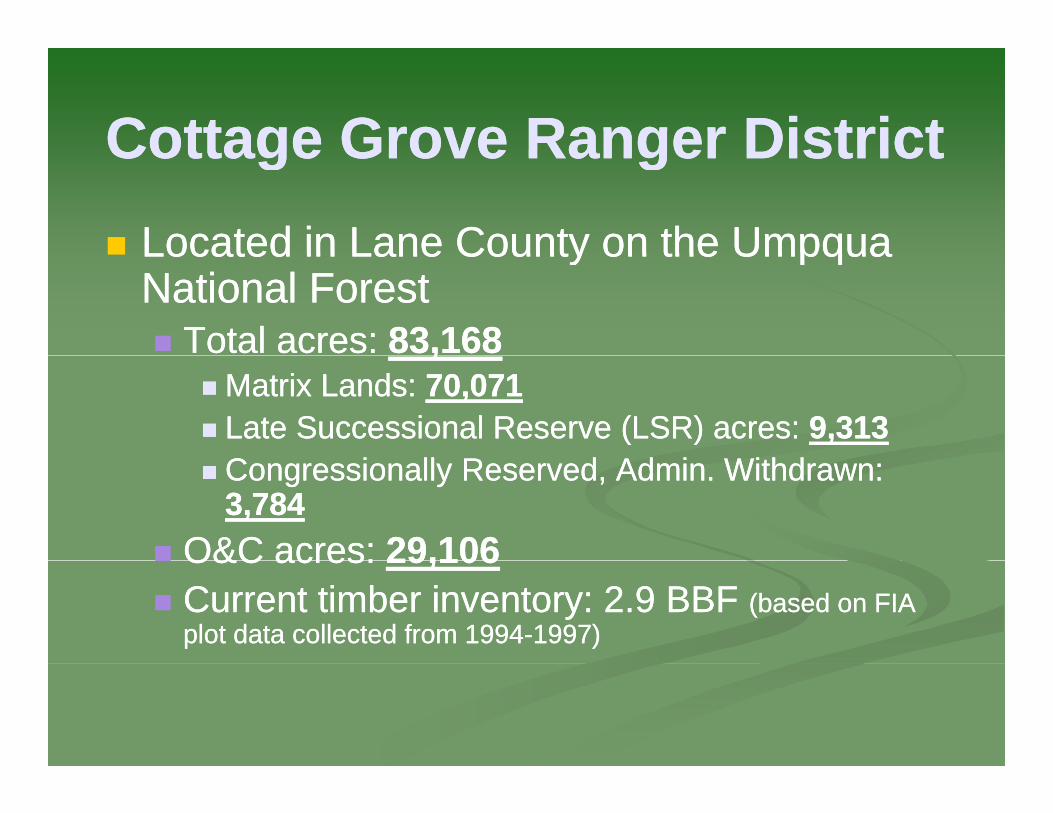
Cottage Grove Ranger DistrictCottage Grove Ranger DistrictCottage Grove Ranger DistrictCottage Grove Ranger DistrictLocated in Lane County on the UmpquaLocated in Lane County on the UmpquaLocated in Lane County on the Umpqua Located in Lane County on the Umpqua National ForestNational Forest
Total acres: Total acres: 83,16883,168,,Matrix Lands: Matrix Lands: 70,07170,071Late Successional Reserve (LSR) acres: Late Successional Reserve (LSR) acres: 9,3139,313C i ll R d Ad i Wi hdC i ll R d Ad i Wi hdCongressionally Reserved, Admin. Withdrawn: Congressionally Reserved, Admin. Withdrawn: 3,7843,784
O&C acres:O&C acres: 29,10629,106O&C acres: O&C acres: 29,10629,106Current timber inventory: 2.9 BBF Current timber inventory: 2.9 BBF (based on FIA (based on FIA plot data collected from 1994plot data collected from 1994--1997)1997)
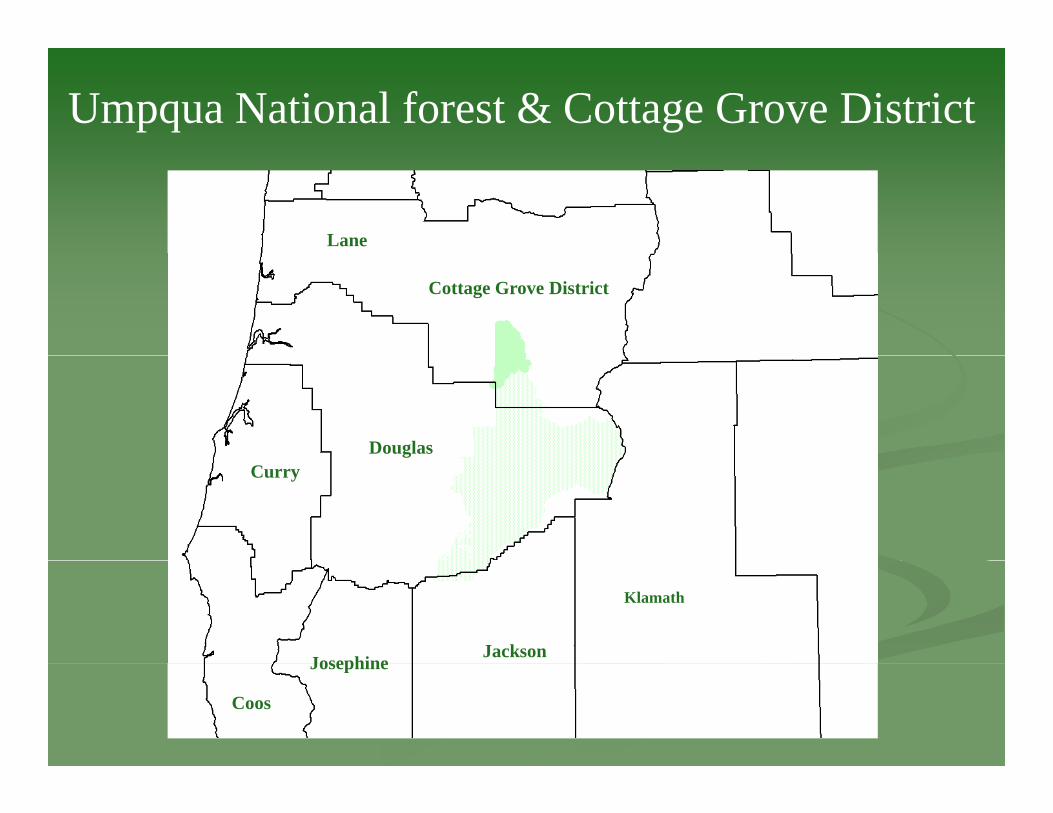
Umpqua National forest & Cottage Grove District
Lane
Cottage Grove District
DouglasCurry
Josephine Jackson
Klamath
Coos
Josephine
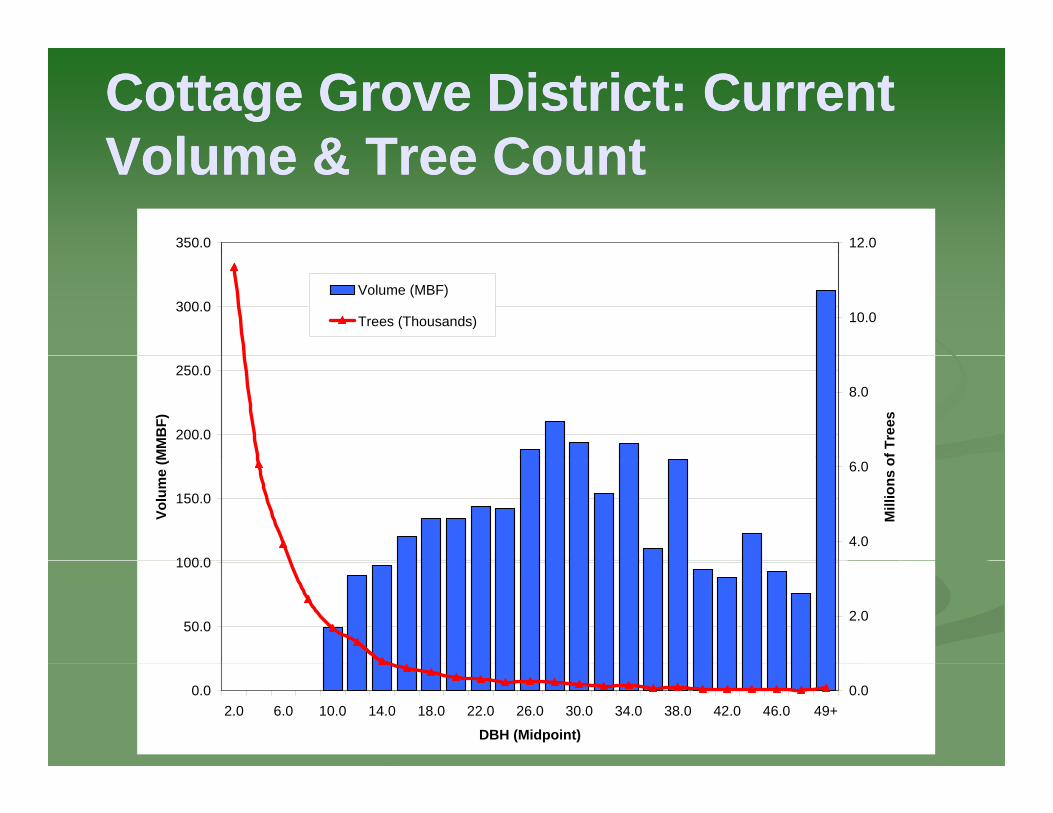
Cottage Grove District: Current Cottage Grove District: Current Volume & Tree CountVolume & Tree CountVolume & Tree CountVolume & Tree Count
350.0 12.0
300.010.0
Volume (MBF)
Trees (Thousands)
200.0
250.0
MM
BF)
8.0
f Tre
es
100 0
150.0
Volu
me
(M
4.0
6.0
Mill
ions
o
50.0
100.0
2.0
0.02.0 6.0 10.0 14.0 18.0 22.0 26.0 30.0 34.0 38.0 42.0 46.0 49+
DBH (Midpoint)
0.0
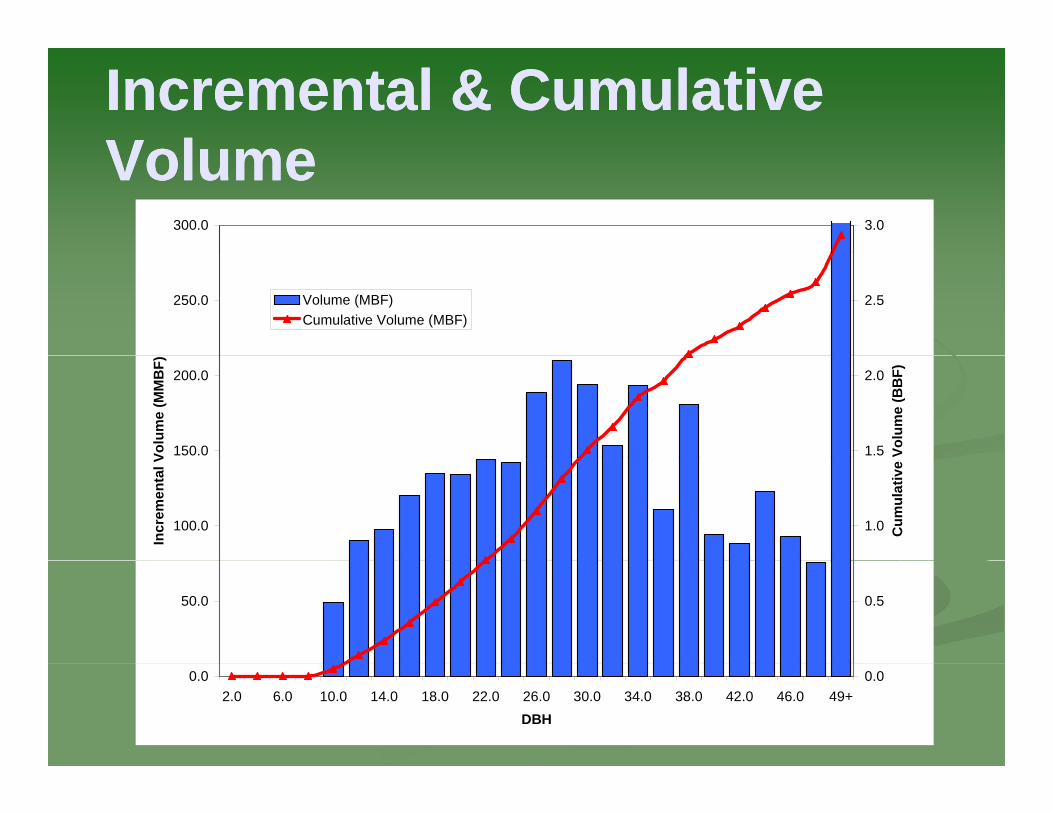
Incremental & Cumulative Incremental & Cumulative VolumeVolumeVolumeVolume
300.0 3.0
250.0 2.5Volume (MBF)Cumulative Volume (MBF)
150.0
200.0
Volu
me
(MM
BF)
1.5
2.0
Volu
me
(BB
F)
100.0
Incr
emen
tal V
1.0 Cum
ulat
ive
50.0 0.5
0.02.0 6.0 10.0 14.0 18.0 22.0 26.0 30.0 34.0 38.0 42.0 46.0 49+
DBH
0.0
HarvestHarvestHarvest Harvest S h d liS h d liScheduling Scheduling
ModelModel
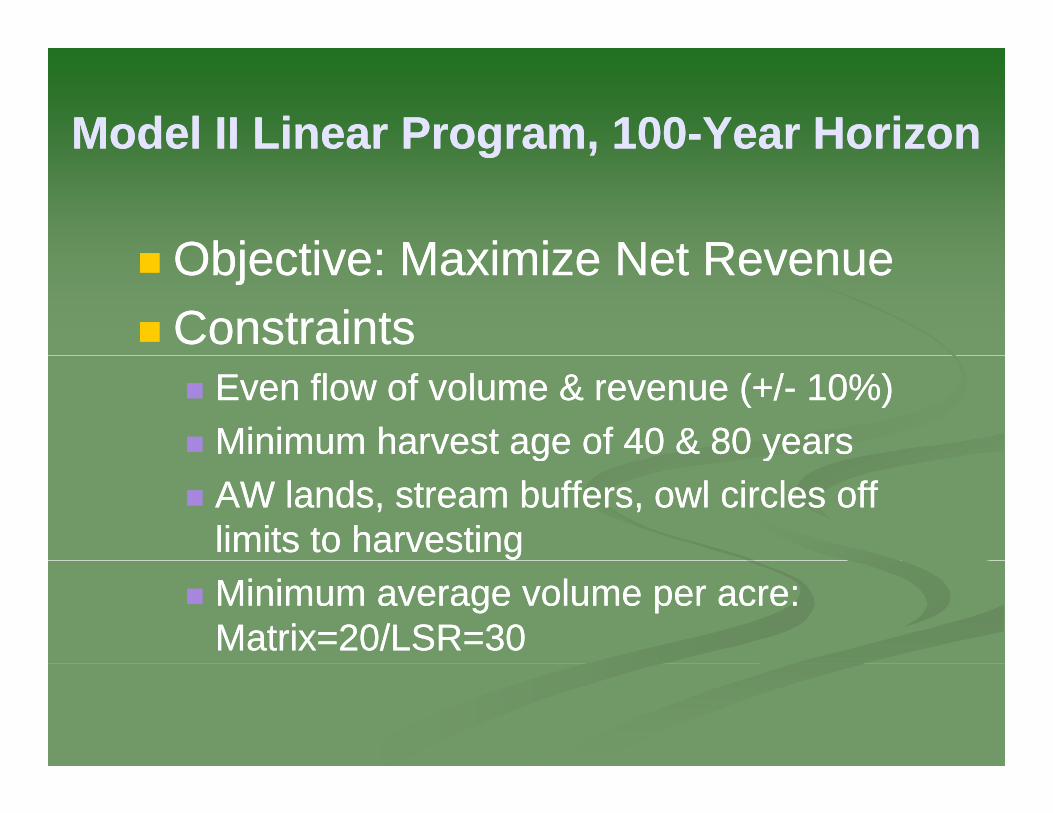
Model II Linear Program, 100Model II Linear Program, 100--Year HorizonYear Horizong ,g ,
Objective: Maximize Net RevenueObjective: Maximize Net RevenueObjective: Maximize Net RevenueObjective: Maximize Net RevenueConstraintsConstraints
Even flow of volume & revenue (+/Even flow of volume & revenue (+/-- 10%)10%)Minimum harvest age of 40 & 80 yearsMinimum harvest age of 40 & 80 yearsg yg yAW lands, stream buffers, owl circles off AW lands, stream buffers, owl circles off limits to harvestinglimits to harvestingMinimum average volume per acre: Minimum average volume per acre: Matrix=20/LSR=30Matrix=20/LSR=30
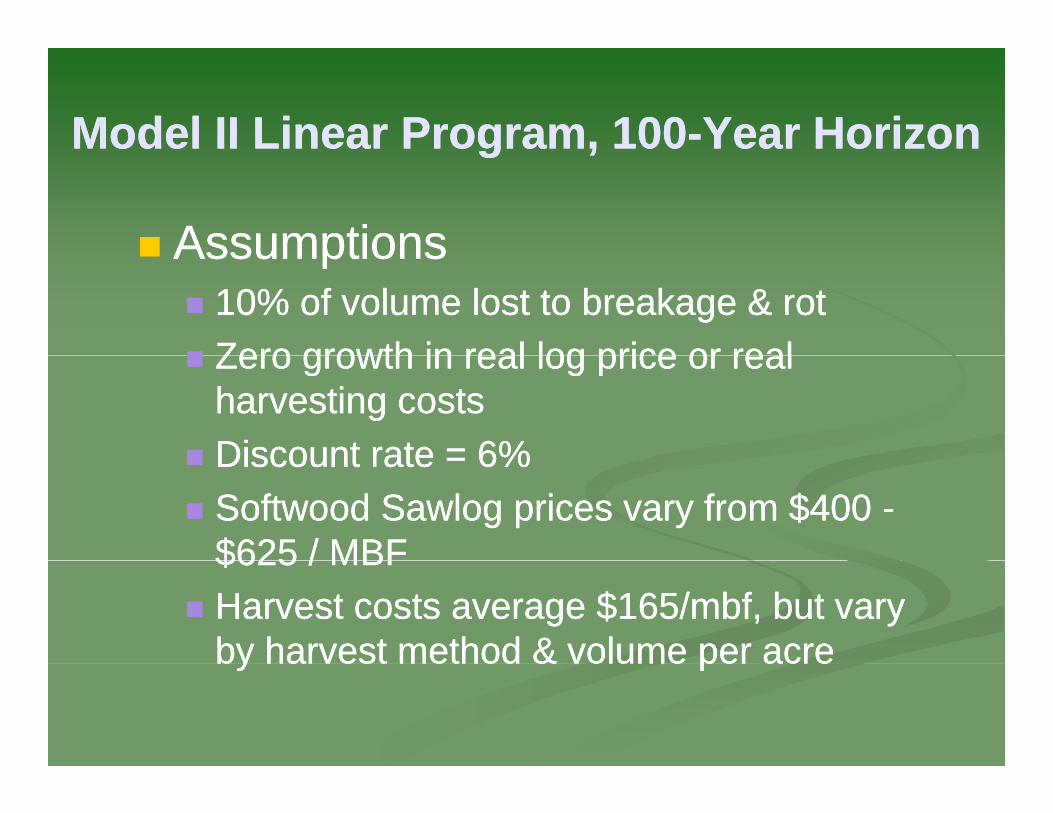
Model II Linear Program, 100Model II Linear Program, 100--Year HorizonYear Horizong ,g ,
AssumptionsAssumptionsAssumptionsAssumptions10% of volume lost to breakage & rot10% of volume lost to breakage & rotZero growth in real log price or realZero growth in real log price or realZero growth in real log price or real Zero growth in real log price or real harvesting costsharvesting costsDiscount rate = 6%Discount rate = 6%Discount rate = 6%Discount rate = 6%Softwood Sawlog prices vary from $400 Softwood Sawlog prices vary from $400 --$625 / MBF$625 / MBF$625 / MBF$625 / MBFHarvest costs average $165/mbf, but vary Harvest costs average $165/mbf, but vary by harvest method & volume per acreby harvest method & volume per acreby harvest method & volume per acreby harvest method & volume per acre
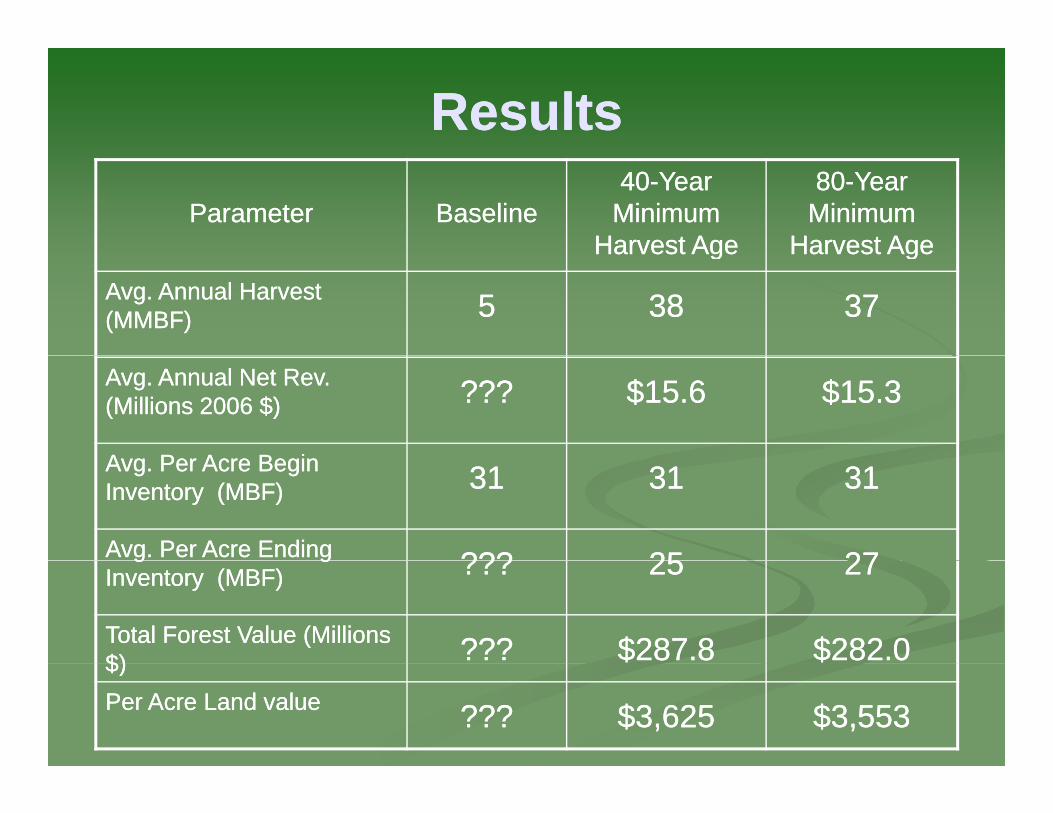
ResultsResults
ParameterParameter BaselineBaseline4040--Year Year
Minimum Minimum Harvest AgeHarvest Age
8080--Year Year Minimum Minimum
Harvest AgeHarvest AgeHarvest AgeHarvest Age Harvest AgeHarvest Age
Avg. Annual Harvest Avg. Annual Harvest (MMBF)(MMBF) 55 3838 3737
Avg. Annual Net Rev. Avg. Annual Net Rev. (Millions 2006 $)(Millions 2006 $) ?????? $15.6$15.6 $15.3$15.3
A P A B iA P A B iAvg. Per Acre Begin Avg. Per Acre Begin Inventory (MBF)Inventory (MBF) 3131 3131 3131
Avg. Per Acre Ending Avg. Per Acre Ending ?????? 2525 2727g gg gInventory (MBF)Inventory (MBF) ?????? 2525 2727
Total Forest Value (Millions Total Forest Value (Millions $)$) ?????? $287.8$287.8 $282.0$282.0$)$) $$ $$Per Acre Land valuePer Acre Land value ?????? $3,625$3,625 $3,553$3,553
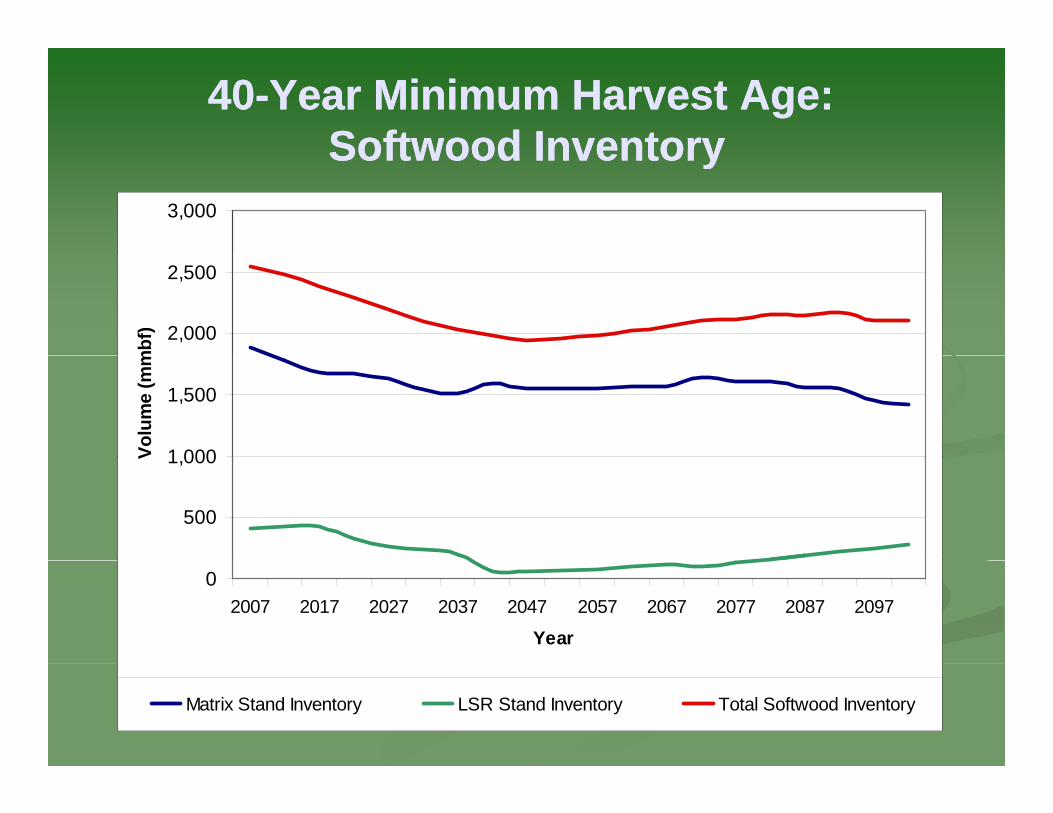
4040--Year Minimum Harvest Age:Year Minimum Harvest Age:Softwood InventorySoftwood InventorySoftwood InventorySoftwood Inventory
3,000
2,000
2,500
mbf
)
1 000
1,500
Volu
me
(mm
500
1,000V
02007 2017 2027 2037 2047 2057 2067 2077 2087 2097
Year
Matrix Stand Inventory LSR Stand Inventory Total Softwood Inventory
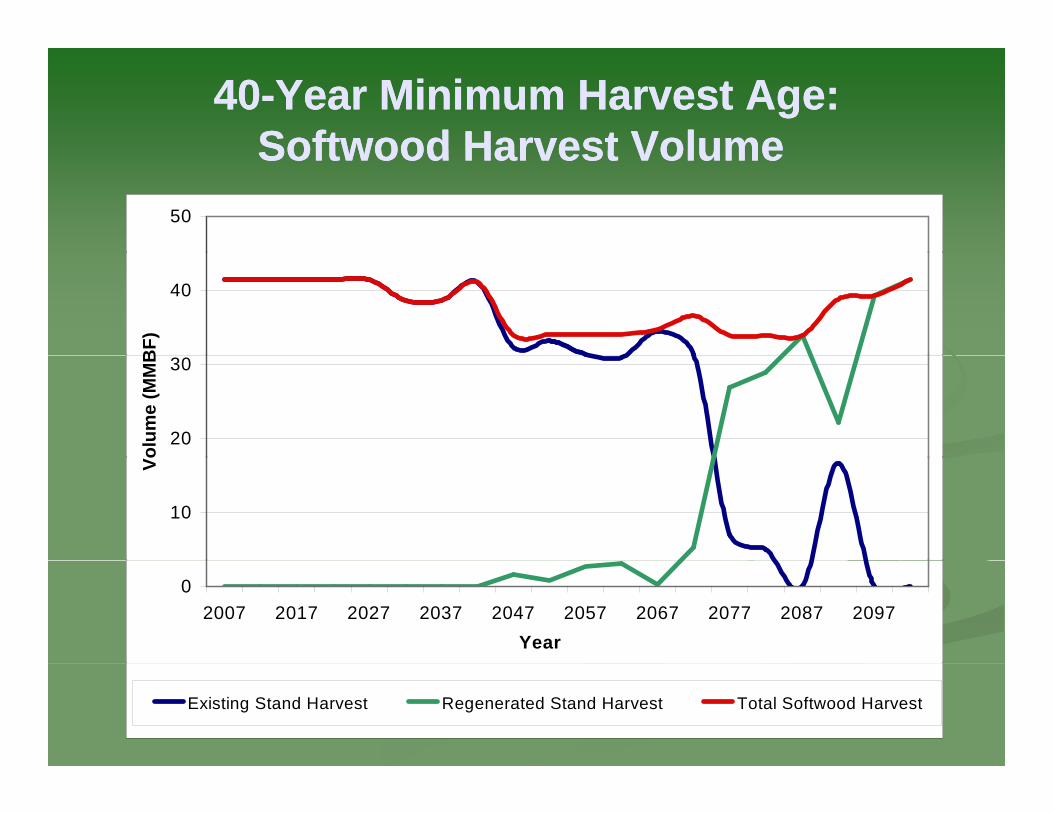
4040--Year Minimum Harvest Age:Year Minimum Harvest Age:Softwood Harvest VolumeSoftwood Harvest VolumeSoftwood Harvest Volume Softwood Harvest Volume
50
40
BF)
20
30
olum
e (M
MB
10
V
02007 2017 2027 2037 2047 2057 2067 2077 2087 2097
Year
Existing Stand Harvest Regenerated Stand Harvest Total Softwood Harvest
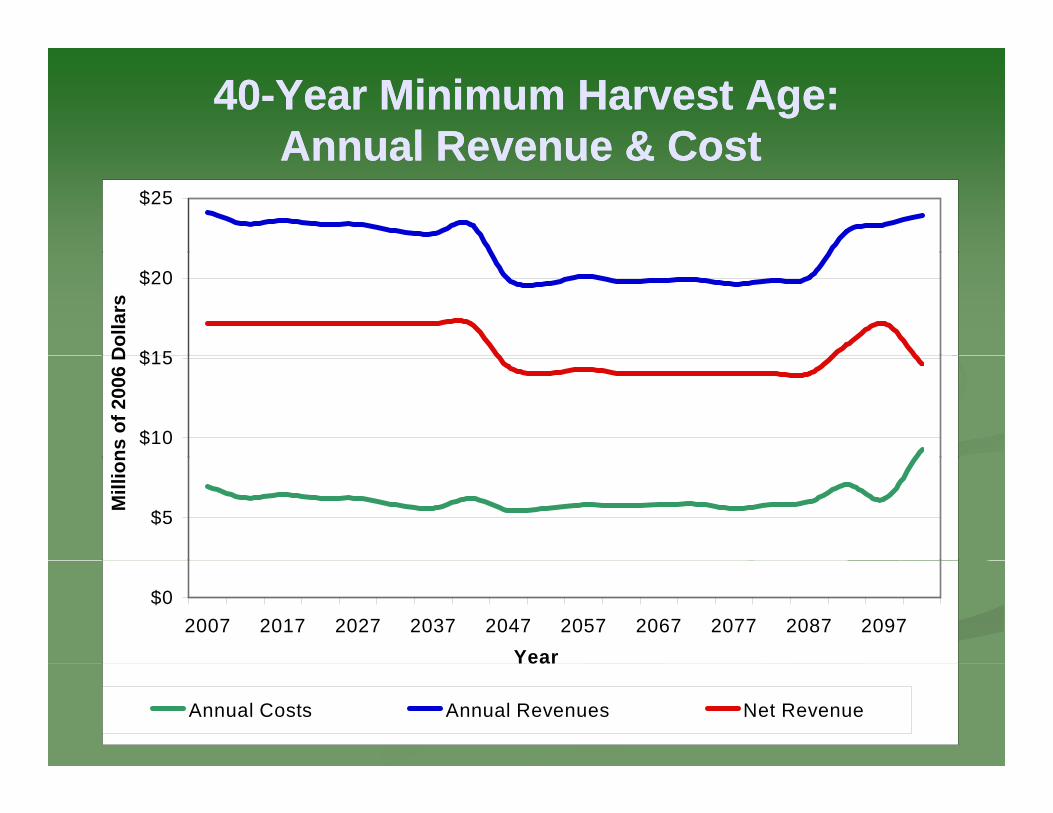
4040--Year Minimum Harvest Age:Year Minimum Harvest Age:Annual Revenue & CostAnnual Revenue & CostAnnual Revenue & Cost Annual Revenue & Cost
$25
$15
$20
Dol
lars
$10
$15
ns o
f 200
6 D
$5
Mill
ion
$02007 2017 2027 2037 2047 2057 2067 2077 2087 2097
YearYear
Annual Costs Annual Revenues Net Revenue
Log FlowLog FlowLog FlowLog FlowM d lM d lModelModel
ResultsResults
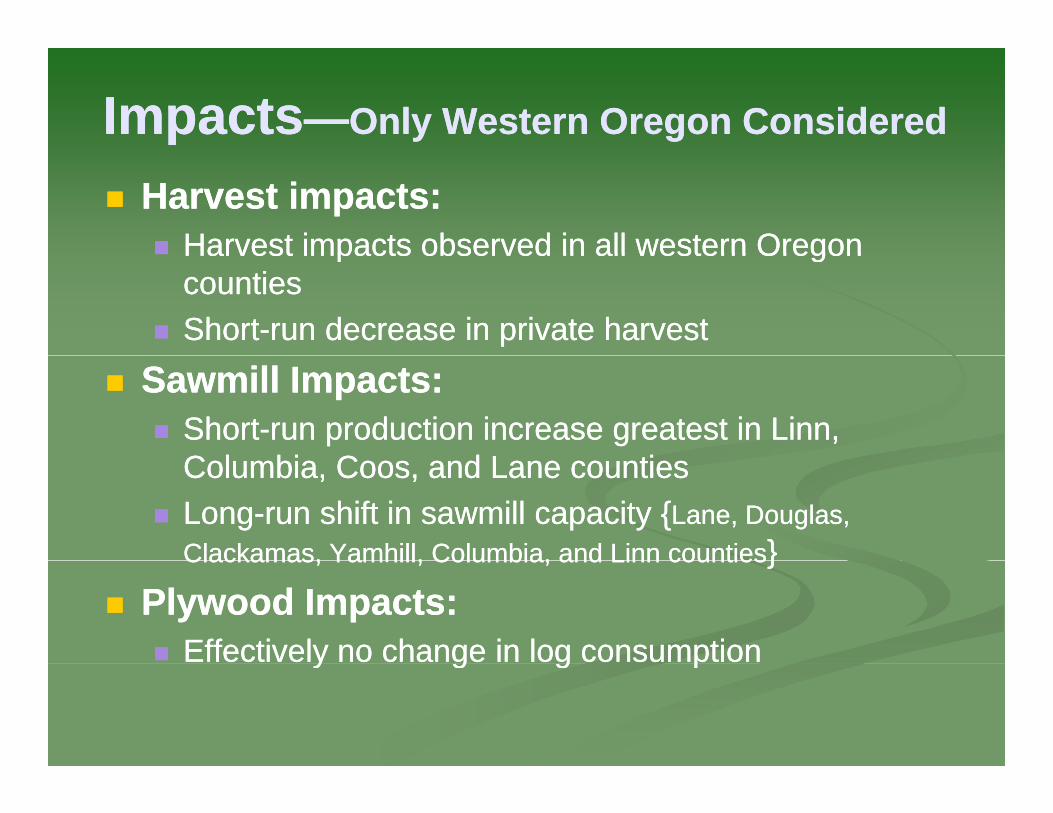
ImpactsImpacts——Only Western Oregon ConsideredOnly Western Oregon Considered
Harvest impacts:Harvest impacts:Harvest impacts observed in all western OregonHarvest impacts observed in all western OregonHarvest impacts observed in all western Oregon Harvest impacts observed in all western Oregon countiescountiesShortShort--run decrease in private harvestrun decrease in private harvest
Sawmill Impacts:Sawmill Impacts:ShortShort--run production increase greatest in Linn, run production increase greatest in Linn, C l bi C d L tiC l bi C d L tiColumbia, Coos, and Lane countiesColumbia, Coos, and Lane countiesLongLong--run shift in sawmill capacity {run shift in sawmill capacity {Lane, Douglas, Lane, Douglas, Clackamas, Yamhill, Columbia, and Linn countiesClackamas, Yamhill, Columbia, and Linn counties}}Clackamas, Yamhill, Columbia, and Linn countiesClackamas, Yamhill, Columbia, and Linn counties}}
Plywood Impacts:Plywood Impacts:Effectively no change in log consumptionEffectively no change in log consumptiony g g py g g p
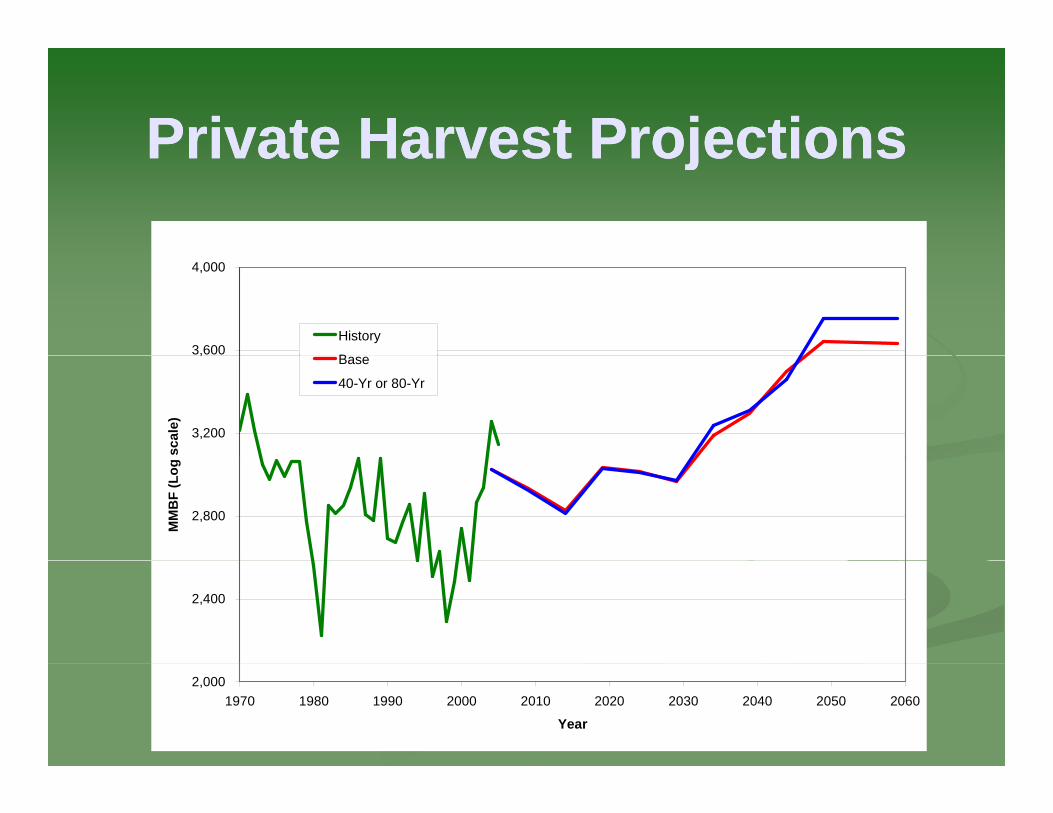
Private Harvest ProjectionsPrivate Harvest ProjectionsPrivate Harvest ProjectionsPrivate Harvest Projections
3,600
4,000
History
B
3,200
,
scal
e)
Base
40-Yr or 80-Yr
2,800
MM
BF
(Log
2,400
2,0001970 1980 1990 2000 2010 2020 2030 2040 2050 2060
Year
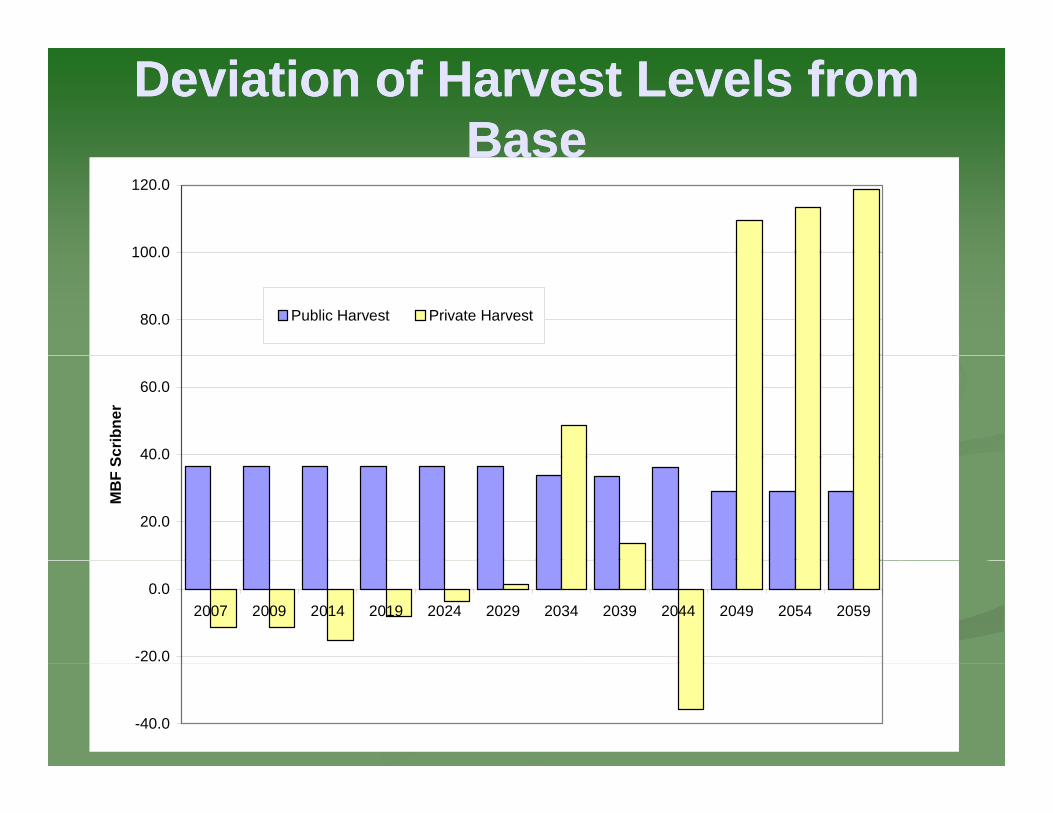
Deviation of Harvest Levels from Deviation of Harvest Levels from BaseBaseBaseBase
100 0
120.0
80.0
100.0
Public Harvest Private Harvest
40.0
60.0
Scrib
ner
20.0
40.0
MB
F S
-20.0
0.02007 2009 2014 2019 2024 2029 2034 2039 2044 2049 2054 2059
-40.0
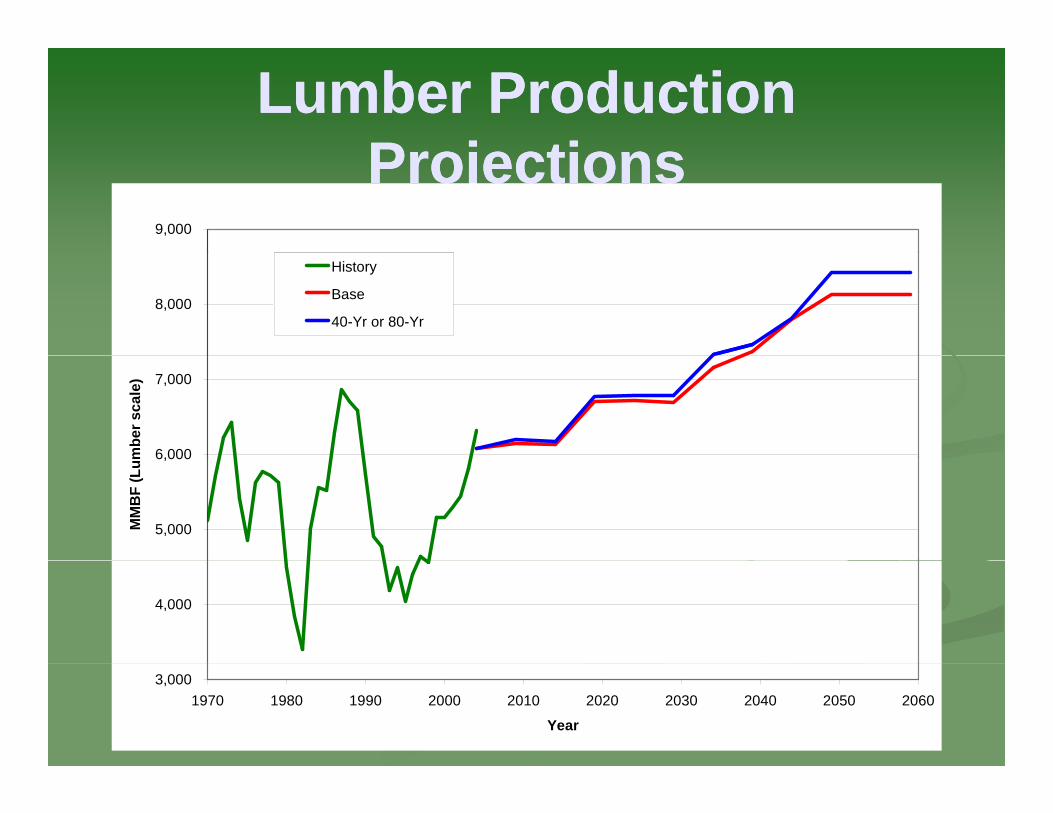
Lumber Production Lumber Production P j tiP j tiProjectionsProjections
9,000
8,000
History
Base
40-Yr or 80-Yr
6,000
7,000
mbe
r sca
le)
5,000
6,000
MM
BF
(Lum
4,000
3,0001970 1980 1990 2000 2010 2020 2030 2040 2050 2060
Year
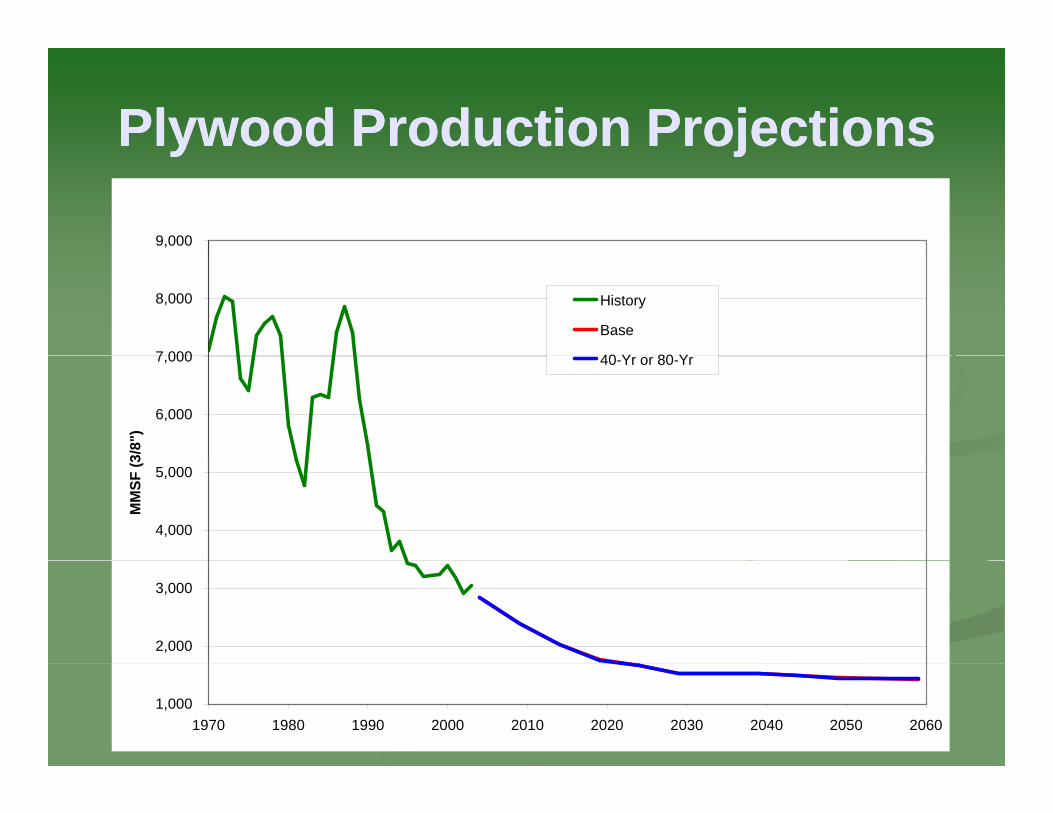
Plywood Production ProjectionsPlywood Production Projectionsy jy j
9,000
7 000
8,000 History
Base
40 Y 80 Y
6,000
7,000
3/8"
)
40-Yr or 80-Yr
4,000
5,000
MM
SF (3
2,000
3,000
1,0001970 1980 1990 2000 2010 2020 2030 2040 2050 2060

IMPLAN IMPLAN ResultsResultsResultsResults
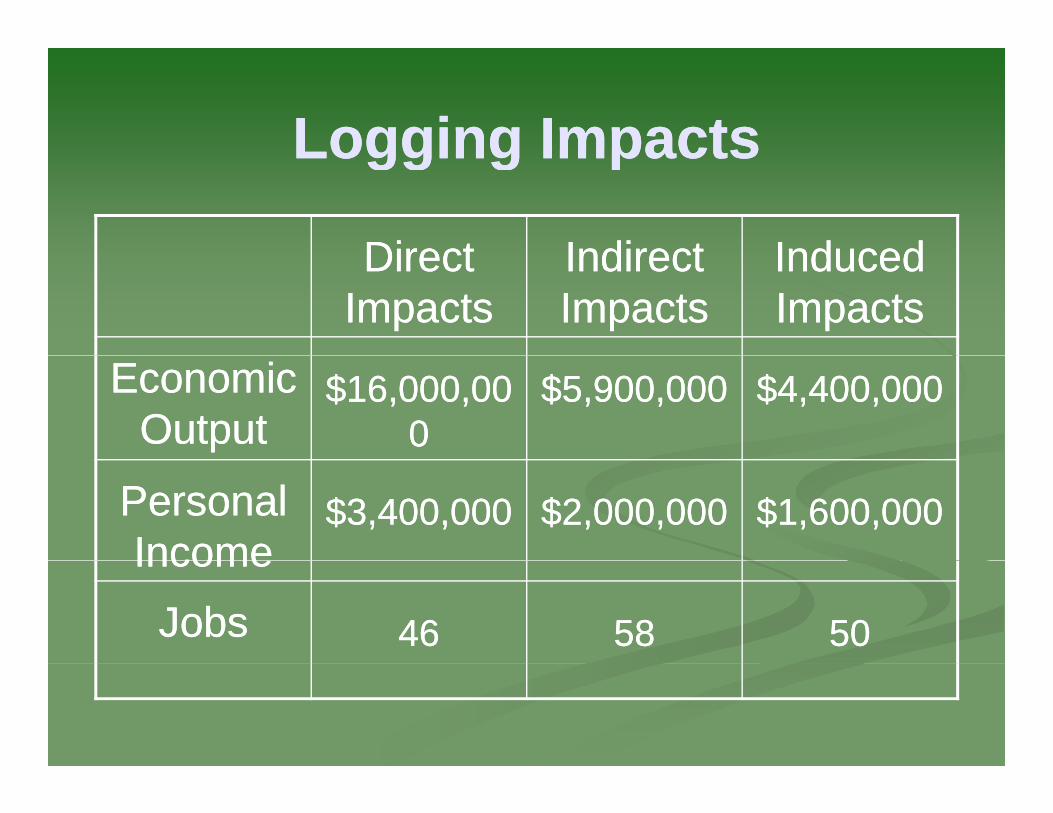
Logging ImpactsLogging ImpactsLogging Impacts Logging Impacts
DirectDirect IndirectIndirect InducedInducedDirect Direct ImpactsImpacts
Indirect Indirect ImpactsImpacts
Induced Induced ImpactsImpacts
Economic Economic OutputOutput
$16,000,00$16,000,0000
$5,900,000$5,900,000 $4,400,000$4,400,000
Personal Personal IncomeIncome
$3,400,000$3,400,000 $2,000,000$2,000,000 $1,600,000$1,600,000IncomeIncome
JobsJobs 4646 5858 5050
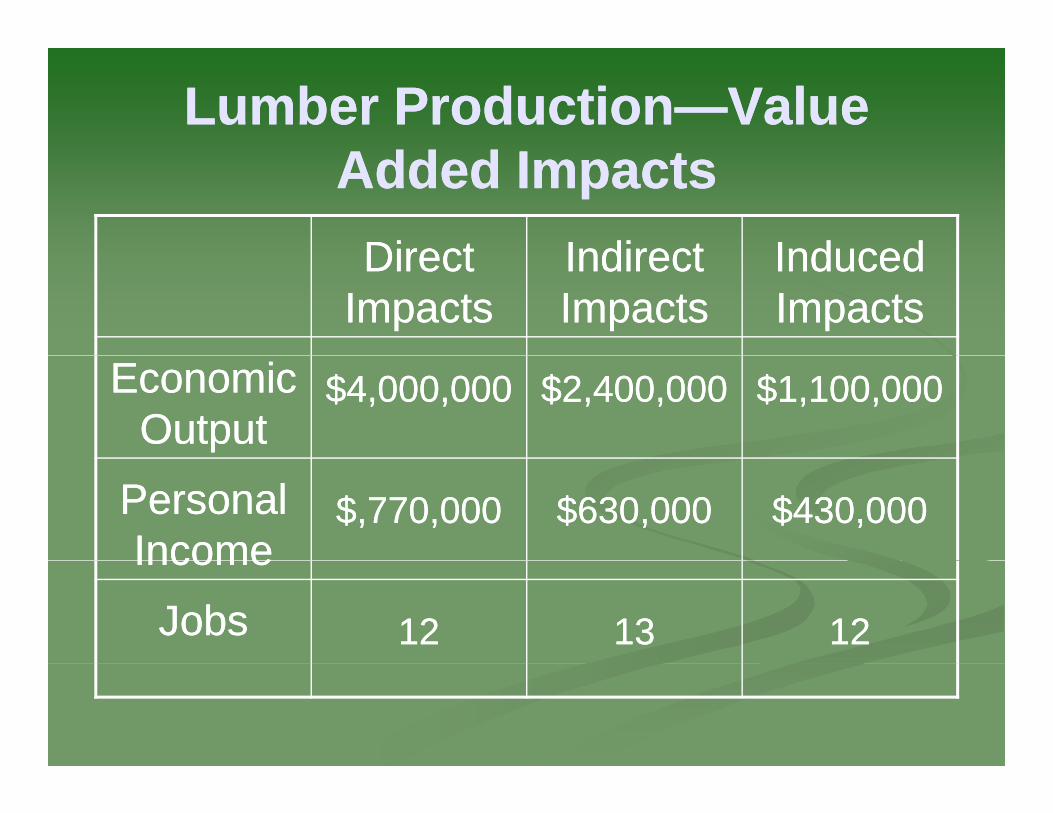
Lumber ProductionLumber Production——Value Value Add d IAdd d IAdded Impacts Added Impacts
DirectDirect IndirectIndirect InducedInducedDirect Direct ImpactsImpacts
Indirect Indirect ImpactsImpacts
Induced Induced ImpactsImpacts
Economic Economic OutputOutput
$4,000,000$4,000,000 $2,400,000$2,400,000 $1,100,000$1,100,000
Personal Personal IncomeIncome
$,770,000$,770,000 $630,000$630,000 $430,000$430,000IncomeIncome
JobsJobs 1212 1313 1212
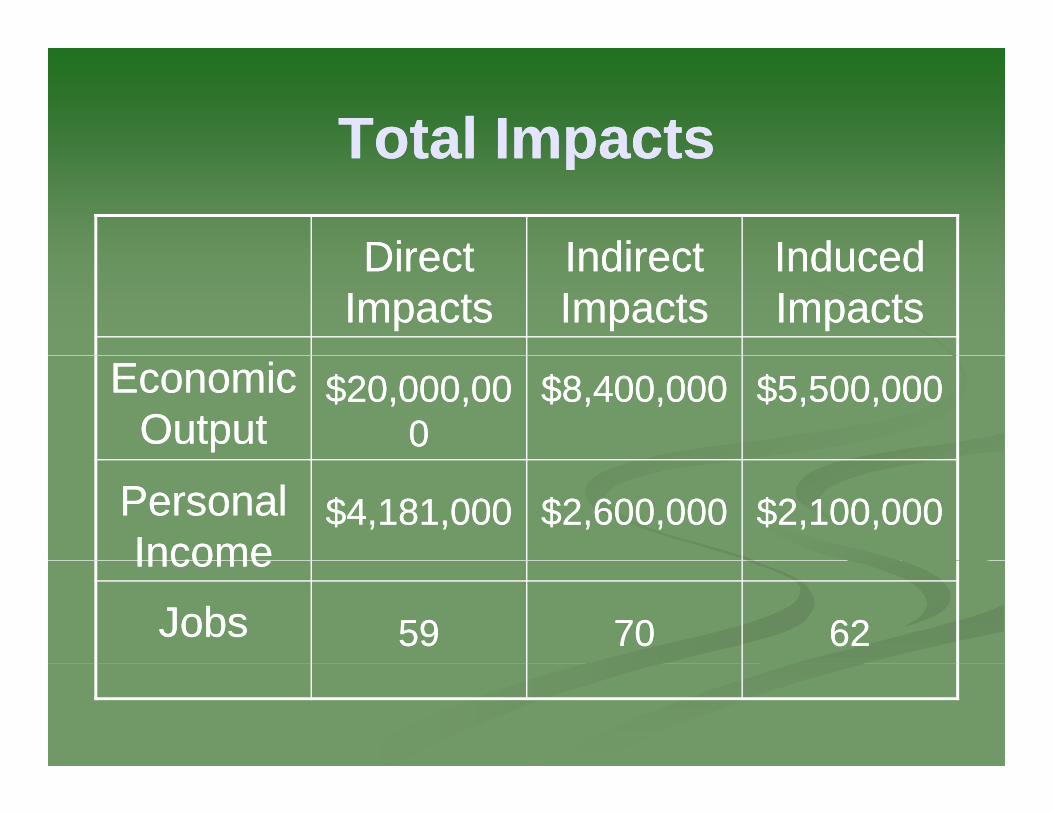
Total ImpactsTotal ImpactsTotal ImpactsTotal Impacts
DirectDirect IndirectIndirect InducedInducedDirect Direct ImpactsImpacts
Indirect Indirect ImpactsImpacts
Induced Induced ImpactsImpacts
Economic Economic OutputOutput
$20,000,00$20,000,0000
$8,400,000$8,400,000 $5,500,000$5,500,000
Personal Personal IncomeIncome
$4,181,000$4,181,000 $2,600,000$2,600,000 $2,100,000$2,100,000IncomeIncome
JobsJobs 5959 7070 6262

ConclusionsConclusionsConclusionsConclusions
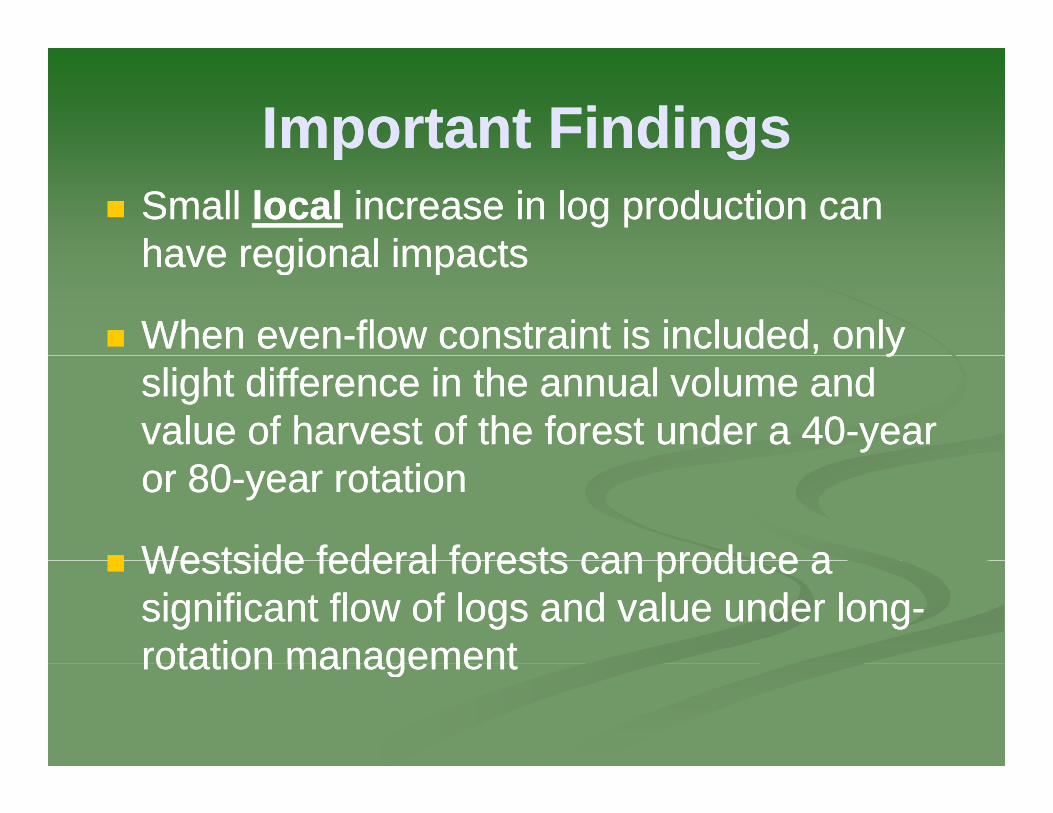
Important FindingsImportant Findingsp gp gSmall Small locallocal increase in log production can increase in log production can have regional impactshave regional impactshave regional impactshave regional impacts
When evenWhen even--flow constraint is included, only flow constraint is included, only yyslight difference in the annual volume and slight difference in the annual volume and value of harvest of the forest under a 40value of harvest of the forest under a 40--year year or 80or 80--year rotationyear rotation
Westside federal forests can produce aWestside federal forests can produce aWestside federal forests can produce a Westside federal forests can produce a significant flow of logs and value under longsignificant flow of logs and value under long--rotation managementrotation managementrotation management rotation management
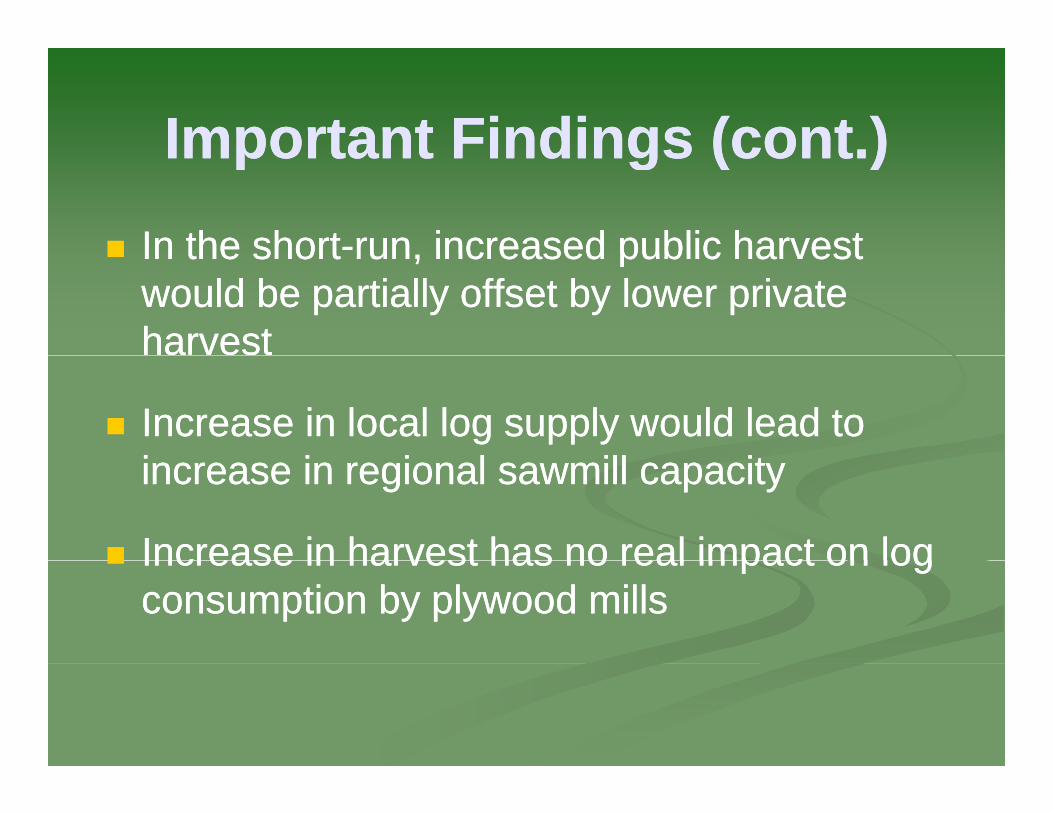
Important Findings (cont.)Important Findings (cont.)Important Findings (cont.)Important Findings (cont.)In the shortIn the short--run increased public harvestrun increased public harvestIn the shortIn the short run, increased public harvest run, increased public harvest would be partially offset by lower private would be partially offset by lower private harvestharvest
Increase in local log supply would lead to Increase in local log supply would lead to i i i l ill iti i i l ill itincrease in regional sawmill capacityincrease in regional sawmill capacity
Increase in harvest has no real impact on logIncrease in harvest has no real impact on logIncrease in harvest has no real impact on log Increase in harvest has no real impact on log consumption by plywood millsconsumption by plywood mills
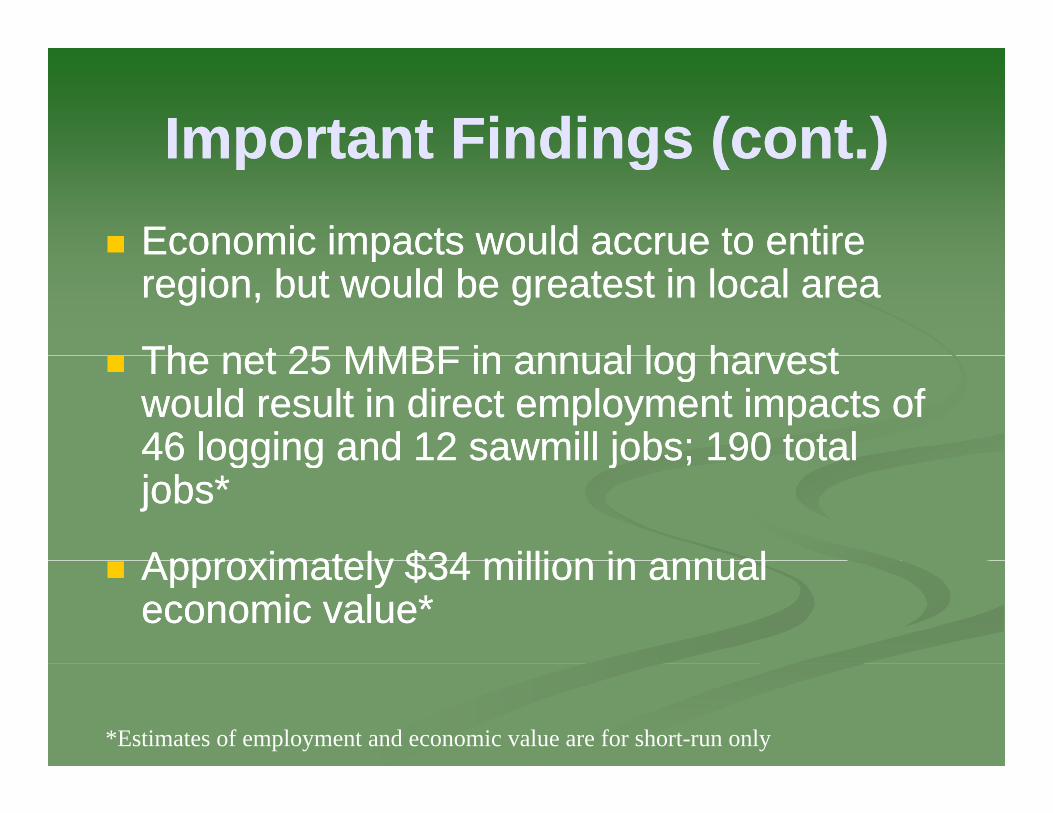
Important Findings (cont.)Important Findings (cont.)Important Findings (cont.)Important Findings (cont.)Economic impacts would accrue to entireEconomic impacts would accrue to entireEconomic impacts would accrue to entire Economic impacts would accrue to entire region, but would be greatest in local arearegion, but would be greatest in local area
The net 25 MMBF in annual log harvestThe net 25 MMBF in annual log harvestThe net 25 MMBF in annual log harvest The net 25 MMBF in annual log harvest would result in direct employment impacts of would result in direct employment impacts of 46 logging and 12 sawmill jobs; 190 total46 logging and 12 sawmill jobs; 190 total46 logging and 12 sawmill jobs; 190 total 46 logging and 12 sawmill jobs; 190 total jobs*jobs*
Approximately $34 million in annualApproximately $34 million in annualApproximately $34 million in annual Approximately $34 million in annual economic value*economic value*
*Estimates of employment and economic value are for short-run only