Embed Size (px)
Citation preview
Preliminary Analysis Memo
Economic Impact of Passenger Rail Expansion along the
New Hampshire Capital Corridor
Prepared for:
New Hampshire Rail Transit Authority Concord, NH
Prepared by:
Economic Development Research Group, Inc. 2 Oliver Street, 9th Floor
Boston, MA 02109
In association with:
Transystems Corporation 38 Chauncy Street, Suite 200
Boston, MA 02111
January 2010
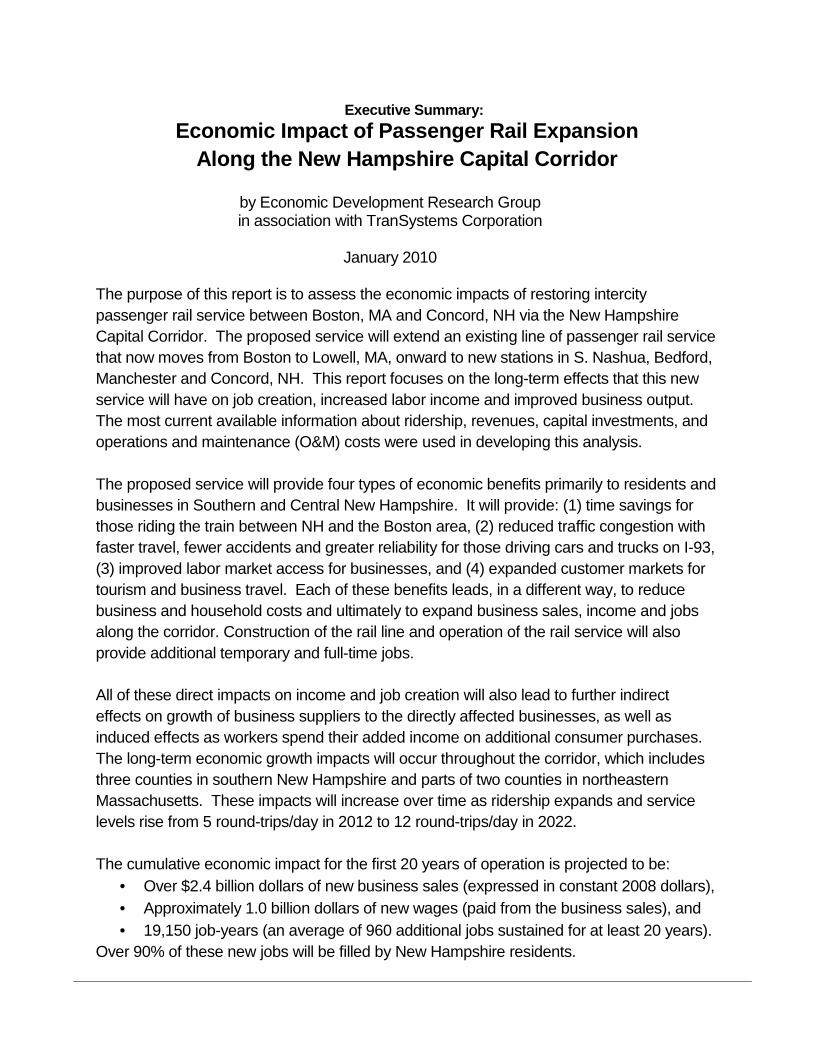
Executive Summary:
Economic Impact of Passenger Rail Expansion Along the New Hampshire Capital Corridor
by Economic Development Research Group in association with TranSystems Corporation
January 2010
The purpose of this report is to assess the economic impacts of restoring intercity passenger rail service between Boston, MA and Concord, NH via the New Hampshire Capital Corridor. The proposed service will extend an existing line of passenger rail service that now moves from Boston to Lowell, MA, onward to new stations in S. Nashua, Bedford, Manchester and Concord, NH. This report focuses on the long-term effects that this new service will have on job creation, increased labor income and improved business output. The most current available information about ridership, revenues, capital investments, and operations and maintenance (O&M) costs were used in developing this analysis. The proposed service will provide four types of economic benefits primarily to residents and businesses in Southern and Central New Hampshire. It will provide: (1) time savings for those riding the train between NH and the Boston area, (2) reduced traffic congestion with faster travel, fewer accidents and greater reliability for those driving cars and trucks on I-93, (3) improved labor market access for businesses, and (4) expanded customer markets for tourism and business travel. Each of these benefits leads, in a different way, to reduce business and household costs and ultimately to expand business sales, income and jobs along the corridor. Construction of the rail line and operation of the rail service will also provide additional temporary and full-time jobs. All of these direct impacts on income and job creation will also lead to further indirect effects on growth of business suppliers to the directly affected businesses, as well as induced effects as workers spend their added income on additional consumer purchases. The long-term economic growth impacts will occur throughout the corridor, which includes three counties in southern New Hampshire and parts of two counties in northeastern Massachusetts. These impacts will increase over time as ridership expands and service levels rise from 5 round-trips/day in 2012 to 12 round-trips/day in 2022. The cumulative economic impact for the first 20 years of operation is projected to be:
• Over $2.4 billion dollars of new business sales (expressed in constant 2008 dollars), • Approximately 1.0 billion dollars of new wages (paid from the business sales), and • 19,150 job-years (an average of 960 additional jobs sustained for at least 20 years).
Over 90% of these new jobs will be filled by New Hampshire residents.
ECONOM IC IM P ACT OF PAS SENGER RAI L EXP AN SION A LONG THE NH CAPITAL CORRIDOR
i i
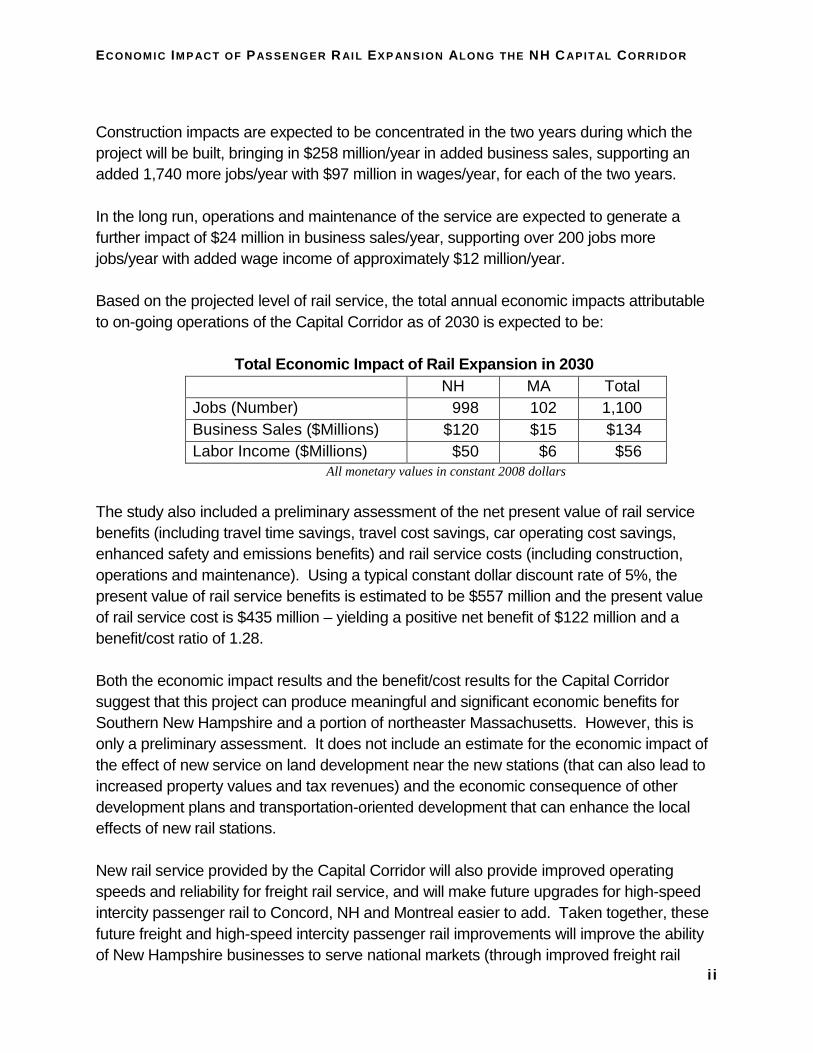
Construction impacts are expected to be concentrated in the two years during which the project will be built, bringing in $258 million/year in added business sales, supporting an added 1,740 more jobs/year with $97 million in wages/year, for each of the two years. In the long run, operations and maintenance of the service are expected to generate a further impact of $24 million in business sales/year, supporting over 200 jobs more jobs/year with added wage income of approximately $12 million/year. Based on the projected level of rail service, the total annual economic impacts attributable to on-going operations of the Capital Corridor as of 2030 is expected to be:
Total Economic Impact of Rail Expansion in 2030 NH MA Total Jobs (Number) 998 102 1,100 Business Sales ($Millions) $120 $15 $134 Labor Income ($Millions) $50 $6 $56
All monetary values in constant 2008 dollars
The study also included a preliminary assessment of the net present value of rail service benefits (including travel time savings, travel cost savings, car operating cost savings, enhanced safety and emissions benefits) and rail service costs (including construction, operations and maintenance). Using a typical constant dollar discount rate of 5%, the present value of rail service benefits is estimated to be $557 million and the present value of rail service cost is $435 million – yielding a positive net benefit of $122 million and a benefit/cost ratio of 1.28. Both the economic impact results and the benefit/cost results for the Capital Corridor suggest that this project can produce meaningful and significant economic benefits for Southern New Hampshire and a portion of northeaster Massachusetts. However, this is only a preliminary assessment. It does not include an estimate for the economic impact of the effect of new service on land development near the new stations (that can also lead to increased property values and tax revenues) and the economic consequence of other development plans and transportation-oriented development that can enhance the local effects of new rail stations. New rail service provided by the Capital Corridor will also provide improved operating speeds and reliability for freight rail service, and will make future upgrades for high-speed intercity passenger rail to Concord, NH and Montreal easier to add. Taken together, these future freight and high-speed intercity passenger rail improvements will improve the ability of New Hampshire businesses to serve national markets (through improved freight rail

ECONOM IC IM P ACT OF PAS SENGER RAI L EXP AN SION A LONG THE NH CAPITAL CORRIDOR
i i i
service) and connect New Hampshire cities to major East Coast metropolitan centers. While none of these factors were counted in the economic impact and benefit analysis to date, they may be additional important factors to be considered in decision-making for funding and initiating the currently-proposed Capital Corridor passenger rail service.
ECONOM IC IM P ACT OF PAS SENGER RAI L EXP AN SION A LONG THE NH CAPITAL CORRIDOR
iv
Table of Contents Executive Summary: ...................................................................................................... i
Overview and Approach: _________________________________________________1
Region-of-Impact: ..........................................................................................................1
Capital Corridor Service Characteristics: ......................................................................3
Ridership and Farebox Revenue Estimates....................................................................3
Methodology: .................................................................................................................4
2030 Regional Economic Impact by Direct Transportation System Change _______6
Economic Impact Analysis ............................................................................................6
Benefit Cost Analysis ..................................................................................................10
Appendix A: Methodological Details ______________________________________13
Ridership, revenue and operating cost assumptions: ...................................................13
Manchester-Boston Regional Airport Boarding Estimates..........................................15
Air Quality and Emissions ...........................................................................................15
Estimate of Emissions Costs per Ton ..........................................................................16
Economic Model Parameters .......................................................................................17
Passenger Time Value..................................................................................................18
Vehicle Operating Costs ..............................................................................................18
Accident Rates .............................................................................................................18
Accident Costs .............................................................................................................18
ECONOM IC IM P ACT OF PAS SENGER RAI L EXP AN SION A LONG THE NH CAPITAL CORRIDOR
1
OVERVIEW AND APPROACH:
This report describes the economic impacts on New Hampshire and Massachusetts communities that result from extending intercity passenger rail service from Boston, Massachusetts to Concord, New Hampshire. The impacts presented are for year 2030, the planning horizon used in the initial ridership forecasts that preceded this study.1 The economic impacts for the affected multi-state region are a consequence of the benefits received by all transportation system users including time savings, highway congestion reduction, reduced accidents, labor market access improvements, and the magnitude and nature of induced trips. Although not included in the scope of this analysis, there may also be the potential for economic impacts related to development (residential/ commercial) around new intercity passenger rail stations.
Region-of-Impact:
The economic impacts affect a bi-state region consisting of 26 cities and towns in Northeastern Massachusetts (Middlesex and Essex counties) and 48 cities and towns in Southern and Central New Hampshire (Hillsborough, Merrimack, and Rockingham counties). There are also labor market effects that accrue to Suffolk County, MA (Boston area) that are not included in the findings reported below, but that have been estimated and included in additional materials provided later in this report (see Table 10).
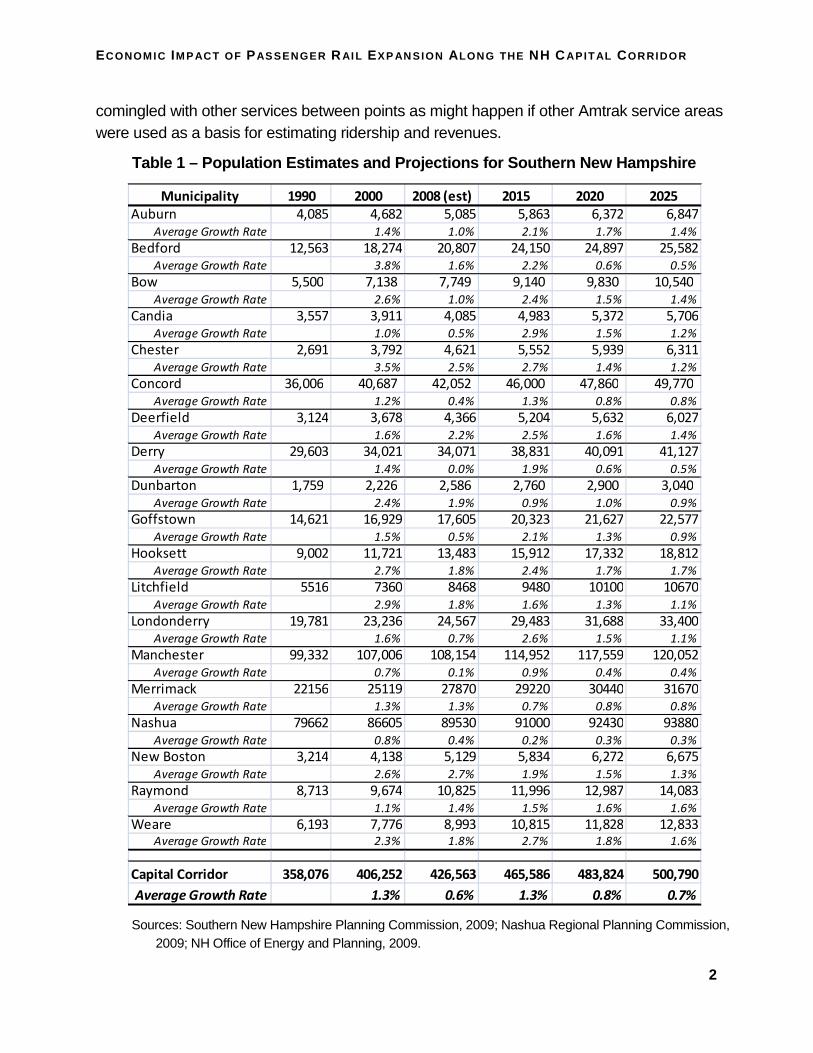
The areas of New Hampshire affected by the new service offered by the Capital Corridor have a history of rapid population growth – especially relative to the rest of New England – and are expected to continue growing at an average of just under 1% through 2025. Table 1 shows historical growth, current estimates, and forecasts of population for each of the cities and towns in the three-counties in the New Hampshire. These cities and towns are expected to grow by a total of 17.4% in the next 15 years, reaching a total population of over 500,000 by 2025 – a transportation market with a major regional airport that will support high-frequency, intercity passenger rail service offered by the proposed Capital Corridor.
Ridership forecasts developed by Transystems Corporation are based on local population growth and travel characteristics similar to those that are being monitored for Amtrak’s “Downeaster” service. While important differences have been taken into account in their analysis, it is important to note that since its inception, the “Downeaster” service has been closely tracked for ridership, performance, operating costs and revenue production – and because of its North Station location (the only Amtrak service from North Station), the costs, ridership, revenue, and operating issues are isolated within the Amtrak system and not
1 Ridership Estimates for Capital Corridor Passenger Rail Service, Southern New Hampshire Planning Commission, PB Americas, Inc., Sept. 2008. http://www.nh.gov/dot/programs/nhrta/documents/ManchesterRailRidershipReport09044082.pdf
ECONOM IC IM P ACT OF PAS SENGER RAI L EXP AN SION A LONG THE NH CAPITAL CORRIDOR
2
comingled with other services between points as might happen if other Amtrak service areas were used as a basis for estimating ridership and revenues.
Table 1 – Population Estimates and Projections for Southern New Hampshire
Sources: Southern New Hampshire Planning Commission, 2009; Nashua Regional Planning Commission, 2009; NH Office of Energy and Planning, 2009.
Municipality 1990 2000 2008 (est) 2015 2020 2025
Auburn 4,085 4,682 5,085 5,863 6,372 6,847Average Growth Rate 1.4% 1.0% 2.1% 1.7% 1.4%
Bedford 12,563 18,274 20,807 24,150 24,897 25,582Average Growth Rate 3.8% 1.6% 2.2% 0.6% 0.5%
Bow 5,500 7,138 7,749 9,140 9,830 10,540 Average Growth Rate 2.6% 1.0% 2.4% 1.5% 1.4%
Candia 3,557 3,911 4,085 4,983 5,372 5,706Average Growth Rate 1.0% 0.5% 2.9% 1.5% 1.2%
Chester 2,691 3,792 4,621 5,552 5,939 6,311Average Growth Rate 3.5% 2.5% 2.7% 1.4% 1.2%
Concord 36,006 40,687 42,052 46,000 47,860 49,770 Average Growth Rate 1.2% 0.4% 1.3% 0.8% 0.8%
Deerfield 3,124 3,678 4,366 5,204 5,632 6,027Average Growth Rate 1.6% 2.2% 2.5% 1.6% 1.4%
Derry 29,603 34,021 34,071 38,831 40,091 41,127Average Growth Rate 1.4% 0.0% 1.9% 0.6% 0.5%
Dunbarton 1,759 2,226 2,586 2,760 2,900 3,040 Average Growth Rate 2.4% 1.9% 0.9% 1.0% 0.9%
Goffstown 14,621 16,929 17,605 20,323 21,627 22,577Average Growth Rate 1.5% 0.5% 2.1% 1.3% 0.9%
Hooksett 9,002 11,721 13,483 15,912 17,332 18,812Average Growth Rate 2.7% 1.8% 2.4% 1.7% 1.7%
Litchfield 5516 7360 8468 9480 10100 10670Average Growth Rate 2.9% 1.8% 1.6% 1.3% 1.1%
Londonderry 19,781 23,236 24,567 29,483 31,688 33,400Average Growth Rate 1.6% 0.7% 2.6% 1.5% 1.1%
Manchester 99,332 107,006 108,154 114,952 117,559 120,052Average Growth Rate 0.7% 0.1% 0.9% 0.4% 0.4%
Merrimack 22156 25119 27870 29220 30440 31670Average Growth Rate 1.3% 1.3% 0.7% 0.8% 0.8%
Nashua 79662 86605 89530 91000 92430 93880Average Growth Rate 0.8% 0.4% 0.2% 0.3% 0.3%
New Boston 3,214 4,138 5,129 5,834 6,272 6,675Average Growth Rate 2.6% 2.7% 1.9% 1.5% 1.3%
Raymond 8,713 9,674 10,825 11,996 12,987 14,083Average Growth Rate 1.1% 1.4% 1.5% 1.6% 1.6%
Weare 6,193 7,776 8,993 10,815 11,828 12,833Average Growth Rate 2.3% 1.8% 2.7% 1.8% 1.6%
Capital Corridor 358,076 406,252 426,563 465,586 483,824 500,790
Average Growth Rate 1.3% 0.6% 1.3% 0.8% 0.7%
ECONOM IC IM P ACT OF PAS SENGER RAI L EXP AN SION A LONG THE NH CAPITAL CORRIDOR
3
Capital Corridor Service Characteristics:
Passenger rail expansion for the Capital Corridor consists of the following:
• Scheduled peak and off-peak intercity passenger rail service of 5 round trips per day, rising to 12 round trips per day by 2022:
• Four New Stations in New Hampshire: South Nashua, Bedford/Manchester-Boston Regional Airport, Manchester, and Concord
• Weekday ridership: over 1,400 (one-way) weekday trips in 2012, rising to over 2,800 weekday trips by 2030
• Estimation of 75% of ridership during peak periods and 25% during off-peak periods
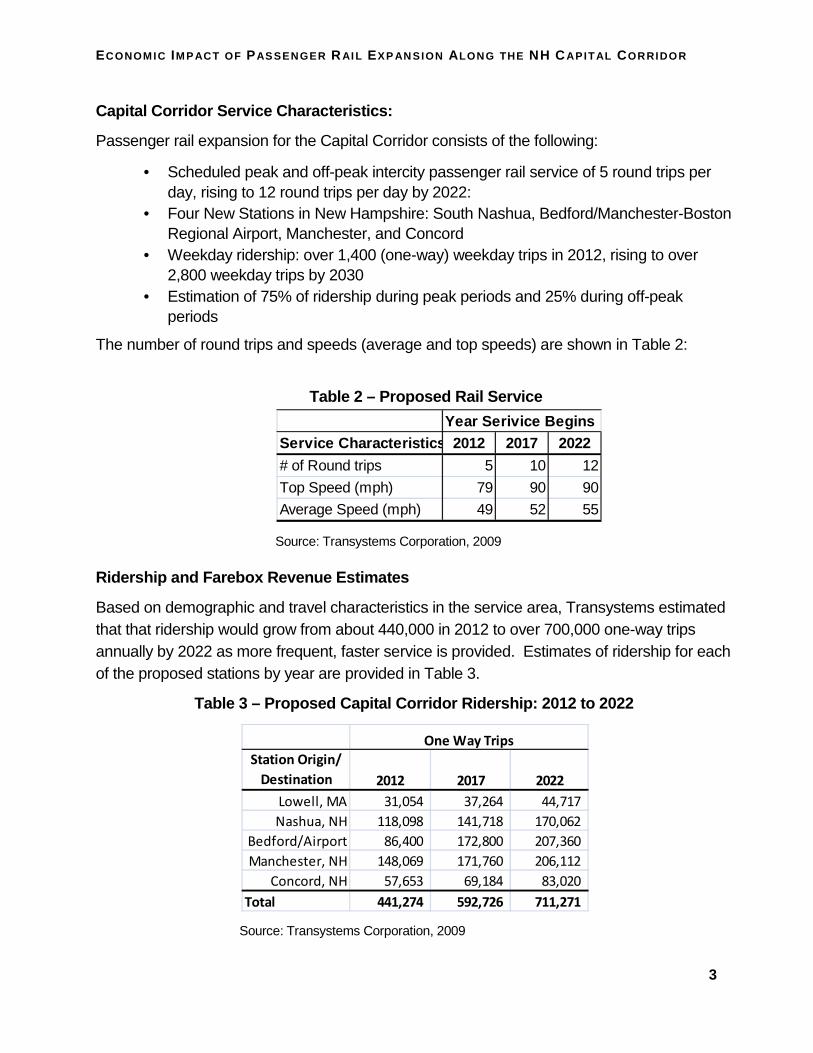
The number of round trips and speeds (average and top speeds) are shown in Table 2:
Table 2 – Proposed Rail Service
Source: Transystems Corporation, 2009
Ridership and Farebox Revenue Estimates
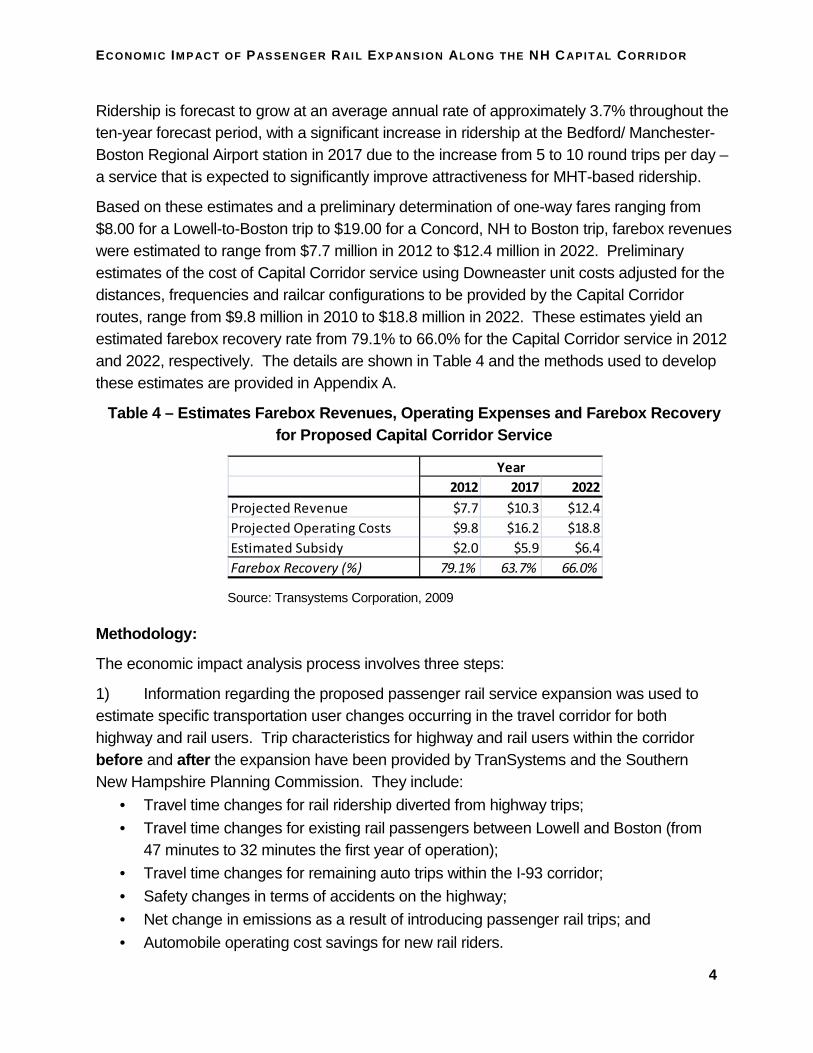
Based on demographic and travel characteristics in the service area, Transystems estimated that that ridership would grow from about 440,000 in 2012 to over 700,000 one-way trips annually by 2022 as more frequent, faster service is provided. Estimates of ridership for each of the proposed stations by year are provided in Table 3.
Table 3 – Proposed Capital Corridor Ridership: 2012 to 2022
Source: Transystems Corporation, 2009
Year Serivice BeginsService Characteristics 2012 2017 2022
# of Round trips 5 10 12
Top Speed (mph) 79 90 90
Average Speed (mph) 49 52 55
Station Origin/
Destination 2012 2017 2022
Lowell, MA 31,054 37,264 44,717
Nashua, NH 118,098 141,718 170,062
Bedford/Airport 86,400 172,800 207,360
Manchester, NH 148,069 171,760 206,112
Concord, NH 57,653 69,184 83,020
Total 441,274 592,726 711,271
One Way Trips
ECONOM IC IM P ACT OF PAS SENGER RAI L EXP AN SION A LONG THE NH CAPITAL CORRIDOR
4
Ridership is forecast to grow at an average annual rate of approximately 3.7% throughout the ten-year forecast period, with a significant increase in ridership at the Bedford/ Manchester-Boston Regional Airport station in 2017 due to the increase from 5 to 10 round trips per day – a service that is expected to significantly improve attractiveness for MHT-based ridership.
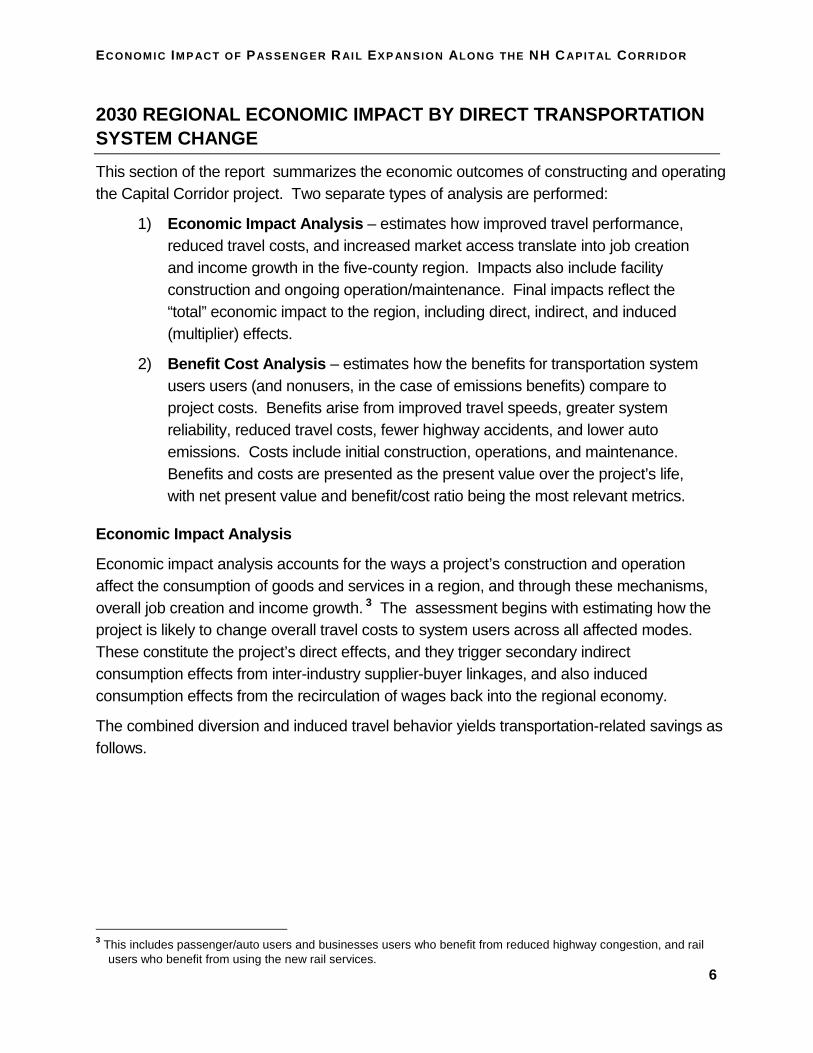
Based on these estimates and a preliminary determination of one-way fares ranging from $8.00 for a Lowell-to-Boston trip to $19.00 for a Concord, NH to Boston trip, farebox revenues were estimated to range from $7.7 million in 2012 to $12.4 million in 2022. Preliminary estimates of the cost of Capital Corridor service using Downeaster unit costs adjusted for the distances, frequencies and railcar configurations to be provided by the Capital Corridor routes, range from $9.8 million in 2010 to $18.8 million in 2022. These estimates yield an estimated farebox recovery rate from 79.1% to 66.0% for the Capital Corridor service in 2012 and 2022, respectively. The details are shown in Table 4 and the methods used to develop these estimates are provided in Appendix A.
Table 4 – Estimates Farebox Revenues, Operating Exp enses and Farebox Recovery for Proposed Capital Corridor Service
Source: Transystems Corporation, 2009
Methodology:
The economic impact analysis process involves three steps:
1) Information regarding the proposed passenger rail service expansion was used to estimate specific transportation user changes occurring in the travel corridor for both highway and rail users. Trip characteristics for highway and rail users within the corridor before and after the expansion have been provided by TranSystems and the Southern New Hampshire Planning Commission. They include:
• Travel time changes for rail ridership diverted from highway trips;
• Travel time changes for existing rail passengers between Lowell and Boston (from 47 minutes to 32 minutes the first year of operation);
• Travel time changes for remaining auto trips within the I-93 corridor;
• Safety changes in terms of accidents on the highway;
• Net change in emissions as a result of introducing passenger rail trips; and
• Automobile operating cost savings for new rail riders.
2012 2017 2022
Projected Revenue $7.7 $10.3 $12.4
Projected Operating Costs $9.8 $16.2 $18.8
Estimated Subsidy $2.0 $5.9 $6.4
Farebox Recovery (%) 79.1% 63.7% 66.0%
Year

ECONOM IC IM P ACT OF PAS SENGER RAI L EXP AN SION A LONG THE NH CAPITAL CORRIDOR
5
2) Expected time and distance savings attributable to the proposed rail service were used to analyze the effects of the user impacts identified in Step 1. Changes in vehicle-hours and vehicle-miles of travel were used to estimate changes in travel time, vehicle operating cost and accident rates. Those effects were then used to estimate the dollar value of total user (time and operating) costs for the affected mix of rail and highway users. In addition to these changes, there may also be a business productivity effect arising from the new transportation option to bring labor to employment centers. Depending on the speed of the proposed passenger rail service from new station areas, proximal businesses may benefit from a larger, more diverse labor pool than would otherwise be available, and more day-trip visits to Concord (NH), Manchester, and Boston are possible. 3) Economic impacts were estimated using information developed in Step 2 for the NH-MA corridor region. The calculations are made using the TREDIS® model2 for a 5-county aggregate study area which allocates the user impacts to the region’s households and the region’s employers, and then estimates the resulting changes (through an economic multiplier effect) in regional jobs and associated changes in levels of labor income, business sales and Gross Regional Product (GRP or value-added).
Appendix A provides supplemental information describing key assumptions and methods for estimating ridership, operating costs, emissions and accident costs.
2 Transportation Economic Development Impact System (see www.tredis.com for further description)
ECONOM IC IM P ACT OF PAS SENGER RAI L EXP AN SION A LONG THE NH CAPITAL CORRIDOR
6
2030 REGIONAL ECONOMIC IMPACT BY DIRECT TRANSPORTAT ION SYSTEM CHANGE
This section of the report summarizes the economic outcomes of constructing and operating the Capital Corridor project. Two separate types of analysis are performed:
1) Economic Impact Analysis – estimates how improved travel performance, reduced travel costs, and increased market access translate into job creation and income growth in the five-county region. Impacts also include facility construction and ongoing operation/maintenance. Final impacts reflect the “total” economic impact to the region, including direct, indirect, and induced (multiplier) effects.
2) Benefit Cost Analysis – estimates how the benefits for transportation system users users (and nonusers, in the case of emissions benefits) compare to project costs. Benefits arise from improved travel speeds, greater system reliability, reduced travel costs, fewer highway accidents, and lower auto emissions. Costs include initial construction, operations, and maintenance. Benefits and costs are presented as the present value over the project’s life, with net present value and benefit/cost ratio being the most relevant metrics.
Economic Impact Analysis
Economic impact analysis accounts for the ways a project’s construction and operation affect the consumption of goods and services in a region, and through these mechanisms, overall job creation and income growth. 3 The assessment begins with estimating how the project is likely to change overall travel costs to system users across all affected modes. These constitute the project’s direct effects, and they trigger secondary indirect consumption effects from inter-industry supplier-buyer linkages, and also induced consumption effects from the recirculation of wages back into the regional economy.
The combined diversion and induced travel behavior yields transportation-related savings as follows.
3 This includes passenger/auto users and businesses users who benefit from reduced highway congestion, and rail
users who benefit from using the new rail services.
ECONOM IC IM P ACT OF PAS SENGER RAI L EXP AN SION A LONG THE NH CAPITAL CORRIDOR
7
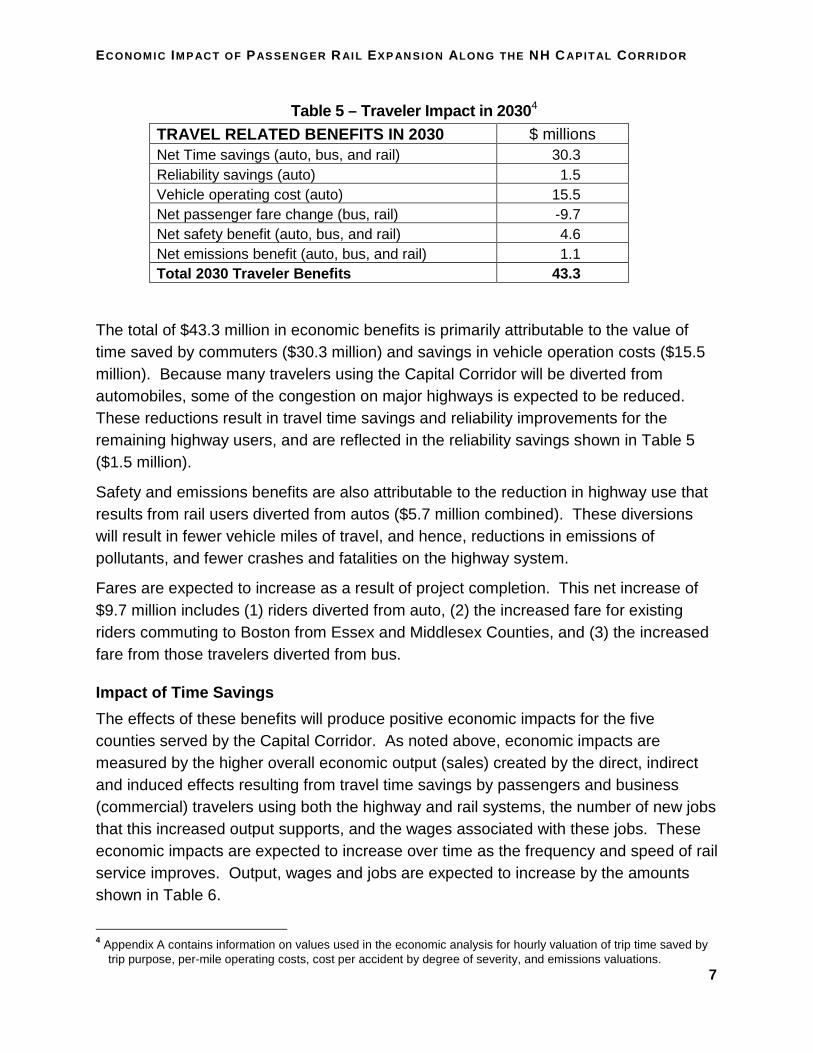
Table 5 – Traveler Impact in 2030 4 TRAVEL RELATED BENEFITS IN 2030 $ millions Net Time savings (auto, bus, and rail) 30.3 Reliability savings (auto) 1.5 Vehicle operating cost (auto) 15.5 Net passenger fare change (bus, rail) -9.7 Net safety benefit (auto, bus, and rail) 4.6 Net emissions benefit (auto, bus, and rail) 1.1 Total 2030 Traveler Benefits 43.3
The total of $43.3 million in economic benefits is primarily attributable to the value of time saved by commuters ($30.3 million) and savings in vehicle operation costs ($15.5 million). Because many travelers using the Capital Corridor will be diverted from automobiles, some of the congestion on major highways is expected to be reduced. These reductions result in travel time savings and reliability improvements for the remaining highway users, and are reflected in the reliability savings shown in Table 5 ($1.5 million).
Safety and emissions benefits are also attributable to the reduction in highway use that results from rail users diverted from autos ($5.7 million combined). These diversions will result in fewer vehicle miles of travel, and hence, reductions in emissions of pollutants, and fewer crashes and fatalities on the highway system.
Fares are expected to increase as a result of project completion. This net increase of $9.7 million includes (1) riders diverted from auto, (2) the increased fare for existing riders commuting to Boston from Essex and Middlesex Counties, and (3) the increased fare from those travelers diverted from bus.
Impact of Time Savings
The effects of these benefits will produce positive economic impacts for the five counties served by the Capital Corridor. As noted above, economic impacts are measured by the higher overall economic output (sales) created by the direct, indirect and induced effects resulting from travel time savings by passengers and business (commercial) travelers using both the highway and rail systems, the number of new jobs that this increased output supports, and the wages associated with these jobs. These economic impacts are expected to increase over time as the frequency and speed of rail service improves. Output, wages and jobs are expected to increase by the amounts shown in Table 6.
4 Appendix A contains information on values used in the economic analysis for hourly valuation of trip time saved by
trip purpose, per-mile operating costs, cost per accident by degree of severity, and emissions valuations.
ECONOM IC IM P ACT OF PAS SENGER RAI L EXP AN SION A LONG THE NH CAPITAL CORRIDOR
8
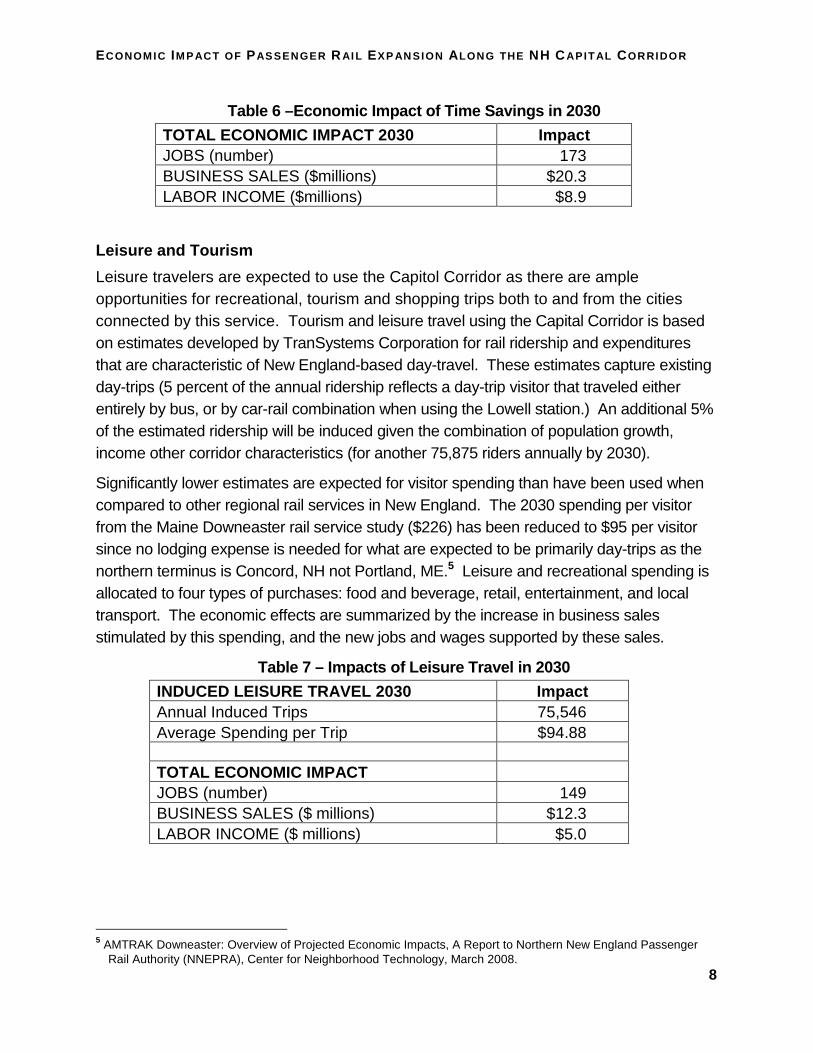
Table 6 –Economic Impact of Time Savings in 2030
TOTAL ECONOMIC IMPACT 2030 Impact JOBS (number) 173 BUSINESS SALES ($millions) $20.3 LABOR INCOME ($millions) $8.9
Leisure and Tourism
Leisure travelers are expected to use the Capitol Corridor as there are ample opportunities for recreational, tourism and shopping trips both to and from the cities connected by this service. Tourism and leisure travel using the Capital Corridor is based on estimates developed by TranSystems Corporation for rail ridership and expenditures that are characteristic of New England-based day-travel. These estimates capture existing day-trips (5 percent of the annual ridership reflects a day-trip visitor that traveled either entirely by bus, or by car-rail combination when using the Lowell station.) An additional 5% of the estimated ridership will be induced given the combination of population growth, income other corridor characteristics (for another 75,875 riders annually by 2030).
Significantly lower estimates are expected for visitor spending than have been used when compared to other regional rail services in New England. The 2030 spending per visitor from the Maine Downeaster rail service study ($226) has been reduced to $95 per visitor since no lodging expense is needed for what are expected to be primarily day-trips as the northern terminus is Concord, NH not Portland, ME.5 Leisure and recreational spending is allocated to four types of purchases: food and beverage, retail, entertainment, and local transport. The economic effects are summarized by the increase in business sales stimulated by this spending, and the new jobs and wages supported by these sales.
Table 7 – Impacts of Leisure Travel in 2030
INDUCED LEISURE TRAVEL 2030 Impact Annual Induced Trips 75,546 Average Spending per Trip $94.88 TOTAL ECONOMIC IMPACT JOBS (number) 149 BUSINESS SALES ($ millions) $12.3 LABOR INCOME ($ millions) $5.0
5 AMTRAK Downeaster: Overview of Projected Economic Impacts, A Report to Northern New England Passenger
Rail Authority (NNEPRA), Center for Neighborhood Technology, March 2008.
ECONOM IC IM P ACT OF PAS SENGER RAI L EXP AN SION A LONG THE NH CAPITAL CORRIDOR
9
Labor Market Access
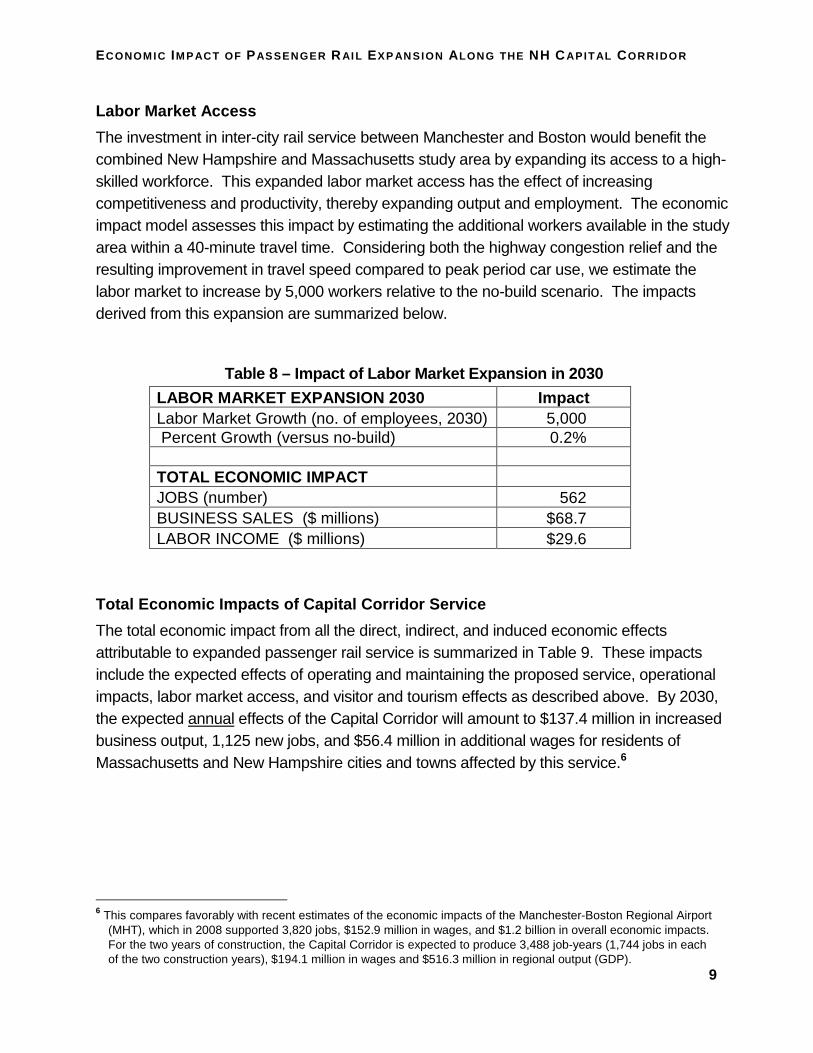
The investment in inter-city rail service between Manchester and Boston would benefit the combined New Hampshire and Massachusetts study area by expanding its access to a high-skilled workforce. This expanded labor market access has the effect of increasing competitiveness and productivity, thereby expanding output and employment. The economic impact model assesses this impact by estimating the additional workers available in the study area within a 40-minute travel time. Considering both the highway congestion relief and the resulting improvement in travel speed compared to peak period car use, we estimate the labor market to increase by 5,000 workers relative to the no-build scenario. The impacts derived from this expansion are summarized below.
Table 8 – Impact of Labor Market Expansion in 2030
LABOR MARKET EXPANSION 2030 Impact Labor Market Growth (no. of employees, 2030) 5,000 Percent Growth (versus no-build) 0.2% TOTAL ECONOMIC IMPACT JOBS (number) 562 BUSINESS SALES ($ millions) $68.7 LABOR INCOME ($ millions) $29.6
Total Economic Impacts of Capital Corridor Service
The total economic impact from all the direct, indirect, and induced economic effects attributable to expanded passenger rail service is summarized in Table 9. These impacts include the expected effects of operating and maintaining the proposed service, operational impacts, labor market access, and visitor and tourism effects as described above. By 2030, the expected annual effects of the Capital Corridor will amount to $137.4 million in increased business output, 1,125 new jobs, and $56.4 million in additional wages for residents of Massachusetts and New Hampshire cities and towns affected by this service.6
6 This compares favorably with recent estimates of the economic impacts of the Manchester-Boston Regional Airport
(MHT), which in 2008 supported 3,820 jobs, $152.9 million in wages, and $1.2 billion in overall economic impacts. For the two years of construction, the Capital Corridor is expected to produce 3,488 job-years (1,744 jobs in each of the two construction years), $194.1 million in wages and $516.3 million in regional output (GDP).
ECONOM IC IM P ACT OF PAS SENGER RAI L EXP AN SION A LONG THE NH CAPITAL CORRIDOR
10
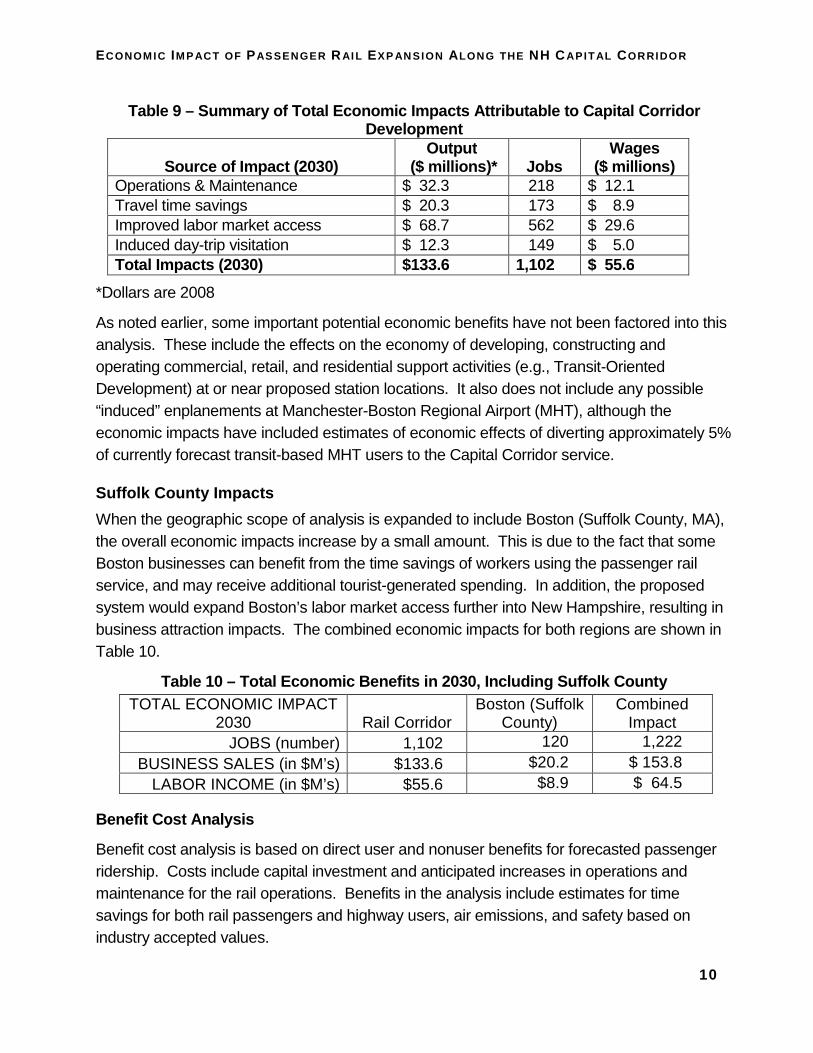
Table 9 – Summary of Total Economic Impacts Attribu table to Capital Corridor Development
Source of Impact (2030) Output
($ millions)* Jobs Wages
($ millions) Operations & Maintenance $ 32.3 218 $ 12.1 Travel time savings $ 20.3 173 $ 8.9 Improved labor market access $ 68.7 562 $ 29.6 Induced day-trip visitation $ 12.3 149 $ 5.0 Total Impacts (2030) $133.6 1,102 $ 55.6
*Dollars are 2008
As noted earlier, some important potential economic benefits have not been factored into this analysis. These include the effects on the economy of developing, constructing and operating commercial, retail, and residential support activities (e.g., Transit-Oriented Development) at or near proposed station locations. It also does not include any possible “induced” enplanements at Manchester-Boston Regional Airport (MHT), although the economic impacts have included estimates of economic effects of diverting approximately 5% of currently forecast transit-based MHT users to the Capital Corridor service.
Suffolk County Impacts
When the geographic scope of analysis is expanded to include Boston (Suffolk County, MA), the overall economic impacts increase by a small amount. This is due to the fact that some Boston businesses can benefit from the time savings of workers using the passenger rail service, and may receive additional tourist-generated spending. In addition, the proposed system would expand Boston’s labor market access further into New Hampshire, resulting in business attraction impacts. The combined economic impacts for both regions are shown in Table 10.
Table 10 – Total Economic Benefits in 2030, Includi ng Suffolk County TOTAL ECONOMIC IMPACT
2030 Rail Corridor Boston (Suffolk
County) Combined
Impact JOBS (number) 1,102 120 1,222
BUSINESS SALES (in $M’s) $133.6 $20.2 $ 153.8 LABOR INCOME (in $M’s) $55.6 $8.9 $ 64.5
Benefit Cost Analysis
Benefit cost analysis is based on direct user and nonuser benefits for forecasted passenger ridership. Costs include capital investment and anticipated increases in operations and maintenance for the rail operations. Benefits in the analysis include estimates for time savings for both rail passengers and highway users, air emissions, and safety based on industry accepted values.
ECONOM IC IM P ACT OF PAS SENGER RAI L EXP AN SION A LONG THE NH CAPITAL CORRIDOR
11
In benefit cost analysis, future benefits and costs are discounted by a real (inflation-adjusted) discount rate. Because benefits accruing further in the future are discounted more heavily, discounting affects capital investment less severely than downstream benefits and operation and maintenance expenses. By discounting and normalizing benefits and costs to their net present value (PV), decision makers have a common basis to compare projects and alternatives when costs and benefits are spread out over 20 or more years. The present analysis considers costs and benefit flows over the period 2010 to 2040.
The Capital Corridor project, as analyzed in this report, has a benefit cost ratio above 1.0 indicating that discounted benefits are higher than discounted costs. This suggests that, based strictly on a comparison of the net present value of costs and benefits, the Capital Corridor will result in a net gain in overall benefits for the investments made in constructing and operating the project.
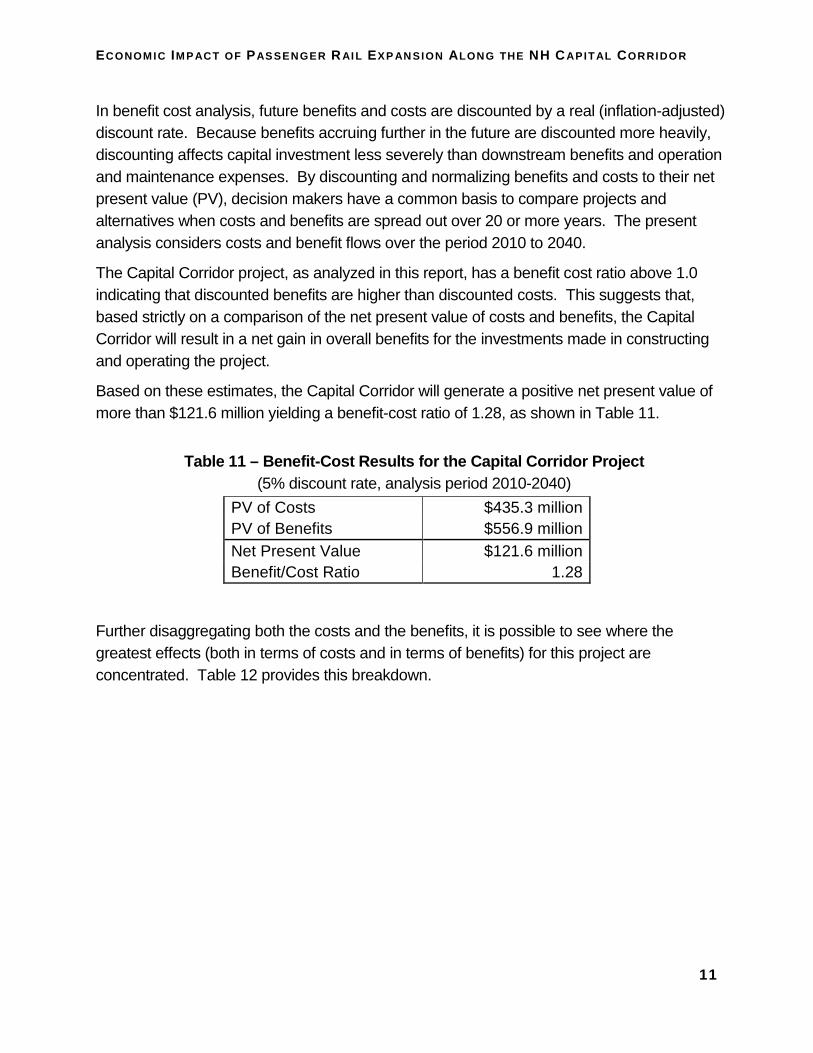
Based on these estimates, the Capital Corridor will generate a positive net present value of more than $121.6 million yielding a benefit-cost ratio of 1.28, as shown in Table 11.
Table 11 – Benefit-Cost Results for the Capital Cor ridor Project (5% discount rate, analysis period 2010-2040)
PV of Costs $435.3 million PV of Benefits $556.9 million Net Present Value $121.6 million Benefit/Cost Ratio 1.28
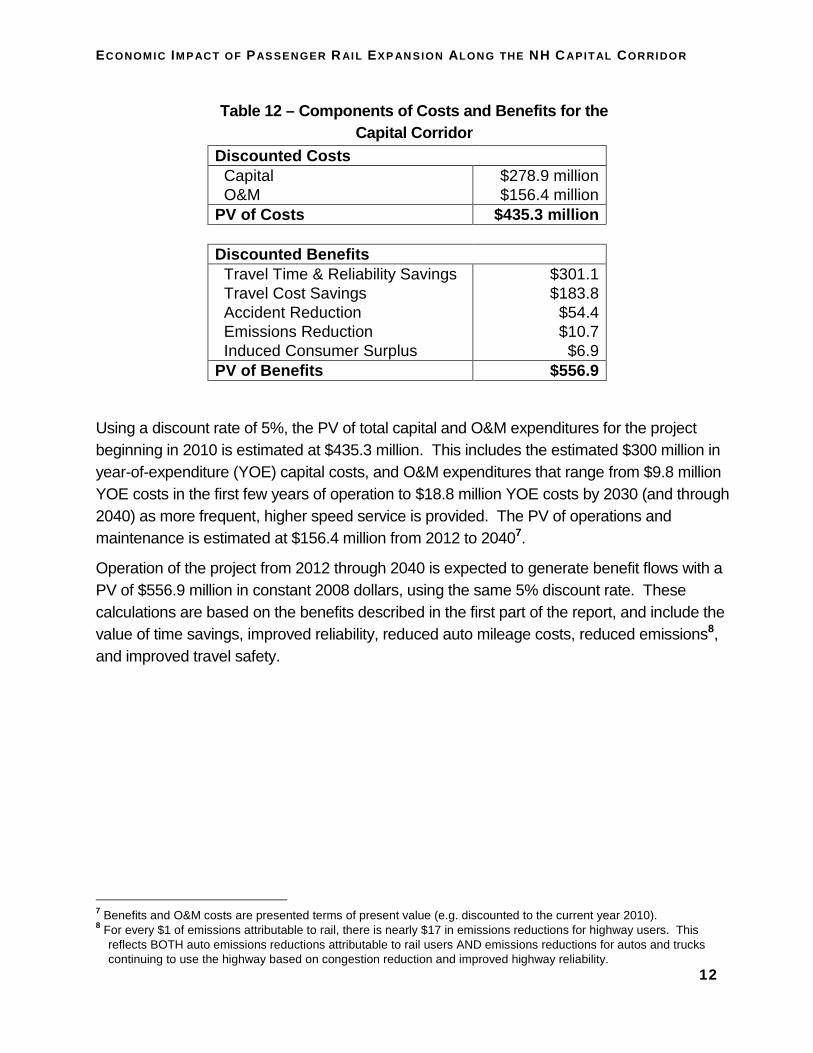
Further disaggregating both the costs and the benefits, it is possible to see where the greatest effects (both in terms of costs and in terms of benefits) for this project are concentrated. Table 12 provides this breakdown.
ECONOM IC IM P ACT OF PAS SENGER RAI L EXP AN SION A LONG THE NH CAPITAL CORRIDOR
12
Table 12 – Components of Costs and Benefits for the Capital Corridor
Discounted Costs
Capital $278.9 million O&M $156.4 million PV of Costs $435.3 million
Discounted Benefits Travel Time & Reliability Savings $301.1 Travel Cost Savings $183.8 Accident Reduction $54.4 Emissions Reduction $10.7 Induced Consumer Surplus $6.9 PV of Benefits $556.9
Using a discount rate of 5%, the PV of total capital and O&M expenditures for the project beginning in 2010 is estimated at $435.3 million. This includes the estimated $300 million in year-of-expenditure (YOE) capital costs, and O&M expenditures that range from $9.8 million YOE costs in the first few years of operation to $18.8 million YOE costs by 2030 (and through 2040) as more frequent, higher speed service is provided. The PV of operations and maintenance is estimated at $156.4 million from 2012 to 20407.
Operation of the project from 2012 through 2040 is expected to generate benefit flows with a PV of $556.9 million in constant 2008 dollars, using the same 5% discount rate. These calculations are based on the benefits described in the first part of the report, and include the value of time savings, improved reliability, reduced auto mileage costs, reduced emissions8, and improved travel safety.
7 Benefits and O&M costs are presented terms of present value (e.g. discounted to the current year 2010). 8 For every $1 of emissions attributable to rail, there is nearly $17 in emissions reductions for highway users. This
reflects BOTH auto emissions reductions attributable to rail users AND emissions reductions for autos and trucks continuing to use the highway based on congestion reduction and improved highway reliability.
ECONOM IC IM P ACT OF PAS SENGER RAI L EXP AN SION A LONG THE NH CAPITAL CORRIDOR
13
APPENDIX A: METHODOLOGICAL DETAILS
Ridership, revenue and operating cost assumptions:
Previous estimates of commuter rail ridership in New Hampshire were based on an MBTA model, featuring an extension of MBTA equipment and operations costs across state lines into New Hampshire using a frequent-service, rush-based corridor to Nashua. While not entirely inappropriate for this study, these studies included assumptions about end-to-end times, speeds, and equipment that do not necessarily apply to intercity passenger rail performance assumptions. Amtrak’s high-speed rail studies were based on a corridor extending well beyond Concord, with higher speeds and frequencies. Thus, neither of these methods is wholly adequate for this study.
The ridership forecasts for the Capital Corridor were based on boarding and alighting data from the Downeaster passenger rail service which is considered to be an appropriate parallel operating plan since the operating schedule would be similar and also because the Downeaster connects to North Station in Boston from its origin in Portland, ME. Other similarities include:
• Operation over existing MBTA commuter routes with one inbound station serving both services (Haverhill, MA) where ridership is split between alternatives (similar to Lowell);
• Same likely equipment set (P42 with Amcoach and cab car run push-pull);
• Same number of daily trips between endpoints, on a similarly distributed all-day, non-commuter schedule;
• Similar markets focused from outlying population centers to the metropolitan center of Boston, in a rail-aware and transit-familiar market;
• Direct competition with parallel Interstate highway corridor (I-95 v. I-93); and
• Interim station stops provide significant boardings (Downeaster’s heaviest loading station is Exeter, NH, 50 miles from Boston) similar to Manchester NH.
Since its inception, the “Downeaster” service has been closely monitored for ridership, performance, operating costs and revenue production – and because of its North Station location (the only Amtrak service from North Station) the costs, ridership, revenue, and operating issues are isolated within the Amtrak system and not comingled with other services between points as might happen elsewhere.
Ticket prices were projected using the same cost/distance parameters established from Boston on existing services. Published Amtrak operating costs were proportionately allocated based upon the total number of trips per day throughout the operating period.
ECONOM IC IM P ACT OF PAS SENGER RAI L EXP AN SION A LONG THE NH CAPITAL CORRIDOR
14
Published ridership and boarding data by station for the “Downeaster” was compared to city population and distance-from-destination data for the Capital Corridor to arrive at initial passenger boarding projections. In the absence of more substantial data and methods, using estimates based on similar markets to a common destination was considered to be a reasonable approach to developing an initial estimate of ridership and revenue. More elaborate studies, including travel demand and stated preference surveys should be considered if ridership forecasts are refined at a later date, or used to support a more precise estimate of net subsidy requirements.
There are several differences between the Downeaster service and the Capital Corridor. For the following considerations, information in the “Downeaster” estimates was modified to conform to conditions likely to be faced for Capital Corridor operations. These include the following:
• Downeaster is 114.7 miles from North Station to Portland; Capitol Corridor is 73.5 miles.
• Total projected train miles for similar schedules result in 423,400 miles on Downeaster vs. 268,275 projected on the Capitol Corridor, resulting in 63% of the projected train miles and less operating cost but approximately the same equipment and administrative needs.
• Downeaster features nine station stops; Capitol Corridor would have five. • Census population for the Boston-Concord corridor is significantly higher than
Boston-Portland; an estimated 426,563 on 75 route miles vs. 217,849 on Downeaster’s on 114 miles – nearly twice the market, with a greater trip-end density, and a potential for higher ridership rates.
• Alternative transportation choices are similar but not exact with parallel interstate highways. Portland – Boston has direct air service as competition to the corridor.
Because equipment costs to provide the service (as well as administrative costs by the operator, presumably Amtrak) are not linear with respect to distance operated, and because operating data was not provided by Amtrak, the ratio of fixed to variable operating cost must be estimated at this time. These estimates do not include existing costs passed through to MBTA, along with operating fees to Guilford/Pan Am, on their portion of operated trackage.
Based on current experience operating rail systems in the region, the relative proportion of fixed to variable costs are expected to be at least 75% fixed cost and 25% variable cost, leading to a higher per-mile train cost than the existing Downeaster, but less overall cost (due to shorter operating distances) with higher projected ridership. This results in an overall higher level of projected farebox recovery than for the Downeaster services.
ECONOM IC IM P ACT OF PAS SENGER RAI L EXP AN SION A LONG THE NH CAPITAL CORRIDOR
15
The impact of these operating costs on required subsidy will not be known until further study and initial negotiations are done with the three involved parties: the operator – likely Amtrak, Guilford/Pan Am, and MBTA. Amtrak has reviewed, but not yet replied, to initial estimates of operating costs.
Manchester-Boston Regional Airport Boarding Estimates
With the advent of new passenger rail service and a new station planned to be built at the Manchester-Boston Regional Airport (MHT), there is a reasonable expectation that some passengers will use this newly available mode of transportation to access the airport. An analysis of potential public transportation passengers that might use MHT was developed by PB Americas, Inc for the Southern New Hampshire Planning Commission (see: “Ridership Estimates for Capital Corridor Passenger Rail Service”, Sept. 2008).
Estimates of air passenger trips that might potentially use the Capital Corridor service were based on estimates of year 2000 daily trips associated with MHT provided by the Southern New Hampshire Planning Commission (SNHPC) with an annual growth rate of 2.8% which was provided by MHT. SNHPC assumed approximately 13,300 daily airport passenger trips in 2000, which increases to 30,500 daily airport trips in 2030. By analyzing the airport passenger travel time of day and the travel origins and destinations (within New England) of airport passengers, PB estimated how many of those daily airport passenger trips could be served by the proposed rail service (identified as Possible Transit Trips). From the identification of the possible transit trips, an assumed transit “mode share” of 5% was used in this analysis, which is typical of airport passengers observed at other US airports with comparable intercity rail services.9
Factors that could likely influence changes in ridership include the number of airlines serving the airport, ease of access to the airports within the region, and the potential for travel packages to utilize the rail service for travel bookings. The current estimates were only based on existing conditions and did not account for potential market changes at the airport.
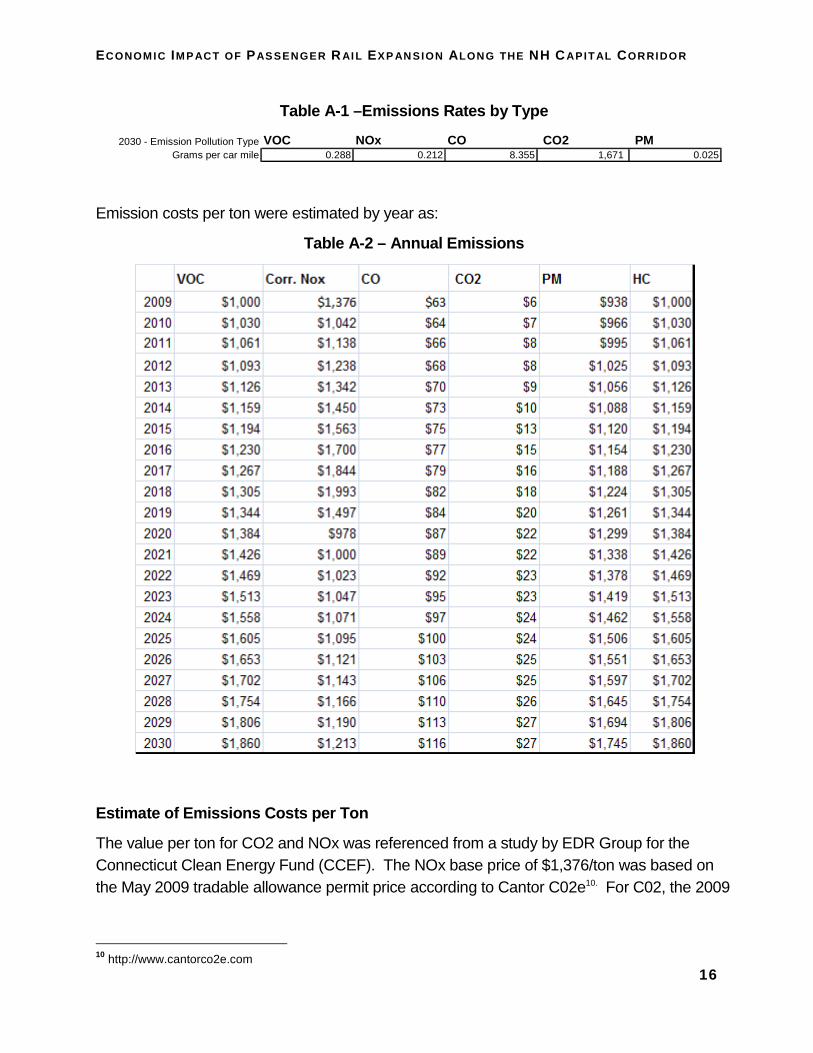
Air Quality and Emissions
Emissions factors were derived from Mobile 6 Emission factors made available from the Massachusetts Department of Environmental Protection. Table A-1 provides emission factors for each of the key criteria pollutants.
9 Baltimore-Washington International Airport and the Amtrak/MARC lines operating between Baltimore Penn Station
and Washington Union Station have as much as 23% of their total weekday riders board/embark at the BWI rail station.
ECONOM IC IM P ACT OF PAS SENGER RAI L EXP AN SION A LONG THE NH CAPITAL CORRIDOR
16
Table A-1 –Emissions Rates by Type
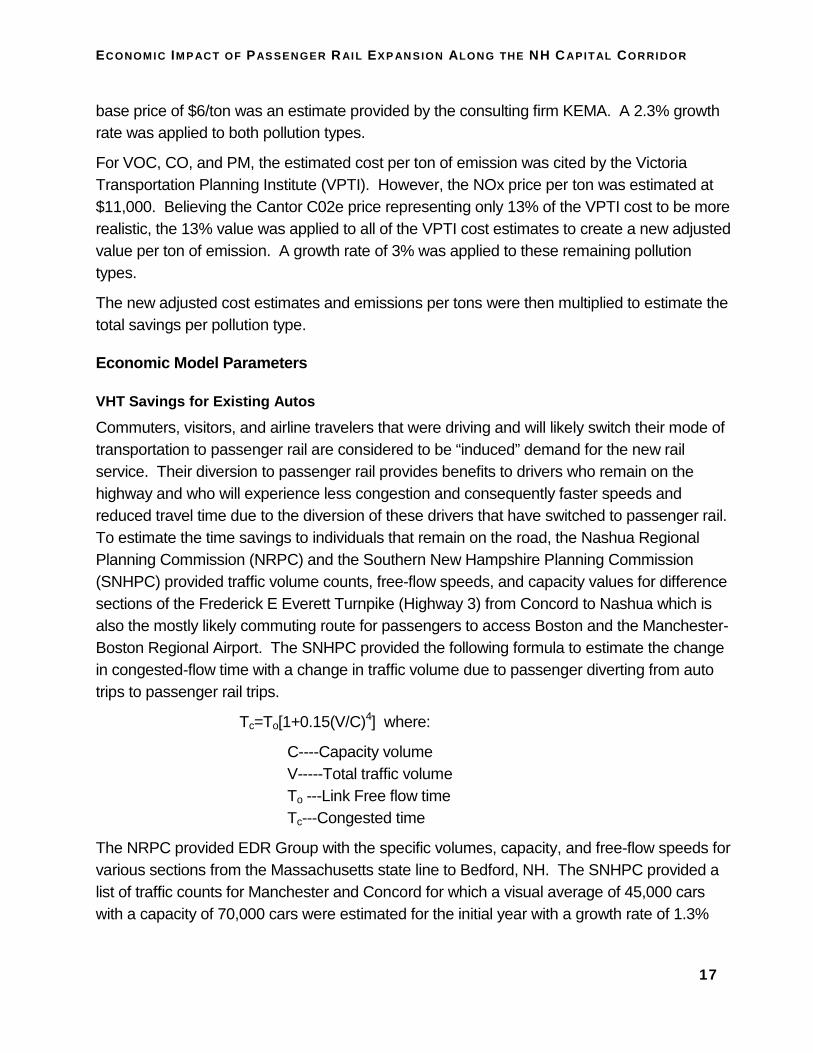
Emission costs per ton were estimated by year as:
Table A-2 – Annual Emissions
Estimate of Emissions Costs per Ton
The value per ton for CO2 and NOx was referenced from a study by EDR Group for the Connecticut Clean Energy Fund (CCEF). The NOx base price of $1,376/ton was based on the May 2009 tradable allowance permit price according to Cantor C02e10. For C02, the 2009
10 http://www.cantorco2e.com
2030 - Emission Pollution Type VOC NOx CO CO2 PM Grams per car mile 0.288 0.212 8.355 1,671 0.025
ECONOM IC IM P ACT OF PAS SENGER RAI L EXP AN SION A LONG THE NH CAPITAL CORRIDOR
17
base price of $6/ton was an estimate provided by the consulting firm KEMA. A 2.3% growth rate was applied to both pollution types.
For VOC, CO, and PM, the estimated cost per ton of emission was cited by the Victoria Transportation Planning Institute (VPTI). However, the NOx price per ton was estimated at $11,000. Believing the Cantor C02e price representing only 13% of the VPTI cost to be more realistic, the 13% value was applied to all of the VPTI cost estimates to create a new adjusted value per ton of emission. A growth rate of 3% was applied to these remaining pollution types.
The new adjusted cost estimates and emissions per tons were then multiplied to estimate the total savings per pollution type.
Economic Model Parameters
VHT Savings for Existing Autos
Commuters, visitors, and airline travelers that were driving and will likely switch their mode of transportation to passenger rail are considered to be “induced” demand for the new rail service. Their diversion to passenger rail provides benefits to drivers who remain on the highway and who will experience less congestion and consequently faster speeds and reduced travel time due to the diversion of these drivers that have switched to passenger rail. To estimate the time savings to individuals that remain on the road, the Nashua Regional Planning Commission (NRPC) and the Southern New Hampshire Planning Commission (SNHPC) provided traffic volume counts, free-flow speeds, and capacity values for difference sections of the Frederick E Everett Turnpike (Highway 3) from Concord to Nashua which is also the mostly likely commuting route for passengers to access Boston and the Manchester-Boston Regional Airport. The SNHPC provided the following formula to estimate the change in congested-flow time with a change in traffic volume due to passenger diverting from auto trips to passenger rail trips.
Tc=To[1+0.15(V/C)4] where:
C----Capacity volume V-----Total traffic volume To ---Link Free flow time Tc---Congested time
The NRPC provided EDR Group with the specific volumes, capacity, and free-flow speeds for various sections from the Massachusetts state line to Bedford, NH. The SNHPC provided a list of traffic counts for Manchester and Concord for which a visual average of 45,000 cars with a capacity of 70,000 cars were estimated for the initial year with a growth rate of 1.3%
ECONOM IC IM P ACT OF PAS SENGER RAI L EXP AN SION A LONG THE NH CAPITAL CORRIDOR
18
per year. Using a 1.1 passenger per car occupancy rate, EDR Group estimated a total of 201,856 Vehicle Hours Travelled (VHT) saved due to auto trips diverted to rail.
Passenger Time Value
The values of time used for different trip purposes (commute = $21.20, personal=$10.60) are generally consistent with methods for valuing user travel time benefits as followed by HERS and BCA.Net software, as well as CUTR and USDOT guidance. However, values have been updated to reflect 2007 wage rates (average of all occupations, not just transport occupations), based on BLS wage data. Both commuting and personal travel time are treated as a non-money user benefit with a value set at 50% of the wage rate (no fringe added). For economic impact analysis only, there is an additional allowance for the effect of higher commuting cost on employer cost in the form of a wage rate premium valued at another 50% of the wage rate per hour without fringe (per research by Zax et al.). For out-of-vehicle transit time (including buffer time), TREDIS uses 100% of the wage rate.
Vehicle Operating Costs
Vehicle operating cost per mile is $0.58 for an average of small, medium and large cars and SUV; as defined by the American Automobile Association for 2008.
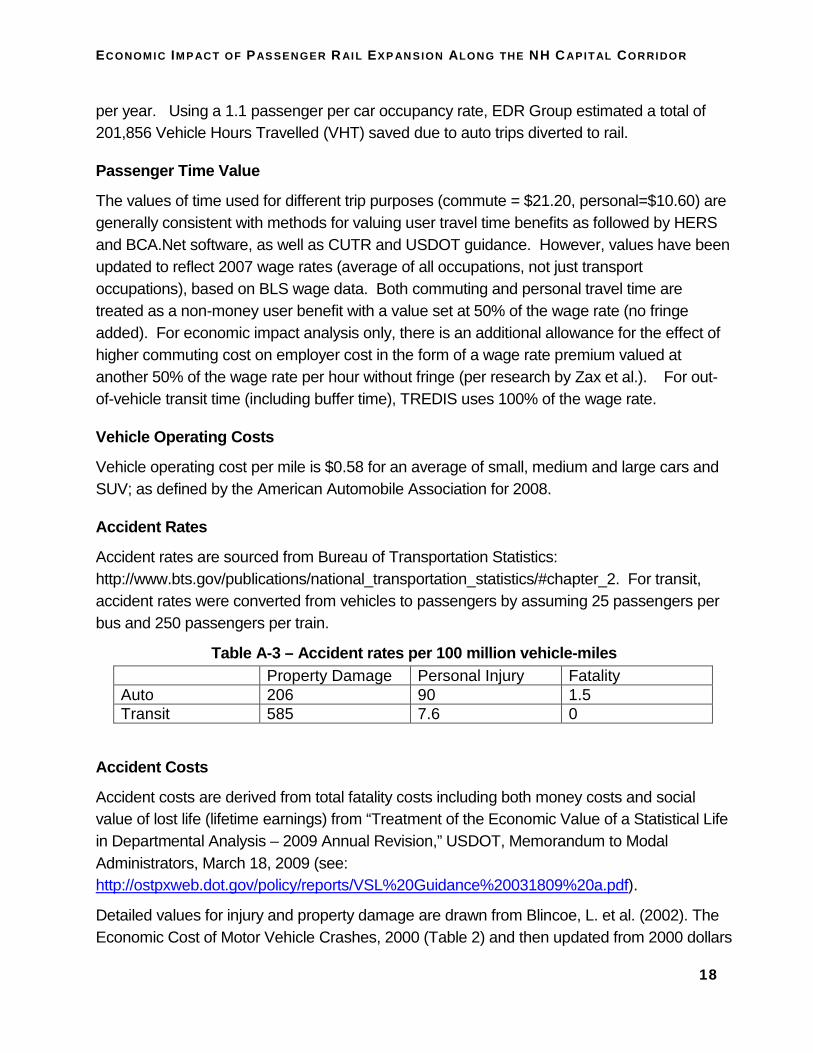
Accident Rates
Accident rates are sourced from Bureau of Transportation Statistics: http://www.bts.gov/publications/national_transportation_statistics/#chapter_2. For transit, accident rates were converted from vehicles to passengers by assuming 25 passengers per bus and 250 passengers per train.
Table A-3 – Accident rates per 100 million vehicle- miles Property Damage Personal Injury Fatality Auto 206 90 1.5 Transit 585 7.6 0
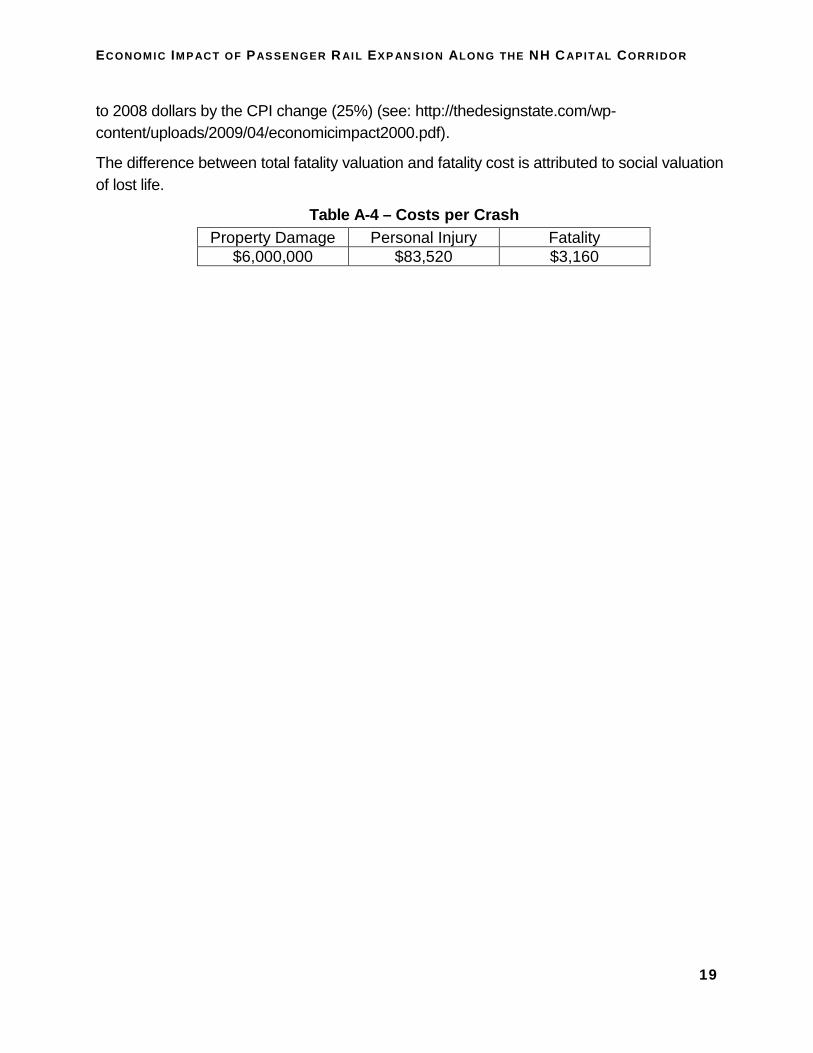
Accident Costs
Accident costs are derived from total fatality costs including both money costs and social value of lost life (lifetime earnings) from “Treatment of the Economic Value of a Statistical Life in Departmental Analysis – 2009 Annual Revision,” USDOT, Memorandum to Modal Administrators, March 18, 2009 (see: http://ostpxweb.dot.gov/policy/reports/VSL%20Guidance%20031809%20a.pdf).
Detailed values for injury and property damage are drawn from Blincoe, L. et al. (2002). The Economic Cost of Motor Vehicle Crashes, 2000 (Table 2) and then updated from 2000 dollars
ECONOM IC IM P ACT OF PAS SENGER RAI L EXP AN SION A LONG THE NH CAPITAL CORRIDOR
19
to 2008 dollars by the CPI change (25%) (see: http://thedesignstate.com/wp-content/uploads/2009/04/economicimpact2000.pdf).
The difference between total fatality valuation and fatality cost is attributed to social valuation of lost life.
Table A-4 – Costs per Crash Property Damage Personal Injury Fatality
$6,000,000 $83,520 $3,160