Embed Size (px)
Citation preview
Economic Impact Analysis of CPV Towantic, LLC’s Construction and Operation of an 805 MW Electricity Generation Facility in Oxford, CT
Prepared by: Peter Gunther, Senior Research Fellow, CCEA
Fred Carstensen, Director, CCEA and
William Waite, Managing Director, Semnia LLC
For: CPV Towantic, LLC
January 2, 2015
Connecticut Center for Economic Analysis Page 2 of 25 University of Connecticut
EXECUTIVE SUMMARY
CPV Towantic, LLC (CPV) engaged the Connecticut Center for Economic Analysis (CCEA) to
develop an analysis of the economic impacts that would flow from constructing and operating a
natural gas-powered electric generating facility in Oxford, CT. CCEA used Regional Economic
Model Inc.’s (REMI) model to project the impact that construction and operation of the facility
will have on the State of Connecticut’s economy, as well as that of local municipalities. This
report presents CCEA’s methodology and findings.
CCEA developed the analysis on the basis of CPV’s construction estimates of inputs that could
feasibly be purchased in Connecticut, as well as CPV’s forecast of the facility’s annual operating
costs. Even where purchases are made in Connecticut the REMI model allocates supply-chain
reactions either internally or externally to the state. Because of its sophistication, and ability to
account for such interactions, the REMI model avoids exaggerating linked impacts within
Connecticut during construction, ensuring CCEA’s results are conservative.
This analysis assesses project impacts first for just construction of the facility, then for
operations, and finally for the entire (total) project; that is, construction and operations
combined. The results highlight the concentration of economic activity the project generates –
both geographically (in the region of the state around Oxford, CT) and over time (aka,
longitudinally). The economic impacts are particularly significant during the construction phase
– approximately three years during which CPV anticipates spending nearly a quarter billion
dollars in Connecticut. The CCEA’s results also confirm that operations will deliver real
economic benefits.
CCEA projects that from 2015 to 2040, CPV’s project in Oxford will generate the following
economic impacts for the State of Connecticut, its residents, and communities. The Towantic
project will:
Add over $7.85 billion in increased real state gross domestic product (RSGDP), in 2009-fixed dollars; about $7.9 billion in new household (personal) income, in current dollars;
Deliver an average of 1,796 incremental jobs over-and-above the REMI base-case annually, or 46,706 job-years in total;
Generate revenue to increase state’s fiscal capacity by a total of $358 million, in 2009-dollars;
Augment local governments’ real state gross domestic product by $347 million, in 2009-dollars.
The economic benefits from CPV’s project will benefit the entire state, but municipalities and
constituents residing closer to Oxford will capture a greater share of the impacts.
Connecticut Center for Economic Analysis Page 3 of 25 University of Connecticut
TABLE OF CONTENTS
Executive Summary ......................................................................................................................... 2
Table of Contents ............................................................................................................................ 3
Introduction .................................................................................................................................... 4
Terms, Definitions, and Acronyms .................................................................................................. 5
Economic Terms .......................................................................................................................... 5
Other Key Terms .......................................................................................................................... 7
Background and Situation ............................................................................................................... 9
Economic Impact Analysis ............................................................................................................. 12
Construction Phase ................................................................................................................... 13
Operations Phase ...................................................................................................................... 15
Sensitivities ........................................................................................................................... 17
Summary of Findings ................................................................................................................. 17
Conclusion ..................................................................................................................................... 20
Appendix 1 – About CCEA ............................................................................................................. 21
Appendix 2 – Maps ....................................................................................................................... 22
Endnotes ....................................................................................................................................... 24
FORWARD-LOOKING STATEMENTS This report contains forward-looking statements regarding economic and financial metrics. Herein, we do not use the term “forward-looking statements” as it is specifically understood within the Private Securities Litigation Reform Act of 1995. However, we use the term in a similar manner, in so far as forward-looking statements involve uncertainties because they relate to events, and depend on circumstances, that have yet to occur, but will or may happen in the future. Forward-looking statements are subject to risks and uncertainties, which could cause actual results to differ, possibly materially, from those anticipated and presented herein. Forward-looking statements are based on the authors’ beliefs, established economic principles, and data from CPV and other accessible, reliable sources, as well as assumptions made by the authors and the base-case scenario contained in the REMI model. When used herein, the words “forecast,” “estimate,” “anticipate,” “should,” variations of such words, and similar expressions, are intended to identify forward-looking statements. However, throughout this report, all economic impacts that have not yet been realized – that is, numbers that are not purely historical – as well as conclusions, recommendations, and the like that are based on such results, should be understood to be or involve forward-looking statements. Factors that could cause forward-looking statements to differ from actual results include but are not limited to: revisions to extant data series; alterations to federal, state, and municipal fiscal policies; timing of specific investments and/or expenditures; demographic growth; legal and regulatory developments; availability of new technologies; natural disasters, adverse weather conditions, and any other force majeure event. All forward-looking statements made in this report are qualified by the cautionary statements in this section. The authors cannot guarantee that the results we anticipate (and present herein) will be realized, or even if realized, will have the expected consequences to, or effects on, the State of Connecticut’s or local municipalities’ economic situation. Forward-looking statements made in this report apply only as of the date of this report. While the authors may elect to update forward-looking statements, we specifically disclaim any obligation to do so after the date of this report.
Connecticut Center for Economic Analysis Page 4 of 25 University of Connecticut
INTRODUCTION
America’s electric system – “the supreme engineering achievement of the 20th century,”
according to the National Academy of the Sciences – is aging, inefficient, and congested, and
incapable of meeting the future energy needs of America’s economy without changes and
substantial capital investments over the next several decades.
As described in the EXECUTIVE SUMMARY, CPV engaged CCEA to develop an analysis of the
economic impacts of constructing and operating a state-of-the-art 805 MW natural gas-
powered electric generating facility in Oxford, CT. This report presents the results of that study.
Using data from CPV and other available, reliable sources, CCEA examined the construction and
operation phases, as well the combined (aggregate) value of CPV’s project, using the REMI
model v.1.6.0. The REMI model allowed CCEA to project economic impacts to both the state
and the region immediately surrounding Oxford for the period 2015 to 2040. This report
presents results for specific indicators both longitudinally and as cumulative, discounted
present (PV) values.
This report is organized into the following sections:
TERMS, DEFINITIONS, AND ACRONYMS: Contains definitions and descriptions of key economic
terms used, organizations referenced, and the meaning of certain phrases.
BACKGROUND AND SITUATION: Provides an overview of the situation regarding the licensing
and planned construction of an energy generating facility in Oxford, as well as some
details regarding the CPV facility.
ECONOMIC IMPACT ANALYSIS:
o CONSTRUCTION PHASE: Describes the activities – and expenditures – expected to
take place between 2015 and 2018, and resulting economic impacts that the
modeling projects for this phase of the project.
o OPERATIONS PHASE: Examines the economic impact of the facility’s continuing
operations from 2017 through 2040.
SENSITIVITIES: Provides additional information regarding how CCEA’s
findings could/would be impacted by changing assumptions regarding
environmental impacts and/or modifications to RGGI payments.
o SUMMARY OF FINDINGS: Amalgamates CCEA findings from the Construction and
Operation Phases, summarizing total forecasted economic impacts from 2015
through 2040.
CONCLUSION: Summarizes what CCEA believes are the salient findings of the study.
TERMS, DEFINITIONS, AND ACRONYMS
While every effort has been made to make the contents of this paper as accessible as possible,
due to the nature of this study, references to certain (technical) economic concepts, as well as
specific organizations, are necessary. This section presents definitions and descriptions of key
terms used, organizations referenced, and the meaning of certain phrases.
ECONOMIC TERMS
Jobs: “A job is defined as an uninterrupted period of work with a particular employer.
Jobs are therefore employer based, not position-based. If a respondent indicates that he
or she left a job but in a subsequent survey returned to the same job, it is counted as a
new job.”i Similarly if two employers each create a job the total number of jobs
generated is two. Because many jobs are part time, the number of jobs in the economy
exceeds the number of fulltime equivalent (FTE) employment. In this analysis, we
consider three job classifications:
o Direct jobs are those created by the organization or organizations responsible
for generating an economic stimulus (e.g., construction jobs with a prime
contractor, employees of a new business, etc.).
o Indirect jobs are those created by the supply chain involved in delivering goods
and services to the organization or organizations that generated the stimulus
(e.g., jobs with secondary contractors, suppliers of materials, etc.).
o Induced jobs are those created as the result of expenditures from direct,
indirect, and other induced employees (e.g., jobs at restaurants, grocery stores,
recreational tourism, etc.).
Job-years are the number of annual jobs created by the project summed over each year.
Personal Income is the sum of compensation to incremental employees plus
proprietors’ income plus current transfer receipts, minus government contributions for
domestic social insurance.
o Disposable Personal Income: Personal income less personal taxes. In other
words, disposable personal income is what a household has discretion to spend
after paying taxes on Personal Income.
Personal Current Taxes includes income taxes paid directly to each order of government
by households but excludes corporate taxes and sales taxes.ii
o Of the $35.66 billion paid by Connecticut citizens in personal current taxes in
2013, $8.12 billion (22.8%) accrued to the state of which $7.93 billion was in
personal income taxes, $183.6 million for motor vehicle licenses and $12.3
Connecticut Center for Economic Analysis Page 6 of 25 University of Connecticut
million other, mostly hunting, fishing and boating licenses. These shares among
governments can vary over time. However, such shares are fairly stable
assuming that federal and state income tax rates remain in the same proportion.
Present value (PV) provides a way to aggregate the financial (and/or economic) impacts
from different years into a single figure. PV takes into consideration the time value of
money – the concept that, for various reasons (specifically individual utility and
inflation), a dollar today is more valuable than a dollar in some future year. The
mathematical expression of PV is:
𝑃𝑉 =∑𝑉𝑎𝑙𝑢𝑒𝑡(1 + 𝑟)𝑡
𝑁
𝑡=0
Where r is the discount rate, t is the specific time period, and N is the total
number of time periods. In (and throughout) this report, we use a discount rate
of 5%;iii t is in years.
Real state gross domestic product (RSGDP) is the total of the State’s output adjusted to
a common year, in this case 2009; “output” is the value added, not the value shipped, by
each industry and sector of the economy.iv
o When referring to RSGDP in this report, we use the term “2009-fixed dollars,”
sometime also referred to as “2009-chained dollars.” According to the U.S.
Federal Reserve Board: “The traditional way to define real GDP has been to sum
the real year-b dollar expenditures for each category. The resulting series has the
interpretation of ‘the value of period t’s output had all prices remained at their
year-b level.’ Because this method values all quantities in terms of a fixed set of
prices, as in a traditional Laspeyres index, it is known as a ‘fixed-weight’ measure
of real output.”v 2009 is used as the benchmark-year by both the U.S.
Department of Commerce, Bureau of Economic Analysis (BEA)vi and REMI. To be
consistent, herein, we use the same benchmark-year.
RGDP of State Government is the annual real output generated by a state government.
RGDP of Local Governments is the annual real output generated by local governments,
e.g. municipalities. The figures presented in this report include all municipalities in
Connecticut. However, the distribution of benefits will accrue disproportionately to
those municipalities located in the immediate area surrounding the facility during both
its construction and operations phases.
Connecticut Center for Economic Analysis Page 7 of 25 University of Connecticut
OTHER KEY TERMS
The Connecticut Siting Council is the government agency most directly responsible for
approving the construction of new power generation facilities in the State. Information
regarding the Council, including its mission and jurisdiction, can be found at
http://www.ct.gov/csc/cwp/view.asp?a=895&q=248310.
The Connecticut Department of Energy and Environmental Protection (DEEP) “is
charged with conserving, improving and protecting the natural resources and the
environment of the state of Connecticut as well as making cheaper, cleaner and more
reliable energy available for the people and businesses of the state.” For additional
information visit: http://www.ct.gov/deep/site/default.asp.
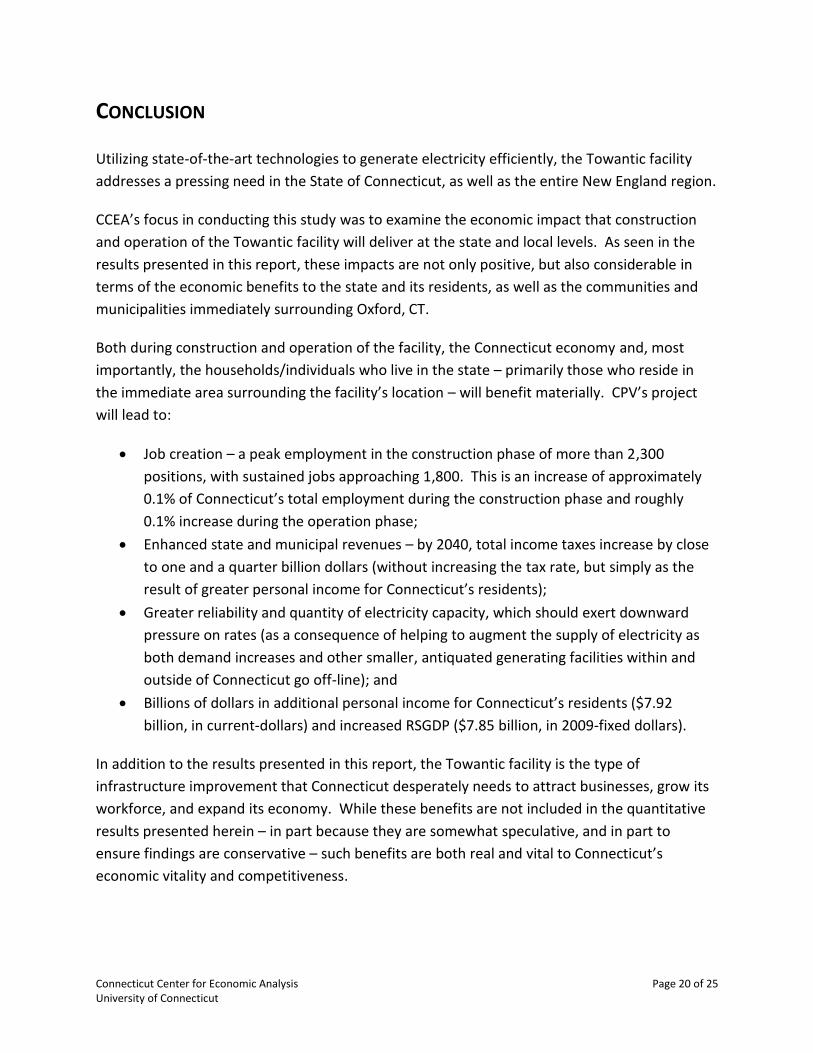
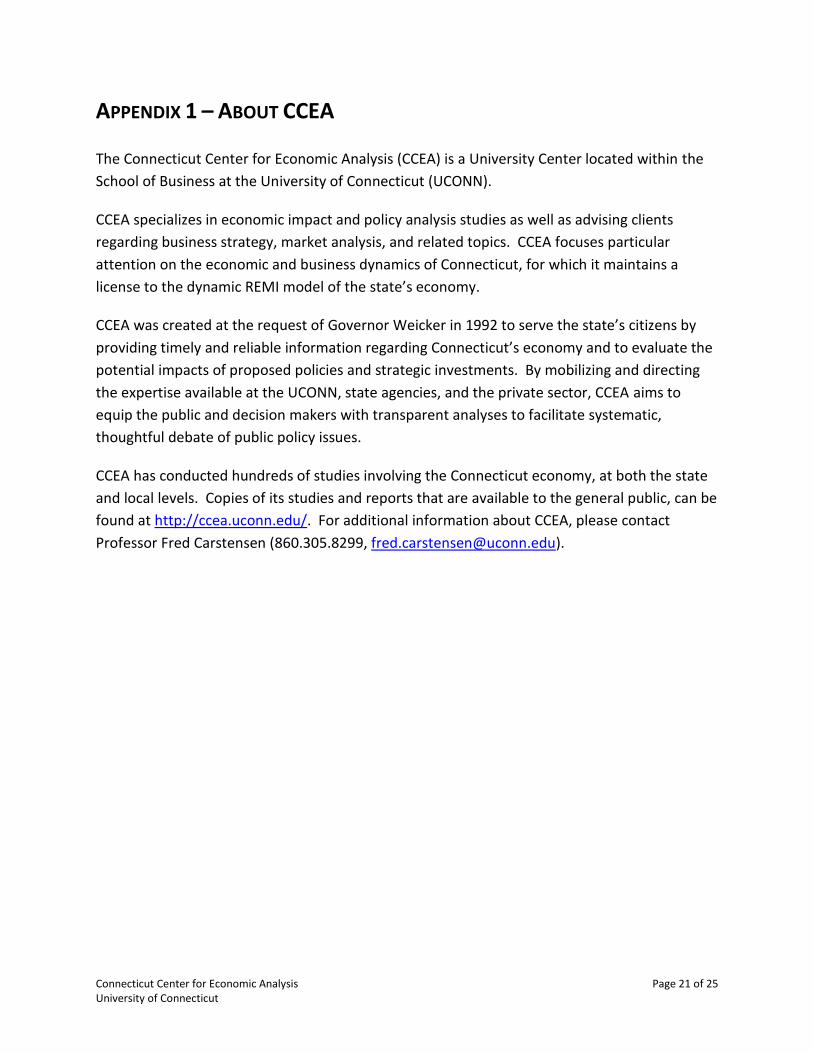
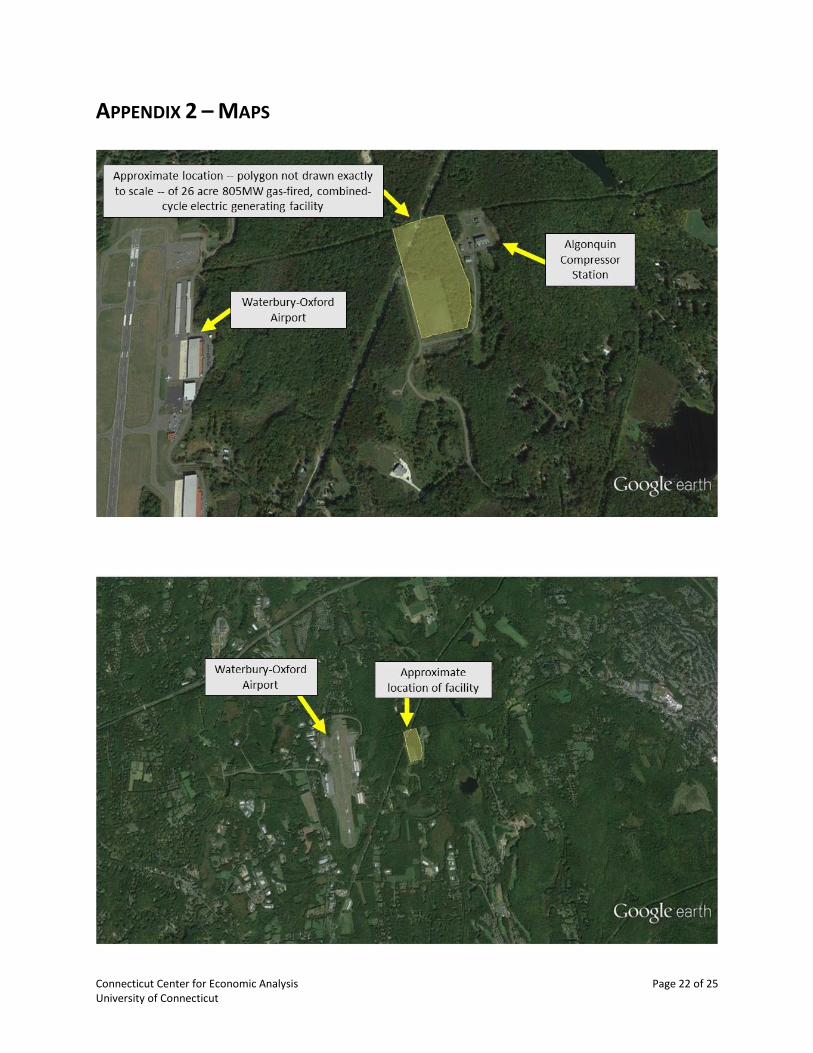
“The facility” or “the Towantic facility” refers to the 805 MW gas-fired, 2x1 combined-
cycle, electrical generation facility CPV is planning to construct on a 26-acre parcel of
land due east of the northern end of the Waterbury-Oxford Airport in Oxford, CT. The
Appendix in this report contains maps illustrating where the facility will be constructed.
The specific location, according to the Connecticut Siting Council is, “… north of the
Prokop Road and Towantic Hill Road intersection in the Town of Oxford, Connecticut.”vii
Federal Energy Regulatory Commission (FERC): “The Federal Energy Regulatory
Commission, or FERC, is an independent agency that regulates the interstate
transmission of natural gas, oil, and electricity. FERC also regulates natural gas and
hydropower projects.” For additional information, visit:
http://www.ferc.gov/about/about.asp; or, see FERC’s FY2014-FY2018 Strategic Plan.viii
o FERC’s Internal Market Monitor (IMM) of Independent Systems Operator New
England (ISO-NE) publishes an Annual Markets Report (AMR) that assesses the
state of competition in the wholesale electricity markets operated by the ISO.
The 2009 Annual Markets Report covers the ISO‘s operating year, January 1 to
December 31, 2009. The report addresses the development, operation, and
performance of the wholesale electricity markets administered by the ISO and
presents an assessment of each market based on market data, performance
criteria, and independent studies. Monthly updates are available for subsequent
periods to February 2012.ix
North American Industrial Classification System (NAICS): The U.S. Census Bureau
maintains the North American Industry Classification System (NAICS) codes. For
additional information on the codes, visit http://www.census.gov/eos/www/naics/.
Connecticut Center for Economic Analysis Page 8 of 25 University of Connecticut
“The project” and “CPV’s project” and “the Towantic project” refers to both the
construction and operation of the facility, as well as all associated or related activities.
Regional Economic Model Inc.’s (REMI) model or “the REMI model”: The REMI model is
the primary tool CCEA uses for conducting long-term economic impact analyses. The
REMI model is a multi-sector, dynamic, equilibrium impact model of Connecticut so that
inputs and impacts are specific at the state level. The program measures total economic
changes over time by comparing a baseline forecast (one in which there is no change) to
an alternative scenario or scenarios via changing direct impacts generated by the
company’s project such as generation of direct industry jobs and development of new
capital assets. Because the variables in the REMI system are inter-related, a change in
any one variable affects many others. For example, if wages rise in one sector, the
relative costs of producing a certain output (or outputs) change, and could potentially
cause the producer to substitute capital for labor. The change in the capital-labor ratio
potentially impacts input demands, which affect jobs, wages, migration and other
variables throughout the economy. Such “chain-reactions” propagate across all sectors
in the model over time. For additional information regarding the model, visit:
http://www.remi.com/the-remi-model.
Regional Greenhouse Gas Initiative (RGGI): “RGGI is a cooperative effort among the
states of Connecticut, Delaware, Maine, Maryland, Massachusetts, New Hampshire,
New York, Rhode Island, and Vermont to cap and reduce CO2 emissions from the power
sector.” (http://www.rggi.org/) RGGI states implemented a new 2014 cap of 91 million
short tons. The cap then declines 2.5 percent each year from 2015 to 2020. Regulated
power generation facilities can use a CO2 allowance issued by any participating state to
demonstrate compliance with an individual state program. In this manner, the state
programs, in aggregate, function as a single regional compliance market for CO2
emissions.
U.S. Energy Information Administration (EIA): “The U.S. Energy Information
Administration (EIA) collects, analyzes, and disseminates independent and impartial
energy information to promote sound policymaking, efficient markets, and public
understanding of energy and its interaction with the economy and the environment.”
For additional information, visit: http://www.eia.gov/about/.
BACKGROUND AND SITUATION
In 1999, the Connecticut Siting Council issued a Certificate of Environmental Compatibility and
Public Need approving construction of a 512 MW power generation facility in Oxford.
Construction of the electric generation facility has been in continuous discussion since that
date, owing, in large part, to the bankruptcy of the original developer, Towantic Energy L.L.C.
(Towantic Energy), a subsidiary of Arena Capitol Ltd.
On January 4, 2007, the Connecticut Siting Council re-visited the issue; it resolved that, since
1999, “the stated changed conditions, as outlined in the Council’s hearing notice, alone or
cumulatively, are not sufficient to modify or otherwise reverse the Council’s 1999 final decision
granting the Certificate. The Council will not conduct further proceedings to consider modifying
or reversing its 1999 final decision at this time.”x
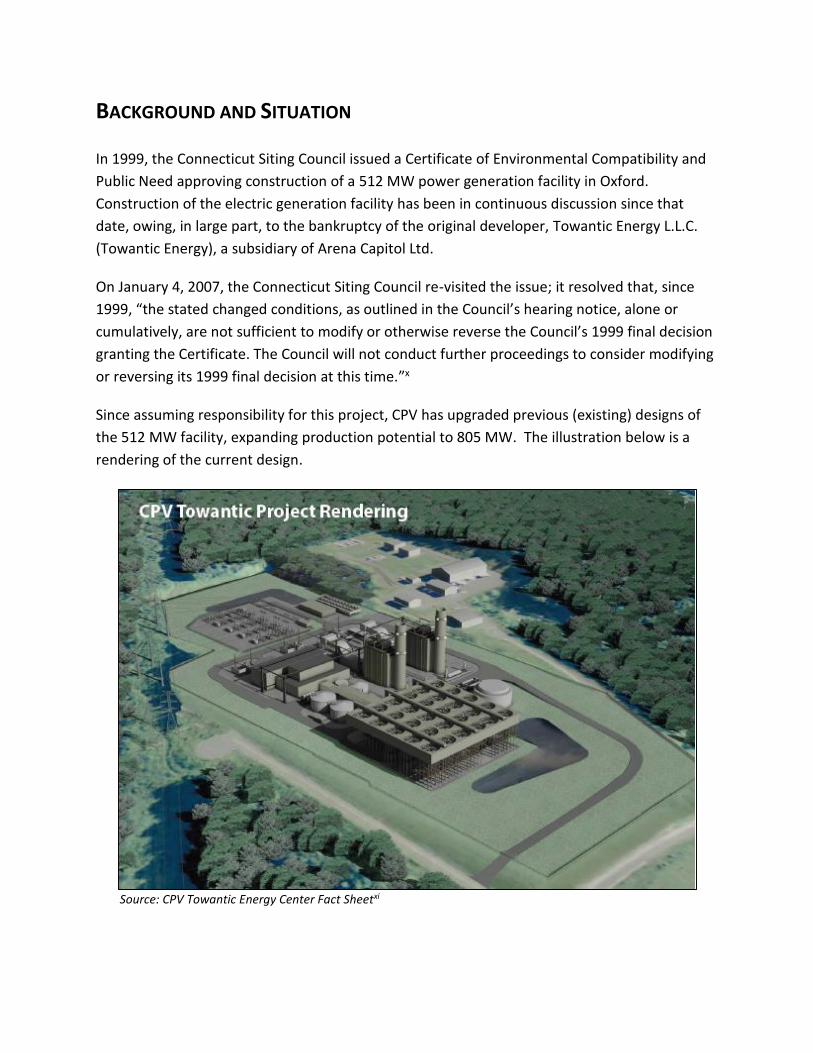
Since assuming responsibility for this project, CPV has upgraded previous (existing) designs of
the 512 MW facility, expanding production potential to 805 MW. The illustration below is a
rendering of the current design.
Source: CPV Towantic Energy Center Fact Sheetxi
Connecticut Center for Economic Analysis Page 10 of 25 University of Connecticut
For CCEA’s analysis, two changes CPV has made to previous plans are especially important:
1) Expanding generating capacity of the facility from 512 MW to 805 MW; and
2) Redesigning the facility to incorporate newer, more efficient technologies, which
generate electricity with significantly lower noise and with fewer emissions per KW than
older (and many existing) facilities.
Because operations of the grid distribution system are beyond CPV’s control, CCEA is unable to
project the potential impact of the enhanced generation capacity on regional retail electricity
markets; they are therefore excluded from this report.1 Yet ISO New England’s 2009 Annual
Market Analysis Report notes, “Connecticut has insufficient reserve capacity to meet the zonal
reserve requirements. Consequently, the Connecticut and (Southwest Connecticut) SWCT
reserve zones have cleared at the price cap of $14.00/kW-month in each reserve auction.”xii In
addition, due to supply constraints, Southeast Massachusetts and Southwest Connecticut had
the highest average day-ahead prices.xiii It is important to be alert to both issues, issues that
provide a critical framework when considering this report’s findings and conclusions.
The expansion of generating capacity– from 512 MW to 805 MW – is important because it
impacts the amount (or quantity) of electricity available in Connecticut. The Towantic facility
will sell power into the grid; that is, it will be a wholesale provider of electricity. As such, CPV’s
ability to set, or control, either where electricity is directed or how much it costs (per kWh)
when it reaches consumers – the retail price – is limited. As a result, this report is neither based
on, nor provides, specific rates beyond those embedded in the REMI model. However, the
presence of a generating facility in Oxford should, ceteris paribus, (i) increase reliability for
consumers (individuals and businesses) located in the immediate area, and (ii) exert downward
pressure on rates (as a consequence of helping to augment the supply of electricity as demand
increases and other smaller antiquated generating facilities within and outside of Connecticut
go off-line).
The availability of affordable, reliable electricity is particularly germane here, because of the
strong relationship between energy and economic performance. While the exact (quantitative)
relationship is a topic of much debate among academics, industrial experts, policy makers, the
general relationship is clear: Reliable, affordable electricity is a necessary condition for
economic growth.xiv
1 These factors have not been included in the calculations for practical reasons (availability and reliability of long-term forecast figures), as well as to help ensure that CCEA’s results are conservative. Making assumptions about future rate moves could upwardly bias our forecasts. It is CCEA’s intention, whenever possible, to assume a conservative posture with regard to calculations, and only comment in the text about additional benefits that could (or, will likely) occur.
Connecticut Center for Economic Analysis Page 11 of 25 University of Connecticut
Based on information provided by CPV, as well as independent research, CCEA understands that
the use of combined-cycle and other advanced technologies – such as new, more efficient
turbines and state-of-the-art emission controls – will result in greater efficiency in generating
electricity, which in turn minimizes emissions of CO2eq and particulates per MWH relative to
generators currently in use, regardless of fuel type.xv
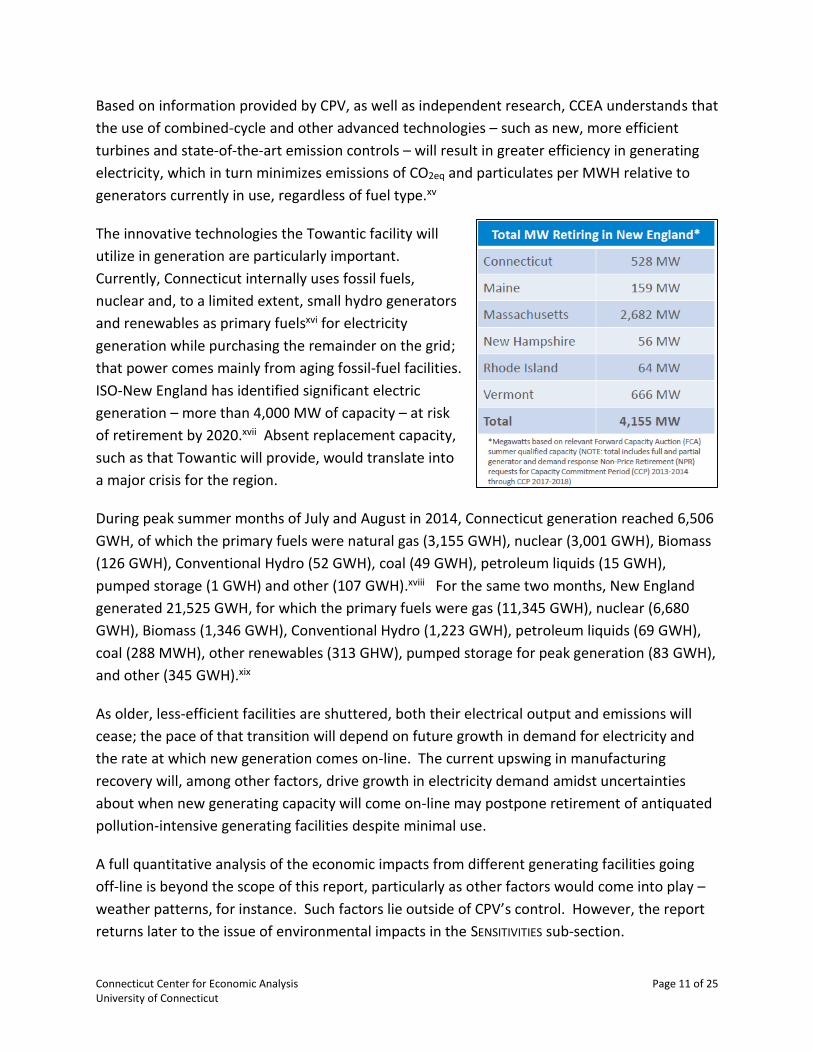
The innovative technologies the Towantic facility will
utilize in generation are particularly important.
Currently, Connecticut internally uses fossil fuels,
nuclear and, to a limited extent, small hydro generators
and renewables as primary fuelsxvi for electricity
generation while purchasing the remainder on the grid;
that power comes mainly from aging fossil-fuel facilities.
ISO-New England has identified significant electric
generation – more than 4,000 MW of capacity – at risk
of retirement by 2020.xvii Absent replacement capacity,
such as that Towantic will provide, would translate into
a major crisis for the region.
During peak summer months of July and August in 2014, Connecticut generation reached 6,506
GWH, of which the primary fuels were natural gas (3,155 GWH), nuclear (3,001 GWH), Biomass
(126 GWH), Conventional Hydro (52 GWH), coal (49 GWH), petroleum liquids (15 GWH),
pumped storage (1 GWH) and other (107 GWH).xviii For the same two months, New England
generated 21,525 GWH, for which the primary fuels were gas (11,345 GWH), nuclear (6,680
GWH), Biomass (1,346 GWH), Conventional Hydro (1,223 GWH), petroleum liquids (69 GWH),
coal (288 MWH), other renewables (313 GHW), pumped storage for peak generation (83 GWH),
and other (345 GWH).xix
As older, less-efficient facilities are shuttered, both their electrical output and emissions will
cease; the pace of that transition will depend on future growth in demand for electricity and
the rate at which new generation comes on-line. The current upswing in manufacturing
recovery will, among other factors, drive growth in electricity demand amidst uncertainties
about when new generating capacity will come on-line may postpone retirement of antiquated
pollution-intensive generating facilities despite minimal use.
A full quantitative analysis of the economic impacts from different generating facilities going
off-line is beyond the scope of this report, particularly as other factors would come into play –
weather patterns, for instance. Such factors lie outside of CPV’s control. However, the report
returns later to the issue of environmental impacts in the SENSITIVITIES sub-section.
Connecticut Center for Economic Analysis Page 12 of 25 University of Connecticut
ECONOMIC IMPACT ANALYSIS
This economic impact analysis assesses differences in key Connecticut economic indicators of
constructing and operating the Towantic facility in the state.
The inputs are for those CPV expects to purchase in Connecticut, not for the totality of the
project. Constraining the impact analysis in this fashion ensures that the Connecticut-based
material inputs for the project are not exaggerated. The process utilizes CCEA’s latest REMI
outlook as the base case which is ‘shocked’ by the construction and operation of the new
facility.
In undertaking this analysis, CCEA has relied on CPV to supply data regarding anticipated
construction expenditures. Such numbers are subject to change as engineering estimates
become more refined. However, CPV completed construction of a similar facility in 2012 and
currently has two more comparable facilities under construction in New Jersey and Maryland.
As such, CCEA has a high degree of confidence in CPV’s estimates for the Towantic project.
Future refinements will most likely have an impact on industry specifics, which could influence
the results presented herein either positively or negatively, depending on the labor and capital
intensity of alternatively impacted industries and their supply-chains within the state. Aside for
any actual quantities of electricity generated, such changes are more apt to influence impacts
during the brief construction period rather than during longer-term operations.
CPV anticipates the Towantic facility will begin operations in 2018. To capture a complete,
comprehensive forecast of the economic impacts the facility will deliver, CCEA calculated the
economic impact of the construction and operations phases independently – results shown
below in the CONSTRUCTION PHASE and OPERATIONS PHASE sub-sections, respectively – and then
analyzed the entire project. CCEA’s findings regarding the impact of the entire project are
presented in the SUMMARY OF FINDINGS sub-section.
Connecticut Center for Economic Analysis Page 13 of 25 University of Connecticut
CONSTRUCTION PHASE
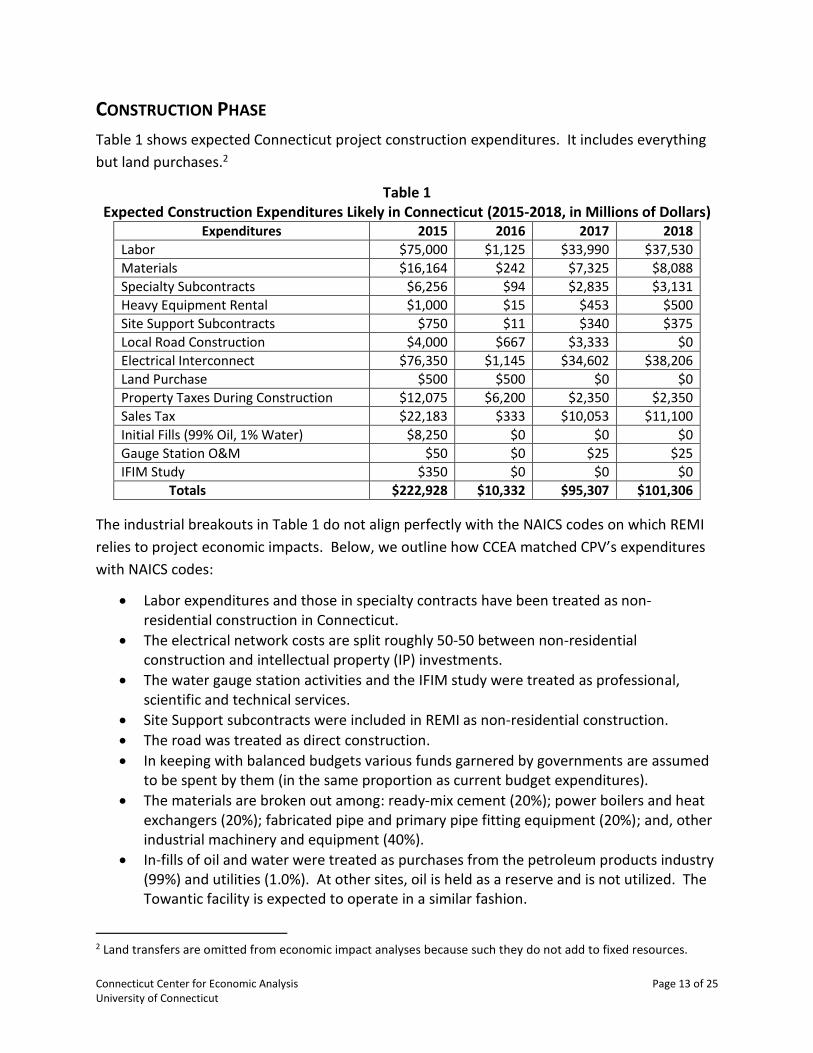
Table 1 shows expected Connecticut project construction expenditures. It includes everything
but land purchases.2
Table 1 Expected Construction Expenditures Likely in Connecticut (2015-2018, in Millions of Dollars)
Expenditures 2015 2016 2017 2018
Labor $75,000 $1,125 $33,990 $37,530
Materials $16,164 $242 $7,325 $8,088
Specialty Subcontracts $6,256 $94 $2,835 $3,131
Heavy Equipment Rental $1,000 $15 $453 $500
Site Support Subcontracts $750 $11 $340 $375
Local Road Construction $4,000 $667 $3,333 $0
Electrical Interconnect $76,350 $1,145 $34,602 $38,206
Land Purchase $500 $500 $0 $0
Property Taxes During Construction $12,075 $6,200 $2,350 $2,350
Sales Tax $22,183 $333 $10,053 $11,100
Initial Fills (99% Oil, 1% Water) $8,250 $0 $0 $0
Gauge Station O&M $50 $0 $25 $25
IFIM Study $350 $0 $0 $0
Totals $222,928 $10,332 $95,307 $101,306
The industrial breakouts in Table 1 do not align perfectly with the NAICS codes on which REMI
relies to project economic impacts. Below, we outline how CCEA matched CPV’s expenditures
with NAICS codes:
Labor expenditures and those in specialty contracts have been treated as non-residential construction in Connecticut.
The electrical network costs are split roughly 50-50 between non-residential construction and intellectual property (IP) investments.
The water gauge station activities and the IFIM study were treated as professional, scientific and technical services.
Site Support subcontracts were included in REMI as non-residential construction.
The road was treated as direct construction.
In keeping with balanced budgets various funds garnered by governments are assumed to be spent by them (in the same proportion as current budget expenditures).
The materials are broken out among: ready-mix cement (20%); power boilers and heat exchangers (20%); fabricated pipe and primary pipe fitting equipment (20%); and, other industrial machinery and equipment (40%).
In-fills of oil and water were treated as purchases from the petroleum products industry (99%) and utilities (1.0%). At other sites, oil is held as a reserve and is not utilized. The Towantic facility is expected to operate in a similar fashion.
2 Land transfers are omitted from economic impact analyses because such they do not add to fixed resources.
Connecticut Center for Economic Analysis Page 14 of 25 University of Connecticut
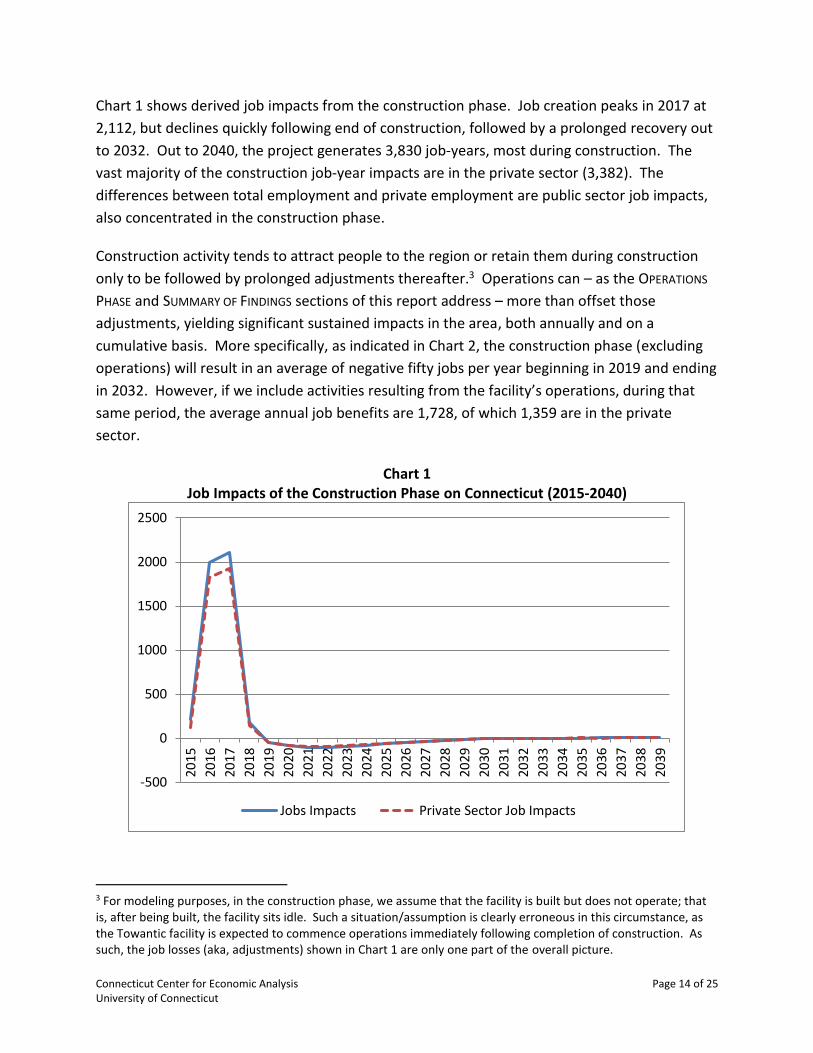
Chart 1 shows derived job impacts from the construction phase. Job creation peaks in 2017 at
2,112, but declines quickly following end of construction, followed by a prolonged recovery out
to 2032. Out to 2040, the project generates 3,830 job-years, most during construction. The
vast majority of the construction job-year impacts are in the private sector (3,382). The
differences between total employment and private employment are public sector job impacts,
also concentrated in the construction phase.
Construction activity tends to attract people to the region or retain them during construction
only to be followed by prolonged adjustments thereafter.3 Operations can – as the OPERATIONS
PHASE and SUMMARY OF FINDINGS sections of this report address – more than offset those
adjustments, yielding significant sustained impacts in the area, both annually and on a
cumulative basis. More specifically, as indicated in Chart 2, the construction phase (excluding
operations) will result in an average of negative fifty jobs per year beginning in 2019 and ending
in 2032. However, if we include activities resulting from the facility’s operations, during that
same period, the average annual job benefits are 1,728, of which 1,359 are in the private
sector.
Chart 1 Job Impacts of the Construction Phase on Connecticut (2015-2040)
3 For modeling purposes, in the construction phase, we assume that the facility is built but does not operate; that is, after being built, the facility sits idle. Such a situation/assumption is clearly erroneous in this circumstance, as the Towantic facility is expected to commence operations immediately following completion of construction. As such, the job losses (aka, adjustments) shown in Chart 1 are only one part of the overall picture.
-500
0
500
1000
1500
2000
2500
2015
2016
2017
2018
2019
2020
2021
202
2
202
3
202
4
202
5
2026
2027
2028
2029
2030
2031
2032
2033
2034
2035
2036
2037
2038
2039
Jobs Impacts Private Sector Job Impacts
Connecticut Center for Economic Analysis Page 15 of 25 University of Connecticut
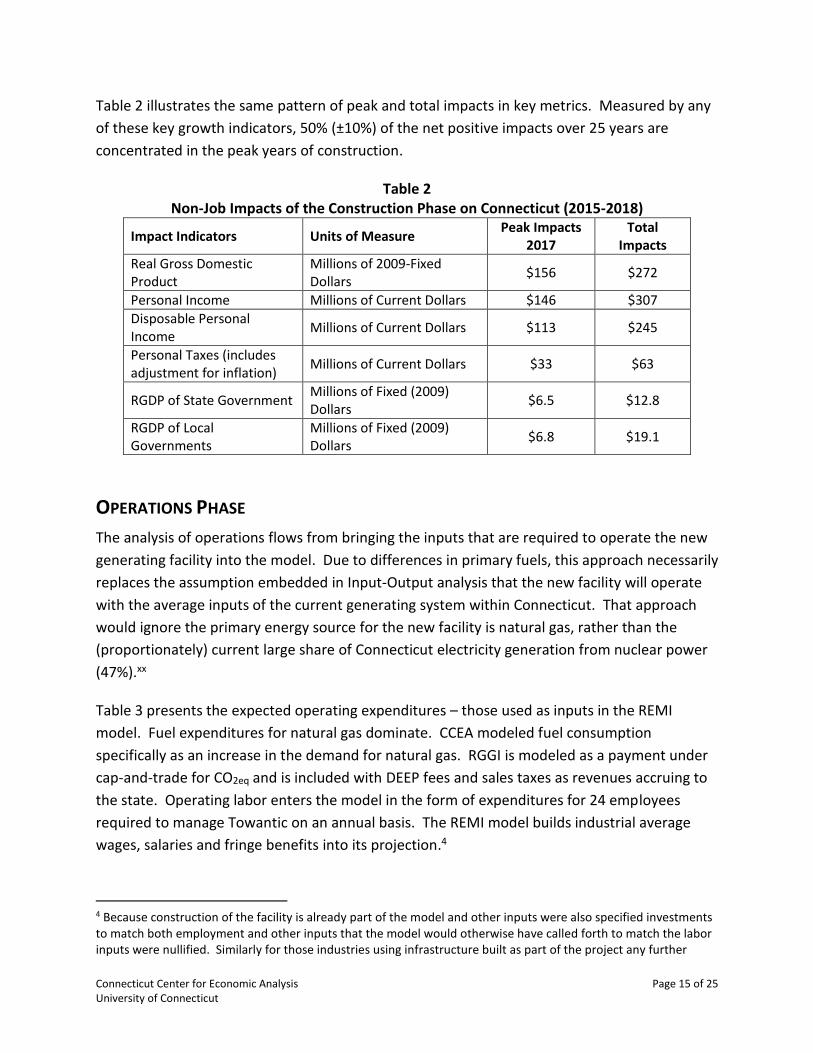
Table 2 illustrates the same pattern of peak and total impacts in key metrics. Measured by any
of these key growth indicators, 50% (±10%) of the net positive impacts over 25 years are
concentrated in the peak years of construction.
Table 2 Non-Job Impacts of the Construction Phase on Connecticut (2015-2018)
Impact Indicators Units of Measure Peak Impacts
2017 Total
Impacts
Real Gross Domestic Product
Millions of 2009-Fixed Dollars
$156 $272
Personal Income Millions of Current Dollars $146 $307
Disposable Personal Income
Millions of Current Dollars $113 $245
Personal Taxes (includes adjustment for inflation)
Millions of Current Dollars $33 $63
RGDP of State Government Millions of Fixed (2009) Dollars
$6.5 $12.8
RGDP of Local Governments
Millions of Fixed (2009) Dollars
$6.8 $19.1
OPERATIONS PHASE
The analysis of operations flows from bringing the inputs that are required to operate the new
generating facility into the model. Due to differences in primary fuels, this approach necessarily
replaces the assumption embedded in Input-Output analysis that the new facility will operate
with the average inputs of the current generating system within Connecticut. That approach
would ignore the primary energy source for the new facility is natural gas, rather than the
(proportionately) current large share of Connecticut electricity generation from nuclear power
(47%).xx
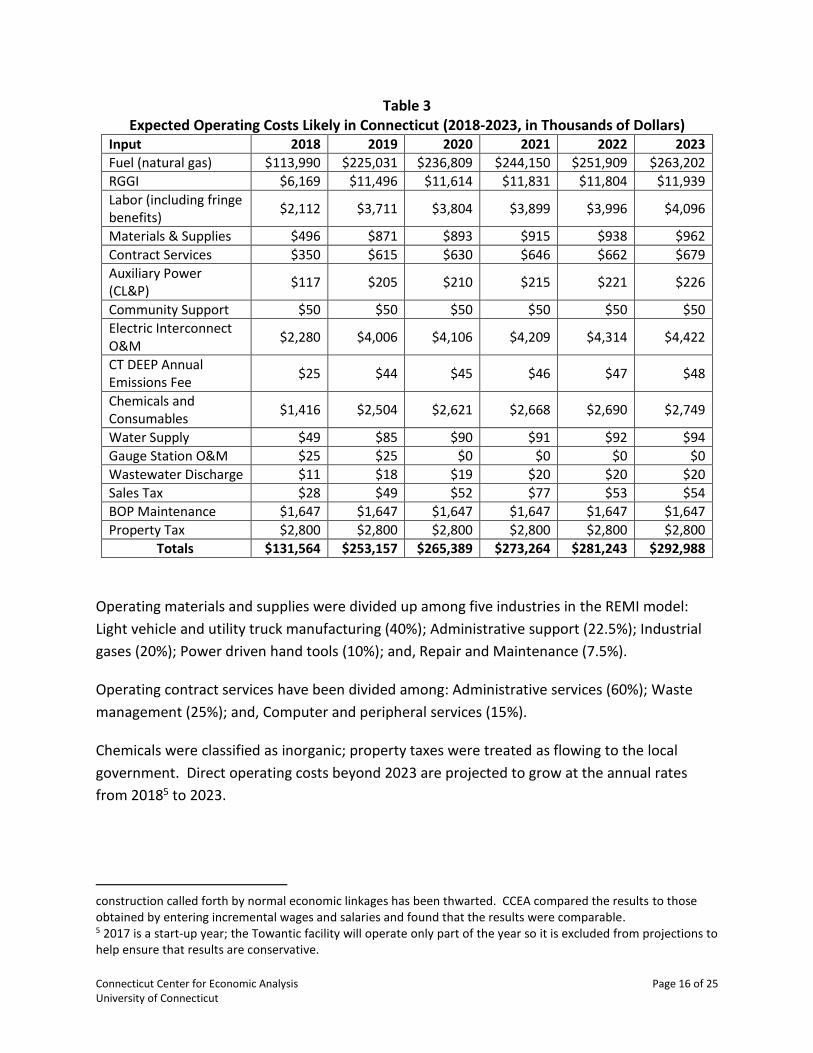
Table 3 presents the expected operating expenditures – those used as inputs in the REMI
model. Fuel expenditures for natural gas dominate. CCEA modeled fuel consumption
specifically as an increase in the demand for natural gas. RGGI is modeled as a payment under
cap-and-trade for CO2eq and is included with DEEP fees and sales taxes as revenues accruing to
the state. Operating labor enters the model in the form of expenditures for 24 employees
required to manage Towantic on an annual basis. The REMI model builds industrial average
wages, salaries and fringe benefits into its projection.4
4 Because construction of the facility is already part of the model and other inputs were also specified investments to match both employment and other inputs that the model would otherwise have called forth to match the labor inputs were nullified. Similarly for those industries using infrastructure built as part of the project any further
Connecticut Center for Economic Analysis Page 16 of 25 University of Connecticut
Table 3 Expected Operating Costs Likely in Connecticut (2018-2023, in Thousands of Dollars)
Input 2018 2019 2020 2021 2022 2023
Fuel (natural gas) $113,990 $225,031 $236,809 $244,150 $251,909 $263,202
RGGI $6,169 $11,496 $11,614 $11,831 $11,804 $11,939
Labor (including fringe benefits)
$2,112 $3,711 $3,804 $3,899 $3,996 $4,096
Materials & Supplies $496 $871 $893 $915 $938 $962
Contract Services $350 $615 $630 $646 $662 $679
Auxiliary Power (CL&P)
$117 $205 $210 $215 $221 $226
Community Support $50 $50 $50 $50 $50 $50
Electric Interconnect O&M
$2,280 $4,006 $4,106 $4,209 $4,314 $4,422
CT DEEP Annual Emissions Fee
$25 $44 $45 $46 $47 $48
Chemicals and Consumables
$1,416 $2,504 $2,621 $2,668 $2,690 $2,749
Water Supply $49 $85 $90 $91 $92 $94
Gauge Station O&M $25 $25 $0 $0 $0 $0
Wastewater Discharge $11 $18 $19 $20 $20 $20
Sales Tax $28 $49 $52 $77 $53 $54
BOP Maintenance $1,647 $1,647 $1,647 $1,647 $1,647 $1,647
Property Tax $2,800 $2,800 $2,800 $2,800 $2,800 $2,800
Totals $131,564 $253,157 $265,389 $273,264 $281,243 $292,988
Operating materials and supplies were divided up among five industries in the REMI model:
Light vehicle and utility truck manufacturing (40%); Administrative support (22.5%); Industrial
gases (20%); Power driven hand tools (10%); and, Repair and Maintenance (7.5%).
Operating contract services have been divided among: Administrative services (60%); Waste
management (25%); and, Computer and peripheral services (15%).
Chemicals were classified as inorganic; property taxes were treated as flowing to the local
government. Direct operating costs beyond 2023 are projected to grow at the annual rates
from 20185 to 2023.
construction called forth by normal economic linkages has been thwarted. CCEA compared the results to those obtained by entering incremental wages and salaries and found that the results were comparable. 5 2017 is a start-up year; the Towantic facility will operate only part of the year so it is excluded from projections to help ensure that results are conservative.
Connecticut Center for Economic Analysis Page 17 of 25 University of Connecticut
SENSITIVITIES
Because operation of the grid, including the generators for which the new facility may operate
as a substitute, and some of the offsets to its RGGI payments and their emissions are beyond
the capabilities of CPV to control, CCEA based its calculations on a scenario in which all
generation displaced by the new facility is currently imported into Connecticut and the plume
from the new facility does not fall outside Connecticut.
CCEA has run a sensitivity case where all the fallout from the new facility dissipates over
Connecticut. The results of that sensitivity case indicate that cumulated job-year impacts
would be reduced by approximately 2% of the estimates shown in the above results.
Should the new facility’s output replace power currently generated in Connecticut from fossil
fuels, the impacts could shrink due to offsetting labor costs and shrinking RGGI payments to the
state government from those alternative generating facilities. Simultaneously the adverse
impacts on amenities from the emissions fallout would be decreased. In the case of relatively
inefficient coal generation, the adverse impacts from emission fallout would extend beyond
savings of CO2eq to impacts of particulate matter linked to health issues. However, as noted
earlier, even during peak operations Connecticut utilized little coal or petroleum generation in
2014, though New England’s operating shares of such facilities were marginally higher.
SUMMARY OF FINDINGS
The combined impacts on jobs of the entire project – both the construction phase and
operations phase –are significant, as Chart 2 reveals.6 The immediate post construction job
losses are soon reversed as annual operating direct, indirect, and induced jobs recover to about
three-quarters of those achieved during peak construction.
6 CCEA’s overall findings are consistent with the analysis Michigan State University developed to evaluate the benefits that would flow to that state’s economy switching generation from coal to gas. See: William Knudsen. (2011). The Economic Impact of Replacing Coal with Natural Gas for Electricity Production, The Strategic Marking Institute, Michigan State University, Working Paper 01-0811.
Connecticut Center for Economic Analysis Page 18 of 25 University of Connecticut
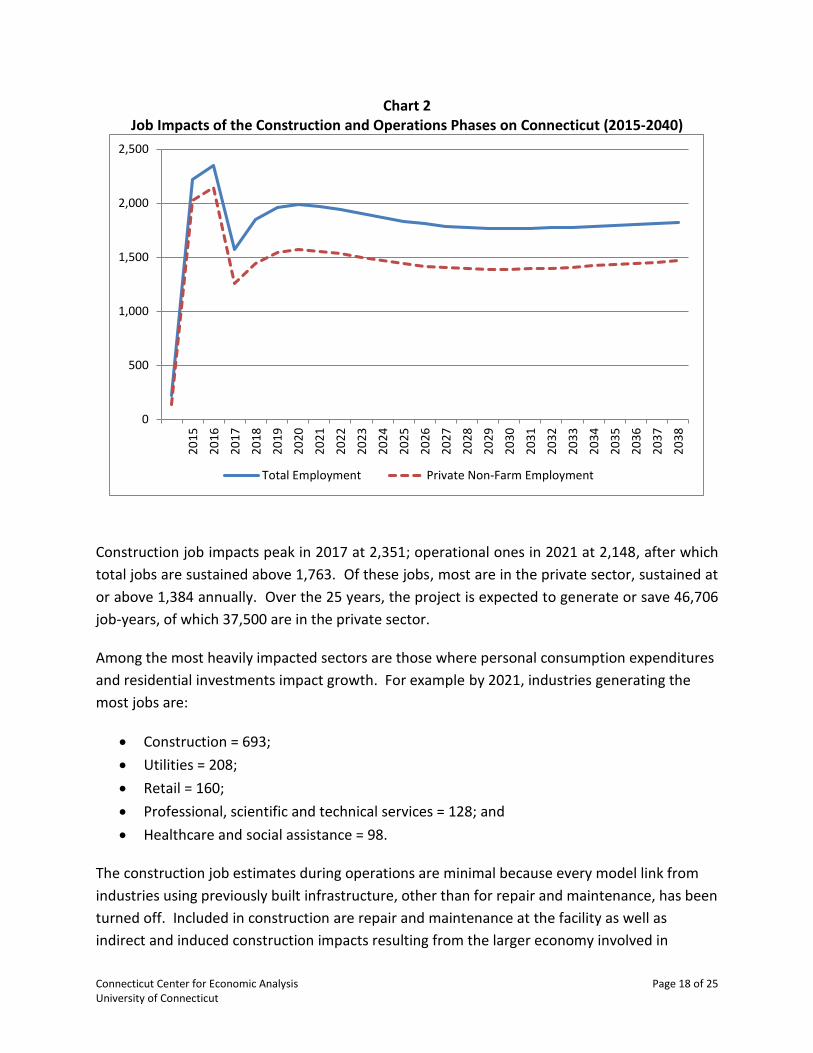
Chart 2 Job Impacts of the Construction and Operations Phases on Connecticut (2015-2040)
Construction job impacts peak in 2017 at 2,351; operational ones in 2021 at 2,148, after which
total jobs are sustained above 1,763. Of these jobs, most are in the private sector, sustained at
or above 1,384 annually. Over the 25 years, the project is expected to generate or save 46,706
job-years, of which 37,500 are in the private sector.
Among the most heavily impacted sectors are those where personal consumption expenditures
and residential investments impact growth. For example by 2021, industries generating the
most jobs are:
Construction = 693;
Utilities = 208;
Retail = 160;
Professional, scientific and technical services = 128; and
Healthcare and social assistance = 98.
The construction job estimates during operations are minimal because every model link from
industries using previously built infrastructure, other than for repair and maintenance, has been
turned off. Included in construction are repair and maintenance at the facility as well as
indirect and induced construction impacts resulting from the larger economy involved in
0
500
1,000
1,500
2,000
2,500
20
15
20
16
20
17
20
18
20
19
20
20
20
21
20
22
20
23
20
24
20
25
20
26
20
27
20
28
20
29
20
30
20
31
20
32
20
33
20
34
20
35
20
36
20
37
20
38
Total Employment Private Non-Farm Employment
Connecticut Center for Economic Analysis Page 19 of 25 University of Connecticut
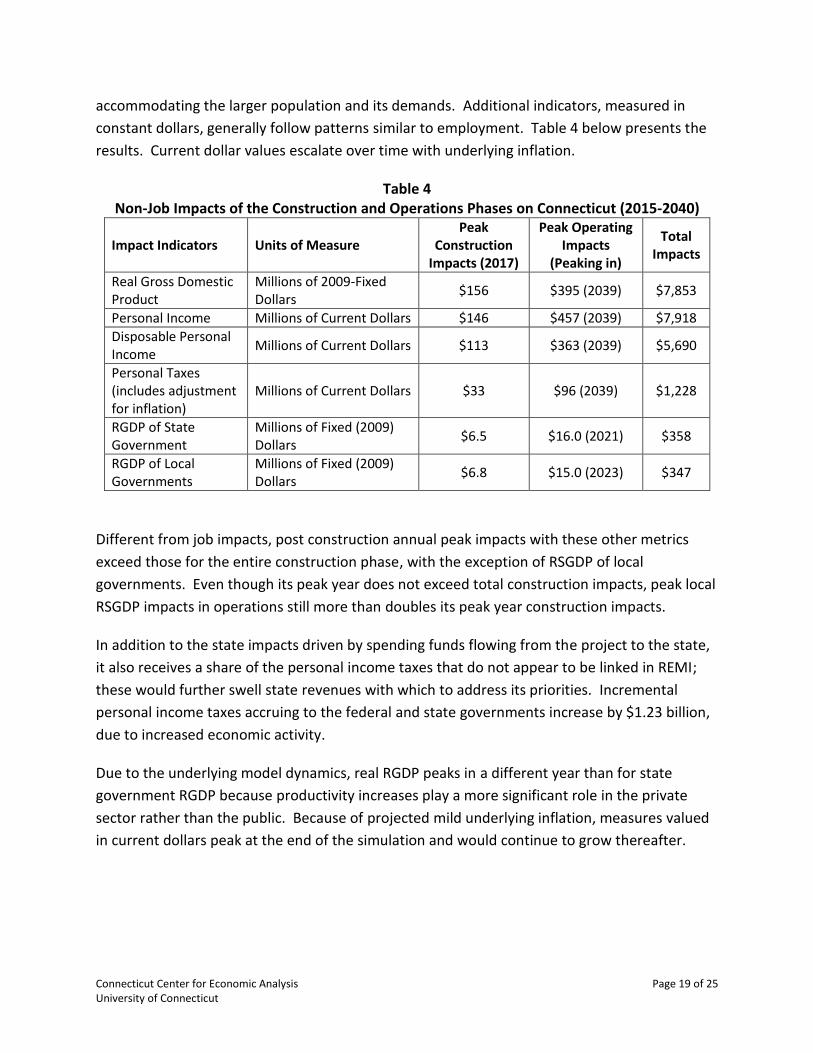
accommodating the larger population and its demands. Additional indicators, measured in
constant dollars, generally follow patterns similar to employment. Table 4 below presents the
results. Current dollar values escalate over time with underlying inflation.
Table 4 Non-Job Impacts of the Construction and Operations Phases on Connecticut (2015-2040)
Impact Indicators Units of Measure Peak
Construction Impacts (2017)
Peak Operating Impacts
(Peaking in)
Total Impacts
Real Gross Domestic Product
Millions of 2009-Fixed Dollars
$156 $395 (2039) $7,853
Personal Income Millions of Current Dollars $146 $457 (2039) $7,918
Disposable Personal Income
Millions of Current Dollars $113 $363 (2039) $5,690
Personal Taxes (includes adjustment for inflation)
Millions of Current Dollars $33 $96 (2039) $1,228
RGDP of State Government
Millions of Fixed (2009) Dollars
$6.5 $16.0 (2021) $358
RGDP of Local Governments
Millions of Fixed (2009) Dollars
$6.8 $15.0 (2023) $347
Different from job impacts, post construction annual peak impacts with these other metrics
exceed those for the entire construction phase, with the exception of RSGDP of local
governments. Even though its peak year does not exceed total construction impacts, peak local
RSGDP impacts in operations still more than doubles its peak year construction impacts.
In addition to the state impacts driven by spending funds flowing from the project to the state,
it also receives a share of the personal income taxes that do not appear to be linked in REMI;
these would further swell state revenues with which to address its priorities. Incremental
personal income taxes accruing to the federal and state governments increase by $1.23 billion,
due to increased economic activity.
Due to the underlying model dynamics, real RGDP peaks in a different year than for state
government RGDP because productivity increases play a more significant role in the private
sector rather than the public. Because of projected mild underlying inflation, measures valued
in current dollars peak at the end of the simulation and would continue to grow thereafter.
Connecticut Center for Economic Analysis Page 20 of 25 University of Connecticut
CONCLUSION
Utilizing state-of-the-art technologies to generate electricity efficiently, the Towantic facility
addresses a pressing need in the State of Connecticut, as well as the entire New England region.
CCEA’s focus in conducting this study was to examine the economic impact that construction
and operation of the Towantic facility will deliver at the state and local levels. As seen in the
results presented in this report, these impacts are not only positive, but also considerable in
terms of the economic benefits to the state and its residents, as well as the communities and
municipalities immediately surrounding Oxford, CT.
Both during construction and operation of the facility, the Connecticut economy and, most
importantly, the households/individuals who live in the state – primarily those who reside in
the immediate area surrounding the facility’s location – will benefit materially. CPV’s project
will lead to:
Job creation – a peak employment in the construction phase of more than 2,300
positions, with sustained jobs approaching 1,800. This is an increase of approximately
0.1% of Connecticut’s total employment during the construction phase and roughly
0.1% increase during the operation phase;
Enhanced state and municipal revenues – by 2040, total income taxes increase by close
to one and a quarter billion dollars (without increasing the tax rate, but simply as the
result of greater personal income for Connecticut’s residents);
Greater reliability and quantity of electricity capacity, which should exert downward
pressure on rates (as a consequence of helping to augment the supply of electricity as
both demand increases and other smaller, antiquated generating facilities within and
outside of Connecticut go off-line); and
Billions of dollars in additional personal income for Connecticut’s residents ($7.92
billion, in current-dollars) and increased RSGDP ($7.85 billion, in 2009-fixed dollars).
In addition to the results presented in this report, the Towantic facility is the type of
infrastructure improvement that Connecticut desperately needs to attract businesses, grow its
workforce, and expand its economy. While these benefits are not included in the quantitative
results presented herein – in part because they are somewhat speculative, and in part to
ensure findings are conservative – such benefits are both real and vital to Connecticut’s
economic vitality and competitiveness.
Connecticut Center for Economic Analysis Page 21 of 25 University of Connecticut
APPENDIX 1 – ABOUT CCEA
The Connecticut Center for Economic Analysis (CCEA) is a University Center located within the
School of Business at the University of Connecticut (UCONN).
CCEA specializes in economic impact and policy analysis studies as well as advising clients
regarding business strategy, market analysis, and related topics. CCEA focuses particular
attention on the economic and business dynamics of Connecticut, for which it maintains a
license to the dynamic REMI model of the state’s economy.
CCEA was created at the request of Governor Weicker in 1992 to serve the state’s citizens by
providing timely and reliable information regarding Connecticut’s economy and to evaluate the
potential impacts of proposed policies and strategic investments. By mobilizing and directing
the expertise available at the UCONN, state agencies, and the private sector, CCEA aims to
equip the public and decision makers with transparent analyses to facilitate systematic,
thoughtful debate of public policy issues.
CCEA has conducted hundreds of studies involving the Connecticut economy, at both the state
and local levels. Copies of its studies and reports that are available to the general public, can be
found at http://ccea.uconn.edu/. For additional information about CCEA, please contact
Professor Fred Carstensen (860.305.8299, [email protected]).
Connecticut Center for Economic Analysis Page 22 of 25 University of Connecticut
APPENDIX 2 – MAPS
Algonquin Compressor
Station
Connecticut Center for Economic Analysis Page 23 of 25 University of Connecticut
Connecticut Center for Economic Analysis Page 24 of 25 University of Connecticut
ENDNOTES
i U.S. Department of Labor, Bureau of Labor Statistics (BLS): “Number of Jobs Held, Labor Market Activity, and
Earnings Growth among the Youngest Baby Boomers: Results from a Longitudinal Study.”
http://www.bls.gov/news.release/pdf/nlsoy.pdf. ii BEA, National Accounts. In assessing impacts dynamically, the difference between personal income and personal
disposable incomes can also be impacted by adjustments to the economy for inflation.
http://www.bea.gov/iTable/iTable.cfm?ReqID=9&step=1#reqid=9&step=3&isuri=1&903=58 iii For additional information on the subject of using discount rates in economic impact analysis studies, see, among
others: Bellinger, W. K. (2007). The Economic Analysis of Public Policy, London and New York. iv The U.S. Department of Commerce, Bureau of Economic Analysis (BEA), updates the National Income and
Product Accounts (NIPA) throughout the year, as well as annually. (In fact, values can be updated for years after
they were originally published.) Since the NIPA figures are used to calculate a variety of metrics, such as GDP,
these revisions can (and frequently do) change values that are used to model economic performance that occurred
in the past (aka, “extant data series”); that is, values can/could be thought of as being “historic.” For additional
information on this topic, see the “Estimate ‘vintages’” section of the BEA’s Primer on GDP and the National
Income and Product Accounts (http://www.bea.gov/national/pdf/nipa_primer.pdf). v Whelan, Karl. (2000). A Guide to the Use of Chain Aggregated NIPA Data, Division of Research and Statistics,
Federal Reserve Board, http://www.federalreserve.gov/pubs/feds/2000/200035/200035pap.pdf.
“A Laspeyres price index is computed by taking the ratio of the total cost of purchasing a specified group of
commodities at current prices to the cost of that same group at base-period prices and multiplying by 100. The
base-period index number is thus 100, and periods with higher price levels have index numbers greater than 100.”
(http://www.britannica.com/EBchecked/topic/331007/Laspeyres-index) vi http://www.bea.gov/ vii http://www.ct.gov/csc/cwp/view.asp?a=962&Q=556110&PM=1 viii http://www.ferc.gov/about/strat-docs/strat-plan.asp ix http://www.ferc.gov/market-oversight/mkt-electric/new-england/isone-archives.asp x http://www.ct.gov/csc/cwp/view.asp?a=958&q=330596 xi http://www.cpvtowantic.com/pdfs/towantic.factsheet_august%202014.pdf xii http://www.iso-ne.com/markets/mktmonmit/rpts/other/amr09_final_051810.pdf xiii Ibid. xiv Many academic studies (as well as industry analyses, and research by other groups) has been done on the
relationship between energy/electricity and economic performance. Below are a very few select references that
address the relationship between economic performance and energy/power availability, cost, and reliability:
Ayres, Robert and Benjamin Warr. (2010). The Economic Growth Engine: How Energy and Work Drive
Material Prosperity, Edward Elgar Publishing, ISBN-13: 978-1849804356.
Carley, Sanya, Sara Lawrence, Adrienne Brown, Andrew Nourafshan, and Elinor Benami. (2011). Energy-
Based Economic Development, Renewable and Sustainable Energy Reviews, Vol. 15, Issue 1, pp. 282-295.
Foster, John. (2014). Energy, Knowledge and Economic Growth, Journal of Evolutionary Economics, Vol.
24, Issue 2, pp. 209-238.
Stiglitz, Joseph. (1974). Growth with Exhaustible Natural Resources: Efficient and Optimal Growth Paths,
The Review of Economic Studies, Vol. 41, Symposium on the Economics of Exhaustible Resources, pp. 123-
137.
Connecticut Center for Economic Analysis Page 25 of 25 University of Connecticut
xv “… the [natural] gas-to-electricity process inherently generates less CO2 per MW than from coal… For example,
the current California Emission Performance Standard sets the limit for CO2 emissions at 500 g kW−1 h−1 of
electricity, equal to that of the average natural gas combined-cycle (NGCC) plant or about half of the amount
produced by coal.” [emphasis added] (Thomas A. Adams II and Paul I. Barton. (2010). High-Efficiency Power
Production from Natural Gas with Carbon Capture, Journal of Power Sources, Vol. 195, Issue 7, pp. 1971-1983.) xvi http://www.eia.gov/state/maps.cfm?v=Electricity xvii “ISO estimates up to 8,300 MW of non-gas-fired generation is ‘at risk’ for retirement by 2020 (28 older oil and
coal units).” http://www.ferc.gov/CalendarFiles/20140610083119-Brandien,%20ISO%20New%20England.pdf. The
chart – “Total MW Retiring in New England” – included in this analysis is taken from FERC paper cited here. xviii http://www.eia.gov/electricity/data/browser/ xix http://www.eia.gov/electricity/data/browser/ xx CASEnergy Coalition (http://casenergy.org/nuclear-basics/energy-in-your-state/connecticut/). Please note: The
earlier generation figures were for peak summer months – specifically, the figures earlier this report, that refer to
the months of July and August in 2014 – whereas the 47% figure is annual.