Embed Size (px)
Citation preview

HAL Id: hal-01291329https://hal.archives-ouvertes.fr/hal-01291329
Submitted on 22 Mar 2016
HAL is a multi-disciplinary open accessarchive for the deposit and dissemination of sci-entific research documents, whether they are pub-lished or not. The documents may come fromteaching and research institutions in France orabroad, or from public or private research centers.
L’archive ouverte pluridisciplinaire HAL, estdestinée au dépôt et à la diffusion de documentsscientifiques de niveau recherche, publiés ou non,émanant des établissements d’enseignement et derecherche français ou étrangers, des laboratoirespublics ou privés.
Economic Growth from a Structural UnobservedComponent Modeling: The Case of Senegal
Samuel Bates, Cheikh Tidiane Ndiaye
To cite this version:Samuel Bates, Cheikh Tidiane Ndiaye. Economic Growth from a Structural Unobserved ComponentModeling: The Case of Senegal. Economics Bulletin, Economics Bulletin, 2014, 34 (2). �hal-01291329�


Economics Bulletin, 2014, Vol. 34 No. 2 pp. 951-965
1. Introduction
The occurrence of shocks on the GDP growth path is a crucial issue particularly inthe case of developing countries for which the external (hence less controllable) sourcesof shocks are not negligible. This issue is widely discussed but still topical in the recentliterature that deals with economic stabilization (Carmignani 2010; Baldini and Ribeiro2008) since low-income countries have a too high degree of dependence vis-à-vis the restof the world. However, macroeconomic stability is a necessary condition for achievingsustainable economic growth. In this context, Senegal, like the other WAEMU countries,does not make an exception. Nevertheless, few studies scrutinize the Senegalese GDP�uctuations except, for instance, Fame and Diop (2007) who limit their study to thepost-80s period from a VAR approach associated with a stochastic general equilibrium.The aim of our paper is to complete the knowledge on the sources of shocks that
have a¤ected the Senegalese GDP growth path since the independence in 1960 by usinganother parametric framework. A structural unobserved component [UC] modeling isimplemented in order to, not only scrutinize the nature of basic shocks coupled with ananalysis of GDP persistence, but also to provide the chronology of economic �uctuationsas well as the evolution in the business cycle properties.Unobserved component modeling gives the opportunity to avoid some drawbacks in-
cluded in some computer-friendly alternatives such as �lters notably. We suggest analgorithm closed to the strategy of Harvey (1989) and Koopman et al. (2009) in orderto always converge toward a convenient compromise among the diversity of acceptablemodels that capture the unobserved time components of GDP.Our estimates give evidence of a smoothed increasing trend for the Senegalese GDP, an
inventory cycle with a time-varying volatility and the occurrence of external shocks thattake the shape of structural (supply) shocks. We relate the extent of external shocks tosome internal factors: dualism (Goldsmith et al. 2004) and low productivity (Echevinyand Mutin 2009), credit rationing to �nance long-term investment and consumption,de�ciencies in the State governance. These domestic shortcomings have strengthened thevulnerability to negative shocks insofar as they contribute to the intensity of externalshocks.Nevertheless, we show that a �resilient" capacity has emerged in Senegal since the 70s
insofar as the potential hysteresis e¤ects are lower and lower through time. This emergingcapacity contribute to the success of stabilizing policy impulsed by international agencylike the IMF in post-80s era. Thus we mitigate the absolute accountability of externalpolicy pressure to the stabilizing process of GDP through time in Senegal. The externalsources of reforms have enhanced an emerging internal capacity of Senegal to outperformthrough time.The remainder of the paper is organized as follows: Section 2 presents the rationale
of our empirical strategy. Section 3 describes the data and details the empirical evidenceon the historical changes observable in the short and long run dynamics of the SenegaleseGDP. Section 4 concludes by providing some policy recommendations related to theongoing current situation.
952

Economics Bulletin, 2014, Vol. 34 No. 2 pp. 951-965
2. Methodology
A statistical analysis is needed to simultaneously distinguish the dynamics of the GDPin the long run from those in the short run and to reveal the nature of shocks that havepredominately impacted the GDP growth course.
2.1 Rationale for the UC modeling
Considering a parametric framework, the UC modeling outperforms the Beveridge-Nelson decomposition (1981) since the �rst reconsiders the perfect correlation betweeninnovations on the trend and innovations on the transitory components that impede toclearly disentangle the contribution of shocks on the long run vs. short run to the wholevariance of a studied series (Harvey 1985, Watson 1986, Nelson 1988, Clark 1989).Also, the UC modeling outperforms commonly used �ltering methods (Hodrick and
Prescott 1997, Christiano and Fitzgerald 2003, for instance). This is particularly truewhen it comes to extract components from series that show a (pseudo) spectrum in which�uctuations at low frequencies are highly in�uential in the whole variance. "When theseries is dominated by low frequencies, the HP and BK �lters provide a distorted cyclicalcomponent. [...] Since most macroeconomic series have the typical Granger shape, theapplication of these mechanical �lters is likely to provide a distorted cyclical component"(Guay and Saint-Amant 1997). In addition, �lters "crudely" specify frequency limits inorder to distinguish the cyclical component from the long-term one. Nothing indicatesthat limits on the frequency of cycles are systematically the same for each economy."Detrending with ad hoc procedure should always be used with care because of the dangerof creating spurious cycles" (Koopman et al. 2009, p. 129).The UC modeling has severaladvantages:� Unit root and stationary analyses of series are no longer crucial. Hence, the biases
induced in the statistical inference by the low power of unit root tests are avoided;� The periods of cycles are precisely estimated;� Shocks that have persistent e¤ects can be distinguished from shocks that have
transitory e¤ects. Concerning the trend, it is possible to determine whether the shocka¤ects the level or the slope of the trend;� Multivariate modeling allows identifying common or similar components among
endogenous series1.
2.2 The empirical strategy
Noting y the Senegalese GDP in logarithmic data, two types of models will be esti-mated.
The �rst one is univariate:
yt = �yt +yt + "yt (1)
1Using a same estimates, it is possible to reveal cointegration due to common trend and to identifycommon or similar cycles. Cycles are de�ned as similar if series share cycles with the same period butwith di¤erent extents and leads/lags among the cycle series. The cycles are common if they are perfectlysynchronous but are not necessarily similar in their extents.
953

Economics Bulletin, 2014, Vol. 34 No. 2 pp. 951-965
where �yt is the trend of yt, yt the cycle. These components may be stochastic or �xed."yt is a white noise. The general form of the trend is decomposed into a level �
ytand a
slope �yt: ��yt�yt
==
�yt�1 + �yt�1 + �yt�yt�1 + �yt
(2)
where �yt s NID(0; �2�y), �yt s NID(0; �2�y).
yt is a higher order cycle component à la Harvey and Trimbur (2003) in order tobetter smooth the cycle from the smoothing parameter j2."
(j)yt
�(j)yt
#= �
y:
�cos��cy�
sin��cy�
� sin��cy�cos��cy� � :" (j)yt�1
�(j)yt�1
#+
"(j�1)yt
�(j�1)yt
#(3)
where � represents a dampening factor, �c is the cycle frequency3, �t =
(0)t , �
�t =
�(0)t
and knowing that:�yt�yt
�= �
y:
�cos��cy�
sin��cy�
� sin��cy�cos��cy� � : � yt�1
�yt�1
�+
��yt��yt
�(4)
with��yt ; �
�yt
�s NID(0; �2�y).
The second model includes the household consumption in logarithm (ct) as an en-dogenous variable from a Structural Seemingly Unrelated Time Series Equations repre-sentation of the univariate modeling:�
ytct
�=
��yt�ct
�+
�ytct
�+
�"yt"ct
�(5)
The general mathematical forms of �ct and ct are identical to the ones in equation2 and equation 3 respectively. The components innovations are such that the associatedvariance/covariance matrices are:
�v =
��vyy �vyc�vcy �vcc
�8 v = ("; �; �; �) and 8t. (6)
�v and v are multivariate normal disturbances which are mutually uncorrelated.
The household consumption is chosen in order to take into account (at least similar)or (at most common) components between two macroeconomic variables (GDP and con-sumption) since the latter has contributed to more than two thirds of the output per yearfor the whole post-colonial period.
Crossing the two models estimated from a Kalman �lter will give a better con�dencein the signi�cance of the shocks as well as in the basic features of the Senegalese GDPgrowth path. Nevertheless, using UC modeling, there may be a huge amount of modelsthat can be selected to explain the GDP course. Fortunately, the algorithm suggested inFigure 1 warrants to always converge toward a model which is a convenient compromiseamong the diversity of acceptable models.
2It is also possible to smooth the slope of the trend.3The period is equal to 1
�c:(2�):
954

Economics Bulletin, 2014, Vol. 34 No. 2 pp. 951-965
Figure 1. Algorithm to converge toward convenient models
Two steps build the algorithm:�Step 1: Starting from a Basic Structural Model4 to end by the basic structure of
UCs.The objective is to obtain the best model as possible without shocks: stochastic vs.
�xed level of the trend, stochastic vs. �xed slope of the trend knowing that a smoothedslope can be useful to better split �uctuations in the short run from the ones in the longrun, a cycle with a speci�c period (or frequency �), regularity captured by the dampeningfactor (�
). At this stage, a good model should: (i) have at least a strong convergence
toward the true observations, (ii) be consistent in the p-values associated with the UCswhen distinguishing a �xed component from an absent one, (iii) provide gain functionsfor each UC the closer as possible to the theoretical ones and (iv) have positive values ofR2s.�Step 2: Introducing the set of signi�cant shocks that impact the GDP course from
intervention variables or dummy variables.The speci�city of our algorithm is to provide this set of interventions while maintaining
unchanged the basic structure of the unobserved components identi�ed in the �rst stepand selecting models that keep unchanged the parameters associated to shocks. Thelist of criteria useful to select the receivable models are: (i) the ones in step 1, (ii)
4A BSM considers a stochastic level and (not higher order) slope of the trend, a stochastic season, anirregular component but no cycle.
955

Economics Bulletin, 2014, Vol. 34 No. 2 pp. 951-965
the normality of innovation residuals or auxiliary residuals5 that are studied from thenormality test statistics of Bowman-Shenton (NBS), (iii) appropriate Cusum and Cusumof square dynamics, (iv) the minimized mean deviation (md) which computes a relativemeasure of errors, (v) the maximized likelihood as well as (vi) the minimized informationcriteria (Akaike, Hannan-Quinn and Schwarz) and of course (vii) parsimony.The algorithm enables to span a huge variety of UC models. Particularly, the iden-
ti�cation of structural components may be improved by adding new variables that mayshare common components with the variable of interest (here, the Senegalese GDP).In case of necessity, it is important to take into account, common components, phaseshifts à la Rünstler (2004) among stochastic components, and idiosynchratic components(Koopman and Azevedo 2008, Chen and Mills 2012).
Once the univariate and multivariate models of reference are selected, one aim is torelate the identi�ed shocks to historical events and agents�behavior, knowing that a shockon the trend (shock on the long run) reveals a structural shock that generally refers to asupply shock whereas a shock on the transitory component of GDP (shock on the shortrun) often induces a demand shock despite hysteresis characteristics may exist in somecases.
3. Data and empirical evidences
3.1 Data
No original quarterly data are available for the Senegalese GDP even for the recentyears. The yearly data are taken from the World Development Indicator bases. In orderto extend the sample alike Doussou (1998), a quarterly interpolation of the available realGDP is made from the method suggested in Goldstein and Khan (1976). Unfortunately,this procedure has the drawback to lose information on both ends of the sample. Thatis the reason why a cubic spline curve is also used. A continuous-time approximation ofquarterly data is then provided from the yearly observations such as the de�nite integralsof the spline over years are constrained to equal the given yearly totals. Both quarterlysamples obtained from the two alternative interpolations are equivalent for the commonnon-missing values that go from 1961 to 2010. A third strategy is the interpolation di-rectly obtained from a UC model of yearly data by considering the quarters as missingvalues. On the Senegalese data, there is no signi�cant di¤erences among three interpola-tion methods (refer to Figure 2 and Table I for proof6). Hence, we are quite con�dent inthe statistical inference that will be implemented on the quarterly data.
5The auxilary residuals are smoothed estimates of the components disturbances that enable to pointout by component information invisible from innovation residuals.
6Results from several tests of equality among means, medians and variances are available upon requestto give additional evidence on the similarity among the three interpolations in the case of Senegal.
956

Economics Bulletin, 2014, Vol. 34 No. 2 pp. 951-965
Table I. Descriptive statistics
Figure 2. GDP measures
3.2 Output of algorithm based on UC modeling
Table II and III report the output of the algorithm useful to study the GDP growth.Figure 3 summarizes the results.
957

Economics Bulletin, 2014, Vol. 34 No. 2 pp. 951-965
Table II. Estimates for the Univariate Models
Table II reports the estimates of two alternative models that have the structure ofequations (1 to 3) considering the presence of some structural shocks. Model 1 containsno exogenous variable whereas model 2 assumes the signi�cance of a dummy variable in1984:1, which value is 1 after 1984:1 and 0 before.
Table III. Estimates for the Bivariate Model
Table III reports the estimates for the two equations in the model (5) and providesadditionally the estimates for structural shocks and the dummy variable in both equa-tions.
958

Economics Bulletin, 2014, Vol. 34 No. 2 pp. 951-965
Figure 3. Unobserved components of the GDP
3.3 Analysis of the GDP trend
Basically, a smooth increasing trend characterizes the growth path of Senegal. TableII and III inform about the several structural shocks that have impacted the GDP course.Two types of shocks on the long run are revealed:
�The positive shocksOn one hand, 1980:1 is the starting period of IMF interventions with an impact on
the level of the trend that extends from 0:44% (univariate model 1) to 0:51% (bivariatemodel). The intervention of international institutions were justi�ed by a slowdown in thegrowth of supply, a de�cit in the current and commercial balances with negative conse-quences on the public �nances and on the debt sustainability. Along the 1980s severalprograms and plans were established. The most important of these are an economic and�nancial recovering plan (1980-1985) and a medium-term structural adjusting program(1985-1993).On the other hand, 1994:2 characterizes the starting quarter of observable impacts of
the CFAF devaluation that occurred in 1994:1. The devaluation has accelerated the speedof growth, which has contributed to an increase in the GDP slope of 0:38% accordingto both univariate models in table II. After a quarter of negative price e¤ect due to thedevaluation, the positive e¤ect of the devaluation is observable insofar as it has beensustained in the subsequent quarters and years by new adjusting policies and economicreforms. All in all, it was about structural adjustment, poverty reduction and growthfacilities. They aimed at stabilizing the main economic aggregates, at rigorously managingpublic �nances and at suppressing the protectionist national policies that threatened tohamper commercial trade.
959

Economics Bulletin, 2014, Vol. 34 No. 2 pp. 951-965
�The negative shocksFirstly, 1968:2 is a crucial date that generated a decrease in the GDP level between
�0:39% (bivariate model in Table III) to�0:48% (model 1 in Table II). This negative sup-ply shock results from the end of trade agreement between France and Senegal concerningthe warranted prices for Senegalese exports.Secondly, the in�uence of the recent international crisis is conspicuous through the
drop in the GDP level after 2008:2 (�0:53% according to Table II). The bivariate estimatein Table III also reveals this shock on the GDP but this is not the case for the devaluationshock. Hence, after the CFAF devaluation, Figure 3 reports a spread between the slopesassociated with the univariate models and the one of the bivariate model. Nevertheless, aslowdowning GDP growth is indisputable in the aftermath of the crisis (Figure 3) acrossthe di¤erent models. The international crisis has impacted the foreign direct privateinvestment in Senegal as well as the �nancial transfers from Senegalese abroad. Tourismreceipts that represent a leading factor in the Senegalese growth after 2000, have alsofallen.
All in all, the shocks basically impact the GDP dynamics in the long run, whichmeans that structural instead of temporary shocks have driven the Senegalese output.Furthermore, in the debate among (i) those considering that external shocks (notably dueto international prices) are determining factors in the growth path (Mendoza 1995, Kose2002, Broda 2004), (ii) those claiming that internal factors are predominant (Ho¤maisterand Roldos 2001, Raddatz 2007) and (iii) those arguing an intermediate stance (Kodoma2006), our results show that there is no doubt about the predominantly external sourceof shocks for Senegal. Nevertheless, these external shocks have an e¤ect with an extentthat surely depends on internal factors.Domestic factors such as the margin behavior of producers and the State governance
that in�uence the �nancial and productive sectors surely increase the incidence of externalshocks on the course of growth. The margin behavior of exporters is involved for thenegative shock in late 60s and in the extent of the positive impact of the 1994 devaluation.In addition, the quality of governance provides resilience to shocks. Unfortunately, a focuson the Worldwide Governance Index (Kaufmann et al. 2010) reveals an indisputable lackof State governance in Senegal. This de�ciency impacts the management of public �nance,which leads to a lack of �nancial lever to stimulate growth and to mitigate adverse externalshocks. Moreover, ine¢ ciency in the decentralization of the state control is conspicuous inthe agricultural sector and in infrastructure (water distribution, regular access to energyand electricity, transportation, and telecommunication networks). Hence, some internalfactors create a rigidity in the production process.Nonetheless, even though there is still a propensity of Senegal to be vulnerable to
negative external shocks like the recent international crisis, things have changed since themid 1980s. The consequences of �nancial and structural reforms, impulsed by interna-tional institutions, result in a positive and permanent breakpoint in the GDP level. Thisis visible by considering the starting period of �nancial process of stabilizing impulsedby the IMF or by referring to the starting period from which the stabilization is con-�rmed (positive impact higher than 0:52% on the GDP level after 1984:1 according tothe parameters of the dummy variable in table II and III).
960

Economics Bulletin, 2014, Vol. 34 No. 2 pp. 951-965
3.4 Analysis of GDP cycle
Focusing on the volatility of the GDP cycle, di¤erent historical states are distinguishedfrom Figure 3.� 1960-1968 is a period of stability with good performance in the farming sector,
especially in the groundnut farming. But 1968:2 is speci�c due to a sudden decreasein nominal price that the groundnut farmers earned (Bonnefond and Couty 1988). Aperiod of growth instability is opened thereafter since no counterbalancing mechanism orsubstitute has emerged.�1968-1984 is a period of instability. Even though no transitory shocks are identi�ed
from the di¤erent models, subsequent droughts a¤ected stocks. Considering Barrios et al.(2010), this is a crucial point for growth in sub-Saharan African countries compared toother developing regions. Besides, the increase in commodity prices exported by Senegalhad no e¤ects on GDP due to the servicing of debt, which absorbs almost all of theincome from exports (Dupuy 1990). As a consequence, the supply growth dropped froma 3% yearly level in 1970-1979 to 1:8% in 1980-1984 while in�ation raised at 8:7%. 1984is the starting year for the output stabilization (decrease in the extent of the output gap).This change mainly results from the e¤ort of stabilization induced by the economic and�nancial recovering plan that lasted several years.�1984-1994 is an intermediate period toward stability. All in all, despite the increase
in primary de�cits connected to the rise in interest rates and in the exchange ratesvolatility, the average growth rate was equal to 2:4% between the 1980s and 1994 dueto drastic measures imposed through the intervention of international agencies (medium-term structural adjusting program).�1994-2008 is a phase of stability. New structural adjusting policies and economic
reforms after the CFAF devaluation led to rigorous management of public �nances anda suppression of protectionism. The average growth rate followed at a 4:4% level andin�ation fell from 32:1% in 1994 to 1:8% in 1997.�2008-now is a phase of uncertain stability. The GDP volatility has been kept up
through the international context of downward growth, which is consistent with the�ndings of Berg et al. (2011). This context partially explains the less e¢ cient taxrevenue and the increasing �scal de�cit.
Beyond the output volatility, our estimates in Tables II and III culminate the debateon the nature and the duration of the economic cycles in developing and developedcountries. For some authors, the duration of economic cycles is similar in developingand industrialized countries (Agenor et al. 2000). In contrast, others show that economiccycles in developing countries are shorter than the cycles in industrialized countries (Randand Tarp 2002). The Senegalese growth cycle lasts as long as an inventory cycle (40months). This cycle period is invariant to the di¤erent models.This cycle characteristic is likely to prevent economic agents (consumers and investors)
from having a long run outlook in their spending behavior. Agents are actively sensitiveto any changes in the current situation even though this is not an event with potential tobecome a structural factor. Consequently, managing in�ation and stabilizing the economyis very challenging and the volatility of the GDP cycle is accentuated in comparison todeveloped countries.
961
Economics Bulletin, 2014, Vol. 34 No. 2 pp. 951-965
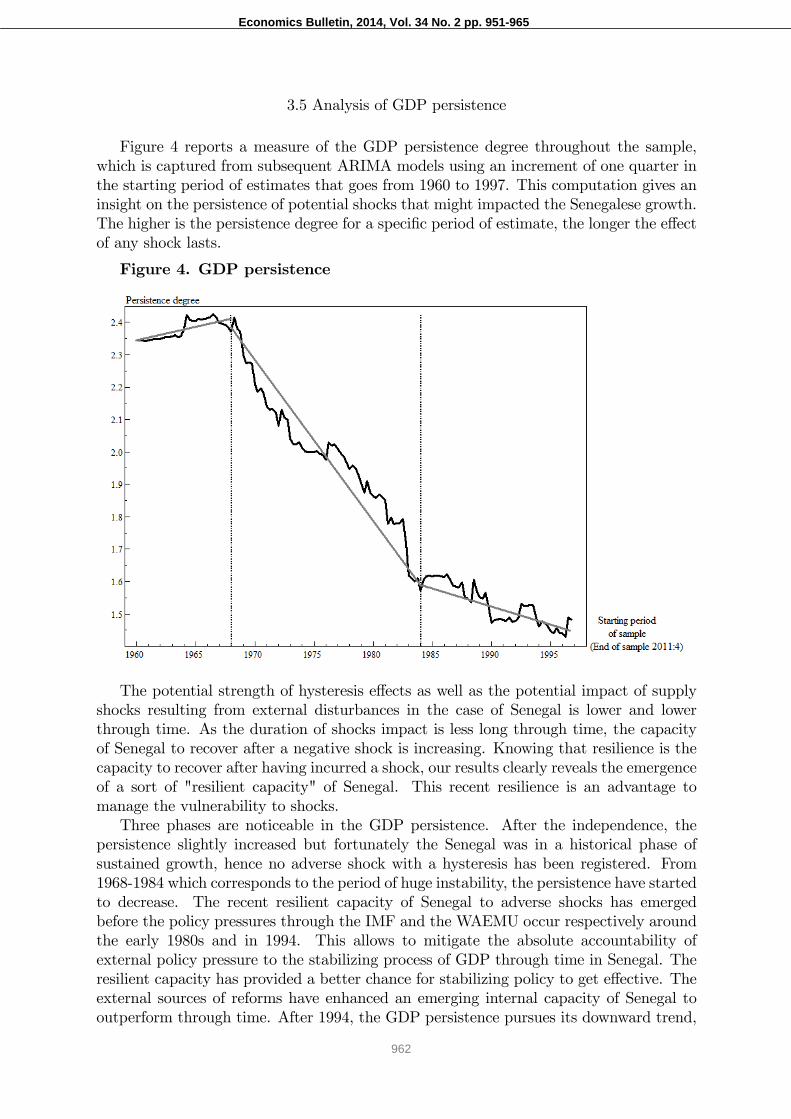
3.5 Analysis of GDP persistence
Figure 4 reports a measure of the GDP persistence degree throughout the sample,which is captured from subsequent ARIMA models using an increment of one quarter inthe starting period of estimates that goes from 1960 to 1997. This computation gives aninsight on the persistence of potential shocks that might impacted the Senegalese growth.The higher is the persistence degree for a speci�c period of estimate, the longer the e¤ectof any shock lasts.
Figure 4. GDP persistence
The potential strength of hysteresis e¤ects as well as the potential impact of supplyshocks resulting from external disturbances in the case of Senegal is lower and lowerthrough time. As the duration of shocks impact is less long through time, the capacityof Senegal to recover after a negative shock is increasing. Knowing that resilience is thecapacity to recover after having incurred a shock, our results clearly reveals the emergenceof a sort of "resilient capacity" of Senegal. This recent resilience is an advantage tomanage the vulnerability to shocks.Three phases are noticeable in the GDP persistence. After the independence, the
persistence slightly increased but fortunately the Senegal was in a historical phase ofsustained growth, hence no adverse shock with a hysteresis has been registered. From1968-1984 which corresponds to the period of huge instability, the persistence have startedto decrease. The recent resilient capacity of Senegal to adverse shocks has emergedbefore the policy pressures through the IMF and the WAEMU occur respectively aroundthe early 1980s and in 1994. This allows to mitigate the absolute accountability ofexternal policy pressure to the stabilizing process of GDP through time in Senegal. Theresilient capacity has provided a better chance for stabilizing policy to get e¤ective. Theexternal sources of reforms have enhanced an emerging internal capacity of Senegal tooutperform through time. After 1994, the GDP persistence pursues its downward trend,
962

Economics Bulletin, 2014, Vol. 34 No. 2 pp. 951-965
which contributes to con�rm the stabilized hence more resilient GDP growth despite itsvulnerability to shocks.
4. Conclusion
The UC modeling helps us to characterize some stylized facts of the cycle in Senegaland to identify the sources of �uctuations that have impacted the GDP course since theindependence year by reasonning on quarterly basis even though only yearly data arereported from institutional sources (Central Bank of West African States, InternationalMonetary Funds). Results show that if the Senegalese growth is more and more stabilizedthanks to a lesser extent of �uctuations and to less persistence, it remains vulnerable toexternal shocks with e¤ect on the long run. This context is not yet appropriate forany optimal projection of economic agents on durable consumption and on productiveinvestment. This is consistent with the GDP cycle of at most 40 months (inventory cycle)and with the margin behaviors of producers.Nevertheless, better results in the post-1984 period and particularly after the deval-
uation in 1994 have provided some hope. After the huge instability from the late 1960sto 1984, some policy interventions initiated from abroad (IMF, World Bank and theWAEMU) have enabled Senegal to gain robustness in its growth path. After two decadesof reforms that have mainly focused on the �nancial sector, it is time to also targetthe de�ciencies in the productive sector (throughout notably the renewing of productiveinfrastructure in the energy and transportation sectors) while pursing e¤ort of State gov-ernance. In addition, more credit facilities dedicated to long-term spending are strategicto gain con�dence in the �nancing of economic activity in the long run. Securing agentssolvency while lessening unequal access to credit are of paramount importance. Suchpolicy orientations agree with the following statement for Sub-Saharan Africa: "whilebanking systems in SSA may grow in tandem with economic growth, their ability to ex-tend credit to households and �rms does not follow suit" (Demestriades and James 2011,p. 265).Despite the somewhat optimistic IMF forecasts (IMF 2012), all in all, the Senegalese
growth should get into a new phase during the following years through structural reformsthat could promote long-term spending in favor of productive investment and consump-tion as well as an increase in the duration of GDP period �turning from a stock cycle toan e¤ective business (Juglar) cycle.Future works will generalize the analysis to the WAEMU in order to identify in�uences
among national GDPs and to make forecasts by using a more complete framework basedon dynamic factors associated with UC modeling (Brauning and Koopman 2013).
References
Agenor, P.R., C.J. McDermott and E.S. Prasad (2000) "Macroeconomic Fluctuationsin Developing Countries: Some Stylized Facts", World Bank Economic Review 14, 251-285.Baldini A. and M. P. Ribeiro, (2008) "Fiscal and Monetary Anchors for Price Stability:
Evidence from Sub-Saharan Africa", IMF Working Paper, WP/08/121.
963

Economics Bulletin, 2014, Vol. 34 No. 2 pp. 951-965
Barrios, S., L. Bertinelli and E. Strobl (2010) "Trends in Rainfall and EconomicGrowth in Africa: A Neglected Cause of the African Growth Tragedy", The Review ofEconomics and Statistics 92, 350�366.Brauning, F. and S.J. Koopman, (2013) "Forecasting Macroeconomic Variables using
Collapsed Dynamic Factor Analysis", International Journal of Forecasting (forthcoming).Berg, A., C. Papageorgiou, C. Pattillo, M. Schindler, N. Spatafora and H. Weisfeld-
Global (2011) "Shocks and their Impact on Low-Income Countries: Lessons from theGlobal Financial Crisis", IMF Working Paper, WP/11/27.Beveridge, S. and C.R. Nelson (1981), "A New Approach to the Decomposition of Eco-
nomic Time Series into Permanent and Transitory Components with Particular Attentionto Measurement of the Business Cycle", Journal of Monetary Economics 7, 151-174.Bonnefond, P. and P. Couty (1988) "Sénégal : passé et avenir d�une crise agricole",
Tiers-Monde 29, 319-340.Broda, C. (2004) "Terms of Trade and Exchange Rate Regimes in Developing Coun-
tries", Journal of International Economics 63, 31-58.Carmignani F., (2010) "Cyclical �scal policy in Africa", Journal of Policy Modeling
32, 254-267.Chen, X., T.C. Mills (2012) "Measuring the Euro area output gap using a multivariate
unobserved components model containing phase shifts", Empirical Economics 43, 671�692.Clark, P.K. (1989) "Trend Reversion in Real Output and Unemployment", Journal
of Econometrics 40, 15-32.Christiano, L.J. and T.J. Fitzgerald (2003) "The Band Pass Filter", International
Economic Review 44, number 2, 435-465.Demetriades P.O. and G.A. James (2011) "Finance and growth in Africa: The broken
link", Economics Letters 113, 263�265.Dossou, A.S.(1998), "Analyse économétrique de la demande de monnaie au Bénin et
au Ghana", Notes d�Information et Statistiques, Banque Centrale des Etats de l�Afriquede l�Ouest, number 479, 1-20.Dupuy, C. (1990) "Les associations villageoises au Sénégal : fonctions économiques et
modalités de �nancement", Tiers-Monde 31, 351-375.Echevin, D. and F. Murtin (2009) "What Determines Productivity in Senegal? Sec-
toral Disparities and the Dual Labour Market", Journal of Development Studies 45,1707-1730.Fame, A. and M.B. Diop (2007) "Sources de Fluctuations Economiques au Sénégal",
Document d�Etude DPEE/DEPE, number 4, 1-55.Goldsmith, P.D., K. Gunjal and B. Ndarishikanye (2004) "Rural-Urban Migration
and Agricultural Productivity: The Case of Senegal", Agricultural Economics 31, 33-45.Goldstein, M. and M.S. Khan (1976) "Large versus Small Prices and the Demand for
Imports", International Monetary Fund Sta¤ Papers 23, 200-225.Guay, A. and P. Saint-Amant (1997) "Do Mechanical Filters Provide a Good Approx-
imation of Business Cycle", Bank of Canada Working Paper, number 53, 1-36.Harvey, A.C. (1985) "Trends and Cycles in Macroeconomic Time Series" Journal of
Business and Economic Statistics 3, 216-227.Harvey, A.C. (1989), Forecasting, Structural Time Series Models and the Kalman
Filter, Cambridge University Press, Cambridge, UK.Harvey, A.C. and T.M. Trimbur (2003) "General Model-Based Filters for Extracting
Cycles and Trends in Economic Time Series", The Review of Economics and Statistics
964

Economics Bulletin, 2014, Vol. 34 No. 2 pp. 951-965
85, 244-255.Hodrick, R.J. and E.C. Prescott (1997) "Postwar U.S. Business Cycles: An Empirical
Investigation", Journal of Money, Credit, and Banking 29, 1-16.Ho¤maister, A.W. and J.E. Roldos (2001) "The Sources of Macroeconomic Fluc-
tuations in Developing Countries: Brazil and Korea", Journal of Macroeconomics 23,213-239.IMF (2012) �Senegal", IMF Country Report 12/337.Kaufmann, D., Kraay, A. and M. Mastruzzi (2010) "The Worldwide Governance
Indicators: A Summary of Methodology, Data and Analytical Issues". World BankPolicy Research Working Paper number 5430.Kodama, M. (2006) "Business Cycles of Non-Mono-Cultural Developing Economies:
The Case of ASEAN Countries", JETRO Discussion Paper, number 52, 1-29.Koopman, S.J., J.V.E. Azevedo (2008) "Measuring Synchronization and Convergence
of Business Cycles for the Euro area, UK and US", Oxford Bulletin of Economics andStatistitics 70, 23-51.Koopman, S.J., N. Shephard, J.A. Doornick and A.C. Harvey (2009b), STAMP 8.2:
Structural Time Series Analyser, Modeller and Predictor, Timberlake Consultants Press,London, UK.Kose, M.A. (2002) "Explaining Business Cycles in Small Open Economies: How Much
Do World Prices Matter?", Journal of International Economics 56, 299-327.Mendoza, E.G. (1995) "The Terms of Trade, the Real Exchange Rate, and Economic
Fluctuations", International Economic Review 36, 101-137.Nelson, C.R. (1988) "Spurious Trend and Cycle in the State Space Decomposition
of Time Series with a Unit Root", Journal of Economic and Dynamics and Control 12,475-488.Raddatz, C. (2007) "Are External Shocks Responsible for the Instability of Output
in Low-Income Countries?" Journal of Development Economics 84, 155-187.Rand, J. and F. Tarp, (2002) "Business Cycles in Developing Countries: Are They
Di¤erent?", World Development 30, 2071-2088.Rünstler, G. (2004) "Modelling phase shifts among stochastic cycles" Econometrics
Journal 7, 232�248.Tahari, A., D. Ghura , B. Akitoby and E. Brou Aka (2004) "Sources of Growth in
Sub-Saharan Africa", International Monetary Fund WP/04/176, 1-30.Watson, M.W. (1986) "Univariate Detrending Methods with Stochastic Trends",
Journal of Monetary Economics 18, 49-75.
965