Embed Size (px)
Citation preview
Ekonomski horizonti, Januar - April 2016, Volumen 18, Sveska 1, 33 - 52 © Ekonomski fakultet Univerziteta u KragujevcuUDC: 33 ISSN: 1450-863 X www. ekfak.kg.ac.rs
Review paperUDC: 338.12.017(597)
doi: 10.5937/ekonhor1601033T
INTRODUCTION
It is well known that economic growth is an important factor determining socio-economic development in developing countries. It is often considered as a prerequisite for improvements in equality, education and the living environment. Thus, achieving high economic growth and maintaining sustainability is the ultimate goal for all policies in developing countries. Why a nation does not obtain as high economic growth as others, or more generally, what are the underlying factors causing diverse economic growth rates among countries, is a question that has great importance in
practice. Unfortunately, defining growth constraints is not a simple task and requires complicated academic techniques with various approaches.
The neo-classical viewpoint of the free market has laid a foundation for the policy thought for recent decades. For example, J. Williamson (1990) summarized the policy standpoint of international institutions such as the IMF and the World Bank in ten pillars. These ten neo-classical pillars were then popularly called the Washington Consensus, which had been adopted as the principles for reforming the policy manifestos for developing countries and gained success to some extent. However, the Washington Consensus soon revealed severe shortcomings. For example, the implementation of the policies and programs based on the Washington Consensus did not succeed as expected in Sub-Saharan Africa’s countries (Rodrik,
ECONOMIC GROW TH CONSTRAINTS IN VIETNAM: A STUDY USING THE GROW TH DIAGNOSTIC APPROACH
Nguyen Duc Thanh and Pham Van Dai*Vietnam Institute for Economic and Policy Research, Hanoi, Vietnam
Recent studies have clearly pointed out a decreasing trend of Vietnam’s economic growth in the short and the medium terms. This paper presents a study applying the growth diagnostic method for Vietnam to determine growth constrains. The binding growth constrains of Vietnam are found to include a poor business environment; an underdeveloped infrastructure, especially the transportation network market; failures related to information externalities, learning externalities and coordination failures. Notably, the energy infrastructure could be a vital constraint in a near future, but is not a binding constraint at present. The inefficiency of financial intermediaries and the government’s over-investment could become a binding constraint when the economy returns to its high growth path.Keywords: Vietnam, economic growth, growth diagnostic, growth policy
JEL Classification: O40, O43,O11, O12
* Correspondence to: Pham Van Dai, Vietnam Institute for Economic and Policy Research, R.707, E4 Building, 144 Xuan Thuy, Cau Giay, Hanoi, Vietnam; e- mail: [email protected]
34 Ekonomski horizonti (2016) 18(1), 33 - 52
2006). According to the focal critique, this method tends to apply the same general principles to all countries without a priority in the action list and with the eyes closed to side effects (Stiglitz, 2003).
Based on the medical concept of diagnostics, R. Hausmann, D. Rodrik and A. Velasco (2005) proposed a new approach to design an appropriate reforming policy in developing countries. The method, popularly called growth diagnostics, aims at identifying growth constraints of an economy by looking at explicit signals. Subsequently, it recommends an economic reforming program focusing on addressing growth constraints by an order of priority.
Since Hausmann et al (2005), the growth diagnostics approach has emerged as a popular framework widely applied in the growth policy studies in developing countries. The World Bank carried out a pilot study applying the growth diagnostics method for 12 economies (including three economies in Asia: Bangladesh, Cambodia and Thailand) in 2005. After that, the Asian Development Bank applied the growth diagnostics to examine economic growth in the Philippines in 2007 and in Indonesia three years later. Recently, the diagnostics approach has been increasingly popular in developing countries and is recognized as an effective tool for macroeconomic and growth analysis. An advantage of the growth diagnostics approach is that it provides a clear road map for analyzing a developing economy based on its own characteristics. Thus, a growth diagnostics study can make use of various data sources from different fields, which are often ignored by the traditional econometric approach.
This paper presents a growth diagnostics study for Viet Nam. Although the growth diagnostics method is widely used throughout the world and has also been applied in the neighboring countries, as far as we know, it has not been applied to Viet Nam and this study should be the very first one. The diagnostics method should be expanded and developed in further researches, not only within the scope of economic growth, but also in other fields, such as poverty reduction, climate change prevention and the educational reform.
The remainder of this paper consists of three sections. Section 2 introduces the growth diagnostics
methodology used in this study. Section 3 applies the methodology in the context of Viet Nam. Section 4 provides the concluding remarks.
GROWTH DIAGNOSTIC FRAMEWORK
The Hausmann-Rodrik-Velasco model
The essential idea underlying the growth diagnostics approach is that there are different constraints, beside common weaknesses such as a poor infrastructure, the low-skilled labor and poor resources, affecting economic growth in a particular economy. Therefore, a well-designed policy should focus on a certain set of constraints instead of trying to solve all the problems simultaneously by limited resources (Hausmann, Klinger & Wagner, 2008).
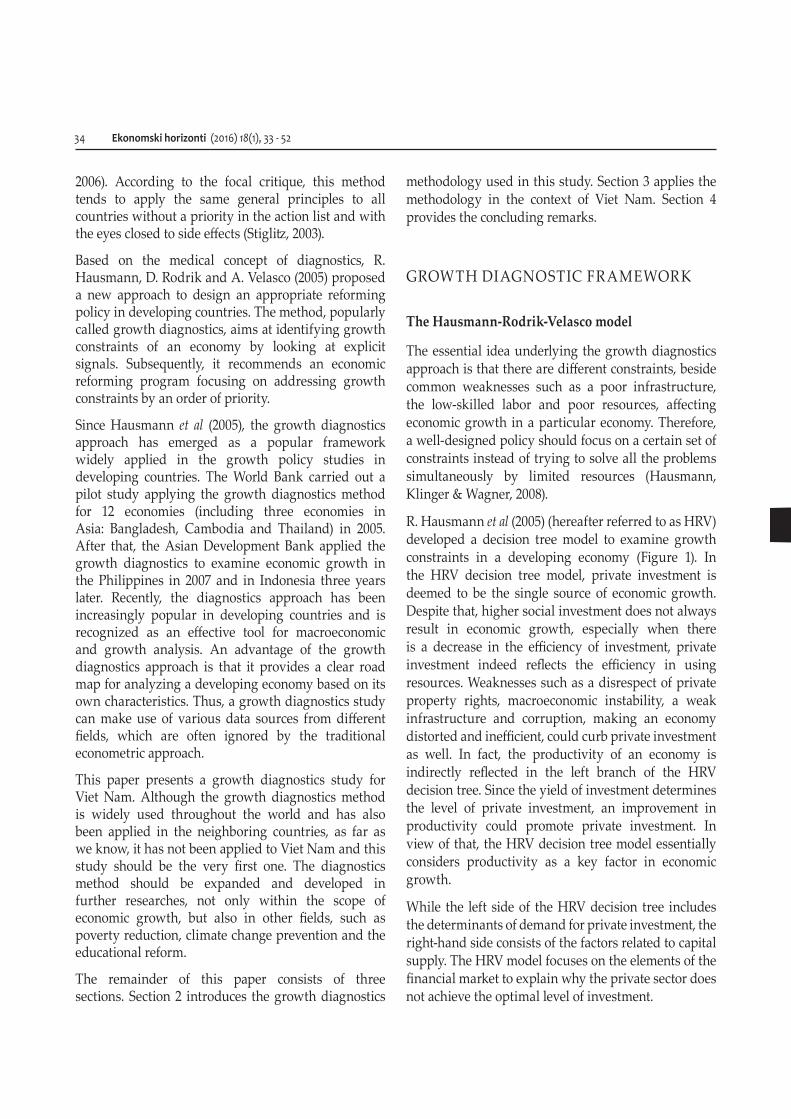
R. Hausmann et al (2005) (hereafter referred to as HRV) developed a decision tree model to examine growth constraints in a developing economy (Figure 1). In the HRV decision tree model, private investment is deemed to be the single source of economic growth. Despite that, higher social investment does not always result in economic growth, especially when there is a decrease in the efficiency of investment, private investment indeed reflects the efficiency in using resources. Weaknesses such as a disrespect of private property rights, macroeconomic instability, a weak infrastructure and corruption, making an economy distorted and inefficient, could curb private investment as well. In fact, the productivity of an economy is indirectly reflected in the left branch of the HRV decision tree. Since the yield of investment determines the level of private investment, an improvement in productivity could promote private investment. In view of that, the HRV decision tree model essentially considers productivity as a key factor in economic growth.
While the left side of the HRV decision tree includes the determinants of demand for private investment, the right-hand side consists of the factors related to capital supply. The HRV model focuses on the elements of the financial market to explain why the private sector does not achieve the optimal level of investment.
Nguyen Duc Thanh and Pham Van Dai, Economic growth constraints in vietnam: A study using the growth diagnostic approach 35
The first step in a diagnostics growth study is to remove unnecessary constraints from the bottom of the decision tree. However, the removal process might mislead people in accepting inaccurate constraints due to a lack of data. R. Hausmann et al (2008) proposed the principles to determine growth constraints using the HRV decision tree.
Diagnostic principles
R. Hausmann et al (2008) offers four fundamental principles for diagnosing growth constraints of an economy:
First, the shadow price of a growth constraint should be relatively high. As analyzed by R. Hausmann et al (2005), the shadow price can represent the tightness of a constraint. The shadow price is defined as a change in the objective function generated by a one-unit increase in the input. Therefore, a higher shadow
price is an indicator of the extent to which removing a constraint influences economic growth. In reality, the shadow price cannot often be directly observed, and is likely to be represented by the market price signals or the gaps between supply and demand.
Secondly, a shift in a constraint should result in a large shift in the objective function (which is private investment in this case). For example, if capital supply is a binding constraint, then an increase in capital accessibility should lead to a significant decrease in the interest rate and a large increase in private investment.
Third, there should be pieces of evidence that economic entities attempt to overcome a binding constraint by themselves. This argument is based on the assumption about the rational expectation of the private sector. Economic entities in the private sector are assumed to be fully aware of the constraints hindering them and to actively respond in different ways.
Figure 1 The growth diagnostic tree
Source: Hausmann, Rodrik & Velasco, 2005

36 Ekonomski horizonti (2016) 18(1), 33 - 52
Fourth, economic entities which have advantages in terms of a binding constraint end up with thriving and overwhelming their competitors. This principle can be applied in two ways. An analyst may determine which sectors of an economy are performing well or are in trouble, and then seek for constraints with respect to which the well-performing sectors are less intense than their counterparts are. Alternately, he/she can begin with a constraint list and identify the sectors in which
this constraint is less intense. Finally, the performance of these sectors is compared to their counterparts to determine the tightness of the constraint.
R. Hausmann et al (2008) summarized the diagnostics testing list in a testing matrix (hereafter referred to as the HKW) (Table 1). In particular, the columns represent the constraints, and the rows describe the phenomena. However, it is noted that the set of the
Table 1 The HKW testing matrix
Binding Finance Binding social returns
Low average savings
Bad finance A lack of complementary factors
Low appropriability Coordination problem
Human capital The infrastructure and public goods
Government failure Market failureEx ante Ex post Low R&D,
Low self-discovery
Ex ante risks Tax Low property rights, crime, corruption
A high lending interest rate A low lending interest rateA low net cash flow from banks A high net cash flow from banksInvestment elastic to the interest rate
A lack of an investment response to the interest rate change
Access to external finance A low infrastructure wrt comparable countries
High static markups and low entry, in industries with entry costs
Monopoly power, high markups, a regulated entry
Expropriation Low sophistication and few new industries
Short loan duration, credit rationing
Inward migration of high skills
Shocks to the infrastructure (a hurricane, a war)
Political risk, social risk
Social unrest Growth responds to new industries
A high deposit interest rate
A high spread High returns to education
Tax policy risk High taxes, top marginal tax rate, corporate tax, VAT
Open conflict Few products „nearby” to move (open forest low)
A negative relation between growth and the current account
If risk is high , profits are low
Pro-cyclical Mincerian returns
Growth elastic to the infrastructure change
Labor market risks
Restrictive labor regulations
Corruption (an illegal tax rate)
Monopoly powers: a high P/E ratio of banks
Returns decrease as education grows
High losses in transport (ICA)
A high expectation of losing future profits
The cost of doing business High returns to coordination activities
Source: Hausmann et al, 2008

Nguyen Duc Thanh and Pham Van Dai, Economic growth constraints in vietnam: A study using the growth diagnostic approach 37
rows and the columns can be flexible. Other tests may be added to or removed from the diagnostics-testing matrix. Some tests in the matrix help us choose between the branches of the decision tree, whereas others simply check the accuracy of hypotheses.
GROWTH DIAGNOSTIC IN VIETNAM
Economic growth in Vietnam: Spotlights
A number of studies have shown a decreasing trend of economic growth, and short- and medium-term challenges recently arising in Vietnam’s economy (Dai & Thanh, 2012; Ohno & Thanh, 2015; Son & Chuong, 2011; Tho, 2013). N. N. Son and P. H. Chuong (2011) concluded that although Viet Nam had achieved a relatively high rate of growth over the period 2001-2010, compared to other neighboring countries and the world economy, the economic growth had largely attributed to the accumulation of the input factors. The low quality of economic growth is reflected in the low efficiency in using resources, the unstable structure of economic growth, and the low national competitive capability.
T. Tho (2013) suggested that Thailand and Malaysia had fallen into the middle-income trap because they had failed to raise their international competitiveness when approaching the upper middle-income level. Vietnam, meanwhile, might have fallen into the trap when it just reached the lower middle-income level. According to T. Tho (2013), the risks facing Vietnam include failures in developing the market factors and reforming the state enterprise, the poor quality of the policy formulation and overwhelming competition from China. H. Ohno and L. H. Thanh (2015) had a similar viewpoint and pointed out the four challenges of Viet Nam’s economy: slowing growth, asset bubbles, the exchange rate overvaluation and low competitiveness.
P. V. Dai and N. D. Thanh (2012) showed a downward trend in the productivity growth of Viet Nam’s economy. More importantly, the trend shows a tendency to speed up and goes against the common trend of the neighboring countries. They also pointed
out that, without substantial economic reforms, the average growth rate could stand merely around 4.8-6.2%/year over the period 2012-2015, indeed is far below the previous periods (Figure 2) (Figure 3).
Financial constraints
The importance of financial constraints
This growth diagnostics analysis follows the HRV decision tree model and goes from the top line. The capital shortage is a common issue in developing countries. According to the HKW testing matrix, the most obvious symptom of the capital shortage is a high interest rate. It can be observed that Vietnam and Indonesia have the highest lending interest rates in the developing East Asian region (Figure 4). Especially over the period from 2010 up to now, the nominal lending interest rate has continued to increase in Vietnam, which goes against the overall trend in the region. Nevertheless, after taking into account the inflation factor adjustment, the real interest rate in Vietnam is not very high, compared to the neighboring countries (Figure 5). Thus, it reveals that inflation is the main factor leading to the high lending interest rate in Vietnam.
Figure 2 The average economic growth rate, 1985-2012 (%)
Source: The General Statistics Office of Vietnam and the World Bank Database

38 Ekonomski horizonti (2016) 18(1), 33 - 52
Moreover, recent studies have observed a remarkable improvement in the cash flow of Vietnamese commercial banks in recent years. Specifically, the commercial banks had been faced with serious
liquidity threats until the end of 2011. Inflation was then brought under control by the government’s package of tightening policies. Liquidity turned into a surplus, which can be evident by a decline in the interbank interest rate. Therefore, it concludes that the growth constraint might have shifted from the capital supply to the demand side.
The third test in the HKW matrix aims to determine the elasticity of the private investment level to the interest rate. When private investment is highly elastic to the interest rate, the growth constraint is likely to be on the supply side. By contrast, if the constraint is on the demand side, a change in the interest rate has a minor influence on the level of investment. The situation of Viet Nam’s economy is that the credit growth rate remains low in spite of the low interest rate. This supports the conclusion about the shift of growth constraints toward investment demand.
Notably, although weaknesses belonging to the supply side are not currently a growth constraint as the economy is in its downturn, they are rather likely to become a binding growth constraint in the next recovery phases. This assumption is supported by the test on access to credit, terms of a loan, and the risk aversion of banks. Vietnamese enterprises are mostly
Note: The disparity between the growth rates of a developing country and the US is captured at the year when its per capita GDP as the percentage of the US per capita GDP is at the same ratio as the one of Vietnam in 2012
Figure 3 The disparity between a country’s economic growth rate and the U.S.
Source: Authors, based on: The World Bank Database
Figure 4 The nominal lending rate, 2005-2012 (%)
Source: The IMF Database
Nguyen Duc Thanh and Pham Van Dai, Economic growth constraints in vietnam: A study using the growth diagnostic approach 39
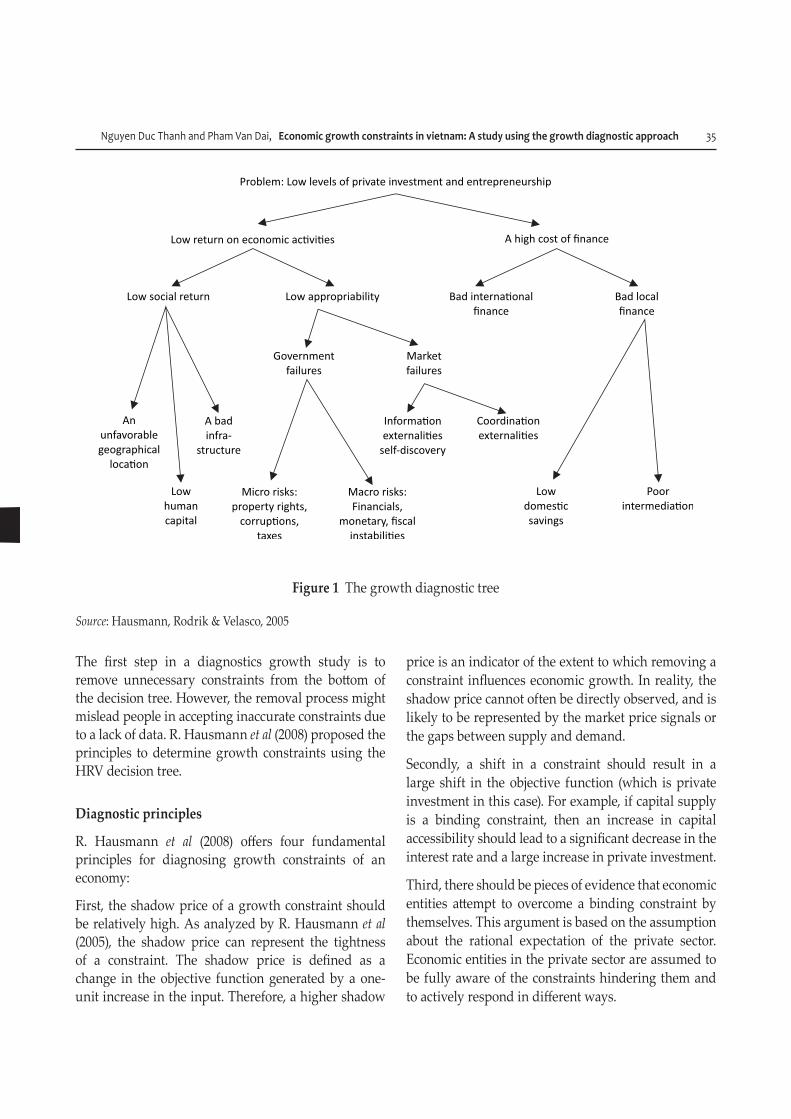
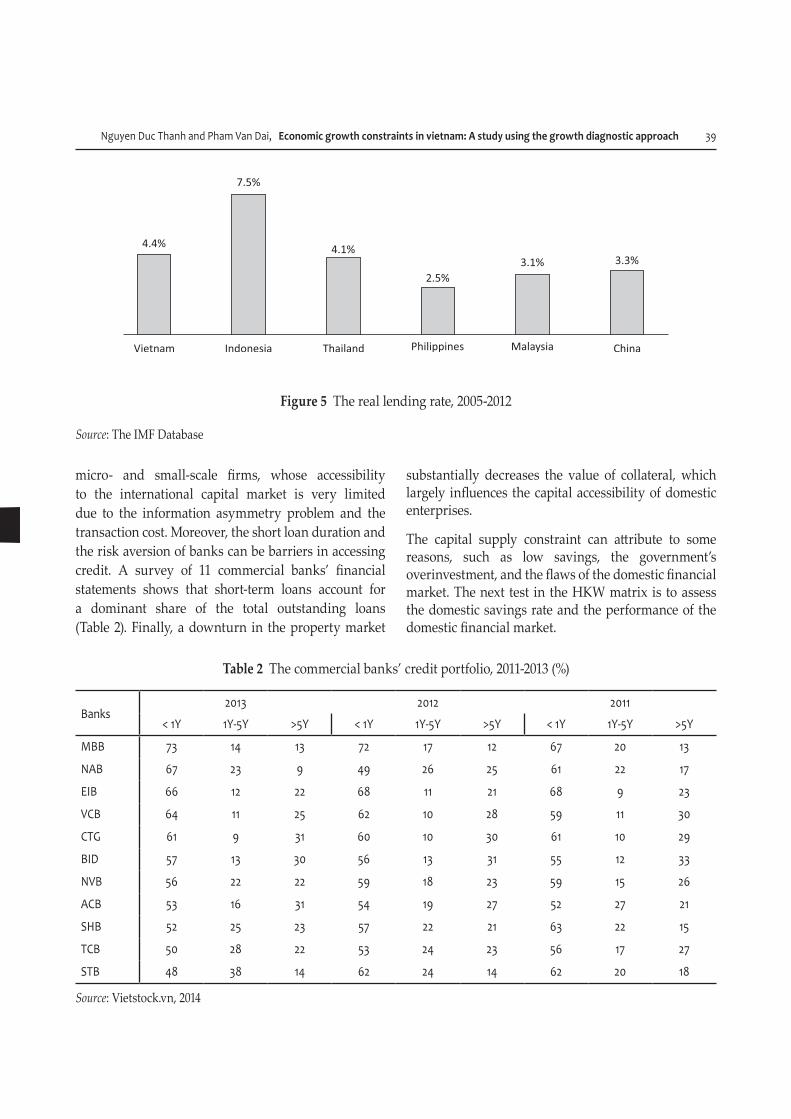
micro- and small-scale firms, whose accessibility to the international capital market is very limited due to the information asymmetry problem and the transaction cost. Moreover, the short loan duration and the risk aversion of banks can be barriers in accessing credit. A survey of 11 commercial banks’ financial statements shows that short-term loans account for a dominant share of the total outstanding loans (Table 2). Finally, a downturn in the property market
substantially decreases the value of collateral, which largely influences the capital accessibility of domestic enterprises.
The capital supply constraint can attribute to some reasons, such as low savings, the government’s overinvestment, and the flaws of the domestic financial market. The next test in the HKW matrix is to assess the domestic savings rate and the performance of the domestic financial market.
Figure 5 The real lending rate, 2005-2012
Source: The IMF Database
Table 2 The commercial banks’ credit portfolio, 2011-2013 (%)
Banks2013 2012 2011
< 1Y 1Y-5Y >5Y < 1Y 1Y-5Y >5Y < 1Y 1Y-5Y >5Y
MBB 73 14 13 72 17 12 67 20 13
NAB 67 23 9 49 26 25 61 22 17
EIB 66 12 22 68 11 21 68 9 23
VCB 64 11 25 62 10 28 59 11 30
CTG 61 9 31 60 10 30 61 10 29
BID 57 13 30 56 13 31 55 12 33
NVB 56 22 22 59 18 23 59 15 26
ACB 53 16 31 54 19 27 52 27 21
SHB 52 25 23 57 22 21 63 22 15
TCB 50 28 22 53 24 23 56 17 27
STB 48 38 14 62 24 14 62 20 18
Source: Vietstock.vn, 2014
40 Ekonomski horizonti (2016) 18(1), 33 - 52
The rate of the savings and public investment
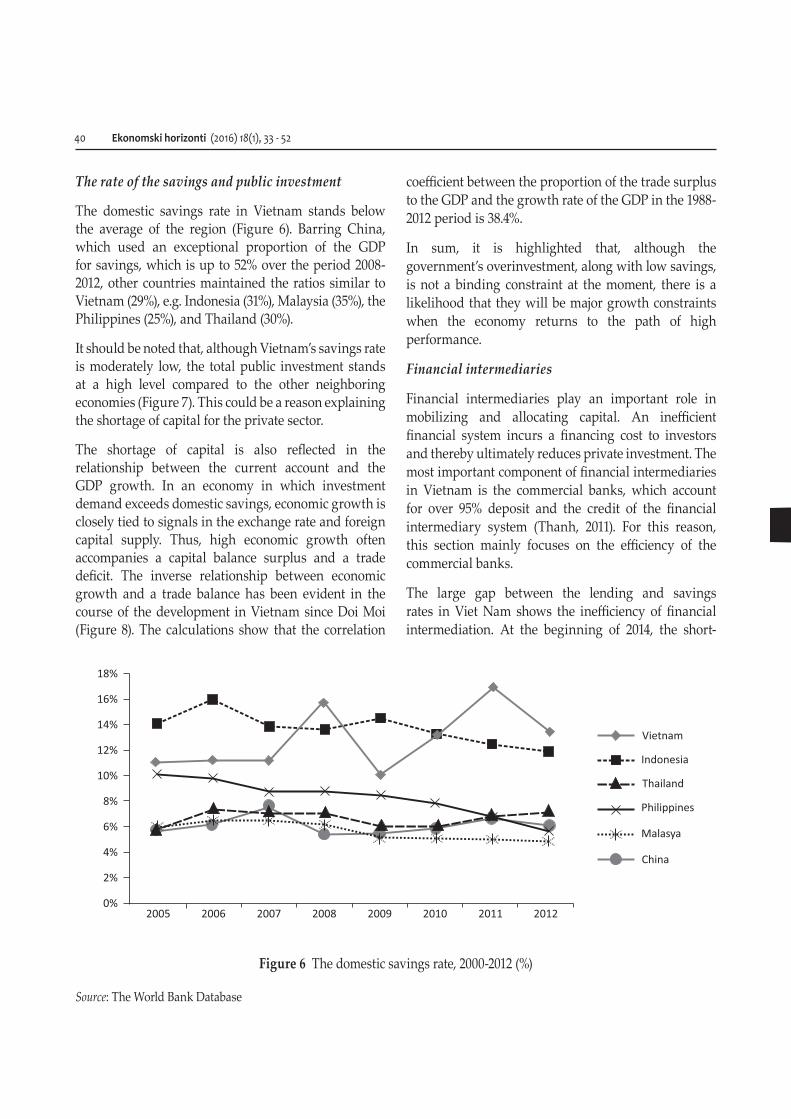
The domestic savings rate in Vietnam stands below the average of the region (Figure 6). Barring China, which used an exceptional proportion of the GDP for savings, which is up to 52% over the period 2008-2012, other countries maintained the ratios similar to Vietnam (29%), e.g. Indonesia (31%), Malaysia (35%), the Philippines (25%), and Thailand (30%).
It should be noted that, although Vietnam’s savings rate is moderately low, the total public investment stands at a high level compared to the other neighboring economies (Figure 7). This could be a reason explaining the shortage of capital for the private sector.
The shortage of capital is also reflected in the relationship between the current account and the GDP growth. In an economy in which investment demand exceeds domestic savings, economic growth is closely tied to signals in the exchange rate and foreign capital supply. Thus, high economic growth often accompanies a capital balance surplus and a trade deficit. The inverse relationship between economic growth and a trade balance has been evident in the course of the development in Vietnam since Doi Moi (Figure 8). The calculations show that the correlation
coefficient between the proportion of the trade surplus to the GDP and the growth rate of the GDP in the 1988-2012 period is 38.4%.
In sum, it is highlighted that, although the government’s overinvestment, along with low savings, is not a binding constraint at the moment, there is a likelihood that they will be major growth constraints when the economy returns to the path of high performance.
Financial intermediaries
Financial intermediaries play an important role in mobilizing and allocating capital. An inefficient financial system incurs a financing cost to investors and thereby ultimately reduces private investment. The most important component of financial intermediaries in Vietnam is the commercial banks, which account for over 95% deposit and the credit of the financial intermediary system (Thanh, 2011). For this reason, this section mainly focuses on the efficiency of the commercial banks.
The large gap between the lending and savings rates in Viet Nam shows the inefficiency of financial intermediation. At the beginning of 2014, the short-
Figure 6 The domestic savings rate, 2000-2012 (%)
Source: The World Bank Database

Nguyen Duc Thanh and Pham Van Dai, Economic growth constraints in vietnam: A study using the growth diagnostic approach 41
term lending rate was ranging from 10% to 11%, while the short-term deposit rate was around 6% (VID Group, 2014). The gap of 4-5% was among the highest in the region (Figure 9).
A large gap between the lending and savings rates often results from two sources; that banks do not
operate efficiently or that the structure of the banking industry enables banks to make a monopoly profit. In a study on Viet Nam’s banking sector, S. Delpachitra and P. V. Dai (2015) showed that the banking sector demonstrated the characteristics of monopolistic competition with a low concentration of the market compared to other economies. For example, the market shares in terms of the total assets held by the three largest commercial banks in Viet Nam was 35% at the end of 2011, compared to 46% in India, 44% in Indonesia, 54% in Malaysia, 49% in the Philippines, and 54% in Thailand.
Moreover, R. Hausmann et al (2008) proposed that the price-earnings (P/E) ratio of banks can serve as a good indicator of monopoly. A high P/E ratio reflects the profitability of a bank and hence tends to be related to monopolistic advantages. According to the Viet Capital Securities (2014), the average P/E ratio of the listed commercial banks is 11.7, which is lower than that of the other industries such as retail (13.6), tourism and entertainment (26.7), insurance (18.0), etc. This demonstrates that the monopolistic power of the commercial bank is not high. Therefore, the constraint
Figure 7 The ratio of public investment to the total social investment, 2008-2013 (%)
Source: The General Statistics Office of Vietnam and the World Bank Database
Figure 8 Economic growth and the trade deficit, 1988-2012
Source: The World Bank Database

42 Ekonomski horizonti (2016) 18(1), 33 - 52
on the capital supply side largely concerned the operational inefficiency of the commercial banks.
The profitability constraint
Based on the symptoms reported above, including the low real interest rate, the excess liquidity in the commercial banks, and the inelastic demand of private investment, it is likely that the expected yield of private investment will be a binding constraint to economic growth. According to the HRV decision tree model, the yield of private investment is conditional on the social return rate and the appropriability of private investors.
Society wealth: Social wealth is defined as the total benefit generated by an investment for the society as a whole. Since private investors capture a certain proportion of the total social benefit, a private investment yield largely depends on the social return rate.
According to the HRV matrix, the social return rate attributes to the two factors: human resources, and the infrastructure and other public goods, which are essential for the implementation of a private investment. A deficiency of those factors would have a negative effect on productivity and would decrease the social return of an investment. The social investment level, measured in terms of percentages of the GDP, is high in Vietnam, despite the fact that it is among the lowest income countries in the region (Figure 10).
The labor force: Vietnam is facing redundancy in the labor force, especially the low-skilled labor. The fact is that Vietnam has never been under the pressure of a shortage of the labor force, not even in the period 1990-2009, when the economy grew at a remarkable annual rate of 2.1 percent. Conversely, in general, labor appears to be redundant, which can be reflected in the fact that around 70 percent of the labor force works in the rural area. In a study on the demographics in Vietnam, N. T. Minh (2009) found that the share of the labor force in the total population would continue to rise in the current period and reach the peak of 70 percent in 2018. Thus, it is clear that, in terms of quantity, human resources are not a binding growth constraint in Vietnam’s economy.
Although Vietnam’s economy is not as developed as the one of its neighboring countries, its labor force has the same level as other ASEAN countries do. The percentage of the labor force completing primary education or higher education accounted for 92 percent, which is even higher than in Indonesia (91 percent), Malaysia (90 percent), and Thailand (91 percent) and just lower than in the Philippines (97 percent). Notably, the proportion of the labor force completing secondary and higher education is lower than in the neighboring countries (Figure 11). However, the lack of the high-skilled labor is not a binding constraint at the current development stage of Vietnam’s economy.
Firstly, the immigration of highly skilled labor is unpopular and there are only a small number of highly qualified foreign employees working mostly in
Figure 9 The interest rate gap
Source: The IMF Database

Nguyen Duc Thanh and Pham Van Dai, Economic growth constraints in vietnam: A study using the growth diagnostic approach 43
managerial positions. Secondly, the return of higher education tends to decrease over time, which can be observed from the downward trend of the income of fresh graduates and their difficulties in finding jobs. According to the Ministry of Labor; Invalids and Social Affairs (2014), 21.2% of young people aged 20-24 with a bachelor’s or higher degree were unemployed. This partially reveals the structural incompatibility between
the quality of the labor force and the development level of the economy. Since Vietnam’s economy is in the early stage of the industrialization process, its economic growth largely relies on the light industries and FDI enterprises. This implies that the majority of demand in the labor market is for skilled and low-cost workers, rather than highly qualified labor. Thus, the development of highly qualified human resources
Figure 10 Average social investment, 2005-2012 (% GDP)
Source: The World Bank Database
Figure 11 The quality of the labor force
Source: The World Bank Database

44 Ekonomski horizonti (2016) 18(1), 33 - 52
should be closely linked to the development a strategy of specific industries in order to ensure the efficiency of social investment.
The infrastructure: The quality of the transportation infrastructure is one of the key factors affecting investment decisions. Despite the rapid development over the last two decades, Vietnam’s transportation infrastructure has many weaknesses. For example, the World Economic Forum (2014) ranked the quality of the transportation infrastructures of 148 countries and reported that Vietnam was ranked in the 82nd position. Comparing to the other countries in the region, Vietnam’s position is only higher than the one of the Philippines (96th), and much lower than Indonesia’s (61st), Malaysia’s (29th), Thailand’s (47th) and China’s (48th) (Figure 12).
The VCCI (2013) showed that the transportation infrastructure is the first and foremost element to be considered in selecting an investment destination. There are as many as 85% of foreign investors in the survey selecting provinces with the best infrastructures to locate their business in. The positive impact of the improvement made in the transportation infrastructure on economic growth can be illustrated by the development gap between regions with good transportation infrastructures, the Red River Delta and the southeast provinces, and the regions with poor transportation infrastructures, the Highlands and the
North-west. Notably, besides the role in promoting economic growth, investment in the transportation infrastructure has a positive spillover effect. For example, N. V. Cuong (2011) showed that improving roads in rural areas helps increase the number of the working hours by rural employees.
The binding of an infrastructure constraint is well reflected in the profitability of construction, operation and transportation (BOT) projects. The Ministry of Transport (2014) reported that the total non-budgetary funds being invested in the infrastructure had reached 117,000 billion VND, with 48 projects at the end of 2013.
Along with the transportation infrastructure, the energy infrastructure is a prerequisite for an investment decision of production. However, the energy infrastructure is not a short-term constraint. In a study on the relationship between economic growth and energy consumption in Vietnam, P. T. Binh (2011) indicated a unilateral causal relationship between economic growth and energy consumption. However, since energy supply tends to be inelastic to price in the medium and long terms, whereas energy demands keep increasing, energy is likely to become a major constraint of economic growth in Vietnam. For example, P. Smith (2014) shows that, although Viet Nam is still able to meet power needs, it will have a difficulty in finding new energy sources with a reasonable cost in the future.
Figure 12 The index of the competitiveness of the infrastructure
Source: The World Bank Database
Nguyen Duc Thanh and Pham Van Dai, Economic growth constraints in vietnam: A study using the growth diagnostic approach 45
Initial investment recovery
Private investors always consider the possibility of recovering the investment cost before making any investment decision. This ability is seriously affected by the government’s failures and market vulnerabilities. The HRV decision tree model classifies the government’s failures into macro- and micro-elements. In particular, the macroeconomic risks stemmed from the instability of the fiscal and the monetary policies, whereas the micro-risks were rooted in corruption, the property right protection, and the tax policy. The HKV matrix divides the risks by the nature of their effect on investment activities as well as by the time of their occurrences (before or after investment decisions).
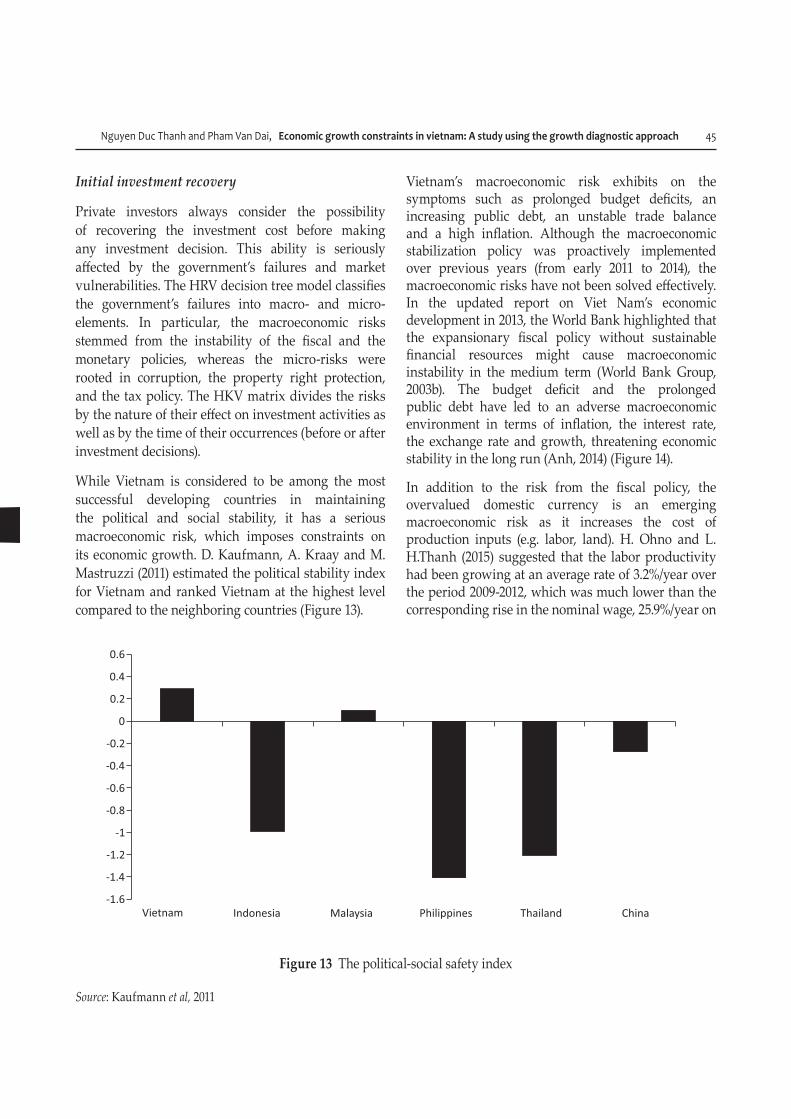
While Vietnam is considered to be among the most successful developing countries in maintaining the political and social stability, it has a serious macroeconomic risk, which imposes constraints on its economic growth. D. Kaufmann, A. Kraay and M. Mastruzzi (2011) estimated the political stability index for Vietnam and ranked Vietnam at the highest level compared to the neighboring countries (Figure 13).
Vietnam’s macroeconomic risk exhibits on the symptoms such as prolonged budget deficits, an increasing public debt, an unstable trade balance and a high inflation. Although the macroeconomic stabilization policy was proactively implemented over previous years (from early 2011 to 2014), the macroeconomic risks have not been solved effectively. In the updated report on Viet Nam’s economic development in 2013, the World Bank highlighted that the expansionary fiscal policy without sustainable financial resources might cause macroeconomic instability in the medium term (World Bank Group, 2003b). The budget deficit and the prolonged public debt have led to an adverse macroeconomic environment in terms of inflation, the interest rate, the exchange rate and growth, threatening economic stability in the long run (Anh, 2014) (Figure 14).
In addition to the risk from the fiscal policy, the overvalued domestic currency is an emerging macroeconomic risk as it increases the cost of production inputs (e.g. labor, land). H. Ohno and L. H.Thanh (2015) suggested that the labor productivity had been growing at an average rate of 3.2%/year over the period 2009-2012, which was much lower than the corresponding rise in the nominal wage, 25.9%/year on
Figure 13 The political-social safety index
Source: Kaufmann et al, 2011

46 Ekonomski horizonti (2016) 18(1), 33 - 52
average. After taking into account the inflation rate of 5.5%/year on average, the real wage indeed increased rapidly.
The Viet Nam labor market is highly flexible compared to other countries in the region (Table 3). In the reports on national competitive capacity, the World Economic Forum (2014) ranked the effectiveness of Vietnam’s labor market the 56th, which is higher than Thailand’s (62nd), the Philippines’ (100th) and Indonesia’s (103rd), but yet lower than China’s (34th) and Malaysia’s (25th). Particularly, Viet Nam’s labor market is highly appreciated regarding the relationship between the cost and productivity, being ranked the 15th in the global rankings. Thus, risk in the labor market is not a likely constraint affecting the possibility of having an investment recovered.
A constraint on the implementation of an investment
The tax policy is not an obstacle for economic growth. Under the new rule, recently enacted1, the corporate income tax rate decreases from 25% to 22% and, especially, a number of small businesses only bear
the tax rate of 20%. The value-added tax rate is 10% or less, depending on different commodities, which is relatively moderate compared to other developing countries (see the World Bank Group (2013a)). In Figure 15, it could be seen that the ratio of taxes to profit in Vietnam is competitive in the region.
Property right violation and crime are a binding constraint on the economic growth in Vietnam despite the fact that they do not cause any serious social instability. These issues add the operational cost for business. For example, allow us to consider a recent case that happened in the factory of Sam Sung Co., Ltd in Bacninh province. The workers in the factory stole and sold electronic circuits, whose total value was USD 40,0002. More interestingly, the binding of this constraint can be reflected in the development of private security companies and asset protection services.
Corruption in Vietnam is severe and stands for a critical growth constraint. According to VCCI (2013), there are only 34.2 percent of FDI firms considering corruption in Vietnam to be less severe than in the countries they
Figure 14 The fiscal deficit, 2003-2013 (% of GDP)
Source: IMF Database

Nguyen Duc Thanh and Pham Van Dai, Economic growth constraints in vietnam: A study using the growth diagnostic approach 47
have investigated. D. Kaufmann et al (2011) constructed an indicator to evaluate the effectiveness of corruption control and ranked Vietnam at the highest level of corruption in the region (Figure 16). The negative effect of corruption on the economic growth in Vietnam
Property right violation, criminals along with corruption are the major barriers in doing business in Vietnam. The World Bank Group (2013a) ranked the
convenience in doing business in Vietnam in the 99th position, which is higher than Indonesia (128th) and the Philippines (138th), but still lower than Malaysia (12th), Thailand (18th) and China (91st) (Table 4).
The market failures: Regarding the market failures, the HRV model presents three groups of factors affecting investors’ ability to recover investment costs. The first is the information externalities that a new product or technology benefits a third party, e.g. competitors, other than the seller and the buyer. The second is the risks associated with learning externalities that workers trained by an investor switch to work for competitors or other sectors. The third is the weak linkages between upstream and downstream industries that could obstruct the development of the private sector.
The impact of the market failures on the economic growth in Vietnam can be demonstrated in the performance of the export sector. Exports mostly consist of low value-added goods such as semi-processed and raw materials. This reveals the limitations in the self-development ability of domestic enterprises. Viettrade (2013) reported that both the agricultural and the industrial sectors’ exported goods are of low value-added. Agricultural export products
Table 3 The efficiency of the labor market
Vietnam Indonesia Malaysia the Philippines
Thailand China
Augmented index 56 103 25 100 62 34
Cooperation in labor-employer relations 64 49 19 34 37 60
The flexibility of the wage determination 69 106 33 109 111 94
Hiring and firing practices 81 39 26 117 31 28
Redundancy costs, weeks of salary 111 141 110 124 135 120
The effect of taxation on incentives to work 99 27 10 40 44 42
The effect of taxation on incentives to work 15 29 2 44 31 17
Reliance on professional management 119 34 21 32 57 44
The country’s capacity to retain a talent 95 39 20 71 27 31
The country’s capacity to attract a talent 69 28 22 86 32 26
Women in the labor force, their ratio to men 21 115 121 111 65 36
Source: World Bank Group, 2013a
Figure 15 The taxes-to-a-profit ratio
Source: The World Bank Database

48 Ekonomski horizonti (2016) 18(1), 33 - 52
are mainly raw and semi-processed products of a poor quality. For example, the low quality rice (25% broken rice) accounted for 70 percent of the export volume in 2012. In addition, 5% broken rice is still not comparable
to Thailand’s in terms of the quality and the price. A similar situation can be found in the industrial sector, which exports low value-added products. For example, electrical components and high-valued electronic
Figure 16 The corruption index
Source: Kaufmann et al, 2011
Table 4 The efficiency of the labor market
Vietnam Indonesia Malaysia Philippines Thailand China
The overall rank 99 128 12 138 18 91
Starting a business 108 166 54 161 85 151
Dealing with construction permits 28 75 96 100 16 181
Getting electricity 155 147 28 57 10 114
Registering property 48 98 33 122 26 44
Getting credit 40 129 1 129 70 70
Protecting investors 169 49 4 128 13 100
Paying taxes 138 131 15 143 96 122
Trading across borders 74 37 11 53 20 68
Enforcing contracts 44 144 33 111 23 19
Resolving insolvency 149 148 49 165 58 82
Source: World Bank Group, 2013a
Nguyen Duc Thanh and Pham Van Dai, Economic growth constraints in vietnam: A study using the growth diagnostic approach 49
goods, despite being exported from Viet Nam, are only assembled domestically in order to exploit cheap labor.
A lack of market linkages is a weakness of Vietnam, revealed by the underdevelopment of the supporting industries. For example, the imported raw material makes up for 80% of the product cost in the textile industry (Viettrade, 2013). According to Viet Nam Development Forum (2011), the underdevelopment of the supporting industries can be showed in the number of firms. While the number of Japanese firms (assemblers) increased from 20 to 62 over the period 2004-2008, the number of domestic enterprises (providers) in the corresponding supporting industries increased from 50 to 53. H. T. Dinh, T. G. Rawski, A. Zafar, L. Wang and E. Mavroeidi (2013) showed that Vietnamese enterprises either export raw materials or manufacture-based intermediate goods. There is little linkage in the value chain, which prevents the economy from reaching a higher level of productivity.
CONCLUSION
This paper focuses on analyzing the growth constraints in the short and the medium terms in Vietnam, using the framework developed by R. Hausmann et al (2005) and R. Hausmann et al (2008). It finds four binding constraints that the government’s resources should be focused on having them removed.
Firstly, Vietnam’s business environment is unhealthy, characterized by severe corruption and crime, which discourages private investors from starting and expanding their businesses. These factors create the shadow price that hinders the growth of enterprises and deters new investment due to a low expected rate of return. This is in line with H. T. Dinh (2014), who pointed out the missing of medium-sized and large enterprises in the domestic market, caused by the poor development of domestic small businesses.
Secondly, similarly to the majority of economies, in their early stages of the industrialization process, the infrastructure is a binding constraint on Vietnam’s economic growth. It is emphasized that an improvement of the quality of the transportation infrastructure is essential in promoting economic
growth in both the short and the medium terms. However, upgrading the transportation network always requires a large amount of capital that is often scarce in developing countries like Vietnam. Thus, investment in the transport infrastructure projects should be carried out based on rigorous cost and benefit analyses. Along with the transportation infrastructure, the energy infrastructure would be an essential constraint in the medium and the long terms, although it is not a binging constraint in the short term.
Thirdly, the weaknesses of the financial intermediaries and excessive and inefficient public investment (including investments of state-owned enterprises) remain the key constraints on economic growth. The poor performance of the financial intermediaries, especially commercial banks, raises the cost of capital imposed on private enterprises, and consequently reduces private investment to below the optimal level. Moreover, the government’s overinvestment causes a crowding-out effect and negatively influences private investment. These two factors make Vietnam’s private sector underdeveloped despite the fact that Vietnam has a domestic savings rate among the highest ones in the region.
Fourthly, the lack of economic linkages between upstream and downstream industries has been an obstacle to the economic development in Vietnam. This constraint stems from the market failures in forming linkages and optimizing benefits of all market participants. The government should play a more active role in promoting industry linkages, which the market mechanism has failed to do. According to H. T. Dinh et al (2013), in addition to the exchange rate and tariff tools, the government could develop industrial parks with the completed infrastructure and buildings („plug and play”), which could encourage forming business.
The growth diagnostic framework is demonstrated to be an effective tool for analyzing and designing development policies in developing countries. By applying this methodology in the specific context of Vietnam, the authors have pointed out the four constraints for economic growth, which should be focally targeted by the government’s development policies. Nevertheless, as the growth diagnostic

50 Ekonomski horizonti (2016) 18(1), 33 - 52
framework requires a wide range of information resources, it should be noted that some economic signals have been neglected due to the limitation of the data. In further research, this method could be expanded to address important policy issues. For example, it can be used to work toward solutions to develop small and medium-sized enterprises, or to improve the quality of the education systems in Viet Nam and other developing countries.
ENDNOTES
1 Law No. 32/2013 / QH13
2 http://laodong.com.vn/phap-luat/nhom-cong-nhan-trom-cap-linh-kien-samsung-galaxy-s5-tri-gia-tien-ti-197069.bld (assessed on 26 July 2015)
REFERENCES
Anh, P. T. (2014). Thâm hụt ngân sách, nợ công và rủi ro vĩ mô ở Việtnam (Fiscal deficit, public debt and macro risks in Vietnam). Vietnam Journal of Economics and Development, 199, 18-28.
Binh, P. T. (2011). Energy consumption and economic growth in Vietnam: Threshold cointegration and causality analysis. International Journal of Energy Economics and Policy, 1(1), 1-17.
Cuong, N. V. (2011). Estimation of the impact of rural roads on household welfare in Vietnam. Asia-Pacific Development Journal, 18(2), 105-135.
Dai, P. V., & Thanh, N. D. (2012). The efficiency and growth of Vietnam’s economy. In N. D. Thanh (Ed.). Vietnam Annual Economic Report 2012: Facing the Challenges of Structural Reforms (pp. 115-153). Hanoi, Vietnam: Global Publisher.
Delpachitra, S., & Dai, P. V. (2015). The determinants of vietnamese banks’ lending behavior: A theoretical model and empirical evidence. Journal of Economics Studies (Forth coming), 42(5), 8 61-877. http://dx.doi.org/10.1108/JES-08-2014-0140
Dinh, H. T. (2014). Light Manufacturing in Vietnam: Creating Jobs and Prosperity in a Middle-Income Economy. Washington, USA: World Bank Publications.
Dinh, H. T., Rawski, T. G., Zafar, A., Wang, L., & Mavroeidi, E. (2013). Tales from the Development Frontier: How China and
Other Countries Harness Light Manufacturing to Create Jobs and Prosperity. Washington, USA: World Bank Publications.
Hausmann, R., Klinger, B., & Wagner, R. (2008, September). Doing Growth Diagnostics in Practice: a ‘Mindbook’. Harvard University Center for International Development, Working Paper 177.
Hausmann, R., Rodrik, D., & Velasco, A. (2005). Growth diagnostics. In J. Stiglitz & N. Serra (Eds.). The Washington Consensus Reconsidered: Towards a New Global Governance. New York, NY: Oxford University Press.
Kaufmann, D., Kraay, A., & Mastruzzi, M. (2011). The worldwide governance indicators: Methodology and analytical issues. Hague Journal on the Rule of Law, 3(02), 220-246. http://dx.doi.org/10.1596/1813-9450-5430
Minh, N. T. (2009). Dynamic demographics and economic growth in Vietnam. Journal of the Asia Pacific Economy, 14(4), 389-398. doi:10.1080/13547860903169365
Ministry of Labor. (2014). Invalids and Social Affairs. Update on the Vietnamese Labor Market (Vol. 2).
Ministry of Transport. (2014). Báo Cáo Kết Quả Huy Động Nguồn Vốn Ngoài Ngân Sách Năm 2013, Kế Hoạch Giải Pháp Thực Hiện Năm 2014 và Kết Quả Áp Dụng Các Giải Pháp Để Tiết Giảm Chi Phí Đầu Tư Của Các Dự Án Từ Khi Thực Hiện Nghị Quyết Số 11/NQ-CP đến Tháng 12/2013. (Report on the Out-of-Budget Resources in 2013, The plan of Implementation in 2014 and Results of Investment Cost Reduction Solutions by Project in Ccordance to Resolution No. 1/NQ-CP as of December 2013).
Nguyen, T. T., & Van Dijk, M. A. (2012). Corruption, growth, and governance: Private vs. state-owned firms in Vietnam. Journal of Banking & Finance, 36(11), 2935-2948. doi: 10.1016/j.jbankfin.2012.03.027
Ohno, H., & Thanh, L. H. (2015). Bẫy Thu Nhập Trung Bình tại Việt Nam: Thực Trạng và Giải Pháp (Middel Income Trap in Vietnam: Situation and Solution). Những Vấn Đề Kinh Tế và Chính Trị Thế Giới, 3(227).
Rodrik, D. (2006). Goodbye Washington consensus, hello Washington confusion? A Review of The World Bank’s economic growth in the 1990s: Learning from A Decade of Reform. Journal of Economic literature, 44(4), 973-987. doi:10.1257/jel.44.4.973
Smith, P. (2014). Vietnam’s choices of energy policy. In N. D. Thanh (Ed.). Vietnam Annual Economic Report 2014: The Constraints to Growth. Hanoi, Vietnam: Global Publisher.
Son, N. N., & Chuong, P. H. (2011). Chất Lượng Tăng Trưởng Kinh Tế Việt Nam Mười Hai Năm Nhìn Lại và Giải Pháp cho Tương Lai (The Quality of Viet Nam’s Economic Growth in the

Nguyen Duc Thanh and Pham Van Dai, Economic growth constraints in vietnam: A study using the growth diagnostic approach 51
Last 10 Years and Solutions for the Future). Hanoi, Vietnam: Transport Publishing House.
Stiglitz, J. (2003). Challenging the Washington consensus. The Brown Journal of World Affairs, 9(2), 33-44.
Thanh, N. C. (2011). Củng Cố và Phát Triển Hệ Thống Các Tổ Chức Tín Dụng ở Việtnam trong Bối Cảnh Mới (Consolidate and develop Vietnam banking system in the new context). Tạp chí Ngân hàng, State Bank of Vietnam, 8, 24-29.
Tho, T. V. (2013). The middle-income trap: Issues for members of the association of southeast Asian nations. Asian Development Bank Institute Working Paper, 421.
VCCI. (2013). Provicial Competitiveness Index 2013.
VID Group. (2014). Vietnam economic prospects: Overview of Q1 2014 and prospects of the following months. Hanoi, Vietnam.
Viet capital securities. (2014). Market Data. Retrieved May 24, 2014, from https://www.vcsc.com.vn/Modules/Analysis/Web/IndustryAnalysis.aspx?tab=3&MenuID=5&inTab=Tongquan&cat=0&lang=en-us
Vietnam development forum. (2011). Survey of the Contexts, Policy Measures, and Result of Developing Supporting Industries in ASEAN: Transport Publishing House.
Vietstock.vn. (2014). Thấy gì từ hiện tượng ngân hàng giảm cho vay ngắn hạn? Retrieved May 24, 2014, from http://vietstock.vn/2014/05/thay-gi-tu-hien-tuong-ngan-hang-giam-cho-vay-ngan-han-757-347558.htm
Viettrade. (2013). Báo Cáo Xúc Tiến Xuất Khẩu 2012-2013 (Export promotion report 2012-2013).
Williamson, J. (1990). What Washington means by policy reform. In J. Williamson (Ed.). Latin American Adjustment: How Much Has Happend (pp. 7-38). Washington, USA: World Bank, Institute for International Economics.
World Bank Group. (2013a). Taking Stock: An Update on Viet Nam’s Recent Economic Developments. Washington, USA.
World Bank Group. (2013b). Doing Business 2013: Smarter Regulations for Small and Medium-Size Enterprises. Washington, USA: World Bank Publications.
World Economic Forum. (2014). The Global Competitiveness Report 2013-2014. Geneva, Switzerland.
Nguyen Duc Thanh received his PhD in development economics from National Graduate Institute for Policy Studies (GRIPS), Japan. He is a member of the Macroeconomic Advisory Group of National Assembly’s Economic Commitee. He is the President of Vietnam Institute for Economic and Policy Research.
Pham Van Dai obtained his PhD in economics and finance from Flinders University, Australia. He is the Head of Research Division, Vietnam Institute for Economic and Policy Research.
Received on 21st January 2016,after two revisions,
accepted for publication on 14th April 2016.Published online on 25th April 2016.

52 Ekonomski horizonti (2016) 18(1), 33 - 52
OGRANIČENJA EKONOMSKOM RASTU U VIJETNAMU: STUDIJA NA TEMELJU PRIMENE PRISTUPA
DIJAGNOSTIKE RASTA
Nguyen Duc Thanh and Pham Van DaiVietnam Institute for Economic and Policy Research, Hanoi, Vietnam
U nedavno sprovedenim studijama, jasno je istaknut opadajući trend kratkoročnog i dugoročnog ekonomskog rasta Vijetnama. U ovom radu, predstavljena je studija koja počiva na primeni pristupa dijagnostike rasta za Vijetnam, u cilju utvrđivanja ograničenja tom rastu. Pokazalo se da glavna ograničenja ekonomskom rastu Vijetnama uključuju siromašno poslovno okruženje; nedovoljno razvijenu infrastrukturu, posebno tržište saobraćajne mreže; probleme u vezi sa informacionim eksternalijama, upoznavanje sa eksternalijama i probleme u koordinaciji. Naročito bi energetska infrastruktura mogla predstavljati jedno od suštinski bitnih ograničenja u bliskoj budućnosti, ali za sada nije jedno od glavnih ograničenja. Neefikasnost posrednika u finansijskom poslovanju i preterano ulaganje od strane države mogli bi da postanu glavno ograničenje kada se privreda Vijetnama vrati na put visokog rasta.Ključne reči: Vijetnam, ekonomski rast, dijagnostika rasta, politika rasta
JEL Classification: O40, O43,O11, O12