Embed Size (px)
Citation preview

EconomicFreedom
James Gwartne y
Robert Lawson
Walter Bloc k
United States

Economic Freedom of the World: 1975-1995 co-publishers
Cato Institute, Washington, D.C., United States of AmericaFounded in 1977, the Cato Institute is a public policy research foundationdedicated to broadening the parameters of policy debate to allow con-sideration of more options that are consistent with the traditional Amer-ican principles of limited government, individual liberty, free markets,and peace. To that end, the Institute strives to achieve greater involve-ment of the intelligent, concerned lay public in questions of policy andthe proper role of government through an extensive program of publica-tions and seminars.
Centro de Investigaciones Economicas Nacionales,Guatemala City, GuatemalaThe Center for Research on the National Economy (CIEN) was estab-lished in Guatemala in 1982. It is a private, non-partisan, not for profitpublic policy institute, funded by the sale of its books and periodicalpublications, income from conferences and seminars, and the support itreceives from its members and the public. The Center's program isdevoted to the technical study of economic and social problems that needto be resolved to promote the stable development of the nation. Itsmembers, staff, research associates, and its supporters share the princi-ples of a social order of free and responsible individuals interactingthrough a market economy functioning within the rule of law.
Centro de Investigaciones Sobre la Libre Empresa, A.C.,Mexico City, MexicoThe Centro de Investigaciones Sobre la Libre Empresa (CISLE) is anonprofit educational and public policy organization founded in 1984.Its aim is to defend and promote the ideals of free trade and free enterprisein all areas of society. CISLE maintains that the fundamental source ofwell being and the wealth of nations is a sound institutional order whichguarantees competition, private ownership, and open markets. CISLE* sactivities are Financed by a select group of generous donors.
The Fraser Institute, Vancouver, CanadaThe Fraser Institute is an independent Canadian economic and socialresearch and educational organization. It has as its objective the redirectionof public attention to the role of competitive markets in providing for thewell-being of Canadians. Where markets work, the Institute's interestlies in trying to discover prospects for improvement. Where markets donot work, its interest lies in finding the reasons. Where competitivemarkets have been replaced by government control, the interest of theInstitute lies in documenting objectively the nature of the improvementor deterioration resulting from government intervention. The work of theInstitute is assisted by an Editorial Advisory Board of internationallyrenowned economists. The Fraser Institute is a national, federally char-tered, non-profit organization financed by the sale of its publications andthe tax-deductible contributions of its members.
The Free Market Foundation of Southern Africa,Johannesburg, South AfricaThe Free Market Foundation of Southern Africa was established in 1975to promote economic freedom. The FMF sponsors and conducts research,publications, conferences, lectures, training programs and lobbyingefforts in support of the free market. Its funding comes from membershipsubscriptions, project sponsorships, and income from sales and fees.
The Hong Kong Centre for Economic Research,Hong KongThe Hong Kong Centre for Economic Research is an independent freemarket policy research institute. The Centre was established in 1987 as
a charitable trust. Untill 992 it was affiliated with the Chinese Universityof Hong Kong, and since then it has been affiliated with the Universityof Hong Kong. The Centre recognizes that the economic success of HongKong is the result of policies that protected private property rights, freeenterprise, and limited the role of the government. It also recognizes thatthe political foundation of these policies is always vulnerable, and thatthe case for preserving these policies and expanding its scope has to becontinuously articulated. The main activities of the Centre are to influ-ence public opinion and policy outcomes through a program of researchand education.
The Institute of Economic Affairs, London, EnglandThe IEA 's mission is to improve public understanding of the foundationsof a free and harmonious society by expounding and analyzing the roleof markets in solving economic and social problems, and bringing theresults of that work to the attention of those who influence thinking, TheIEA achieves its mission by a high quality publishing program; conferen-ces, seminars and lectures on a range of subjects; outreach to school andcollege students; brokering media introductions and appearances; andother related activities. Incorporated in 1955 by the late Sir AnthonyFisher, the IEA is an educational charity, limited by guarantee. It isindependent of any political party or group, and is financed by sales ofpublications, conference fees, and voluntary donations.
The Institute of Economic Affairs, Accra, GhanaThe Institute of Economic Affairs (IEA) Ghana is an independent,non-governmental institution dedicated to the establishment andstrengthening of a market economy and a democratic, free and opensociety. The IEA was founded in October 1989. It considers im-provements in the legal, social and political institutions as necessaryconditions for sustained economic growth and human development. TheIEA supports research, and promotes and publishes studies on importanteconomic socio-political and legal issues i n order to enhance understand-ing of public policy.
Institute of Public Affairs, Jolimont, AustraliaEstablished in 1943, thelPAis Australia's oldest and largest private-sec-tor "think tank." Its aim is to advance the interests of the Australianpeople. Those interests include prosperity and full employment, the ruleof law, democratic freedoms, security from crime and invasion, highstandards in education and family life. To identify and promote the bestmeans of securing these values, the IP A undertakes research, organizesseminars, and publishes widely.
The Israel Center for Social and Economic Progress,Mevasseret Zion, IsraelThe Israel Center for Social and Economic Progress (ICSEP) is anon-partisan public policy think tank advocating free market policies inIsrael. It holds conferences and seminars for Israeli decision makers andpublic opinion moulders. It runs an extensive publications and audiovisual program. It is also engaged in teaching basic economic conceptsto high school students and new immigrants.
Liberales Institut, Bonn, GermanyThe Liberales Institut (Liberty Institute) is the think tank of the Friedrich-Naumann-Foundation. The Bonn-based institute devotes itself to spread-ing ctassical liberal/free market ideas through the publication of classicalliberal literature, the analysis of current political trends and the promo-tion of research. By organizing conferences and workshops, the institutetries to stimulate an intellectual exchange among liberals around theworld.
www.fraserinstitute.org

ECONOMIC FREEDOMOF THE WORLD:1975-1995
www.fraserinstitute.org

www.fraserinstitute.org

ECONOMIC FREEDOMOF THE WORLD:1975-1995
byJames GwartneyRobert LawsonWalter Block
www.fraserinstitute.org

Copyright © 1996 by The Fraser Institute. All rights reserved. No part of thisbook may be reproduced in any manner whatsoever without written permis-sion except in the case of brief quotations embodied in critical articles andreviews.
The authors of this book have worked independently and opinions expressedby them, therefore, are their own, and do not necessarily reflect the opinionsof the members or the trustees of The Fraser Institute.
Printed in Canada.
Canadian Cataloguing in Publication Data
Gwartney, James D.Economic Freedom of the World, 1975-1995
Includes bibliographical references.ISBN 0-88975-157-9
1. Free enterprise. 2. Economic history—1971-1990. 3.Economic history—1900- 4. Economic development—Measurement. I. Lawson, Robert A. (Robert Allen), 1967- II.Block, Walter, 1941- III. Fraser Institute (Vancouver, B.C.) IV.TitleHB95.G92 1995 330.9'045 C95-911182-4
www.fraserinstitute.org

TABLE OF CONTENTS
Foreword vii
List of Exhibits ix
About the Authors xii
Acknowledgments xiii
Executive Summary xv
Graphic Summary of Major Findings xix
Introduction: The Historical Development of The Economic Freedom Indexby Michael A. Walker 1
Chapter 1 Construction of the Economic Freedom Index 11
• The Concept of Economic Freedom / 12• The Components of Our Index of Economic Freedom / 14• Attaching Weights to the Components / 37
Chapter 2 Rating the Economic Freedom of Countries in 1993-1995, 1990, 1985,1980, and 1975 47
• Country Ratings in 1993-1995 / 47• Country Rankings: 1975-1995 / 62• The Persistently High and Persistently
Low Rated Countries: 1975-1995 / 66
Chapter 3 Changes in the Economic Freedom of Countries: 1975 to 1995 71
• Changes in the Economic Freedom of Countries / 71• Changes in the Economic Freedom of the World / 80• Changes in Economic Freedom By Development
Status and Region / 84
www.fraserinstitute.org

Chapter 4 Economic Freedom and Economic Growth 89
• Measurement Problems and the Relationship BetweenEconomic Freedom and Income / 90
• The Level of Economic Freedom, Income, and Growth / 92• Changes in Economic Freedom and the Growth of GDP / 97• Economic Freedom and Economic Growth: Some Reflections / 104• Concluding Remarks / 107
Chapter 5 Country Profiles I l l
Appendix I The Summary Index Ratings for 1975, 1980, 1985, and 1990 . . . . 229
Appendix II The Underlying Data Used to Calculate the Indexes 243
VI
www.fraserinstitute.org

FOREWORD
Freedom is a big word, and economic freedom not much smaller. To talk abouteconomic freedom is easy; to measure it, to make fine distinctions, assign numbers to itsattributes, and combine them into one overall magnitude—that is a very different andmuch more difficult task, as we found out when we started on this quest some thirteenyears ago (see Michael Walker's introduction).
James Gwartney, Robert Lawson, and Walter Block deserve great credit for havingbrought this quest to so satisfactory a temporary conclusion—I say temporary because thisstudy of economic freedom for more than 100 countries provides a cornucopia forstudents of the relation between economic freedom, political freedom, and civil freedom,and for further explorations of the relation between economic freedom and the level andrate of economic growth. The resulting studies will surely make revised editionsnecessary, both to bring the indexes of economic freedom up to date and to incorporatethe additional understanding that will be generated.
For many of us, freedom—economic, political, civil—is an end in itself not a meansto other ends—it is what makes life worthwhile. We would prefer to live in a free countryeven if it did not provide us and our fellow citizens with a higher standard of life thanan alternative regime. But I am firmly persuaded that a free society could never surviveunder such circumstances. A free society is a delicate balance, constantly under attack,even by many who profess to be its partisans. I believe that free societies have arisen andpersisted only because economic freedom is so much more productive economically thanother methods of controlling economic activity.
It did not require the construction of an index of economic freedom for it to bewidely believed that there is a close relation between economic freedom and the level andrate of economic growth. Theoretical considerations gave reason to expect such arelation, and little more than casual observation sufficed to show that what theorysuggested, experience documented. We have not in a sense learned any big thing fromthis book that we did not know before. What we have done is to acquire a set of datathat can be used to explore just how the relation works, and what are the essentialconnections, and that will enable skeptics to test their views objectively.
Vll
www.fraserinstitute.org
To achieve these advantages, it was essential that the measure of economicfreedom not beg any questions by depending on outcomes; it was essential that it dependonly on objective characteristics of an economy. This may seem obvious but I assure youthat it is not. After all, the rate of economic growth or the level of living may be anexcellent proxy for economic freedom, just as an auto's maximum speed may be anexcellent proxy for the power of its motor. But any such connections must bedemonstrated not assumed or taken for granted. There is nothing in the way the indexesare calculated that would prevent them from having no correlation whatsoever with suchcompletely independent numbers as per capita GDP and the rate of growth of GDP. Yetthe actual correlation between the indexes and the level and rate of economic growthdocumented in some of the extraordinarily informative graphs in the book (e.g., ExhibitS-2) is most impressive. No qualitative verbal description can match the power of thatgraph.
Milton FriedmanThe Hoover Institution
Stanford University
via
www.fraserinstitute.org

List of Exhibits
EXHIBIT TITLE PAGE
Exhibit S-1A: The Average of the Three 1993-95 Summary Index Ratings of EconomicFreedom xx
Exhibit S-1B: The 1993-95 Summary Index (Isl) of Economic Freedom xxi
Exhibit S-2: The 1995 Economic Freedom, Grade Level, Per Capita GDP,and Growth xxii
Exhibit S-3: The Income Levels and Growth Rates of Persistently Highand Persistently Low Rated Countries xxiii
Exhibit S-4A: The Economic Freedom Ratings (Isl) During 1975-1995and Growth Rate for High-Rated Non-Industrial Economies . . . . xxiv
Exhibit S-4B: The Economic Freedom Ratings (Isl) During 1975-1995and Growth Rate for Low-Rated Non-Industrial Economies . . . . xxv
Exhibit S-4C: The Economic Freedom Ratings (Isl) and Growth Rates ofLess-Developed Economies That Became More Free During1975-1995 xxvi
Exhibit S-4D: The Economic Freedom Ratings (Isl) and Growth Rates ofLess-Developed Economies That Became Less Free During1975-1995 xxvii
Exhibit S-5: Growth Rates During 1980-1994 of the Ten Countries withthe Largest Increases and Largest Declines in EconomicFreedom During 1975-1990 xxviii
Exhibit S-6: The Growth of Per Capita GDP During 1980-1990 for theCountries That Had a One Unit Increase in the IslEconomic Freedom Rating Between 1975 and 1985 (andMaintained the Increase into the 1990s) Compared tothe Growth of Countries with a One Unit DeclineDuring 1980-1990 xxix
Exhibit S-7: Changes in the Average Country Rating for theSummary Indexes and the Components: 1975-1995 xxx
IX
www.fraserinstitute.org

Exhibit 1-1: Components of the Index of Economic Freedom 16
Exhibit 1-2: The Weights Attached to Each Component in theAlternative Indexes 38
Exhibit 2-1: Component, Area, and Summary Index Ratings: 1993-1995 48
Exhibit 2-2: The Economic Freedom Rating (Isl) of the 15Highest, 15 Lowest and Selected Middle-ratedCountries for 1975, 1980, 1985, 1990, and 1995 64
Exhibit 2-3: Countries with Either Persistently High orPersistently Low Ratings Throughout the1975-1995 Period 67
Exhibit 3-1: The Ratings of the 15 Countries with the LargestIncrease in the Index of Economic Freedom (Isl)During the 1975-1990 Period 72
Exhibit 3-2: The Ratings of the 15 Countries with the LargestDecline in the Index of Economic Freedom (Isl)During the 1975-1990 Period 74
Exhibit 3-3: Countries With at Least a One Unit Increase in theIsl Summary Rating Between 1975 and 1985 and Main-tenance of This Increase Between 1985 and 1995 75
Exhibit 3-4: The Ten Countries With the Largest Increase in theIsl Summary Rating Between 1980 and 1990 and theMaintenance of This Increase Between 1990 and 1995 77
Exhibit 3-5: The Fifteen Most Improved Countries During 1985-1995 and 1990-1995 79
Exhibit 3-6: Changes in the Average Value of the Components ofthe Index of Economic Freedom and the AverageSummary Rating of Countries: 1975-1995 82
Exhibit 3-7: Average Summary Rating (Isl) by Level of Develop-ment and Region: 1975-1995 86
www.fraserinstitute.org

Exhibit 4-1A:
Exhibit 4-1B:
Exhibit 4-2:
Exhibit 4-3:
Exhibit 4-4:
Exhibit 4-5:
Exhibit 4-6:
Exhibit 4-7:
The Per Capita GDP and the Growth of Per Capita GDPfor the Countries with an Index Rating Grade of Aor B in 1993-1995 93
The Per Capita GDP and the Growth of Per Capita GDPfor the Countries with an Index Grade of F-, 1993-1995 94
The Growth of Per Capita GDP for Countries With aPersistently High and Persistently Low EconomicFreedom Rating During 1975-1995 95
The Economic Growth of the 15 Countries for Whichthe Index of Economic Freedom (Isl) Increased theMost During 1975-1990 98
The Economic Growth of the 15 Countries for Whichthe Index of Economic Freedom (Isl) Declined theMost During 1975-1990 99
The Growth of Per Capita GDP for Countries with atLeast a One Unit Change in the Isl Summary Indexof Economic Freedom Between 1975 and 1985 101
The Growth of Per Capita GDP for the Ten Countrieswith the Largest Change in the Isl Summary RatingBetween 1980 and 1990 102
Selected Comparisons Between Countries with Increasesand Decreases in Economic Freedom During Various Periods . 106
XI
www.fraserinstitute.org

About the Authors
James Gwartney is a Professor of Economics and Policy Sciences at Florida StateUniversity. His Ph.D. in Economics is from the University of Washington (1969). Heis the co-author (with Richard Stroup) of Economics: Private and Public Choice, awidely-used university level text and What Everyone Should Know About Economics andProsperity, a popular book that has already been translated to ten foreign languages. Heis also the author of several other books and articles published in the leading professionaljournals of economics.
Robert Lawson is an Associate Professor of Economics at Shawnee StateUniversity. He received his Ph.D. from Florida State University in 1992. In addition tothe study of economic systems, freedom and growth, his major area of research is publicchoice.
Walter Block is an Associate Professor of Economics at the College of the HolyCross. His Ph.D. in economics is from Columbia University (1972). Senior Economistat The Fraser Institute from 1978 to 1991, he is the author (or co-author) of six books andthe editor (or co-editor) of twelve others. He is currently the co-editor of two journals,The Review of Austrian Economics and The Journal of Libertarian Studies. He has alsoserved as the guest editor of The Journal of Labor Economics and Cultural Dynamics.
Xll
www.fraserinstitute.org

Acknowledgments
This project is the fruition of a team effort. It is an outgrowth of a series of sixconferences jointly sponsored by the Fraser Institute of Vancouver, British Columbia andthe Liberty Fund of Indianapolis, Indiana. We owe an enormous debt to both thesponsors and conference participants. The free wheeling discussions stimulated ourthinking and provided us with several ideas, many of which are incorporated into ourmeasure of economic freedom.
While we benefitted from discussions and papers presented by numerousparticipants, we must mention the specific contributions of three. First, Mike Walkerprovided the entrepreneurial insight for the topic, the energy to organize the conferenceseries, and the persuasiveness to attract several of today's finest intellects to address thetopic. Without his contribution, we would probably have not even thought about themeasurement of economic freedom, much less undertaken the task. His Introduction tothe book presents the historical background that proceeded our work on this topic.
Second, the contribution of Alvin Rabushka was also crucial. His enthusiasm forthe project supported it during the early days. His paper, "Preliminary Definition ofEconomic Freedom" presented at the second conference, outlined the key attributes ofeconomic freedom and provided us with invaluable guidance concerning how they shouldbe measured. More recently as our work developed, he has given us additional directionand encouragement.
Third, we would like to thank Milton Friedman. No words can fully express ourdebt to him. He attended each of the Fraser/Liberty Fund conferences and his ferociouslove for intellectual inquiry was an inspiration to all participants. His pointed and oftenrevealing criticisms challenged us to work harder and think deeper. His directions havehelped us avert at least a few of the treacherous swamps that inevitably accompany aproject of this type.
We would also like to express our appreciation to the Policy Sciences Center ofFlorida State University for providing the research and word processing support that madethe project feasible. Barbara Morgan and Frank Keuchel assisted with data gathering,calculations, and the checking of the figures in the manuscript. Kristin McCahon,Director of Publications at the Fraser Institute, did an excellent job of coordinating thedesign and publication of the book. Finally, no one will be happier to see this projectcompleted than Valerie N. Colvin, Senior Art/Production Specialist. She maintained herpatience during numerous occasions when data were updated, a variable or a countryadded, or an exhibit redesigned. It was a challenging task and she handled it well.
James GwartneyRobert LawsonWalter Block
xm
www.fraserinstitute.org

www.fraserinstitute.org

Executive Summary
1. The central elements of economic freedom are personal choice, protection ofprivate property, and freedom of exchange. The goal of this study is to constructan index that is (a) a good indicator of economic freedom across countries and (b)based on objective components that can be updated regularly and used to trackfuture changes in economic freedom.
2. An index containing 17 components was designed to provide an empirical measurefor economic freedom. The components were grouped into four major areas: I.Money and Inflation, II. Government Operations and Regulations, III. Takingsand Discriminatory Taxation, and IV. Restrictions on International Exchange.Exhibit 1-1 provides a description of the specific components of the index. Datawere assembled and procedures adopted to rate countries on a zero to ten scale foreach of the components. Chapter 1 indicates the data sources used and explainshow the each of the component ratings were derived. See Appendix II for thetables containing the underlying data and the ratings for each of the 17components.
3. Since there is not a single "best way" to weight the components into an aggregatesummary rating, three alternative summary indexes were derived. See Exhibit 1-2for the component weights used to derive each of the three indexes.
4. Exhibit 2-1 presents the 1993-1995 ratings for each of the 17 components in ourindex, as well as area ratings, and the three alternative summary indexes (and theaverage of the three). With the exception of the high-income industrial countries,the three alternative summary ratings yield similar results. In the case of theindustrial countries, the summary index that allocates only a very small weight tothe size of government consumption expenditures and transfers and subsidies asa share of the economy yielded ratings that were approximately one unit higherthan the two other summary ratings.
5. In terms of economic freedom, Hong Kong is the highest rated country in theworld. Since Hong Kong's average for the three alternative ratings in 1993-1995 was significantly higher than any other country, it was given a lettergrade of A+. New Zealand, Singapore, and United States earned a gradeof A. The following ten countries were assigned a grade of B: Switzerland,United Kingdom, Canada, Australia, Ireland, Japan, Netherlands, Germany,Belgium, and Malaysia. Exhibit S-1A (Graphic Summary) indicates theaverage of the three indexes for each country and their ranking. Exhibit S-1Bprovides the same information for the Isl index.
XV
www.fraserinstitute.org
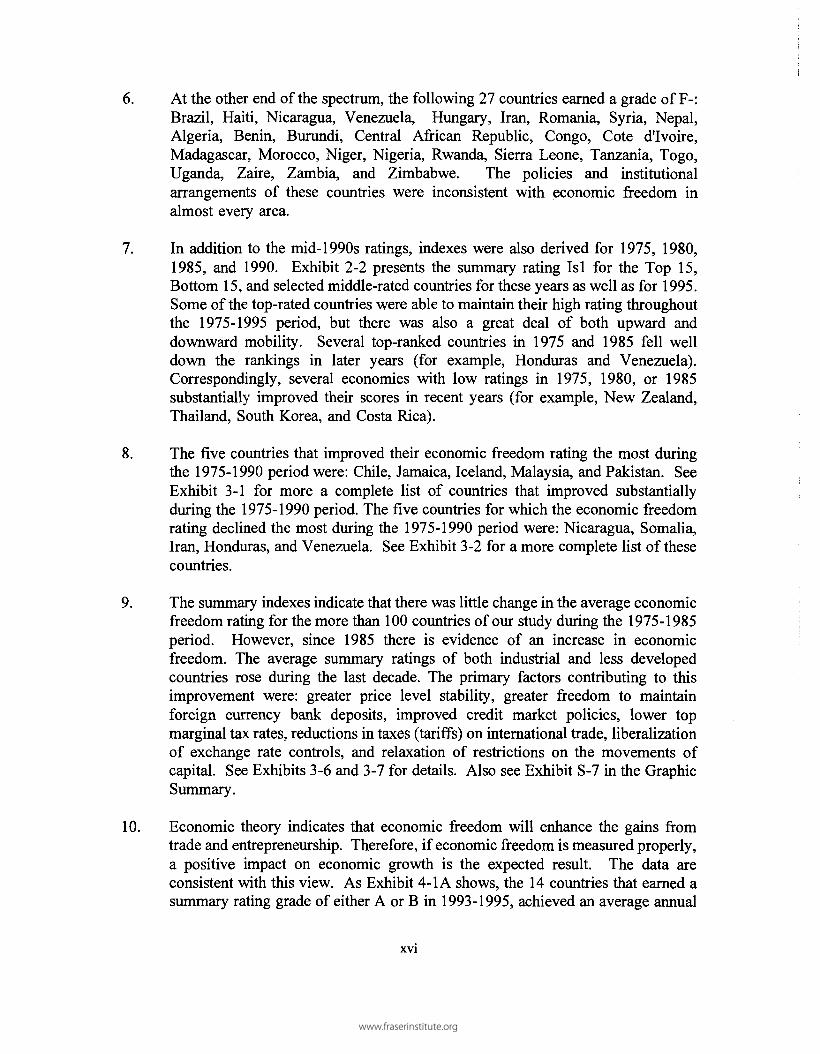
6. At the other end of the spectrum, the following 27 countries earned a grade of F-:Brazil, Haiti, Nicaragua, Venezuela, Hungary, Iran, Romania, Syria, Nepal,Algeria, Benin, Burundi, Central African Republic, Congo, Cote d'lvoire,Madagascar, Morocco, Niger, Nigeria, Rwanda, Sierra Leone, Tanzania, Togo,Uganda, Zaire, Zambia, and Zimbabwe. The policies and institutionalarrangements of these countries were inconsistent with economic freedom inalmost every area.
7. In addition to the mid-1990s ratings, indexes were also derived for 1975, 1980,1985, and 1990. Exhibit 2-2 presents the summary rating Isl for the Top 15,Bottom 15, and selected middle-rated countries for these years as well as for 1995.Some of the top-rated countries were able to maintain their high rating throughoutthe 1975-1995 period, but there was also a great deal of both upward anddownward mobility. Several top-ranked countries in 1975 and 1985 fell welldown the rankings in later years (for example, Honduras and Venezuela).Correspondingly, several economies with low ratings in 1975, 1980, or 1985substantially improved their scores in recent years (for example, New Zealand,Thailand, South Korea, and Costa Rica).
8. The five countries that improved their economic freedom rating the most duringthe 1975-1990 period were: Chile, Jamaica, Iceland, Malaysia, and Pakistan. SeeExhibit 3-1 for more a complete list of countries that improved substantiallyduring the 1975-1990 period. The five countries for which the economic freedomrating declined the most during the 1975-1990 period were: Nicaragua, Somalia,Iran, Honduras, and Venezuela. See Exhibit 3-2 for a more complete list of thesecountries.
9. The summary indexes indicate that there was little change in the average economicfreedom rating for the more than 100 countries of our study during the 1975-1985period. However, since 1985 there is evidence of an increase in economicfreedom. The average summary ratings of both industrial and less developedcountries rose during the last decade. The primary factors contributing to thisimprovement were: greater price level stability, greater freedom to maintainforeign currency bank deposits, improved credit market policies, lower topmarginal tax rates, reductions in taxes (tariffs) on international trade, liberalizationof exchange rate controls, and relaxation of restrictions on the movements ofcapital. See Exhibits 3-6 and 3-7 for details. Also see Exhibit S-7 in the GraphicSummary.
10. Economic theory indicates that economic freedom will enhance the gains fromtrade and entrepreneurship. Therefore, if economic freedom is measured properly,a positive impact on economic growth is the expected result. The data areconsistent with this view. As Exhibit 4-1A shows, the 14 countries that earned asummary rating grade of either A or B in 1993-1995, achieved an average annual
XVI
www.fraserinstitute.org

growth rate in per capita real GDP of 2.4% during 1980-1994 and 2.6% during1985-1994. In contrast, the average annual growth of per capita real GDP for the27 countries with a summary rating of F- in 1993-1995 was minus 1.3 percentduring 1980-1994 and minus 1.6 percent for the 1985-1994 period. Twenty-oneof the 27 experienced declines in real per capita GDP during 1980-1994. SeeExhibits 4-IB for additional details. Also see Exhibit S-2 in the GraphicSummary for evidence that differences in economic freedom (and theaccompanying grade level) exert a positive impact on both income levels andgrowth rates.
11. Since increases in economic freedom and maintenance of a high level of freedomwill positively influence growth, countries that achieve and sustain high levels ofeconomic freedom over a lengthy time period will tend to be high-incomecountries. The six countries (Hong Kong, Switzerland, Singapore, United States,Canada, and Germany) with persistently high ratings throughout the 1975-1995period were all in the Top Ten in terms of 1994 per capita GDP. No countrywith a persistently high economic freedom rating during the two decadesfailed to achieve a high level of income. In contrast, no country with apersistently low rating was able to achieve even middle income status. SeeExhibit 4-2 and Exhibit S-3 in the Graphic Summary for additional details.
12. The countries with the largest increases in economic freedom during the period,achieved impressive growth rates. As Exhibit 4-3 shows, the 15 countries(actually there are 17 because of a tie) with the most improvement in the indexof economic freedom during the 1975-1990 period experienced an average growthrate in per capita GDP of 2.7 percent during 1980-1990 (and 3.1% during 1985-1994). All 17 of the countries in the most improved category experiencedpositive growth rates. In contrast, the average real per capita GDP declined atan annual rate of 0.6% in the 15 countries (there were also 16 in this group dueto a tie) for which the index of economic freedom fell the most during the sameperiod. Eleven of the 16 countries with the largest declines in economic freedomexperienced declines in real per capita GDP during 1980-1994. See Exhibit 4-4and Graphic Exhibit S-5 for additional details.
13. Countries that achieved a one unit increase in the Is 1 economic freedom ratingbetween 1975 and 1985 and maintained that increase during the next decade grewat a average rate of 3.5% during 1985-1994. Mauritius, Pakistan, Japan, Chile,Jamaica, Singapore, Portugal, United Kingdom and Turkey comprised thiscategory. In contrast, the growth rates of the countries where economic freedomdeclined during 1975-1985 were persistently negative. The pattern was similar forthe countries that achieved and sustained increases in economic freedom between1980 and 1990 compared to those experiencing declines in freedom. See Exhibits4-5 and 4-6 for additional details. Also see Exhibits S-4C and S-4D in theGraphics Summary section.
XVll
www.fraserinstitute.org

14. Chapter 5 presents detailed data for both economic freedom ratings and recentindicators of economic performance for many of the countries included in ourstudy.
XVlll
www.fraserinstitute.org

Graphic Summary
of
Major Findings
www.fraserinstitute.org

Exhibit S-1A: The Average of the Three 1993-95 Summary Index Ratings ofEconomic Freedom
Average Rating
0 2 4 6 8 10
Average Rating
2 4 6 8 10
nony r\ony \.New Zealand 2.
Singapore 3.United States 4.
Switzerland 5.United Kingdom 6.
Canada 6.Ireland 8.
Australia 8.Japan 10.
Netherlands 11.Germany 12.Belgium 12.
Malaysia 12.Thailand 15.
Costa Rica 16.Denmark 16.
Taiwan 16.Panama 16.France 20.
South Korea 20.Norway 22.
Spain 23.Austria 23.Belize 23.
Argentina 26.Chile 26.
Finland 26.Uruguay 26.
Guatemala 26.Bolivia 31.
Italy 31.Jamaica 31.Iceland 31.
Mauritius 31.Sweden 31.
El Salvador 36.Philippines 36.
Trinidad/Tob. 36.Paraguay 40.
Fiji 41.Portugal 41.
Malta 41.Indonesia 41.
Mexico 45.Botswana 46.
Peru 47.Honduras 47.
Ecuador 49.Colombia 50.
Czech Rep 51.Pakistan 51.
I I I I I
|^^HH^MH8.5^MHHHI^H8.2• • ^ • ^ ^ • • 8 . 0^^••^^^•7.9^ • •^^• •7 .6^•^••^^7.6^^M^^H7.4•i^^^^H7.4^^^^^••7.3^^•^•••7.2•H^HHH7.1••^^^M7.1•1^HHMH7.1^^M^^H6.9^^•^••6.8• • • ^ • • • 6 . 8^ ^ • • • • 6 . 8• • • •^^ •6 .8^^^^^M6.7• • •^^•6.7•••^^•6.4IHBBHB6.3^^•^^•6.3••^^^•6.3•^^^••6.2• • • • ^ • 6 . 2••^^^•6.2• •^^•6 .2• • • • • • • 1 6 . 2^^•^^6.1• • •^^6 .1•••^^•6.1• • •6 .1^^^H^6.11^HBHH6.1^^••••6.0^ ^ ^ ^ ^ • 6 . 0IB^^^M6.0^§••15.9^^•^M5.8^^•^•15.8^^§^• •15 .8•^•^•••5.8^^• •5 .7^^••••5.6• • • ^ ^ 5 . 5• • • •^•5 .5^• • • •15 .4^1^BHB5.3••^^•5.2^^•^^5.2
Domin. Rep 53 .Greece 54.Cyprus 54.
South Africa 54.Jordan 57.
Sri Lanka 57.Poland 57.Gabon 60.
Chad 61.Bulgaria 62.
Ghana 62.India 62.
Tunisia 65.Turkey 66.
Bangladesh 66.Israel 66.Egypt 69.
Mali 70.Slovakia 70.
Cameroon 72.Malawi 72.Kenya 72.
Senegal 75.C African R 75.Venezuela 75.
Morocco 75.Sierra Leone 79.
Benin 80.Niger 81.
Rwanda 82.Togo 82.
Congo Rep 82.Zimbabwe 85.
Hungary 85.Nepal 85.
Madagascar 88.Nigeria 88.
Cote d' Ivoire 90.Tanzania 90.
Haiti 90.Zambia 93.Uganda 93.
Romania 95.Burundi 96.
Brazil 97.Nicaragua 98.
Syria 99.Algeria 100.
Iran 101.Zaire 101.
Somalia 103.
t i l l
•^•^•15.0MHHM4.9••^^•4.91MMH4.9^••^•14.8HHBM4.8•••1^4.8•IM^H4.7• • •^4.5••^H4.4^HM^.4• • • • 4 . 4• • •^ •4 .3•^••14.2•^•^4.2^M^4.2• •^•4.2l ^ ^ ^ 4 . 1
^•••4.1••H4.0••1^4.0MH1M4.0•^^•3.9• • • • 3 . 9^^IH|3.9^••13.9•^^3.8^••13.7^•••3.6• • • 3 . 5• • • 3 . 5• • • 3 . 5^ ^ ^ 3 . 4^ ^ • 3 4^§••3.4• • •3 .3• • •3 .3^••3.2• • •3.2•^•3.2• • •3.1• M 3 1• • • 3 . 0•^•2.9••12.8• • •271 ^ ^ 2 . 4
^•2.1•11.9^•1.9-N/R
Note: Chapter 1 explains how the three summary indexes (le, Is1, and Is2) are derived. The rating
above is the average of these three. See Exhibit 2-1 for each of the three ratings.
XX
www.fraserinstitute.org

Exhibit S-1B: The 1993-95 Summary Index (Is1) of Economic Freedom
Is1 Rating
2 4 6 8 10
Is1 Rating
2 4 6 8 1 0
Hong Kong 1.Singapore 2.
New Zealand 3.United States 4.
Switzerland 5.Malaysia 6.
Unit. Kingdom 6.Thailand 6.Canada 9.
Japan 9.Australia 11.
South Korea 12.Ireland 12.
Costa Rica 12.Panama 15.Taiwan 15.
Guatemala 17.Bolivia 18.
Netherlands 18.Germany 18.Argentina 21 .
Belgium 21.Mauritius 21 .Jamaica 21.
El Salvador 21 .Belize 21.
Philippines 27.Uruguay 28.
Paraguay 28.Fiji 28.
Indonesia 28.France 32.
Denmark 32.Ecuador 34.
Peru 34.Mexico 36.Spain 36.Chile 36.
Austria 36.Trinidad/ 36.
Norway 41.Dom. Rep. 41.
Iceland 41.Italy 44.
Malta 44.Finland 44.
Honduras 47.Sweden 47.Portugal 47.Pakistan 50.
I I I I I
:::::::::::•:::::::::::::::::::::::::::::::::::::::::::::! 9 .2
"" : 3 8 2: : s so
! 7 6-i 7 5
I 70•;.:.... •;:: 170
I 70• . :.. 1 6 9
I 693685 6 7
-::::... " ::.. : :::.J 6 7-:::::::: ::::: : :::::J 6 7
.1661661653 64
.:: : J6 4:::::::::::::::::::::::::::::::::::::::a6 4
:: : : 16 3" j 6 3
163":::.. 3 63
:::• :..:: : :::J 6 3::::::::::::::::::::::::::::::::::::::3 6 3
! 6 2"•:: "le i
161"' : "16 1
: : : :..ie i:::::::::::::::::::::::::::::::::::] 6 0
3 60559159I 5 8I 5 8
:::::::::::::::::::::::::::::::::::] 5 8. I 58
: 15 8357
:: ::ii 5 7_ " 3 5 6
3 5 63 5 6j 5 5J55
' ! 5 5" " " 15 4
Botswana 50.Colombia 52.
Chad 53.Sri Lanka 53.
Cyprus 53.Greece 56.
Czech Rep. 56.Jordan 56.
S. Africa 56.Poland 60.Ghana 60.Gabon 62.Kenya 63.
Venezuela 63.India 63.
Bangladesh 66.Mali 67.
Malawi 67.Tunisia 67.
Israel 70.Sierra Leone 70.
Bulgaria 70.Cameroon 70.
Turkey 70.C African 70.
Senegal 76.Madagascar 77.
Benin 77.Egypt 77.
Nigeria 80.Morocco 80.Rwanda 82.Uganda 82.
Tanzania 82.Slovakia 82.
Togo 86.Niger 86.
Zambia 86.Nepal 86.
Congo 90 .Zimbabwe 91 .
Hungary 92.Nicaragua 93.
Brazil 93.Burundi 95.
Cote d'lvoire 95.Romania 97.
Haiti 97.Syria 99.Iran 100.
Algeria 100.Zaire 102.
Somalia 103.
. ...
... .
.
• — - . . ,
i i i
HN/R
I 1 1 1 1
% 5.4T : i 5.3:::::::::::::::™;-| b. o
i 5. 0ZIZZZJb.0
1 4.9:::::::::::....::::i 4.9
14.9::: : : i 4.9
•••3 4 8
3 4.8_ J 4 V
14 5_ l 4 . b
I4.b14.4
Z Z _ J 4 334 3
__J43™~~~!42
. ,,! 4 2~"TZZ142'.'."" ! 4 7
1 14 2"™~142
. 14 1Z Z Z D 4 0' .....'" 3 4 0ZZU40
! 3 9i 3 937
l-AfZZD3/
37ZZ336— 1 3 ( 5
3 3 63365
'3 3 b34
~ 13 3.. 133Z Z ] 3 3•^"132ZZ332ZH29~~129Z126121321]1 9
Note: Chapter 1 explains how this rating was derived. Se e Exhibit 2-1 for information on the componentsthat underlay the rating. I n the judgment of the authors, the Is1 index is the most reliable indicator ofdifferences in economic freedom across a wide range of countries.
XXI
www.fraserinstitute.org

Exhibit S-2: The 1995 Economic Freedom, Grade Level Per CapitaGDP, and Growth
A. Averag e Per Capita GDP by1995 Economic Freedom Grade
The graph at the right indicatesthe average per capita GDP ofcountries grouped according totheir 1995 economic freedomgrade. On average, countries withmore economic freedom havea higher per capita GDP. (The GDPfigures are derived by thepurchasing power parity method,Summers and Heston, Penn WorldTables data). They are measuredin 1985 U.S. dollars.
20
3 15
&o 10S 8
o<u 50.
$13,659
F- F D C B A1995 Economic Freedom Grade
B. Th e Average Growth Rate of PerCapita GDP Between 1980 and 1994by 1995 Economic Freedom Grade
Here we illustrate the annualgrowth rate of per capita GDPby economic freedom grade. Notonly do countries with moreeconomic freedom have a higherper capita GDP (see above),they also generally grow morerapidly.
F- F D C B A1995 Economic Freedom Grade
xxn
www.fraserinstitute.org

Exhibit S-3: The Income Levels and Growth Rates of Persistently High and PersistentlyLow Rated Countries
As the graphs below indicate, countries with persistently high economic freedom ratingsduring the last two decades have a very high per capita GDP while those with persistentlylow ratings have extremely low incomes. The growth rates of the persistently high-ratedgroup are also positive, while those for the low-rated group are low and often negative.
Persistently High-rated Countries: 1975-1995
1994 Per Capita GDP0 5 1 0 1 5 2 0 2
Hong Kong
Switzerland
Singapore
United States
Canada
Germany
IHiH^HIHH$1? '832
H H H H | $15,980
H | H | H | H $14,415
l i ^ H H H i l H i $18,850H H H H I i H I $17,510m m m $15,005
Persistently Low-rated Countries: 1975-1995
1994 Per Capita GDP
Somalia
Zimbabwe
Growth of Per Capita GDP 1980-940 3 6
Hong Kong •
Switzerland H
Singapore H
United States •
Canada 1
Germany 1
HHH^HH||^HH| 5.0
Ho.8
HHHHHH53
I ^H 1.6[HI 1.3| H H | 1.8
Growth of Per Capita GDP 1980-94- 6 - 3 0 3
Somalia
Zambia
Hungary
Romania
Brazil
Syria
Uganda
Zaire -
Zimbabwe -
-3.7
-2.0
-2.1
-2.3
-0.7
0.2
0.1
| 0.2
l o . 4
Note: The countries with a grade of A or B in 1995 and a ranking in the top 15 in the other yearscomprise the persistently high-rated group. Countries with a summary economic freedom rating (Isl) ofless than 4.0 for every year throughout the 1975-1995 period comprise the persistently low-rated group.See Exhibits 2-3 and 4-2 for additional details. The GDP per capita figures (measured in 1985 U.S.dollars) are updates of the Summers and Heston data. They were derived by the purchasing power paritymethod.
xxin
www.fraserinstitute.org

Exhibit S-4A: The Economic Freedom Ratings (Is1) During 1975-1995 andGrowth Rate for High-Rated Non-Industrial Economies
Hong Kong
Singapore
Malaysia
Thailand
12
c? 8toa:"w 4
n
12
D) gc 8
••(0
or5 4
n
12
Rat
ing
00
w 4
0
Economic Freedom Rating
9 2 9. 4 9. 5 9. 3 9 1
Hill1975 198 0 198 5 199 0 199 5
Year
S 1 2
o•f 8coO
0 Aa. 4
c
jk 0
Economic Growth
^ ^ ^ 5. 7
O 1975-8 5 1985-9 4Year
8 0 8 5 8. 2•mi1975 198 0 198 5 199 0 199 5
Year
S 1 2n
hg. i
n P
er C
apita
<o
A
co • 1
° 1975-8 5 1985-9 4Year
7.1 7. 1 7. 0_ _ • • ••III!• • • • • i1975 198 0 198 5 199 0 199 5
Year
Q . 1 2
oen
r Cap
itC
O
CU A
a. 4
4.2 5 °
^0LM_MJ° 1975-8 5 1985-9 4
Year
12
Is1 R
atin
g.&
. C
O
U
R , 7. 0
4.9 5.0 5-3 • • ^Mmil1975 198 0 198 5 199 0 199 5
Year
OCO
I. 8CO
O(D 4.EO) o
7.6
M lO 1975-8 5 1985-9 4
Year
XXIV
www.fraserinstitute.org

Exhibit S-4B: The Economic Freedom Ratings (Is1) During 1975-1995 andGrowth Rate for Low-Rated Non-Industrial Economies
Economic Freedom Rating Economic Growth
Brazil
1975 1980 1985 1990 1995
Syria
Algeria
Nigeria
1975 1980 1985 1990 1995 1975-85 1985-94
1975-85 1985-941975 1980 1985 1990 1995
1975 1980 1985 1990 1995 1975-85 1985-94
XXV
www.fraserinstitute.org

Exhibit S-4C: The Economic Freedom Ratings (Is1) and Growth Rates ofLess-Developed Economies That Became More FreeDuring 1975-1995
Economic Freedom Rating
Chile
Portugal
•nil1975 1980 1985 1990 1995
1975 1980 1985 1990 1995
PakistanU)
tin
CO cQL 5
n
2.33.5
13.9
14.2
I5.4•1
1975 1980 1985 1990 1995
Year
Mauritius
Is1 R
atin
g
10
5
0
' 3. 9
11975
3.8
11980
6.0
|
1985Year
5.6
11990
6.3
I1995
Economic Growth
Q- 10QO
Cap
itaU
l
Per
c
_g> 0o
4.8
2.4 ^ ^ |
LJBHL^^BJ1975-85 1985-9 4
Year
Q_ 1 nQ 1 0
Ba.COO 5Q5Q.c
F oo
3.3
1.8 ^^M
_^H_HLJ1975-85 1985-9 4Year
fe10o
Cap
itaU
l
Per
c
°> 0o
5.6
2.8 ^^M
LJHH_^HJ1975-85 1985-9 4
Year
XXVI
www.fraserinstitute.org

Exhibit S-4D: The Economic Freedom Ratings (Is1) and Growth Rates ofLess-Developed Economies That Became Less FreeDuring 1975-1995
Venezuela
Economic Freedom Rating
10
(DQL
-5
6.9 6.65.2 5.5 4.5
1975 1980 1985 1990 1995
Year
Economic Growth
Honduras
Iran
Nicaragua
6.1 6.0 6.0
1975-85 1985-941975 1980 1985 1990 1995
2.5 2.7 3.2
1975-85 1985-9 41975 1980 1985 1990 1995
1975-85 1985-941975 1980 1985 1990 1995
XXV11
www.fraserinstitute.org

Exhibit S-5: Growth Rates During 1980-1994 of the Ten Countries with the LargestIncreases and Largest Declines in Economic Freedom During 1975-1990
Change in Per Capita GDPBetween 1980 and 1994
Ten Countries with Larges tIncrease in Economic Freedo mRatings: 1975-199 0(Change in Is1 rating in parentheses. )
All of these countriesachieved positive growth rates.Their average increase in percapita GDP was 2.7%. (SeeExhibit 4.3 for additionaldetails.)
(2.9) Chile
(2.0) Jamaica
(2.0) Iceland
(2.0) Malaysia
(1.9) Turkey
(1.9) Pakistan
(1.8) Egypt
tie (1.7) Portuga l
tie (1.7) Japan
tie (1.7) Singapore
tie (1.7) Mauritius
tie (1.7) New Zealand
1 1 1
• 0. 8• 0. 9
• 1 1. 2
2.8
•2.8
2.7
1
2.9
••
1
4.1
| 5. 3
| 4. 8
-6 -3
Ten Countries with Larges tDecline in Freedom Ratings:1975-1990(Change in Is1 rating in parentheses.
Nine of the 11 countries withthe largest declines in economicfreedom during 1975-1990 alsoexperienced declines in percapita GDP. On average, theirper capita GDP declinedapproximately 1% annuallyduring 1980-1994. (SeeExhibit 4-4 for additionaldetails.)
tie (-0.7) Panama
tie (-0.7) Morocco
(-0.8) Algeria
(-1.0) Tanzania
(-1.1) Zambia
(-1.2) Congo
(-1.4) Venezuela
(-1.4) Honduras
(-1.8) Iran -
(-1.8) Somalia -
(-4.4) Nicaragua \- -3. 3
-0.6
-0.6
-2.1m
-0.7
-1.2m
-0.7 I
-0.2
-2.0
0.4
I 0.6
XXVlll
www.fraserinstitute.org

Exhibit S-6: The Growth of Per Capita GDP During 1980-1990 for the Countries That Had aOne Unit Increase in the Is1 Economic Freedom Rating Between 1975 and1985 (and Maintained that Increase into the 1990s) Compared to the Growthof Countries with a One Unit Decline During 1980-1990
Growth of Per CapitaGDP 1980-199 0
Countries with a One UnitIncrease in Is1 IndexBetween 198 0 and 1990(Change in Is1 rating in parentheses.)
All nine of the countrieswith a unit increase between1980 and 1990 achieved positivegrowth rates. Their averageincrease in per capita GDP was3.1%. (See Exhibit 4.5 foradditional details.)
-6
Countries with a One UnitDecline in Is1 IndexBetween 1980 and 1990(Change in Is1 rating in parentheses. )
Among the nine countries witha one unit or more decline ineconomic freedom between 1980and 1990, only Tanzania wasable to achieve a positivegrowth rate. The average forthese countries was minus 1.3%.(See Exhibit 4-5 for additionaldetails.)
Note: Se e Exhibits 3-3 and 4-5 for details.
(-1.0) Syria
(-1.1) Algeria
(-1.3) Bolivia
(-1.4) Tanzania
(-1.4) Honduras -
(-1.5) Somalia
(-1.7) Venezuela
(-2.5) Iran
(-4.6) Nicaragua
-1.2
-0.1
-2.4
-0.9
-1.2
-1.8
-1.1
- -3. 7
0.6
XXIX
www.fraserinstitute.org

Exhibit S-7: Changes in the Average Country Rating for the SummaryIndexes and the Components: 1975-1995
A: Average Summary Rating of Countries, 1975-1995
The average country rating increasedby only a small amount (0.3 or less)between 1975 and 1985, but it rose bya larger amount (approximately 1.0)between 1985 and 1995. (Note thateach of our three indexes followed thissame pattern.) This suggests thatthere has been a modest move towardeconomic freedom during the lastdecade.
Summary Index Is1
Average Country Rating2 4 6 8
1975
1980
1985
1990
1995
Summary Index le Summary Index Is2
c
1975
1980
1985
1990
1995
Average Country Rating) 2 4 6
1 | |
^ ^ ^ ^ ^ 4 . 1
^ ^ ^ ^ ^ ^ ^ ^ ^ 4 . 4
^ ^ ^ ^ ^ ^ ^ ^ • 4 . 7
^ ^ ^ ^ ^ ^ ^ ^ ^ 1 5'2
8 1I
Average Country Rating2 4 6
1975
1980
1985
1990
1995
3.9
4.1
10
xxx
www.fraserinstitute.org

B. Averag e Component Rating of Countries:
IA: Money
0
1975 •1985 •1995 •
Expansion
Average2 4
1Country Rating
6 8 1 0
IIH3.6• • 1• • 1
• 5.114.2
| IC:ForeignCurrency Accounts jAverage Country Rating
0 2 4 6 8
ID: Deposits Abroad I
MA.: Government Consumption
IB: Inflation Variability!
0
1975 •1985 •1995 •
Average Country Rating2 4 6 8 1 0
•••3.8•^• •5 .1
10
0
1975 •1985 •1995 Hj
Average2 4
H i 2.5^•2.8
•H
Country Rating6 8 1
(J5.0
Average Country Rating0 2 4 6 8 1 0
1975 flH||
1985 i ^ m1995 H |
^ 5 . 3
^••5.0HH|4.8
IIB: Government Enterprises \
Average Country Rating0 2 4 6 8
1975
IF: Credit Market)
IIIB: Margina l Tax Rates [Average Country Rating
0 2 4 6 8
10
Average Country Rating0 2 4 6 8 1 0
1975 i m1985 p H1 9 9 5 l | ^ |
^••4.8• • •wmmmI7-1
H7'6
IIIA:
0
1975 1
1985 1
1995 1
Transfers & Subsides |Average Country Rating2 4 6 8
•1HM5.9••^••5.0• • • 1 4 . 9
10
10
NIC:
1975
1985
1995
Conscription jAverage Country
0 2 4 6
Hm^i4.9
HUH4-1
IHHH4'3
Rating8 1 0
XXXI
www.fraserinstitute.org

Exhibit S-7: (con't)
IVA:
1975
1985
1995
Trade Taxes |Average
0 2 4
—
^ Bmm
Country6
14.4
I5'1• •
Rating8
6.4
10
|lVC:
1975
1985
1995
Size
0
•i•
of Trade Sector |Average Country2 4 6
HI^Hfl4.9^^^^•5.0
^HHH4'8
Rating8 1 0
IVB
1975
1985
1995
: Exchange Rate Controls |
Average0 2 4
—
Sm
Country Rating6 8 1 0
• I 5.4([5.0
H^HI75
IVD: Capital Mobility Restraints IAverage Country Rating
0 2 4 6 8 1 0
The component ratings indicate that the major areas of improvement during the last 20 years were greaterprice stability (IB), increased freedom to maintain foreign currencies both domestically and abroad (IC andID), more orderly credit markets, lower marginal tax rates (since 1985), lower taxes on international trade(IVA), relaxation of foreign exchange controls (since 1985), and fewer restrictions on capital mobility.Larger government consumption and transfer sectors (IIA and III A) were areas of declining economicfreedom.
Note: See Exhibit 3-6 for additional details.
xxxii
www.fraserinstitute.org

INTRODUCTION:
The Historical Development of TheEconomic Freedom Index
by Michael A. Walker
The current volume is the culmination of a process whichbegan at the 1984 meetings of the Mont Pelerin Society inCambridge, England. In the course of a comment on a paper byPaul Johnson, I made reference to the famous passage in Capitalismand Freedom written by Milton Friedman and Rose Friedman, inwhich the authors note that, "Historical evidence speaks with asingle voice on the relation between political freedom and a freemarket. I know of no example in time or place of a society thathas been marked by a large measure of political freedom, and thathas not also used something comparable to a free market toorganize the bulk of economic activity."
There then ensued a discussion about the relationshipbetween economic and political freedom led by the late Max Thurn,a long time member of the Society. It became clear during thecourse of this discussion that while Milton and Rose Friedman'scomment had been extant for three decades there had been noserious attempt to explore the relationship between economic andpolitical freedoms in a scholarly way. At the meeting I approachedMilton and Rose Friedman to invite them to co-host a symposiumto investigate these relationships. They agreed and subsequentlyDr. Neil McLeod, President of the Liberty Fund, Inc. ofIndianapolis agreed to provide the funding to bring a group ofdistinguished economists from all over the world to the NapaValley, California in 1986.
The proceedings of this first symposium were published ina book which I edited entitled, Freedom, Democracy and EconomicWelfare, published by the Fraser Institute in 1988. Meanwhile,Alvin Rabushka, Milton Friedman's colleague at the HooverInstitution who had been concerned about these issues for nearly adecade because of his direct involvement in the study and
www.fraserinstitute.org

documentation of the economic development of Hong Kong, helda series of Liberty Fund conferences. One, on "Taxation andLiberty" was held in Santa Fe, New Mexico in 1985 and anotheron "Taxation, Democracy, and Threats to Liberty" in Savannah,Georgia in 1987. Alvin Rabushka was also a participant in the1986 Napa Valley Conference and he was to play a central role indeveloping the symposium series.
Milton Friedman had suggested to me that I should inviteto the first meeting in the Napa Valley a representative fromFreedom House because they had expanded their 1982 AnnualReport on political and civil liberties around the world to include,on an experimental basis, ratings for economic freedom. RaymondGastil, then the President of Freedom House and Lindsay Wright,a young economist working for the organization, came andpresented a paper on their findings on economic freedom at thefirst conference.
As Gastil and Wright shared their views on economicliberty, it was obvious that they differed significantly from those ofmost conference participants. The Gastil-Wright approach reflectedthe Freedom House perspective that democratic political proceduresand civil liberties were the most important aspects of freedom.According to this philosophy, highly progressive taxation and largeincome transfers are entirely consistent with individual liberty, ifpolicies in these areas are approved by democratic majorities oflegislative bodies.1 Several of the participants in this firstconference, including myself, Walter Block, and Alvin Rabushka,believed that the Freedom House approach trivialized and distortedeconomic freedom, making it dependent on the political process.We came away even more convinced that development of a soundmeasure of economic freedom was a vitally important project.
My colleague Walter Block and Alvin Rabushka had asubsequent meeting in which they decided to suggest that a seriesof follow up symposia be held in order to explore the weaknessesof the Freedom House approach and to develop an index ofeconomic freedom that was consistent with the history and propermeaning of economic liberty. The long term objective would beto develop a measure of economic freedom that would be publishedon a regular basis just like the Freedom House's annual survey ofpolitical and civil liberties.
www.fraserinstitute.org

It was then left for me to persuade Milton and RoseFriedman to co-host a series of symposia to properly elucidate thesubject and to persuade the Liberty Fund to provide the financing.The new President of Liberty Fund, Inc., Mr. W. W. Hill was quiteexcited by the project, could see its implications, and happilyagreed to fund a further five meetings in which internationalexperts would build up an intellectual base from which the indexmight be formed.
The second conference of the series was held in Vancouverin July of 1988 and centred on a paper presented by AlvinRabushka on how economic freedom should be defined.2 Buildingon the work of John Locke, Adam Smith, Milton Friedman, MurrayRothbard, and his own extensive empirical and theoretical analysis,Rabushka examined the attributes of economic freedom and thenature of policies consistent with that freedom. He argued thatprivate property and rule of law provided the foundation—theinstitutional basis—for economic freedom. Rabushka applied theconcept of economic freedom to five basic areas—taxation, publicspending, economic regulation of business and labour, money, andforeign trade—and outlined some ideas about how it might bemeasured in each of these areas. This work proved to be quiteimportant in focusing subsequent discussion at the other symposia.
Also at the second meeting came the first attempt to provideempirical measures with a paper by Zane Spindler and Laurie Still.In their paper they added to the taxonomy suggested by AlvinRabushka and provided a first-cut try at evaluating the FreedomHouse Index and adding to it a measure of freedom based oninvoluntary military service and freedom of foreign trade andinvestment. One of the consequences of the discussion of thispaper was the suggestion that all of the participants produce a listof factors that they felt should go in to an index of economicfreedom and there resulted a list of indicators which might be usedfor this purpose.
The third meeting was held in 1989 at Banff, Alberta andrepresented the first real attempt to construct both theoretical andempirical measures which were derived from the principlessketched out by Rabushka at the second session. Sectoral papersexplored the construction of indices for labour markets,international trade and money markets. The discussions weremostly interesting for the direction they would provide for the
www.fraserinstitute.org

papers presented at the fourth meeting held at Sea Ranch,California in 1990.
The fourth symposium saw the investigation proceed to amuch higher level of understanding both empirically andtheoretically. A theoretical paper by Ronald Jones and Alan C.Stockman built upon two papers by Stephen Easton to specificallyconsider freedom as part of the standard economic model. Theiranalysis put to rest a confusion which often attends suchdiscussions and that is the difference between wealth and freedom.They showed that there could simultaneously be a reduction infreedom and an increase in wealth.
Also at the fourth symposium there was the beginning of theindex which is presented in this book. James Gwartney workedwith Walter Block and Robert Lawson to produce the firstcomprehensive index which ranked 79 countries in the sectorswhich Rabushka had outlined and which were further discussed atthe third symposium. The fourth symposium also involved, in apaper by Zane Spindler and Joanna Miyake, the consideration ofthe list of indices of freedom which had been devised during thesecond symposium.
One of the most interesting aspects of the fourth symposiumwas a survey of economic freedom conducted by Milton and RoseFriedman. Each of the symposium participants was asked to rank11 countries which would be familiar to all participants. Miltonand Rose then analyzed the ranking during the evening andpresented it the following day. This simple survey and analysis ofit proved to be quite helpful in discovering the dispersion ofestimates of the freedom of countries that were neither very freenor very unfree but somewhere in between. The classic problemof distinguishing amongst things that are similar was also seen toplague the task of measuring freedom.
One of the conclusions that emerged from the Sea Ranchmeeting was that there are two ways in which to construct an indexof freedom. The "low tech," judgmental way in which a numberof individuals are asked to provide their subjective ranking of agroup of countries and the "high tech" way in which a largenumber of criteria, based on a series of measurable quantities, areapplied to produce the rating.
www.fraserinstitute.org

By way of testing further the low tech approach, it wasdecided to have a future meeting consider a group of countries andto have individuals who were familiar with the countries rank themon a freedom scale. The fifth symposium held in 1991 at MontereyCalifornia focused on a series of papers which had been constructedin this way. Essentially, groups of respondents in Asia, LatinAmerica, Africa, Europe and North America were asked to rankcountries in their region as well as countries outside their regionwhich were common to all of the lists. In this way it was hopedthat an integrated picture might emerge of the economic freedomrankings of all countries considered.
While this exercise produced some interesting insights, ingeneral it was found that respondents did not possess enoughinformation about the countries they were asked to rank and it wasquite difficult to find people in a given region who wereknowledgeable about more than one or two countries. While therewere many interesting insights generated from the various regions,it did not prove possible to derive a coherent index from thecomponents.
In a separate survey conducted by Stephen Easton andmyself, members of the Mont Pelerin Society were also asked torank countries in their region and this survey did prove to becoherent. However, it was in general felt that more success mightbe achieved by reverting to the "high tech" method and the use ofmany index series for each country which Gwartney, Block andLawson had begun in the fourth session. This objectification of themeasurement process would overcome the problems of subjectivityand the difficulty of finding knowledgeable people to do the rating.
However, a serious problem remained. Namely, to find theweights that should be attached to the various data series in theGwartney, Block and Lawson index. In partial response to therecognition of this problem, Easton and I undertook another surveyof the Mont Pelerin Society membership in which we asked therespondents to rank each country's performance in a number ofgeneral areas such as international trade, monetary freedom, etc.The sixth symposium focused entirely on the revised Gwartney,Block and Lawson paper and the second paper which Easton andI had constructed.
The sixth symposium was held in Sonoma California in1993 and the focus of discussion was a greatly revised Gwartney,
www.fraserinstitute.org

Block and Lawson paper and the paper Easton and I had written toreport the results of our second survey. Many suggestions forimprovement were advanced and a number of approaches to theproblem of weighting the components of the index were discussed.The Index of Freedom which is presented in this volume reflectsthe valuable contributions of the participants toward resolving thedifficulties which were identified.
All told, 61 people have contributed to the Rating EconomicFreedom program of the Fraser Institute. We feel that it would beappropriate to acknowledge their contribution to the process andthey are therefore named at the end of this introduction. However,it goes without saying that they are not responsible for the resultingindex nor do they necessarily endorse it or its implications.
Recently, the Heritage Foundation of Washington, D.C., haspublished an index of Economic Freedom. There is some question,therefore, as to why we should produce another, seeminglycompeting index. The answer is simple.
First of all, as The Heritage Foundation was careful to notein their publication, the research which has been produced by theRating Economic Freedom Project of the Fraser Institute is of afundamental kind and attempts to deal with the key methodologicalissues involved in the creation of such an index. The HeritageFoundation index reflects some of this research but is not ascomplete or as comprehensive as the index published here. It ishoped that the Heritage Foundation will incorporate the advancesin the state of research which are reflected in this index.
Secondly, this index provides a historical measurement ofeconomic freedom. It is possible therefore to use this index toundertake analysis of the relationship between economic freedomand other variables through time. This is a very importantconsideration.
Finally, we believe that this index represents the "state ofthe art" in the measurement of economic freedom and that itestablishes both a new bench mark for economic freedom and anew starting point for research that will improve our understandingof this vital aspect of the human condition.
www.fraserinstitute.org

Endnote:
1. For the presentation of this view, see Lindsey M. Wright, "A ComparativeSurvey of Economic Freedoms" in Freedom in the World: Political Rights andCivil Liberties, 1982, ed. Raymond D. Gastil (Westport and London: GreenwoodPress, 1982), pp. 51-90 and Raymond D. Gastil and Lindsey M. Wright, "TheState of the World: Political and Economic Freedom," in Freedom, Democracyand Economic Welfare, ed. Michael Walker (Vancouver: The Fraser Institute,1988), pp. 85-119. For a detailed criticism of this view, see Alvin Rabushka"Freedom House Survey of Economic Freedoms," in Economic Freedom: Towarda Theory of Measurement, ed. Walter Block (Vancouver: The Fraser Institute,1991), pp.57-71.
2. For those interested in the papers and a summary of the discussion from theentire Fraser Institute/Liberty Fund series, see Michael A. Walker, ed., Freedom,Democracy, and Economic Welfare, (Vancouver: Fraser Institute, 1988); WalterBlock, ed., Economic Freedom: Toward and Theory of Measurement,(Vancouver: Fraser Institute, 1991); and Stephen T. Easton and Michael A.Walker, eds., Rating Global Economic Freedom, (Vancouver: Fraser Institute,1992).
www.fraserinstitute.org

Participants in Fraser Institute/Liberty Fund Series:
James AhiakporProfessor of EconomicsCalifornia State Universityat Hayward
Armen AlchianProfessor of EconomicsUniversity of Calif.—LosAngeles
Peter BauerProfessor Emeritus ofEconomicsLondon School ofEconomics
Gary S. BeckerProfessor of EconomicsUniversity of Chicago
Juan F. BendfeldtExecutive SecretaryCentro de EstudiosEconomico-SocialesGuatemala
Walter BlockProfessor of EconomicsCollege of the Holy Cross
Jack CarrInstitute for Policy AnalysisUniversity of Toronto
John F. ChantProfessor of EconomicsSimon Fraser University
Edward CranePresident, Cato Institute
William C. DennisLiberty Fund, Inc.
Arthur T. DenzauProfessor of EconomicsWashington University
Governor Ramon P. DiazCentral Bank of Uruguay
Thomas J. DiLorenzoProfessor of EconomicsLoyola College—Baltimore
Stephen EastonProfessor of EconomicsSimon Fraser University
David FriedmanUniversity of Chicago LawSchool
Milton FriedmanThe Hoover InstitutionStanford University
Rose FriedmanThe Hoover InstitutionStanford University
Raymond GastilFreedom House
John C. GoodmanPresident, National Centerfor Policy Analysis
John G. GreenwoodChairman/Chief EconomistG.T. Capital Management
www.fraserinstitute.org

Herbert GrubelProfessor of EconomicsSimon Fraser University
James D. GwartneyProfessor of EconomicsFlorida State University
William HammettManhattan Institute
Arnold HarbergerProfessor of EconomicsUniversity of Chicago
W.W. HillLiberty Fund., Inc.
Edward L. HudginsHeritage Foundation
Ronald W. JonesProfessor of EconomicsUniversity of Rochester
Professor Brian KantorProfessor of EconomicsUniversity of Capetown
Henry KierzkowskiProfessor of EconomicsGrad. Inst. of InternationalStudiesGeneva, Switzerland
Henri LePagePresident, Institut deL' EntrepriseParis, France
Robert LawsonProfessor of EconomicsShawnee State University
Assar LindbeckProfessor of EconomicsInst. for InternationalEconomic StudiesUniversity of Stockholm
Tibor MachanProfessor of PhilosophyAuburn University
Henry MarineDean, School of LawGeorge Mason University
Antonio MartinoProfessor of EconomicsUniversity of Rome
Hugo MaulProfessor of EconomicsCentro de EstudiosEconomico-SocialesGuatemala
Richard B. McKenzieProfessor of EconomicsGraduate School ofManagementUniversity of California,Irvine
Charles MurrayAmerican EnterpriseInstitute
Douglass C. NorthProfessor of EconomicsWashington University
Simon OgusG.T. Management (Asia)LimitedHong Kong
www.fraserinstitute.org

Filip PaldaProfessor of EconomicsEcole nationaled'administration publiqueMontreal, Quebec
Ellen PaulProfessor of PhilosophyBowling Green StateUniversity
Michael ParkinProfessor of EconomicsUniversity of WesternOntario
Gramoz PashkoDeputy Prime MinisterGovernment of Albania
Svetozar PejovichProfessor of EconomicsTexas A & M University
Sally PipesPresident, Pacific ResearchInstitute
Robert PooleEditor, Reason
Alvin RabushkaThe Hoover InstitutionStanford University
Gerald RadnitskyProfessor of PhilosophyUniversity of Trier
Richard W. RahnPresident, Novecon Corp.
Alan ReynoldsHudson Institute
Gerald W. ScullyProfessor of EconomicsSchool of ManagementUniversity of Texas atDallas
Bernard SieganProfessor of LawUniv. of San Diego Schoolof Law
Zane SpindlerProfessor of EconomicsSimon Fraser University
Ingemar StahlProfessor of EconomicsUniversity of LundLund, Sweden
Alan C. StockmanProfessor of EconomicsUniversity of Rochester
Richard L. StroupProfessor of EconomicsMontana State University
Melanie TammenCato Institute
Gordon TullockProfessor of EconomicsUniversity of Arizona
Michael WalkerExecutive DirectorFraser Institute
Sir Alan WaltersThe World Bank
Lindsay WrightFreedom House
10
www.fraserinstitute.org

CHAPTER 1
Construction of theEconomic Freedom Index
Measurement is the making of distinction; precisemeasurement is making sharp distinctions.
-Enrico Fermi
Most people prefer to choose for themselves. This indicatesthat freedom, including economic freedom, has intrinsic value.Adam Smith noted that human beings have a natural inclination to"truck and barter." Restrictions on the freedom to choose andengage in voluntary exchange deny human beings something theyvalue—something that is an integral part of their humanity. Inaddition, economic theory indicates that economic freedom affectsincentives, productive effort, and the effectiveness of resource use.Since the time of Smith, economists have argued that the freedomto choose, supply resources, compete in business, and trade withothers is a central ingredient—perhaps the fundamental element—ofeconomic progress.
If economic freedom is this important, why have weinvested so little time attempting to measure it? The obviousanswer is that economic freedom is multi-dimensional and thereforeits measurement is a difficult—some would say impossible—task.These same arguments were presented prior to the development ofthe national income accounts used to measure gross domesticproduct. Of course, there is a parallel here. Since most thoughtmeasurement of output with any degree of accuracy was animpossible task, it was 150 years after Smith's Wealth of Nationsbefore a comprehensive measure was developed.
If we are unable to measure economic freedom, we are ina poor position to judge its significance as a source of progress.Clearly, the degree of economic freedom present is influenced bynumerous factors. No single statistic will be able to fully captureall of them and their interrelations. However, we believe that it ispossible to devise measures and develop indicators that will capture
www.fraserinstitute.org

the most important elements of economic freedom and provide areasonably good measure of differences in economic freedomacross countries and time periods.2 As the quotation of ProfessorFermi indicates, measurement involves making distinctions. Whensomething is difficult to measure precisely, the distinctions may notbe as refined as we would like. This is the case with economicfreedom. The measures developed in this study might best beviewed as approximations rather than precise measures. Therefore,small differences between countries and across time periods shouldnot be taken very seriously.
This chapter addresses three topics. We begin with adiscussion of the concept of economic freedom. The secondsection describes the various components of our indexes andindicates how the economic freedom ratings for each of thecomponents are derived. The final section considers the problemsthat arise when the components are aggregated into a summaryindex and explains how the three summary indexes of economicfreedom are derived.
An index ofeconomic freedomshould measure theextent to whichrightly acquiredproperty is protect-ed and individualsare free to engagein voluntarytransactions.
THE CONCEPT OF ECONOMIC FREEDOM
The central elements of economic freedom are personalchoice, protection of private property, and freedom of exchange.Individuals have economic freedom when (a) property they acquirewithout the use of force, fraud, or theft is protected from physicalinvasions by others and (b) they are free to use, exchange, or givetheir property to another as long as their actions do not violate theidentical rights of others. Thus, an index of economic freedomshould measure the extent to which rightly acquired property isprotected and individuals are free to engage in voluntarytransactions. In an economically free society, the fundamentalfunction of government is the protection of private property and theenforcement of contracts. When a government fails to protectprivate property, takes property itself without full compensation, orestablishes restrictions that limit voluntary exchange, it violates theeconomic freedom of its citizens.4
This concept of economic freedom reflects the prior workof others. Alvin Rabushka, a pioneer researcher and leadingscholar in this area, highlighted the relationship between privateproperty and economic freedom in the following manner:
12
www.fraserinstitute.org

Private property is the common denominator that underpinsevery liberal philosophical treatment of individual economicfreedom. John Locke regarded the existence of privateproperty as the proper condition of man in a state of nature;the primary function of civil society, to which man granted therights he enjoyed in the state of nature, was to protect andpreserve private property. Most important, the state has noright to take any part of a man's property without his consent.
Lindsey Wright of the Freedom House has also stressed thecentral role of private property. In the 1982 Freedom Houseannual report, she stated:
The freedom to have property and control its use isfundamental to the ability of individuals and groups to makeeconomic choices independent of arbitrary intervention byotherx6
Freedom of exchange and the autonomy of the individualare also integral elements of economic freedom. As AlvinRabushka put it:
The free and voluntary exchange of property titles goes handin hand with the rights of private property. Unless eachindividual controls the use of his property, including his rightto transfer it to another party in exchange for someconsideration, the notion of private ownership and use haslittle meaning. Thus, freedom of contract is inherent in privateproperty.... A free society affords every individual freedom ofcontract in contrast with, say, an aristocratic society in whichonly the nobility can enter into contracts to exchange titles.
It is useful to view economic freedom within the frameworkQ
of protective rights and intrusive rights. Protective rights provideindividuals with a shield against others who would invade and/ortake what does not belong to them. Since they are nonaggressionrights, all citizens can simultaneously possess them. In order tomaintain protective rights, preventing people from initiatingaggression against others is all that is required. In contrast,intrusive rights (or "positive rights" as they are sometimes called),such as a "right" to food, clothing, medical services, housing, or aminimal income level impose "forced labor" requirements on others.If A has a right to housing, for example, this logically implies thathe has a right to force B to provide the housing. But A has noright to the labor of B or any other individual. Thus, A cannotpossibly have a right to housing and other things that can only be
Intrusive rightssuch as a "right"to foody clothing,medical services,housing, or aminimal incomelevel impose"forced labor"requirements onothers. Alleged"rights" of this typeare simply dis-guised demands forthe forced transfersof income andwealth.
13
www.fraserinstitute.org

supplied if they are provided by other people. Intrusive rightstherefore conflict with economic freedom because such "rights"imply that some have a right to the labor and possessions of others.In reality, alleged "rights" of this type are simply disguiseddemands for the forced transfers of income and wealth.
It is important to distinguish economic freedom frompolitical and civil liberties. Political freedom has to do with theprocedures that are used to elect government officials and decidepolitical issues. Political liberty is present when all adult citizensare free to participate in the political process (vote, lobby, andchoose among candidates), elections are fair and competitive, andalternative parties are allowed to participate freely. Civil libertyencompasses the freedom of the press and the rights of individualsto assemble, hold alternative religious views, receive a fair trial,and express their views without fear of physical retaliation. Acountry may have a substantial amount of both political and civilliberty—it may be highly democratic and the major civil libertiesmay be protected—and still adopt policies that conflict witheconomic freedom. Countries like Israel, Sweden, and Indiaillustrate this point. Political and civil liberties are present in suchcountries, but nonetheless, their policies—for example, the levels oftaxation, government spending, and regulations—are often inconflict with economic freedom.
Our goal is toconstruct an indexthat is (a) a goodindicator ofeconomic freedomacross countriesand (b) based onobjectivecomponents thatcan be updatedregularly.
THE COMPONENTS OF OUR INDEXOF ECONOMIC FREEDOM
Our goal is to construct an index that is (a) a good indicatorof economic freedom across a large number of countries and (b)based on objective components that can be updated regularly. Tothe extent possible, we want to avoid having to make "judgmentcalls" when rating the policies, legal structures, and institutions ofa country.
As Exhibit 1-1 indicates, our index has 17 components thatare allocated to four major areas: (1) money and inflation, (2)government operations and regulations, (3) takings anddiscriminatory taxation, and (4) international exchange.9 Since wewant the ratings to be easily comparable across countries and time
14
www.fraserinstitute.org

periods, a zero to ten rating scale was used for each component inthe index. A ten represents the highest possible rating and a zerothe lowest.
Because the structure of the underlying data used to derivethe ratings was not always the same, three alternative methods wereused to derive them. A continuous variable provided the underlyingdata for seven of the components. When this was the case, the datafor 1985—our base year—were arrayed from the highest to thelowest values and divided into eleven groups containing an equalnumber of countries. Nations in those 11 groups were thenassigned ratings ranging from ten to zero. For example, if therewere 99 countries (for which the required data were available), thenthe nine countries that rated best in this category in 1985 wouldreceive a rating often, the next nine would receive a rating of nine,and so on. The cutoff points between groups in the 1985 datawere then used to rate each country in the other years (1975, 1980,1990 and 1995). To determine the interval cutoff points between,say, a ten and a nine rating, we calculated the midpoint in the 1985data between the country with the lowest ten rating and the countrywith the highest nine rating.
The advantage of using only the base year 1985 to derivethe conversion table is that this approach allows the ratings ofcountries to either improve or worsen in the other years. Thus,while the rating system judges countries relative to one anotherduring the 1985 base year, the rating of a country can move up ordown in the other years. If most countries improve (or regress)relative to the base year, this system allows their ratings to reflectthis improvement.
A binary variable provided the underlying data for three ofthe components. This would be the case, for example, when arestriction was either present or absent (or when an act was eitherlegal or illegal). If the condition consistent with economic freedomwas present, the country was assigned a rating of ten.Alternatively, if the condition was absent, the country was assigneda zero.
Finally, in some cases a classification-rating system wasdeveloped and underlying data used to classify and rate eachcountry. This method was employed when the underlying datawere multi-dimensional. For example, both the top marginal tax
15
www.fraserinstitute.org

Exhibit 1-1 : Component s o f the Index of Economic Freedo m
I. MONE Y AN D INFLATION (Protectio n o f money as a store o f value andmedium of exchange)A. Averag e Annua l Growt h Rat e o f the Money Suppl y Durin g the
Last Five Years Minu s the Potential Growth Rat e of Real GDPB. Standar d Deviatio n o f the Annual Inflatio n Rat e Durin g the Last
Five YearsC. Freedo m o f Citizens to Own a Foreign Currenc y Ban k Accoun t
DomesticallyD. Freedo m of Citizens to Maintain a Bank Account Abroad
II. GOVERNMEN T OPERATIONS AND REGULATION S (Freedom to decide whatis produced and consumed)A. Governmen t Genera l Consumption Expenditure s as a Percent of
GDPB. Th e Role and Presence of Government-Operated Enterprise sC. Pric e Controls—the Exten t that Businesses are Free to Set Their
Own Prices (Thi s variable i s included in only the 1990 and 199 5Indexes.)
D. Freedo m of Private Businesses and Cooperatives to Compete inMarkets (This variable is included only in the 1995 Index.)
E. Equalit y of Citizens Unde r The Law and Access of Citizens to aNondiscriminatory Judiciar y (Thi s variable is included only in the1995 Index. )
F. Freedo m from Government Regulation s and Policies that Caus eNegative Rea l Interes t Rate s
III. TAKING S AN D DISCRIMINATOR Y TAXATIO N (Freedo m t o kee p what yo uearn)A. Transfer s and Subsidies as a Percent of GDPB. To p Marginal Tax Rate (and income threshold at which it applies)C. Th e Use of Conscripts to Obtain Militar y Personne l
IV. RESTRAINT S ON INTERNATIONAL EXCHANG E (Freedom of exchange withforeigners)A. Taxe s o n Internationa l Trad e a s a Percen t o f Export s Plu s
ImportsB. Differenc e Betwee n th e Official Exchang e Rat e an d the Blac k
Market Rat eC. Actua l Size of Trade Sector Compared to the Expected SizeD. Restriction s o n the Freedo m o f Citizen s t o Engag e i n Capita l
Transactions with Foreigner s
rate and the income level at which the rate took affect were usedto rate tax structures. The various countries were placed into ratingcategories reflecting both of these variables. When this methodwas used, the zero to ten rating range was still retained.
16
www.fraserinstitute.org

The underlying data and the country ratings for each of the 17components are presented in the tables of Appendix II. (Note: thelabeling of the tables for each of the components presented inAppendix II matches the labels of Exhibit 1-1.) We now turn toa discussion of the components in each of the four major areas ofour index and the explanation of precisely how the country ratingsfor each of the 17 components were derived. We will begin withthe money and inflation area.
I. Money and Inflation
Since money plays such a central role in the exchange process,monetary institutions and arrangements exert an important impacton the security of property and freedom of exchange. Moneymakes it possible for people to engage in complex exchangesinvolving the receipt of income or payment of a purchase priceacross lengthy time periods. It also provides a means of storingpurchasing power into the future.
The relationship between monetary arrangements and policiesand economic freedom is a matter of some controversy. Somewould argue that any government action whatsoever in this areanecessarily conflicts with economic freedom.11 Proponents of thisview argue that if coinage of money and the business of bankingwere left completely to the private sector, firms would tie the valueof money they issue to precious metals (like gold and silver) andfollow strategies designed to maintain purchasing power stability inorder to protect their reputation (brand name) and the futuredemand for their product. According to this perspective, thecompetitive process would lead to monetary stability becausepeople would be reluctant to use money issued by institutions thatlacked credibility. In turn, the credibility of banking institutionswould be dependent upon their ability to develop and maintain amonetary unit with stable, predictable purchasing power.
Others argue that provision of a stable monetary framework isa legitimate function of government and if the government providesa stable monetary unit with predictable value, its actions areconsistent with economic freedom.12 The proponents of this viewoften argue for constitutional provisions that would commit themonetary authorities to stable money and limit their ability toexpand the supply of money.
Money makes itpossible for peopleto engage incomplex exchangesinvolving thereceipt of incomeor payment of apurchase priceacross lengthy timeperiods.
17
www.fraserinstitute.org

The generalingredients ofeconomic freedomin the monetaryarea are: (1) slowmonetary ex-pansion thatmaintains andprotects the valueof money, (2) pricelevel (or inflationrate) stability, and(3) the absence ofrestrictions limitingthe use of alter-native currencies.
There is some common ground between these two camps. First,both would agree that economic freedom is diminished whenmonetary disturbances and unexpected price changes alter the valueof money and the terms of time-dimension agreements involvingmoney. Such actions involve, in effect, the taking of property. Inmany such cases, wealth is taken from one private party and givento another. In other cases, it is taken from individuals andtransferred to the government.
Second, there is also widespread agreement that governmentactions which deter the use of alternative currencies infringe on thefreedom of contract and therefore economic freedom. The right oftrading partners to conduct their business affairs in any currency-domestic or foreign; private or issued by a government—is animportant right. Thus, laws conflict with economic freedom whenthey require trading partners to use a certain currency or prohibitthe ownership and use of alternatives. In turn, the freedom tomaintain and use alternative currencies limits the power of thenational monetary authorities. When trading partners can easilyshift to other means of exchange, they are better able to protectthemselves against a central monetary authority that followsinflationary and unpredictable policies.
Today, almost every government in the world issues money andoperates a central bank that conducts monetary policy. Therefore,if we want to establish gradations of economic freedom in this area,we must evaluate these policies. Our discussion highlights threegeneral ingredients of economic freedom in the monetary area: (1)slow monetary expansion that maintains and protects the value ofmoney, (2) price level (or inflation rate) stability, and (3) theabsence of restrictions limiting the use of alternative currencies.We proceed to an explanation of how the four monetarycomponents of our index were derived.
I-A: The Average Annual Growth Rate of the Money Supplyduring the last five years Minus the Annual Growth Rate ofPotential GDP.
Authorities that issue money have an implicit responsibility tomaintain the purchasing power of the outstanding units. When thesupply of a currency is increased rapidly relative to the availabilityof goods and services, wealth is taken from the people holdingmoney (and assets yielding a fixed nominal return). In essence,rapid growth in the money supply "waters down" the value of the
18
www.fraserinstitute.org

outstanding monetary units and thereby erodes its value. This iswrongful seizure of property. Therefore, countries with high ratesof monetary growth relative to real GDP are given low ratings.
Data Sources and Methodology. The compound average annualgrowth rate of the money supply (Ml) during the 5-year periodjust prior to each rating year minus the average growth of real GDPduring the last ten years was calculated. A country's real GDPgrowth rate during the last ten years was perceived to be a goodestimator for the growth of potential GDP. The money supply andGDP data were from the World Bank, World Tables, 1994 and theInternational Monetary Fund, Monthly International FinancialStatistics. The latter source was generally used to update the dataseries for the more recent years. The statistics for this measure ofmonetary growth are presented by country for each of the fiveperiods in Table I-A of Appendix II.
When a country's monetary authorities expand the moneysupply slowly (rapidly) relative to potential GDP, this variable willbe small (large) and the country will receive a high (low) rating.The data for the 1985 base year period were arranged in ascendingorder and divided into eleven groups of equal size. Since the 1985money supply data were available for 101 countries, the ninecountries with the lowest rate of monetary expansion were given arating of ten. The nine countries with the next lowest rate ofmonetary expansion were given a rating of nine, and so on. Themidpoints between intervals were then used to derive the range foreach of the zero-to-ten ratings for the 1985 base year. Thetransformation table containing these values is included in thesource note accompanying Table I-A (Appendix II). These base-year rating intervals were then used to assign ratings for the otherfour periods. These ratings are presented along with the actualmoney growth data for each of the five periods in Table I-A(Appendix II).
I-B: The Standard Deviation of Annual Inflation Rate duringthe last five years.
The efficacy of money is directly related to the stability of itsvalue. When the inflation rate is constantly changing in anunpredictable manner—when it is 10% in one year, 40% the next,and 20% the year after that, it is extremely difficult to plan for thefuture and undertake exchanges that involve a time dimension (e.g.,payment for the purchase of an automobile or house over a period
19
www.fraserinstitute.org

The efficacy ofmoney is directlyrelated to thestability of itsvalue.
of years). Since unpredictable changes in the rate of inflationundermine the efficacy of money, countries with the moststable—and therefore most easily predictable—rates of inflation aregiven the highest ratings. Correspondingly, countries with thehighest variability in their inflation rates are given the lowestratings.14
Data Sources and Methodology. Data for the GDP Deflatorfrom the World Bank, World Tables, 1994 supplemented withrecent data from the International Monetary Fund, MonthlyInternational Financial Statistics were used to calculate theinflation rate of each country by year. Then the standard deviationof the inflation rate was calculated for each 5-year period prior tothe rating year. Following the procedures adopted for continuousvariables, the base-year 1985 data were divided into elevenintervals of equal size and these intervals were then used todetermine the country ratings for each period. Data for both thestandard deviation of the inflation rate and the corresponding ratingby country for each of the five periods of our study are presentedin Table II-B of Appendix II. The conversion table derived fromthe base year data is also presented in the note at the end of thistable.
I-C: Freedom of Residents to Own Foreign MoneyDomestically.
Money offered by other monetary authorities is a substitute formoney issued by the government of a given country. Whenresidents are allowed to maintain bank accounts in foreigncurrencies, it is easier for them to avoid the uncertaintiesaccompanying an unstable domestic monetary regime. Thus,citizens have more economic freedom if they are allowed tomaintain domestic bank accounts in other currencies.
Data Sources and Methodology. The World CurrencyYearbook, which was published bi-annually throughout the 1975-1990 period contains a "front matter" table which lists each countryand indicates whether it is legal for the citizens of the country toown foreign currency bank accounts domestically. Thisinformation was used to rate each country for 1975, 1980, 1985,and 1990. An Annual Report, Exchange Arrangements andExchange Restrictions, published by the International Monetary
20
www.fraserinstitute.org

Fund, also provides information on the legality of foreign currencybank accounts for each country. The 1994 Report provided thesource for this component during the most recent period (1993-1995).
Since this is a binary variable—generalized holdings of foreigncurrency accounts are either legal or illegal—a country is given arating of 10 if citizen ownership of a foreign currency bank accountis legal. If such an account is illegal, the country is given a ratingof zero.
I-D: Freedom of Residents to Maintain Bank AccountsAbroad.
Ownership of a bank account abroad provides anotheralternative method of storing purchasing power for future use.From a security standpoint, this option may be preferable to thedomestic ownership of a foreign currency bank account because anaccount abroad is less vulnerable to confiscation by one's owngovernment. When the monetary arrangements of a country havea history of instability, many citizens may prefer to deposit theirfunds with a bank elsewhere. Freedom to own a bank accountabroad provides them with this option and thereby reduces theirgovernment's power to utilize monetary expansion as a method ofextracting wealth from them. Thus, countries that permit theircitizens to maintain bank accounts abroad are given a higher rating.
Data Sources and Methodology. As was the case for theprevious component, the International Currency Yearbook and theExchange Arrangements and Exchange Restrictions—Annual Reportare the source of this variable. When it is legal for the citizens ofa country to own a bank account abroad, the country is given arating of 10. When ownership of these accounts is illegal, thecountry is given a rating of zero.
II. Government Operations and Regulations
Market exchange is based on a voluntary agreement amongtrading partners. Unless all parties agree, the transaction will nottake place. No private business firm, regardless of its size, canforce potential consumers to purchase its products. Government isfundamentally different. Unlike business firms, governments cantake (tax) some of your wealth and transfer it to others or use it to
21
www.fraserinstitute.org

There are twobroad functions ofgovernment thatare consistent witheconomic freedom:(1) protection ofindividuals againstinvasions byintruders, bothdomestic andforeign, and (2)provision of a fewselect goods—whateconomists callpublic goods.
operate government agencies or enterprises. Governments can alsoset prices, limit entry into markets and occupations, mandateprovision of services by private parties (usually businesses), andimpose numerous other regulations on individuals.
There are two broad functions of government that are consistentwith economic freedom: (1) protection of individuals and theirproperty against invasions by intruders, both domestic and foreignand (2) provision of a few select goods—what economists callpublic goods—which have characteristics that make them difficultfor private business firms to produce and market. Nobel laureateJames Buchanan refers to these functions as the protective andproductive functions of government.
Government's protective function seeks to prevent individualsfrom physically harming the person or property of another and tomaintain an infrastructure of rules within which people can interactpeacefully. The crucial ingredients of this infrastructure include theenforcement of contracts and the avoidance of restrictions,regulations, and differential or excessive taxes that would restrainexchange.
The productive function of government involves the provisionof public goods—goods that have two distinguishing characteristics:(1) supplying them to one individual simultaneously makes themavailable to others, and (2) it is difficult, if not impossible, torestrict their consumption to paying customers only. Nationaldefense, flood control projects, and mosquito abatement programsare examples of public goods.15
When governments move beyond these protective andproductive functions into the provision of private goods, theyrestrict consumer choice and economic freedom. Most modernstates are heavily involved in directing production toward more ofsome goods and less of others, operation of enterprises, theprotection of government firms from the discipline of competition,the imposition of price controls, and numerous other expendituresand regulatory activities that have nothing to do with either theprotection of property rights or the provision of public goods.
Given the breadth and magnitude of government operations andregulations, precise measurement of these activities is an impossibletask. However, our index includes six components that provideinsight into the relationship between government activity and
22
www.fraserinstitute.org

economic freedom in several important areas. While thesecomponents are far from inclusive, they provide an indication ofthe degree to which governmental operations conflict witheconomic freedom.
II-A: Government General Consumption Expenditures as aShare of GDP.
When government consumption expenditures increase as a shareof GDP, political decision-making is substituted for market choicesand coordination. Ceteris paribus, more public sector spendingmeans less spending by individuals and families.
As government expenditures increase, more and more of theseexpenditures tend to be channelled toward activities outside of theprotective and productive functions of government. Big-spendinggovernments generally tend to be more heavily involved in projectsdesigned to benefit local constituents, organized special interests,and other favored groups—including government bureaucrats andofficials. Therefore, as coercive political decision-making allocatesmore resources and non-coercive market decision-making allocatesfewer, economic freedom shrinks.
Data Sources and Methodology. The World Bank, WorldTables, provided the primary source of the data for this variable.In a few cases, data were obtained from the International MonetaryFund, Monthly International Financial Statistics, since current datawere sometimes more readily available from this source. Sincegovernment consumption as a share of GDP is a continuousvariable, the general procedures that we previously outlined wereutilized to derive the rating transformation in 1985. In turn, the1985 intervals were used to rate the countries in the other years.The transformation table containing these intervals is presented inthe note at the end of Table II-A of Appendix II. The countryratings for this variable are also presented in this table.
II-B: Government-Operated Enterprises as a Share of theEconomy.
Government-operated enterprises also involve the substitutionof political coercion for market decision-making. Governmententerprises are fundamentally different from private businesses.Their start-up capital is coercively obtained from taxpayers,whereas the initial funds of private firms are voluntarily obtained
23
www.fraserinstitute.org

Data ongovernmentexpenditures willsubstantiallyunderstate theintervention ofgovernment whenstate-operatedenterprises arewidespread.
from investors willing to risk their own wealth. Subsequentinvestment decisions of public sector firms are made by politicalofficials playing with funds that belong to taxpayers, rather thanentrepreneurs capable of attracting financial capital voluntarily frominvestors. Subsidies, favorable tax treatment, and regulations areoften used to protect state-operated firms from private competitors.If the government project fails to generate enough revenue to coverits costs, there is no bankruptcy mechanism to bring it to a halt.Thus, public sector enterprises tend to stifle market forces andsubstitute political choices for market decision-making.
Data on government expenditures will substantially understatethe intervention of government when state-operated enterprises arewidespread. To the extent the current operating expenditures ofgovernment enterprises are covered by sales revenue, they generallydo not appear in the national budget. Only the subsidy (or revenuesurplus) enters into the budgetary accounts. Inclusion of thisvariable helps to correct a major deficiency of general governmentconsumption expenditures as a measure of the size andintrusiveness of the state.
Data Sources and Methodology. Ideally, it would be nice tohave a continuous variable like the proportion of output (oremployment) of government-operated enterprises as a share of theeconomy. To our knowledge, data of this sort are unavailable froma single source for a large number of countries. However, therehas been a great deal of research on government-operatedenterprises in recent years and empirical data are increasinglybecoming available. The Organization for Economic Cooperationand Development (OECD) has done a number of studies of itsmembers on this topic. The World Bank recently conducted asimilar study of African countries.17 Our research on the topic alsoturned up several country studies of government-operatedenterprises and privatization during the last two decades. Inaddition, the International Monetary Fund, Government FinanceStatistics Yearbook, provides a listing of the enterprises operated bythe central governments of various countries.18
We analyzed these various sources and used them to classifycountries into six different categories that were assigned ratingsranging from zero to ten. Countries with very few government-operated enterprises that were estimated to produce less than 1percent of the country's output were assigned a rating of ten. Asthe estimated size and breadth of the government enterprise sector
24
www.fraserinstitute.org

increased, countries were assigned lower ratings. A rating of 8 wasassigned when there were few government-operated enterprisesexcept for power-generating or similar industries where economiesof scale might reduce the effectiveness of competition. A rating of6 was assigned when the government enterprises also spread intotransportation, communications, and the development of energysources, but private enterprises dominated other sectors of theeconomy. A rating of 4 was given when most of the largeenterprises of the economy were operated by the government andthese enterprises generally comprised between 10 and 20 percent ofthe total non-agricultural employment and output. The assignedrating declined to 2 when government enterprises were estimatedto comprise between 20 and 30 percent of the total non-agriculturalemployment and output and to zero when the estimated share of thepublic sector businesses exceeded 30 percent of the economy. Thesource note at the end of Table II-B of Appendix II providesadditional details on these rating categories as well as the countryratings for each of our rating years.
II-C: Price Controls—The Extent that Businesses Are Free toSet Their Own Prices.
The freedom of individuals to use their own property andengage in voluntary exchange can be substantially reduced byregulations that limit the scope of business activity and the use ofprivately-owned property. Price controls interfere with the freedomof buyers and sellers to undertake exchanges even though the termsof trade are mutually agreeable. Price controls also, in effect, takeproperty from a private owner. For example, if price controls onrental housing cut the rate of return of a property in half, inessence, they take half of the property's value from the owner.Since price controls both constrain exchange and take propertyfrom owners, they are inconsistent with economic freedom.
Data Sources and Methodology. Two major data sources wereutilized to rate countries in this area. First, the WorldCompetitiveness Report published by The World Economic Forumcontains survey data indicating the "extent to which companies canset their prices freely". This source provided data for 32 countriesin 1989 and 41 countries in 1994. Since this was the mostcomprehensive empirical indicator on the breadth of price controlswe could find, we used it to rate the countries covered by the
Price controlsinterfere with thefreedom of buyersand sellers toundertakeexchanges eventhough the terms oftrade are mutuallyagreeable.
25
www.fraserinstitute.org

World Economic Forum surveys. The list of countries rated fromthis source is supplied in the note accompanying Table II-C ofAppendix II.19
In addition, Price Waterhouse's Doing Business in... publicationseries provides a verbal description of the imposition of pricecontrols in various product categories for countries covered by theseries. When available, this information was used to rate thecountries not covered by the data from the World CompetitivenessReport. In some instances, supplementary information fromcountry sources was also used. These descriptive data were usedto place countries into various categories indicating the coverage ofprice controls as a share of the economy. The more widespread theuse of price controls throughout the economy, the lower the rating.
The country ratings for this variable and additional detailsconcerning their derivation are provided in Table II-C of AppendixII. Since the source data for this variable were only available in1990 and 1994, it was not included in the 1975, 1980, and 1985indexes.
II-D: Freedom to Enter and Compete in Markets.
The freedom to enter and compete in product and labor marketsis highly important. Governments often require licenses and/orimpose other restraints that limit the entry of firms into variousbusiness activities and of individuals into various occupations.
Data Source and Methodology. The data source of this ratingwas the Freedom House, Freedom in the World: The AnnualSurvey of Political Rights and Civil Liberties, 1994-95. In recentyears the Freedom House annual survey used to rate the politicaland civil liberties of countries has included a sub-category on theeconomic freedom of businesses and cooperatives to compete in themarketplace (Item 9 on the Freedom House checklist of 13 civilliberty categories). Each country was given a rating of 0 to 4 witha rating of 4 indicating the countries for which businesses and
Oft
cooperatives were most free to compete. We transformed the 0 to4 rating of Freedom House to our 0 to 10 scale (0 = 0, 1 = 2.5,2 = 5, 3 = 7.5 and 4 = 10). The ratings for each country arepresented in Table II-D of Appendix II.
26
www.fraserinstitute.org

II-E: Equality of Citizens Under The Law and Access ofCitizens to a Nondiscriminatory Judiciary.
A legal structure that clearly defines property rights, enforcescontracts, and provides a mutually agreeable mechanism for thesettlement of contractual and property right disputes provides thefoundation for a market economy. To the extent countries providesuch a legal system, they are given higher ratings.
Data Sources and Methodology. The rating data for thiscomponent are also found in the annual survey of political and civilliberties conducted by the Freedom House. (See Freedom House,Survey of Political Rights and Civil Liberties, 1994-95.) Item 5 ofthe 13 item civil liberties checklist is: "Are citizens equal underthe law, do they have access to an independent, non-discriminatoryjudiciary, and are they respected by the security forces?" Countrieswere given ratings ranging from 0 to 4. The higher the rating, thegreater the degree of equality under the law. As in the case of theprevious component, we transformed the 0 to 4 ratings of theFreedom House to our 0 to 10 scale. Since this variable wasunavailable prior to 1994, it was only included in our 1995 index.
II-F: Freedom from Government Regulations and Policiesthat Cause Negative Real Interest Rates.
This component seeks to measure the impact of credit marketregulations, interest rate controls, and government operation of thebanking system on the freedom of citizens to borrow and lend.Many government regulations restrict entry into various bankingactivities and increase the cost of transactions between borrowersand lenders. As a result, the differential between the borrowingand the lending (or deposit) rate is unnecessarily large andexchange between borrowers and lenders is retarded.
Probably the most damaging way that government regulationsand controls restrict exchanges in the credit market is through thecombination of an inflationary monetary policy and interest ratecontrols. When the inflation rate exceeds the fixed interest rate,negative real interest rates occur. With negative real interest rates,the purchasing power of the principal and interest of savers actuallydeclines when wealth is held in the form of domestic savings
Probably the mostdamaging way thatgovernmentregulations andcontrols restrictexchanges in thecredit market isthrough thecombination of aninflationarymonetary policyand interest ratecontrols.
27
www.fraserinstitute.org

deposits or bonds. Thus, there is little incentive to save andthereby supply funds to the domestic capital market. "Capitalflight" will result as domestic residents seek positive returns abroadand foreigners shun the country. Such policies will both diminisheconomic freedom and undermine the operation of the capitalmarket.
Data Sources and Methodology. Our objective is to develop arating for this component that will reflect both regulations thatdrive a wedge between the borrowing and lending interest rates andpolicies that lead to destructive negative real interest rates. First,we obtained the inflation rate, deposit interest rate, and lendinginterest rate data for each country from the International MonetaryFund, International Financial Statistics Yearbook (or the monthlyversion of this publication). These data were used to estimate realinterest rates. The differential between the nominal deposit andlending interest rates was used as the estimate of the respective realrates.
The data on the real deposit and lending rates (and thedifferential between the two) during the three years prior to a ratingyear were then used to classify credit markets. Countries weregiven rating of ten when their real interest rates were consistentlylow and positive and the differential between the borrowing andlending rates relatively small. A slightly lower rating (an 8) wasgiven if the differential between the two rates was larger (8% ormore), while the deposit and lending real rates remainedpersistently positive. Countries with persistently negative realdeposit and lending interest rates were assigned still lower ratings.The larger the negative rate, the lower the rating. If either thedeposit or lending real interest rate was persistently negative by asingle-digit amount, a country was given a score of 6. If both werepersistently negative by a single-digit amount, 4 was assigned. Ifeither the deposit or lending real interest rate was persistentlynegative by a double-digit amount, the country was given a ratingof 2. A zero was assigned if both the borrowing and lending realinterest rates were persistently negative by double-digit amounts orif hyperinflation had virtually eliminated the operation of the creditmarket. Table II-F of Appendix II provides the country rating forthis component. (See the note at the end of that table foradditional details on the derivation of the ratings.)
28
www.fraserinstitute.org

III. Takings and Discriminatory Taxation
When a government plays favorites—when it takes from onegroup in order to make transfers to others or when it imposes thecosts of public services disproportionately on various groups—thegovernment becomes an agent of plunder. Such actions conflictwith economic freedom. This is equally true whether the policiesare undertaken by a dictatorial political leader or a legislativemajority.
Much of what modern states do involves taking from some inorder to make transfers to others (often with the intent of "buying"their votes). This is true for both the budgetary and regulatorypolicies of government. We have identified three areas wherediscriminatory actions in the political sphere are particularlyimportant and where measurement is possible. These three areasare (a) subsidies and income transfers, (b) marginal tax rates, and(c) conscription.
III-A: Transfers and Subsidies as a Percent of GDP.
Transfers and subsidies violate the freedom of individuals tokeep the value of their productivity. When governments taxincome from one person in order to transfer it to another, they aredenying individuals the fruits of their labors. This is true whetherfunds are transferred from the rich to the poor (or as is often thecase, from the poor to the rich), from one racial group to another,or from the politically disorganized to the politically powerful. Thetaking of property (including labor services) without fullycompensating the rightful owner is a per se violation of economicfreedom.21 The ratio of transfers and subsidies to GDP indicatesthe degree to which various countries use the budget to engage intaking and transfer activities. Thus, countries with large transfersectors are given low ratings.
Data Sources and Methodology. Data on transfers andsubsidies are supplied by the International Monetary Fund,Government Finance Statistics Yearbook, (various years). TheGDP data are from the World Bank, World Tables, 1994. Inaddition, supplementary data on transfers and subsides from Inter-American Development Bank, Economic and Social Progress inLatin America, 1994 Report were also utilized. Special care was
Much of whatmodern states doinvolves takingfrom some in orderto make transfersto others (oftenwith the intent of"buying" theirvotes).
29
www.fraserinstitute.org

In essence, highmarginal tax ratesseize wealth fromtaxpayers withoutproviding them anequivalent increasein service.
taken to ensure that the subsidies and transfers for all levels ofgovernment were counted, and that intergovernmental transferswere omitted in order to avoid double-counting.
Following the general procedures used for other continuousvariables, the 1985 data on transfers and subsidies as a percent ofGDP were arranged from highest to lowest and used to form a zeroto ten conversion table. Countries with a small (large) transfersector were rated high (low). The raw data, the ratings, and theconversion table showing the relationship between the size of thetransfer sector and the rating for each year are presented in TableIII-A (Appendix II).
III-B: Top Marginal Tax Rate (and Income Threshold atWhich It Applies).
High marginal tax rates discriminate against productive citizensand deny them the fruits of their labor. In essence, such rates seizewealth from taxpayers without providing them an equivalentincrease in service. To the extent that they raise revenue, highmarginal tax rates force some people to pay for services providedto others.
Generally, high marginal rates are a very inefficient form ofraising government revenue, since people will often reduce theirwork effort and make other adjustments when a large proportion oftheir additional earnings is taxed away. Thus, high marginal taxrates impose an additional cost (and loss of freedom) over andabove the revenues transferred to the government. Perhaps thefollowing example will help illustrate this point. Suppose that thegovernment threw everyone who earned more than $100,000 peryear in jail for six months. In essence, this is a very high marginaltax rate. A tax scheme like this would substantially reduceeconomic freedom over and above the revenue it generated for thegovernment. In fact, it probably would not raise much revenue.Nonetheless, the impact on economic freedom would be substantial.So it is with high marginal tax rates—they impose a discriminatorycost on people over and above the cost of the revenue theygenerate.
Data Sources and Methodology. Data on the top marginal taxesand the income threshold at which they apply were assembled from
30
www.fraserinstitute.org
Price Waterhouse, Individual Taxes: A Worldwide Summary,(various issues). The exchange rate at beginning of the year wasused to convert the income threshold data to U.S. dollars, and theU.S. Consumer Price Index was used to convert the threshold toreal 1982-84 dollars. A conversion table was designed and used toassign each country a zero to ten rating based on the country's topmarginal tax rate and the income threshold at which the rate tookeffect. Countries with low marginal tax rates and a high incomethreshold for the initial application of the top rate were given highscores (toward the ten end of the scale). Correspondingly,countries with high marginal tax rates and low income thresholdswere assigned a low rating (toward the zero end of the scale).The data on the top marginal tax rates and their effective incomethresholds, as well as the associated ratings for each country arepresented in Table III-B of Appendix II. The conversion table usedto derive the ratings from the tax rate and income threshold data ispresented in the source note at the end of this table.
III-C: The Use of Conscripts to Obtain Military Personnel.
Conscription prevents individuals from selling their laborservices to those who offer them the most attractive compensationpackage. In essence, military conscription denies draftees theproperty right to their labor services. While national defense is anacceptable activity for a "protective and productive" state, the costof that protection should be imposed on all citizens. Singling outa specific group (for example, young men or young women) to payfor something that benefits all is a clear "taking" and adiscriminatory form of taxation. The military draft falls into thiscategory and, as such, is a violation of economic freedom.
Data Sources and Methodology. International Institute forStrategic Studies, The Military Balance, (various issues) indicatecountries which use conscription to obtain military personal. Thispublication provided the source material for this component. Thereare only two possible values for this component— conscription iseither present or absent. Nations that rely on wage payments ratherthan conscription to obtain military personnel are given a rating of10. Those that utilize conscription earn a zero. Appendix II, TableIII-C indicates whether countries utilize conscription and providesthe ratings for each country.
31
www.fraserinstitute.org
It makes nodifference if thepotential tradingpartners live indifferent countries.Restrictions onexchange—bothdomestic andinternational—are aper se violation ofeconomic freedom.
IV. Restraints On International Exchange
Since the time of Adam Smith, economists of almost allpersuasions have recognized the efficiency gains derived from freetrade. Free trade makes it possible for the citizens of differentcountries to gain from division of labor, economies of scale, andspecialization in areas where they have a comparative advantage.As a result, trading partners can produce a larger joint output andeach can derive mutual gain.24
This standard economic argument, however, is not our majorfocus. We are interested in international trade because freedom ofexchange is also a central tenet of economic freedom. It makes nodifference if the potential trading partners live in differentcountries. Restrictions on exchange—both domestic and inter-national—are per se violations of economic freedom.
Prodded by interest groups, governments use a variety ofdevices to restrain international trade. Tariffs, export duties,quotas, exchange rate controls, "buy-local" policies, marketingboards, restrictions on foreign ownership (or on the repatriation ofthe capital, interest, or dividends to owners), monopoly grants todomestic citizens, and discriminatory licensing or taxation thatlimits access to credit, foreign exchange, or other markets—all ofthese devices retard the ability of domestic citizens to engage inexchange activities with foreigners. Thus, they are a violation ofeconomic freedom. Our task is to measure the extent to whichvarious countries have imposed such restrictions. Toward this end,we will focus on four general types of restrictions: tariffs and othertaxes on international trade, exchange rate controls, regulationsthat reduce the volume of trade, and regulations limiting capitalmarket transactions.
IV-A: Taxes on International Trade as a Percent of ExportsPlus Imports.
Taxes on international trade limit the freedom of domesticresidents to trade with foreigners. Tariffs and taxes on exports drivea wedge between what the seller receives and what the buyer pays.Thus, they reduce the volume of international trade, lowerconsumer and producer surplus, and, most relevant to our concerns,retard economic freedom.
32
www.fraserinstitute.org

Data Sources and Methodology. Data on revenue derivedfrom "taxes on international trade transactions" were obtained fromthe International Monetary Fund, Government Finance StatisticsYearbook, (various issues). These data along with the informationon exports and imports (World Bank, World Tables, 1994) wereused to derive an average tax rate on international trade. As thistax wedge increases, the freedom of domestics to trade withforeigners is retarded and therefore the country is given a lowerrating.26 As long as a nation's taxes on international trade are inthe normal range—that is, in the range where higher tax rates leadto an increase in tax revenues—there will be a direct relationshipbetween revenues from taxes imposed on international trade and therestrictive effects of the taxes on trade (and thus, economicfreedom). However, if taxes on some goods are raised so high thatthey are in the prohibitive range—the range where higher taxesmean less revenues—then the revenues from trade taxes willunderstate the restrictive effects of the taxes and their adverseimpact on economic freedom.
Table IV-A of Appendix II presents tax revenues oninternational trade as a percent of exports plus imports for theyears of our study. Following our usual procedures forcontinuous variables, the 1985 statistics were arrayed fromlowest to highest and used to derive the conversion intervals forthe base year (1985). These intervals were then used to rateeach country in the other years. Of course, countries with thelowest average tax rates on international trade were given thehighest ratings. See Table IV of Appendix II for the trade taxdata and accompanying country ratings.
IV-B: Difference Between the Official Exchange Rate andthe Black Market Rate.
If people in a country are going to trade with outsiders, theymust be able to convert their domestic currency to foreign exchange(other currencies). Exchange rate controls often make it difficultfor them to do so. Currency convertibility is no problem if anation permits its domestic currency to be freely and legallyconverted to other currencies in the foreign exchange market. Manygovernments, however, fix the price of their currency and prohibitcurrency exchanges at other prices.
Fixed exchange rates need not interfere with the freeconvertibility of a currency if a country is willing to subject its
Taxes on inter-national tradereduce the volumeof trade, lowerconsumer andproducer surplus,and, most relevantto our concerns,retard economicfreedom.
33
www.fraserinstitute.org

The black marketexchange rateprovides anindicator of thedegree to which ex-change ratecontrols limit tradewith foreigners.
monetary policy to maintenance of the fixed rates. Put anotherway, a country can either (1) follow an independent monetarypolicy and allow its exchange rate to fluctuate or (2) tie itsmonetary policy to the maintenance of the fixed exchange rate. Itcannot, however, maintain convertibility if it is going to both fixthe exchange rate value of its currency and follow an independentmonetary policy. It must either give up its monetary independenceor allow its exchange rate to fluctuate if its currency is going to befully convertible with other currencies.
Some countries, particularly small ones, have chosen to forgomonetary independence and tie the exchange rate value of theirdomestic currency to a widely accepted currency like the U.S.dollar, the German mark, or the French franc.27 Fixing theexchange rate value of one's currency works fine as long as thecountry is willing to forgo control over its monetary policy.
Problems arise, however, when a country attempts to both fixthe exchange rate value of its currency and conduct an independentmonetary policy, particularly if the latter is inflationary. When thishappens, the fixed exchange rate value of the domestic currencywill exceed the market level. Since the prices of foreign currenciesare fixed below equilibrium, a shortage of foreign exchange willresult and black markets will develop. The more a currency is outof line with the forces of supply and demand, the larger the blackmarket premium and greater the adverse impact of the exchangerate controls on the volume of international trade. Thus, the blackmarket exchange rate provides an indicator of the degree to whichexchange rate controls limit trade with foreigners.
Data Sources and Methodology. International CurrencyAnalysis, Inc. World Currency Yearbook (various issues), providedthe information on the size of the black market exchange ratepremium through 1990. More recently, the monthly newsletter ofthis organization was the source for the black market rate betweenvarious currencies and the U.S. dollar. In turn, this rate can beused to calculate the black market premium.
The larger the black market premium, the more restrictivethe impact on international trade. Thus, countries with the highestblack market premiums are given the lowest ratings. Since this isa continuous variable, the 1985 data were arrayed from the lowestto the highest and the intervals that allocated an equal number ofcountries to each of the 11 rating categories were derived. In turn,
34
www.fraserinstitute.org

this transformation table was used to rate the countries for the otheryears. The information on the black market exchange ratepremium, the associated ratings for each country and transformationtable are all presented in Table IV-B of Appendix II.
IV-C: Actual Size of Trade Sector Compared to the ExpectedSize.
In addition to tariffs and exchange rate controls, manynations restrain trade through the use of quotas, monopoly grants,"buy local" schemes, and various other types of discriminatoryregulations. Trade restrictions of this type are every bit as mucha violation of economic freedom as tariffs, export duties, andexchange rate controls. Ignoring such restrictions would be aserious omission.
Data Sources and Methodology. Since these restrictions arenumerous, complex, and heterogeneous, their direct measurementis an insurmountable task. Thus, we devised an indirect methoddesigned to approximate their severity. Regression analysis wasused to estimate the expected size of the trade sector for eachcountry, given its geographic size, population, and location relativeto potential trading partners.
We hypothesized that the expected size of a country's tradesector is a function of the following five variables: (1) geographicsize, (2) population, (3) a dummy variable indicating that thecountry is land-locked and therefore restricted in its use of oceansfor transport purposes, (4) a dummy variable indicating that thecountry has potential trading partners within 150 miles of itsborders but less than 50 percent of its population resides within thisdistance from the potential trading partners, and (5) a dummyvariable indicating that more than 50 percent of the country'spopulation was located within 150 miles of a potential tradingpartner. The base for the last two variables is therefore countriesthat do not have a potential trading partner within 150 miles.
Since geographically large countries tend to have manyproducers and consumers located long distances from potentialforeign trading partners, physical size tends to reduce the expectedsize of the trade sector. Similarly, a large population will facilitatethe ability of domestic producers to sell (and domestic consumersbuy) in the domestic market while fully realizing the potentialeconomies associated with large scale production. Thus, a negative
In addition totariffs andexchange ratecontrols, manynations restraintrade through theuse of quotas,monopoly grants,"buy local"schemes, andvarious other typesof discriminatoryregulations.
35
www.fraserinstitute.org

Limitations ondomestic invest-ments by foreignersand the freedom ofcitizens to investabroad restricteconomic freedomand often lead toside effects such aspolitical favoritism,bribes, and otherforms ofcorruption.
sign is expected for the geographic size and population variables.A negative sign is also expected for land-locked countries. Finally,a positive sign is expected for the last two variables since havingcloser trading partners will tend to enhance the size of the tradesector. Regression analysis confirms each of these relationships.28
This model was then used to derive an "expected size of thetrade sector" for each country which was then compared with theactual size of the country's trade sector. If the actual size of acountry's trade sector as a share of GDP was significantly smallerthan expected (given its geographic size, population, and locationalcharacteristics), this is consistent with the view that its trade sectorwas reduced as the result of quotas and other regulatory restraints.Such countries were given low ratings. In contrast, if the actualsize of a nation's trade sector as a share of GDP was large relativeto the expected size, this indicates that regulatory restrictions wereminimal. Therefore, countries in this category were given highratings. The data for the various components of the regressionequation and the actual size of the trade sector were from theWorld Bank, World Tables and World Development Report.
Table IV-C of Appendix II provides the data on the actualsize of the trade sector, the expected size, and the percentagedifference between the two. This latter figure was used to derivethe rating transformation table in the usual manner for continuousvariables. This transformation table along with the associatedcountry ratings are also presented in Table IV-C of Appendix II.
IV-D: Restrictions on the Freedom of Citizens to Engage inCapital Transactions with Foreigners.
Many countries require foreigners to get permission from thegovernment in order to make an investment or remit its earnings.Sometimes these regulations reflect the presence of an inflexibleexchange rate regime. In other instance, they are designed toprotect domestic industries and/or centrally plan the investment ofthe economy. Often there are side effects such as politicalfavoritism, bribes and other forms of corruption. Clearly, suchregulations of capital movements are inconsistent with economicfreedom.
Many governments also limit the freedom of their citizens tomake either real property or financial investments abroad, or both.In some cases there is an outright prohibition and in other
36
www.fraserinstitute.org
instances, permission to undertake an investment must be obtainedfrom government authorities. These restrictions also conflict witheconomic freedom.
Data Sources and Methodology. International MonetaryFund, Exchange Arrangements and Exchange Restrictions (variousissues) provides excellent descriptive data on the presence ofrestrictions, if any, that apply to both foreigners who want to makeinvestments within the country and citizens wishing to makeinvestments abroad. This descriptive information was used toclassify and rate each country. A country was given a rating of tenwhen foreigners were free to undertake domestic investments andnationals were free to undertake investments abroad. As more andmore restrictions were placed on the freedom of nationals to investabroad and foreigners to invest domestically, a country was givena lower and lower rating. The source note at the end of Table IV-D of Appendix II provides the details on the various categories ofrestrictions and the ratings accompanying them. This table alsoprovides the ratings for each country for the various years of ourstudy.
ATTACHING WEIGHTS TO THE COMPONENTS
We have identified 17 elements where institutionalarrangements and/or public policies exert a substantial influence oneconomic freedom. How can we aggregate these 17 elements intoa summary index? If we could accurately measure the costs of theactions that prohibit or retard voluntary exchanges and/or mandateinvoluntary "transactions", we could use these figures to attachweights to the various components. Of course, data limitationsgenerally prevent us from making such calculations.
There are several alternative methods that might be used toaggregate components of economic freedom into a summary index.Unfortunately, there are problems associated with each of them.Therefore, we will develop and present results for three alternativesummary indexes, each of which attaches different weights to thecomponents. We now proceed to a discussion of how these indexeswere developed and the deficiencies that accompany each.
Equal Impact Index Ie. The simplest alternative would be totake the position that since we do know the weight that should be
There are severalalternative methodsthat might be usedto aggregate com-ponents of econ-omic freedom intoa summary index.Unfortunately, allof them haveproblems. There-fore, we willdevelop and presentthe results for threealternativesummary indexes.
37
www.fraserinstitute.org

attached to the various components, each should exert an equalimpact on the index. Only one adjustment is required to achievethis objective—each variable must be assigned a weight equal to theinverse of its standard deviation. This is precisely what thesummary index that we will refer to as Ie does. (The "e" refers toequal impact.) Each component in the Ie index is assigned a weightequal to the inverse of its standard deviation. Thus, less weight isgiven to a component when it has a great deal of variability acrosscountries. Under this procedure, each of the components will exertan equal impact on the index. Exhibit 1-2 indicates both thestandard deviation of the ratings across countries and the weightsattached to each component when the Ie index is constructed.
Exhibit 1-2: The Weights Attached to Each Component in theAlternative Indexes
Component WeightsComponent
IA:IB:IC:ID:
MA:IIB:IIC:IID:ME:IIF:
IMA:1MB:IMC:
IVA:IVB:IVC:IVD:
Money Expansio nInflation Variabilit yForeign Currenc y Account sDeposits Abroa d
Government Consumptio nGovernment Enterprise sPrice Control sEntry int o Busines sEquality Unde r th e La wCredit Marke t
Transfers & Subside sMarginal Ta x Rate sConscription
Trade Taxe sExchange Rat e Control sSize o f Trade Secto rCapital Mobilit y Restraint s
Standard -Deviation8
3.23.24.84.5
3.22.42.32.23.53.3
3.22.54.9
3.23.43.23.1
leb
5.85.83.84.1
5.87.78.08.35.25.6
5.87.43.8
5.85.45.85.9
I s 1 b
4.75.33.02.7
6.26.57.16.74.73.4
10.912.73.6
6.76.23.75.9
Is2
6.96.24.38.3
0.710.49.77.65.54.9
0.54.55.0
4.86.95.88.0
TOTALS 100.0 100.0 100.0
a Th e standard deviation of the component rating s for all countries i n 1985 (thebase year) o r the earlies t year the data for the component were available .
The I e weights will resul t i n each component exertin g an equal impact o n theindex. I n order for this to be the case, the weights for each component mus t beinversely related to the variation in the component ratings across countries. Thus ,the I e weight s ar e equa l t o 1/ a + S 1/a . Th e Is 1 surve y weight s wer e als oadjusted for differences in the variation in the component ratings across countries.
38
www.fraserinstitute.org

Survey Index Isl. An alternative approach would be to askknowledgeable people to provide their estimates for the importanceof each component (the relative size of the loss in economicfreedom imposed by the restrictions encompassed in thecomponent) and to use this survey data as a basis for attachingweights. Our summary index Isl follows this procedure (the Islrefers to the Index derived from the Survey 1 method). Weconstructed a survey instrument which described the 17 componentsin our index and asked the participants of the past threeconferences on Measurement of Economic Freedom jointlysponsored by the Liberty Fund and Fraser Institute to provide uswith their views concerning the weights that should be attached toeach of the components. Since all of these people attended at leastone of the conferences, we were reasonably sure of their familiaritywith the concept of economic freedom and the factors thatinfluence it.
Eighteen of the 40 individuals who received the questionnaireresponded. Exhibit 1-2 (the second column under Isl) presents theaverage weight for each of the seventeen components derived fromthis survey. The respondents were instructed to assign weightssumming to 100 and to insert a zero weight for any component thatthey did not believe contributed to economic freedom.Nonetheless, at least 17 of the 18 respondents assigned a positiveweight for each of the components.
As a comparison of the weights accompanying the Ie and Islindexes reveals, the survey respondents attached an above averageweight to transfers and subsidies (III-A) and high marginal tax rates(III-B). At the other end of the scale, the respondents attached theleast weight to the deposits abroad (I-D), the credit market (II-F),and the size of the trade sector (IV-C). Except for these five cases,the weights attached by the respondents to the other 12 variableswere similar (prior to the adjustment for the differences in thestandard deviations.) This indicates that the respondents believedthese twelve factors were of similar importance as an indicator ofeconomic freedom.
While this procedure is both understandable and simple, itstill has a few deficiencies. First, survey methods are generally notfavorites of economists. The views of the respondents—evenknowledgeable respondents—may not accurately reflect the "true"importance of the various factors as indicators of economicfreedom. There is also a second problem—the weights (or
39
www.fraserinstitute.org

importance of the components) will in some cases vary acrosscountries. For example, one would expect that freedom ofexchange with foreigners will be more important for residents ofsmall countries than for large ones. This suggests that theappropriate weights should vary across countries. Therefore to adegree, the weights might be thought of as an average that wouldbe most appropriate for a typical country.
Survey Index Is 2. A third approach to the problem ofweights would be to ask a large number of people who are familiarwith specific countries to rate those countries' overall economicfreedom on a common scale (for example, zero to 100) and thenattempt to regress various objective indicators of economic freedom(e.g. the ratings of our 17 components) on these country ratings inorder to derive the "implicit" weights underlying the subjectiveaggregate ratings for each of the countries. If the subjective ratingsfor the various countries were "correct" then the regressioncoefficients would provide estimates for the weights of thecomponents. While this option is attractive, there is a majorpractical problem—the number of countries is not large enough toprovide for reliable simultaneous estimates of a model with 17components. Thus, we were unable to develop a summary indexbased on this method.
However, we did pursue a modified form of this approach.Stephen Easton and Michael Walker conducted a survey fromwhich they were able to derive a subjective aggregate rating for 33countries, 31 of which are included in our analysis. Wecalculated the simple correlation coefficient for each of thevariables in our index and the subjective country ratings of theEaston-Walker survey. Each component was then weightedaccording to the relative size of its correlation coefficient. If theratings of a component across the 31 countries were highlycorrelated with the Easton-Walker country ratings, then thecomponent was given a large weight. In contrast, components thatwere poorly correlated with the Easton-Walker index were givenproportionally smaller weights. The weights for the componentsderived by this method are presented in Exhibit 1-2, column 4. Werefer to the summary index derived by this procedure as Is2—theSurvey 2 approach.
When the component weights are derived by this method, thegovernment enterprise (II-B) and price controls (II-C) componentsreceive the largest weights, 10.4 percent and 9.7 percent
40
www.fraserinstitute.org
respectively. In contrast, the government consumption (II-A) andtransfers and subsidies (III-A) components receive very littleweight, less than 1 percent.
Some Final Thoughts on Weights. Given that there is noideal solution to the problem of weights for the components, wegenerally present each of the three summary indexes. If we had tochoose among these three, our preference would be for Isl becauseit reflects the views of a sample of people who have thoughtseriously about both economic freedom and the importance ofvarious ingredients of that freedom. We recognize that others mayhave different views with regard to the importance of thecomponents in our index. If one thinks that alternative componentweights would be preferable for any country (or in aggregate), theindex can be recalculated from the ratings for each component.
In conclusion, we would like to make two additional pointswith regard to the component weights and evaluation of thesummary indexes. First, when a country has either low or highratings for all, or almost all, of the components, the weightsattached to the various components will not exert much impact onthe summary index. Under these circumstances, almost anysensible set of weights will lead to a high rating when the ratingsfor most of the components are high (and a low rating when theratings for most of the components are low.) As we will see, asubstantial number of the countries fall into one or the other ofthese categories. Second, the ability of the summary indexes toexplain differences in economic growth across countries alsoprovides evidence as to their merit. Economic theory indicates thatthe gains from specialization, exchange, and productive efficiencyassociated with economic freedom will tend to generate higherincome levels and growth rates. Therefore, if our measures ofeconomic freedom are related to the level and growth of income,this will enhance our confidence in their accuracy. We will addressthis subject in Chapter 4.
When a countryhas either low orhigh ratings for all,or almost all, of thecomponents, theweights attached tothe variouscomponents willnot exert muchimpact on thesummary index.
LOOKING AHEAD
In this chapter we defined the various components of ourindexes and explained how these components are weighted in thethree alternative indexes of economic freedom that we derive. Thefollowing chapter will present the country ratings for thecomponents and the summary indexes for the 1993-95 period.
41
www.fraserinstitute.org

Endnotes
1. As quoted by Milton Friedman in Walter Block (ed.), Economic Freedom:Toward a Theory of Measurement (Vancouver: Fraser Institute, 1991), p. 11.
2. Other researchers have also sought to quantify economic freedom acrosscountries. See Zane Spindler and Laurie Still, "Economic Freedom Ratings," inWalter Block (ed.), Economic Freedom: Toward a Theory of Measurement(Vancouver: The Fraser Institute, 1991); Gerald W. Scully and Daniel J. Slottje,"Ranking Economic Liberty Across Countries," Public Choice (69: 121-152,1991); and Bryan T. Johnson and Thomas P. Sheehy, The Index of EconomicFreedom, (Washington, D. C. : Heritage Foundation, 1995).
3. Of course, the most basic property right of individuals is the property rightto their person. The protection of individuals from "invasions" by others is thecentral element of criminal law. Since cross-country data on the safety ofindividuals from physical attacks on their person differ substantially and theirreliability is generally questioned, our study does not attempt to deal with thisfactor.
4. See Ronald W. Jones and Alan C. Stockman. "On the Concept of EconomicFreedom" in Stephen T. Easton and Michael A. Walker (ed.), Rating GlobalEconomic Freedom, (Vancouver: The Fraser Institute, 1992) for an excellentdiscussion of the concept of economic freedom and an analysis of how it mightbe measured.
5. Alvin Rabushka, "Preliminary Definition of Economic Freedom," inEconomic Freedom: Toward a Theory of Measurement, ed. Walter Block,(Vancouver: The Fraser Institute, 1991), pp. 87-108. This article provides anexcellent foundation for the development of an empirical measure of economicfreedom.
6. Lindsey M. Wright, "A Comparative Survey of Economic Freedom," inFreedom in the World: Political Rights and Civil Liberties 1982, ed. RaymondD. Gastil, (Westport and London: Greenwood Press, 1982), p. 55.
7. Rabushka (1991), p. 89.
8. Philosophers generally refer to protective rights as negative rights andintrusive rights as positive rights. See Roger Pilon, "Property Rights, Takings,and a Free Society," in Public Choice and Constitutional Economics, JamesGwartney and Richard Wagner (ed.), (Greenwich, CT: JAI Press, 1988) andWalter Block, The U.S. Bishops and Their Critics: An Economic and EthicalPerspective, (Vancouver: The Fraser Institute, 1986) for an analysis of this topicand its importance for a free society.
9. However, the data for three components—price controls, freedom of entry intobusiness, and equality under the law—are unavailable for the years 1975, 1980,and 1985. The latter two variables are also unavailable for 1990. Thus, ourindex has 14 components for the years 1975, 1980, and 1985; 15 in 1990; and17 in 1993-95.
10. Often the total number of countries for which the data were available wasnot evenly divisible by eleven. When this was the case, the odd number ofratings was spread as evenly as possible among high and low ratings categories.
42
www.fraserinstitute.org

11. For details on this view, see Murray Rothbard, The Mystery of Banking,(New York: Richard and Snyder, 1983) and What Has Government Done to OurMoney, 3rd ed. (San Rafael, CA: Libertarian Publishers, 1985).
12. See Milton Friedman, Capitalism and Freedom, (Chicago: University ofChicago Press, 1962), Chapter III and Money Mischief: Episodes in MonetaryHistory (New York: Harcourt Brace Jovanovich, 1992).
13. While they were extremely rare during the period of our study, monetarycontractions can also change the terms of trade and undermine economicexchange. Therefore, our transformation table is symmetrical. The larger anegative change in the money supply minus potential GDP, the lower the ratingof a country. Further, a sizeable monetary contraction might well cause a sharpreduction in real GDP. Under these circumstances, money growth minus thechange in current-year real GDP would lead to a higher rating than is justified.This is why we used the change in real GDP during the last ten years ratherthan the change in GDP during the current year to adjust the money growthfigures for cross-country differences in the growth of potential real output. Wewould like to thank Milton Friedman for calling this problem to our attention andsuggesting the use of the ten-year average growth rate to minimize distortionsarising from this source.
14. Our thinking in this area was influenced by the rational expectations theoryof Robert Lucas, Thomas Sargent, Robert Barro and others. For a review of thisliterature, see The Rational Expectations Revolution: Readings From The FrontLine, edited by Preston J. Miller (Cambridge, MA: MIT Press, 1994).
15. While the public goods justification for government action represents themainstream position, there are dissenters. See Hans-Hermann Hoppe, "Fallaciesof Public Goods Theory and the Production of Security," in The Economics andEthics of Private Property: Studies in Political Economy and Philosophy,(Boston: Kluwer, 1993); Tyler Cowen, ed., The Theory of Market Failure: ACritical Examination, (Fairfax, VA: George Mason University Press, 1988);Walter Block, "Public Finance and Taxation," Canadian Public Administration,Fall 1993 and Walter Block, "Taxation in the Public Finance," Journal of PublicFinance and Public Choice, Fall 1989.
16. Both government consumption and GDP were measured in the domesticcurrency units of the respective countries. Government consumptionexpenditures include all spending on goods and services purchased by thegovernment—things like national defense, road maintenance, wages and salaries,office space, and government-owned vehicles. Since it is obtained from thenational income accounts, it includes all levels of government spending. Note,this variable does not include direct transfers and subsidies, since these do notenter into the national income accounts.
17. See particularly John R. Nellis, "Public Enterprises in Sub-Saharan Africa,"World Bank Discussion Paper, no. 1 (Washington, DC: November, 1986);Rexford A. Ahene and Bernard S. Katz, eds., Privatization and Investment inSub-Saharan Africa, (New York: Praeger, 1992); and OECD Economic Surveys,(Italy: Organization for Economic Cooperation and Development, January, 1994).
18. International Monetary Fund, Government Finance Statistics Yearbook(Washington, D.C.: IMF), annual.
43
www.fraserinstitute.org

19. See The World Economic Forum, World Competitiveness Report, (Geneva:World Economic Forum, 1994). Also see various issues of this publication forearlier years.
20. The actual ratings for the specific checklist items were unavailable in theAnnual Survey publication. However, Joseph Ryan, a senior scholar at theFreedom House, graciously supplied them to us.
21. See Terry L. Anderson and P.J. Hill, The Birth of the Transfer Society (PaloAlto: Hoover Institution Press, 1980) and Richard A. Epstein, Takings: PrivateProperty and the Power of Eminent Domain (Cambridge: Harvard UniversityPress, 1985) for additional analysis of income transfers, the taking of privateproperty, and economic freedom
22. When there was a range of top marginal tax rates within a country, as wassometimes the case under federal systems of government, the midpoint of the toprates for the country was used to derive the rating for this variable.
23. Some may argue that military conscription can sometimes promote economicfreedom in the long run by helping to protect a country against an external threatimposed by an authoritarian aggressor. This may well be true, but we do notknow how to measure the intensity of the potential future threat. Thus, we wereunable to adjust for it.
24. See Henry George, Protectionism or Free Trade 1886, reprinted edition,(New York: Robert Schalkenbach Foundation, 1980) for an excellent analysisof the economies of trade restrictions.
25. See Stephen T. Easton, "Rating Economic Freedom: International Trade andFinancial Arrangements," in Stephen T. Easton and Michael A. Walker (eds.),Rating Global Economic Freedom, (Vancouver: The Fraser Institute, 1992) foradditional analysis on this topic.
26. There is one significant deficiency with this approach as a measure of theloss of freedom due to the imposition of trade taxes—extremely high taxes ongoods may limit trade so much that the duties will raise little revenue. A totallyprohibitive marginal tax rate on a good would generate no revenue at all.
27. For example, Hong Kong has followed this strategy: its currency is tied tothe U.S. dollar. Instead of a central bank that conducts monetary policy, HongKong has a currency board that issues HK dollars in exchange for U.S. dollarsat a fixed rate of 7.7 Hong Kong dollars = $1 U.S. dollar. The HK dollarsissued by the currency board are fully convertible and 100 percent backed withU.S. dollars and U.S. bonds dominated in dollars. If people want more HongKong dollars, they can obtain them by providing the currency board with U.S.dollars (at the fixed rate), which the board then invests in U.S. governmentbonds. Other countries have also followed this approach. Singapore has tied itscurrency to a bundle of foreign currencies. Several African countries, includingBenin, Cameroon, Central African Republic, Chad, Congo Peoples Republic,Cote d'lvoire, Gabon, Niger, Senegal and Togo, tie their currency to the Frenchfranc.
28. With log of exports plus imports divided by GDP as the dependent variable,the following regression was used to estimate the expected size of the tradesector:
44
www.fraserinstitute.org

Independent variables
Area in sq. kilometers (log)
Population (log)
Land-locked country (dummy)
Between 1% and 50% of populationwithin 150 miles of trading partner
Between 50% and 100% of populationwithin 150 miles of trading partner
1980 (dummy)
1985 (dummy)
1990 (dummy)
1993 (dummy)
Intercept
R2
Number of observations
Coefficient
-.109
-.154
-.177
.165
.194
.119
.036
.109
.130
2.260
.50
496
t-ratio
8.83
8.80
3.37
2.05
2.82
2.09
0.62
1.90
2.24
8.76
This regression indicates that 50% of the variation in the size of thetrade sector across countries reflects country differences in geographic size,population, and locational variables. We derived the expected size of the tradesector by plugging the country characteristics for the variables into the regressionequations. This provides us with an expected size of the trade sector for eachcountry (for each of the years of our study), given its geographic size,population, and locational characteristics.
29. An adjustment of this type is particularly important when the index includesboth continuous and binary variables. Since our rating procedure for continuousvariables assigns an equal number of countries to each of 11 intervals during thebase year, the standard deviation of these components will be equal and they willall be assigned the same weight in the Ie index (see Exhibit 1-2.) Since thestandard deviations of the three binary variables (I-C. I-D, and III-C) weregreater, the weights attached to these components were smaller. Failure to makethis adjustment would result in the dominance of the index by the variables withthe most variability.
30. The survey weights were also adjusted for differences in the standarddeviations of the various components. See previous endnote.
31. The use of uniform techniques to derive estimates that we know will havea bias under certain circumstances is not particularly unusual. For example, werecognize that our methods of deriving GDP will understate the output of less
45
www.fraserinstitute.org
developed countries since non-market and therefore uncounted productiveactivities will be greater for such countries than for modern industrial economies.In a similar manner, our index Isl will overestimate the economic freedom ofsmall countries with numerous restraints on international trade and underestimatethe economic freedom of large countries with numerous restraints oninternational trade.
32. Stephen T. Easton and Michael A. Walker, "A Survey Approach to Indexesof Economic Freedom," a paper presented to the Sixth Liberty Fund-FraserInstitute Symposium on Rating Economic Freedom held November 18-21, 1993in Sonoma, California.
46
www.fraserinstitute.org

CHAPTER 2
Rating the Economic Freedom ofCountries in 1993-1995, 1990, 1985,
1980, and 1975
Having explained how the index of economic freedom isconstructed, we are now ready to present the data for the 103countries (102 prior to the separation of Czechoslovakia into theCzech Republic and Slovak Republic in 1993) for which we wereable to obtain reasonably complete data. This chapter focuses onthree topics. First, we will present the component ratings, arearatings, and summary indexes for the 1993-1995 period for eachcountry. These data will allow us to identify the strengths andweaknesses of each country and make comparisons acrosscountries. Second, we will also present the summary ratings forthe Top 15, Bottom 15, and selected other countries for 1975,1980, 1985, 1990 and 1995. These data will permit us to observethe changes in the composition of country rankings during the lasttwo decades. Finally, we will identify two groups—the firstcomprised of countries with persistently high levels and the secondwith persistently low levels—of economic freedom throughout theentire period of our study.
COUNTRY RATINGS IN 1993-1995
Exhibit 2-1 presents the 1993-1995 ratings for each of the17 components in our index, as well as area ratings, and the threealternative summary indexes. The area ratings and the summaryindexes merely reflect the aggregation of the component ratingswhich range from zero to ten. The higher the rating, the greaterthe estimated degree of economic freedom.
www.fraserinstitute.org

Exhibit 2.1: Component, Area, and Summary Index Ratings: 1993-95
Parti: Component
INDUSTRIALCOUNTRIESUnited StatesCanadaAustraliaJapanNew ZealandAustriaBelgiumDenmarkFinlandFranceGermanyIcelandIrelandItalyNetherlandsNorwaySpainSwedenSwitzerlandUnited Kingdom
CENTRAU-
1:
A
79598
8891
10549
8978
10107
SOUTH AMERICAArgentinaBelizeBoliviaBrazilChileColombiaCosta RicaDominican RepEcuadorEl SalvadorGuatemalaHaitiHondurasJamaicaMexicoNicaraguaPanamaParaguay
010
1
021
220212201021
Ratings: 1993-95Money and
InflationB C D
10 10 1 010 1 0 1010 10 1010 1 0 1 010 10 1 010 10 1010 1 0 1 010 1 0 1 09 1 0 1 0
10 1 0 1 010 1 0 1 05 1 0 1 09 1 0 1 09 1 0 1 09 1 0 1 09 1 0 1 0
10 1 0 1 06 1 0 09 1 0 1 09 1 0 1 0
0 1 0 1 09 0 05 1 0 1 00 0 05 1 0 106 10 1 03 1 0 1 01 0 02 1 0 1 04 1 0 1 02 1 0 1 01 1 0 1 03 1 0 1 02 1 0 1 02 1 0 1 00 0 0
10 1 0 1 03 1 0 1 0
II: Government Operations
A
31
28525011
314251
3051
101539738
109
10-
869419
B
86688264666442624486
684284866884846068
C
8875
10
658879-
85776
869
868486660660447244
D
10.07.5
10.07.5
10.07.57.5
10.07.57.57.5
10.07.57.57.57.57.5
10.010.010.0
10.010.07.57.5
10.07.5
10.07.57.55.07.52.57.57.57.55.07.57.5
E
7.57.57.57.5
10.07.5
10.010.010.07.57.5
10.07.57.5
10.010.05.0
10.010.05.0
2.57.52.50.05.00.07.52.52.52.50.00.02.52.50.00.02.52.5
F
10101010106
1010108
106
1010101010
101010
81080
1088-
6108-
6480
108
III:
A
32342000100320002022
310833569899-775548
Takings
B
74427522234-
342431
95
94
108359
8989-
597898
C
1010101010
000000
10100000
00
10
0100000
1010000
100
100
10100
IV: International
A
99899
910109
1010
68
1010
-
9
98
10
-
1776-
6--
67--
--
267
SectorB
1010101010
1010101010108
1010101010
101010
106866887846068
106
104
C
39
615
7102258183863455
03316343401-
383335
I
D
10888
108
101088
105
108
10108
101010
10850555258825850
105
48
www.fraserinstitute.org

Exhibit 2-'I (con't )
Part 2: Area Ratings (Is1)
Moneyand
Inflation
9.19.78.59.79.49.49.49.77.0
10.08.56.59.49.19.48.89.46.99.78.8
3.66.05.60.05.96.05.20.94.35.64.64.65.24.34.60.07.64.9
Govern-ment
Operations '
7.66.46.97.48.7
5.06.86.76.76.07.06.16.65.27.35.85.66.77.96.8
7.66.95.93.28.45.57.06.25.36.66.81.76.14.86.42.14.96.5
Takings
5.84.04.43.95.42.3
0.90.91.31.41.94.73.51.90.91.92.2
0.55.04.5
5.4
7.27.94.92.64.37.98.77.47.37.8
10.05.18.35.37.17.16.9
Inter-nationalSector
8.69.08.27.78.98.7
10.08.77.98.79.75.59.18.39.79.18.08.78.69.2
7.74.56.13.95.75.76.04.25.95.06.01.0
4.98.06.52.77.75.3
Part 3:
(le)
7.97.57.37.38.4
6.27.1
6.76.16.67.1
6.07.46.17.26.36.36.17.97.5
6.26.36.12.86.35.36.75.15.46.06.23.1
5.56.05.72.76.65.9
Summary Indexes
(Is1)
7.66.96.86.98.0
5.86.3
6.05.66.06.45.76.75.66.45.75.8
5.57.57.0
6.36.36.43.35.85.36.75.75.96.36.52.9 *5.56.35.83.36.66.1
(Is2)
8.68.48.07.89.16.97.8
7.76.97.57.8
6.68.16.77.97.26.96.78.38.3
6.26.35.92.46.55.47.04.35.05.75.83.5 *5.46.05.72.27.15.6
Avg.
8.07.67.47.38.56.37.1
6.86.26.77.1
6.17.46.17.26.46.36.17.97.6
6.26.36.12.86.25.36.85.05.46.06.23.25.56.15.72.76.85.9
Grade
ABBBA
CBCCCBCBCBCC
CBB
CCCF-CDCDDCCF-DCDF-CD
a INDUSTRIALCOUNTRIESUnited States
CanadaAustralia
JapanNew Zealand
AustriaBelgium
DenmarkFinlandFrance
GermanyIcelandIreland
ItalyNetherlands
NorwaySpain
SwedenSwitzerland
United Kingdom
CENTRAU-SOUTH AMERICA
ArgentinaBelizeBoliviaBrazilChile
ColombiaCosta Rica
Dominican RepEcuador
El SalvadorGuatemala
HaitiHonduras
JamaicaMexico
NicaraguaPanama
Paraguay
49
www.fraserinstitute.org
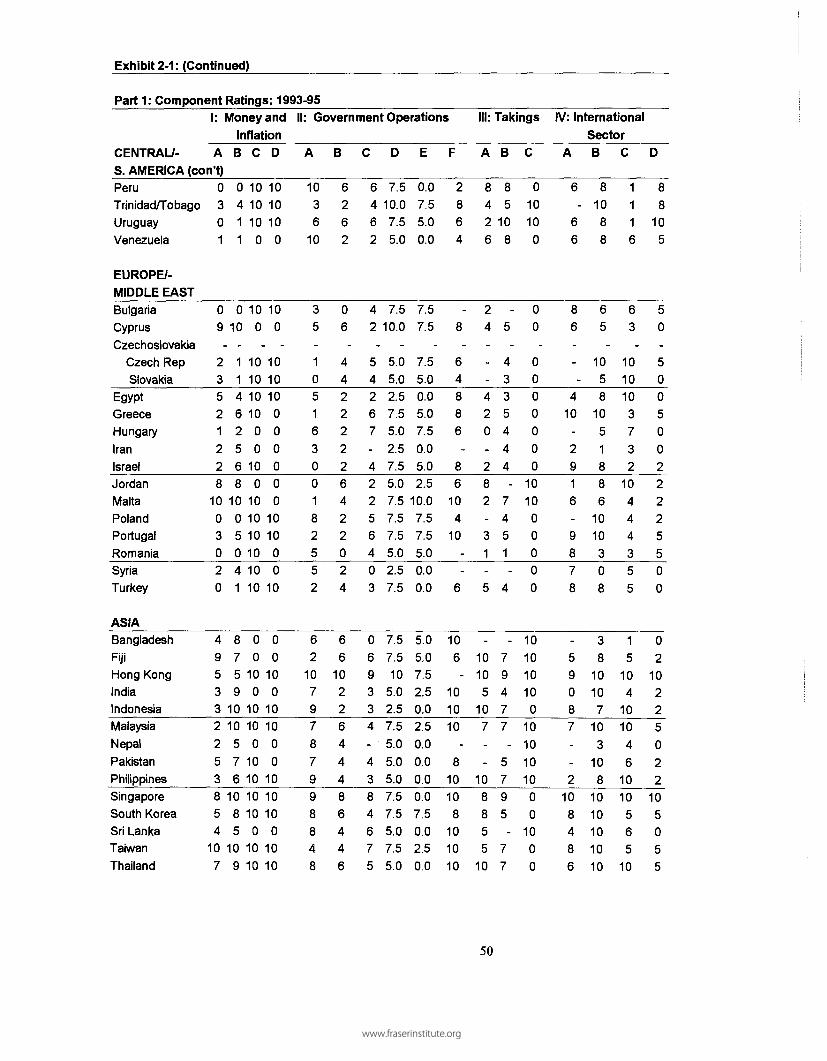
Exhibit 2-1: (Continued)
Parti: Component1:
CENTRAL/- AS. AMERICA (con't)
Ratings: 1993-95Money and II: Government Operations
InflationB C D A B C D E F
III: Takings
A B C
IV:
A
International
SectorB C D
Peru 0 0 1 0 1 0TrinidatVTobago 3 4 1 0 1 0Uruguay 0 1 1 0 1 0Venezuela 1 1 0 0
1036
10
6262
6462
7.510.07.55.0
0.07.55.00.0
2864
8426
85
108
010100
6-
66
81088
11
16
88
105
EUROPE/-MIDDLE EAST
BulgariaCyprus
Czech RepSlovakia
EgyptGreeceHungaryIranIsraelJordanMaltaPolandPortugalRomaniaSyriaTurkey
ASIABangladeshFijiHong KongIndiaIndonesiaMalaysiaNepalPakistanPhilippines
09
23521228
1003020
495332253
010
11462568
1005041
8759
1010576
100
1010101000
100
101010101010
00
100
10100
1010
100
101010000000
101000
10
00
100
101000
10
35
10516300182552
62
10797879
06
44222226422024
66
10226444
42
54267-42256403
069334-43
7.510.0
5.05.02.57.55.02.57.55.07.57.57.55.02.57.5
7.57.510
5.02.57.55.05.05.0
7.57.5
7.55.00.05.07.50.05.02.5
10.07.57.55.00.00.0
5.05.07.52.50.02.50.00.00.0
-8
64886-
86
104
10--
6
106-
101010
-8
10
24
-420-282-31-5
-10105
107--
10
-5
4335444-
7451-
4
-79477-
57
00
0000000
101000000
101010100
10101010
86
-4
10-2916-9878
-59087--2
65
1058
1051886
1010308
38
10107
103
108
63
1010103732
10444355
15
104
101046
10
50
50050
022225500
02
10225
0
22
Singapore 8 1 0 1 0 1 0 9 8 8 7. 5 0. 0 1 0 8 9 0South Korea 5 8 1 0 1 0 8 6 4 7. 5 7. 5 8 8 5 0Sri Lanka 4 5 0 0 8 4 6 5. 0 0. 0 1 0 5 - 1 0Taiwan 1 0 1 0 1 0 1 0 4 4 7 7. 5 2. 5 1 0 5 7 0Thailand 7 9 1 0 1 0 8 6 5 5. 0 0. 0 1 0 1 0 7 0
10 10 10 108 10 5 54 10 6 08 10 5 56 10 10 5
50
www.fraserinstitute.org

Exhibit 2-1 (continued)
Part 2: Area Ratings (Is1)Money
andInflation
3.65.94.0
0.6
3.66.1N/R4.64.96.54.51.0
2.34.55.18.33.66.2
1.93.94.0
3.95.16.83.97.9
7.62.35.86.69.47.82.9
10.0
8.8
Govern-ment
Operations
5.85.56.2
3.9
4.26.2N/R4.53.63.04.75.5
2.04.13.45.15.75.4
3.71.93.8
5.35.49.44.54.1
6.04.5
4.64.97.26.65.45.7
5.5
Takings
6.95.36.8
6.1
1.53.9N/R3.12.33.03.11.9
3.12.78.55.43.13.5
0.90.03.9
10.08.69.55.27.3
7.410.06.18.67.45.56.25.3
7.3
Inter-
nationalSector
6.37.16.8
6.3
6.33.7N/R8.14.35.07.53.6
1.45.74.74.65.67.4
5.02.95.4
1.45.09.73.96.5
7.82.16.15.0
10.07.34.97.3
7.5
Part 3:
(le)
5.45.96.0
4.0
4.45.1N/R5.24.1
4.34.93.6
2.04.24.85.84.85.7
3.12.64.2
4.45.89.04.55.97.13.5
5.36.18.26.74.96.8
6.9
Summary Indexes
(Is1)
5.95.86.1
4.5
4.25.0
N/R4.93.74.04.93.3
2.14.24.95.64.85.5
2.92.64.2
4.46.19.14.56.17.03.6
5.46.28.26.75.06.6
7.0
(Is2)
5.16.36.4
3.2
4.74.7
N/R5.64.54.45.03.3
1.64.24.85.94.7
6.1
2.92.14.3
3.95.59.04.15.37.13.05.05.78.26.64.57.06.7
Avg.
5.56.06.2
3.9
4.44.9
5.24.14.24.93.4
1.94.24.85.84.85.83.02.44.3
4.25.89.04.45.87.13.45.26.08.26.74.86.86.9
GradeS
DCC
F-
FF
DFFFF-
F-FFDFDF-F-F
FDA+FDBF-DCACFCC
a CENTRAU-. AMERICA (con't)
PeruTrinidad/Tobago
UruguayVenezuela
EUROPE/-MIDDLE EAST
BulgariaCyprus
CzechoslovakiaCzech Rep
SlovakiaEgypt
GreeceHungary
IranIsrael
JordanMalta
PolandPortugalRomania
SyriaTurkey
ASIABangladesh
FijiHong Kong
IndiaIndonesiaMalaysia
NepalPakistan
PhilippinesSingapore
South KoreaSri Lanka
TaiwanThailand
51
www.fraserinstitute.org

Exhibit 2-1: (Continued )
Part 1: Component Ratings
AFRICAAlgeriaBeninBotswanaBurundiCameroonC African RepChadCongo PeoplesCote d' IvoireGabonGhanaKenyaMadagascarMalawiMaliMauritiusMoroccoNigerNigeriaRwandaSenegalSierra LeoneSomaliaSouth AfricaTanzaniaTogoTunisiaUgandaZaireZambiaZimbabwe
I:
A
23
104937
R 75
101111765
101781
315
100001
;: 1993-95
Money andInflationB
210755767
26232559
101
14
21
• 0
929
101003
C
000
0000000
1000000000
100
10000000000
D
00
000000
00000000000000000000000
II: Government Operations
A
27
086831
11
76
1037733
10077-
17338152
B
44
644640
46246446262666440442204
C
-
2
6-
2--
0
4464-
2-
-6-
4-
42-
4426--
22
D
2.55.0
7.52.55.05.05.05.0
5.07.55.05.05.07.55.0
10.05.05.05.02.55.05.02.55.02.55.05.05.02.55.05.0
E
0.05.0
5.00.00.02.50.02.50.00.02.50.02.55.00.07.50.00.00.00.02.50.00.05.02.50.00.00.00.00.02.5
F
--
6-
8886888--
48
10-
80682-
10-
8---
08
III:
A
--5-8-
10--
10799--
6-
-
-9-8-
6-
-4---
-
Takings
B
--
5-
1--
33075-
7-
83-
7-
4-
-
48--
8173
C
0
0
10101000
100
1010100
10
01000
10100
100
10000
1010100
IV: Internationa
A
--1-3-
8--
4262--3---0-
2----
1----
SectorB
1
8
828888887634866801
88-
106864588
C
82
10121665425445552
10021-
510361-
89
1
D
2050000000000222500000020050222
N/R = No rating because data were available for less than eleven of the seventeen componentsin the index for this year.* These summary ratings should be interpreted with caution because they are based on data foronly eleven of the seventeen components in the index for this year.
52
www.fraserinstitute.org

Exhibit 2-1 (continued)
Part 2: Area Ratings (Is1)Money
andInflation
1.34.35.4
2.94.43.34.1
4.52.25.02.91.31.02.03.84.84.93.30.65.43.1
2.50.03.91.04.56.40.30.00.01.3
Govern-
mentOperations
2.34.55.1
3.84.05.93.82.13.54.45.04.06.14.24.78.03.54.34.02.85.34.02.44.43.23.53.94.01.52.33.6
Takings
0.00.05.7
10.05.00.07.54.52.35.37.47.36.87.70.07.52.30.07.79.23.18.50.05.66.20.03.08.43.07.72.3
Inter-
nationalSector
3.03.65.51.0
3.43.45.64.54.34.12.94.32.13.35.1
3.95.43.62.30.33.6
3.00.05.84.73.84.21.83.55.86.0
Part 3:
(le)
2.23.85.6
3.04.14.14.63.53.3
4.74.54.13.54.04.3
6.23.93.73.53.54.13.8N/R4.93.33.64.43.11.83.13.5
Summary Indexes
(IsD
2.14.05.4
3.24.24.25.03.53.24.74.84.54.04.34.3
6.33.93.63.73.74.14.2
N/R4.93.73.64.33.71.93.63.4
(Is2)
2.13.35.82.63.73.54.03.43.24.63.93.42.53.73.85.83.83.52.73.43.73.3
N/R4.82.63.44.32.42.02.73.3
Avg.
2.13.75.6
2.94.03.94.53.53.24.74.44.03.34.04.16.13.93.63.33.54.0
3.8
4.93.23.54.33.11.93.13.4
Grade a
F-F-DF-
FF-FF-F-FFFF-FF
CF-F-F-F-F
F-
FF-F-FF-F-F-F-
AFRICAAlgeria
BeninBotswana
BurundiCameroon
C African RepChad
Congo RepCote d1 Ivoire
GabonGhanaKenya
MadagascarMalawi
MaliMauritiusMorocco
NigerNigeria
RwandaSenegal
Sierra LeoneSomalia
South AfricaTanzania
TogoTunisia
UgandaZaire
ZambiaZimbabwe
a Th e average of the three ratings was used to assign the letter grade. Th e followingconversion table was used to allocate the letter grades. Countrie s with an average forthe thre e summar y rating s o f 8. 0 o r mor e wer e assigne d a n A (9. 0 o r mor e wa sassigned A+); 7.0 to 7.99 a B ; 6.0 t o 6.99 a C; 5.0 to 5.99 a D; 4.0 to 4.99 a F ; andless than 4.0 a F- .
Note: Se e Exhibi t 1- 1 fo r the description of each component i n the index.
53
www.fraserinstitute.org

The country com-ponent ratingsranging from zeroto ten for each ofthe 17 componentsare presented inPart 1 ofExhibit 2-1.
Some Reflections on the Component Ratings
Since both the summary and area ratings are merely anaggregation of the component ratings, it is important for the readerto understand the meaning of the latter.1 Let us look at thevarious component ratings for a few countries and consider theirsignificance. France (and Sweden and Switzerland among severalothers) received a rating of ten for component I-A, monetaryexpansion adjusted for the estimated growth rate of potentialoutput. Since the monetary expansion variable was continuous, theten rating indicates that the rate of monetary expansion in Franceduring the five years immediately prior to 1995 would have placedit in the top 1/1 lth of the countries during the base year (1985) interms of the least monetary expansion adjusted for the potentialgrowth of real output. Canada, Japan and Denmark (among others)received a rating of 9, indicating that the expansion in the moneysupply of these countries would have placed them in the second1/1 lth of countries during the base year.
At the other end of the spectrum, Brazil received a rating ofzero, indicating that the growth rate of its money supply during thefive years immediately prior to 1995 would have placed it in thebottom 1/1 lth of countries—those with the highest growth rates ofthe money supply—during the base year. (Note: the annual growthrate of the money supply in Brazil was 1,233% during the fiveyears immediately prior to the 1995 rating.) France, Sweden,Switzerland, Canada, Japan, Denmark and other countries withhigh ratings received them because they did not use monetaryexpansion to dilute the value of their monetary unit and therebyseize property from persons holding money during the 1990-94period. On the other hand, Brazil, Argentina, Ecuador, Peru,Uruguay, and other countries with low ratings received themprecisely because of their highly expansionary monetary policies.
The second component (I-B) in the index is the instabilityin the price level as measured by the standard deviation in the rateof inflation during the last five years. As previously discussed,fluctuations in the inflation rate increase uncertainty and retardtime-dimension exchanges. When the rate of change in the pricelevel is relatively constant, it will be more easily predictable;therefore it will exert less adverse impact on exchange. Thus, thecountries with the lowest standard deviation (least variability) in theinflation rate are given the highest ratings. The ratings of ten ofthe United States, Canada, Australia and Japan, for example,
54
www.fraserinstitute.org
indicate that the small variability in the inflation rate in each ofthese countries during 1990-1994 would have placed them in thetop 1/1 lth of the countries with the least variability in the inflationrate during the base year period. The nine ratings for Finland,Ireland, and Italy indicate that while the 1990-1994 variability inthe rate of inflation in these countries was low, it was slightlygreater than for the countries receiving a rating of ten. At the otherend of the spectrum, the zero ratings of Argentina, Brazil, andNicaragua indicate that the fluctuations in the inflation rates ofthese countries during 1990-1994 would have placed them in thebottom 1/1 lth of all countries during the base year period.
The next two components, freedom to maintain a foreigncurrency bank account domestically (I-C) and freedom to maintaina bank account abroad (I-D) have only two possible outcomes—itis either legal or illegal to maintain these accounts. The ten ratingsfor the United States, Canada, Australia, and numerous othercountries indicate that it was legal in the mid-1990s for the citizensof these countries to maintain accounts of this type. The zeroratings for Belize, Brazil, and Dominican Republic, for example,indicate that the citizens of these countries were not permitted tolegally maintain these accounts in the mid-1990s.
Using the weights derived from our survey of experts (seeExhibit 1-2), the four components in the area of money andinflation (Area I) are aggregated into an Isl area rating. Theseresults are presented in Part 2 of Exhibit 2-1. Of course, countrieswith high ratings for the four components in the money andinflation area will also receive a high rating in this area. Forexample, the money and inflation area rating of France was tenbecause it received a rating of ten for each of the four componentsin this area. The money and inflation area rating of Canada wasslightly lower (9.7) since it received a 9 for the money expansioncomponent (I-A) and a ten for the other three monetarycomponents. The area ratings are merely a reflection of thecomponent ratings that comprise them.
The country ratings for the other components in the indexhave a similar meaning. In each case, a higher component ratingindicates that the country's institutional arrangements and/or policychoices are more consistent with economic freedom in the specificcategory measured by the component. A component rating of 10indicates that for this dimension of economic freedom the nation isamong the freest in the world. On the other hand, a component
A highercomponent ratingindicates that thecountry'sinstitutionalarrangementsand/or policychoices are moreconsistent witheconomic freedomin the specificcategory measuredby the component.
55
www.fraserinstitute.org
rating of zero indicates that the country is among the least free inthe category measured by the component.
In order to makecomparisons acrosscountries easier, wederived an averagefor the threesummary indexesand used it toassign letter grades.
The Summary Ratings of Countries: 1993-1995
As we explained in Chapter 1, the 17 components wereaggregated into three alternative summary indexes. Each of thethree summary indexes reflects a different set of weights for thevarious components of the index.3 Exhibit 1-2 indicates thevarious weights applied to each component under the threealternative methods of deriving a summary index.
The summary indexes of economic freedom derived by eachof the three alternative methods are presented in Part 3 of Exhibit2-1. Except for the industrial countries, the three summary indexesgenerally yielded similar ratings. As Exhibit 1-2 shows, Is2allocates only a very small weight to the components forgovernment consumption as a share of GDP (II-A) and transfersand subsidies as a share of GDP (III-A). Since the high-income,industrial countries generally rate poorly in these two areas, thesummary index rating of these countries is higher when less weightis allocated to these two components. On the other hand, Islallocates a relatively large weight to the transfers and subsidies (III-A) and marginal tax rate (III-B) components, two areas wheremany of the high-income industrial countries do poorly. Thisstructure of weights tends to reduce the Isl summary rating ofindustrial countries relative to their Is2 rating. Thus, the Is2summary index is often approximately one unit higher than the Islindex for these countries. For example, in the case of Sweden, theIs2 summary rating is 6.7 compared to a Isl rating of 5.5. Similardifferences between the Isl and Is2 summary ratings are alsopresent for other industrial countries.4
In order to make comparisons across countries easier, wederived an average for the three summary indexes and used it toassign letter grades. Countries with an average of 8.0 or more forthe three alternative summary indexes were assigned a letter gradeof "A". (An average of 9.0 or more was assigned an A+).Countries with an average for the three summary ratings between7.0 and 7.95 were assigned a "B". Below that point, one lettergrade was subtracted for each decline of 1.0 in the average of thethree summary ratings. Thus, countries with a rating of less thanfive, were given a letter grade of "F". An F- grade, indicating little
56
www.fraserinstitute.org

economic freedom in any of the four major areas, was assignedwhen the average of the three summary ratings for a country wasless than 4.0.
We now turn to the consideration of these grades (andsummary ratings) across countries. By a substantial margin, HongKong was the highest rated country in the mid-1990s. With theexception of the upper middle ratings for the monetary expansionand price stability components, Hong Kong rates high in everyarea. Its ratings for the three summary indexes were almostidentical, either 9.0 or 9.1. The average Hong Kong summaryrating was a half point higher than those for any other country.Thus, Hong Kong was given a grade of A+.
Three other countries—the United States, New Zealand, andSingapore achieved an average for the three alternative indexes ofmore than 8.0. These countries were given a grade of "A". Withthe exception of a couple of components, these countries wereconsistently rated high in all categories. For example, the ratings ofthe United States were 7 or better for all components exceptgovernment consumption (II-A), the size of transfer sector (III-A),and the size of trade sector (IV-C). These same three componentswere also weaknesses of New Zealand. The presence ofconscription pulled down the summary ratings of Singapore.Singapore also received a very low rating for the equality underthe law component (II-E).
The following ten countries were given a grade of "B" sincetheir average for the three summary ratings was between 7.0 and7.9: Canada, Australia, Japan, Belgium, Germany, Ireland,Netherlands, Switzerland, United Kingdom, and Malaysia.Typically the component ratings of these countries were high inthe money and inflation and international categories. On the otherhand, with the exception of Malaysia, the summary scores of thesecountries were generally pulled down by low component ratings forthe size of the government consumption and transfer sectors. Thepresence of conscription also reduced the ratings of Belgium,Germany, Netherlands, and Switzerland. A low rating for equaltreatment under the law reduced the grade level for Malaysia.Among the C rated countries; Denmark, Costa Rica, Panama,Taiwan, and Thailand had the highest average summary ratings(either 6.8 or 6.9).
By a substantialmargin, HongKong was thehighest ratedcountry in themid-1990s.
57
www.fraserinstitute.org

Except for the C ofMauritius and theD of Botswana, theother 29 Africannations included inour study earnedgrades of either For F-.
At the other end of the spectrum, the following countriesearned a grade of F-: Brazil, Haiti, Nicaragua, Venezuela,Hungary, Iran, Romania, Syria, Nepal, Algeria, Benin, Burundi,Central African Republic, Congo, Cote d'lvoire, Madagascar,Morocco, Niger, Nigeria, Rwanda, Sierra Leone, Tanzania, Togo,Uganda, Zaire, Zambia, and Zimbabwe. Clearly, the policies andinstitutional arrangements of these countries were inconsistent witheconomic freedom in almost every area.
Taking a closer look at the summary ratings within regions,all of the industrial countries earned a grade of "C" or better. Therecord in Central and South America was not as good. No countryin the region was able to earn a grade of either A or B. Elevencountries—Argentina, Belize, Bolivia, Chile, Costa Rica, ElSalvador, Guatemala, Jamaica, Panama, Trinidad/ Tobago andUruguay achieved a "C" rating in 1993-1995. As we will see later,several of these countries in the "C" category had substantiallylower ratings during the earlier years of our study. At the otherend of the scale, Brazil, Dominican Republic, Haiti, and Nicaragua,received either F or F- ratings. As Exhibit 2-1 (Part 1) illustrates,the ratings of Central and South American countries were oftenextremely low for the monetary expansion (I-A) and price stability(I-B) components.
The overall summary ratings of the non-industrial countriesof Europe and the Middle East were also quite low. The D ratingsof Czech Republic, Malta, and Portugal were the highest among thenations in this group. Bulgaria, Cyprus, Slovakia, Egypt, Hungary,Iran, Israel, Jordan, Poland, Romania, Syria, and Turkey allreceived either F or F- ratings in 1995.
In Asia, the summary index ratings were highly diverse. Aswe previously mentioned, Hong Kong and Singapore earned A+ orA ratings, and Malaysia a B. Taiwan and Thailand earned high "C"grades. The Philippines and South Korea also received C ratings.At the other end of the spectrum, Bangladesh, India, and Sri Lankaposted F ratings, while Nepal registered an F-.
The economic freedom ratings of the African countries wereextremely low. Except for the C of Mauritius and the D ofBotswana, the other 29 African nations included in our studyearned grades of either F or F-. The ratings of Algeria, Burundi,
58
www.fraserinstitute.org

Congo, Cote d'lvoire, Madagascar, Niger, Nigeria, Tanzania, Togo,Uganda, Zaire, Zambia, and Zimbabwe were among the lowest inthe world.
Exhibits S-1A and S-1B in the Graphic Summary at thefront of the book present the average for the three ratings and theIsl ratings respectively—arrayed from the highest to the lowest forthe 102 nations we were able to rate in 1993-1995. These exhibitsmake it easy to identify the relative position of various countries.As these data illustrate, the rankings of the two indexes are quitesimilar. Hong Kong, New Zealand, Singapore, United States, andSwitzerland are the five highest ranked countries for both theaverage of the three indexes and the Isl ratings. The onlydifference is the switching of the second and third place positionsbetween New Zealand and Singapore. Moving down the ranking,Australia and Ireland tie for eighth in the average, but drop slightlyto 11th and 12th in the Isl ranking. On the other hand, Malaysiaand Thailand tie for sixth in the Isl ranking, compared to their 12thand 15th place ranking in the average index calculation.
The major difference between the average of the threeindexes and the Isl index is the relative rankings of industrial andnon-industrial nations. As we previously discussed, the Is2 indexgives very little weight to the size of the government consumptionand transfer sectors (components II-A and III-A), two areas wherethe industrial nations generally do poorly. Therefore, inclusion ofthe Is2 ratings into the average increases both the ratings andrankings of the industrial relative to the less developed countries.Thus, the industrial countries generally do better when their rankingis derived by the average of the three indexes rather than the Islrating. For example, Germany ranks 12th in the average index, but18th in the Isl; France is 20th in the average, but 31st in the Isl;and Italy and Sweden tie for 31 st in the average; but they rank 44thand 47th respectively in the Isl rankings. On the other hand,several non-industrial nations do better in the Isl rankings. Forexample, Mexico and Indonesia rank 44th and 45th respectivelywhen rated by the average of the three indexes, but they tie for35th in the Isl rankings; Peru ranks 47th in the average ratings, but33rd in the Isl; South Korea ranks 20th when rated by the averagemethod, but 12th in the Isl ratings; and Philippines is 36th in theaverage ratings, but 27th in the Isl rankings.
59
www.fraserinstitute.org

Despite these differences, the rankings of numerouscountries were quite similar. For example, rankings for the averageof the three indexes and the Isl index respectively for the followingcountries were: Portugal, 41 and 47; South Africa, 54 and 56;India, 62 and 63; Israel and Turkey, 66 and 70 (tie); Nigeria, 88and 81; and Brazil, 97 and 93. Syria, Iran, Algeria, and Zaireranked 99 through 102 for both of the alternative methods. Thus,while the country rankings shift around under the two methods, themovements are not huge. Even in extreme cases, the differencesare not more than 12 to 15 positions, and almost all changes of thissize are in the middle of the distribution. A review of Exhibits S-1A and S-1B will provide information on the rankings of othercountries.
The ratings of thehigh-incomeindustrial countrieswere quite high inthe money andinflation area.
The Pattern of the 1993-1995 Area Ratings
Exhibit 2-1, Part 2, indicates the Isl area ratings for thevarious countries. Let us take a closer look at their pattern in1993-1995. The ratings of the high-income industrial countrieswere quite high in the money and inflation area. With theexception of Finland, Iceland and Sweden, all of the industrialcountries earned a rating of 8.5 or more in the money area. Thesehigh ratings are a reflection of low rates of monetary growth, lowand stable rates of inflation, and the freedom of citizens to maintainforeign currency bank accounts both domestically and abroad.Among the less developed countries, Singapore, Taiwan, andThailand had the highest ratings (8.8 or more) in the money area.The ratings of Panama, Indonesia, Malaysia, and South Korea werejust slightly lower (between 7.6 and 7.9).
The component ratings for monetary expansion and inflationinstability of the South and Central American countries weregenerally low. Of course, this is a reflection of the erraticmonetary policy that has characterized this region for severaldecades. Several of the Middle Eastern and transitional economiesof Eastern Europe were also characterized by monetary and pricelevel instability in the first half of the 1990s (see ratings forcomponents I-A and I-B for evidence on these points). TheAfrican countries also had very low ratings in the monetary area.In several countries (for example, Ghana, Nigeria, Sierra Leone,Tanzania, Uganda, Zaire, Zambia, and Zimbabwe), monetaryinstability was a contributing factor. However, restrictions limitingthe use of foreign currencies were the primary reason for the low
60
www.fraserinstitute.org

ratings of most other African countries. The freedom to maintaina foreign currency bank account either domestically or abroad wasalmost totally absent in Africa.
The component ratings of the industrial countries in the areaof government operations were mixed. Since their governmentconsumption expenditures were generally large, with the exceptionof Japan, the ratings of the industrial countries were quite low forthis component. The European countries (for example, Austria,Italy, Denmark, Norway, Sweden, and Spain) also received lowratings for the government enterprise component. In contrast, theratings of the industrial countries were generally quite high for theease of entry into business, equal treatment under the law, andcredit market components. Overall, the government operations arearatings of New Zealand, Switzerland and United States were thehighest (7.6 or more) among the industrial countries while theratings of Austria, Italy, Norway, and Spain were the lowest(between 5.0 and 5.8).
In South and Central America, Argentina, Chile, and CostaRica had the highest ratings (7.0 or more) in the governmentoperations area, while Brazil, Haiti, and Nicaragua had the lowest.Among the other less developed countries, Hong Kong, Singapore,and Mauritius had the highest government operations area ratings.On the other hand, Egypt, Iran, Syria, Algeria, Congo, Zaire, andZambia were among those who did the most poorly in this area.
Large transfer sectors and high marginal tax rates pulleddown almost all industrial countries in the area of takings anddiscriminatory taxation. In addition, since most European countriesutilize conscription as a means of obtaining military personnel, theyalso earned a low rating for this component. This combination—alarge transfer sector, high marginal tax rates, and conscrip-tion—resulted in some very low ratings in the takings area. Thosefor Belgium, Denmark, Finland, France, Germany, Italy,Netherlands, and Sweden were among the lowest in the world.Among the non-industrial countries, the ratings of Hong Kong,Philippines, Fiji, Dominican Republic, Jamaica, and Jordan werequite high. Chile, Bulgaria, Egypt, Hungary, Israel, and Romaniawere among the countries with low ratings in this area.
In the international exchange area, with the exception ofIceland, the ratings of most industrial countries were quite high (8.0or more). Compared to other industrial countries, the rating of
Large transfersectors and highmarginal tax ratespulled down theratings of almostall industrialcountries.
61
www.fraserinstitute.org

Japan was also on the low side. The ratings of several Asiancountries—most notably Hong Kong, Singapore, Malaysia, andThailand—were strong in this area. Among the South and CentralAmerican countries, Argentina, Jamaica, and Panama had thehighest ratings and Brazil and Nicaragua the lowest in theinternational area. The Czech Republic, Greece, and Portugal alsoachieved high marks in this area, while those of Iran, Syria,Bangladesh, India and Nepal were relatively low. Among theAfrican nations, Zimbabwe, Botswana, Chad, South Africa, Zambiaand Zimbabwe registered the highest ratings.
Not only was HongKong the topranked country in1995, it was alsothe top-ratedcountry during thefour earlier ratingyears. Singapore,United States,Switzerland,Canada, andGermany were alsoin the Top 15during each of theprior years.
COUNTRY RANKINGS: 1975-1995
Exhibit 2-2 presents the economic freedom summary indexIsl for the 15 highest rated, 15 lowest rated, and selected othercountries for 1975, 1980, 1985, and 1990, as well as the 1995rankings. As discussed in Chapter 1, data for the components onentry into business (II-D) and equal treatment under the law (II-E)were only available for 1995. Similarly, the data required for theprice controls component (II-C) were available only for 1990 and1995. Thus, the summary index for 1990 has only 15 componentsand the indexes for 1975, 1980, and 1985 have only 14. In spiteof these limitations, the summary indexes for 1975-1990 provideinsight concerning the direction of changes in economic freedomduring this period.
There are several interesting points about the lists of the 15highest rated countries in the various years. First, several countrieswere in the Top 15 list during each of the rating years. Not onlywas Hong Kong the top ranked country in 1995, it also achievedthis status during the four prior rating years. Singapore, UnitedStates, Canada, and Switzerland were also in the Top 15 listduring each of the years. The summary ratings of these countriesgenerally improved during the two decades. For example, the Islrating of Singapore rose from 6.8 in 1975 to 8.0 in 1985 and 8.5in 1990, before receding to 8.2 in 1995. The Isl score of theUnited States rose steadily throughout the period, increasing from6.0 in 1975, 6.5 in 1985 and 7.7 in 1995.
Second, in addition to those remaining in the Top 15, therewas another group of top-ranked countries that improved theirrelative position substantially during the last two decades.
62
www.fraserinstitute.org

Malaysia, Japan, United Kingdom, Costa Rica, and Thailandcomprise this category. None of these countries ranked in the Top15 in 1975. Japan moved up steadily between 1975 and 1990,climbing to a sixth place ranking in 1990, before falling back toninth in 1995. The Isl summary score of Japan increased from 5.2in 1975 to 6.9 in both 1990 and 1995. The relative position of theUnited Kingdom increased steadily after 1980. The Isl rating of theUnited Kingdom jumped from 4.5 in 1980 to 6.0 in 1985 and 7.0in 1995. The Isl index indicates that the economy of the UnitedKingdom is now the sixth most free in the world. The summaryindex of Malaysia jumped from 5.1 in 1975 (and 5.6 in 1980) to7.1 in both 1985 and 1990. Costa Rica's improvement has beeneven more recent. Prior to 1990, Costa Rica was consistentlyranked in the upper part of the middle-rated group. Actually its Islsummary rating declined from 5.2 in 1975 to 4.8 in 1980 and 4.6in 1985. Since 1985 the rating of Costa Rica has improveddramatically jumping to 6.6 in 1990 and 6.7 in 1995. The 1995Isl rating of Costa Rica places it in an twelfth place tied withSouth Korea and Ireland among the 103 nations in our study.
Finally, there is another group of countries that ranked inthe Top 15 in 1975 that have clearly regressed. In 1975, the 7.4rating of Honduras was exceeded only by Hong Kong. But by1980, Honduras had slipped to tenth place and by 1990, it hadfallen from the Top 15 list. By 1995 the Isl rating of Hondurashad slid to 5.5, nearly two units less than its 1975 mark. Venezuelafollowed a similar course. Its 6.9 summary rating was the fifthhighest in 1975. By 1985 Venezuela was no longer in the Top 15and its summary score continued to drop, plunging to 5.5 in 1990and 4.5 in 1995.6
Perhaps Nicaragua provides the most dramatic illustrationof a plunge in the level of economic freedom during the last twodecades. In 1975 Nicaragua's Isl summary index was the eighthhighest in the world. Its rating, however, fell from 6.4 in 1975 to3.6 in 1980. By 1985, Nicaragua's rating had declined to 1.8, thirdlowest among the more than 100 countries in our study. Duringthe 1990s, Nicaragua's Isl summary rating has rebounded modestly,reaching 3.3 in 1995.
A few countries have remained persistently on the list of 15countries with the lowest freedom index ratings. Brazil has placedin the Bottom 15 during every year of our study. Iran and Syriahave been in this group for each of the last four rating years.
Malaysia, Japan,United Kingdom,Costa Rica, andThailand improvedtheir relativeposition andrecently moved intothe Top 15.
63
www.fraserinstitute.org
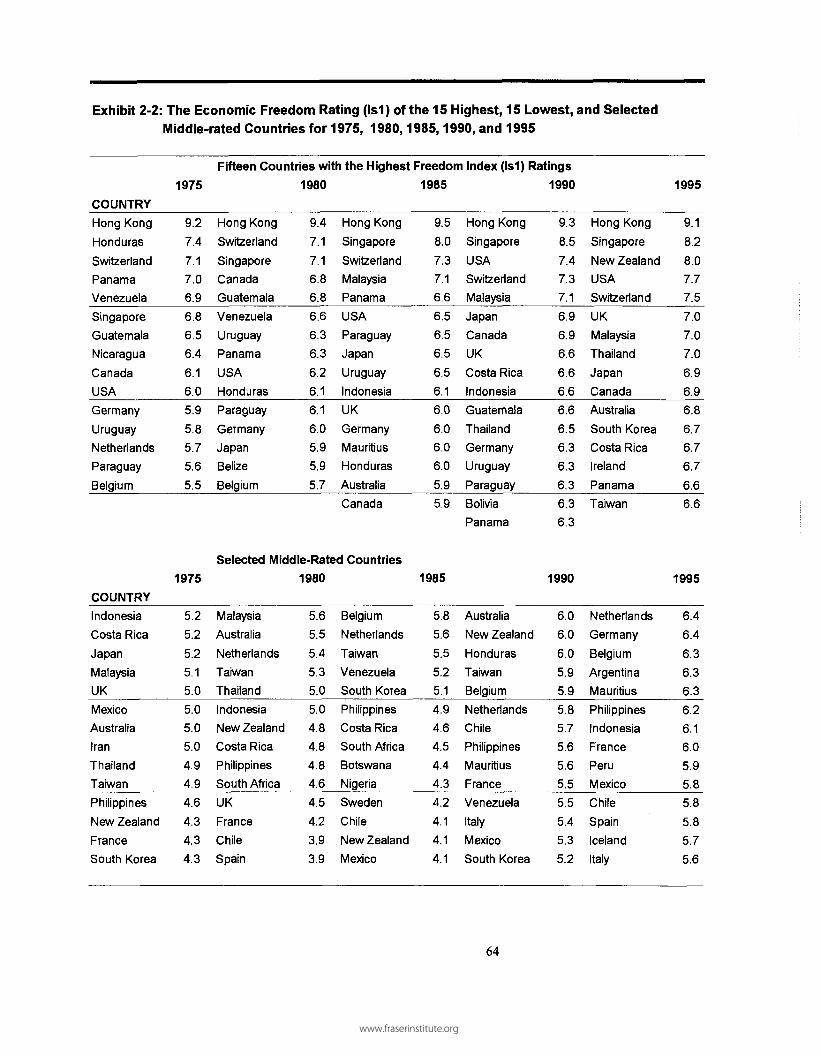
Exhibit 2-2: The Economic Freedom Rating (Is1) of the 15 Highest, 15 Lowest, and SelectedMiddle-rated Countries for 1975, 1980,1985,1990, and 1995
COUNTRY
Hong KongHondurasSwitzerlandPanamaVenezuelaSingaporeGuatemalaNicaraguaCanadaUSAGermanyUruguayNetherlandsParaguayBelgium
COUNTRY
IndonesiaCosta RicaJapanMalaysiaUKMexicoAustraliaIranThailandTaiwanPhilippinesNew ZealandFranceSouth Korea
1975
9.2
7.4
7.1
7.0
6.9
6.8
6.5
6.4
6.1
6.0
5.9
5.8
5.7
5.6
5.5
1975
5.2
5.2
5.2
5.1
5.0
5.0
5.0
5.0
4.9
4.9
4.6
4.3
4.3
4.3
Fifteen Countries with the Highest Freedom
Hong KongSwitzerlandSingaporeCanadaGuatemalaVenezuelaUruguayPanamaUSAHondurasParaguayGermanyJapanBelizeBelgium
1980
9.47.17.16.86.86.66.36.36.26.16.16.05.95.95.7
Hong KongSingaporeSwitzerlandMalaysiaPanamaUSAParaguayJapanUruguayIndonesiaUKGermanyMauritiusHondurasAustraliaCanada
Selected Middle-Rated Countries
MalaysiaAustraliaNetherlandsTaiwanThailandIndonesiaNew ZealandCosta RicaPhilippinesSouth AfricaUKFranceChileSpain
1980
5.65.55.45.35.05.04.84.84.84.64.54.23.93.9
BelgiumNetherlandsTaiwanVenezuelaSouth KoreaPhilippinesCosta RicaSouth AfricaBotswanaNigeriaSwedenChileNew ZealandMexico
1985
9.5
8.0
7.3
7.1
6.6
6.5
6.5
6.5
6.5
6.1
6.0
6.0
6.0
6.0
5.9
5.9
1985
5.8
5.6
5.5
5.2
5.1
4.9
4.6
4.5
4.4
4.3
4.2
4.1
4.1
4.1
Index (Is1) Ratings
Hong KongSingaporeUSASwitzerlandMalaysiaJapanCanadaUKCosta RicaIndonesiaGuatemalaThailandGermanyUruguayParaguayBoliviaPanama
AustraliaNew ZealandHondurasTaiwanBelgiumNetherlandsChilePhilippinesMauritiusFranceVenezuelaItalyMexicoSouth Korea
1990
9.3
8.5
7.4
7.3
7.1
6.9
6.9
6.6
6.6
6.6
6.6
6.5
6.3
6.3
6.3
6.3
6.3
1990
6.06.06.05.95.95.85.75.65.65.55.55.45.35.2
Hong KongSingaporeNew ZealandUSASwitzerlandUKMalaysiaThailandJapanCanadaAustraliaSouth KoreaCosta RicaIrelandPanamaTaiwan
NetherlandsGermanyBelgiumArgentinaMauritiusPhilippinesIndonesiaFrancePeruMexicoChileSpainIcelandItaly
1995
9.1
8.2
8.0
7.7
7.5
7.0
7.0
7.0
6.9
6.9
6.8
6.7
6.7
6.7
6.6
6.6
1995
6.4
6.4
6.3
6.3
6.3
6.2
6.1
6.0
5.9
5.8
5.8
5.8
5.75.6
64
www.fraserinstitute.org

Exhibit 2-2: (Con't)
1975
Selected Middle-Rated Countries (Con't)
1980 1985 1990
COUNTRY
1975
Fifteen Countries with the Lowest Freedom Index (Is1) Ratings
1980 1985 1990
COUNTRY
Source: Se e Appendix I for the component ratings and the summary indexes for the complete list ofcountries.
1995
ItalySouth AfricaMauritiusGreeceSyriaPeruSri LankaSwedenBotswanaNepalIndia
4.13.93.93.93.73.73.63.53.53.43.3
MauritiusGreeceIndiaItalyArgentinaNicaraguaSri LankaBotswanaPakistanSwedenPeruIceland
3.83.83.83.63.63.63.53.53.53.43.43.4
SpainPakistanTurkeyItalySri LankaPortugalIndiaPeruFranceEgyptIcelandGreece
4.13.93.83.63.63.53.43.43.43.33.33.2
SpainIcelandSouth AfricaTurkeySwedenPakistanEgyptPortugalPeruArgentinaIndiaGhanaGreece
4.74.74.64.64.54.24.24.14.03.83.73.63.4
SwedenPortugalHondurasSouth AfricaCzech Rep.GreecePolandIndiaVenezuelaIsraelTurkeyEgyptNigeria
5.55.55.54.94.94.94.84.54.54.24.24.03.9
1995
JamaicaBrazilTrinidad/Tob.ArgentinaHungaryZambiaTurkeyChileIcelandSomaliaGhanaEgyptPortugalPakistanIsraelUganda
3.23.23.23.13.02.92.82.82.72.62.52.42.42.32.11.2
PortugalMadagascarSyriaTunisiaC. African R.TogoBurundiBangladeshEgyptJamaicaAlgeriaBrazilSomaliaIranIsraelTurkeyGhanaUganda
3.13.13.13.13.02.92.92.82.82.82.72.72.52.52.32.32.32.2
TunisiaGhanaSyriaZambiaIranZimbabweIsraelArgentinaCzechoslov.AlgeriaBrazilPolandTanzaniaNicaraguaUgandaSomalia
2.82.82.72.72.72.62.52.52.42.42.32.21.91.81.71.1
MoroccoSyriaIranCongoIsraelHungaryBrazilAlgeriaUgandaCzechoslov.TanzaniaZimbabweRomaniaNicaraguaZambiaBulgariaSomalia
3.23.23.23.13.03.02.92.72.52.42.32.32.22.01.81.60.8
NepalNigerZambiaCongoZimbabweHungaryBrazilNicaraguaBurundiCote d'lvoireHaitiRomaniaSyriaIranAlgeriaZaire
3.63.63.63.53.43.33.33.33.23.22.92.92.62.12.11.9
65
www.fraserinstitute.org

Perhaps the mostdramatic improve-ments among thecountries in theBottom 15 twodecades ago havebeen registered byChile, Iceland, andquite recentlyArgentina.
Uganda and (perhaps surprising to some) Israel were on the Bottom15 list throughout the 1975-1990 period. Israel is an example ofa country that even through its rating is still quite low, has shownsome improvement. The 1975 summary index rating (Isl) of Israelwas 2.1, the second lowest in the world. Even though it remainedin the Bottom 15, its rating had risen to 3.0 by 1990 and it climbedto 4.2 in 1995. Egypt's experience was similar to that of Israel. In1975, Egypt's 2.4 rating placed it near the bottom. But the Islsummary index of Egypt rose to 2.8 in 1980 and 4.2 in 1990(Egypt's 1995 rating was 4.0).
Perhaps the most dramatic improvements among countriesin the Bottom 15 two decades ago have been registered by Chile,Iceland, and quite recently Argentina. In 1975 the summary index(Isl) of Chile was 2.8, eighth lowest among the countries that wewere able to rate during that year. But Chile has made steadyimprovement since that time. The Isl summary index of Chile roseto 3.9 in 1980, 5.7 in 1990, and 5.8 in 1995. This is a three unitincrease over a 20 year period. Iceland has achieved an increaseof similar magnitude. The index rating of Iceland jumped from 2.7in 1975 to 4.7 in 1990 and 5.7 in 1995. The advancement ofArgentina did not really begin until the late 1980s. As recently as1985, the Isl summary rating of Argentina was 2.5. Since thattime, the Argentine Isl rating has jumped to 3.8 in 1990 and 6.3in 1995, an increase of 3.8 units in a decade. In the yearsimmediately ahead, it will be interesting to monitor the impact ofthis dramatic improvement on the performance of the Argentineeconomy.
THE PERSISTENTLY HIGH ANDPERSISTENTLY LOW RATED COUNTRIES:1975-1995
Exhibit 2-3 identifies the countries that registeredpersistently high and persistently low ratings throughout the 1975-1995 period. Countries that received a letter grade of either A orB for the most recent rating year and ranked among the Top 15during each of the earlier rating years comprise the persistentlyhigh-rated group. Only six countries—Hong Kong, Switzerland,Singapore, United States, Canada, and Germany—were able toachieve this status. At the other end of the spectrum, Exhibit 2-3also provides the list of countries with persistently low rankings.
66
www.fraserinstitute.org

None of the nine countries included in the lower part of this exhibitwere able to register a summary index rating (Isl) as high as 4.0during any of the rating years. Their low ratings indicate thateconomic freedom has been stifled in almost every area. And thishas been the case for at least two decades.
If free economies grow more rapidly and our index is areasonably good measure of economic freedom, nations that arepersistently free over a lengthy period of time should achieve highlevels of income. Correspondingly, we would expect the incomelevels of the persistently unfree group to be low, as the result of thecumulative effects of slow growth and stagnation over a prolongedperiod of time. We will investigate this issue in Chapter 4.
If free economiesgrow more rapidly,nations that arepersistently freeover a lengthy timeperiod will achievehigh levels ofincome.
Exhibit 2-3: Countries with Either Persistently High orPersistently Low Ratings Throughout the 1975—1995 Period
Index of Economic Freedo m (Is1)
1975 1980 1985 1990
Persistently High Ratings8
1995
Hong Kon gSwitzerlandSingaporeUnited State sCanadaGermany
Persistently Low Ratings
SomaliaZambiaHungaryRomaniaBrazilSyriaUgandaZaireZimbabwe
9.27.16.86.06.15.9
2.62.93.0N/R3.23.71.23.6N/R
9.47.17.16.26.86.0
2.53.13.23.22.73.12.23.53.7
9.57.38.06.55.96.0
1.12.73.33.22.32.71.73.32.6
9.37.38.57.46.96.3
0.81.83.02.22.93.22.53.42.3
9.17.58.27.76.96.4
N/R3.63.32.93.32.63.71.93.4
N/R = No rating becaus e of insufficient dat a for several of the component sduring this year .a Thi s group of countries made a grade of A or B in 1993-95 and they wer ein the top 15 during 1975 , 1980, 1985 , and 1990 .b Th e Is1 summary ratin g for these countries was always les s than 4.0.
67
www.fraserinstitute.org
LOOKING AHEAD
We now have an overview of the ratings by country foreach of the years covered by our study. In the following chapter,we will analyze the changes in economic freedom during the lasttwo decades in more detail and attempt to determine whether theeconomic freedom of the world is increasing or decreasing.
Endnotes
1. The underlying data used to derive the country ratings for each of the 17components in our index are contained in the 17 tables of Appendix II. TheRoman numeral and letter labels for these tables match the area and letter labelsfor the components of our index. The note at the end of each table in AppendixII provides a detailed explanation of how the ratings for the component werederived. Readers interested in the details of the relationship between theunderlying data and the component ratings will want to review these tablescarefully.
2. Of course, area ratings could also be derived by using the weights associatedwith the Ie and Is2 aggregated indexes. (See Exhibit 1-2 for the componentweights associated with the alternative methods of aggregating the componentratings into area and summary ratings.) In most cases, the three alternativemethods yield similar results. Thus, in the interest of preserving space, only theIsl area ratings are presented here.
3. If the data for a component could not be obtained for a country, the weightfor that component was distributed proportionally among the other componentswhen deriving a summary index for the country.
4. Our survey respondents indicated that a high level of governmentconsumption, a large transfer and subsidy sector, and high marginal tax rates areimportant infringements upon economic freedom. We agree. Thus, we believethat Isl is a more accurate indicator of economic freedom than Is2.
5. Some may be interested in the differences between our index and that ofBryan T Johnson and Thomas P. Sheehy, The Index of Economic Freedom,(Washington, D.C.: Heritage Foundation, 1995). There are several differencesbetween the two. First our index is more comprehensive—it has 17 componentscompared to 10 for the Johnson-Sheehy Index. Second, we developed ratings forfive different years over two decades. This makes is possible to track theeconomic freedom of various countries over time. The Johnson-Sheehy Indexcovers only one year. Third, Johnson and Sheehy do not attempt to deal with theproblem of how to weight the different components. They simply averaged theirten components when deriving their summary rating. Finally, our index is basedon objective variables and the relationship between underlying data and acountry's component ratings is clearly specified. We sought to minimize therole of judgment calls. This was not always the case with the Johnson-Sheehyindex.
68
www.fraserinstitute.org

With regard to the results, there are both similarities and differences.Hong Kong and Singapore rank one and two in the Johnson-Sheehy Index justas they do in our Isl index. United States, Japan, Canada, United Kingdom, andGermany rank high in both indexes. But there are also some strikingdifferences. Johnson and Sheehy rate Uganda as the 43rd freest country amongthe 101 in their study. For our three indexes, Uganda ranks 92nd (Ie), 83rd(Isl), and 98th (Is2). The average of our three indexes places it in the BottomTen among the 102 countries in our study. Given that the monetary policy ofUganda is among the most unstable in the world, citizens are prohibited fromowning foreign currencies, exchange rate controls are highly restrictive, andforeigners cannot undertake investments without the permission of thegovernment, it is difficult for us the perceive how Uganda could possible earna middle ranking in terms of economic freedom.
There are other differences that we find troublesome. Johnson andSheehy rank the Czech Republic 12th, while it ranks 51st in our index. TheCzech Republic has handled the transition better than any Eastern Europeancountry, but with its high level of government consumption, continued stateownership of many enterprises and assets (including approximately one-third ofthe housing stock), and use of conscription, we do not believe it is the 12th freestcountry in the world. In the Johnson and Sheehy index, Hungary and Tunisiaare ranked 31 and 36, while Poland is 62nd. Both our index and knowledge ofthese countries suggests that the economy of Poland is more free than eitherHungary or Tunisia. Despite the reservations, we admire Johnson and Sheehyfor tackling this difficult problem.
6. During the last decade, several countries in South and Central America haveliberalized their economies; Honduras and Venezuela are two interestingexceptions. The primary factors underlying the fall in the summary rating ofVenezuela are monetary and financial—tighter restrictions on the convertibilityof the domestic currency, new restrictions on the maintenance of foreigncurrency accounts and the mobility of capital, and greater use of price controls.In the case of Honduras, increased monetary instability, exchange rate controls,and widespread use of price controls have contributed to the rating declines.
69
www.fraserinstitute.org

www.fraserinstitute.org

CHAPTER 3
Changes in Economic FreedomDuring 1975-1995
Policies and institutional arrangements influence economicfreedom. How has the economic freedom of various countrieschanged during the last two decades? Have there been changes inthe economic freedom of the world in recent years? If so, what arethe primary sources of these changes? How has the degree ofeconomic freedom changed according to development status andregion? This chapter will address these and related issues.
CHANGES IN THE ECONOMIC FREEDOMOF COUNTRIES
In some ways, the changes in economic freedom are evenmore interesting than the level. If our index is a good measure ofeconomic freedom, an increase in a country's summary ratingindicates that it is moving toward liberalization—that the economicfreedom of the citizenry is expanding. In contrast, a reduction inthe summary rating would suggest a decline.
Changes in Summary Ratings: 1975-1990
Which countries have experienced the largest changes ineconomic freedom in recent years? Exhibit 3-1 indicates the 15(actually there are 17 because of a tie) nations for which thesummary index (Isl) increased the most between 1975 and 1990.1
Chile, Jamaica, Iceland, and Malaysia head the list. The Islsummary index of these four countries increased by 2.0 or moreduring the 1975-1990 period. The increases of Pakistan, Turkey,Egypt, Portugal, Japan, Singapore, Mauritius, and New Zealandwere only slightly less than those of the Top Four countries.
www.fraserinstitute.org

Exhibit 3-1: The Ratings of the 15 CountriesIncrease in the Index of Economic Freedom1975-1990 Period
Country
Chile
Jamaica
Iceland
Malaysia
Pakistan
Turkey
Egypt
Portugal
Japan
Singapore
Mauritius
New Zealand
United Kingdo m
(tie) Thailand
(tie) Indonesi a
(tie) Unite d States
(tie) Costa Rica
Index of E
1975
2.8
3.2
2.7
5.1
2.3
2.8
2.4
2.4
5.2
6.8
3.9
4.3
5.0
4.9
5.2
6.0
5.2
Economic
1980
3.9
2.8
3.4
5.6
3.5
2.3
2.8
3.1
5.9
7.1
3.8
4.8
4.5
5.0
5.0
6.2
4.8
With the Largest(Is1) During the
Freedom (Is1 )
1985
4.1
4.4
3.3
7.1
3.9
3.8
3.3
3.5
6.5
8.0
6.0
4.1
6.0
5.3
6.1
6.5
4.6
1990
5.7
5.2
4.7
7.1
4.2
4.6
4.2
4.1
6.9
8.5
5.6
6.0
6.6
6.3
6.6
7.4
6.6
ChangeBetween1975 and
1990
+2.9
+2.0
+2.0
+2.0
+1.9
+1.8
+1.8
+1.7
+1.7
+1.7
+1.7
+1.7
+1.6
+1.4
+1.4
+1.4
+1.4
Source: Th e change in the index Is1 during the 1975-1990 period was derivedfrom the summary ratings of Appendix I : Table s A1-1 and A1-4.
United Kingdom, Thailand, Indonesia, United States, and CostaRica round out this list of countries that, according to our summaryindex, moved most rapidly toward liberalization during the 1975-1990 period.
The group with the largest expansion in economic freedomis highly diverse. It includes countries from Europe, Asia, Southand Central America, Oceania, and Africa. There are those with
72
www.fraserinstitute.org

high-income industrial backgrounds like Japan, United Kingdom,New Zealand, and United States as well as those with low percapita incomes like Turkey, Egypt, Thailand, Jamaica, andIndonesia. In 1975, the economic freedom rating for some wasamong the lowest in the world. Chile, Iceland, Pakistan, Turkey,Egypt, and Portugal fall into this category. On the other hand,some—Singapore and United States for example—were alreadyhighly rated in 1975. Clearly, these data suggest that improvementin economic freedom can be achieved by countries with highlydiverse characteristics.
Exhibit 3-2 indicates the 15 nations (there are 16 in thisgroup as the result of a tie) for which the summary index ofeconomic freedom (Isl) declined the most between 1975 and 1990.Nicaragua, Somalia, Iran, Honduras, Venezuela, and Congo headthis list. This group is somewhat less diverse. Seven of the 16countries are African; six (Nicaragua, Honduras, Venezuela,Panama, El Salvador and Brazil) are Latin American; and two (Iranand Syria) are Middle Eastern. There are no Asian countries andonly one (Greece) from Europe in this group. Neither are thereany high-income industrial countries on the list.
Countries with Sustained Increases inEconomic Freedom: 1975-1995
Economic theory indicates that credibility and sustainedprogress are important if an increase in economic freedom is goingto exert its full positive impact on the performance of an economy.Neither domestic nor foreign investors are likely to risk much oftheir savings if they fear that, for example, a relaxation of creditmarket controls or a shift to a less inflationary monetary policy islikely to be reversed in the near future. Thus, countries that movesteadily and consistently toward economic liberalization are likelyto achieve a higher level of economic performance than those thatshift back and forth between liberal and restrictive policies.
In the next two exhibits^ countries that have both achievedand sustained substantial increases in economic freedom during theperiod of our study will be identified. The nine nations listed inExhibit 3-3 achieved at least a one unit increase in their Islsummary index between 1975 and 1985 and they maintained thatincrease during the next decade—their rating in 1995 was at leastas high as in 1985. Others may have achieved as large increases,
Credibility andsustained progressare important if anincrease ineconomic freedomis going to exert itsfull positive impact.
73
www.fraserinstitute.org

Exhibit 3-2: The Ratings of the 15 Countries With the LargestDecline in the Index of Economic Freedom (Is1) During the1975-1990 Period
Country
Nicaragua
Somalia
Iran
Honduras
Venezuela
Congo
Zambia
Tanzania
Algeria
Morocco
Panama
Syria
Greece
El Salvador
(tie) Brazi l
(tie) Sierr a Leon e
Index of
1975
6.4
2.6
5.0
7.4
6.9
4.5
2.9
3.3
3.5
3.9
7.0
3.7
3.9
4.7
3.2
4.2
Economic
1980
3.6
2.5
2.5
6.1
6.6
4.0
3.1
4.0
2.7
3.7
6.3
3.1
3.8
3.7
2.7
3.5
Freedom
1985
1.8
1.1
2.7
6.0
5.2
4.0
2.7
1.9
2.4
4.1
6.6
2.7
3.2
4.1
2.3
3.9
(Is1)
1990
2.0
0.8
3.2
6.0
5.5
3.3
1.8
2.3
2.7
3.2
6.3
3.2
3.4
4.3
2.9
3.9
ChangeBetween1975 and
1990
-4.4
-1.8
-1.8
-1.4
-1.4
-1.2
-1.1
-1.0
-0.8
-0.7
-0.7
-0.5
-0.5
-0.4
-0.3
-0.3
Source: Th e change in the index Is1 during the 1975-1990 period was derivedfrom the summary ratings of Appendix I : Table s A1-1 and A1-4.
but they were unable to maintain them. In essence, Exhibit 3-3lists the nations that took a substantial step toward economicliberalization during 1975-1985 and maintained the more liberalpolicies into the 1990s. No other countries were able to bothachieve and sustain such large increases during this period.
The largest increase was achieved by Mauritius.2 Severalfactors contributed to the jump in this country's summary ratingbetween 1975 and 1985. In the early 1970s, the economy ofMauritius was characterized by monetary expansion and a highly
74
www.fraserinstitute.org

Exhibit 3-3: Countries With at LeastSummary Rating Between 1975 andIncrease Between 1985 and 1995
Country
Mauritius
Pakistan
Japan
Chile
Jamaica
Singapore
Portugal
UnitedKingdom
Turkey
Index
1975
3.9
2.3
5.2
2.8
3.2
6.8
2.4
5.0
2.8
a One Unit Increase in the Is11985 and Maintenance of This
: of Economic Freedo m (I
1980
3.8
3.5
5.9
3.9
2.8
7.1
3.1
4.5
2.3
1985
6.0
3.9
6.5
4.1
4.4
8.0
3.5
6.0
3.8
1990
5.6
4.2
6.9
5.7
5.2
8.5
4.1
6.6
4.6
s1)
1995
6.3
5.4
6.9
5.8
6.3
8.2
5.5
7.0
4.2
Change
1975-85
+2.1
+1.6
+1.3
+1.3
+1.2
+1.2
+1.1
+1.0
+1.0
in Is1
1985-95
+0.3
+1.5
+0.4
+1.7
+1.9
+0.2
+2.0
+1.0
+0.4
Source: Derive d from Exhibi t 2-1 an d Appendix I .
variable inflation rate. During 1970-1975, the growth rate of theMl money supply (adjusted for growth of real output) averaged 30percent and the standard deviation of the annual rate of inflationwas 20 percent. Reflecting this rapid monetary expansion and pricelevel instability, Mauritius' 1975 rating for these two components(IA and IB) was one (on our ten point scale). By the mid-1980s,Mauritius had moved toward a substantially more stable monetarypolicy. Its 1985 ratings for monetary expansion and inflationstability were 10 and 9 respectively, quite an improvement over the1975 ratings. Relaxation of exchange rate controls anddevelopment of a stable competitive credit market also contributedto the improvement during the 1975-1985 period.
Pakistan, Japan, and Chile also made substantial gainsbetween 1975 and 1985. Pakistan can credit its improvement togreater monetary stability and elimination of conscription. Japan'sincrease reflected less expansionary monetary policy, greater pricestability, and removal of various restrictions on capital movements.
The Isl summary index of Chile rose from 2.8 in 1975 to4.1 in 1985 and 5.8 in 1995, an increase of 3.0 units in two
75
www.fraserinstitute.org

Portugal's topmarginal tax ratewas sliced from82% in 1975 (and84% in 1980) to69% in 1985 and40% in 1990.
decades. Several factors contributed to the improvement. In themid-1970s, Chile's monetary policy was a disaster. Triple-digitincreases in the money supply were causing triple-digit rates ofinflation (and wild fluctuations in the inflation rate.) Morerecently, the rates of monetary expansion and price level increaseshave been in the 10% to 20% range, considerably less than ideal,but nonetheless a substantial improvement compared to the early1970s. In the early 1980s, Chile legalized the use of foreigncurrency bank accounts both domestically and abroad. Reductionsin government expenditures as a share of GDP, privatization, lowermarginal tax rates,3 and a relaxation of restrictions on themovement of capital also contributed to the improvement in thesummary rating of Chile during the 1975-1995 period.
Portugal's situation while not as dramatic was quite similarto that of Chile. Its Isl summary rating rose from 2.4 in 1975 to3.5 in 1985 and 5.5 in 1995, an increase of 3.1 units during the 20-year period. During the 1975-1985 period, relaxation of exchangerate controls and lower tariffs propelled Portugal's initialimprovement. In 1975, Portugal imposed tight exchange ratecontrols and, as a result, the accompanying black market exchangerate premium was quite high (48%). These controls wereliberalized throughout the period and the Portuguese escudo is nowfully convertible. Portugal's average tax rate on international tradefell from 4.6% in 1975 to 1.2% in 1985 (and 0.5% in the early1990s.) Lower marginal tax rates and deregulations of financialand capital markets have contributed to continued improvementduring the last decade. The top marginal tax rate was sliced from82% in 1975 (and 84% in 1980) to 69% in 1985 and 40% in 1990.Legislation in the late 1980s relaxed restraints on the flow ofcapital both into and out of the country. Finally, in the early 1990s,Portugal legalized the maintenance of foreign currency bankaccounts. As Exhibits 3-1 and 3-3 show, Portugal and Chile areleaders among those that have made persistent moves toward afreer economy during the last two decades.
Exhibit 3-4 lists the ten countries that made the largest gainsin economic freedom between 1980 and 1990 and sustained theminto the mid-1990s. In essence, the nations of Exhibit 3-4 begantheir moves toward economic freedom a little later than those inExhibit 3-3. There is some overlap between the two—Chile andMauritius are on both lists. Jamaica, United Kingdom, Costa Rica,
76
www.fraserinstitute.org

Exhibit 3-4 : The TenIs1 Summary RatingMaintenance o f This
Country
Jamaica
UnitedKingdom
CostaRica
Bolivia
Chile
Italy
Mauritius
Mexico
Norway
Thailand
Countries With the Largest Increase in theBetween 1980 and 1990 and theIncrease Between 1990 and 1995
Index of Economic Freedo m
1980
2.8
4.5
4.8
4.5
3.9
3.6
3.8
3.8
3.4
5.0
1985
4.4
6.0
4.6
4.2
4.1
3.6
6.0
4.1
3.9
5.3
1990
5.2
6.6
6.6
6.3
5.7
5.4
5.6
5.3
4.8
6.3
1995
6.3
7.0
6.7
6.4
5.8
5.6
6.3
5.8
5.7
7.0
ChangeIs
1980-90
+2.4
+2.1
+1.8
+1.8
+1.8
+1.8
+1.8
+1.5
+1.4
+1.3
in Index;1
1990-95
+1.1
+0.4
+0.1
+0.1
+0.1
+0.3
+0.7
+0.5
+0.9
+0.7
Bolivia, and Chile head the group of countries that registered themost improvement during the 1980s and maintained it into 1993-1995. The Isl summary rating of Jamaica rose from 2.8 in 1980to 5.2 in 1990 and 6.3 in 1995. Legalization of foreign currencybank accounts, persistent reductions in the top marginal tax rate(the top rate was cut from 80% in 1980 to 33% in 1990 and 25%in 1994), relaxation of exchange rate controls, and more liberalinternational trade policies were the primary factors underlying thegains of Jamaica. In the case of the United Kingdom, privatization,removal of restrictions on foreign bank currency accounts, and taxcuts (the top marginal tax rate was reduced from 83% in 1979 to40% in 1989) provided the impetus for the gains. Reductions intop marginal tax rates and a more liberalized trade regime were theprimary forces contributing to the recent improvement of bothCosta Rica and Bolivia.
77
www.fraserinstitute.org

Since 1985, nocountry has movedmore rapidlytoward a freeeconomy than NewZealand andArgentina.
Country Rating Increases: 1985-1995
The economic freedom index increased substantially forquite a large number of countries between 1985 and 1995. Exhibit3-5 (left side) presents the 1985, 1990, and 1995 ratings for the 15countries with the largest increases in the economic freedom index(Isl) during the last decade. Since 1985, no country has movedmore rapidly toward a free economy than New Zealand andArgentina. The summary ratings of these two countries haveincreased by almost four points. Let us take a closer look at thespecific areas of change in these two countries.
Monetary reform, reductions in marginal tax rates, and de-regulation of the exchange and capital markets provided the majorsources for the gains of New Zealand. In the late 1980s, NewZealand legalized the holdings of foreign currency bank accountsboth domestically and abroad. The ratings for these twocomponents jumped from zero to ten. In addition, legislation waspassed instructing the central bank to maintain a low and stable rateof inflation—and the law provided for accountability. If the rate ofinflation is not maintained within a specified narrow band, thegovernor of the central bank is subject to dismissal.Unsurprisingly, price level stability increased. The inflation rate,which had been fluctuating between 6% and 20% during the 1980s,declined sharply and remained between 1% and 3% during the firsthalf of the 1990s. Thus, New Zealand's rating for the pricestability component (I-B) jumped from 4 in 1990 to 10 in 1995.In the late 1980s, New Zealand's top marginal tax rate was paredfrom 66 to 33 percent. Exchange rate controls were eliminated andthe restrictions on capital mobility were scrapped. Clearly, theimprovement in the summary rating of New Zealand reflectedwidespread economic reform.
Argentina has reduced government consumption as a shareof the economy, privatized several enterprises that were previouslyoperated by the government, and virtually eliminated price controlsduring the last decade. The top marginal tax rate was reduced from62% in 1985 to 35% in 1990 and 30% in 1994. Thus, theArgentine rating for this component jumped from a 2 in 1985 to a9 in 1995. In the mid-1980s, Argentina imposed both exchangerate controls and tight restrictions on capital movements. By themid-1990s, the Argentine peso was fully convertible and the
78
www.fraserinstitute.org
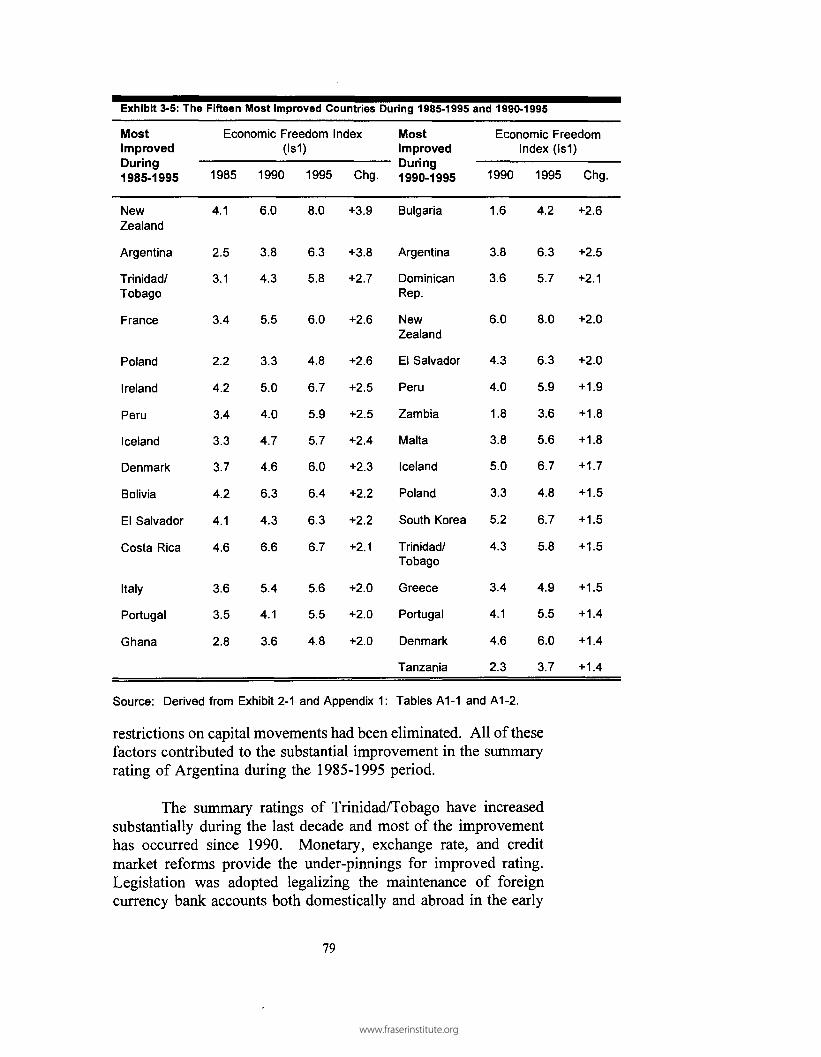
Exhibit 3-5: The
MostImprovedDuring1985-1995
NewZealand
Argentina
Trinidad/Tobago
France
Poland
Ireland
Peru
Iceland
Denmark
Bolivia
El Salvado r
Costa Ric a
Italy
Portugal
Ghana
Fifteen IMost Improved Countries
Economic Freedo m(Is1)
1985
4.1
2.5
3.1
3.4
2.2
4.2
3.4
3.3
3.7
4.2
4.1
4.6
3.6
3.5
2.8
1990
6.0
3.8
4.3
5.5
3.3
5.0
4.0
4.7
4.6
6.3
4.3
6.6
5.4
4.1
3.6
1995
8.0
6.3
5.8
6.0
4.8
6.7
5.9
5.7
6.0
6.4
6.3
6.7
5.6
5.5
4.8
Index
Chg.
+3.9
+3.8
+2.7
+2.6
+2.6
+2.5
+2.5
+2.4
+2.3
+2.2
+2.2
+2.1
+2.0
+2.0
+2.0
During 1985-1995
MostImproved
1990-1995
Bulgaria
Argentina
DominicanRep.
NewZealand
El Salvador
Peru
Zambia
Malta
Iceland
Poland
South Kore a
Trinidad/Tobago
Greece
Portugal
Denmark
Tanzania
and 1990-1995
Economic Freedo mIndex (Is1 )
1990
1.6
3.8
3.6
6.0
4.3
4.0
1.8
3.8
5.0
3.3
5.2
4.3
3.4
4.1
4.6
2.3
1995
4.2
6.3
5.7
8.0
6.3
5.9
3.6
5.6
6.7
4.8
6.7
5.8
4.9
5.5
6.0
3.7
Chg.
+2.6
+2.5
+2.1
+2.0
+2.0
+1.9
+1.8
+1.8
+1.7
+1.5
+1.5
+1.5
+1.5
+1.4
+1.4
+1.4
Source: Derive d from Exhibi t 2-1 and Appendix 1 : Table s A1-1 and A1-2.
restrictions on capital movements had been eliminated. All of thesefactors contributed to the substantial improvement in the summaryrating of Argentina during the 1985-1995 period.
The summary ratings of Trinidad/Tobago have increasedsubstantially during the last decade and most of the improvementhas occurred since 1990. Monetary, exchange rate, and creditmarket reforms provide the under-pinnings for improved rating.Legislation was adopted legalizing the maintenance of foreigncurrency bank accounts both domestically and abroad in the early
79
www.fraserinstitute.org

1990s. The Exchange Rate Control Act of 1993 provided for afloating exchange rate and removed the restrictions on theconvertibility of the Trinidad/Tobago dollar. This legislationeliminated the black market exchange rate premium, which hadbeen running in the 40% to 60% range for more than a decade.The requirement that foreigners obtain the approval of thegovernment prior to undertaking an investment project wasscrapped. Most other restrictions on the movement of capital intoand out of the country were eliminated. Trinidad/Tobago continuesto be plagued by large government expenditures—particularly whencompared to other low-income, less developed countries—and alarge government-enterprise sector. It will be interesting to seewhether the recent monetary reforms and deregulation of theforeign exchange and capital markets are sustained and, if they are,how the economy develops in the decade ahead.
As Exhibit 3-5 illustrates, several other countries have alsomade substantial gains during the last decade. The summaryratings (Isl) of France, Poland, Ireland, Peru, Iceland, Denmark,Bolivia, and El Salvador increased by 2.2 units or more during the1985-1995 period. The summary ratings of Costa Rica, Italy,Portugal, and Ghana also climbed substantially during this period.
A few countries with exceedingly low ratings and modestincreases prior to 1990 also registered sizeable jumps in the early1990s. Bulgaria, Dominican Republic, Zambia, and Tanzania fallinto this category.4 At this point it is too early to tell whetherthese reforms will be long lasting or merely temporary. In theyears immediately ahead, investors and other observers will wantto keep a close eye both on these recent gainers, and thosecountries that began moving toward more liberal policies during thelatter half of the 1980s.
CHANGES IN THE ECONOMIC FREEDOMOF THE WORLD
Has the degree of economic freedom changed during the last20 years? Exhibit 3-6 provides insight concerning this question.Data on the three summary indexes for the countries in our studyare available for each of the rating years. There was little changein these summary indexes between 1975 and 1985. The averageIsl summary index hardly changed at all while the average for the
80
www.fraserinstitute.org

Ie and Is2 indexes rose by only 0.3 of a unit between 1975 and1985. However, the picture was quite different during the 1985-1995 decade. The Isl index rose from 4.3 in 1985 to 4.6 in 1990and 5.2 in 1995. The other two summary indexes rose by similaramounts. Thus, each of the indexes was approximately a full pointhigher in 1995 than in 1985. This indicates that while there waslittle change in the economic freedom of the world between 1975and 1985, a significant amount of liberalization has occurred since1985.
The changes in the average ratings for the components ofour index shed light on the nature of the increases in economicfreedom. First, during the last decade there has been a substantialmove toward liberalization in the money and inflation area. Therating for the variability in the inflation rate component hasexceeded 5.0 during each of the last four rating periods, up from3.8 in 1975. There has also been an increase in the freedom ofcitizens to maintain foreign currency bank accounts bothdomestically and abroad—particularly during the last ten years. Theaverage component rating for domestic ownership of foreigncurrency accounts (component I-C) rose from 3.8 in 1985 to 6.0 in1995. Simultaneously, the average rating for the freedom tomaintain a bank account abroad (component I-D) rose from 2.8 in1985 to 5.0 in 1995.5
In addition to the monetary area, there was a substantialincrease in the average rating for the credit market component (II-F). The average rating for this component rose from 4.8 in 1975to 7.1 in 1985 and 7.6 in 1995. This indicates that countries weremuch less likely to impose interest rate controls and followinflationary policies in the mid-1990s than during the mid-1970s.Thus, credit markets today are both more integrated and morecompetitive than they were two decades ago.
The path of the marginal tax rate component is particularlyinteresting because the direction of change in the average ratingreversed during the 1980s. Between 1975 and 1985, there was atendency for countries to increase their top marginal tax ratesand/or impose the top rate at a lower income level. Thus, theaverage rating for this component (III-B) fell from 3.5 in 1975 to2.5 in 1985. However, this trend changed during the latter half ofthe 1980s. The average rating for this component rose to 4.1 in1990 and 5.4 in 1995. In 1985, there were 48 countries thatimposed a top marginal tax rate of 60% or more on personal
In 1985, 48countries imposedtop marginal taxrates of 60% ormore. By 1994,only 10 imposedsuch high rates.
81
www.fraserinstitute.org

Exhibit 3-6: Changes in the Average Value of the Components of the Index ofEconomic Freedom and the Average Summary Rating of Countries: 1975—1995
Average Ratin g of ComponentComponents (Th e number of countries rated is in parentheses.)
1975 198 0 198 5 199 0 199 5
IA: Money Expansion 3. 6 (93 ) 3. 8 (97 ) 5. 1 (101) 4. 5 (102) 4. 2 (102)
IB: Inflatio n Variability 3.8(97 ) 5.3(99 ) 5.1(102 ) 5.4(102 ) 5.4(103 )
IC: Foreign Currency Accounts 3. 2 (97 ) 3. 7 (100 ) 3. 8 (101 ) 4. 6 (102 ) 6. 0 (103)
ID: Deposit s Abroad 2.5(99 ) 2.9(99 ) 2.8(101 ) 3.8(102 ) 5.0(103 )
MA: Government Consumption 5.3(96 ) 5.1(101 ) 5.0(102 ) 5.1(100 ) 4.8(101 )
MB: Government Enterprise s 4. 5 (102) 4. 4 (102) 4. 2 (102) 4. 3 (102 ) 4. 5 (103)
IIC: Price Controls - - - 3. 7 (79 ) 4. 9 (87)
IID: Entr y into Business - - - — 6.5(103 )
HE: Equality Under the Law - - - 3.7(103 )
IIF: Credi t Market 4. 8 (27 ) 5. 7 (73 ) 7. 1 (80 ) 7. 0 (89 ) 7. 6 (85 )
5.4 (77) 5. 0 (81 ) 5. 2 (82 ) 4. 9 (75 )
2.4 (69) 2.5 (78) 4.1 (80) 5.4 (81)
4.7 (101) 4.1 (102) 4.1 (102) 4.3 (103)
4.5 (96) 5.1 (90) 5.9 (90) 6.4 (66)
5.4 (102) 5.2 (102) 5.0 (102) 6.1 (102) 7.5 (102)
4.8 (101) 5.0 (101) 4.7 (102) 4.8 (100)
2.4 (102) 2.6 (102) 3.0 (102) 4.1 (103)
4.3 (99) 4.4 (102) 4.7 (102) 5.2 (101)
4.3 (99) 4.3 (102) 4.6 (102) 5.2 (101)
4.1 (99) 4.2 (102) 4.5 (102) 5.2 (101)
Source: Derive d from Exhibi t 2-1 and Appendix 1 : Table s A1-1 and A1-2.
income. By 1994, only ten (Japan, Belgium, Denmark, Finland,Netherlands, Sweden, Romania, Cameroon, Gabon, and Zaire)
82
MA: Transfers & Subsides
IIIB: Margina l Tax Rate s
11 IO: Conscription
IVA: Trade Taxes
IVB: Exchang e Rate Controls
IVC: Siz e of Trade Sector
IVD: Capita l Mobility Restraint s
Summary Ratings :Index l e
Index Is 1
Index Is2
5.9 (65)
3.5 (62)
4.9 (91)
4.4 (93)
5.4 (102
4.9 (97)
2.1 (99)
4.1 (94)
4.2 (94)
3.9 (94 )
www.fraserinstitute.org

imposed such high rates. The top marginal rate was 70% or morefor 13 countries in 1985. None levied such a high rate on personalincome in 1994.
Numerous nations have chopped their high marginal taxrates during the last decade. For example, during the 1985-1994period, Norway cut its top rate from 64% to 42%; the top rate inArgentina was reduced from 62% to 30%; in Costa Rica from 50%to 25%; in Dominican Republic from 73% to 25%; and the toprates of both Peru and Malta fell from 65% in 1985 to 30% in1994. The top marginal rates of several African countries havealso declined sharply. Ghana recently cut its top marginal ratefrom 55% to 30%. Tanzania sliced its top rate from 95% in 1985to 50% in 1990 and 30% in 1994. In Zambia, the top rate plungedfrom 75% in 1990 to 30% in 1994. These factors explain theincreased average rating for the marginal tax rate component duringthe last decade. See Appendix II, Table III-B for additionalinformation on changes in marginal tax rates.
Lower taxes on international trade, relaxation of exchangerate controls, and more liberal policies toward capital movementshave also contributed to the improvement in the average summaryratings, particularly during the last decade. There was a downwardtrend in the average tax rate on international trade throughout theperiod of our study. Thus, the rating for this component (IV-A)rose from 4.4 in 1975 to 5.1 in 1985 and to 6.4 in 1995. Whilethere was little relaxation of exchange rate controls between 1975and 1985—the average rating for this component actually declinedfrom 5.4 to 5.0 during this period—there has been substantialliberalization during the last decade. In 1985, there were 38countries that imposed restrictive exchange controls such that theaccompanying black market exchange rate premium was 25% ormore. By 1995, there were only eleven (Haiti, Iran, Romania,Syria, Bangladesh, Nepal, Algeria, Burundi, Madagascar, Nigeria,and Rwanda) in this category (see Appendix II, Table IV-B).Reflecting these changes, the rating for the exchange rate controlscomponent (IV-B) rose from 5.0 in 1985 to 7.5 in 1995. Therewas also some relaxation of the control on capital movements. Therating for this component (IV-D) rose from 2.1 in 1975 to 4.1 in1995. Most of that increase took place during the most recentdecade.
Improvement in the average component ratings was notuniversal. There was little change in the average rating for
In 1985, 38countries imposedrestrictive exchangecontrols such thatthe accompanyingblack marketexchange ratepremium was 25%or more. In 1995,only elevenimposed suchcontrols.
83
www.fraserinstitute.org

Since 1985 theevidence indicatesthat the overalllevel of economicfreedom of theworld hasincreased.
government enterprises as a share of the economy. While there hasbeen a lot of talk about privatization and a few countries haveprivatized a significant number of their state enterprises, the overallchange has been modest. The ratings for government consumptionas a share of GDP (II-B), size of the transfer-subsidy sector (III-A),and conscription (III-C) actually declined during the period,particularly during the 1975-1985 period. The average rating fortransfers and subsidies as a share of the economy fell from 5.9 in1975 to 5.0 in 1985, and there has been little change since then.The rating for the conscription component followed a similar path,declining from 4.9 in 1975 to 4.1 in 1985. Again, there was littlesubsequent change.
We are now in a position to summarize our findings withregard to the overall change in the economic freedom of the worldduring the last two decades. First, there was little change ineconomic freedom between 1975 and 1985. A few of thecomponents in our index increased during this period but therewere offsetting declines in others. Second, since 1985 the evidenceindicates that the overall level of economic freedom of the worldhas increased. Several factors have contributed to thisimprovement. There has been less variability in the inflation rate.Many countries have removed prior legal restrictions against theownership and use of foreign currency bank accounts bothdomestically and abroad. Credit market restrictions and otherpolicies that lead to negative real interest rates were considerablyless common in the 1990s than in the 1970s. Reductions in highmarginal tax rates have enhanced the freedom of highly productiveand hard-working citizens to keep what they earn. Taxes oninternational trade have been reduced, exchange rate controlsrelaxed considerably, and restrictions on the movement of capitalhave been liberalized in many countries around the world. As aresult of these changes, international exchange is now freer than itwas a decade ago.
CHANGES IN ECONOMIC FREEDOM BYDEVELOPMENT STATUS AND REGION
Is there a difference between industrial and less-developednations with regard to the changes in economic freedom during thelast two decades? Exhibit 3-7 sheds light on this issue. As thisexhibit illustrates, the average summary rating of the 20 countries
84
www.fraserinstitute.org

classified as "industrial" increased from 4.7 to 5.0 during the 1975-1985 period.6 During this same time period, the average rating forless developed countries was unchanged. Thus, there was verylittle change in the level of economic freedom in either theindustrial or non-industrial countries between 1975 and 1985.
However, the situation was quite different during thefollowing decade. The average summary rating of the 20 industrialcountries rose from 5.0 in 1985 to 5.7 in 1990 and 6.4 in 1995.Thus, the average summary rating of industrial countries rose by1.4 units between 1985 and 1995. The average rating for LDCsrose from 4.1 in 1985 to 4.4 in 1990 and 4.8 in 1995, only half asmuch as the increase for the industrial countries. As a result ofthese changes, the economic freedom gap between the industrialand less developed countries has widened during the last 20 years.In 1975, the average rating of the industrial countries was only 0.6units higher than the average rating for the LDCs. By 1995, thisgap had widened to 1.6 units.7
Exhibit 3-7 also presents the average Isl summary ratingsby region. This exhibit illustrates a number of interesting points.First, the average summary rating of the 15 Asian countries in ourstudy increased steadily—about 0.3 units every five years—through-out the period. Thus, their average rating was 6.2 in 1995,up from 4.8 in 1975. Improvements in other regions were bothsmaller and less consistent across time periods. Second, afterlanguishing between 4.2 and 4.5 throughout most of the 1975-1990period, the economic freedom rating (Isl) of the Europeancountries in our study jumped from 4.5 in 1990 to 5.4 in 1995.The recent changes in Eastern Europe contributed substantially tothis increase. Third, the average summary rating of SouthAmerican countries was virtually unchanged during the 1975-1985period, but it jumped from 4.6 to 5.9 between 1985 and 1995. Theaverage ratings for the Central American/Caribbean region declinedbetween 1975 and 1985, but rose during the decade following1985. Finally, the ratings for Africa and Middle East are quiterevealing. In contrast with Asia, Europe, and South America, therehas been little change in their average summary ratings. In Africa,the average summary rating has been between 3.6 and 4.0throughout the 20-year period. In the Middle East, the averagerating has ranged from 3.2 to 3.6 during the same period. In 1975,the average ratings in these two regions were about 1.0 less thanthe average for the Asian countries. By 1995, this gap hadwidened to approximately 2.5 units. With the exception of two or
The economicfreedom gapbetween theindustrial and lessdeveloped countrieshas widened duringthe last 20 years.
85
www.fraserinstitute.org

Exhibit 3-7: Average Summary Rating (Is1) byDevelopment and Region: 1975-1995
Area
Level of
Average Summary Ratin g (Is1 )(Number o f countries rate d i n parentheses. )
1975
By Level of Development:
Industrial8
Less Develope d
By Region:
Africa
Asia
Europe
Middle East b
South America
Central America/Caribbean
North America/Oceania0
4.7(20)
4.1(73)
3.6(28)
4.8(15)
4.2(20)
3.5(5)
4.7(9)
5.0(12)
5.4(4)
1980
4.9(20)
3.9(82)
3.6(31)
5.0(15)
3.6(25)
3.2(5)
4.7(9)
4.6(13)
5.8(4)
1985
5.0(20)
4.1(82)
3.7(31)
5.4(15)
4.1(25)
3.3(5)
4.6(9)
4.4(13)
5.6(4)
1990
5.7(20)
4.4(82)
3.8(31)
5.8(15)
4.5(25)
3.6(5)
5.3(9)
4.9(13)
6.6(4)
1995
6.4(20)
4.8(82)
4.0(30)
6.2(15)
5.4(26)
3.6(5)
5.9(9)
5.5(13)
7.4(4)
a Ou r classification o f industria l matches tha t o f the World Ban k during themid-1980s—the mid-poin t o f our study. O f course, growth enlarges this grou pwith the passage o f time. Se e primary tables for a complete listin g o f theindustrial countries.b Th e following countries ar e include d i n this group: Egypt , Iran , Israel ,Jordan, and Syria.c Th e following countries are included i n this group: Unite d States , Canada,Australia, and Ne w Zealand.
three countries that have made modest moves toward liberalization,there is little reason for optimism with regard to the future ofeconomic freedom in these two regions.
86
www.fraserinstitute.org

LOOKING AHEAD
Thus far we have presented data on both the level ofeconomic freedom and its change. We are now ready to investigatethe impact of economic freedom on the growth rate of an economy.This will be the focus of the following chapter.
Endnotes
1. Since this chapter focuses on changes in economic freedom, we will generallypresent only the Isl summary rating. There are two reasons for this. First, aspreviously indicated, we believe that the Isl summary rating is a better measureof economic freedom than the other two indexes. However, there is a secondand more important reason why we now focus on only one rating. As ameasuring rod for changes in economic freedom across time periods, the threeindexes follow a similar pattern. If one of the indexes for a country increases(or declines) substantially, the others almost invariably change by a similarmagnitude. Given this fact, it would generally be redundant to present the tablesof this chapter for each of the three indexes.
2. The 17 tables of Appendix II present the underlying data and country ratingsfor each of the 17 components of our index. These data can be used to pinpointthe sources of changes in the summary ratings. The "Country Profile" data ofChapter 5 also make it easy to visualize the factors contributing to changes in acountry's summary rating.
3. Chile has reduced its top marginal tax rate during every five year period since1975. In 1975 the top marginal tax rate on the personal income of individualswas 80 percent. By 1980 the rate had been reduced to 60%, and additional ratereductions to 57% in 1985, 50% in 1990 and 48% in 1994 followed.
4. As previously noted, the summary ratings of African countries are universallylow. Other than the small countries of Botswana and Mauritius, probably Kenyaand Ghana provide the most hope for change in this region. Both have recentlytaken a few constructive measures. Since 1990, Ghana has removed pricecontrols on several commodities, reduced the top marginal personal income taxrate from 55% to 35%, and removed many of its restrictions on the convertibilityof currency. Thus, the black market exchange premium for the Ghanaian Cedihas been virtually eliminated (a triple-digit premium was present throughoutmuch of the 1980s.) However, Ghana continues to be plagued by several otherfactors, including monetary instability, a large government-enterprise sector,insecure property rights, and capital market restrictions.
Kenya's Isl summary rating (4.5 in 1995) is one of the highest in Africaand its monetary and legal arrangements are more stable than most othercountries in the region. However, except for a reduction in the marginal tax ratefrom 65% in 1985 to 40% in 1994, few constructive steps toward liberalizationhave been taken.
87
www.fraserinstitute.org

5. The number of countries allowing citizens to maintain foreign currency bankaccounts domestically rose from 31 in 1975 to 38 in 1985 and 62 in 1995. Thenumber authorizing bank accounts abroad rose from 25 in 1975 to 28 in 1985and 51 in 1995. Thus, the number of countries where these freedoms are presenthas approximately doubled during the last two decades. See Tables I-C and I-Dof Appendix II for additional details.
6. Of course, changes in income influence the classification of countries overtime. We used the classification status of the World Bank in the mid-1980s, themid-point of our study. At that time, 20 of the countries in our study wereclassified as "industrial" by the World Bank.
7. As we have already noted, the economic freedom index of several lessdeveloped countries has increased substantially during the last two decades.Inspection of Exhibits 3-1, 3-3, and 3-4 indicates that LDCs are well representedamong those that have achieved substantial increases in economic freedom.Unfortunately, as Exhibit 3-2 shows, they completely dominate the list ofcountries that have moved in the opposite direction—those that have adopted bothpolicies and institutional arrangements that conflict with economic freedom.
88
www.fraserinstitute.org

CHAPTER 4HHHM
Economic Freedom, Income, andGrowth
In the 1990s we have reached a point where most ofthe developing world has come to realize that to geteconomic growth we need economic freedom, andpolicies that attract instead of repel investment.
-Editorial, Wall Street Journal (Aug. 24, 1995).
Chapter 2 presented summary ratings designed to measuredifferences among countries in the amount of economic freedom atvarious points in time. In the last chapter, we analyzed howeconomic freedom has changed during the last two decades. Thepresent focus is on the linkage, if any, between economic freedomand economic growth. Do countries with more economic freedomgrow more rapidly and achieve higher income levels? How dochanges in economic freedom affect the growth of income?
Higher incomes and improved living standards aredependent on increases in the production of goods and services thatpeople value. Without growth in the production of goods andservices valued by consumers, the income of a nation will stagnate.Increases in production per capita are the basis of increases inincome per capita.
There are essentially four sources of increases in product-ivity and income: (1) improvements in the skills of workers, (2)investment and capital formation, (3) advancements in technology,and (4) better economic organization. These four factors areinterrelated and, in varying degrees, are all influenced by economicfreedom. If people are not permitted to keep what they produceand earn, they will have little incentive to either upgrade their skillsor invest in structures and machines designed to enhance futureproductivity. Additionally, if individuals are not allowed to trynew ways of doing things, innovation and improvements intechnology will be stifled. Most importantly, economic freedom isreflective of institutional arrangements. If an economy's institutionsare consistent with economic freedom, it will be easier for peopleto cooperate with each other, specialize in areas where they have
www.fraserinstitute.org

a comparative advantage, and realize gains from trade andentrepreneurship.1 Correspondingly, institutional arrangements thatrestrain trade, increase transaction costs, weaken property rights,and create uncertainty will reduce the realization of gains fromtrade and also the incentive of individuals to engage in productiveactivities.2
Thus, economic theory indicates that economic freedom(and increases in that freedom) will enhance growth because it willlead to increases in the incentive to earn, higher productivity, andgains from trade and entrepreneurship. Therefore, if it is measuredproperly, one would expect that economic freedom will bepositively related to economic growth.
MEASUREMENT PROBLEMS AND THERELATIONSHIP BETWEEN ECONOMICFREEDOM AND INCOME
When considering the impact of economic freedom on thelevel and growth of income, it is important to keep several pointsin mind. First, while there are good reasons to expect that anincrease in economic freedom will enhance, for example, thegrowth rate of real per capita GDP, the linkage is likely to be aloose one. When a nation adopts policies and institutions moreconsistent with economic freedom, it will take time to convincedecision-makers that the changes are permanent, rather thantemporary. This will be particularly true if opposition to the moreliberal policies remains strong or if the nation has a history ofpolicy shifts and instability. The effectiveness of the new policyis very much dependent on the credibility of the change.Credibility can only be earned with the passage of time and theamount of time required to earn it will be influenced by historicalfactors and current political conditions. Thus, the time periodbetween the institution of a policy that influences economicfreedom and its actual impact on economic growth is likely to behighly variable, and in some cases, quite lengthy. Clearly, thistime lag will weaken the relationship between changes in economicfreedom and changes in the growth rate of income.
Second, there are also good reasons to expect that the levelof economic freedom will enhance growth, but this linkage too is
90
www.fraserinstitute.org

likely to be a weak one. Growth is partly an ongoing discoveryprocess. In a very real sense, wealth creation involves figuring outwhere and how resources can be transformed into goods andservices that are more highly valued than the resources. Comparedto the situation where restrictions are widespread, entrepreneurs ina free economy will have greater incentive to figure out better waysof doing things and greater freedom to act on their innovativeideas. Their actions will promote economic growth. However, ameasure of economic freedom at a point time—our 1995 summaryindex for example—does not reveal how long that measured levelof economic freedom has been present. Neither does the rating fora specific year reveal if the degree of economic freedom has beenincreasing or decreasing. Both of these factors will weaken therelationship between economic freedom and growth.3
Neither does a measure of economic freedom at a point intime reveal if there are signs of adverse change on the horizon.Influential political leaders may be promoting policies inconsistentwith economic freedom. The political climate may be such that thelikelihood of future policies restrictive of economic freedom ishigh. These factors will influence the security of property rights,attractiveness of investment, and level of current economic activity.Until actually instituted, however, they will not affect our measureof economic freedom. Factors of this type will also weaken therelationship between the level of economic freedom and the growthof production and income.
Finally, there are good reasons to expect that the linkagebetween the level of economic freedom over a lengthy time periodand per capita GDP will be quite strong. As a country moves froma low to high level of economic freedom, it will experience rapidgrowth (once credibility is gained). This will be particularly truefor low-income countries that will often be able to gain byemulating and adopting proven technologies and successful businessideas from high-income, more developed nations. Since growth ispartly a discovery process, countries with more economicfreedom—even those that have already achieved high levels ofincome—will tend to have higher growth rates than those with apersistently low level of freedom. As a result, countries with highlevels of economic freedom over a lengthy time period will almostsurely have much higher levels of per capita GDP than theircounterparts with persistently low levels of economic freedom.
A measure ofeconomic freedomat a point in timedoes not reveal howlong the level offreedom has beenpresent, if it hasbeen increasing ordecreasing, orwhether the like-lihood of futurerestrictive policiesis high or low.These omissionswill weaken therelationship be-tween freedom andgrowth.
91
www.fraserinstitute.org

THE LEVEL OF ECONOMIC FREEDOM,INCOME, AND GROWTH
A comprehensive analysis of precisely how economicfreedom impacts the growth and level of income is beyond thefocus of this research project.4 However, we will present anoverview of the data on this topic.
Let us begin by looking at the relationship between the levelof economic freedom and level of income. In the GraphicSummary, we presented an exhibit which illustrated the average percapita GDP of countries according to their 1993-1995 economicfreedom grade. (See Exhibit S-2A at the front of the book.) Asthe 1995 economic freedom grade declined, so too did the averageincome level. The average 1994 per capita GDP for the A ratedeconomies was $15,834; the average for those with a grade of Bwas $13,659; at the C grade, it was $7,888; at the D level, it was$3,784; F grades had an average income of $3,068 and for F-, itwas $1,650. Clearly, these data indicate that there is a stronglinkage between level of economic freedom and level of income.
Income comparisons between the most and least freeeconomies shed additional light on the consistency of thisrelationship. Exhibit 4-1A presents the 1994 per capita GDP(measured in 1985 U.S. dollars) for the 14 countries that earned anA or B economic freedom grade in 1993-1995. The average of ourthree summary indexes indicates that in the mid-1990s these 14economies were the freest in the world. The 1994 per capita GDPof these countries was quite high. Only one, Malaysia, had a percapita income figure of less than $10,000 in 1994. The average percapita GDP for the 14 A or B rated countries was $14,280. Exceptfor Malaysia, all of the 14 countries in the most free group rankedamong the 21 countries with the highest incomes in the world.5
Exhibit 4-IB presents the income data for the 27 countrieswith an economic freedom grade of F- in 1993-1995. While theeconomically free list was dominated by high-income economies,those with extremely low incomes dominated the "least free" list.Only one (Venezuela) of the 27 in the least free group was able toachieve an income level of even $5,000.6 Twenty-two of these 27countries had a per capita GDP of less than $3,000. More than
92
www.fraserinstitute.org

Exhibit 4-1A: The Per Capita GDP and the Growth of Per CapitaGDP for the Countries with an Index Rating Grade of A or B in1993-1995
Grade of Aor B
Hong Kon gSingaporeNew ZealandUnited State sSwitzerland
MalaysiaUnited Kingdo mCanadaJapanAustralia
IrelandNetherlandsGermany8
Belgium
Average
a Wes t German y
Is11993-95
9.08.28.07.77.5
7.07.06.96.96.8
6.76.46.46.3
only.
Per Capit aGDP 199 4 (in
1985 U.S. -dollars)
$17,83214,41512,24018,85015,980
$6,51013,43017,51015,10515,169
$10,64013,50515,00513,735
14,280
Growth o f Pe rGDP
1980-94
5.05.31.21.60.8
4.11.91.32.91.6
3.21.31.81.5
2.4
Capita
1985-94
5.75.90.81.60.7
5.01.81.02.81.6
4.31.72.11.9
2.6
Source: Se e Exhibi t 2.1 for the summary rating and grade data. Th e per capitaGDP dat a ar e fro m Rober t Summers an d Ala n Heston , Penn World Tables(Cambridge: National Bureau of Economic Research). These figures were derivedby the purchasin g powe r parit y method. Th e growth of pe r capita GD P figureswere derive d from the World Bank , World Tables. Thes e figures were use d toupdate the Summers an d Heston data to 1994 .
half (14 of the 27) had income levels below $1,000. The averageper capita GDP for the least free group was $1,650, about one-ninth of the average for the most free group.
Despite the measurement problems that we previouslydiscussed, a comparison of Exhibits 4-1A and 4-IB also indicatesthat there is a link between the level of economic freedom asmeasured by our index and the growth of real GDP. The averageannual growth rate of per capita real GDP for the 14 countries witha grade of either A or B was 2.4% during the 1980-1994 periodand 2.6% during 1985-1994. The growth rate of per capita GDPfor every one of the 14 was positive. In contrast, the averagegrowth rate of per capita GDP for the F- rated countries was minus1.3% during the 1980-1994 period (and minus 1.6 during 1985-
93
www.fraserinstitute.org

Exhibit 4-1BGDP for the
Grade of F-
BrazilHaitiNicaraguaVenezuelaHungary
lrana
RomaniaSyriaa
NepalAlgeria8
Benina
Burundi8
Cent. AfricanCongoa
Cote d'lvoire a
MadagascarMorocco8
Nigera
NigeriaRwanda
Sierra Leone a
Tanzania8
Togoa
Uganda8
Zaire8
Zambia8
Zimbabwe8
Average
: The Per Capita GDP and theCountries with an Index Grade
1 A 4Is1
1993-95
3.32.93.34.53.3
2.12.92.63.62.1
4.03.23.93.53.2
4.03.93.63.93.7
4.23.73.63.71.9
3.63.4
Per Capit aGDP 199 4
(in 198 5U.S. dollars )
$4,118665
1,1656,3954,720
$3,6501,3664,2701,0052,700
$930569514
2,2001,065
$6052,150
470960762
$734470530547300
$5251,162
$1,650
Growth iof F- in
Growth
1980-94
+0.1-4.5-3.3-1.2-0.2
-0.2-2.3+0.2+2.3-0.6
-0.1+1.0-1.9-0.7-3.9
-2.8+0.5-3.9-1.3-1.0
-1.2-0.6-4.2+0.5-3.7
-2.1-0.7
-1.3
of Per Capita1993-1995
of Pe r Capit aGDP
1985-94
+0.8-5.4-3.8+0.2-1.0
-1.7-4.9+0.6+2.4-2.3
-1.0+0.3-2.9-3.1-4.3
-1.9+0.5-2.2+1.1-1.7
-1.1+0.5-4.9+0.6-5.3
-1.6-1.6
-1.6
a Th e per capita GDP and growth data for these countries are only through 1993.
Source: Se e Exhibit 2-1 for the summary rating and grade data. Th e data for percapita GD P ar e fro m Summer s an d Heston , Penn World Tables, (Cambridge :National Burea u o f Economi c Research) . Th e growt h o f pe r capit a GD P dat awere derive d from the World Bank , World Tables. Thes e figures were use d toupdate the Summers and Heston data to the most recent year for which GDP wasavailable.
94
www.fraserinstitute.org

Exhibit 4-2: The Growth of Per Capita GDP for Countries withPersistently High and Persistently Low Economic FreedomRatings During 1975-1995
Countries
PersistentlyHigh Ratings8
Hong Kon gSwitzerlandSingaporeUnited State sCanadaGermany
Average
Real GDP(in 198 5 U
1994
$17,83215,98014,41518,85017,51015,005
$16,599
Per Capit a.S. dollars )
GrowthRate
1980-94
5.00.85.31.61.31.8
2.6
Persistently
Real GDP(in 198 5 U
1994
r
Low Ratings0
SomaliaZambia0
HungaryRomaniaBrazilSyria0
Uganda0
Zaire0
Zimbabwe0
Average
$580525
4,7201,3604,1184,270
547300
1,162 « •
$1,954
Per Capit a.S. dollars )
GrowthRate
1980-94
-2.0-2.1+0.2-2.3+0.1+0.2+0.4-3.7
• -0. 7
-1.1
a Thi s i s the lis t o f countries that (a ) made an A or B in 1995 and (b ) ranked inthe top 1 5 durin g 1975 , 1980 , 1985 , and 1990 . Se e Exhibi t 2- 3 fo r th e yearl yratings o f these countries .
D Thi s is the lis t o f countries that had an economic freedom rating (Is1) o f F- i n1995 and a rating o f less than 4.0 for each of our rating years. Se e Exhibi t 2- 3for the yearly rating s o f these countries .
0 Th e GDP data for these countries are only through 1993 .
d Th e GDP data for this country ar e only through 1992 .
Source: Th e pe r capit a GD P ar e updates o f th e purchasin g powe r parit yestimates o f Rober t Summer and Alan Heston, Penn World Tables (Cambridge:National Burea u o f Economi c Research , 1994) .
1994.) During 1980-1994, 21 of the countries with an F- ratingexperienced declines in real GDP per capita; only 6 were able toregister a positive growth rate. Other than the 2.3% growth rateof Nepal (which was approximately equal to the average growthrate of the A/B rated countries), none of other low-rated countrieswas able to achieve an average growth rate in excess of 1.0%during 1980-1994. The pattern for the 1985-1994 period wassimilar.
95
www.fraserinstitute.org

The six persistentlyfree economiesduring the lastdecade all rankedin the Top Ten interms of per capitaincome. Theiraverage per capitaGDP was ten timesthat of thepersistently unfreegroup.
Since the data of Exhibits 4-1A and 4-IB focus on countryratings at a point in time, they may be influenced by changes insummary ratings as well as differences in the levels.7 Exhibit 4-2attempts to eliminate the impact of the former factor. Here wepresent data for per capita GDP and its growth rate for countrieswith persistently high and persistently low ratings throughout theentire 1975-1995 period. Since the ratings for these countries didnot change very much during the period, this comparison shouldprovide us with a better indication of how persistent differences inthe level of economic freedom influence both level of income andeconomic growth.
The persistently high rated-category was comprised of thecountries with an economic freedom grade of either A or B in1995 and a ranking in the Top 15 during each of the prior ratingyears of our study. Correspondingly, countries were included inpersistently low category if their 1995 rating was F- and theirsummary index (Isl) was less than 4.0 during each of the priorrating years. (See Exhibit 2-3 for the yearly ratings for both ofthese groups). Thus, the six nations in the persistently high-ratedgroup have been among the freest in the world for at least twodecades, and probably much longer. Similarly, the nine economiesin the persistently low-rated group have been among the least freeover the same period of time.
First, let us consider the income level data. The 1994 percapita incomes of the persistently free group averaged $16,599;they ranged from the $14,415 of Singapore to the $18,850 of theUnited States. These are exceedingly high per capita incomes. Thefigures for United States, Hong Kong, and Canada were the threehighest among the 103 countries in our study. Switzerland rankedfifth, Germany eighth, and Singapore tenth. Thus, the sixpersistently free economies during the last decade all ranked in theTop Ten in terms of per capita income. In contrast, the highestincome among the persistently unfree group, Hungary's $4,720, wasonly a little more than one-fourth of the average for the freeeconomies. Four of the nine persistently low-rated countries hada per capita GDP of less than $600. The average per capita GDP($1,954) of the persistently unfree group was less than one-eighththe average for the persistently free group. Just as we hadexpected, economies that are free over a lengthy time periodachieve high levels of income, while those that are unfree forextended periods have low incomes.
96
www.fraserinstitute.org

Turning to the growth figures, the six persistently freeeconomies all had positive growth rates and their annual growthrate of per capita real GDP averaged 2.6% during 1980-1994. Incontrast, five of the nine persistently low-rated countries hadnegative rates of growth and none were able to achieve growth ofeven a half percent annually during 1980-1994. On average, the percapita GDP of the low-rated group declined at an annual rate of 1.1percent during the 1980-1994 period.
These figures provide strong evidence that the level ofeconomic freedom exerts a positive impact on both per capitaincome and economic growth. When an economy is free over along period of time, individuals achieve high and growing levels ofincome. Similarly, when economic freedom is stifled for lengthyperiods, incomes stagnate and fall relative to those of freeeconomies.
CHANGES IN ECONOMIC FREEDOMAND GROWTH OF GDP
Theory indicates that a sustained increase in economicfreedom will enhance growth, while a decline will retard it. Thus,one would expect countries with an expanding amount of economicfreedom to have higher growth rates than those with a contractingamount of freedom. However, the immediate impact of a changein economic freedom is likely to be small—particularly in the caseof an expansion in freedom. As we previously discussed, there willgenerally be a lag between the time when institutional arrangementsand policies become more consistent with economic freedom andwhen they begin to exert their primary impact on economic growth.Therefore, when considering the effects of changes in economicfreedom during a period, we will generally analyze their impact ongrowth beginning five years after the initial rating year.
Exhibit 4-3 presents data for the 15 countries (actually thereare 17 because of a tie) that showed the most improvement in thesummary index (Isl) of economic freedom between 1975 and 1990.(See Exhibit 3-1 for their yearly ratings.) Chile, Jamaica, Iceland,Malaysia, and Pakistan head the most-improved list during the1975-1990 period. In terms of development, the most improvedcountries were a diverse group. As the 1980 income figuresindicate, only five (Iceland, Japan, New Zealand, United Kingdom,
97
www.fraserinstitute.org
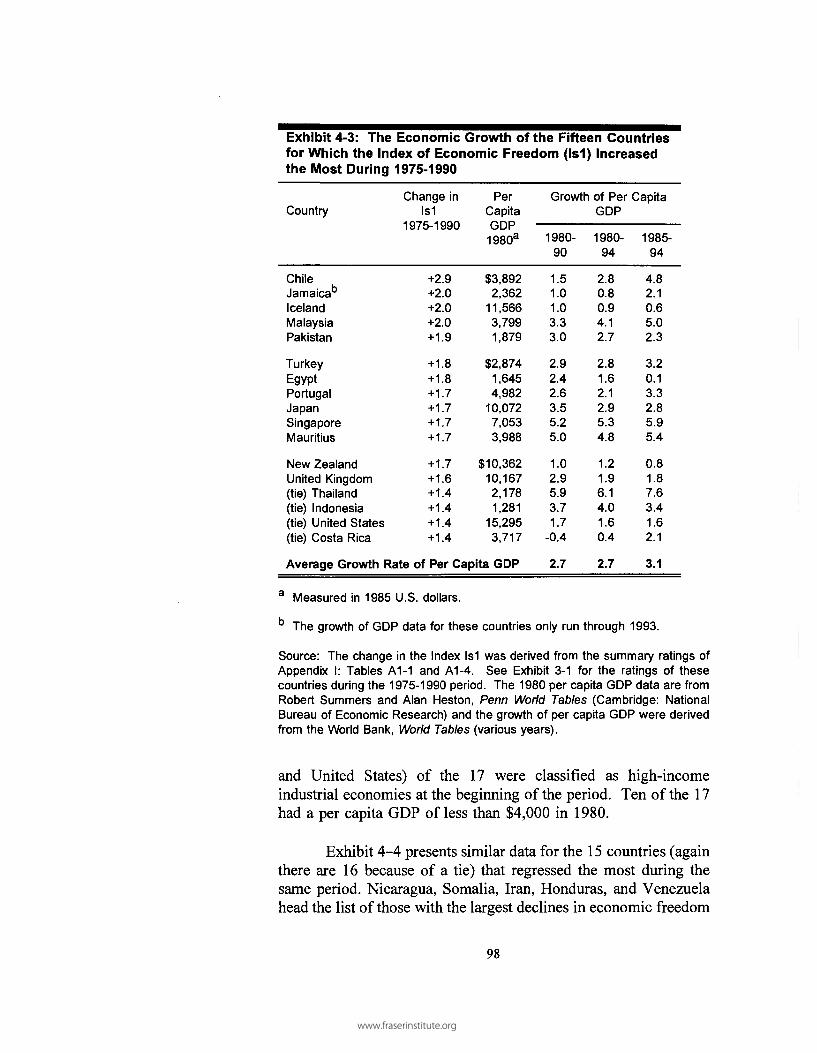
Exhibit 4-3: The Economic Growth of the Fifteen Countriesfor Which the Index of Economic Freedom (Is1)the Most During
Country
ChileJamaica*3
IcelandMalaysiaPakistan
TurkeyEgyptPortugalJapanSingaporeMauritius
New ZealandUnited Kingdo m(tie) Thailan d(tie) Indonesi a(tie) Unite d States(tie) Cost a Ric a
1975-1990
Change inIs1
1975-1990
+2.9+2.0+2.0+2.0+1.9
+1.8+1.8+1.7+1.7+1.7+1.7
+1.7+1.6+1.4+1.4+1.4+1.4
PerCapitaprsn
GDP1980a
$3,8922,362
11,5663,7991,879
$2,8741,6454,982
10,0727,0533,988
$10,36210,1672,1781,281
15,2953,717
Average Growth Rate of Per Capita GDP
Growth
1980-90
1.51.01.03.33.0
2.92.42.63.55.25.0
1.02.95.93.71.7
-0.4
2.7
Increased
of Pe r iGDP
1980-94
2.80.80.94.12.7
2.81.62.12.95.34.8
1.21.96.14.01.60.4
2.7
Capita
1985-94
4.82.10.65.02.3
3.20.13.32.85.95.4
0.81.87.63.41.62.1
3.1
a Measure d i n 198 5 U.S. dollars .
b Th e growth o f GDP data for these countries onl y ru n through 1993 .
Source: Th e change i n the Inde x Is 1 was derived from the summary rating s o fAppendix I : Table s A1- 1 an d A1-4 . Se e Exhibi t 3- 1 fo r th e rating s o f thes ecountries during the 1975-1990 period. Th e 1980 per capita GDP data are fromRobert Summer s an d Ala n Heston , Penn World Tables (Cambridge : Nationa lBureau of Economic Research ) an d the growth of per capita GDP were derive dfrom the World Bank , World Tables (various years) .
and United States) of the 17 were classified as high-incomeindustrial economies at the beginning of the period. Ten of the 17had a per capita GDP of less than $4,000 in 1980.
Exhibit 4-4 presents similar data for the 15 countries (againthere are 16 because of a tie) that regressed the most during thesame period. Nicaragua, Somalia, Iran, Honduras, and Venezuelahead the list of those with the largest declines in economic freedom
98
www.fraserinstitute.org

Exhibit 4-4: The Economic Growth of the Fifteen Countriesfor Which the Index of Economic Freedom (Is1) Declined theMost During 1975-1990
Country
NicaraguaSomalialranb
HondurasVenezuela
Congob
Zambiab
Tanzania13
Algeria13
Morocco
PanamaSyria13
GreeceEl Salvador(tie) Sierr a Leon e(tie) Brazi l
Average Growth
ChangeIs1
1975-1990
-4.4-1.8-1.8-1.4-1.4
-1.2-1.1-1.0-0.8-0.7
-0.7-0.5-0.5-0.4
b -0. 3-0.3
Rate of Per
in Pe rCapitaGDP1980a
$1,853744
3,4341,5196,395
$1,931971480
2,7581,941
$3,3924,4675,9012,0141,1394,305
Capita GDP
Growth of
1980-90
-1.2-0.7-1.1-1.1-1.7
+0.2-2.9-0.3+0.1+1.1
-1.4-1.2+1.0-0.5-0.9-0.6
-0.7
1980-94
-3.3-2.0-0.2-0.7-1.2
-0.7-2.1-0.6-0.6+0.6
+0.4+0.2+0.8-0.4-1.2+0.9
-0.6
GDP
1985-94
-3.8
-1.7-0.1+0.2
-3.1-1.6+0.5-2.3+0.5
+0.3+0.6+0.9+1.4-1.1+0.8
-0.6
a Measure d i n 198 5 U.S . dollars . Thes e data are from Summer s and Heston,Penn World Tables, (Cambridge: Nationa l Bureau of Economic Research) .
b Th e growth of GDP data for these countries are only through 1993 .
Source: Th e change i n the Inde x Is 1 was derived from the summary rating s o fAppendix I : Table s A1- 1 an d A1-4 . Se e Exhibi t 3- 2 fo r th e rating s o f thes ecountries during the 1975-199 0 period.
between 1975 and 1990. While there were no high-incomeindustrial countries in this group, four (Venezuela, Syria, Greece,and Brazil) of the 16 had income levels above $4,000 in 1980.
As Exhibit 4-3 indicates, the nations with the largestincreases in economic freedom (Isl) during the 1975-1990 periodregistered an average growth in per capita GDP of 2.7% during1980-1990. Their growth rate during the most recent ten years(1985-1994) was even higher, 3.1 percent. All 17 of thesecountries achieved a positive growth rate during 1980-1994 and1985-1994. The growth of the non-industrial countries that movedtoward liberalization was particularly impressive. The per capita
99
www.fraserinstitute.org

The seven lessdeveloped countries(Mauritius, Chile,Portugal, Jamaica,Singapore,Pakistan, andTurkey) whichachieved the largestincreases ineconomic freedombetween 1975 and1985 and main-tained the increasesinto the 1990s grewat an annual rateof 3.9% during1985-1994.
real GDP of eight (Chile, Malaysia, Portugal, Turkey, Singapore,Mauritius, Thailand, and Indonesia) of the 12 non-industrialnations with the largest increases in economic freedom grew 3percent or more during the last decade. The average growth of percapita GDP for the 12 non-industrial nations—the eight listed aboveplus Jamaica, Pakistan, Egypt, and Costa Rica—was 3.8 percent. Atthis growth rate, incomes would double every 18 years.
The economic record of the countries that restrictedeconomic freedom during 1975-1990 stands in stark contrast to thatof those liberalizing their economies. As Exhibit 4-4 indicates,average real per capita GDP declined at an annual rate of 0.7percent during 1980-1990 (and by 0.6% during 1985-1994) in the16 countries for which the index of economic freedom fell themost. The economic decline was widespread. Twelve of the 16countries experienced reductions in real per capita GDP during the1980-1990 period. None were able to achieve a growth rate ofmore than 1.1 percent, a rate less than one-half the average growthrate for those that moved toward economic freedom.
As we previously discussed, maintenance of an increase ineconomic freedom is vitally important. Countries that shift backand forth between liberal and restrictive policies will losecredibility, which will weaken the positive effects of their moreliberal policies. Therefore, if we want to isolate the real impact ofeconomic freedom, we need to consider the performance ofeconomies that both increase and maintain a higher freedom rating.Exhibit 4-5 (upper part) identifies the countries—there were onlynine—in our sample that achieved at least a one unit increase ineconomic freedom (as measured by the Isl index) during 1975-1985 and maintained the increase into the 1990s. Thus, theseeconomies were clearly more free throughout 1985-1995 than theywere in 1975.
How did the expansion of economic freedom influence thegrowth rates of these countries? As Exhibit 4-5 illustrates, the percapita GDP of these nine expanded at an annual rate of 3.1%during the 1980s and at a 3.5% rate during 1985-1994, up from2.2% during 1975-1985. During the last decade, the slowestgrowth rate among the nine was the 1.8% rate of the UnitedKingdom. Seven of the nine were classified as less developed bythe World Bank at the beginning of the period. These seven-Mauritius, Chile, Portugal, Jamaica, Singapore, Pakistan, andTurkey—grew at an average annual rate of 3.9% during 1985-1994.
100
www.fraserinstitute.org

Exhibit 4-5: The Growth of Per Capita GDP for Countries with atLeast a One Unit Change in the Is1 Summary Index of EconomicFreedom Between 1975 and 1985
Change in Is1 Rating Growth of Per Capita GDP
1975-85 1985-95 1975-85 1980-90 1985-94
Countries with at least a 1 UnitIncrease Between 1975 and 1985and Maintenance of theIncrease During 1985-95a
MauritiusPakistanJapanChileJamaica
SingaporePortugalUnited Kingdo mTurkey
+2.1+1.6+1.3+1.3+1.2
+1.2+1.1+1.0+1.0
+0.3+1.5+0.4+1.7+1.9
+0.2+2.0+1.0+0.4
+2.8+3.3+3.4+2.4-3.0
+5.2+1.8+1.5+2.3
+5.0+3.0+3.5+1.9+1.0
+5.2+2.6+2.5+2.9
+5.4+2.3+2.8+4.8+2.1
+5.9+3.3+1.8+3.2
Average Growth Rate of Per Capita GDP 2.2
Countries with a 1 Unit DeclineBetween 1975 and 1985
3.1 3.5
NicaraguaIranVenezuelaSomaliaHonduras
TanzaniaBoliviaAlgeriaSyria
Average Growth
-4.6-2.5-1.7-1.5-1.4
-1.4-1.3-1.1-1.0
Rate of Per
+1.5-0.6-0.7N/R-0.5
+1.8+2.2-0.3+0.1
Capita GDP
-4.8-2.7-2.2+0.2+0.8
-1.7-2.1+2.5-1.3
-1.3
-3.7-1.1-1.8-1.2-0.9
+0.6-2.4-0.1-1.2
-1.3
-3.8-1.7+0.2-2.3-0.1
+0.5+0.1-2.3+0.6
-1.0
a Al l of these countries achieve d at least a 1 unit increas e in the Is1 summaryrating between 197 5 and 1985 and they were able to maintain this higher ratin gduring the following decade. Non e of the other countries in our study were ableto achieve and maintain such a large increase. Se e Exhibit 3-3 for the rating ofthese countries during each of the periods .
N/R = No rating in 1995; thus, the change betwee n 198 5 and 1995 cannot becalculated.
101
www.fraserinstitute.org

Exhibit 4-6: The Growth of Per Capita GDP for the TenCountries With the Largest Change in the Is1 SummaryRating Between 1980 and 1990
Countries with theIncrease Betweenand Maintenance iIncrease in 1995
Jamaica13
United Kingdo mCosta Ric aBolivia6
Chile
ItalyMauritiusMexicoNorwayThailand
Change i n Is1Rating
1980-90
! Largest
1990-95
1980 and 1990of the
+2.4+2.1+1.8+1.8+1.8
+1.8+1.8+1.5+1.4+1.3
+1.1+0.4+0.1+0.1+0.1
+0.2+0.7+0.5+0.9+0.7
Growth
1980-90
+1.0+2.5-0.4-2.4+1.9
+2.0+5.0-0.3+1.8+5.9
of Pe r Capit a
1985-94
+2.1+1.8+2.1+0.1+4.8
+2.0+5.4+0.1+1.3+7.6
GDP
1989-94
+1.9+0.3+2.3+1.1+4.2
+1.1+4.3+1.0+2.1+7.1
Average Growth Rate of Per CapitaGDP
Countries with the LargestDecline between 1980 and 1990
1.7 2.7 2.5
Dominican Re pSomaliab
Tanzania13
NicaraguaZimbabwe13
ZambiaVenezuelaRomaniaJordanCongob
Average GrowthGDP
-1.9-1.7-1.7-1.6-1.3
-1.3-1.1-1.0-0.9-0.9
Rate of Per
+2.1N/R
+1.4+1.2+1.1
+1.8-1.0+0.7+0.5+0.4
Capita
-0.4-1.2+0.6-3.8+0.2
-2.2-1.8-0.8-1.9+1.7
-1.0
+0.7-2.3+0.5-3.8-1.6
-1.6+0.2-4.9-3.0-3.1
-1.9
+0.1-3.0-0.8-0.4-2.0
-2.4+1.2-6.2-1.5-3.0
-1.8
a Se e Exhibi t 3-4 for the Is 1 ratings o f these countries durin g 1980-1995 .
b Th e 1994 GDP data were unavailable when this study was completed. Thus ,the growth data only run through 1993 .
102
www.fraserinstitute.org

Exhibit 4-5 (lower part) identifies the economies—therewere also nine—where the Isl economic freedom rating declinedby one unit or more during 1975-1985. On average, the real GDPof these countries fell at an annual rate of 1% or more. During1980-1990, eight of nine regressors experienced reductions in percapita real GDP. None was able to achieve a growth rate of morethan 0.6% during either 1980-1990 or 1985-1994. Clearly, thegrowth rates of the countries with a one unit or more reduction ineconomic freedom were persistently and substantially less thanthose with a one unit increase.
Exhibit 4-6 is similar to Exhibit 4-5, except the focus is onthe changes in economic freedom between 1980 and 1990. Theupper part of the exhibit contains data for the ten countries thatachieved the largest increases in economic freedom (Isl index)during the 1980s and maintained them in 1995. It is a diversegroup including three high-income industrial nations (UnitedKingdom, Italy, and Norway) and seven less developed economies.Among the latter group, Jamaica, Bolivia, Chile, Mauritius, andMexico all had 1980 freedom ratings of 4.5 or less. The ratingincreases of Costa Rica, Bolivia, Italy, Mexico, and Thailand wereconcentrated in the latter half of the 1980s. In fact, the Isl ratingsof Costa Rica and Bolivia actually declined between 1980 and1985, prior to their sizeable increase between 1985 and 1990 (seeExhibit 3-4 for the ratings throughout this period.)
During 1980-1990 Costa Rica, Bolivia, and Mexicoexperienced declines in per capita GDP. Interestingly, the freedomratings of two (Costa Rica and Bolivia) of these three weredeclining until the latter half of the 1980s. By 1985-1994 all tenof these countries were on a positive growth path. During the lastfive years, the growth rates of Costa Rica, Bolivia, and Mexicowere 2.3%, 1.1%, and 1.0% respectively. Each was a substantialimprovement on the growth rate prior to their jump in economicfreedom during the latter half of the 1980s. On average, the realGDP of the countries that improved the most during the 1980sincreased by 2.7% during 1985-1994 and 2.5% during 1989-1994.
Exhibit 4-6 (lower part) presents data for the ten countrieswhere economic freedom regressed the most during the 1980s.Seven of these ten experienced declines in per capita GDP during1980-1990 and 1985-1994. Their average per capita growth ratewas minus 1.9% during the latter period, 4.6% less than the rateachieved by the ten with the largest gains in economic freedom.
103
www.fraserinstitute.org

The gap between the two groups remained large during the mostrecent five year period. None of the countries with large declinesin economic freedom was able to achieve a persistent positivegrowth rate during the 1980-1994 period.
Without exception,countries witheither a high levelor a substantialincrease ineconomic freedomachieved positivegrowth rates in percapita GDP.
ECONOMIC FREEDOM AND ECONOMICGROWTH: SOME REFLECTIONS
When considered together, the exhibits indicate a verystrong relationship between economic freedom and economicgrowth. There is only a six country overlap between the 14 A orB rated countries of Exhibit 4-1A and the 17 most-improvedcountries of Exhibit 4-3. Malaysia, Japan, Singapore, NewZealand, United Kingdom, and United States are on both lists.Thus, there are 25 countries that were in either the top-rated groupin 1993-1995 and/or the most-improved group during 1975-1990.The per capita GDP of every one of these 25 increased during1980-1994 and 1985-1994. Their average growth rate of percapita GDP was 2.9% during 1985-1994.
There was considerable overlap between the 27 low-ratedcountries of Exhibit 4-IB and the 16 countries with the largestreductions in the summary rating included in Exhibit 4-4. Only fiveof the countries with the largest rating declines failed to appearamong the lowest rated—those with a F- grade—in 1993-1995.Thus, there were 32 countries with either a F- rating in 1993-1995and/or a substantial decline in rating between 1975 and 1990. Ofthese thirty-two, 24 had a negative growth rate for per capita GDPduring the 1980-1994 period. Only Nepal which grew at an annualrate of 2.3 percent during 1980-1994 was able to achieve a growthrate greater than 1.0 percent during the period.
Clearly, these data indicate that during the last two decadesthere has been a strong relationship between economic freedom andeconomic growth. Without exception, countries with either a highlevel or a substantial increase in economic freedom achievedpositive growth. Correspondingly, the overwhelming majority ofcountries with low and/or contracting levels of economic freedomexperienced declines in per capita GDP.8
These findings are buttressed by the linkage between apersistently high freedom rating over a lengthy time period and
104
www.fraserinstitute.org
level of income. Without exception, countries with a persistentlyhigh level of economic freedom during the last two decades alsoachieved high per capita income levels. On the other hand, nocountry with a persistently low level of economic freedom duringthe last two decades was able to achieve even middle income status(see Exhibit 4-2).
Finally, countries that achieved substantial increases ineconomic freedom and then sustained those increases invariablymoved to a positive growth path. This was true for the increasesof 1975-1985 (Exhibit 4-5) and also for those of 1980-1990(Exhibit 4-6). Correspondingly, when economic freedom declined,economies stagnated, and incomes fell.
Comparisons between similar countries in the same regioncan also provide insight on the impact of economic freedom.Exhibit 4-7 presents data of this type. Perhaps more than any othertwo countries, Chile and Venezuela have moved in very differentdirections throughout the last two decades. In 1975, theVenezuelan economy was relatively free (its Isl rating was 6.9),while Chile was saddled with all types of economic restrictions. Butthe situation has changed dramatically since that time. Theeconomic freedom rating of Chile has risen steadily from 2.8 in1975 to 4.1 in 1985 and 5.8 in 1995. In contrast, the summaryrating of Venezuela declined from 6.9 in 1975 to 5.2 in 1985 andto 4.5 in 1995. (See the Country Profile data of Chapter 5 foradditional details on the factors underlying the changes in thefreedom ratings of these two countries.) What has happened to thegrowth rates of the two countries? Chile's growth of per capitaGDP accelerated throughout the period, soaring to an annual rateof 4.8% during 1985-1994. In contrast, the Venezuelan economystagnated. Per capita GDP declined 2.2% annually between 1975and 1985 and has changed very little since that time.
The comparison between Costa Rica and Honduras, twosmall Central American countries, is also revealing. Between 1975and 1985, the freedom rating for both declined and their economiesstagnated—Honduras experienced a slight increase in income whileCosta Rica registered a small decline. Since 1985, Costa Rica hasliberalized its economy substantially. Monetary policy has beenmore stable and the top tax rate was reduced from 50% to 25%.Exchange rate controls have been virtually eliminated and otherbarriers to trade have been reduced. Thus, the Isl summary ratingof Costa Rica jumped from 4.6 in 1985 to 6.7 in 1995.
While Chile movedtoward economicliberalism,Venezuela movedin the oppositedirection. Duringthe last decadeChile's growth ofGDP per capitawas 4.8% com-pared to 0.2% forVenezuela.
105
www.fraserinstitute.org

Exhibit 4-7: Selected Comparisons Between Countries with Increases andDecreases in Economic Freedom During Various Periods
Economic Freedom Rating(Isl)
Change in PerCapita GDP
ChileVenezuela
Costa RicaHonduras
GhanaCote d'lvoire
PortugalGreece
ArgentinaBrazil
JamaicaPanama
1975
2.86.9
5.27.4
2.53.9
2.43.9
3.13.2
3.27.0
1980
3.96.6
4.86.1
2.34.1
3.13.8
3.62.7
2.86.3
1985
4.15.2
4.66.0
2.84.4
3.53.2
2.52.3
4.46.6
1990
5.75.5
6.66.0
3.63.7
4.13.4
3.82.9
5.26.3
1995
5.84.5
6.75.5
4.83.2
5.54.9
6.33.3
6.36.6
1975-85
+2.4-2.2
-0.2+0.8
-1.9-1.6
+1.8+1.8
-3.1+1.5
-3.0+2.3
1985-94
+4.8+0.2
+2.1-0.1
+1.4-4.3
+3.3+0.9
+2.2+0.8
+2.1+0.3
Meanwhile, Honduras continued to move in the opposite direction.Monetary growth became more expansionary. Predicably, pricelevel instability increased. Interest rate controls were imposed.The summary rating (Isl) of Honduras fell from 6.0 in 1985 to 5.5in 1995. The economic performance of the two has also moved inopposite directions. Costa Rica is now on a solid growth pathachieving an increase in per capita GDP of 2.1% during 1985-1994(and 3.9% during 1992-1994). In contrast, the per capita GDP ofHonduras declined during the last decade.
Ghana and Cote d'lvoire have also moved in oppositedirections during the last decade. Between 1975 and 1985, bothcountries had low and relatively constant freedom ratings. Bothwere also experiencing negative growth rates. Since 1985, Ghanahas made some modest moves toward a liberal economy. Its toptax rate was cut from 60% to 35% during the decade; its veryrestrictive exchange rate controls were liberalized; and the size ofits trade sector has grown sharply. As a result, Ghana's Isl ratingincreased by two points during the last decade, while that of Coted'lvoire fell by more than a point. Their economies have followedsuit. Ghana's real GDP per capita increased by 1.4% during 1985-1994, while Cote d'lvoire's fell by 4.3%.
106
www.fraserinstitute.org

The records of the other countries included in Exhibit 4-7are similar. The economic freedom rating of Portugal has shownsteady improvement throughout the last 20 years, while prior to the1990s the rating of Greece declined. During the last decade, thegrowth record of Portugal has clearly been the more impressive ofthe two. Economic freedom was stifled in both Argentina andBrazil until the late 1980s, when Argentina began taking decisivesteps toward a freer economy. Again, economic growth responded.The recent growth record of Argentina has been stronger than thatof Brazil. Like Portugal, Jamaica has moved steadily toward afreer economy since 1980, while Panama has regressed from itsrating of 1975. The real GDP of Jamaica had shown strong growthsince 1985 while Panama continues to struggle.
CONCLUDING REMARKS
More precise measurement of the relationship betweeneconomic freedom and economic growth—particularly betterknowledge about the length and nature of time lags betweenchanges in economic freedom and observation of their impact oneconomic growth—will require additional research. Improvementsin the measurement of economic freedom and its variation acrosscountries and time periods will facilitate this research. We believethat this study is a fruitful beginning—a foundation for additionalwork in this area.
However, we also believe that the exhibits presented in thischapter indicate that both the level of economic freedom andchanges in that level exert a consistent and potent impact oneconomic growth. Countries with more economic freedom tend togrow more rapidly than their counterparts adopting policies thatrestrict economic freedom. Furthermore, the potency of therelationship enhances our confidence that these indexes are areasonable measure of economic freedom.
Finally, we believe that our findings contain an importantmessage for both high-income industrial and low-income lessdeveloped countries. If the citizens of high-income countries wantto maintain and increase their income levels, they had best not erecteconomic roadblocks that restrict the freedom of individuals to actand reap the benefits of their actions. Nations that choose this
The evidence isoverwhelming-countries with moreeconomic freedomtend to grow morerapidly than theircounterpartsadopting policiesthat restricteconomic freedom.
107
www.fraserinstitute.org

course can expect their growth rate and eventually their level of percapita income to fall below that of freer economies.
Correspondingly, if low-income nations are going to growand achieve high income status, they must liberalize theireconomies. Low-income countries that achieved and maintainedsubstantial increases in economic freedom during the last twodecades also achieved impressive growth rates. There were noexceptions—every nation that significantly improved its rating alsoachieved solid economic growth. On the other hand, economiesthat moved away from economic freedom were characterized bysluggish growth and economic decline. The message isclear—economic freedom is the foundation for the achievement ofeconomic growth and prosperity.
Endnotes
1. Among modern economists, no one has stressed the importance ofentrepreneurship as a source of wealth creation and economic growth moreforcefully than Israel Kirzner. For a detailed analysis of this topic, see Israel M.Kirzner, Competition and Entrepreneurship, (Chicago: University of ChicagoPress, 1973).
2. Throughout his illustrious career, 1994 Nobel laureate Douglass C. North haspersuasively stressed the importance of institutional change as a source of growthand prosperity. In North's view, important institutional changes— particularly thedevelopment of the patent system and later the corporation— provided the initialingredients for the economic growth of the West. In his recent writings, Northhas focused on the interrelations among economic institutions, changes intransaction costs, and economic growth. See Douglass C. North, Institutions,Institutional Change, and Economic Performance, (Cambridge: CambridgeUniversity Press, 1990). Our thought process has been greatly influenced byProfessor North. In a very real sense, our index of economic freedom might beviewed as an effort to evaluate the economic institutions of countries with regardto their consistency with factors that are conducive to lower transactions costs,gains from trade, and the incentive to produce.
3. Perhaps a hypothetical illustration will help clarify these points. Considerthree countries A, B, and C, each with a rating of 7 on our 10 point scale. A isa high income country that achieved a rating of 7 several decades ago and hasmaintained it though the years; B is a high-income country that maintained arating of 9 until a few years ago when it adopted several policies that conflictedwith economic freedom; C is a low-income country that had a rating of 3 fifteenyear ago. However, since that time it has moved steadily toward economicfreedom. Would you expect these equally rated countries to have the samegrowth rate? Given its high income status and recent loss of economic freedom,we would expect B to have the lowest growth rate. Similarly, we would expectC to have the highest rate of growth, given its recent gains in economic freedomand original low-income status.
108
www.fraserinstitute.org

4. See The World Bank, World Development Report, 1983, chapter 6 and GeraldW. Scully, "The Institutional Framework and Economic Development," Journalof Political Economy 96 (June 1988), pp. 652-662 for prior work on this topic.
5. Except for Malaysia, all of the countries in the most free category are nowclassified as high-income industrial nations. However, this was not always thecase. As recently as 1980, the World Bank classified three others—Hong Kong,Singapore, and Ireland—among the "developing countries" of the world.Interestingly, these four—Malaysia and the three newcomers to the high-incomeindustrial group—have the highest growth rates in the group. Their annualincreases in per capita GDP ranged between 3.2% and 5.3% throughout the1980-1994 period. None of the long-time, high-income industrial nationsachieved a growth rate greater than 2.9% during this period. This suggests thatthe growth rates of the industrial countries with high incomes for a long periodof time have converged toward a lower long-term growth rate. Predictably, thisgrowth rate will be lower than the growth of the newly emerging free (andformerly low-income) economies.
6. Interestingly, Venezuela is a newcomer among the least free economies. Asrecently as 1980, our Isl rating ranked the Venezuelan economy as the sixthmost free in the world. In 1975 it ranked fifth. Its 1980 per capitaincome—when it was a relatively free economy—was $7,401 (measured in 1985dollars), well above its 1994 level. Therefore, to a large degree, Venezuela'scurrent high-income status is merely a reflection of its past history as a relativelyfree economy.
7. One would expect that countries with recent rating reductions will be over-represented among the countries with low ratings at a point in time whilecountries with recent rating increases will be over-represented among thecountries with high current ratings. Thus, some of the difference in the growthrates between the high and low rated countries may be the result of changes inthe ratings rather than merely differences in the rating levels. The set ofcountries included in Exhibit 4-2 will tend to minimize the impact of the changein the ratings.
8. In an effort to quantify more precisely the impact of the level and changesin the level of economic freedom on economic growth, we regressed thesummary index (Isl) in 1975 (the beginning of the period), changes in the indexduring the 1975-1990 period, and the investment/GDP ratio on the growth of percapita real GDP during 1975-1994. We included investment as a share of GDPin the regression since other researchers have shown that it is an importantexplanatory factor of differences in growth rates among countries. Its inclusionalso provides us with a benchmark with which to judge the importance ofeconomic freedom as a source of growth. The results were:
Growth Rate (1975-94)= -4.72 + 0.33 LEF + 1.04 CEF + 0.19 I/GDP(2.19) (5.52) (5.53)
R2 = .47
In this equation, LEF is the 1975 level of economic freedom (Islrating), CEF is the change in economic freedom (Isl rating) between 1975 and1990, and I/GDP is the average investment/GDP ratio during the 1975-1990period. The estimates were derived from the observations for the 90 countriesfor which all of the variables were available. The t-ratios for the coefficients are
109
www.fraserinstitute.org

in parentheses. While the results should be interpreted with caution, they dosuggest that economic freedom as measured by our index exerts a strong impacton economic growth. The size of the coefficient for the level of economicfreedom indicates that a one unit increase in the initial rating increased thegrowth rate of per capita GDP by 0.33%. Similarly, The coefficient for thechange in economic freedom indicates that a one unit increase in the Islsummary index during 1975-1990 was associated with approximately a 1%increase in the growth of per capita real GDP. A unit change in theinvestment/GDP ratio is estimated to increase growth by 0.19%. These resultsindicate that a one unit increase (on a 0-10 scale) in the level of economicfreedom at the beginning of the period exerts about the same impact on thegrowth of per capita real GDP as a two unit increase in the investment/GDP ratio(e.g., an increase from 20% to 22%). Correspondingly, a unit change ineconomic freedom during the period exerts about the same effect as a five unitincrease (e.g., from 20% to 25%) in the investment/GDP ratio. This isparticularly impressive when one considers that economic freedom will generallyexert a positive impact on both the level and efficiency of investment. The R2
indicates that (a) differences among countries in economic freedom (both thelevel and changes in the level) and (b) differences among countries in investmentas a share of GDP explain almost half of the variation in growth rates acrosscountries.
110
www.fraserinstitute.org

CHAPTER 5
Country Profiles
This chapter presents detailed data covering both economicfreedom and recent performance for many of the countries in ourstudy. Part 1 contains the three summary indexes, the Isl arearatings (in bold), and the ratings for each of the components (andthe actual data used to derive the component ratings when theunderlying variable is continuous). Since this information ispresented for each rating year, it makes it easy to observe thespecific factors that cause a country's rating to change over time.The data sources for this information were described in Chapter 1.
Part 2 of the profile for each country presents recent (1987-1994) annual data on economic performance, including the growthof real GDP, rate of inflation, changes in the money supply,investment/GDP ratio, budget deficit as a share of GDP, and therate of unemployment (when reliable figures were available).Except for the latter indicator, this information was fromInternational Monetary Fund, International Financial StatisticsYearbook and Monthly International Financial Statistics. The datafor the rate of unemployment were from either the Organisation forEconomic Cooperation and Development (OECD), EconomicOutlook or International Labour Organisation, Bulletin of LabourStatistics. Data on population (and its growth rate) and the growthof per capita real GDP for the 1980-1990 and 1985-1994 periodsare also given. Finally, the 1994 (or most recent) per capita GDPmeasured in 1985 U.S. dollars are also presented for each country.These data are updates of the estimates of Robert Summers andAlan Heston, Penn World Tables (Cambridge: National Bureau ofEconomic Research, 1994), which were derived by the purchasingpower parity method. We believe that they are the most accuratecurrently available set of income comparisons across countries.The Summers and Heston data generally ran through 1992. Weused the 1993 and 1994 growth of per capita real GDP measuredin domestic currency to update the 1992 country figures ofSummers and Heston to 1994 (or the most recent year for whichthe GDP data were available). This is the same set of data andprocedures that we followed when making income comparisonsacross countries presented in other sections of this study.
www.fraserinstitute.org

ARGENTINA
Part 1: The Economic Freedom Ratings for the Components and Various Area andSummary Indexes: 1975, 1980, 1985, 1990 and 1993-95.(The numbers in parentheses indicate the actual values for the components.)
19751980
1985
19901993-95
Summary RatingsIe
3.1
3.32.5
3.4
6.2
Isl3.13.6
2.5
3.86.3
Is23.13.42.6
3.26.2
Summary Rating Is1: 5 Year Periods
1975 1980 1985 1990 1993-95Year
Components of Economic Freedom 1975 1980 1985 1990 1993-95
I. Money and Inflation(a) Annual Money Growth (last 5 yrs.)
(b) Inflation Variablity (last 5 yrs.)
(c) Ownership of Foreign Currency(d) Maint. of Bank Account Abroad
II. Government Operation(a) Govern. Consumption (% of GDP)(b) Government Enterprises
(c) Price Controls(d) Entry Into Business(e) Legal System
(f) Avoidance of Neg. Interest Rates
III. Takings(a) Transfers and Subsidies (% of GDP)
(b) Marginal Tax Rates (Top Rate)(c) Conscription
IV. International Sector(a) Taxes on International Trade (Avg.)
(b) Black Market Exchange Rates (Prem.)
(c) Size of Trade Sector (% of GDP)(d) Capital Transactions with Foreigners
3.60
0
10
10
6.576
-
-
-
-
3.5
4
4
0
0.3
0
1
0
0
(78.2)(61.8)
(12.6)
(7.9)(51)
(12.9)(124)
(11.8)
3.60
0
10
10
3.9
6
4
-
-
-
0
4.4
460
2.5
1
8
00
(150.0)(119.8)
(13.4)
(9.7)(45)
(9.5)
(1)(11.6)
3.600
1010
4.374
---
0
2.13
20
0.7
0
21
0
(295.3)
(207.6)
(12.0)
(11.7)
(62)
(12.7)
(40)
(18.0)
3.600(1
1010
3.8104
0
--
0
4.9
470
2.8
0
100
0
(515.4)185.0)
(5.6)
(8.5)(35)
(12.8)
(0)(15.3)
3.60
0
10
10
7.6106
8
102.5
8
5.4
390
7.7
-
10
0
10
(371.6)
(793.4)
(5.1)
(12.8)(30)
(0)(14.8)
112
www.fraserinstitute.org

ARGENTINA
Part 2: Recent Economic Indicators:
Population 1994: 33.9(in millions)
Annual Rate of Change (1980-94): 1.3%
Real Per Capita GDP :(in 1985 U.S. dollars)
Avg. Growth Rate:
1994 = $6,025
1980-90 = -2.3%
1985-94 = 2.2%
Economic Indicators:Change in Real GDP:Aggregate
: Per CapitaInflation Rate (CPI)
Change in Money Supply: (Ml)
:(M2)Investment/GDP RatioCentral Government Budget
Deficit (-) or Surplus (+)
As a Percent of GDPUnemployment Rate
19872.61.3
131.398.6
133.4
19.6
-2.95.3
1988
-1.9-3.2
343.0231.9
345.5
18.6
-1.96.0
1989
-6.2-7.5
3079.82765.5
2347.3
15.5
-0.47.4
19900.1
-1.22314.01504.9
1065.8
14.5
7.4
19918.97.6
171.7277.5
251.215.0
5.8
19928.7
7.424.979.1
78.6
17.0
+0.16.7
19936.04.7
10.635.4
51.1
18.6
-0.710.1
19947.15.8
4.222.0
-
19.9
-0.7-
Other than perhaps New Zealand, Argentina has moved more rapidly toward a freeeconomy during the last decade than any other country. In both 1975 and 1985, the economicfreedom rating of Argentina placed it in the Bottom Ten among the more than 100 countries inour study. Trade restrictions, monetary expansion, hyperinflation, high taxes, and governmentregulations characterized the Argentine economy for years. This began to change in the late1980s. Exchange rate controls were eliminated and the Argentine peso was anchored to the U.S.dollar (1 peso=$l). Monetary policy was conducted so as to maintain this relationship. Severalgovernment enterprises were privatized; credit market restrictions were relaxed; marginal tax rateswere reduced (the top rate was cut from 62% in 1985 to 35% in 1990 and 30% in 1994). Mostrestrictions on capital transactions with foreigners were also eliminated.
The Argentine economy was transformed and it is now on a healthy growth path. Duringthe last two years, the annual growth of per capita GDP has averaged 5.3%, compared to minus2.3% during 1980-1990. The inflation rate has decelerated sharply from over 2000% in 1990 to25% in 1992 and 4% in 1994. While the transformation to date is impressive, the Argentinetransition to a free economy is not yet finished. Argentina desperately needs a prolonged periodof relative price stability. The fall out from the Mexican monetary crisis of late 1994 complicatedthe achievement of this objective, but thus far Argentina has managed to stay on course. Inaddition, movement toward a more flexible labor market is critical. Recently, the combinationof dynamic change and wage inflexibility has led to rising unemployment. If Argentina can moveahead in these two areas, its economic future will be bright.
113
www.fraserinstitute.org

AUSTRALIA
Part 1: The Economic Freedom Ratings for the Components and Various Area andSummary Indexes: 1975, 1980, 1985, 1990 and 1993-95.(The numbers in parentheses indicate the actual values for the components.
197519801985
1990
1993-95
Summary RatingsIe
5.4
6.0
6.6
6.5
7.3
I s l
5.0
5.5
5.9
6.0
6.8
Is2
6.1
6.8
7.5
7.3
8.0
Summary Rating Is1: 5 Year Periods
Components of Economic Freedom 1975 1980 1985 1990 1993-95
I. Money and Inflation(a) Annual Money Growth (last 5 yrs.)(b) Inflation Variablity (last 5 yrs.)
(c) Ownership of Foreign Currency(d) Maint. of Bank Account Abroad
II. Government Operation(a) Govern. Consumption (% of GDP)
(b) Government Enterprises
(c) Price Controls(d) Entry Into Business
(e) Legal System(f) Avoidance of Neg. Interest Rates
III. Takings(a) Transfers and Subsidies (% of GDP)
(b) Marginal Tax Rates (Top Rate)
(c) Conscription
IV. International Sector(a) Taxes on International Trade (Avg.)(b) Black Market Exchange Rates (Prem.)(c) Size of Trade Sector (% of GDP)
(d) Capital Transactions with Foreigners
7.47
5
10
10
4.4
3
6
-
-
-
4
3.9
4
210
5.26
8
4
2
(7.0)
(4.2)
(17.2)
(8.5)
(64)
(4.4)
(1)(28.8)
8.25
9
10
10
5.3
26
-
-
-
10
3.9
4
210
5.67
8
5
2
(8.7)(1.6)
(18.0)
(10.1)
(62)
(3.6)
(1)(33.9)
8.7
8
8
10
10
5.3
26
-
-
-
10
3.5
3
210
7.17
10
6
5
(3.3)(2.2)
(18.9)
(10.9)(60)
(3.2)
(0)(35.2)
7.63
9
10
10
5.5
2
6
6
-
-
10
3.9
3
3
10
7.87
10
5
8
(11.9)(1.9)
(17.8)
(10.7)
(49)
(3.1)
(0)(34.3)
8.5
5
10
10
10
6.9
26
7
10
7.5
10
4.4
3
4
10
8.28
10
6
8
(9.6)(0.8)
(19.0)
(13.4)(47)
(2.3)
(0)(37.4)
114
www.fraserinstitute.org

AUSTRALIA
Part 2: Recent Economic IndicatorsPopulation 1994: 18.0
(in millions)
Annual Rate of Change (1980-94): 1.4%
Real Per Capita GDP :
(in 1985 U.S. dollars)
A vg. Growth Rate: 1980-90
1985-94
1994= $15,169
1.6%1.6%
Economic Indicators:
Change in Real GDP: Aggregate: Per Capita
Inflation Rate (CPI)
Change in Money Supply: (Ml)
: (M2)Investment/GDP Ratio
Central Government BudgetDeficit (-) or Surplus (+)As a Percent of GDP
Unemployment Rate
1987
4.9
3.3
8.5
17.112.7
24.1
0.0
8.0
1988
4.4
2.6
7.224
14.3
25.2
+ 1.3
7.2
1989
4.4
2.6
7.6
19.8-26.3
26.7
+ 1.46.1
1990
1.2-0.3
7.3
3.5
15.8
22.6
+0.76.9
1991
-1.1-2.7
3.2
8.5
5.6
19.6
-2.69.5
19922.6
1.4
1.0
18.14.7
19.2
-3.910.7
1993
4.1
2.8
1.8
17.86.9
19.6
-5.010.7
1994
5.0
3.6
1.9
15.48.1
20.8
-4.39.6
The average of our three indexes places the Australian economy in a tie with Ireland asthe 8th freest in the world. Moreover, its economic freedom rating has registered modest butsteady increases during the last two decades. No doubt, this relatively high ranking and consistentincreases are, in large part, responsible for the high level of real GDP ($15,169 in 1994) attainedby this country.
The strengths of this economy are in the financial and international areas: relatively freetrade, open capital markets, relatively stable rate of inflation, and a competitive and open creditmarket. It also earns high marks for a relatively competitive business environment and thesecurity of property rights, including equal treatment under the law. The major weaknesses arethe high level of government consumption—19% of the GDP in 1993—and a large and growingtransfer sector. Most recently, a little more than 13% of GDP was transferred from one citizento another, up from 8.5% of GDP in 1975. Policies of this type generally culminate with largebudget deficits and a high rate of unemployment. These signs are increasingly apparent inAustralia. In the 1990s, the budget deficits of the central government averaged approximately 4%of GDP and the unemployment rate hovered around 10% of the labor force. Like several otherhigh-income industrial nations, Australia must reduce the size of government and its transfer andregulatory policies that are the primary cause of its unemployment problem if it wants to achievestrong growth and continued prosperity in the future.
115
www.fraserinstitute.org
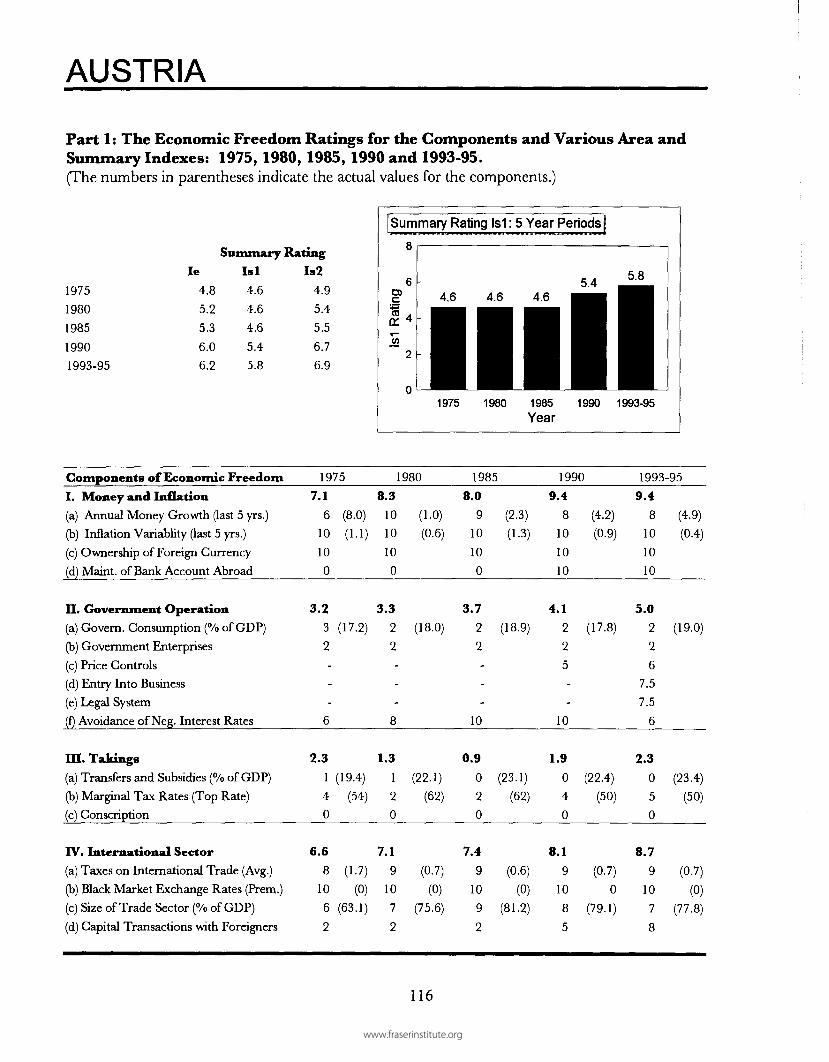
AUSTRIA
Part 1: The Economic Freedom Ratings for the Components and Various Area andSummary Indexes: 1975, 1980, 1985, 1990 and 1993-95.(The numbers in parentheses indicate the actual values for the components.)
1975
19801985
19901993-95
Ie
4.8
5.25.3
6.0
6.2
Summary RatingI s l
4.6
4.6
4.6
5.4
5.8
Is24.9
5.4
5.5
6.7
6.9
Summary Rating Is1: 5 Year Periods
1975 1980 1985 1990 1993-95Year
Components of Economic Freedom 1975 1980 1985 1990 1993-95
I. Money and Inflation(a) Annual Money Growth (last 5 yrs.)(b) Inflation Variablity (last 5 yrs.)
(c) Ownership of Foreign Currency(d) Maint. of Bank Account Abroad
II. Government Operation(a) Govern. Consumption (% of GDP)
(b) Government Enterprises
(c) Price Controls(d) Entry Into Business(e) Legal System(f) Avoidance of Neg. Interest Rates
III. Takings(a) Transfers and Subsidies (% of GDP)(b) Marginal Tax Rates (Top Rate)(c) Conscription
IV. International Sector(a) Taxes on International Trade (Avg.)(b) Black Market Exchange Rates (Prem.)
(c) Size of Trade Sector (% of GDP)
(d) Capital Transactions with Foreigners
7.16
10
10
0
3.23
2---
6
2.31
4
0
6.6
8
10
6
2
(8.0)
(1.1)
(17.2)
(19.4)
(54)
(1.7)
(0)(63.1)
8.3
10
10
10
0
3.3
22---
8
1.3
1
20
7.19
10
7
2
(1.0)
(0.6)
(18.0)
(22.1)
(62)
(0.7)
(0)(75.6)
8.0
9
10
10
0
3.7
22---
10
0.9
0
20
7.49
10
9
2
(2.3)
(1.3)
(18.9)
(23.1)
(62)
(0.6)
(0)(81.2)
9.4
8
10
10
10
4.1
225
-
-
10
1.9
0
4
0
8.1
9
10
8
5
(4.2)
(0.9)
(17.8)
(22.4)
(50)
(0.7)
0
(79.1)
9.4
8
10
10
10
5.0226
7.5
7.5
6
2.30
5
0
8.79
10
7
8
(4.9)
(0.4)
(19.0)
(23.4)
(50)
(0.7)
(0)(77.8)
116
www.fraserinstitute.org

AUSTRIA
Part 2: Recent Economic IndicatorsPopulation 1994: 7.9
(in millions)Annual Rate of Change (1980-94): 0.2%
Real Per Capita GDP a :(in 1985 U.S. dollars)
Avg. Growth Rate:
1994=
1980-90=1985-94=
$13
1
1
,250
.9%
. 8 %
Economic Indicators:
Change in Real GDP: Aggregate: Per Capita
Inflation Rate (CPI)Change in Money Supply: (Ml)
: (M2)
Investment/GDP Ratio
Central Government BudgetDeficit (-) or Surplus (+)As a Percent of GDP
Unemployment Rate
19871.7
1.5
1.4
10.0
8.8
24.0
-5.5
5.6
1988
4.1
3.8
1.9
10.26.7
24.8
-5.0
5.3
19893.8
3.4
2.66.1
6.9
25.4
-3.8
5.0
1990
4.2
3.0
3.3
1.7
7.225.2
-4.5
5.4
19912.9
1.6
3.3
6.0
8.4
26.3
-4.8
5.8
19921.8
1.1
4.0
5.27.6
25.1
-3.9
5.9
1993
-0.1
-1.43.6
8.6
6.8
24.2
-2.8
6.8
19943.0
2.8
3.0
11.9
5.3
24.1
-4.0
6.5
a Derived by purchasing power parity method.
The average of our three summary indexes ranked Austria as the 23 rd most free economy in1993-1995. The Isl index placed it 36th.
Austria's rating has improved during the last decade, primarily as the result of a reduction inthe top marginal tax rate from 62% to 50% and relaxation of restrictions on capital mobility.The most recent improvement may partially reflect the change in the structure of the index, ratherthat a genuine move toward a freer economy. The "entry into business" and "legal structure"components are included only in the most recent index. Since the Austrian ratings for these twocomponents are relatively high, their inclusion pushes the summary indexes upward.
The major deficiencies of this economy are its huge government consumption and transfersectors. Government now takes over 40% of the earnings of Austrians—19% for governmentconsumption and another 23% for transfers and subsidies. In order to finance this high level ofgovernment spending, Austria has resorted to large budget deficits. During the last decade, thesedeficits have averaged approximately 4% of GDP. As a result, the national debt has beenincreasing as a share of the economy. In turn, this soon pushes interest costs up, which makesit still more difficult to control government spending. Credit markets will not accept acontinuously rising debt to GDP ratio. Therefore, like several other European nations, Austriawill be forced to reduce the size of its deficit in the near future.
117
www.fraserinstitute.org

BELGIUM
Part 1: The Economic Freedom Ratings for the Components and Various Area andSummary Indexes: 1975, 1980, 1985, 1990 and 1993-95.(The numbers in parentheses indicate the actual values for the components.)
197519801985
19901993-95
Summary RatingsIe
6.2
6.8
6.9
6.7
7.1
I s l
5.5
5.7
5.8
5.9
6.3
Is27.38.08.1
7.57.8
Summary Rating Is1: 5 Year Periods
10
CD
T=re
OH
1975 1990 1993-9 5
Components of Economic Freedom 1975 1980 1985 1990 1993-95
I. Money and Inflation(a) Annual Money Growth (last 5 yrs.)
(b) Inflation Variablity (last 5 yrs.)
(c) Ownership of Foreign Currency
(d) Maint. of Bank Account Abroad
II. Government Operation
(a) Govern. Consumption (% of GDP)(b) Government Enterprises(c) Price Controls
(d) Entry Into Business
(e) Legal System(f) Avoidance of Neg. Interest Rates
III. Takings(a) Transfers and Subsidies (% of GDP)
(b) Marginal Tax Rates (Top Rate)
(c) Conscription
IV. International Sector(a) Taxes on International Trade (Avg.)
(b) Black Market Exchange Rates (Prem.)(c) Size of Trade Sector (% of GDP)(d) Capital Transactions with Foreigners
7.86
7
10
10
4.8
3
6
-
-
-
6
0.9
0
2
0
9.8
10
10
9
10
(7.9)
(3.0)
(16.5)
(28.5)
(64)
(0.0)
(0)(107.0)
9.7
10
9
10
10
5.3
2
6
-
-
-
10
0.0
0
0
0
10.0
10
101010
(1.5)
(1.6)
(17.8)
(26.0)
(76)
(0.0)
(0)(128.3)
10.0
10
10
10
10
5.7
3
6
-
-
-
10
0.0
0
0
0
10.010
10
10
10
(1.7)
(0.8)
(17.1)
(27.6)
(76)
(0.0)
(0)
(151.2)
9.79
10
10
10
5.1
56
2-
-10
0.90
20
10.0
10
10
10
10
(2-9)(1.0)
(14.5)
(25.0)
(55-65)
(0.0)
(0)(145.0)
9.4
8
10
10
10
6.8
5
6
5
7.5
10
10
0.9
0
20
10.010
10
10
10
(3.3)
(0.4)
(15.0)
(26.6)
(55-65)
(0.0)
(0)(135.6)
118
www.fraserinstitute.org

BELGIUM
Part 2: Recent Economic IndicatorsPopulation 1994: 10.1
(in millions)
Annual Rate of Change (1980-94): 0.2%
Real Per Capita GDP :(in U.S. dollars)
Avg. Growth Rate:
1994=
1980-90=1985-94=
$13,
1
1
735
.8%
.9%
Economic Indicators:Change in Real GDP: Aggregate
: Per Capita
Inflation Rate (CPI)
Change in Money Supply: (Ml)
: (M2)
Investment/GDP RatioCentral Government Budget
Deficit (-) or Surplus (+)As a Percent of GDP
Unemployment Rate
19872.0
1.9
1.6
7.0
10.4
16.2
-7.811.9
19885.0
4.4
1.2
4.0
7.3
18.1
-6.511.1
19893.6
3.3
3.1
3.1
7.1
19.8
-6.6
10.2
1990
3.2
2.9
3.5
3.1
7.3
20.6
-5.79.6
1991
2.2
1.9
3.2
10.45.5
19.5
-6.8
10.2
19921.9
1.5
2.41.5
10.8
19.3
-7.1
11.2
1993-1.7
-1.4
2.8
7.3
13.0
19.4
-6.613.1
19943.7
3.5
2.4
10.4
1.2
19.3
-5.813.8
Based on the average of our three indexes, the Belgium economy was the 12th freest (tiedwith Germany and Malaysia) in the world in the mid-1990s. (Note: its Isl summary rating placedit in a tie for 21st place.) Its summary ratings indicate that it has made small but steady stridestoward economic freedom during the last two decades.
From the viewpoint of economic freedom, monetary stability and the international sectorare Belgium's strengths. In recent years, monetary expansion has been modest, prices relativelystable, and citizens are free to maintain foreign currency bank accounts. The sore spot forBelgium is its takings policy. Transfers and subsidies comprise approximately 25% of GDP. Inaddition, marginal tax rates, while curtailed from a high of 76% in the 1980s, continue to takeapproximately 60% of the marginal earnings of productive citizens. Belgium's top rates areamong the highest in the world.
The growth of the welfare state has been financed with large budget deficits in recentyears. Since 1987 the budget deficit of the central government has persistently exceeded 6% ofGDP. This is an unsustainable level and it has drastically pushed up the government interest cost.Given that taxes are already pushing their revenue maximum level, bond markets will force thegovernment to curtail its spending. Belgium is a high income country—its real per capita GDPin 1994 was a healthy $13,735. It is perfectly capable of cutting spending and modifying someof its welfare state practices in order to meet its financial obligations to bondholders. However,this will mean a change of direction and, if political considerations precluded this option, thiscountry could be headed for a financial crisis.
119
www.fraserinstitute.org

BOLIVIA
Part 1: The Economic Freedom Ratings for the Components and Various Area andSummary Indexes: 1975, 1980, 1985, 1990 and 1993-95.(The numbers in parentheses indicate the actual values for the components.)
19751980
198519901993-95
Ie
5.3
4.4
3.2
5.8
6.1
Summary RatingsI s l
5.5
4.5
4.2
6.3
6.4
Is2
4.9
4.3
2.2
5.5
5.9
Summary Rating Is1: 5 Year Periods]
O) 6cCO „
01 4
J2 2
. 5.5
14.5 4.2
6.3
16.4
11975 1980 1985
Year1990 1993-95
Components of Economic Freedom 1975 1980 1985 1990 1993-95
I. Money and Inflation(a) Annual Money Growth (last 5 yrs.)
(b) Inflation Variablity (last 5 yrs.)(c) Ownership of Foreign Currency
(d) Maint. of Bank Account Abroad
II. Government Operation(a) Govern. Consumption (% of GDP)
(b) Government Enterprises
(c) Price Controls
(d) Entry Into Business
(e) Legal System(f) Avoidance of Neg. Interest Rates
HI. Takings(a) Transfers and Subsidies (% of GDP)(b) Marginal Tax Rates (Top Rate)
(c) Conscription
IV. International Sector(a) Taxes on International Trade (Avg.)(b) Black Market Exchange Rates (Prem.)
(c) Size of Trade Sector (% of GDP)(d) Capital Transactions with Foreigners
4.6
2
1
10
10
7.0
8
6
-
-
-
-
7.510
-
0
4.2
2
6
8
2
(19.3)
(21-0)
(10.5)
(1.3)
(8.9)
(5)(58.2)
4.6
1
2
10
10
6.0
6
6
-
-
-
6
5.09
3
0
2.9
3
4
2
2
(21.3)
(11.0)
(14.1)
(1.6)(48)
(7.8)
(22)(37.7)
0.0
0
0
0
0
3.9
6
4
-
-
-
0
7.39
8
0
3.4
4
5
2
2
(569.5)
(4349.2)
(13.3)
(1.8)
(30)
(7.0)
(9)(30.2)
3.9
1
0
10
10
5.7
6
4
6
-
-
8
7.9
8
10
0
6.5
8
10
5
2
(38.1)
(91.2)
(14.0)
(2.8)
(10)
(2-3)
(0)(46.8)
5.6
1
5
10
10
5.9
5
4
8
7.5
2.5
8
7.9
8
10
0
6.1
7
8
3
5
(33.0)
(4.3)
(15.2)
(2.6)
(13)
(2-8)
(1)(40.4)
120
www.fraserinstitute.org

BOLIVIA
Part 2: Recent Economic IndicatorsPopulation 1994: 7.9
(in millions)Annual Rate of Change (1980-94): 2.5
Real Per Capita GDP :(in 1985 U.S. dollars)
Avg. Growth Rate:
1993 =
1980-90=
1985-93=
$1,730
-2.4%0.1%
Economic Indicators:Change in Real GDP: Aggregate
: Per Capita
Inflation Rate (CPI)Change in Money Supply: (Ml)
:(M2)Investment/GDP RatioCentral Government Budget
Deficit (-) or Surplus (+)
As a Percent of GDP
Unemployment Rate
19872.6
0.1
14.661.7
108.814.9
+0.720.5
19883.0
0.5
16.027.4
24.6
11.3
-0.618.0
19892.8
0.3
15.218.6
19.59.8
-1.220.0
19904.1
1.6
17.139.4
53.1
9.2
-1.519.0
19914.6
2.1
21.445.1
50.5
13.2
-0.1
19923.4
0.9
12.132.9
38.4-
-1.8
19933.0
0.5
8.5
30.0
33.7-
1994
28.7
22.6
Historically, the potential of this poor South American country has been stifled bymonetary instability and hyperinflation. In 1985 Bolivia's inflation rate soared to over 13,000%(this means that prices increased by a factor of 130 in one year). Inflation rates of this magnitudeundermine economic progress, pretty much regardless of the policies in other areas.
Attempting to rebound from this catastrophic situation, Bolivia has taken a number ofconstructive steps in recent years. The freedom to maintain foreign currency bank accounts whichwas denied during the inflation of the mid-1980s has now been restored. The top marginal taxrate was reduced from 48% in 1980 to 10% in 1990 and 13% in 1994. Tariff rates were cut byapproximately a third during the 1980s. Relaxation of exchange rate controls has just abouteliminated the black market in this area. There has also been some relaxation of the restrictionson the movement of capital. As the result of the changes, Bolivia now ranks in the upper thirdamong the nations in our study.
However, unless monetary policy is brought under control, a Bolivian "economic miracle"is unlikely. The growth of the Ml money supply continues to exceed 30%, a figure far tooexpansionary for the achievement of a low and stable rate of inflation. Stable money matters.It is an important ingredient of economic freedom. The sooner Bolivian policy makers understandthis point and begin to act accordingly, the brighter the future of this troubled economy.
121
www.fraserinstitute.org

BOTSWANA
Part 1: The Economic Freedom Ratings for the Components and Various Area andSummary Indexes: 1975, 1980, 1985, 1990 and 1993-95.(The numbers in parentheses the actual values for the components.)
Summary Ratio
Ie Isl
1975 3.9 3.51980 3.8 3.5
1985 4.7 4.4
1990 4.4 4.3
1993-95 5.6 5.4
Components of Economic FreedomI. Money and Inflation(a) Annual Money Growth (last 5 yrs.)
(b) Inflation Variablity (last 5 yrs.)(c) Ownership of Foreign Currency
(d) Maint. of Bank Account Abroad
II. Government Operation(a) Govern. Consumption (% of GDP)
(b) Government Enterprises
(c) Price Controls
(d) Entry Into Business
(e) Legal System(f) Avoidance of Neg. Interest Rates
III. Takings(a) Transfers and Subsidies (% of GDP)
(b) Marginal Tax Rates (Top Rate)
(c) Conscription
IV. International Sector(a) Taxes on International Trade (Avg.)
(b) Black Market Exchange Rates (Prem.)(c) Size of Trade Sector (% of GDP)(d) Capital Transactions with Foreigners
LgS
Is2
4.0
4.1
5.1
4.4
5.8
Summary Rating Is1
8
O) 6
fCO 4
, _
~~ 2
0
19751.4
-
3
0
0
5.1
2
8
-
-
-
-
3.7
6
0
10
3.4
1
210
~
(7.7)
(18.8)
(5.5)
(75)
(10.4)
(44)(109.1)
1
JI
1.6
3
2
0
0
4.51
8
4
3.7
6
0
10
4.1
0
4
10
5
3.5
MM 1••̂ 1
1975
1980
(11.9)
(8.8)
(19.3)
(4.9)
(75)
(12.8)
(10)(116.4)
3.5
•I••1980
5 Year
4.4^H••H^^^H
1985Year
19853.1
8
20
0
4.9
0
8
-
-
-
8
4.3
5
210
5.0
3
4
10
5
(4.2)(8.8)
(24.2)
(7.3)
(60)
(7.1)
(22)
(115.0)
Periods |
4.3^m•••—M^H
199C
5.'
• •1 •1 •1 •
I
•1111• ^ 1
1993-95
1990
1.3
220
0
4.6
2
6
6
-
-
4
4.75
3
10
5.54
5
10
5
(15.4)
(8.7)
(19.1)
(6.6)
(50)
(6.6)
(7)
(118.1)
1993-955.4
10 (0.5)
7 (2.5)0
0
5.1
0 . (24.6)6
6
7.5
5
6
5.75 (6.9)
5 (40)
10
5.5
1 (9.6)
8 (1)10 (106.0)5
122
www.fraserinstitute.org
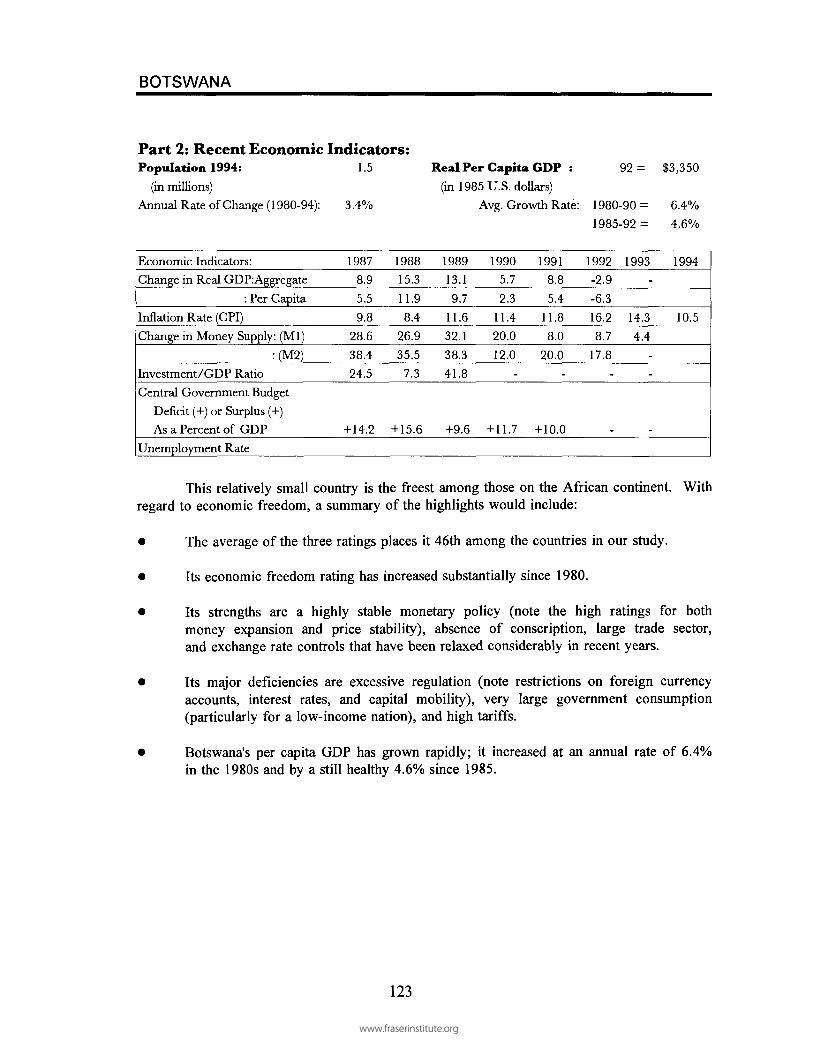
BOTSWANA
Part 2: Recent Economic Indicators:Population 1994: 1.5
(in millions)
Annual Rate of Change (1980-94): 3.4%
Real Per Capita GDP : 92= $3,350
(in 1985 U.S. dollars)
Avg. Growth Rate: 1980-90= 6.4%
1985-92 = 4.6%
Economic Indicators:
Change in Real GDP:Aggregate
: Per Capita
Inflation Rate (CPI)
Change in Money Supply: (Ml)
:(M2)Investment/GDP Ratio
Central Government Budget
Deficit (+) or Surplus (+)
As a Percent of GDP
Unemployment Rate
1987
8.9
5.5
9.8
28.6
38.4
24.5
+ 14.2
1988
15.3
11.9
8.4
26.9
35.5
7.3
+ 15.6
1989
13.1
9.7
11.6
32.1
38.3
41.8
+9.6
1990
5.7
2.3
11.4
20.0
12.0
-
+ 11.7
1991
8.8
5.4
11.8
8.0
20.0
-
+ 10.0
1992
-2.9
-6.3
16.2
8.7
17.8
-
1993 1994
-
14.3 10.5
4.4
-
-
This relatively small country is the freest among those on the African continent. Withregard to economic freedom, a summary of the highlights would include:
• The average of the three ratings places it 46th among the countries in our study.
• Its economic freedom rating has increased substantially since 1980.
• Its strengths are a highly stable monetary policy (note the high ratings for bothmoney expansion and price stability), absence of conscription, large trade sector,and exchange rate controls that have been relaxed considerably in recent years.
• Its major deficiencies are excessive regulation (note restrictions on foreign currencyaccounts, interest rates, and capital mobility), very large government consumption(particularly for a low-income nation), and high tariffs.
• Botswana's per capita GDP has grown rapidly; it increased at an annual rate of 6.4%in the 1980s and by a still healthy 4.6% since 1985.
123
www.fraserinstitute.org

BRAZIL
Part 1: The Economic Freedom Ratings for the Components and Various Area andSummary Indexes: 1975, 1980, 1985, 1990 and 1993-95.(The numbers in parentheses indicate the actual values for the components.)
1975
19801985
19901993-95
Summary RatingsIe
2.82.5
2.0
2.12.8
I s l
3.22.72.3
2.9
3.3
Is2
2.01.7
1.21.4
2.4
Summary Rating Is1: 5 Year Periods
'•sa:
3.2 3.32.3
1975 1980 1985 1990 1993-95Year
Components of Economic Freedom 1975 1980 1985 1990 1993-95
I. Money and Inflation(a) Annual Money Growth (last 5 yrs.)
(b) Inflation Variablity (last 5 yrs.)(c) Ownership of Foreign Currency(d) Maint. of Bank Account Abroad
II. Government Operation(a) Govern. Consumption (% of GDP)(b) Government Enterprises
(c) Price Controls
(d) Entry Into Business(e) Legal System(f) Avoidance of Neg. Interest Rates
III. Takings(a) Transfers and Subsidies (% of GDP)
(b) Marginal Tax Rates (Top Rate)(c) Conscription
IV. International Sector(a) Taxes on International Trade (Avg.)(b) Black Market Exchange Rates (Prem.)
(c) Size of Trade Sector (% of GDP)
(d) Capital Transactions with Foreigners
1.31
3
0
0
6.08
4
-
-
-
-
3.9
-
5
0
2.45
2
20
(28.9)
(6.9)
(10.6)
(50)
(5.7)
(49)
(19.0)
0.61
1
0
0
6.49
4
-
-
-
-
3.1
3
4
0
1.7
1
4
20
(41.6)
(16.6)
(9.2)
(12.4)
(55)
(10.0)(18)
(20.4)
0.00
0
0
0
3.98
2
-
--
0
2.14
1
0
3.07
2
20
(137.8)
(53.1)
(9.9)
(10.0)
(60)
(3.2)
(49)
(19.3)
0.00
0
0
0
1.9
5
20
-
-
0
5.4
3
9
0
2.96
4
0
0
(648.6)
(909.8)
(15.5)
(10.7)
(25)
(3.7)(10)
(12.6)
0.00(1232.5)0
0
0
3.23
24
7.5
0
0
4.9
3
8
0
3.9
7
6
1
0
(956.5)
(16.5)
(11.8)
(35)
(3.2)
(5)
(16.5)
124
www.fraserinstitute.org

BRAZIL
Part 2: Recent Economic Indicators:Population 1994: 159.8
(in millions)Annual Rate of Change (1980-94): 2.0%
Real Per Capita GDP
(in 1985 U.S. dollars)Avg. Growth Rate:
1994= $4,118
1980-90= -0.6%1985-94= 0.8%
Recent Economic Indicators:Change in Real GDP: Aggregate
: Per Capita
Inflation Rate (CPI)Change in Money Supply (Ml)
:(M2)Investment/GDP RatioCentral Government Budget
Deficit (-) or Surplus (+)As a Percent of GDP
Unemployment Rate
19873.6
1.6
229.7
149.2163.4
22.2
-12.0
1988-0.1
-2.1682.3
-
22.7
-15.23.8
19893.3
1.3
1287.0-
-
24.8
-16.13.3
1990-4.4-6.3
2937.8-
-
21.6
-5.74.3
19910.2
-0.7440.9380.6
-
19.0
-0.44.8
1992-0.8-2.8
1008.7744.9
-
19.1
-3.64.5
19934.1
2.22148.41584.4
-
21.0
5.3
19945.7
3.8
2668.52823.6
The largest country in South America ranked 97th (based on the average of our threeindexes; its Isl summary rating placed it 93rd) among the 103 countries in our study. It wasin the Bottom Ten for each of the five rating years covered by our study.
Brazil's policies conflict with economic freedom in almost every area. Its monetarypolicy is a disaster, characterized by excessive monetary growth and the consequenthyperinflation. During 1992-1994, both the money supply and the price level expanded atrates of approximately 2000%. Furthermore, it is illegal to maintain foreign currency bankaccounts. Thus, Brazil's monetary policy and institutional arrangements undermine theworkings of a market economy.
Nor is there much evidence of economic freedom in the area of government operations.Government consumption has increased substantially as a share of GDP during the last decade,the legal system often fails to support private property rights, and government enterprises arewidespread. On a brighter note, the top marginal tax rate was reduced from 60% in 1985 to35% in 1993-95. In addition, there were reductions in taxes on international trade (from 5.7%to 3.2% over two decades), and some relaxation of exchange rate controls.
As might be expected from its pattern of economic freedom, Brazil's growth record isdismal. Its real GDP per capita in 1994 was approximately the same as in 1980. Unless thisnation makes a dramatic change, its economy will continue to stagnate.
125
www.fraserinstitute.org

CAMEROON
Part 1: The Economic Freedom Ratings for the Components and Various Area andSummary Indexes: 1975, 1980, 1985, 1990 and 1993-95.(The numbers in parentheses indicate the actual values for the components.)
1975
1980
1985
1990
1993-95
Ie
4.2
4.7
5.4
4.4
4.1
Summary RatingsI s l
4.7
5.3
5.6
4.5
4.2
Is2
3.3
3.7
4.6
3.9
3.7
Summary Rating Is1: 5 Year Periods
Components of Economic Freedom 1975 1980 1985 1990 1993-95
I. Money and Inflation(a) Annual Money Growth (last 5 yrs.)
(b) Inflation Variablity (last 5 yrs.)
(c) Ownership of Foreign Currency
(d) Maint. of Bank Account Abroad
II. Government Operation
(a) Govern. Consumption (% of GDP)
(b) Government Enterprises
(c) Price Controls
(d) Entry Into Business
(e) Legal System
(f) Avoidance of Neg. Interest Rates
III. Takings
(a) Transfers and Subsidies (% of GDP)
(b) Marginal Tax Rates (Top Rate)
(c) Conscription
IV. International Sector
(a) Taxes on International Trade (Avg.)
(b) Black Market Exchange Rates (Prem.)
(c) Size of Trade Sector (% of GDP)
(d) Capital Transactions with Foreigners
2.54
4
0
0
6.0
8
4
-
-
--
9.2
9
-
10
2.6
0
7
4
0
(10.3)
(5.3)
(10.9)
(1.4)
(13.4)
(2)(48.2)
3.6
2
9
0
0
6.3
9
4
-
-
-
6
10.0
10
-
10
2.7
1
7
3
0
(15.1)
(1.9)
(8.7)
(0.8)
(11.0)
(2)(51.3)
5.17
9
0
0
6.3
9
4
-
-
-
6
6.3
10
2
10
4.5
5
8
5
0
(6.3)
(1.5)
(9.0)
(0.6)
(60)
(6.1)
(1)(57.6)
4.4
9
5
0
0
4.8
7
4
2
-
-
8
5.0
8
1
10
3.8
6
6
2
0
(-3.2)
(4.2)
(12.9)
(2.7)
(60)
(5.4)
(4)
(41.5)
4.4
9
5
0
0
4.0
6
4
2
5
0
8
5.0
8
1
10
3.4
3
8
2
0
(-2.9)
(4.1)
(13.6)
(2.7)
(60)
(7.7)
(1)(40.6)
126
www.fraserinstitute.org

CAMEROON
Part 2: Recent Economic Indicators:Population 1994: 12.9
(in millions)
Annual Rate of Change (1980-94): 2.8%
Real Per Capita GDP :(in 1985 U.S. dollars)
Avg. Growth Rate:
1993 =
1980-90 =1985-93 =
$975
-0.4%-6.3%
Economic Indicators:
Change in Real GDP:Aggregate
: Per Capita
Inflation Rate (CPI)Change in Money Supply: (Ml)
:(M2)Investment/GDP RatioCentral Government Budget
Deficit (+) or Surplus (+)As a Percent of GDP
Unemployment Rate
1987-5.0
-7.8
12.8-4.7
-8.229.0
1988
-7.2-10.0
-5.5
-7.2-10.727.3
1989-6.0
-8.8
5.5
2.5
5.1
27.3
-3.2
1990
2.1
-0.7
1.7
3.0
3.2
28.8
-5.8
1991
-9.5
-12.3
1.9
-1.9
1.2
26.8
-5.2
1992-7.3
-10.1
1.4
-3.7
-2.8-
-2.1
1993 1994-2.7
-5.5-
-35.1 16.9
-26.2-
After increasing from 4.7 to 5.6 between 1975 and 1985, the economic freedom rating(Isl) of Cameroon plunged to 4.2 during the last decade. Cameroon's 1993-1995 rating placesit in a tie for 72nd place. The highlights include:
• Relatively stable monetary arrangements (Cameroon is part of the CFA group with currenciestied to the French franc), but prohibition of foreign currency accounts undermines confidence.
• The major strengths are absence of conscription and a largely convertible currency—blackmarket premium in the foreign exchange market is generally small.
• The major weaknesses are widespread government enterprises, a weak and oftendiscriminatory legal system, high marginal tax rates (the top rate has been 60% throughoutthe last decade), and restrictive trade practices (high tariffs, small trade sector, and extensiverestrictions on the mobility of capital). With regard to the latter, direct investments abroadmust be approved by the Ministry of Finance.
• As Cameroon moved to a more restrictive economy, its growth rate plunged. Since 1985, thereal per capita GDP has declined at an annual rate of 6.3%.
127
www.fraserinstitute.org

CANADA
Part 1: The Economic Freedom Ratings for the Components and Various Area andSummary Indexes: 1975, 1980, 1985, 1990 and 1993-95.(The numbers in parentheses indicate the actual values for the components.)
1975
1980
1985
1990
1993-95
Ie6.57.56.77.57.5
Summary RatingIs l
6.16.8
5.96.96.9
Is27.58.57.78.58.4
| Summary Rating Is1: 5 Year Periods |
10
8O)
I'a:_ 4(A
6.8 6.9 6.9
him1975 1980 1985 1990 1993-95
Year
Components of Economic Freedom 1975 1980 1985 1990 1993-95
I. Money and Inflation(a) Annual Money Growth (last 5 yrs.)
(b) Inflation Variablity (last 5 yrs.)
(c) Ownership of Foreign Currency
(d) Maint. of Bank Account Abroad
II. Government Operation(a) Govern. Consumption (% of GDP)
(b) Government Enterprises
(c) Price Controls
(d) Entry Into Business
(e) Legal System
(f) Avoidance of Neg. Interest Rates
III. Takings(a) Transfers and Subsidies (% of GDP)
(b) Marginal Tax Rates (Top Rate)
(c) Conscription
IV. International Sector(a) Taxes on International Trade (Avg.)
(b) Black Market Exchange Rates (Prem.)
(c) Size of Trade Sector (% of GDP)
(d) Capital Transactions with Foreigners
7.475
10
10
4.1
1
6
-
-
-
6
4.8
44
10
8.16
10
9
8
(6.0)
(4.0)
(19.5)
(9.1)
(43-61)
(3.7)
(0)
(47.2)
9.7109
1010
5.3
26-
--
10
4.4
34
10
8.78
10
9
8
(1.6)
(1.9)
(19.2)
(14.5)
(47-62)
(2.4)
(0)(55.1)
6.946
1010
4.916-
--
10
3.5
23
10
8.9
8
10
10
8
(11.3)
(3.2)
(20.1)
(16.3)
(49-60)
(1.7)
(0)(54.5)
9.48
10
10
10
5.9
1
6.
8
-
-
10
4.5
25
10
9.09
1098
(4.0)
(1.1)
(20.3)
(15.6)
(42-47)
(1.2)
(0)
(51.2)
9.79
10
10
10
6.4
1
6
8
7.57.510
4.0
24
10
9.0
9
10
9
8
(2.5)
(1.1)
(20.1)
(17.7)
(44-54)
(1.2)
(0)(54.0)
128
www.fraserinstitute.org

CANADA
Part 2: Recent Economic Indicators:Population 1994: 27.9
(in millions)Annual Rate of Change (1980-94): 1.1%
Real Per Capita GDP :
(in 1985 U.S. dollars)Avg. Growth Rate:
1994 =
1980-90 =1985-94 =
$17,
1
0
510
.8%
.9%
Economic Indicators:Change in Real GDP: Aggregate
: Per CapitaInflation Rate (CPI)Change in Money Supply: (Ml)
: (M2)
Investment/GDP RatioCentral Government Budget
Deficit (-) or Surplus (+)As a Percent of GDP
Unemployment Rate
19874.3
2.8
4.4
14.29.5
21.7
-2.58.8
19884.9
3.6
4
3.6
9.8
22.5
-2.27.7
19892.4
0.6
5
4.3
11.423
-2.57.5
1990
-0.2-1.84.8
1.7
9.8
20.7
-4.18.1
1991-2.2-3.05.6
5.8
7.219.1
-6.6
10.2
19920.6
-0.5
1.5
5.4
6.9
18.1
-7.1
11.2
19933.5
2.4
1.8
6.3
11.718.0
-7.111.1
19945.6
4.5
0.6
6.1
5.2
18.3
2.8
10.3
Based on the average of our three indexes, in 1993-1995 Canada placed 6th (tied withthe United Kingdom) among the countries in our study. The Isl summary rating ranked it 9th(tied with Japan). Except for a slight rating decline in 1985, which was primarily the result ofmonetary and price instability, Canada's rating has been steady and persistently high throughoutthe last two decades. In fact, Canada ranked among the ten most free economies in 1975, 1980,1990, and 1993-1995. (See Exhibit 2-2.) Our analysis suggests that persistent economic freedomwill lead to high income status. Canada's 1994 per capita GDP was the third highest in the world,behind only United States and Hong Kong, two other persistently free economies.
Our index does highlight three areas of obvious weakness: (1) a large governmentconsumption sector—20 percent of GDP is allocated by the political process rather than markets,(2) a large and growing transfer sector, and (3) relatively high marginal tax rates, particularly inBritish Columbia, Nova Scotia, Ontario, and Quebec. In order to finance its huge expenditures,in the late 1980s and early 1990s the federal government ran a series of large deficits as a shareof GDP (see above). In turn, the deficits pushed up the interest cost on the debt. In order to dealwith this problem, Canadian governments must reduce their expenditures and rely more on themarket sector. Several provinces are currently moving in this direction.
While our index does not incorporate this factor, there is evidence that the Canadian labormarket is relatively inflexible. In recent years, Canada's unemployment rate has persistentlyexceeded that of the United States. This suggests that deregulation and a reevaluation of thesystem of benefit transfers to unemployed workers is in order.
129
www.fraserinstitute.org

CHILE
Part 1: The Economic Freedom Ratings for the Components and Various Area andSummary Indexes: 1975, 1980, 1985, 1990 and 1993-95.(The numbers in parentheses indicate the actual values for the components.)
1975
1980
1985
1990
1993-95
Summary RatingsIe
2.8
4.1
4.8
6.1
6.3
Isl2.8
3.9
4.1
5.7
5.8
Is22.5
3.8
5.3
6.3
6.5
Summary Rating Is1: 5 Year Periods
D>5.7 5. 8
1975 1980 1985 1990 1993-95Year
Components of Economic Freedom 1975 1980 1985 1990 1993-95
I. Money and Inflation(a) Annual Money Growth (last 5 yrs.)
(b) Inflation Variablity (last 5 yrs.)
(c) Ownership of Foreign Currency
(d) Maint. of Bank Account Abroad
II. Government Operation
(a) Govern. Consumption (% of GDP)
(b) Government Enterprises
(c) Price Controls
(d) Entry Into Business
(e) Legal System
(fj Avoidance of Neg. Interest Rates
III. Takings
(a) Transfers and Subsidies (% of GDP)
(b) Marginal Tax Rates (Top Rate)
(c) Conscription
IV. International Sector
(a) Taxes on International Trade (Avg.)
(b) Black Market Exchange Rates (Prem.)
(c) Size of Trade Sector (% of GDP)
(d) Capital Transactions with Foreigners
0.00210.7)
0
0
0
5.0
4
6
-
-
-
-
1.6
4
0
0
4.8
6
6
5
2
(234.0)
(15.7)
(10.5)
(80)
(5.6)
(5)(52.9)
1.90
0
10
0
7.6
7
8
-
-
-
8
2.1
3
2
0
4.9
7
6
4
2
(93.5)
(80.6)
02.5)
(12.9)
(60)
(2.8)
(6)(49.8)
6.16
2
10
10
7.26
8
-
-
-
8
1.3
2
1
0
3.9
5
4
5
2
(7.3)
(9.6)
(13.4)
(15.3)
(57)
(5.7)
(22)
(53.8)
6.0
1
6
10
10
8.3
9
8
8
-
-
8
3.0
4
3
0
6.2
6
10
7
2
(24.7)
(3.2)
(9.6)
(10.5)
(50)
(3.7)
(0)(65.4)
5.9
2
5
10
10
8.4
9
8
8
10
5
10
2.6
3
3
0
5.7
6
6
6
5
(18.3)
(4.1)
(9.3)
(10.8)
(48)
(3.7)
(4)
(60.0)
130
www.fraserinstitute.org

CHILE
Part 2: Recent Economic Indicators:Population 1994: 14.0
(in millions)Annual Rate of Change (1980-94): 1.7
Real Per Capita GDP :
(in 1985 U.S. dollars)Avg. Growth Rate:
1994= $5,250
1980-90= 1.9%1985-94= 4.8%
Economic Indicators:Change in Real GDP: Aggregate
: Per Capita
Inflation Rate (CPI)Change in Money Supply (Ml)
:(M2)Investment/GDP Ratio
Central Government BudgetDeficit (-) or Surplus (+)As a Percent of GDP
Unemployment Rate
19876.6
4.9
19.919.7
30.222.2
0.4
19887.3
5.5
14.7
39.5
29.222.8
-0.2
1989
10.28.5
17.027.0
26.425.5
1.8
19903.0
1.4
26.011.8
27.724.7
0.8
19916.1
4.5
21.8
43.224.7
22.2
1.6
199211.09.4
15.4
19.5
27.524.1
2.3
19936.3
4.6
12.126.5
37.1
26.2
2.0
1994
4.2
2.6
12.019.9
20.824.3
The record of the Chilean economy during the last two decades illustrates the importanceof economic freedom. In 1975, only 7 countries had a lower economic freedom rating (Isl) thanChile. The economy was characterized by monetary instability, hyperinflation, large governmentexpenditures, high taxes, and various restrictions on international transactions. Things began tochange for the better during the latter half of the 1970s. Between 1975 and 1990, Chile's Islrating jumped from 2.8 to 5.7, the largest increase among the countries in our study during thisperiod of time.
Several factors played a role in this improvement. Even though monetary policy is stilltoo expansionary the annual rate of monetary growth was curtailed from 216.6% during the fiveyears prior to 1975 to approximately 20% during the last decade. Legalization of foreign currencybank accounts, privatization, a reduction in government consumption expenditures (as a share ofGDP, they fell from 15.7% in 1975 to 9.3% during the latest period), a substantial reduction inthe top marginal tax rate (it was reduced from a horrendous 80% in 1975 to the current 48% rate)and some relaxation of restrictions on international exchange all contributed to the improvementin Chile's economic freedom rating.
Chile's rate of economic growth changed in lock step with its improvement in economicfreedom. While Chile's GDP per capita was virtually unchanged during the 1970s, it increasedat an annual rate of 1.9% during the 1980s and since 1985 the rate has accelerated to 4.8%.More needs to be done. Chile needs to make its currency completely convertible and its marginaltaxes are still too high. However, if Chile continues on its current path, its economic future willbe bright.
131
www.fraserinstitute.org

COSTA RICA
Part 1: The Economic Freedom Ratings for the Components and Various Area andSummary Indexes: 1975, 1980, 1985, 1990 and 1993-95.(The numbers in parentheses indicate the actual values for the components.)
1975
1980
1985
19901993-95
Summary RsIe
5.3
4.9
4.8
6.56.7
Isl5.24.84.6
6.66.7
itings
Is25.65.4
5.3
7.17.0
Summary Rating Is1: 5 Year Periods
Components of Economic Freedom 1975 1980 1985 1990 1993-95I. Money and Inflation
(a) Annual Money Growth (last 5 yrs.)
(b) Inflation Variability (last 5 yrs.)(c) Ownership of Foreign Currency
(d) Maint. of Bank Account Abroad
II. Government Operation(a) Govern. Consumption (% of GDP)(b) Government Enterprises(c) Price Controls
(d) Entry Into Business(e) Legal System(f) Avoidance of Neg. Interest Rates
III. Takings(a) Transfers and Subsidies (% of GDP)(b) Marginal Tax Rates (Top Rate)
(c) Conscription
IV. International Sector(a) Taxes on International Trade (Avg.)(b) Black Market Exchange Rates (Prem.)(c) Size of Trade Sector (% of GDP)
(d) Capital Transactions with Foreigners
4.922
10
10
6.5
5
8
-
-
-
-
6.1
-
5
10
3.9
5
5
3
2
(16.0)
(8.9)
(15.2)
(50)
(5.9)
(8)(68.6)
5.925
10
10
5.1
28
-
-
-
-
5.7
5
510
2.96
1
22
(15.7)
(4.5)
(18.2)
(6.0)
(50)
(5.3)
(69)
(63.3)
4.311
10
10
6.0
4
8
-
-
-
6
4.7
5
3
10
3.7
4
3
25
(32.1)
(24.2)
(15.8)
(7.2)
(50)
(6.9)
(24)
(63.2)
6.6
3
6
10
10
3.9
28-
-
-8
7.96
9
10
5.8
4
10
3
5
(13.0)
(3.3)
(18.2)
(5.0)
(25)
(7.0)
(0)(75.4)
5.223
10
10
7.0
3
8
6
10
7.58
7.96
9
10
6.0
6
8
4
5
(15.9)
(6.1)
(17.3)
(4.7)
(25)
(5.0)
(1)(82.0)
132
www.fraserinstitute.org

COSTA RICA
Part 2: Recent Economic Indicators:Population 1994: 3.3
(in millions)Annual Rate of Change (1980-94): 2.4
Real Per Capita GDP :(in 1985 U.S. dollars)
Avg. Growth Rate:
1994= $3,785
1980-90 -0.4%
1985-94 2.1%
Economic Indicators:Change in Real GDP: Aggregate
: Per Capita
Inflation Rate (CPI)Change in Money Supply: (Ml)
:{M2)Investment/GDP Ratio
Central Government Budget
Deficit (-) or Surplus (+)
As a Percent of GDP
Unemployment Rate
19874.82.3
16.812.7
17.627.1
-2.9
19883.41.9
20.86.9
23.524.5
19895.7
3.216.524.4
29.726.5
-2.1
19903.6
1.219.012.9
28.0
27.2
-3.1
19912.3
0.028.74.1
28.025.0
-1.3
19927.7
5.721.833.4
28.728.9
+0.9
19936.33.9
9.87.0
17.1
30.4
-0.2
19944.5
2.113.5
10.216.820.9
-4.7
Costa Rica is another country that illustrates the importance of economic freedom as asource of progress. As recent as the mid-1980s, Costa Rica was simply another struggling CentralAmerican economy. Its per capita GDP actually declined during the 1975-1985 period. Between1985 and 1990, its Isl economic freedom rating rose from 4.6 to 6.6, one of the largest increasesduring this period and the increase was maintained in the mid-1990s. In our most recent ratingyear, Costa Rica's Isl rating indicated that its economy was the 12th most free (tied with Irelandand South Korea) in the world in the mid 1990s. (Note: the average of our three ratings placesit 16th.)
Two major factors contributed to the jump in Costa Rica's rating. First, the top marginaltax rate was sliced from 50% in 1985 to 25% in 1989. The lower rate remains in effect. Second,various trade restraints in the international sector have been reduced. The average tariff rate wascut from 6.9% in 1985 to 5.0% in 1993. Exchange rate controls were relaxed and the blackmarket exchange rate premium declined. As a share of GDP, the size of the trade sector increasedfrom 63% in 1985 to 82% in 1994. Excessive monetary growth is a continuing deficiency. Theannual rate of monetary growth during the last decade was still around 15%, a rate that is far tooexpansionary for the achievement of stable prices.
The increase in economic freedom has fueled economic growth. During the 1985-1994period, the per capita GDP of Costa Rica increased at an average annual rate of 2.1%, up fromminus 0.3% during 1975-1985. Costa Rica has now experienced 11 straight years of growth inreal GDP and during 1992-1994 the per capita growth of real GDP averaged almost 4% annually.Continued movement toward economic freedom will keep this country on a solid growth path.
133
www.fraserinstitute.org

CZECH REPUBLIC (Data prior to 1993 are for former Czechoslovakia )
Part 1: The Economic Freedom Ratings for the Components and Various Area andSummary Indexes: 1975, 1980, 1985, 1990 and 1993-95.(The numbers in parentheses indicate the actual values for the components.)
197519801985
1990
1993-95
Summary RatingIe
-
-
2.7 *
2.5
5.2
Isl Is2-
-
2.4 * 2.4 *
2.4 2.4
4.9 5.6
*Should be interpreted with caution because it is basedon only 10 of the 14 components.
Summary Rating Is1: 5 Year Periods
8
o>'43CO
6 -
2 -2.4
1975 198 0 1990 1993-9 5
Components of Economic Freedom 1975 1980 1985 1990 1993-95
I. Money and Inflation(a) Annual Money Growth (last 5 yrs.)
(b) Inflation Variablity (last 5 yrs.)
(c) Ownership of Foreign Currency(d) Maint. of Bank Account Abroad
II. Government Operation(a) Govern. Consumption (% of GDP)
(b) Government Enterprises(c) Price Controls
(d) Entry Into Business
(e) Legal System(f) Avoidance of Neg. Interest Rates
III. Takings(a) Transfers and Subsidies (% of GDP)
(b) Marginal Tax Rates (Top Rate)
(c) Conscription
IV. International Sector(a) Taxes on International Trade (Avg.)(b) Black Market Exchange Rates (Prem.)
(c) Size of Trade Sector (% of GDP)(d) Capital Transactions with Foreigners
-
-
0
0
-
0
-
-
-
-
-
-
0
-
0 (359)
-
0
-
-
0
0
2 (19.5)0
-
-
-
-
-
-
0
-
0 (387)
-
0
5.4
9
8
0
0
0.5
1
0
-
-
-
-
0.0
-
-
0
1.6
-
0
7
0
(3.0)
(2-2)
(20.9)
(423)
(69.7)
4.7
10
5
0
0
0.3
1
0
0
-
-
-
1.9
0
4
0
3.3
6
26
0
(0.4)
(4.0)
(22.5)
(37.2)
(55)
(4.0)
(61)
(68.8)
4.6
21
10
10
4.5
1
4
5
5
7.5
6
3.1
-
4
0
8.1
-
10
10
5
(13.9)
(17.4)
(22.3)
(44)
(0)(110.5)
134
www.fraserinstitute.org

CZECH REPUBLIC
Part 2: Recent Economic Indicators: a
Population 1994: 10.3(in millions)
Annual Rate of Change (1980-94): 0.1%
Real Per Capita GDP :(in 1985 U.S. dollars)
Avg. Growth Rate:
1994 = $4,800
1985-94= -1.4%
Economic Indicators:
Change in Real GDP:Aggregate: Per Capita
Inflation Rate (CPI)
Change in Money Supply: (Ml)
:(M2)Investment/GDP Ratio
Central Government BudgetDeficit (+) or Surplus (+)As a Percent of GDP
Unemployment Rate
1987
2.1
2.0
0.1
3.6
6.0
14.9
-
1988
2.3
2.2
0.1
6.1
6.7
13.5
-
19890.7
0.6
1.4
4.7
6.3
12.9
-2.4-
1990-1.5-1.6
10.0
0.2
3.8
15.7
+0.11.2
1991
-14.0-14.157.7
4.2
10.7
13.3
-2.04.0
1992-6.9-7.0
10.8
25.727.6
-
-3.33.0
19930.0
-0.120.8
24.022.5
26.5
+0.03.7
19942.5
2.4
9.1
20.3
+ 1.03.3
a All data prior to 1993 are for the former Czechoslovakia. The 1993 and 1994 data are for thethe Czech Republic only. The Czech Republic comprised approximately two-thirds ofthe former Czechoslovakia,b Estimate of the authors.
In the few short years since the yoke of Communism was lifted from the Czech Republic,it has made significant strides in the direction of economic freedom. Its 4.9 rating is no greatshakes compared to the freest countries of the world—it is tied with Pakistan for 51 st place—butthe Czech Republic is now the economically most free of all the former Communist bloc nations.
While government ownership is still common in this former socialist country, massprivatization has moved large sectors of the economy into private hands during the last five years.In contrast with most other Eastern European nations, the Czech voucher plan successfullyprivatized many large state enterprises. The Czech koruna is approaching full convertibility. Astrade barriers have fallen the size of the trade sector has grown dramatically in recent years.Exports plus imports now sum to 110% of GDP; substantially more than would be expected fora country of this size and location.
Of course, problems remain. The current growth of the money supply will fuel inflationunless it is curtailed. Government consumption expenditures—22.3% of the GDP in 1994—are stillquite high. Both employment and income taxes are high and compliance is low and difficult toenforce in an economy where most transactions are conducted with cash rather than checks.Nonetheless, the foundation has been laid and if the Czech Republic continues to move towardeconomic freedom, its future will be bright.
135
www.fraserinstitute.org

DENMARK
Part 1: The Economic Freedom Ratings for the Components and Various Area andSummary Indexes: 1975, 1980, 1985, 1990 and 1993-95.(The numbers in parentheses indicate the actual values for the components.)
1975
1980
1985
1990
1993-95
Summary RatingsIe
4.1
4.3
4.1
5.4
6.7
Isl3.8
3.8
3.7
4.6
6.0
Is24.3
4.6
4.4
6.4
7.7
Summary Rating Is1: 5 Year Periods
1975 1980 1985 1990 1993-95
Year
Components of Economic Freedom 1975 1980 1985 1990 1993-95I. Money and Inflation(a) Annual Money Growth (last 5 yrs.)
(b) Inflation Variablity (last 5 yrs.)(c) Ownership of Foreign Currency(d) Maint. of Bank Account Abroad
4.5
5
9
0
0
(9.6)
(2.1)
5.57
1000
(7.0)
(0.8)
3.63 (12.5)8 (2.4)00
8.86
101010
(7.3)
(0.8)
9.79
101010
(2.4)
(0.4)
II. Government Operation(a) Govern. Consumption (% of GDP)
(b) Government Enterprises(c) Price Controls
(d) Entry Into Business
(e) Legal System(f) Avoidance of Neg. Interest Rates
III. Takings(a) Transfers and Subsidies (% of GDP)
(b) Marginal Tax Rates (Top Rate)(c) Conscription
IV. International Sector(a) Taxes on International Trade (Avg.)(b) Black Market Exchange Rates (Prem.)
(c) Size of Trade Sector (% of GDP)(d) Capital Transactions with Foreigners
3.3
0
4
-
-
-
8
1.3
21
0
6.7
9
8
3
5
(24.6)
(17.8)
(63)
(0.9)
(1)(61.1)
3.7
0
4
-
-
-
10
0.4
1
0
0
6.7
10
7
3
5
(26.7)
(20.8)
(66)
(0-1)(2)
(66.5)
3.7
0
4
-
-
-
10
0.41
0
0
7.7
10
10
4
5
(25.3)
(20.4)
(73)
(0.0)
(0)
(73.0)
4.40
4
6
-
-
10
0.0
0
0
0
7.510
10
3
5
(25.3)
(22.6)
(68)
(0.0)
(0)(65.5)
6.7
0
4
8
10
10
10
0.9
0
20
8.7
10
10
210
(25.3)
(24.6)
(65)
(0.0)
(0)
(66.4)
136
www.fraserinstitute.org

DENMARK
Part 2: Recent Economic Indicators:Population 1994: 5.2 Real Per Capita GDP : 1994= $14,800
(in millions) (in 1985 U.S. dollars)
Annual Rate of Change (1980-94): 0.3% Avg. Growth Rate: 1980-90=
1985-94=
2.0%
1.5%
Recent Economic Indicators:
Change in Real GDP: Aggregate
: Per Capita
Inflation Rate (CPI)
Change in Money Supply: (Ml)
: (M2)Investment/GDP Ratio
Central Government Budget
Deficit or Surplus (% of GDP)
Unemployment Rate
1987
0.3
0.0
4
7.7
4.5
19
2.4
7.8
1988
1.2
0.9
4.6
45.6
-1.5
17.9
0.6
8.6
1989
0.6
0.3
4.8
0.4
2.2
18.4
-0.5
9.3
1990
1.4
1.1
2.6
8.1
6.6
17.3
-1.5
9.6
1991
1.0
0.7
2.4
5.6
3.6
16.1
-2.1
10.5
1992
1.2
0.9
2.1
-0.8
-0.8
15.1
-2.4
11.2
1993
1.2
0.9
1.3
10.5
19.7
13.7
-4.5
12.2
1994
4.4
4.1
2.0
-1.3
-9.9
15.1
-4.3
11.5
The average of our three summary indexes ranked Denmark as the 16th most free economyin 1993-1995; the Isl index placed it 32nd. Thus, Denmark ranks in the upper third among themore than 100 nations in our study.
Denmark's rating has improved during the last decade, primarily as the result of a freer andmore stable monetary regime. During the last five years, monetary expansion has been low (lessthan 5%) and the inflation rate has been steady at an annual rate of approximately 2%. Theformer restrictions on the maintenance of foreign currency bank accounts have been abolished.Removal of prior restrictions limiting the mobility of capital have also contributed to Denmark'srecent improvement.
The major deficiencies of this economy are its huge government consumption and transfersectors. Government now takes over 50% of the earnings of Danes—25% for governmentconsumption and another 25% for transfers and subsidies. Denmark is now caught is the viciouscycle of large government expenditures, budget deficits, and rising interest costs that fuel stillmore government expenditures. Higher taxes will not solve this problem. The current topmarginal tax rate of 65% is already the highest in the world except for the 66% rate imposed inthe tiny African nation of Gabon. Predictably, the high taxes and large government expenditureshave reduced private investment (down to only 15% of GDP) and led to high unemployment(11.5% in 1994 and 10.5% in mid-1995).
137
www.fraserinstitute.org

EGYPT
Part 1: The Economic Freedom Ratings for the Components and Various Area andSummary Indexes: 1975, 1980, 1985, 1990 and 1993-95.(The numbers in parentheses indicate the actual values for the components.)
197519801985
1990
1993-95
Summary RatingsIe
2.73.5
3.9
4.7
4.3
I s l
2.4
2.8
3.3
4.2
4.0
Is23.0
3.9
4.24.7
4.4
Summary Rating Is1: 5 Year Periods
4-2 4. 0
1975 1980 1985 1990 1993-95Year
Components of Economic Freedom 1975 1980 1985 1990 1993-95
I. Money and Inflation(a) Annual Money Growth (last 5 yrs.)
(b) Inflation Variablity (last 5 yrs.)(c) Ownership of Foreign Currency
(d) Maint. of Bank Account Abroad
II. Government Operation(a) Govern. Consumption (% of GDP)(b) Government Enterprises
(c) Price Controls
(d) Entry Into Business(e) Legal System
(f) Avoidance of Neg. Interest Rates
III. Takings(a) Transfers and Subsidies (% of GDP)
(b) Marginal Tax Rates (Top Rate)(c) Conscription
IV. International Sector(a) Taxes on International Trade (Avg.)
(b) Black Market Exchange Rates (Prem.)
(c) Size of Trade Sector (% of GDP)(d) Capital Transactions with Foreigners
2.62
6
0
0
2.00
4
-
-
-
-
0.0
0
-
0
3.8
0
8
10
0
(13.8)
(3.5)
(24.9)
(25.0)
(16.7)
(1)(61.5)
5.6
1
5
10
10
3.24
2---
4
0.820
0
3.0
0
5
10
0
(21.5)
(4.4)
(15.7)
(17.2)(80)
(13.1)
(9)(73.4)
7.56
6
10
10
3.23
2---
6
2.13
20
1.9
1
1
8
0
(7.8)
(3.4)
(17.2)
(13.9)
(65)
(12.1)(146)
(52.0)
8.5
6
9
10
10
3.9
7
2
2--
6
2.54
20
3.7
5
210
0
(7.3)
(1.6)
(11.7)
(8.9)
(65)
(5.9)(56)
(65.0)
6.5
5
4
10
10
3.0
5
2
22.5
0
8
3.0
4
3
0
5.0
4
8
10
0
(8.4)
(5.4)
(15.0)
(10.6)
(50)
(6.4)
(1)(65.1)
138
www.fraserinstitute.org

EGYPT
Part 2: Recent Economic Indicators:Population 1994: 57.0
(in millions)
Annual Rate of Change (1980-94) 2.4%
Real Per Capita GDP :
(in 1985 U.S. dollars)
Avg. Growth Rate:
1994= $1,915
1980-90= 0.1%
1985-94= 2.4%
Economic Indicators:
Change in Real GDP: Aggregate
: Per Capita
Inflation Rate (CPI)
Change in Money Supply (Ml)
:(M2)
Investment/GDP Ratio
Central Government Budget
Deficit (-) or Surplus (+)
As a Percent of GDP
Unemployment Rate
1987
6.4
4.0
19.7
8.7
12.8
26.1
-5.1
1988
5.4
3.0
17.7
15.5
25.6
33.2
-7.7
1989
5.0
2.6
21.3
10.7
17.8
31.3
-5.4
6.9
1990
5.7
3.3
16.8
14.6
22.8
29.4
-5.7
8.6
1991
1.1
-1.3
19.7
12.9
28.0
24.0
-1.0
1992
4.4
2.0
13.6
6.3
15.2
19.8
-3.5
1993
3.0
0.8
12.1
9.4
15.9
16.2
1994
3.9
1.7
8.2
10.7
11.2
16.6
Source: United Nations, Statistical Yearbook, 1992 (New York 1994).
Only three countries (Uganda, Israel, and Portugal) had lower economic freedom ratingsthan Egypt in 1975. Between 1975 and 1990, Egypt's Isl. economic freedom rating rose slowlyfrom 2.4 to 4.2, prior to receding to 4.0 in our most recent rating year. Based on the average ofour three indexes, Egypt placed 69th in the mid-1990s. Its Isl summary rating places it 77th.Thus, Egypt ranks in the lower-middle group among our 103 countries.
What accounts for Egypt's low rating? Monetary instability, numerous governmententerprises, price controls, a 50% top marginal tax rate (this is down from 80% in 1980), a legalsystem that often fails to support private property rights, conscription, and capital market restrictionsall contributed to this country's low rating. The trade sector is a lone bright spot. The averagetariff rate was cut in half during the last decade. The black market foreign exchange premiumevaporated after soaring to near 150% in the mid-1980s. The size of the trade sector is significantlylarger than one would expect, given the country size and locational characteristics.
After struggling during the early 1980s, the economy grew at a 2.4% clip duringthe last decade. Egypt has a number of things going for it. A decisive move toward a freereconomy and sound policies in other areas would almost certainly put it on a strong growth path.
139
www.fraserinstitute.org

FINLAND
Part 1: The Economic Freedom Ratings for the Components and Various Area andSummary Indexes: 1975, 1980, 1985, 1990 and 1993-95.(The numbers in parentheses indicate the actual values for the components.)
1975
19801985
1990
1993-95
Summary RatingsIe
4.0
5.04.9
5.5
6.1
Isl3.9
4.64.4
4.8
5.6
Is24.0
5.25.1
6.3
6.9
Summary Rating Is1: 5 Year Periods
1975 1980 1985 1990 1993-95Year
Components of Economic Freedom 1975 1980 1985 1990 1993-95
T. Mnnry anil Inflation(a) Annual Money Growth (last 5 yrs.)
(b) Inflation Variablity (last 5 yrs.)
(c) Ownership of Foreign Currency
(d) Maint.of Bank Account Abroad
II. Government Operation(a) Govern. Consumption (% of GDP)
(b) Government Enterprises
(c) Price Controls
(d) Entry Into Business
(e) Legal System
(f) Avoidance of Neg. Interest Rates
III. Takings(a) Transfers and Subsidies (% of GDP)
(b) Marginal Tax Rates (Top Rate)(c) Conscription
IV. International Sector(a) Taxes on International Trade (Avg.)
(b) Black Market Exchange Rates (Prem.)
(c) Size of Trade Sector (% of GDP)(d) Capital Transactions with Foreigners
3.924
10
0
4.53
6--
--
2.13
20
5.88
8
4
2
(18.9)
(5.5)
(17.0)
(14.1)
(61-68)
(1.6)
(1)(54.0)
7.0
7
9
10
0
4.9
26--
-8
1.7
31
0
6.29
85
2
(5.5)
(1.9)
(18.0)
(14.3)
(65-71)
(0.8)
(1)(67.2)
6.149
10
0
4.9
16--
-10
1.3
21
0
6.69
104
2
(10.3)
(1.9)
(20.2)
(15.8)
(64-70)
(0.4)
(0)(58.1)
9.17
1010
10
5.2166-
-10
0.8
20
0
6.39
10
2
2
(6.8)
(0.9)
(21.1)
(16.0)
(63-69)
(0.6)
(0)(47.6)
7.019
10
10
6.7
16
87.510
10
1.3
1
20
7.99
10
28
(29.1)
(1.9)
(22.4)
(21.1)
(55-61)
(0.6)
(0). (52.5)
140
www.fraserinstitute.org

FINLAND
Part 2: Recent Economic Indicators:Population 1994: 5.1
(in millions)
Annual Rate of Change (1980-94): 0.5%
Real Per Capita GDP :
(in 1985 U.S. dollars)
Avg. Growth Rate: 1980-90
1985-94
1994= $12,000
2.7%
0.3%
Economic Indicators:Change in Real GDP: Aggregate
: Per Capita
Inflation Rate (CPI)
Change in Money Supply: (Ml)
: (M2)Investment/GDP RatioCentral Government Budget
Deficit (-) or Surplus (+)As a Percent of GDP
Unemployment Rate
19874.1
3.6
4.1
9.0
10.7
24.0
-1.75.0
1988
4.9
4.6
5.1
15.914.1
26.6
+0.44.5
19895.7
5.3
6.6
15.318.429.7
+ 1.83.4
19900.0
-0.4
6.1
14.88.5
28.1
+0.23.4
1991
-7.1
-7.9
4.1
173.9-4.9
20.5
-7.07.5
1992-3.8-3.9
2.6
3.3
1.6
16.7
-14.813.0
1993
-2.6-3.0
2.1
6.7
0.1
13.2
-12.417.7
1994
3.5
3.0
1.1
10.8
2.1
15.4
-12.818.6 a
a First 10 months of the year.
In 1993-1995, the average of our three indexes ranked the Finnish economy as the 26thmost free in the world. Its Isl summary rating placed it 44th. Other than modestimprovement in the monetary area and some relaxation of the restrictions on capital mobility,there is little evidence of movement toward a freer economy. (Note: most of the increase inthe government operations rating between 1990 and 1993-1995 reflects the inclusion of the"entry into business" and "legal system" variables into our index for the first time.)
This is a troubled economy. Like several other "big government" European nations,Finland is caught in the vicious cycle of large government expenditures, budget deficits (thegovernment deficit exceeded 10% of GDP during 1992-1994) that soon push up interest costs,and rising expenditures on interest that fuel still more government spending. Higher taxes willnot solve this problem. Finland's current top marginal tax rate of approximately 60% isalready one of the highest in the world. Weak private investment and high unemployment aretypically side effects of large government expenditures, rising interest costs, and high taxes.Changing trade patterns associated with the collapse of the former Soviet Union created anadditional transition problem that drove the Finnish unemployment rate to record levels (nearly20%) in 1994. The budgetary situation is going to force Finland to make some difficultdecisions in the near future. If it is going to prosper, its needs to reduce the size ofgovernment and allow markets to coordinate more of its economic activity.
141
www.fraserinstitute.org

FRANCE
Part 1: The Economic Freedom Ratings for the Components and Various Area andSummary Indexes: 1975, 1980, 1985, 1990 and 1993-95.(The numbers in parentheses indicate the actual values for the components.)
1975
19801985
1990
1993-95
Summary RatingsIe
4.4
4.6
3.9
6.2
6.6
Isl4.3
4.2
3.4
5.5
6.0
Is24.4
4.7
4.1
77.5
Summary Rating Is1: 5 Year Periods
8
1975 1990 1993-95
Components of Economic Freedom 1975 1980 1985 1990 1993-95
I. Money and Inflation(a) Annual Money Growth (last 5 yrs.)
(b) Inflation Variablity (last 5 yrs.)
(c) Ownership of Foreign Currency(d) Maint. of Bank Account Abroad
II. Government Operation(a) Govern. Consumption (% of GDP)
(b) Government Enterprises(c) Price Controls(d) Entry Into Business
(e) Legal System(f) Avoidance of Negative Interest Rates
III. Takings(a) Transfers and Subsidies (% of GDP)
(b) Marginal Tax Rates (Top Rate)(c) Conscription
IV. International Sector(a) Taxes on International Trade (Avg.)(b) Black Market Exchange Rates (Prem.)
(c) Size of Trade Sector (% of GDP)
(d) Capital Transactions with Foreigners
3.9
5
7
0
0
4.5
3
4
-
-
-
8
2.30
5
0
6.9
10
10
4
2
(8.4)
(2.6)
(16.6)
(24.0)
(48)
(0.1)
(0)(54.0)
4.6
4
10
0
0
4.1
24
-
-
-
8
1.40
3
0
6.0
10
6
5
2
(10.2)(0.8)
(18.1)
(26.1)(60)
(0.1)
(3)
(67.2)
4.5
6
8
0
0
3.7
1
4
-
-
-
8
0.50
1
0
6.1
10
6
6
2
(8.1)
(2.3)
(19.4)
(26.8)(65)
(0.0)(4)
(47.1)
9.7
9
10
10
10
5.226
6
-
-
8
1.40
3
0
7.910
10
5
5
(3.0)
(0.9)
(17.9)
(25.2)(53)
(0.0)
(0)(46.1)
10.010
10
10
10
6.0
1
6
7
7.5
7.5
8
1.40
3
0
8.7
10
10
5
8
(-1.2)(0.5)
(19.8)
(26.9)(57)
(0.0)
(0)(45.0)
142
www.fraserinstitute.org

FRANCE
Part 2: Recent Economic Indicators:Population 1994:
(in millions)
Annual Rate of Change (1980-84):
58.0
0.7%
Real Per Capita GDP :(in 1985 U.S. dollars)
Avg. Growth Rate:
1994=
1980-90=1985-94=
$13,910
1.9%1.6%
Economic Indicators:Change in Real GDP: Aggregate
: Per Capita
Inflation Rate (CPI)Change in Money Supply: (Ml)
: (M2)
Investment/GDP RatioCentral Government Budget
Deficit (-) or Surplus (+)
As a Percent of GDPUnemployment Rate
19872.3
1.6
3.3
4.6
6.6
20.2
-1.210.5
19884.5
3.8
2.7
1.9
5.6
21.4
-2.310.0
19894.3
3.6
3.5
5.4
2.5
22.3
-1.99.4
1990
2.5
1.8
3.4
3.9
3.4
22.5
-2.18.9
19910.8
0.2
3.2
-4.7
0.6
21.4
-2.29.4
1992
1.2
0.6
2.4
0.0
0.5
19.7
-3.910.4
1993-0.9
-1.4
2.1
1.4
1.6
17.5
-5.811.6
19941.8
1.3
1.7
1.6
4.1
18.7
-5.9
12.1
Based on the average of our three indexes, the French economy tied with South Korea for20th place on the most free list. Its Isl summary rating places it 32nd.
France's economic freedom rating improved during the last decade mostly as the resultof a reduction in monetary growth, greater price stability, and legalization of foreign currencybank accounts. Like most of the European welfare state economies, France achieved high ratingsin the monetary and international sectors, but low ratings for government operations and takings,particularly the latter. The ratings for all three of the components in the takings areas wereexceedingly low. Transfers and subsidies have consistently taken more than one-quarter of GDPfrom the person who earned it and transferred it to another. The 57% top marginal tax bracketis one of the highest in the world. Combine these two factors with conscription, and you havea very low rating in the takings area.
A large transfer sector generally leads to two unpleasant side effects—large budget deficitsand high unemployment rates. The French economy is plagued with both. The budget deficitsof the 1990s have averaged approximately 4% of GDP, a level that is unsustainable for a countrywith a real growth rate of less than two percent. The deficit along with the double digitunemployment rates, will almost certainly lead to pressure for change in the years immediatelyahead.
143
www.fraserinstitute.org

GERMANY
Part 1: The Economic Freedom Ratings for the Components and Various Area andSummary Indexes: 1975, 1980, 1985, 1990 and 1993-95.(The numbers in parentheses indicate the actual values for the components.)
19751980
19851990
1993-95
Summary RatingsIe
6.4
6.6
6.9
7.0
7.1
Isl5.9
6.0
6.0
6.3
6.4
Is27.3
7.6
8.0
7.8
7.8
Summary Rating Is1: 5 Year Periods
10
TO•43
COOHtn
5.9 6.0 6.0 6.3 6.4
HUM1975 1980 1985 1990 1993-95Year
Components of Economic Freedom 1975 1980 1985 1990 1993-95
I. Money and Inflation(a) Annual Money Growth (last 5 yrs.)(b) Inflation Variability (last 5 yrs.)
(c) Ownership of Foreign Currency
(d) Maint. of Bank Account Abroad
H. Government Operation(a) Govern. Consumption (% of GDP)(b) Government Enterprises
(c) Price Controls(d) Entry Into Business
(e) Legal System(f) Avoidance of Neg. Interest Rates
III. Takings(a) Transfers and Subsidies (% of GDP)
(b) Marginal Tax Rates (Top Rate)
(c) Conscription
IV. International Sector(a) Taxes on International Trade (Avg.)
(b) Black Market Exchange Rates (Prem.)
(c) Size of Trade Sector (% of GDP)(d) Capital Transactions with Foreigners
8.8
6
10
10
10
4.5
1
6
-
-
-
8
2.724
0
8.8
10
10
6
8
(7.5)(0.9)
(20.5)
(17.4)
(56)
(0.0)
(0)(46.5)
9.4
8
10
10
10
4.9
1
6
-
-
-
10
2.223
0
8.8
10
10
6
8
(4.5)(0.5)
(20.3)
(17.6)
(56)
(0.0)
(0)(53.3)
9.7
9
10
10
10
4.9
1
6
-
-
-
10
1.3
1
20
9.810
10
9
10
(3.1)
(1.0)
(20.1)
(19.0)
(56)
(0.0)
(0)(61.5)
8.5
5
10
10
10
6.4
26
9
-
-
10
2.223
0
9.710
10
8
10
(9.6)
(0.7)
(18.3)
(17.9)
(56)
(0.0)
(0)(58.0)
8.5
5
10
10
10
7.0
3
6
9
7.5
7.5
10
1.9
0
4
0
9.710
10
8
10
(8.7)(0.6)
(17.5)
(22.4)
(53)
(0.0)
(0)(59.9)
144
www.fraserinstitute.org

GERMANY
Part 2: Recent Economic Indicators:Population 1994: 80.9
(in millions)
Annual Rate of Change (1980-94): 0.2%
Real Per Capita GDP :(in 1985 U.S. dollars)
Avg. Growth Rate:
1994=
1980-90=1985-94=
$15,005
2.1%2.1%
Economic Indicators:
Change in Real GDP: Aggregate: Per Capita
Inflation Rate (CPI)Change in Money Supply: (Ml)
:(M2)Investment/GDP RatioCentral Government Budget
Deficit (-) or Surplus (+)
As a Percent of GDP
Unemployment Rate
1987
2.3
2.13.34.67.0
20.2
-1.26.3
19884.54.3
2.7
1.95.8
21.4
-2.3
6.3
1989
4.34.13.55.44.5
22.3
-1.9
5.7
19902.52.3
3.45.7
12.9
22.5
-2.15.0
19910.80.6
3.2-1.110.4
21.4
-1.3
4.2
1992
1.21.02.4
-0.98.6
19.7
-3.8
4.6
1993-0.9
-1.1
2.1-
8.5
17.5
-2.6
5.8
19943.33.1
2.33.7
1.4
24.5
6.5
a Data are for West Germany.
Based on the average of our three indexes, the German economy was the 12th freest (tiedwith Belgium and Malaysia) in the world in the mid-1990s. Both the summary rating andranking of this country have been steady throughout the last two decades. No doubt, thisrelatively high economic freedom rating over a lengthy time period has contributed to the highincome level of this country. Its $15,005 GDP per capita in 1994 was the 8th highest in theworld.
Monetary and price stability (note the 10 ratings throughout for this component), freedomto maintain bank accounts in other currencies, a stable and competitive credit market, and arelatively free trade sector constitute the strengths of this economy. There are three majorweaknesses—a high level of government consumption, a large transfer sector, and high tax rates.Throughout most of the last two decades, government consumption has taken approximately 20%of the GDP. Another 20% is taxed away from its earner and transferred to someone else. Thus,approximately 40% of the German GDP is channelled through the government; earners get to keepless than 60% of what they earn. The top marginal personal income tax rate is currently 53%,down only modestly from 56% in 1990. Since several other high-income industrial countries havereduced their top rates substantially during the last decade, the German rate is now one of thehighest in the world.
Given its price stability, strong and competitive trade sector, and high investment rate, thiseconomy will probably continue to perform reasonably well in the future. However, othereconomies that have adopted more liberal policies will almost surely achieve higher growth rates.Therefore, if Germany continues on its present course, its income relative to other countries islikely to decline in the future.
145
www.fraserinstitute.org

GHANA
Part 1: The Economic Freedom Ratings for the Components and Various Area andSummary Indexes: 1975, 1980, 1985, 1990 and 1993-95.(The numbers in parentheses indicate the actual values for the components.)
1975
19801985
19901993-95
Summary RatingsIe
2.1
1.8
2.13.3
4.5
Isl2.5
2.3
2.8
3.6
4.8
Is21.3
1.0
1.0
2.63.9
Summary Rating Is l :5 Year Periods I
8
1975 198 0 198 5 199 0 1993-9 5Year
Components of Economic Freedom 1975 1980 1985 1990 1993-95
I. Money and Inflation(a) Annual Money Growth (last 5 yrs.)
(b) Inflation Variablity (last 5 yrs.)
(c) Ownership of Foreign Currency
(d) Maint. of Bank Account Abroad
II. Government Operation(a) Govern. Consumption (% of GDP)(b) Government Enterprises
(c) Price Controls(d) Entry Into Business
(e) Legal System
(f) Avoidance of Neg. Interest Rates
III. Takings(a) Transfers and Subsidies (% of GDP)(b) Marginal Tax Rates (Top Rate)(c) Conscription
IV. International Sector(a) Taxes on International Trade (Avg.)
(b) Black Market Exchange Rates (Prem.)(c) Size of Trade Sector (% of GDP)
(d) Capital Transactions with Foreigners
1.0
1
20
0
3.4
7
0
-
-
-
-
4.5
8
0
10
0.4
0
1
1
0
(25.6)(8.7)
(13.0)
(3.1)(70)
(20.6)
(67)
(37.8)
0.6
1
1
0
0
2.77
0---
0
5.0
8
1
10
0.0
0
0
0
0
(42.8)
(16.9)
(11.2)
(2.4)
(60)
(17.3)
(304)
(17.6)
0.3
1
0
0
0
3.5
9
0
-
-
-
0
5.8
10
1
10
0.3
0
1
0
0
(43.9)
(38.2)
(9.4)
(1.3)
(60)
(21.7)
(142)
(21.2)
3.9
1
5
10
0
3.0
8
20
-
-
2
5.58
210
1.8
1
5
1
0
(37.9)
(4.8)
(10.9)
(2.6)
(55)
(11.6)
(?)(39.4)
2.9
1
210
0
5.07
26
5
2.5
8
7.4
7
7
10
2.92
7
20
(25.0)
(8.6)
(11.7)
(3.3)
(35)
(8.6)
(2)(42.8)
146
www.fraserinstitute.org

GHANA
Part 2: Recent Economic Indicators:Population 1994: 16.8
(in millions)Annual Rate of Change (1980-94): 3.2%
Real Per Capita GDP :(in 1985 U.S. dollars)
Avg. Growth Rate:
1993=
1980-90 =
1985-93 =
$975
-1.1%
1.4%
Economic Indicators:Change in Real GDP: Aggregate
: Per CapitaInflation Rate (CPI)
Change in Money Supply (Ml)
: (M2)Investment/GDP Ratio
Central Government Budget
Deficit (-) or Surplus (+)
As a Percent of GDPUnemployment Rate
1987
4.8
1.639.852.6
56.910.4
+0.5
1988
5.6
2.431.444.0
44.210.9
+0.4
19895.1
2.7
25.250.8
57.213.5
+0.7
19903.30.1
37.329.7
27.512.3
+0.2
19915.3
2.118.04.3
12.112.7
+ 1.5
19923.9
0.710.122.8
34.8
12.9
-4.8
19935.0
1.825.048.0
39.9
14.8
-2.5
1994
24.9
36.633.7
In 1990-95 the average of our three indexes placed Ghana 62nd (tied with Bulgaria andIndia) among the 103 countries in our study. Despite its low rating, Ghana's economy is one ofthe freest in Africa. Only Mauritius and Botswana are rated significantly higher. During the1975-1985 period, this economy was beset with monetary instability, negative interest rates, highmarginal tax rates, rigid exchange rate controls (the 1985 black market premium was 142%, downfrom 304% in 1980), and restrictive trade practices. Thus, its ratings during this period wereamong the lowest in the world.
During the last decade, there has been observable improvement, most notably somerelaxation of both interest rate and exchange rate controls and a sharp reduction in the topmarginal tax rate from 60% to 35%. Much more needs to be done. During the last five years,monetary expansion has averaged 25% annually. The predictable side effect—a high and variablerate of the inflation—continues to undermine the confidence and planning of decision-makers.Trade restrictions continue to retard international exchange and the mobility of capital. Foreigninvestors must obtain approval from the Ghana Investment Center prior to undertaking a projectotherwise they will not be permitted to remit returns from their investment. Policies of this typemust be scrapped if this poor country is going to develop in the future.
147
www.fraserinstitute.org

GREECE
Part 1: The Economic Freedom Ratings for the Components and Various Area andSummary Indexes: 1975, 1980, 1985, 1990 and 1993-95.(The numbers in parentheses indicate the actual values for the components.)
19751980
1985
19901993-95
Summary RatingsIe
3.7
3.8
3.5
3.5
4.9
Isl3.9
3.8
3.2
3.4
4.9
Is2
3.2
3.5
3.4
3.5
5.0
Summary Ratin g Is1 : 5 Year Period s
8 r
1975 1980 1985 1990 1993-95Year
Components of Economic Freedom 1975 1980 1985 1990 1993-95I. Money and Inflation(a) Annual Money Growth (last 5 yrs.)
(b) Inflation Variability (last 5 yrs.)
(c) Ownership of Foreign Currency
(d) Maint. of Bank Account Abroad
3.83 (12.9)
3 (7.3)
10
0
5.22 (14.1)8 (2.4)
100
5.22 (16.5)8 (2.3)
100
4.92 (18.6)7 (2.9)
100
4.52 (16.5)
6 (3.4)
10
0
H. Government Operation(a) Govern. Consumption (% of GDP)(b) Government Enterprises
(c) Price Controls
(d) Entry Into Business
(e) Legal System(f) Avoidance of Neg. Interest Rates
III. Takings(a) Transfers and Subsidies (% of GDP)
(b) Marginal Tax Rates (Top Rate)(c) Conscription
IV. International Sector(a) Taxes on International Trade (Avg.)
(b) Black Market Exchange Rates (Prem.)(c) Size of Trade Sector (% of GDP)(d) Capital Transactions with Foreigners
3.6
5
2-
-
-4
3.54
4
0
4.67
6
22
(15.2)
(8.5)
(52)
(3.5)
(3)(43.7)
3.6
4
2-
-
-6
2.63
3
0
4.37
5
2
2
(16.4)
(12.5)
(60)
(3.2)
(7)(47.1)
2.5
1
2-
-
-6
1.3
21
0
4.79
3
4
2
(20.4)
(18.0)
(63)
(0.3)(25)
(53.9)
2.0
1
20
-
-
8
1.9
0
4
0
5.610
6
3
2
(21.1)
(27.1)
(50)
(0.1)
(3)(54.2)
4.7
1
26
7.5
5
8
3.1
25
0
7.510
10
3
5
(19.7)
(15.6)(40)
(0.1)
(0)(56.1)
148
www.fraserinstitute.org

GREECE
Part 2: Recent Economic Indicators:Population 1994: 10.5
(in millions)Annual Rate of Change (1980-94): 0.5%
Real Per Capita GDP :(in 1985 U.S. dollars)
Avg. Growth Rate:
1994=
1980-90=1985-94=
$6,783
0.9%0.9%
Economic Indicators:Change in Real GDP: Aggregate
: Per Capita
Inflation Rate (CPI)Change in Money Supply: (Ml)
: (M2)Investment/GDP RatioCentral Government Budget
Deficit (-) or Surplus (+)
As a Percent of GDPUnemployment Rate
1987-0.5-0.7
16.418.7
21.5
17.6
-13.76.4
19884.5
4.2
13.514.523.6
19.3
-15.26.0
19893.5
3.2
13.721.5
22.120.9
-26.4
6.5
1990-1.1
-1.620.423.3
18.5
19.9
-28.96.4
19913.3
2.1
19.515.6
7.4
20.4
-18.9
7.3
19920.9
-0.115.915.5
12.4
19.8
-12.08.7
1993-0.5-1.0
14.4
13.14.1
19.3
-15.7
9.8
19941.1
0.6
10.928.1
24.8
19.5
10.1
Greece may well be the cradle of democracy, but it still has a long way to go in the areaof economic freedom. Throughout 1975-1990, Greece's summary ratings were just slightly betterthan those of the Bottom Ten. (See Exhibit 2-2 for evidence on this point.) Its rating jumpedsubstantially in the 1990s. Based on the average of our three indexes, the Greek economy nowranks 54th (tied with Cyprus and South Africa) among the 103 countries of our study.
The major factors underlying this recent improvement were:
• elimination of price controls in several areas;• reduction of the top marginal tax rate to 40%, down from 63% in 1985 and 50% in 1990;• movement to a fully convertible currency in the foreign exchange market; and• relaxation of various restrictions limiting the mobility of capital.
Much more needs to be done. Monetary policy continues to be far too expansionary.(Note that the monetary aggregates have continued to grow at approximately 20% annually inrecent years.) Huge budget deficits (these deficits have averaged 20% of GDP during the fiveyears) fuel the pressure for monetary expansion, drain funds from the capital market, andundermine confidence in the governmental authorities. Greece needs to follow the path ofPortugal, another relatively poor member of the European Union. During the last two decades,Portugal has taken a number of steps toward economic freedom and it has paid off with ahandsome rate of economic growth. It is time for Greece to travel this same road.
149
www.fraserinstitute.org

GUATEMALA
Part 1: The Economic Freedom Ratings for the Components and Various Area andSummary Indexes: 1975, 1980, 1985, 1990 and 1993-95.(The numbers in parentheses indicate the actual values for the components.)
1975
19801985
1990
1993-95
Summary RatingsIe
5.9
6.4
5.6
6.3
6.2
I s l
6.5
6.8
5.7
6.6
6.5
Is25.3
6.0
5.1
6.0
5.8
Summary Rating Isl: 5 Year Periods
Components of Economic Freedom 1975 1980 1985 1990 1993-95
I. Money and Inflation(a) Annual Money Growth (last 5 yrs.)(b) Inflation Variability (last 5 yrs.)
(c) Ownership of Foreign Currency
(d) Maint. of Bank Account Abroad
II. Government Operation(a) Govern. Consumption (% of GDP)(b) Government Enterprises
(c) Price Controls(d) Entry Into Business
(e) Legal System
(f) Avoidance of Neg. Interest Rates
III. Takings(a) Transfers and Subsidies (% of GDP)(b) Marginal Tax Rates (Top Rate)(c) Conscription
IV. International Sector(a) Taxes on International Trade (Avg.)(b) Black Market Exchange Rates (Prem.)
(c) Size of Trade Sector (% of GDP)
(d) Capital Transactions with Foreigners
4.25
3
0
10
9.0
10
8
-
-
-
-
8.210
9
0
4.56
4
25
(9.7)
(7.8)
(6.9)
(0.8)
(34)
(5.6)
(10)
(45.3)
6.94
6
10
10
8.4
9
8
-
-
-
8
7.710
8
0
4.46
4
1
5
(10.7)
(3.6)
(8.0)
(1.2)
(40)
(4.8)
(10)
(47.1)
6.2
4
4
10
10
8.8
10
8
-
-
-
8
6.3
10
5
0
2.53
1
0
5
(10.1)
(5.3)
(7.1)
(1.3)
(48)
(7.5)
(89)
(25.0)
4.6
2
1
10
10
7.9
10
8
6
-
-
8
6.9
9
7
0
6.3
7
10
1
5
(18.3)
(15.2)
(6.8)
(1.8)
(34)
(3.6)
(0)(43.4)
4.61
210
10
6.8
10
8
6
7.5
0
8
7.89
9
0
6.0
7
6
1
8
(21.1)
(13.2)
(6.4)
(1.9)
(25)
(3.6)
(4)(45.0)
150
www.fraserinstitute.org

GUATEMALA
Part 2: Recent Economic Indicators:Population 1994: 10.2
(in millions)Annual Rate of Change (1980-94): 2.9
Real Per Capita GDP :
(in 1985 U.S. dollars)Avg. Growth Rate:
1994= $2,300
1980-90= -2.0%
1985-93= 0.6%
Economic Indicators:Change in Real GDP: Aggregate
: Per Capita
Inflation Rate (CPI)Change in Money Supply (Ml)
:(M2)Investment/GDP Ratio
Central Government BudgetDeficit (-)or Surplus (+)As a Percent of GDP
Unemployment Rate
19873.5
0.6
12.313.7
14.013.9
-1.3
19883.9
1.0
10.8
10.2
15.613.7
-1.7
19893.9
1.0
11.414.4
15.913.5
-2.9
19903.1
0.2
41.232.7
21.313.6
-2.1
19913.6
0.7
33.219.1
35.114.3
0.0
19924.8
1.9
10.016.6
47.4
18.2
0.0
19934.0
1.1
11.8
18.1
12.118.7
-1.7
19944.0
1.0
10.5
34.1
10.616.4
-1.4
Based on the average for our three indexes, Guatemala ranks 26th (tied with several othercountries) among the countries in our study. Except for a decline during the mid-1980s that wasprimarily the result of higher trade taxes, more restrictive exchange rate controls, and a declinein the size of the trade sector, Guatemala's summary rating has been steady throughout the lasttwo decades.
The major weaknesses of this economy are monetary instability, insecure property rights,and an absence of the rule of law. During the last decade, budget deficits financed with thecreation of money have become a habit. The money supply has been increasing at an annual rateof approximately 20 percent. Predictably this policy leads to a high and variable rate of inflationwhich undermines investment and other exchanges involving a time dimension. (Note: Effectivein 1995, a new constitutional provision prohibits the central bank from extending credit to thegovernment. This is a positive step toward more stable monetary arrangements.) The legalsystem often grants political officials discretionary authority. This undermines the rule of law andinevitably leads to political corruption and loss of confidence in the system.
Some modest steps toward economic freedom have been taken. Between 1985 and 1994,the top marginal tax rate was reduced from 48% to 25%. Unfortunately the rate was increasedto 30% in 1995. Taxes on international trade have declined slightly during the last decade.However, without monetary stability and a more even-handed legal system, it will be difficult forthis poor country to find the path to consistent economic growth.
151
www.fraserinstitute.org

HONDURAS
Part 1: The Economic Freedom Ratings for the Components and Various Area andSummary Indexes: 1975, 1980, 1985, 1990 and 1993-95.(The numbers in parentheses indicate the actual values for the components.)
1975
1980
1985
19901993-95
Summary RatingsIe
7.16.1
6.25.95.5
Isl7.4
6.1
6.0
6.05.5
Is26.86.1
6.05.7
5.4
Summary Rating Is1:
ings
CO
a:V)
An3 00
CO
4
2
n
. 7.4
VIII
5 Year
6.0
| |II
Periods |
6.0!•II5.5•1
1975 1980 1985Year
1990 1993-95
Components of Economic Freedom 1975 1980 1985 1990 1993-95
I. Money and Inflation(a) Annual Money Growth (last 5 yrs.)(b) Inflation Variablity (last 5 yrs.)
(c) Ownership of Foreign Currency
(d) Maint. of Bank Account Abroad
II. Government Operation(a) Govern. Consumption (% of GDP)
(b) Government Enterprises(c) Price Controls
(d) Entry Into Business(e) Legal System(f) Avoidance of Neg. Interest Rates
III. Takings(a) Transfers and Subsidies (% of GDP)
(b) Marginal Tax Rates (Top Rate)(c) Conscription
IV. International Sector(a) Taxes on International Trade (Avg.)
(b) Black Market Exchange Rates (Prem.)(c) Size of Trade Sector (% of GDP)(d) Capital Transactions with Foreigners
7.17
410
10
7.5
7
8
--
--
9.5
10
9-
5.46
10
5
0
(6.4)
(5.4)
(12.4)
(0.5)
(27)
(5.3)
(0)(70.4)
6.937
10
10
7.5
7
8
-
-
-
-
8.4
-
8
10
3.1
4
4
5
0
(12.9)
(3.0)
(12.7)
(40)
(6.7)
(20)
(80.3)
9.79
10
10
10
7.7
6
8
-
-
-
10
5.99
5
0
0.9
-1
20
(2.6)
(1.3)
(13.1)
(2.3)
(46)
(65)
(54.1)
5.223
10
10
7.6
7
8
-
-
-
8
5.9
9
5
0
5.1
-
10
5
0
(15.7)
(6.7)
(12.9)
(2.2)
(46)
(0)(75.2)
5.223
10
10
6.1
8
8
4
7.52.5
6
5.17
5
0
4.9
-63
5
(17.8)
(6.7)
(10.6)
(4.0)
(46)
(3)(65.3)
152
www.fraserinstitute.org

HONDURAS
Part 2: Recent Economic Indicators:Population 1994: 5.7 Real Per Capita GD :
(in millions) (in 1985 U.S. dollars)Annual Rate of Change (1980-94): 3.1% Avg. Growth Rate:
1994= $1,335
1980-90= -0.9%1985-94= -0.1%
Economic Indicators:
Change in Real GDP: Aggregate
: Per Capita
Inflation Rate (CPI)
Change in Money Supply: (Ml)
:(M2)Investment/GDP RatioCentral Government Budget
Deficit (-) or Surplus (+)As a Percent of GDP
Unemployment Rate
1987
6.0
2.9
2.5
14.415.9
17.4
19884.6
1.5
4.5
13.4
20.021.0
-3.0
19894.3
1.2
9.9
14.4
11.919.1
-3.3
1990
0.1
-3.023.3
28.3
19.823.0
-3.4
1991
3.3
0.2
34.0
20.221.724.7
+0.7
19925.6
2.5
8.8
11.9
18.426.0
+0.9
19933.7
0.6
10.7
19.218.926.7
-0.2
1994-1.3
-4.521.736.6
28.625.9
-0.1
In 1975, Honduras was one of the most economically free countries in the world.Our Isl summary index ranked it 2nd—behind only Hong Kong—in 1975. In our other twosummary indexes, its ranking was lower, but nonetheless impressive. Since that time, therating of Honduras has slid downward. In the mid-1990s, our indexes place it 47th amongthe 103 nations in our study.
What accounts for the decline? An increase in monetary instability was clearly acontributing factor. In the five years prior to 1975, the Ml money supply increased at amodest annual rate of 6.4%; during the most recent period, the annual rate of increase was17.8%. Not surprisingly, the more rapid monetary growth led to increased variability inthe rate of inflation. Honduran authorities also increased the top marginal tax rates from27% in 1975 to 46% in the 1980s. The higher rate remains in effect. Thus, the amountof marginal earnings that the most productive citizens are allowed to keep for themselvesis now substantially less than was the case in 1975. Conscription was instituted beginningin the 1980s. Exchange rate controls were imposed off and on throughout the last 15 years.In the mid-1980s the controls were so rigid that the black market premium rose to 65%.All of these factors contributed to the decline in economic freedom.
As economic freedom dropped, so too, did the performance of the economy. Percapita GDP fell by almost 10% during the 1980s and there is little sign of a rebound.Unless this country begins moving in the opposite direction, its economic future is bleak.
153
www.fraserinstitute.org

HONG KONG
Part 1: The Economic Freedom Ratings for the Components and Various Area andSummary Indexes: 1975, 1980, 1985, 1990 and 1993-95.(The numbers in parentheses indicate the actual values for the components.)
1975
1980
1985
1990
1993-95
Summary RatingsIe
9.0
-9.3.
* '? 9pJ ' 9.2
9.0
Is l
9.2
9.4
9.5
9.3
9.1
Is2
9.0
9.2
9.5
9.2
9.0
Summary Ratin g
Is1 R
atin
g
n
9
7
5
3
1
9!2
- ^̂ H
LJH_1975
Is1:5
9.4
I•1980
Year Period s
9.5
1 • • 11•LJHJ1985Year
|
9.3• i1••1990
9.1
• • i1•JBL
1993-95
Components of Economic Freedom 1975 1980 1985 1990 1993-95
I. Money and Inflation(a) Annual Money Growth (last 5 yrs.)
(b) Inflation Variability (last 5 yrs.)
(c) Ownership of Foreign Currency
(d) Maint. of Bank Account Abroad
II. Government Operation
(a) Govern. Consumption (% of GDP)
(b) Government Enterprises
(c) Price Controls
(d) Entry Into Business
(e) Legal System
(f) Avoidance of Neg. Interest Rates
III. Takings(a) Transfers and Subsidies (% of GDP)
(b) Marginal Tax Rates (Top Rate)
(c) Conscription
IV. International Sector
(a) Taxes on International Trade (Avg.)
(b) Black Market Exchange Rates (Prem.)
(c) Size of Trade Sector (% of GDP)
(d) Capital Transactions with Foreigners
6.8
5
5
10
10
10.0
10
10
-
-
-
-
10.0
10
10
10
9.5
9
10
9
10
(9.3)
(3.9)
(7.5)
(1.1)
(15)
(0.7)
(0)(162.5)
7.79
4
10
10
10.0
10
10
-
-
-
-
10.0
10
10
10
9.5
9
10
9
10
(2.9)
(5.2)
(6.5)
(0.6)
(15)
(0.5)
(0)(180.7)
8.79
7
10
10
10.0
10
10
-
-
-
-
9.5
10
9
10
9.7
9
10
10
10
(2.9)
(2.5)
(7.6)
(0.9)
(25)
(0.6)
(0)(209.5)
7.24
7
10
10
10.010
10
10
-
-
-
9.5
10
9
10
9.7
9
10
10
10
(10.3)
(2.9)
(6.2)
(0.9)
(25)
(0.4)
(0)(262.9)
6.85
5
10
10
9.4
10
10
9
10
7.5
-
9.5
10
9
10
9.7
9
10
10
10
(9.9)
(4.5)
(6.9)
(1.2)
(25)
(0.3)
(0)(285.8)
154
www.fraserinstitute.org

HONG KONG
Part 2: Recent Economic Indicators:Population 1994: 6.0 Real Per Capita GDP :
(in millions) (in 1985 U.S. dollars)Annual Rate of Change (1980-94): 1.2% Avg. Growth Rate:
1994= $17,832
1980-90:
1985-94:
5.4%
5.7%
Economic Indicators:Change in Real GDP:Aggregate
: Per CapitaInflation Rate (CPI)Change in Money Supply: (Ml)
:(M2)Investment/GDP RatioCentral Government Budget
Deficit (-) or Surplus (+)As a Percent of GDP
Unemployment Rate
198714.5
13.35.3
46.0
30.7
26.4
+3.3
1.7
19888.3
7.1
7.4
8.5
14.228.6
+4.21.4
19892.8
1.6
9.7
6.8
19.926.7
+2.11.1
19903.0
1.8
9.7
13.3
22.3
27.4
+0.7
1.3
19913.9
2.7
11.019.5
13.3
27.2
+3.4
1.8
19925.4
4.2
9.6
21.110.828.5
+2.8
2.0
19935.4
4.2
8.7
20.6
16.0
27.7
+2.12.0
19945.1
3.9
8.6
6.1
12.8
31.8
+0.8
1.9
Hong Kong is the freest nation in the world and this has been the case for the last severaldecades. It provides a vivid reminder of what an economically free people can accomplish in arelatively short period of time. In 1960, Hong Kong's per capita GDP was $2,247, less than thecomparable figures for Israel, Mexico, and Argentina, for example. Its 1960 income figure wasapproximately one-third that of Venezuela, Sweden, and Canada; and one-fourth that ofSwitzerland and United States. Three decades of sustained growth have changed all of this. In1994, Hong Kong's per capita GDP ($17,832) was the second highest in the world, following onlythe United States. (Note: the per capita GDP figures are all in constant purchasing power 1985U.S. dollars, see Summers and Heston.)
In contrast with most other high-income nations, government consumption in Hong Kongremains small (6.9% of GDP during the most recent year), transfers and subsidies are low(approximately 1% of GDP), and the top marginal tax rate is 25% with a ceiling on the averagetax rate set at 15% of gross income. Clearly, the citizens of Hong Kong are permitted to keepmost of what they earn. Hong Kong's economic freedom ratings is exceedingly high in everyarea except monetary and price stability, and even its middle rating in this area may be misleadingbecause Hong Kong's recent inflation is the result of a structural transformation that has pushedup the prices of goods that are not traded internationally. In addition, residents are free tomaintain bank accounts and use currencies other than the Hong Kong dollar if they wish to doso. What does the future hold? In 1997, the political control over Hong Kong will revert toChina, a country not known for its economic freedom. Hopefully, the Chinese will look closelyat Hong Kong's enviable economic record before they decide to transform the world freesteconomy.
155
www.fraserinstitute.org

INDIA
Part 1: The Economic Freedom Ratings for the Components and Various Area andSummary Indexes: 1975, 1980, 1985, 1990 and 1993-95.(The numbers in parentheses indicate the actual values for the components.)
19751980
198519901993-95
Ie
3.0
3.8
3.5
3.7
4.5
Summary RatingsI s l
3.3
3.8
3.4
3.7
4.5
Is2
2.3
3.2
3.1
3.3
4.1
Summary Rating Is1:5 Year Periods I
8
1975 1980 1985 1990 1993-95Year
Components of Economic Freedom 1975 1980 1985 1990 1993-95
I. Money and Inflation(a) Annual Money Growth (last 5 yrs.)(b) Inflation Variablity (last 5 yrs.)
(c) Ownership of Foreign Currency(d) Maint. of Bank Account Abroad
II. Government Operation(a) Govern. Consumption (% of GDP)
(b) Government Enterprises
(c) Price Controls(d) Entry Into Business
(e) Legal System
(f) Avoidance of Neg. Interest Rates
III. Takings(a) Transfers and Subsidies (% of GDP)(b) Marginal Tax Rates (Top Rate)
(c) Conscription
IV. International Sector(a) Taxes on International Trade (Avg.)
(b) Black Market Exchange Rates (Prem.)(c) Size of Trade Sector (% of GDP)(d) Capital Transactions with Foreigners
2.55
3
0
0
4.49
0
-
-
-
-
4.1
7
0
10
2.10
5
1
2
(8.7)(7.2)
(9.4)
(3.8)(77)
(14.8)
(9)(12.8)
3.56
5
0
0
5.1
9
0
-
-
-
8
4.26
1
10
2.5
0
6
2
2
(7.8)(4.8)
(9.6)
(5.4)(60)
(15.5)
(5)(16.6)
4.6
4
10
0
0
4.3
7
0
-
-
-
8
3.3
5
0
10
2.0
0
4
2
2
(10.8)
(1 .1)
(11.1)
(6.5)(62)
(24.2)(14)
(15.0)
4.55
9
0
0
3.9
7
0
3
-
-
8
4.3
5
210
2.10
4
3
2
(9.4)(1.4)
(11.6)
(6.5)(53)
(20.7)(10)
(18.7)
3.9
3
9
0
0
4.5
7
23
5
2.5
10
5.25
4
10
3.9
0
10
4
2
(12.7)
(2.1)
(11.8)
(6.7)
(45)
(17.0)
(0)(21.2)
156
www.fraserinstitute.org

INDIA
Part 2: Recent Economic Indicators:Population 1994: 918
(in millions)
Annual Rate of Change (1980-94): 2.1%
Real Per Capita GDP
(in 1985 U.S. dollars)
Avg. Growth Rate:
1994 =
1980-90 =
1985-94 =
$1,
3
2
335
. 5 %
.9%
Economic Indicators:
Change in Real GDP:Aggregate
: Per Capita
Inflation Rate (CPI)
Change in Money Supply: (Ml)
:(M2)Investment/GDP Ratio
Central Government Budget
Deficit (-) or Surplus (+)
As a Percent of GDP
Unemployment Rate
1987
4.8
2.7
8.8
14.7
17.4
23.7
-8.4
1988
9.9
7.8
9.4
15.1
17.0
25.6
-8.1
1989
6.6
4.5
6.2
18.1
17.8
25.6
-7.9
1990
4.9
2.8
9.0
18.9
17.9
26.7
-8.2
1991
1.0
-1.1
13.9
17.5
16.2
24.0
-5.8
1992
4.6
2.5
11.8
20.2
19.8
25.0
-5.2
1993
3.5
1.4
6.4
9.0
13.1
21.3
-7.4
1994
5.3
3.3
9.9
26.1
16.5
-
-6.7
In the mid-1990s the average of our three indexes places India in a tie (with Bulgaria andGhana) for 62nd place. This ranking is an improvement over prior years. Throughout the 1975-1990 period, India generally ranked just above the ten least free countries in our study (seeExhibit 2-2). Among the Asian countries in our study, India along with Nepal and Bangladeshwere the least free.
Economic freedom is restricted in many areas. Double-digit monetary expansion—nodoubt fueled by large budget deficits—undermines the productivity of the rupee and legal restraintslimit the ability of citizens to turn to more stable currencies. Even though governmentconsumption as a share of GDP is not particularly large (the most recent rating for this componentwas 7), the Indian economy is dominated by government. State-operated enterprises exist inalmost every major sector of the economy. Price controls abound. Restrictions limit entry intovarious business activities. Investment by foreigners generally requires approval from thegovernment. The legal system arms political decision-makers with a great deal of discretionaryauthority. The Indian tariff rates are among the highest in the world. (Note: the average tax rateon international trade was 17% in 1993.) All these factors serve to undermine economic freedomand the operations of markets.
In recent years, a few modest steps toward a freer economy have been taken. The topmarginal tax rate has been cut from 77% in 1975 and 62% in 1985 to the current 45% rate.Exchange rate controls have been eased during the last decade. The credit market is now morefully integrated with the global market. However, much more needs to be done if this populacecountry is going to reach its full potential.
157
www.fraserinstitute.org

INDONESIA
Part 1: The Economic Freedom Ratings for the Components and Various Area andSummary Indexes: 1975, 1980, 1985, 1990 and 1993-95.(The numbers in parentheses indicate the actual values for the components.)
1975
198019851990
1993-95
Summary RatingsIe
5.0
4.9
6.0
6.5
5.9
I s l
5.2
5.0
6.1
6.6
6.1
Is24.6
4.6
5.6
6.0
5.3
Summary Rating
Is1 R
atin
g
i n
8
6
4
2
0
- 5. 2
1975
ls1:5Year
• I1980
Periods
11985Year
6.6
1990
6.1
J_1993-95
Components of Economic Freedom 1975 1980 1985 1990 1993-95
I. Money and Inflation(a) Annual Money Growth (last 5 yrs.)(b) Inflation Variability (last 5 yrs.)
(c) Ownership of Foreign Currency
(d) Maint. of Bank Account Abroad
II. Government Operation(a) Govern. Consumption (% of GDP)(b) Government Enterprises
(c) Price Controls(d) Entry Into Business
(e) Legal System
(f) Avoidance of Neg. Interest Rates
IH. Takings(a) Transfers and Subsidies (% of GDP)(b) Marginal Tax Rates (Top Rate)(c) Conscription
IV. International Sector(a) Taxes on International Trade (Avg.)(b) Black Market Exchange Rates (Prem.)
(c) Size of Trade Sector (% of GDP)(d) Capital Transactions with Foreigners
4.3
1
1
10
10
5.5
9
4
-
-
-
2
5.5
9
4
0
5.26
5
9
2
(32.6)
(16.3)
(9.0)
(1.5)
(48)
(4.0)
(7)(44.2)
4.61
210
10
4.3
8
2---
2
4.6
8
3
0
6.27
7
10
2
(24.8)
(10.2)
(10.5)
(3.3)
(50)
(2.9)
(2)(53.3)
7.5
5
7
10
10
4.4
7
2----
6.5
8
7
0
5.8
8
5
9
2
(8.8)
(3.0)
(11.2)
(2.5)
(35)
(1.6)
(?)(42.6)
5.9
3
4
10
10
6.3
9
26
-
-
10
6.9
9
7
0
7.3
8
10
10
2
(13.1)
(5.1)
(9.0)
(2.0)
(35)
(2.5)
(0)(52.6)
7.9
3
10
10
10
4.1
9
23
2.5
0
10
7.310
7
0
6.5
8
7
10
2
(13.2)
(0.9)
(8.2)
(0.7)
(35)
(1.9)
(2)(55.8)
158
www.fraserinstitute.org

INDONESIA
Part 2: Recent Economic Indicators:Population 1994: 190
(in millions)Annual Rate of Change (1980-94): 1.8%
Real Per Capita GDP :
(in 1985 U.S. dollars)
Avg. Growth Rate:
1994= $2,310
1980-90 = 3.7%
1985-94 = 4.6%
Economic Indicators:
Change in Real GDP:Aggregate
: Per CapitaInflation Rate (CPI)Change in Money Supply: (Ml)
:(M2)Investment/GDP RatioCentral Government Budget
Deficit (-) or Surplus (+)
As a Percent of GDP
Unemployment Rate
19874.9
3.1
9.2
11.420.1
31.4
-0.8
19885.8
4.0
8.0
10.0
25.5
31.5
-3.0
19897.5
5.7
6.4
24.0
29.3
35.2
-1.9
1990
7.2
5.4
12.535.8
46.8
36.1
+0.4
1991
6.9
5.1
9.4
12.9
24.235.0
+0.4
19926.3
4.5
7.5
9.6
20.6
34.6
-0.4
1993
6.5
4.7
9.7
-
-
37.3
-0.8
1994
6.8
5.0
8.5
-
-
34.0
The average of our three indexes places Indonesia 41st among the countries in our study. Inthe Asian region, it falls in the middle. This economy is clearly less free than those of Hong Kong,Singapore, Malaysia, Thailand, South Korea, and Taiwan, but more free than India, Bangladesh,and Nepal. There are two major areas that Indonesia must improved if it is going to achieve its fullpotential. These two deficiencies are:
Legal Structure—the Absence of Rule of Law. The legal structure provides public officialswith too much arbitrary authority. When the discretion of government officials replaces the ruleof law, the security of property rights is undermined and corruption (for example, bribes, selectiveenforcement of regulations, and favoritism) becomes a way of life. A legal structure of this typeundermines market allocation.
Excessive Regulation. This is a regulated economy. Price controls, limitations on entry intobusiness and professional practice, exchange rate controls (however, the black market premium isrelatively small), and restrictions on the movement of capital are widespread. Governmententerprises—often protected from potential market competitors—operate in many sectors of theeconomy.
Despite these shortcomings, Indonesia's growth record during the last two decades has beenoutstanding. With movement toward a freer economy, it could follow the path of Japan andbecome a major economic power.
159
www.fraserinstitute.org

IRAN
Part 1: The Economic Freedom Ratings for the Components and Various Area andSummary Indexes: 1975, 1980, 1985, 1990 and 1993-95.(The numbers in parentheses indicate the actual values for the components.)
1975
1980
198519901993-95
Ie4.92.6
2.6
3.22.0
Summary RatingsIsl
5.02.5
2.7
3.2
2.1
Is24.8
2.92.5
3.01.6
Summary Rating Is1: 5 Year Periods |
3.2
2.1
1975 1980 1985 1990 1993-95Year
Components of Economic Freedom 1975 1980 1985 1990 1993-95
I. Money and Inflation(a) Annual Money Growth (last 5 yrs.)
(b) Inflation Variablity (last 5 yrs.)(c) Ownership of Foreign Currency
(d) Maint. of Bank Account Abroad
II. Government Operation(a) Govern. Consumption (% of GDP)(b) Government Enterprises
(c) Price Controls
(d) Entry Into Business(e) Legal System
(f) Avoidance of Neg. Interest Rates
III. Takings(a) Transfers and Subsidies (% of GDP)
(b) Marginal Tax Rates (Top Rate)(c) Conscription
IV. International Sector(a) Taxes on International Trade (Avg.)
(b) Black Market Exchange Rates (Prem.)(c) Size of Trade Sector (% of GDP)(d) Capital Transactions with Foreigners
2.52
-10
0
2.0
0
4
-
-
-
-
5.3
4
8
0
7.0
7
7105
(18.1)
(24.2)
(8.9)
(40)
(4.0)
(2)(75.0)
4.9
1
3
10
10
1.51
2----
3.85
-0
0.6
0
1
20
(35.1)(6.1)
(20.8)
(7.0)
(17.0)
(164)(29.7)
4.913
10
10
3.5
5
2
--
--
3.28
00
0.0
0
000
(23.4)(6.8)
(15.5)
(3.0)
(90)
(14.2)(533)(16.0)
6.326
10
10
3.6
7
2
2-
--
2.87
00
1.63
(14.8)
(3.6)
(11.1)
(4.4)
(75)
(7.3)
0(2197)4
0
(35.2)
2.3250
0
2.0
3
2-
2.50
-
3.1
-40
1.4
21
30
(18.9)(4.3)
(17.3)
(54)
(8.7)
(156)(31.1)
160
www.fraserinstitute.org

IRAN
Part 2: Recent Economic Indicators:Population 1994: 60.1
(in millions)
Annual Rate of Change (1980-94): 2.8%
Real Per Capita GDP :(in 1985 U.S. dollars)
Avg. Growth Rate:
1993= $3,650
1980-90= -1.1%1985-93= -1.7%
Economic Indicators:Change in Real GDP: Aggregate
: Per Capita
Inflation Rate (CPI)Change in Money Supply: (Ml)
:(M2)Investment/GDP RatioCentral Government Budget
Deficit (-) or Surplus (+)
As a Percent of GDP
Unemployment Rate
1987
1.2
-1.628.617.5
19.5
25.2
-7.1
1988-8.7
-11.528.7
15.220.119.1
-9.2
19893.3
0.5
22.3
13.222.5
23.8
-3.9
199011.7
8.9
7.6
15.9
18.128.6
-1.8
199111.4
8.6
17.125.4
23.4
33.2
-2.3
19925.7
2.9
25.718.3
25.132.6
-1.4
19931.8
-1.0
21.223.3
27.429.0
-0.3
1994
31.541.6
33.3
In 1975, the Iranian economic freedom rating of 5.0 placed it in the Top Thirty amongthe countries in our study. That changed dramatically following the Iranian revolution and theoverthrow of the Shah. Since 1980, Iran has ranked among the ten least free countries in eachof our rating years. Its 1993-1995 average summary rating placed it in a tie with Zaire as theleast free country in the world.
Inspection of the components makes it clear why Iran received such a low rating.Monetary policy is highly expansionary—the Ml money supply grew at an annual rate of18.9% during the last five years. Citizens are not allowed to have foreign currency bankaccounts, so the function of money as a store of value is undermined. Governmentconsumption takes a large share (17.3%) of GDP. Government enterprises are widespreadthroughout the economy. Equal protection under the law is weak; political figures have asubstantial amount of discretionary authority. Taxes take 54% of the marginal earnings ofproductive citizens—and this is down from 90% in 1985 and 75% in 1990. Conscription takesthe labor of the young. The taxes on international trade are among the highest in the world.Exchange rate controls have led to a 150% black market premium. As a share of GDP, thesize of the trade sector is now less than half its size in 1975. Foreigners are not allowed toundertake domestic investments and neither are citizens allowed to make investments abroadwithout the permission of the government.
The 1993 per capita real GDP of Iran was 40% less than the 1975 figure. Countriesthat stifle economic freedom pay a price.
161
www.fraserinstitute.org

ISRAEL
Part 1: The Economic Freedom Ratings for the Components and Various Area andSummary Indexes: 1975, 1980, 1985, 1990 and 1993-95.(The numbers in parentheses indicate the actual values for the components.)
19751980
1985
19901993-95
Ie
2.22.4
2.4
2.9
4.2
Summary RatingsIsl2.12.3
2.53.0
4.2
Is22.32.62.5
2.8
4.2
Summary Rating Is1: 5 Year Periods |8
1975 198 0 198 5 199 0 1993-9 5Year
Components of Economic Freedom 1975 1980 1985 1990 1993-95
I. Money and Inflation(a) Annual Money Growth (last 5 yrs.)(b) Inflation Variablity (last 5 yrs.)
(c) Ownership of Foreign Currency
(d) Maint. of Bank Account Abroad
II. Government Operation(a) Govern. Consumption (% of GDP)
(b) Government Enterprises(c) Price Controls
(d) Entry Into Business(e) Legal System
(f) Avoidance of Neg. Interest Rates
III. Takings(a) Transfers and Subsidies (% of GDP)
(b) Marginal Tax Rates (Top Rate)(c) Conscription
IV. International Sector(a) Taxes of International Trade (Avg.)
(b) Black Market Exchange Rates (Prem.)(c) Size of Trade Sector (% of GDP)
(d) Capital Transactions with Foreigners
3.222
10
0
1.002----
0.0--
0
2.3224
2
(18.2)(9.4)
(40.2)
(8.0)
(60)(77.4)
2.21
0
10
0
0.8
02---
0
0.911
0
5.26842
(40.0)
(33.2)
(38.5)
(20.8)(66)
(5.1)
(1)(90.4)
1.90
0
10
0
0.8
0
2---
0
1.81
3
0
4.87
55
2
(169.3)(101.7)
(34.4)
(19.7)
(60)
(2.9)
(7)(85.8)
2.91
210
0
1.4020-
-6
2.724
0
5.29
6
22
(42.6)
(13.0)
(28.8)
(16.7)
(51)
(0.9)(4)
(69.0)
4.526
100
4.1024
7.55.0
8
2.7240
5.79822
(17.0)(3.6)
(27.1)
(15.2)(50)
(1.1)
(1)(64.4)
162
www.fraserinstitute.org

ISRAEL
Part 2: Recent Economic Indicators:Population 1994: 5.3
(in millions)
Annual Rate of Change (1980-94): 2.3%
Real Per Capita GDP :(in 1985 U.S. dollars)
Avg. Growth Rate:
1994 =
1980-90 =
1985-94 =
$9,970
1.8%
2.2%
Economic Indicators:Change in Real GDP:Aggregate
: Per Capita
Inflation Rate (CPI)Change in Money Supply: (Ml)
:(M2)Investment/GDP Ratio
Central Government BudgetDeficit (-) or Surplus (+)As a Percent of GDP
Unemployment Rate
19876.13.8
19.8
58.227.4
19.1
-3.3
6.1
1988
3.10.8
16.331.0
20.0
17.3
-8.06.4
19891.3
-1.0
20.227.6
23.7
15.9
-3.98.9
19905.83.5
17.227.9
19.4
18.7
-4.39.6
1991
6.23.9
19.0
26.5
19.224.3
-8.010.6
19926.64.3
11.9
22.815.7
24.3
-3.9
11.2
19933.00.7
10.9
25.8
27.224.0
-1.810.0
1994
6.54.2
12.319.7
24.7-
7.6 a
a First 6 months of the year.
Israel may be the "bastion of democracy in the Middle East," but when it comes toeconomic freedom, it is not a "moral light to the nations." On the contrary, its economic freedomrating is poor, although there are some modest signs of improvement. In 1975, Israel's Islsummary rating of 2.1 was the second lowest among the countries in our study. Only Uganda hada lower rating. In 1980, 1985, and 1990, Israel's rating increased, but it continued to rank in theBottom Ten among the more than 100 countries of our study (see Exhibit 2-2). Based on theaverage of our three indexes, Israel ranked 66th (tied with Turkey and Bangladesh) in 1993-1995.
Monetary expansion, price instability, a huge government consumption sector, widespreadpublic sector enterprises, and a large transfer sector constitute the major weaknesses of thiseconomy. The Israeli top marginal tax rate, although declining from 66% in 1980, is still at the50% level. Countries that take one half of the marginal earnings of their most productive citizensare unlikely to reach their full potential. Put simply, the Israeli government has suffocated themarket sector.
This country needs monetary stability (note the 20% recent growth in money),deregulation of its financial and capital markets, and privatization of state enterprises. Theentrepreneurial spirit and market success of the Jewish people are renown around the world. Ifreleased, these forces will also lead to prosperity and growth in the Jewish homeland.
163
www.fraserinstitute.org

ITALY
Part 1: The Economic Freedom Ratings for the Components and Various Area andSummary Indexes: 1975, 1980, 1985, 1990 and 1993-95.(The numbers in parentheses indicate the actual values for the components.)
1975
1980
1985
1990
1993-95
Summary RatingsIe
4.0
3.8
4.0
5.9
6.1
Isl4.1
3.6
3.6
5.4
5.6
Is23.6
3.84.1
6.4
6.7
Summary Rating Is1: 5 Year Periods
8
a: 44.1
3.6 3.6
5.4
MM15.6
11975 1980 1985 1990 1993-95
Year
Components of Economic Freedom 1975 1980 1985 1990 1993-95
I. Money and Inflation(a) Annual Money Growth (last 5 yrs.)(b) Inflation Variablity (last 5 yrs.)
(c) Ownership of Foreign Currency
(d) Maint. of Bank Account Abroad
II. Government Operation(a) Govern. Consumption (% of GDP)
(b) Government Enterprises
(c) Price Controls
(d) Entry Into Business(e) Legal System(f) Avoidance of Neg. Interest Rates
III. Takings(a) Transfers and Subsidies (% of GDP)
(b) Marginal Tax Rates (Top Rate)(c) Conscription
IV. International Sector(a) Taxes on International Trade (Avg.)(b) Black Market Exchange Rates (Prem.)(c) Size of Trade Sector (% of GDP)(d) Capital Transactions with Foreigners
2.234
0
0
4.4
6
2-
-
-6
3.1
25
0
6.510555
(12.6)
(5.2)
(14.1)
(17.5)
(48)
(0.3)
(9)(41.1)
3.3280
0
3.6
5
2---
4
0.41
00
7.9101055
(17.2)
(2.2)
(14.7)
(20.9)
(72)
(0.0)
(0)(46.5)
3.55
6
0
0
3.6
4
2-
-
-6
0.0
0
0
0
8.0
10
10
6
5
(9.8)
(3.8)
(16.4)
(28.5)
(81)
(0.0)
(0)(46.0)
9.17
10
10
10
4.4
3
25
-
-10
2.30
50
7.7
101045
(7.0)
(0.8)
(17.4)
(27.1)
(50)
(0.0)
(0)(41.4)
9.1
8
9
10
10
5.2
2
25
7.57.5
10
1.9
0
40
8.310
10
3
8
(3.7)
(1.7)
(17.6)
(28.6)
(51)
(CO)
(0)(39.8)
164
www.fraserinstitute.org

ITALY
Part 2: Recent Economic Indicators:Population 1994: 58.0
(in millions)
Annual Rate of Change (1980-94): 0.2%
Real Per Capita GDP :
(in 1985 U.S. dollars)
Avg. Growth Rate:
1994=
1980-90=
1985-94=
$12,920
2.0%
2.0%
Economic Indicators:
Change in Real GDP: Aggregate
: Per Capita
Inflation Rate (CPI)
Change in Money Supply: (Ml)
: (M2)
Investment/GDP Ratio
Central Government Budget
Deficit (-) or Surplus (+)
As a Percent of GDP
Unemployment Rate
1987
3.1
3.1
4.7
10.5
9.8
21.0
-14.9
10.9
1988
4.1
4.0
5.1
7.8
7.0
21.5
-10.6
11.0
1989
2.9
2.9
6.3
7.5
8.5
21.3
-10.5
11.9
1990
2.1
2.1
6.4
8.1
9.0
21.0
-10.3
10.3
1991
1.2
1.2
6.3
10.0
8.7
20.5
-9.9
9.9
1992
0.7
0.6
5.2
7.1
8.2
19.4
-10.9
10.5
1993
-0.7
-1.0
4.5
7.4
7.3
19.2
-9.6
10.2
1994
2.7
2.5
4.2
3.5
2.7
18.7
11.6
After declining during 1975-1985, Italy's economic freedom rating has increased substantiallyduring the last decade. Based on the average of our three indexes, Italy ranked 31st (tied with severalother countries) in the mid-1990s. Its Isl summary rating placed it in a tie for 44th place (with Maltaand Finland.)
The primary factors underlying the recent improvement of Italy are a more stable monetarypolicy, removal of restrictions on the ownership of foreign currency bank accounts, and a reductionin the top marginal tax rate. Historically, Italy's monetary expansion and inflation rates have been thehighest of the large industrial nations of Europe. As the steady improvement in the money expansionand inflation variability components of our index indicate, Italy has made substantial progress in thisarea. It also legalized the maintenance of foreign currency bank accounts, both domestically andabroad, in the late 1980s. These changes have led to a sharp increase in Italy's rating in the monetaryarea during the last decade. The reduction in the top marginal tax rate from a confiscatory 81% tothe current 51% also helped push the summary rating upward.
Like several other European nations, the Italian economy is plagued with large governmentconsumption and transfer sectors which are fueling a huge budget deficit that has averagedapproximately 10% of GDP during the last decade. Deficits of this size cannot be maintained for verylong without rapid growth in the money supply. Unless Italy gets its budget under control, themonetary instability of the past will soon be returning.
165
www.fraserinstitute.org

JAPAN
Part 1: The Economic Freedom Ratings for the Components and Various Area andSummary Indexes: 1975, 1980, 1985, 1990 and 1993-95.(The numbers in parentheses indicate the actual values for the components.)
1975
1980
1985
1990
1993-95
Summary RatingsIe
5.3
6.4
6.9
7.4
7.3
Is l
5.25.9
6.5
6.9
6.9
Is2
5.3
6.4
7.0
7.9
7.8
Summary Rating
Is1 R
atin
g
m
8
6
4
2
0
•1975
Is1:5
5.9
1980
Year Periods!
RC 6.9
• I1985 199 0Year
6.9
J_1993-95
Components of Economic Freedom 1975 1980 1985 1990 1993-95
I. Money and Inflation(a) Annual Money Growth (last 5 yrs.)
(b) Inflation Variablity (last 5 yrs.)
(c) Ownership of Foreign Currency(d) Maint. of Bank Account Abroad
II. Government Operation(a) Govern. Consumption (% of GDP)(b) Government Enterprises
(c) Price Controls(d) Entry Into Business
(e) Legal System
(f) Avoidance of Neg. Interest Rates
III. Takings(a) Transfers and Subsidies (% of GDP)
(b) Marginal Tax Rates (Top Rate)(c) Conscription
IV. International Sector(a) Taxes on International Trade (Avg.)
(b) Black Market Exchange Rates (Prem.)
(c) Size of Trade Sector (% of GDP)(d) Capital Transactions with Foreigners
4.54
4
10
0
7.28
8
-
-
-
4
3.4
4
1
10
6.5
9
10
3
2
(10.8)(5.6)
(10.0)
(9.6)(68)
(1.3)
(0)(25.6)
7.69
9
10
0
8.4
8
8
-
-
-
10
2.94
0
10
6.59
10
3
2
(2.4)
(1.7)
(9.8)
(10)(75)
(0.9)
(0)(28.3)
8.310
10
10
0
8.89
8
-
-
-
10
3.4
4
1
10
7.29
103
5
(0.9)
(0.8)
(9.6)
(10.4)
(70)
(0.8)
(0)(25.5)
9.79
10
10
10
7.99
86-
-
10
3.9
4
210
7.79
10
1
8
(2.0)
(0.9)
(9.1)
(9.9)
(65)
(0.9)
(0)(21.0)
9.79
10
10
10
7.4
8
8
5
7.5
7.5
10
3.9
4
210
7.79
10
1
8
(2.4)
(0.6)
(9.8)
(10.0)
(65)
(0.9)
(0)(18.0)
166
www.fraserinstitute.org

JAPAN
Part 2: Recent Economic Indicators:Population 1994: 125.7
(in millions)
Annual Rate of Change (1980-94): 0.5%
Real Per Capita GDP :
(in 1985 U.S. dollars)
Avg. Growth Rate:
1994=
1980-90=
1985-94=
$15,
3
2
105
. 5 %
. 8 %
Economic Indicators:
Change in Real GDP: Aggregate
: Per Capita
Inflation Rate (CPI)
Change in Money Supply: (Ml)
: (M2)
Investment/GDP Ratio
Central Government Budget
Deficit (-) or Surplus (+)
As a Percent of GDP
Unemployment Rate
1987
4.1
3.6
0.1
9.0
10.2
28.7
-3.5
2.8
1988
6.2
5.8
0.7
7.7
11.2
30.6
-2.6
2.5
1989
4.7
4.3
2.3
4.6
10.0
31.8
-2.9
2.3
1990
4.8
4.5
3.1
3.2
12.1
32.8
-1.6
2.1
1991
4.3
3.9
3.3
5.9
4.1
32.5
2.1
1992
1.1
0.8
1.7
6.5
1.2
31.2
2.2
1993
0.1
-0.2
1.3
4.2
1.4
30.4
2.5
1994
0.9
0.4
0.6
5.7
3.1
28.8
2.9
This economic powerhouse has shown slow and steady improvement in the area of economicfreedom over the last two decades. Its economic freedom summary rating (Isl) increased from 5.2 in1975 to 6.9 in 1993-1995. Japan's Isl rating places it ninth while the average of the three indexes ranksit 10th among the more than 100 countries in our study.
Japan's greatest strength is in the money and inflation area. Its most recent rating in this areawas 9.7, up from 4.5 in 1975. For the last ten to fifteen years, Japan has been a model of monetarystability. For a high-income industrial country, Japan's government consumption expenditures arerelatively small. Its rating in this area is the highest among the industrial nations. Its major weaknessesare high marginal tax rates (its top marginal rate of 65% is now out of line with the rest of the worldwhich has been reducing rates) and non-tariff trade restraints (note how the size of the trade sector ismuch smaller than would be expected for a country of this size and location).
Japan's modest growth rates in the 2-4% range are probably indicative of a high-income matureeconomy. Of course, these growth rates would be the envy of quite a few high-income Europeannations. While Japan is no free market Utopia, its generally positive economic record highlights theimportance of monetary stability, security of ownership rights, primary reliance on market allocation,and the integration of financial markets with the world economy.
167
www.fraserinstitute.org

KENYA
Part 1: The Economic Freedom Ratings for the Components and Various Area andSummary Indexes: 1975, 1980, 1985, 1990 and 1993-95.(The numbers in parentheses indicate the actual values for the components.)
1975
1980
1985
1990
1993-95
Summary RatingsIe
3.8
4.0
4.7
4.4
4.1
I s l
3.4
4.0
4.3
4.5
4.5
Is23.9
3.84.6
4.0
3.4
Summary Rating Is1: 5 Year Periods
D)
3.44.0 4.3 4.5 4.5
1975 1980 1985 1990 1993-95
Year
Components of Economic Freedom 1975 1980 1985 1990 1993-95
I. Money and Inflation(a) Annual Money Growth (last 5 yrs.)
(b) Inflation Variability (last 5 yrs.)
(c) Ownership of Foreign Currency
(d) Maint. of Bank Account Abroad
II. Government Operation(a) Govern. Consumption (% of GDP)
(b) Government Enterprises
(c) Price Controls(d) Entry Into Business
(e) Legal System
(f) Avoidance of Neg. Interest Rates
III. Takings(a) Transfers and Subsidies (% of GDP)(b) Marginal Tax Rates (Top Rate)
(c) Conscription
IV. International Sector(a) Taxes on International Trade (Avg.)(b) Black Market Exchange Rates (Prem.)(c) Size of Trade Sector (% of GDP)(d) Capital Transactions with Foreigners
3.4
9
20
0
3.224
--
-4
2.2-
0
10
4.5
6
5
8
0
(3.2)(9.3)
(18.3)
(70)
(5.5)
(8)(64.3)
2.86
3
0
0
3.71
4
-
-
-
8
5.08
1
10
3.7
5
4
7
0
(7.2)(6.1)
(19.8)
(2.3)(65)
(6.1)(10)
(67.0)
5.88
10
0
0
4.93
4
-
-
-
10
3.76
0
10
3.6
3
7
5
0
(4.5)
(1.2)
(17.5)
(4.7)(65)
(7.4)
(2)(51.6)
3.9
3
9
0
0
3.7
24
2-
-10
5.98
3
10
3.8
46
6
0
(12.2)(1.4)
(18.7)
(2.8)(50)
(6.3)
(6)(57.5)
1.3
1
3
0
0
4.06
4
4
5
0
-
7.39
5
10
4.3
6
6
5
0
(23.1)
(7.5)
(13.1)
(1.7)(40)
(3.7)
(6)(54.0)
168
www.fraserinstitute.org

KENYA
Part 2: Recent Economic Indicators:Population 1994: 27.5 Real Per Capita GDP : 1993=
(in millions) (in 1985 U.S. dollars)
Annual Rate of Change (1980-94): 3.6% Avg. Growth Rate: 1980-90=
1984-93=
0.6%
0.7%
Economic Indicators:
Change in Real GDP: Aggregate
: Per Capita
Inflation Rate (CPI)
Change in Money Supply: (Ml)
: (M2)
Investment/GDP Ratio
Central Government Budget
Deficit (-) or Surplus (+)
(As a Percent of GDP)
Unemployment Rate
1987
5.9
2.3
7.6
13.6
18.3
19.8
-6.7
1988
6.2
2.6
11.2
2.25.9
20.1
-4.4
1989
4.7
1.1
12.9
11.5
15.3
19.3
-6.9
1990
4.2
0.6
15.6
18.7
14.0
20.8
-4.0
1991
1.4
-2.4
19.8
16.6
18.7
19.3
-2.8
1992
0.4
-3.2
29.5
29.7
29.3
17.1
-0.4
1993
-0.2
-3.8
45.8
37.4
30.5
15.3
-4.0
1994
5.2
1.6
29.0
25.0
20.6
-3.4
Based on the average of our three indexes, Kenya's economic freedom rating placed it72nd in 1993-1995. The summary rating changed very little during the last two decades.While Kenya's ratings are poor in almost all categories, its major deficiencies are:
Unstable Monetary Policy. In recent years, the annual rate of monetary growth hassoared above 20% and it appears to be moving higher (it exceeded 30% during 1992-1994).Of course, this fuels the inflation rate, which is now in the 30% range. Since citizens areprohibited from maintaining foreign currency bank accounts, they have no way to hold moneyas a store of value.
Poor Legal Structure. The legal structure often operates in a discriminatory manner.Public officials have a great deal of discretionary authority that is often beyond the reach ofthe legal structure. As the result, corruption is widespread and the security of property rightsand enforcement of contracts is weak.
Excessive Regulation. This is a regulated economy. Price controls, exchange ratecontrols (the black market premium is relatively small), an under-developed credit market, andrestrictions on the movement of capital (in order to assure the remittance of earnings, foreigninvestors must obtain a "certificate of approved enterprise") undermine the development of amarket economy.
Perhaps Kenya's poor growth record (per capita GDP has increased at an average rate of0.6% during the last 15 years) will provide stimulus for some positive changes in the nearfuture.
169
www.fraserinstitute.org

MALAYSIA
Part 1: The Economic Freedom Ratings for the Components and Various Area andSummary Indexes: 1975, 1980, 1985, 1990 and 1993-95.(The numbers in parentheses indicate the actual values for the components.)
1975
1980
1985
1990
1993-95
Summary RatingsIe
5.3
6.0
7.2
7.3
7.1
Is l
5.1
5.6
7.1
7.1
7.0
Is2
5.9
6.7
7.0
7.4
7.1
Summary Rating Is1: 5 Year Periods
Components of Economic Freedom 1975 1980 1985 1990 1993-95
I. Money and Inflation(a) Annual Money Growth (last 5 yrs.)
(b) Inflation Variability (last 5 yrs.)
(c) Ownership of Foreign Currency
(d) Maint. of Bank Account Abroad
II. Government Operation
(a) Govern. Consumption (% of GDP)
(b) Government Enterprises
(c) Price Controls
(d) Entry Into Business
(e) Legal System
(f) Avoidance of Neg. Interest Rates
III. Takings
(a) Transfers and Subsidies (% of GDP)
(b) Marginal Tax Rates (Top Rate)
(c) Conscription
IV. International Sector
(a) Taxes on International Trade (Avg.)
(b) Black Market Exchange Rates (Prem.)
(c) Size of Trade Sector (% of GDP)
(d) Capital Transactions with Foreigners
3.95
2
0
10
3.0
2
4
-
-
--
5.2
5
4
10
6.9
4
10
10
5
(8.9)
(8.3)
(17.7)
(6.4)
(50)
(7.0)
(0)(86.8)
7.25
6
10
10
4.0
3
4
-
-
6
4.7
6
2
10
6.6
3
10
10
5
(9.7)
(3.1)
(16.5)
(4.8)
(60)
(7.7)
(0)(112.6)
7.310
7
10
0
6.5
5
6
-
-
-
10
7.3
8
6
10
7.2
5
10
10
5
(0.9)
(2-6)
(15.3)
(3.6)
(45)
(5.7)
(0)(104.6)
7.17
4
10
10
6.3
6
6
5
-
-
10
7.3
8
6
10
7.8
7
10
10
5
(6.5)
(5.2)
(14.0)
(2.4)
(45)
(3.2)
(0)(151.2)
7.62
10
10
10
6.0
7
6
4
7.5
2.5
10
7.4
7
7
10
7.8
7
10
10
5
(14.0)
(1.1)
(13.0)
(4.2)
(34)
(2.8)
(0)(154.2)
170
www.fraserinstitute.org

MALAYSIA
Part 2: Recent Economic Indicators:Population 1994: 19.5
(in millions)
Annual Rate of Change (1980-94): 2.5%
Real Per Capita GDP :
(in 1985 U.S. dollars)
Avg. Growth Rate:
1994= $6,510
1980-90 = 3.30%
1985-94 = 4.98%
Economic Indicators:
Change in Real GDP:Aggregate
: Per Capita
Inflation Rate (CPI)
Change in Money Supply: (Ml)
:(M2)Investment/GDP Ratio
Central Government Budget
Deficit (-) or Surplus (+)
As a Percent of GDP
Unemployment Rate
1987
5.4
2.9
3.0
12.8
3.9
23.2
-6.6
1988
8.9
6.4
2.6
14.4
8.8
26.0
-0.3
1989
9.2
6.7
2.8
17.3
15.1
29.0
-0.5
1990
9.7
7.2
2.6
15.6
10.7
32.1
-1.3
1991
8.7
6.2
4.4
9.9
15.5
36.3
-0.2
1992
8.5
6.0
4.8
-
-
35.9
+0.7
1993
8.0
5.5
3.5
22.6
21.4
35.0
+ 1.6
1994
9.9
7.4
3.7
31.6
22.4
38.5
+2.3
Between 1975 and 1985, the economic freedom of this southeast Asian nation increasedsubstantially and the higher rating was maintained during the last decade. In the mid-1990s, theMalaysian economy ranks as one of the freest in the world. Our Isl summary rating ranks it 6thand the average of our three ratings places it 12th. Other than Hong Kong and Singapore, no non-industrial economy has a higher rating than Malaysia.
Several factors contributed to the improvement. There was an increase in the stability ofthe price level (and inflation rate). Foreign currency bank accounts were legalized. During thelast two decades, there has been a decline in both government consumption expenditures andtransfers as a share of the economy. Not many countries can match that record. Marginal taxrates have been reduced. The top rate is now 34%, down from 60% in 1980. Tariffs have beenreduced and the trade sector has grown rapidly. There are a few areas of concern, however. Inthe last few years, the growth rate of the money supply has been rapid which may foreshadowfuture inflation. Malaysia also shows some reluctance to give up its regulatory ways as evidencedby the relatively low ratings in Government Enterprises (lib), Price Controls (lie) and Equalitybefore the Law (He).
All in all, Malaysia's impressive move toward economic liberalization is being rewardedby a vibrant and growing economy. With per capita GDP growth rates averaging over 3% peryear in the 1980's and increasing to nearly 5% in the 1990's, Malaysia is earning the dividendsof economic freedom.
171
www.fraserinstitute.org

MAURITIUS
Part 1: The Economic Freedom Ratings for the Components and Various Area andSummary Indexes: 1975, 1980, 1985, 1990 and 1993-95.(The numbers in parentheses indicate the actual values for the components.)
197519801985
1990
1993-1995
Ie
3.7
3.8
6.0
5.4
6.2
Summary RatingsI s l
3.9
3.8
6.0
5.6
6.3
Is2
3.1
3.6
5.5
4.8
5.8
Summary Rating Is1: 5 Year Periods
1975 1980 1985 1990 1993-1995Year
Components of Economic Freedom 1975 1980 1985 1990 1993-95
I. Money and Inflation(a) Annual Money Growth (last 5 yrs.)
(b) Inflation Variablity (last 5 yrs.)
(c) Ownership of Foreign Currency(d) Maint. of Bank Account Abroad
II. Government Operation(a) Govern. Consumption (% of GDP)
(b) Government Enterprises
(c) Price Controls(d) Entry Into Business
(e) Legal System
(f) Avoidance of Neg. Interest Rates
III. Takings(a) Transfers and Subsidies (% of GDP)(b) Marginal Tax Rates (Top Rate)
(c) Conscription
IV. International Sector(a) Taxes on International Trade (Avg.)
(b) Black Market Exchange Rates (Prem.)(c) Size of Trade Sector (% of GDP)
(d) Capital Transactions with Foreigners
0.6
1
1
0
0
6.5
7
6
-
-
-
-
6.2
5
-
10
3.1
4
25
2
(31.0)(20.1)
(11.1)
(6.6)
(7.1)(47)
(112.3)
3.17
3
0
0
6.0
6
6
-
-
-
-
4.7
5
3
10
2.0
1
2
4
2
(6.3)(8.0)
(14.1)
(6.5)(50)
(9.6)(40)
(112.6)
6.0
10
9
0
0
7.6
8
6
-
-
-
10
7.0
6
7
10
3.7
1
8
4
2
(-0.8)
(1.4)
(10.2)
(5.2)(35)
(9.6)
(1)(109.0)
4.0
2
10
0
0
4.7
7
6
-
-
-
8
7.4
7
7
10
3.8
3
5
6
2
(16.2)(1.3)
(11.1)
(4.2)(35)
(7.6)
(8)
(142.1)
4.8
6
9
0
0
8.0
7
6
-
10
7.5
10
7.5
6
8
10
3.9
3
6
5
2
(7.9)(1.7)
(12.9)
(4.9)
(30)
(7.5)
(5)(128.3)
172
www.fraserinstitute.org

MAURITIUS
Part 2: Recent Economic Indicators:Population 1994: 1.1
(in millions)
Annual Rate of Change (1980-94): 1.1%
Real Per Capita GDP :
(in 1985 U.S. dollars)Avg. Growth Rate:
1994 = $6,650
1980-90= 5.0%
1985-93 = 5.4%
Economic Indicators:Change in Real GDP:Aggregate
: Per Capita
Inflation Rate (CPI)Change in Money Supply: (Ml)
:(M2)Investment/GDP RatioCentral Government Budget
Deficit (-) or Surplus (+)
As a Percent of GDP
Unemployment Rate
1987
10.29.1
0.5
29.3
32.225.3
+0.3
18.5
19886.8
5.7
9.2
22.129.430.6
+0.3
10.4
19894.6
4.5
12.7
20.4
19.130.7
-1.6
6.7
1990
7.2
6.1
13.519.6
19.930.4
-0.5
4.6
1991
4.1
3.0
7.0
24.1
21.327.7
3.8
19926.3
5.2
4.6
11.5
19.728.5
-0.8
19935.4
4.3
10.5
6.2
14.529.4
0.0
19944.6
3.5
7.3
7.4
16.431.7
This small island nation off the southeastern coast of Africa took substantial stepstoward economic freedom between 1975 and 1985 and it has maintained its higher ratings intothe 1990s. Based on the average of our three summary ratings, Mauritius ranked 31st (tiedwith several other countries) in 1993-1995. Its Isl rating placed it even higher (tied for 21st).
What accounts for this relatively high ranking? While there is still room forimprovement, the growth rate of the money supply has been moderate and the inflation raterelatively stable. The government consumption and transfer sectors are both relatively smalland the legal structure provides for protection of property rights and freedom of entry intobusiness. Taxes are relatively low; the top marginal tax rate is currently 30%, down from 50%in 1980. The record is not all positive. Tariff rates are high and there are restrictions on boththe convertibility of the domestic currency and the movement of capital into and out of thecountry. All considered, however, it is not a bad record, probably the best among the Africangroup of nations.
Like its economic freedom rating, Mauritius's growth rate has been impressive. Its percapita GDP grew at an annual rate of 5.0% during the 1980s and 5.4% during the last decade.With additional moves toward freedom, the economic future of this country would indeed bebright.
173
www.fraserinstitute.org
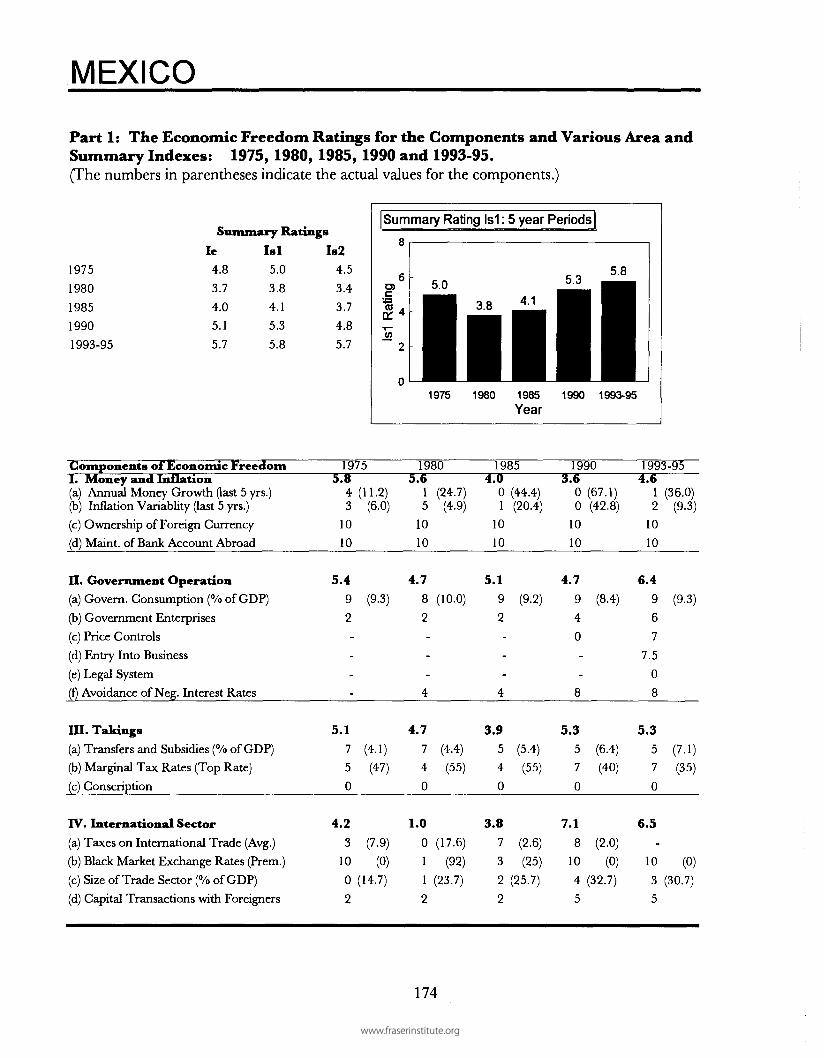
MEXICO
Part 1: The Economic Freedom Ratings for the Components and Various Area andSummary Indexes: 1975, 1980, 1985, 1990 and 1993-95.(The numbers in parentheses indicate the actual values for the components.)
19751980
1985
1990
1993-95
Summary RatingsIe
4.8
3.7
4.0
5.1
5.7
I s l
5.0
3.8
4.1
5.3
5.8
Is24.5
3.4
3.7
4.8
5.7
Summary Rating Is1: 5 year Periods
Q)
|
5.8
IUIP1975 1980 1985 1990 1993-95Year
Components of Economic FreedomI. Money and Inflation(a) Annual Money Growth (last 5 yrs.)(b) Inflation Variablity (last 5 yrs.)(c) Ownership of Foreign Currency(d) Maint. of Bank Account Abroad
19755.8
4 (11.2)3 (6.0)
10
10
19805.6
1 (24.7)5 (4.9)
10
10
19854.0
0 (44.4)1 (20.4)
10
10
19903.6
00
10
10
(67.1)(42.8)
1993-954.6
12
10
10
(36.0)(9.3)
II. Government Operation(a) Govern. Consumption (% of GDP)
(b) Government Enterprises
(c) Price Controls(d) Entry Into Business
(e) Legal System(f) Avoidance of Neg. Interest Rates
III. Takings(a) Transfers and Subsidies (% of GDP)(b) Marginal Tax Rates (Top Rate)
(c) Conscription
IV. International Sector(a) Taxes on International Trade (Avg.)(b) Black Market Exchange Rates (Prem.)(c) Size of Trade Sector (% of GDP)
(d) Capital Transactions with Foreigners
5.4
9
2
-
-
-
-
5.1
7
5
0
4.23
10
0
2
(9.3)
(4.1)(47)
(7.9)
(0)(14.7)
4.78
2---
4
4.77
4
0
1.0
0
1
1
2
(10.0)
(4.4)(55)
(17.6)
(92)(23.7)
5.19
2---
4
3.95
4
0
3.8
7
3
22
(9.2)
(5.4)(55)
(2.6)(25)
(25.7)
4.7
9
4
0
-
-
8
5.3
5
7
0
7.1
8
10
4
5
(8.4)
(6.4)(40)
(2.0)
(0)(32.7)
6.4
9
6
77.5
0
8
5.35
7
0
6.5
-
10
3
5
(9.3)
(7.1)(35)
(0)(30.7)
174
www.fraserinstitute.org
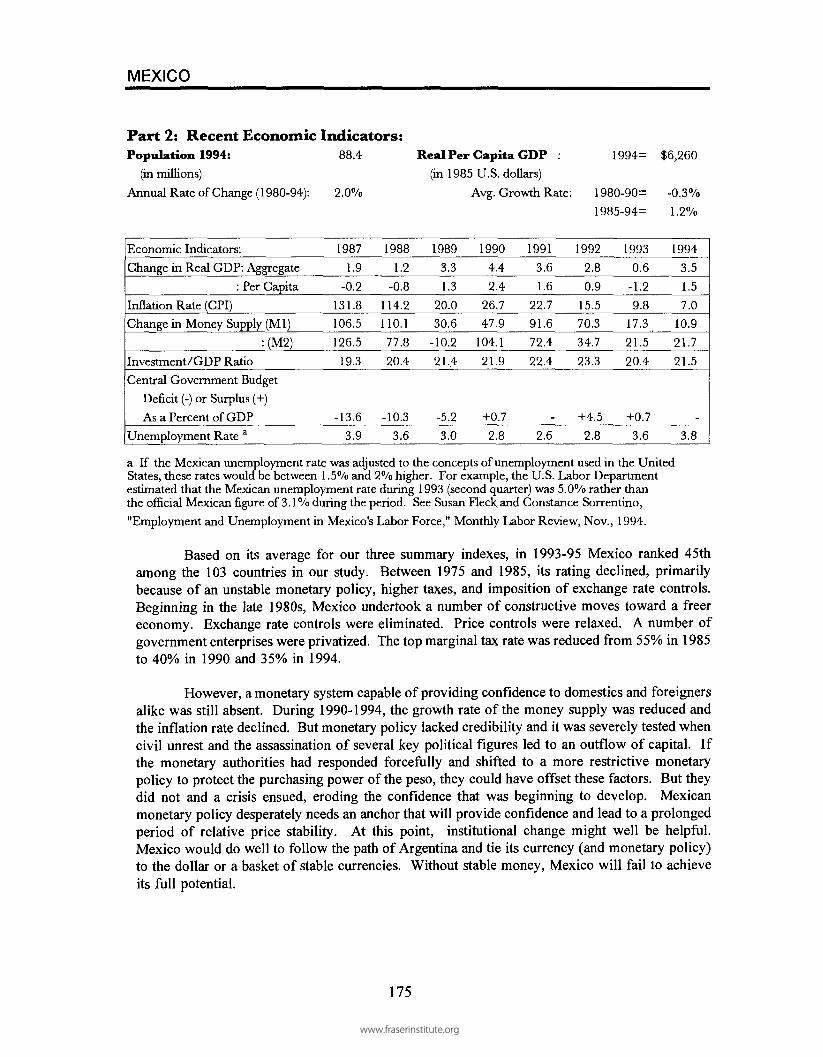
MEXICO
Part 2: Recent Economic Indicators:Population 1994: 88.4
(in millions)
Annual Rate of Change (1980-94): 2.0%
Real Per Capita GDP :
(in 1985 U.S. dollars)
Avg. Growth Rate:
1994= $6,260
1980-90= -0.3%
1985-94= 1.2%
Economic Indicators:
Change in Real GDP: Aggregate
: Per Capita
Inflation Rate (CPI)
Change in Money Supply (Ml)
:(M2)
Investment/GDP Ratio
Central Government Budget
Deficit (-) or Surplus (+)
As a Percent of GDP
Unemployment Rate a
1987
1.9
-0.2
131.8
106.5
126.5
19.3
-13.6
3.9
1988
1.2
-0.8
114.2
110.1
77.8
20.4
-10.3
3.6
1989
3.3
1.3
20.0
30.6
-10.2
21,4
-5.2
3.0
1990
4.4
2.4
26.7
47.9
104.1
21.9
+0.7
2.8
1991
3.6
1.6
22.7
91.6
72.4
22.4
2.6
1992
2.8
0.9
15.5
70.3
34.7
23.3
+4.5
2.8
1993
0.6
-1.2
9.8
17.3
21.5
20.4
+0.7
3.6
1994
3.5
1.5
7.0
10.9
21.7
21.5
3.8
a If the Mexican unemployment rate was adjusted to the concepts of unemployment used in the UnitedStates, these rates would be between 1.5% and 2% higher. For example, the U.S. Labor Departmentestimated that the Mexican unemployment rate during 1993 (second quarter) was 5.0% rather thanthe official Mexican figure of 3.1 % during the period. See Susan Fleck and Constance Sorrentino,
"Employment and Unemployment in Mexico's Labor Force," Monthly Labor Review, Nov., 1994.
Based on its average for our three summary indexes, in 1993-95 Mexico ranked 45thamong the 103 countries in our study. Between 1975 and 1985, its rating declined, primarilybecause of an unstable monetary policy, higher taxes, and imposition of exchange rate controls.Beginning in the late 1980s, Mexico undertook a number of constructive moves toward a freereconomy. Exchange rate controls were eliminated. Price controls were relaxed. A number ofgovernment enterprises were privatized. The top marginal tax rate was reduced from 55% in 1985to 40% in 1990 and 35% in 1994.
However, a monetary system capable of providing confidence to domestics and foreignersalike was still absent. During 1990-1994, the growth rate of the money supply was reduced andthe inflation rate declined. But monetary policy lacked credibility and it was severely tested whencivil unrest and the assassination of several key political figures led to an outflow of capital. Ifthe monetary authorities had responded forcefully and shifted to a more restrictive monetarypolicy to protect the purchasing power of the peso, they could have offset these factors. But theydid not and a crisis ensued, eroding the confidence that was beginning to develop. Mexicanmonetary policy desperately needs an anchor that will provide confidence and lead to a prolongedperiod of relative price stability. At this point, institutional change might well be helpful.Mexico would do well to follow the path of Argentina and tie its currency (and monetary policy)to the dollar or a basket of stable currencies. Without stable money, Mexico will fail to achieveits full potential.
175
www.fraserinstitute.org

NETHERLANDS
Part 1: The Economic Freedom Ratings for the Components and Various Area andSummary Indexes: 1975, 1980, 1985, 1990 and 1993-95.(The numbers in parentheses indicate the actual values for the components.)
1975
19801985
19901993-95
Summary RatingsIe
6.3
6.4
6.6
6.7
7.2
I s l
5.7
5.4
5.6
5.8
6.4
Is2
7.1
7.5
7.6
7.6
7.9
Summary Rating Is1: 5 Year Periods8
CO
6.45.7 5 4 5.6 a.a j _mil1975 1980 1985 1990 1993-95Year
Components of Economic FreedomI. Money and Inflation(a) Annual Money Growth (last 5 yrs.)(b) Inflation Variablity (last 5 yrs.)
(c) Ownership of Foreign Currency
(d) Maint. of Bank Account Abroad
19758.8
6 (7.9)10 (0.7)
10
10
1980
9.1
8
9
10
10
(3.9)(1.7)
19859.1
8
9
10
10
(4.9)(1.9)
19909.4
8
10
10
10
(4.4)(1.0)
1993-959.4
9
9
10
10
(2.6)(1.7)
II. Government Operation(a) Govern. Consumption (% of GDP)(b) Government Enterprises(c) Price Controls(d) Entry Into Business
(e) Legal System(f) Avoidance of Neg. Interest Rates
HI. Takings(a) Transfers and Subsidies (% of GDP)
(b) Marginal Tax Rates (Top Rate)(c) Conscription
IV. International Sector(a) Taxes on International Trade (Avg.)(b) Black Market Exchange Rates (Prem.)(c) Size of Trade Sector (% of GDP)(d) Capital Transactions with Foreigners
4.8
3
6
-
-
-
6
2.3
0
50
8.29
10
9
5
(16.9)
(25.6)
(46)
(1.3)
(0)
(92.2)
5.73
6
-
-
-
10
0.0
0
0
0
9.110
10
8
8
(17.4)
(29.4)
(72)
(0.0)
(0)(100.9)
6.14
6
-
-
-
10
0.0
0
0
0
9.510
10
10
8
(15.7)
(31.6)
(72)
(0.0)
(0)(116.8)
6.65
6
7
-
-
10
0.0
0
0
0
9.3
10
10
9
8
(14.5)
(28.7)
(72)
(0.0)
(0)(103.7)
7.356
7
7.5
10
10
0.9
0
20
9.7
10
10
8
10
(14.9)
(30.7)
(60)
(0.0)
(0)(100.0)
176
www.fraserinstitute.org

NETHERLANDS
Part 2: Recent Economic Indicators:Population 1994: 15.4
(in millions)
Annual Rate of Change (1980-94): 0.6%
Real Per Capita GDP :(in 1985 U.S. dollars)
Avg. Growth Rate: 1980-901985-94
1994= $13,505
1.5%
1.7%
Economic Indicators:Change in Real GDP: Aggregate
: Per Capita
Inflation Rate (CPI)Change in Money Supply: (Ml)
: (M2)
Investment/GDP RatioCentral Government Budget
Deficit or Surplus (% of GDP)
Unemployment Rate
19873.3
2.7
-0.7
6.9
3.8
20.7
-3.1
9.6
19882.6
2.0
0.7
7.5
3.2
21.4
-4.2
9.1
19894.7
4.1
1.1
5.5
8.8
22.6
-4.3
8.3
1990
3.9
3.4
2.5
5.5
9.0
22.2
-4.8
7.5
19912.3
1.5
3.9
3.6
5.4
21.1
-2.8
7.0
19921.8
1.2
3.7
5.5
5.2
20.8
-3.4
6.7
19930.4
-0.22.1
7.8
5.1
19.7
-1.0
8.3
19942.5
1.9
2.6
0.9
0.2
19.7
0.0
7.8
During 1975-1990, the Isl economic freedom summary rating of the Netherlandsfluctuated within a narrow range between 5.5 and 5.8. During the 1990s, there has been someupward movement. Based on the average of our three economic freedom indexes, the Netherlandsranked 1 lth (between Japan and Germany) in 1993-1995. The Isl summary index ranks it a littlelower—in a tie with Bolivia and Germany for 18th place.
Netherlands gets exceedingly high marks in both the money and international areas. Thejustification for these high ratings is clear. The growth rate of the money supply has been low andrelatively stable. Not surprisingly, the inflation rate has followed suit. Citizens are allowed tomaintain foreign currency bank accounts both domestically and abroad. Tariffs are negligible; thecurrency is fully convertible; the trade sector is large; and there are virtually no restrictions on themobility of capital.
Even in the government operations area, the rating of the Netherlands is not bad. Whilegovernment consumption is large, this is offset by a strong legal system, competitive businesspractices, and a credit market that is well integrated with the global economy. In contrast with theother areas, the rating of the Netherlands in the takings area is one of the lowest in the world.Netherlands combines a huge transfer sector (only Sweden transfers a larger share of its GDPaway from those who generate it), with high taxes (the top marginal tax rate is currently 60%,down from the 72% figure of 1990), and conscription. Typically, a large transfer sector leads totwo unpleasant side effects—large budget deficits and high unemployment rates. To date, theseeffects have been moderate. However, if the current transfer policies remain in place, thesenegative side effects will almost certainly become more severe in the future.
177
www.fraserinstitute.org

NEW ZEALAND
Part 1: The Economic Freedom Ratings for the Components and Various Area andSummary Indexes: 1975, 1980, 1985, 1990 and 1993-95.(The numbers in parentheses indicate actual values for the components).
1975
1980
1985
1990
1993-95
Ie
4.5
5.1
4.6
6.4
8.4
Summary RatingsI s l
4.3
4.8
4.1
6.0
8.0
Is24.6
5.6
4.9
7.29.1
Summary Rating Is1: 5 Year Periods!10
1975 1980 1985 1990 1993-95
Year
Components of Economic Freedom 1975 1980 1985 1990 1993-95I. Money and Inflation
(a) Annual Money Growth (last 5 yrs.)
(b) Inflation Variablity (last 5 yrs.)
(c) Ownership of Foreign Currency
(d) Maint. of Bank Account Abroad
2.93 (11.8)
6 (3.7)
0
0
5.17900
(5.5)
(2.1)
3.55600
(8.6)
(3.1)
5.3
1 (40.2)
4 (5.0)
10
10
9.4
8 (3.4)
10 (0.8)
10
10
II. Government Operation(a) Govern. Consumption (% of GDP)
(b) Government Enterprises
(c) Price Controls
(d) Entry Into Business
(e) Legal System
(f) Avoidance of Neg. Interest Rates
III. Takings(a) Transfers and Subsidies (% of GDP)
(b) Marginal Tax Rates (Top Rate)
(c) Conscription
IV. International Sector(a) Taxes on International Trade (Avg.)
(b) Black Market Exchange Rates (Prem.)
(c) Size of Trade Sector (% of GDP)
(d) Capital Transactions with Foreigners
5.0
4
6
-
-
-
-
3.1
1
3
10
6.28
6
5
5
(15.6)
(20.2)
(60)
(2.4)
(5)(55.9)
4.5
26
-
-
-
6
2.7
1
210
7.38
10
5
5
(17.9)
(21.9)
(60)
(2.5)
(0)(61.8)
5.7
4
6
-
-
-
8
1.71
0
10
6.38
6
6
5
(16.2)
(20.6)
(66)
(2.0)
(4)
(64.4)
6.7
3
6
9
-
-
10
4.6
0
7
10
7.3
8
6
4
10
(17.0)
(27.5)
(33)
(1.7)
(5)(54.0)
8.7
5
8
10
10
10
10
5.4
27
10
8.9
9
10
5
10
(15.2)
(15.7)
(33)
(1.2)
(0)(59.4)
178
www.fraserinstitute.org

NEW ZEALAND
Part 2: Recent Economic Indicators:Population 1994: 3.5
(in millions):
Annual Rate of Change (1980-94): 0.8%
Real Per Capita GDP :(in 1985 U.S. dollars)
Avg. Growth Rate:
1994=
1980-90=1985-94=
$12,240
1.0%0.8%
Economic Indicators:
Change in Real GDP: Aggregate
: Per Capita
Inflation Rate (CPI)Change in Money Supply: (Ml)
: (M2)Investment/GDP RatioCentral Government Budget
Deficit (-) or Surplus (+)
As a Percent of GDP
Unemployment Rate
1987
-0.8
-1.615.7
30.6
31.521.9
+ 1.0
4.1
1988
1.2
0.46.4
44.8
-8.620.0
+2.0
5.6
1989-1.0
-1.85.7
39.7
8.923.4
7.1
1990
0.2
-0.66.1
27.7
62.221.2
+4.0
7.7
1991-2.0
-2.8
2.61.3
30.417.4
+ 1.9
10.2
19921.6
0.81.02.7
11.719.5
-2.3
10.3
1993
5.2
4.41.33.7
3.818.4
0.0
9.5
19946.0
4.21.7
10.3
7.7 a
a First 9 months of the year.
In 1985, New Zealand was plagued by an expansionary and unstable monetary policy,restrictions on foreign currency holdings, high marginal tax rates, a large transfer sector, exchangerate controls, and capital market restrictions. Much has changed in the last decade. Monetaryreform—the central bank has a legislative mandate to keep the inflation rate low—has led to adramatic improvement in price stability. Foreign currency bank accounts are now legal. (Note:New Zealand's rating in the monetary area rose from 2.5 in 1985 to 9.4 in 1995.) The topmarginal tax rate has been sliced from 66% to 33%. Exchange rate controls have been removedand the New Zealand dollar is now fully convertible.
Propelled by these changes, the Isl summary index of New Zealand rose from 4.1 in 1975to 8.0 in 1995, the largest increase in the world during this time period. New Zealand now ranksas the third most free economy, behind only Hong Kong and Singapore. Governmentconsumption expenditures and the transfer sector are still quite large, but even here some progresshas been made. These policies are now beginning to pay off. After years of sluggish growth, realGDP increased at an annual rate of 5.2% in 1993 and 6% in 1994 (see Part 2, above). Inflationhas fallen to an annual rate of near 1% and the unemployment rate is falling. If New Zealandstays on its current path, our analysis suggests its economic future will be bright.
179
www.fraserinstitute.org

NICARAGUA
Part 1: The Economic Freedom Ratings for the Components and Various Area andSummary Indexes: 1975, 1980, 1985, 1990 and 1993-95.(The numbers in parentheses indicate the actual values for the components.)
19751980
198519901993-95
Ie6.0
3.5
1.21.5
2.7
Summary RatingsIsl
6.4
3.6
1.8
2.0
3.3
Is25.5
3.6
0.6
1.1
2.2
Summary Rating Is1: 5 Year Periods
3.3
1975 1980 1985 1990 1993-95Year
Components of Economic Freedom 1975 1980 1985 1990 1993-95
I. Money and Inflation(a) Annual Money Growth (last 5 yrs.)(b) Inflation Variablity (last 5 yrs.)(c) Ownership of Foreign Currency
(d) Maint. of Bank Account Abroad
II. Government Operation(a) Govern. Consumption (% of GDP)
(b) Government Enterprises(c) Price Controls
(d) Entry Into Business(e) Legal System(f) Avoidance of Neg. Interest Rates
III. Takings(a) Transfers and Subsidies (% of GDP)
(b) Marginal Tax Rates (Top Rate)(c) Conscription
IV. International Sector(a) Taxes on International Trade (Avg.)
(b) Black Market Exchange Rates (Prem.)(c) Size of Trade Sector (% of GDP)
(d) Capital Transactions with Foreigners
5.23
210
10
7.59
6
-
-
-
-
7.98
10
0
4.9
6
4
4
5
(12.3)(8.8)
(9.1)
(2.4)
(21)
(4.9)
(21)(65.7)
4.3
1
1
10
10
3.6
1
6
-
-
-
-
5.1
7
5
0
1.4
21
3
0
(26.6)(15.9)
(19.7)
(4.1)
(50)
(8.7)
(91)(67.5)
0.0
0
0
0
0
0.00
0
-
-
-
-
4.3
5
5
0
1.1
3
0
1
0
(70.0)(60.3)
(35.7)
(6.2)(50)
(7.4)
(382)(36.5)
0.0
0(2073.5)
0(4853.2)0
0
0.00
0
-
-
-
0
3.8
5
-
0
3.5
6
4
4
0
(32.6)
(6.8)
(4.3)
(10)(68.5)
0.0
0 (322.9)0(2875.9)
0
0
2.14
0
25.0
0
0
7.15
8
10
2.7
26
3
0
(15.9)
(6.2)(30)
(8.0)
(4)
(65.2)
180
www.fraserinstitute.org

NICARAGUA
Part 2: Recent Economic Indicators:Population 1994: 4.4
(in millions)
Annual Rate of Change (1980-94): 3.4%
Real Per Capita GDP :(in 1985 U.S. dollars)
Avg. Growth Rate:
1994=
1980-90=1985-94=
$1,165
-3.8%-3.8%
Economic Indicators:Change in Real GDP: Aggregate
: Per Capita
Inflation Rate (CPI)Change in Money Supply: (Ml)
:(M2)Investment/GDP RatioCentral Government Budget
Deficit (-) or Surplus (+)
As a Percent of GDP
Unemployment Rate
1987
-0.7
-4.1911.9562.8
487.115.8
1988-12.4
-15.810205.0
--
26.8
-23.7
1989-1.7
-4.14770.42403.0
-
27.2
-1.9
1990-0.1
-3.57485.2
--
19.3
-11.6
1991
-0.2-3.6
2742.21330.0
1510.019.7
19920.4
-3.020.3
11.520.017.4
-2.1
1993-0.9
-4.3-
-4.6
25.221.7
+0.3
1994
3.20.0
-
36.1
61.3
22.2
The Nicaraguan experiment of the last two years provides a vivid portrait of what happenswhen economic freedom is lost. In almost every area, policies that conflicted with economicfreedom were adopted. The government financed more and more of its expenditures with moneycreation. Soaring money growth (the annual growth rate of the money supply rose from 12%during 1970-1975, to 26% in 1975-1980, to 70% in 1980-1985, and to more than 2000% during1985-1990) predictably led to hyperinflation. The government responded with price controls,higher taxes, and more spending. Government consumption expenditures increased from 9% ofGDP in 1975 to 36% in 1985. By the mid-1980s, government enterprises dominated the economyand the top marginal tax rate had been pushed to 50%, up from 21% in 1975. Higher tariffs,rigid exchange rate controls (the black market exchange rate premium rose from 21% in 1975 to382% in 1985), and capital market controls were also a part of this political economy experiment.
The results were disastrous. Measured in 1985 dollars, the per capita income of Nicaraguafell from $2,531 in 1975 to $1,165 in 1994. In 1975, Nicaragua's per capita income was nearlyas large as that of Chile; by 1994 it was only one-fifth as large. In the early 1990s, a few modeststeps toward economic freedom have been taken, but much more will be required to restore theconfidence of citizens and foreigners alike.
181
www.fraserinstitute.org

NIGERIA
Part 1: The Economic Freedom Ratings for the Components and Various Area andSummary Indexes: 1975, 1980, 1985, 1990 and 1993-95.(The numbers in parentheses indicate the actual values for the components.)
19751980
1985
19901993-95
Summary RatingsIe
3.2
3.0
3.8
3.3
3.5
I s l
3.3
2.8
4.3
3.3
3.7
Is2
2.5
2.7
2.9
2.9
2.7
Summary Rating Is1: 5 Year Periods
1975 1980 1985 1990 1993-95
Year
Components of Economic Freedom 1975 1980 1985 1990 1993-95
I. Money and Inflation(a) Annual Money Growth (last 5 yrs.)
(b) Inflation Variablity (last 5 yrs.)
(c) Ownership of Foreign Currency(d) Maint. of Bank Account Abroad
II. Government Operation(a) Govern. Consumption (% of GDP)
(b) Government Enterprises
(c) Price Controls(d) Entry Into Business
(e) Legal System
(f) Avoidance of Neg. Interest Rates
III. Takings(a) Transfers and Subsidies (% of GDP)
(b) Marginal Tax Rates (Top Rate)
(c) Conscription
IV. International Sector(a) Taxes on International Trade (Avg.)
(b) Black Market Exchange Rates (Prem.)(c) Size of Trade Sector (% of GDP)(d) Capital Transactions with Foreigners
0.6
1
1
0
0
4.77
4
-
-
-
2
4.5
8
0
10
2.74
26
0
(25.4)(15.7)
(12.6)
(2.9)(75)
(6.6)
(43)
(41.2)
3.3
1
9
0
0
3.9
7
2---
2
2.2-
0
10
2.021
7
0
(25.5)
(1.5)
(11.9)
(70)
(8.5)
(72)(48.0)
3.1
7
3
0
0
4.0
6
2
-
-
-
4
6.7
10
3
10
2.36
0
3
0
(6.8)
(6.0)
(13.5)
(1.4)
(55)
(5.1)
(270)(28.5)
0.9
21
0
0
3.7
7
2
4
-
-
0
3.8
-
210
4.3
6
3
10
0
(20.2)(19.3)
(11.4)
(55)
(4.0)
(23)(64.6)
0.6
1
1
0
0
4.0
10
2
4
5.0
0
0
7.7-
7
10
2.3
-
0
10
0
(30.0)
(17.7)
(5.3)
(35)
(277)
(73.7)
182
www.fraserinstitute.org

NIGERIA
Part 2: Recent Economic Indicators:Population 1994: 107.9
(in millions)
Annual Rate of Change (1980-84): 3.0%
Real Per Capita GDP :(in 1985 U.S. dollars)
Avg. Growth Rate:
1994=
1980-90=1985-94=
$960
-2.0%1.1%
Economic Indicators:
Change in Real GDP: Aggregate
: Per CapitaInflation Rate (CPI)
Change in Money Supply: (Ml)
:(M2)Investment/GDP RatioCentral Government Budget
Deficit (-) or Surplus (+)
As a Percent of GDP)
Unemployment Rate
1987
-0.5
-3.511.3
0.6
7.78.8
-8.9
19889.96.9
54.5
35.7
32.96.5
19897.4
4.450.5
37.8
22.5
8.2
1990
8.2
5.27.4
25.9
21.811.9
1991
4.7
1.713.047.8 --
42.8 --11.0
19923.6
0.644.6
—
—
10.7
19932.6
-0.4
57.2
12.8
1994
1.3
-1.7
9.4
The economic freedom of this resource rich country was low throughout the 1975-1995period and there are few signs of improvement. Monetary instability, insecure property rights,rigid exchange rate controls, and capital market restrictions continue to undermine theNigerian economy. Excessive monetary expansion (Ml grew by 30% annually during the mostrecent five-year period) has caused high and variable rates of inflation. In 1990, the inflationrate was 7%, but it rose to 45% in 1992 and 57% in 1993. It is difficult for either businessesor households to plan for the future in this environment. In addition the economy ischaracterized by inefficient state enterprises and legal restrictions (and subsidies) that retardcompetition from private firms. Nigeria's 1994 black market exchange rate premium (277%)was the second highest among the countries in our study. A highly politicized economy of thistype almost inevitably leads to corruption that undermines the confidence of both domesticsand foreigners. This is precisely what has happened to the Nigerian economy.
Measured in 1985 dollars, the per capita income of Nigeria has fallen from $1,438 in1980 to $960 in 1994. Unless the current policies that are stifling both economic freedom andprosperity are reversed, the economic stagnation will almost surely continue.
183
www.fraserinstitute.org

NORWAY
Part 1: The Economic Freedom Ratings for the Components and Various Area andSummary Indexes: 1975, 1980, 1985, 1990 and 1993-95.(The numbers in parentheses indicate the actual values for the components.)
19751980198519901993-95
Summary Ratings
Ie3.83.84.35.36.3
Isl3.6
3.4
3.9
4.8
5.7
Is23.8
4.0
4.4
6.1
7.2
Summary Rating Is1: 5 Year Periods8
D)
1975 1980 1985 1990 1993-95Year
Components of Economic Freedom 1975 1980 1985 1990 1993-95
I. Money and Inflation(a) Annual Money Growth (last 5 yrs.)
(b) Inflation Variablity (last 5 yrs.)
(c) Ownership of Foreign Currency(d) Maint. of Bank Account Abroad
II. Government Operation(a) Govern. Consumption (% of GDP)
(b) Government Enterprises(c) Price Controls
(d) Entry Into Business
(e) Legal System(f) Avoidance of Neg. Interest Rates
III. Takings(a) Transfers and Subsidies (% of GDP)
(b) Marginal Tax Rates (Top Rate)
(c) Conscription
IV. International Sector(a) Taxes on International Trade (Avg.)
(b) Black Market Exchange Rates (Prem.)(c) Size of Trade Sector (% of GDP)
(d) Capital Transactions with Foreigners
4.24
9
0
0
1.51
2----
0.0
-
0
0
6.9
9
8
9
2
(10.2)
(2-1)
(19.3)
(74)
(0.5)
(1)(90.3)
5.410
7
0
0
2.8
22
-
-
-
6
0.4
1
0
0
6.0
9
6
7
2
(1.6)(3.0)
(18.8)
(22.1)(75)
(0.3)
(3)(88.5)
2.93
6
0
0
3.7
22---
10
0.9
1
1
0
8.4
10
10
8
5
(12.7)(3.3)
(18.5)
(21.4)
(64)
(0.3)
(0)(86.0)
6.3
26
10
10
3.8
1
25
-
-
10
1.40
3
0
8.8
10
10
6
8
(17.1)(3.5)
(21.1)
(27.3)
(54)
(0.3)
(0)(81.1)
8.8
7
9
10
10
5.81
27
7.5
10
10
1.9
0
4
0
9.1-
10
6
10
(5.7)
(1.9)
(21.9)
(27.0)
(42)
(0)(79.0)
184
www.fraserinstitute.org
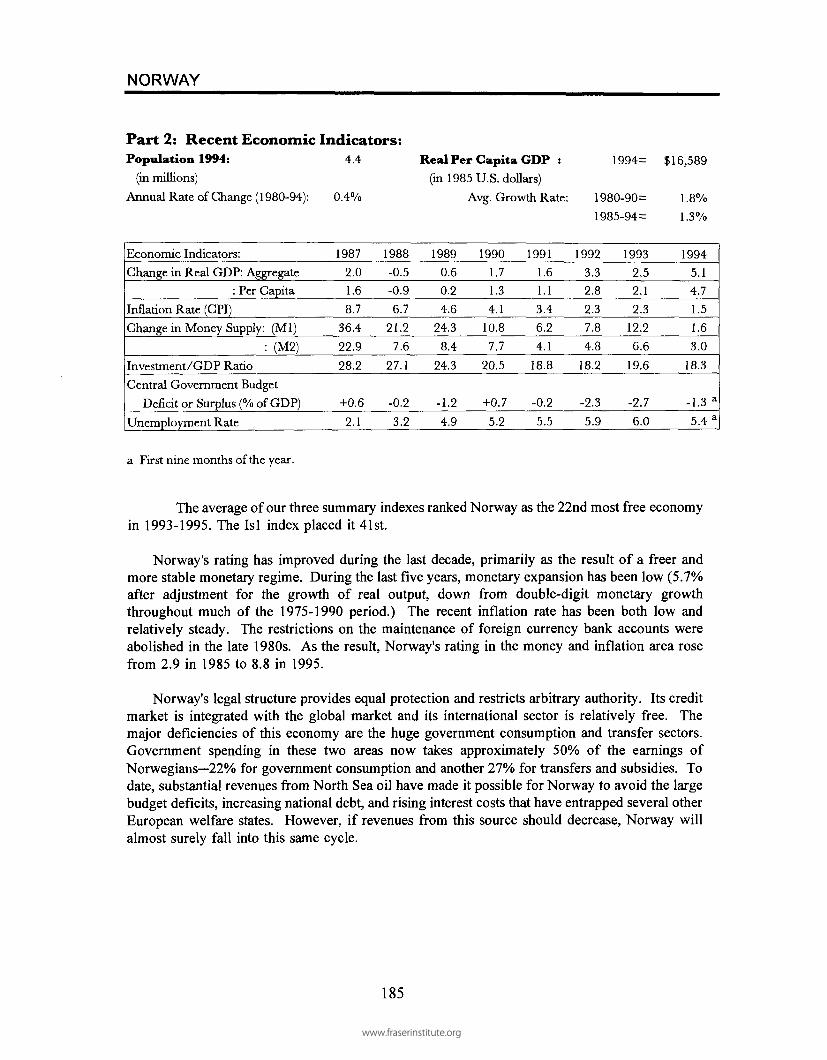
NORWAY
Part 2: Recent Economic Indicators:Population 1994: 4.4
(in millions)
Annual Rate of Change (1980-94): 0.4%
Real Per Capita GDP :(in 1985 U.S. dollars)
Avg. Growth Rate:
1994=
1980-90=1985-94=
$16,589
1.8%1.3%
Economic Indicators:
Change in Real GDP: Aggregate: Per Capita
Inflation Rate (CPI)
Change in Money Supply: (Ml)
: (M2)Investment/GDP Ratio
Central Government Budget
Deficit or Surplus (% of GDP)
Unemployment Rate
19872.0
1.6
8.7
36.4
22.9
28.2
+0.6
2.1
1988-0.5-0.96.7
21.27.6
27.1
-0.2
3.2
19890.6
0.2
4.6
24.3
8.4
24.3
-1.24.9
19901.7
1.3
4.1
10.87.7
20.5
+0.7
5.2
19911.6
1.1
3.4
6.2
4.1
18.8
-0.25.5
19923.3
2.8
2.3
7.8
4.8
18.2
-2.3
5.9
19932.5
2.1
2.3
12.26.6
19.6
-2.7
6.0
19945.1
4.7
1.5
1.6
3.0
18.3
-1.3 a
5.4 a
a First nine months of the year.
The average of our three summary indexes ranked Norway as the 22nd most free economyin 1993-1995. The Isl index placed it 41st.
Norway's rating has improved during the last decade, primarily as the result of a freer andmore stable monetary regime. During the last five years, monetary expansion has been low (5.7%after adjustment for the growth of real output, down from double-digit monetary growththroughout much of the 1975-1990 period.) The recent inflation rate has been both low andrelatively steady. The restrictions on the maintenance of foreign currency bank accounts wereabolished in the late 1980s. As the result, Norway's rating in the money and inflation area rosefrom 2.9 in 1985 to 8.8 in 1995.
Norway's legal structure provides equal protection and restricts arbitrary authority. Its creditmarket is integrated with the global market and its international sector is relatively free. Themajor deficiencies of this economy are the huge government consumption and transfer sectors.Government spending in these two areas now takes approximately 50% of the earnings ofNorwegians—22% for government consumption and another 27% for transfers and subsidies. Todate, substantial revenues from North Sea oil have made it possible for Norway to avoid the largebudget deficits, increasing national debt, and rising interest costs that have entrapped several otherEuropean welfare states. However, if revenues from this source should decrease, Norway willalmost surely fall into this same cycle.
185
www.fraserinstitute.org
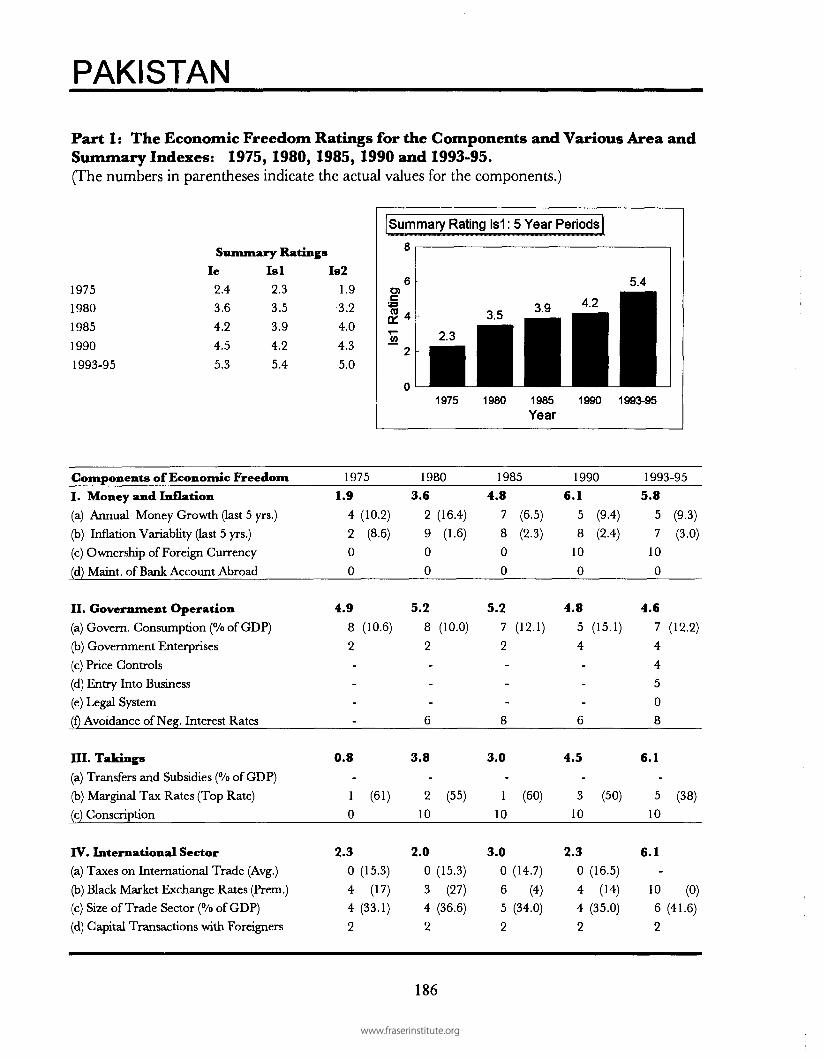
PAKISTAN
Part 1: The Economic Freedom Ratings for the Components and Various Area andSummary Indexes: 1975, 1980, 1985, 1990 and 1993-95.(The numbers in parentheses indicate the actual values for the components.)
19751980
1985
1990
1993-95
Summary RatingsIe
2.4
3.6
4.2
4.5
5.3
I s l
2.3
3.5
3.9
4.2
5.4
Is2
1.9
3.2
4.0
4.3
5.0
Summary Rating Is1: 5 Year Periods
1975 1980 1985 1990 1993-95Year
Components of Economic Freedom 1975 1980 1985 1990 1993-95
I. Money and Inflation(a) Annual Money Growth (last 5 yrs.)
(b) Inflation Variablity (last 5 yrs.)(c) Ownership of Foreign Currency
(d) Maint. of Bank Account Abroad
II. Government Operation(a) Govern. Consumption (% of GDP)
(b) Government Enterprises
(c) Price Controls(d) Entry Into Business
(e) Legal System(f) Avoidance of Neg. Interest Rates
III. Takings(a) Transfers and Subsidies (% of GDP)(b) Marginal Tax Rates (Top Rate)
(c) Conscription
IV. International Sector(a) Taxes on International Trade (Avg.)
(b) Black Market Exchange Rates (Prem.)(c) Size of Trade Sector (% of GDP)(d) Capital Transactions with Foreigners
1.9
4
20
0
4.9
8
2
-
-
-
-
0.8
-
1
0
2.30
4
4
2
(10.2)(8.6)
(10.6)
(61)
(15.3)
(17)
(33.1)
3.6
29
0
0
5.28
2-
--
6
3.8
-
2
10
2.00
3
4
2
(16.4)
(1.6)
(10.0)
(55)
(15.3)
(27)
(36.6)
4.8
7
8
0
0
5.27
2
-
-
-
8
3.0
-
1
10
3.0
0
6
5
2
(6.5)
(2.3)
(12.1)
(60)
(14.7)
(4)(34.0)
6.15
8
10
0
4.8
5
4
-
-
-
6
4.5
-
3
10
2.30
4
4
2
(9.4)
(2.4)
(15.1)
(50)
(16.5)
(14)
(35.0)
5.85
7
10
0
4.6
74
4
5
0
8
6.1
-
5
10
6.1
-
10
6
2
(9.3)
(3.0)
(12.2)
(38)
(0)(41.6)
186
www.fraserinstitute.org

PAKISTAN
Part 2: Recent Economic Indicators:Population 1994: 126.3
(in millions)
Annual Rate of Change (1980-84): 3.1%
Real Per Capita GDP :
(in 1985 U.S. dollars)
Avg. Growth Rate:
1994= $1,435
1980-90= 3.0%
1985-94= 2.3%
Economic Indicators:
Change in Real GDP: Aggregate
: Per Capita
Inflation Rate (CPI)
Change in Money Supply: (Ml)
: (M2)
Investment/GDP Ratio
Central Government Budget
Deficit (-) or Surplus (+)
As a Percent of GDP
Unemployment Rate*
1987
6.5
3.4
4.7
18.8
14.9
19.1
-8.5
3.1
1988
7.6
4.5
8.8
15.2
12.1
18.0
-6.3
3.1
1989
5.0
1.9
7.8
11.0
5.7
18.9
-7.4
3.1
1990
4.5
1.4
9.1
16.4
12.4
18.9
-5.4
3.1
1991
5.5
2.4
11.8
19.0
15.0
19.0
-7.6
6.3
1992
7.8
4.7
9.5
20.0
24.6
20.1
-7.9
6.3
1993
2.6
-0.5
9.4
8.2
23.4
20.4
-7.4
-
1994
4.0
0.9
12.5
10.9
16.0
19.9
-6.0
-
* From the United Nations, Statistical Yearbook.
Pakistan's summary economic freedom rating (Isl) improved from a very low 2.3 in 1975 to5.4 in 1993-95. Most of the improvement came in the 1990's. In terms of the rankings, Pakistanmoved from 93rd in 1975 to 50th in the mid-1990s (or 51st based on the average of the three ratings).
The improvement in Pakistan's economic freedom rating can be attributed to a few componentsin the index. First, top marginal tax rates have been reduced from 61% in 1975 (and 60% in 1985)to the current rate of 38%. A significant liberalization of the exchange rate system has reduced theblack market exchange rate premium from a high of 27% in 1980 to zero (and a rating of 10) in1993-94. Some of the increase in the summary rating for 1993-95 may reflect the fact that the Taxeson International Trade (IVa) datum was not available for Pakistan in that year. In all the previousperiods, this component received a zero rating. Its absence in the most recent period may haveartificially inflated the summary rating slightly.
It is clear that there has been a slight move toward economic liberalization in Pakistan overthe last two decades. This improvement has allowed Pakistan to report modest, if unremarkable,annual growth rate of per capita GDP of approximately 2.5%. For Pakistan to make the move intothe modern market economy like Malaysia, Thailand, and Singapore, it must improve its regulatoryenvironment that restricts citizens from holding bank accounts abroad, restricts prices and market entry,fails to treat citizens equally before the law, and interferes with the capital transactions with foreigners.
187
www.fraserinstitute.org

PERU
Part 1: The Economic Freedom Ratings for the Components and Various Area andSummary Indexes: 1975, 1980, 1985, 1990 and 1993-95.(The numbers in parentheses indicate the actual values for the components.)
19751980
19851990
1993-95
Ie
3.1
3.0
3.2
3.4
5.4
Summary RatingsIsl3.7
3.4
3.4
4.0
5.9
Is22.1
2.0
2.22.4
5.1
Summary Rating Is1: 5 Year Periods
1975 1980 1985 1990 1993-95Year
Components of Economic Freedom 1975 1980 1985 1990 1993-95
I. Money and Inflation(a) Annual Money Growth (last 5 yrs.)
(b) Inflation Variablity (last 5 yrs.)
(c) Ownership of Foreign Currency
(d) Maint. of Bank Account Abroad
II. Government Operation(a) Govern. Consumption (% of GDP)(b) Government Enterprises
(c) Price Controls(d) Entry Into Business(e) Legal System
(f) Avoidance of Neg. Interest Rates
III. Takings(a) Transfers and Subsidies (% of GDP)(b) Marginal Tax Rates (Top Rate)(c) Conscription
IV. International Sector(a) Taxes on International Trade (Avg.)
(b) Black Market Exchange Rates (Prem.)
(c) Size of Trade Sector (% of GDP)(d) Capital Transactions with Foreigners
1.9
24
0
0
5.57
4
-
-
-
-
5.5
9
4
0
1.7
1
222
(18.6)(5.9)
(12.4)
(1.9)(51)
(9.5)
(56)(32.8)
0.6
1
1
0
0
6.0
8
4
-
-
-
-
4.5
9
2
0
2.61
4
4
2
(39.1)(17.5)
(10.5)
(1.9)(65)
(10.6)
(18)(41.6)
1.9
0
0
10
0
6.4
9
4
-
-
-
-
3.6
9
0
0
2.3224
2
(98.4)(38.1)
(9.5)
(1.8)(65)
(8.3)
(51)(39.4)
1.90
0
10
0
4.4
10
4
2--
0
5.1
8
4
0
3.6
6
4
1
2
(690.2)(2302.8)
(6.4)
(3.0)(45)
(3.9)
(16)(26.8)
3.6
0
0
10
10
5.810
6
6
7.5
0
2
6.9
8
8
0
6.3
6
8
1
8
(249.1)
(2380.4)
(5.7)
(2.8)(30)
(4.4)
(1)(22.4)
188
www.fraserinstitute.org

PERU
Part 2: Recent Economic Indicators:Population 1994: 23.3
(in millions)
Annual Rate of Change (1980-94): 2.1 %
Real Per Capita GDP :
(in 1985 U.S. dollars)
Avg. Growth Rate:
1994=
1980-90=
1985-94=
$2,390
-2.8%
-0.7%
Economic Indicators:
Change in Real GDP: Aggregate
: Per Capita
Inflation Rate (CPI)
Change in Money Supply: (Ml)
:(M2)Investment/GDP Ratio
Central Government Budget
Deficit (-) or Surplus (+)
As a Percent of GDP
Unemployment Rate a
1987
8.3
6.2
85.8
96.2
79.1
22.0
-6.2
4.8
1988
-8.2
-10.3
667.0
261.2
271.0
24.2
-3.6
1989
-11.0
-13.1
3398.7
1585.5
2081.3
17.9
-5.6
7.9
1990
-4.3
-6.4
7481.7
4930.1
4825.2
15.5
-3.7
1991
2.8
0.7
409.5
476.4
628.3
16.6
-1.4
5.8
1992
-2.3
-4.4
73.5
78.2
107.2
16.6
-1.8
1993
6.4
4.3
48.6
76.5
98.5
18.5
-0.8
1994
13.0
11.0
23.7
30.7
46.0
20.4
a From the United Nations, Statistical Yearbook.
Based on the average of our three indexes, Peru's 1993-95 economic freedom rating placedit 47th among the 103 countries in our study. This was a substantial improvement. During the lastdecade and particularly during the last five years, Peru has made dramatic moves toward a freereconomy. As the accompanying data show, gains have been registered. Exchange rate controls havebeen relaxed (the black market premium fell from 51% in 1985 to 16% in 1990 and 1% in 1994).Tariffs have been reduced and capital market controls relaxed. The top marginal tax rate was cutfrom 65% in 1985 to 45% in 1990 and 30% in 1994.
While some progress has been made—monetary expansion was reduced from the colossalfigures of 1988-91 (see above)—the growth rate of the money supply is still much too rapid. Likeseveral other Latin American countries with a history of inflation, Peru's monetary policy needs acredible anchor. There are several ways this could be accomplished, including the establishment ofa currency board (as in the case of Hong Kong) or the subjection of one's monetary policy to themaintenance of a pegged exchange rate (as Argentina has done). Unless institutional change of thistype is taken, it will be difficult to convince decision-makers that monetary and price stability areimportant policy objectives. Without this credibility, the economy will fail to meet its full potential.
The changes to date are paying off. After years of decline (real per capita GDP fell from$3164 in 1975 to $2092 in 1992, a reduction of 34%), Peru achieved robust growth during 1993-1994. In fact, its 13% growth rate of real GDP in 1994 was probably the highest in the world. Ifadditional steps are taken to achieve monetary stability and expand economic freedom, the long-termprospects for this economy are good.
189
www.fraserinstitute.org

PHILIPPINES
Part 1: The Economic Freedom Ratings for the Components and Various Area andSummary Indexes: 1975, 1980, 1985, 1990 and 1993-95.(The numbers in parentheses indicate the actual values for the components.)
1975
19801985
19901993-95
Summary RatingsIe
4.4
4.7
4.7
5.26.1
I s l
4.6
4.8
4.9
5.6
6.2
Is23.6
3.8
3.8
4.3
5.7
Summary Rating Is1: 5 Year Periods
8
IIH(0
64.6 4.8 4.9
5.6
16.2
11975 1980 1985 1990 1993-95
Year
Components of Economic Freedom 1975 1980 1985 1990 1993-95
I. Money and Inflation(a) Annual Money Growth (last 5 yrs.)(b) Inflation Variablity (last 5 yrs.)
(c) Ownership of Foreign Currency(d) Maint. of Bank Account Abroad
H. Government Operation(a) Govern. Consumption (% of GDP)
(b) Government Enterprises
(c) Price Controls
(d) Entry Into Business(e) Legal System
(f) Avoidance of Neg. Interest Rates
HI. Takings(a) Transfers and Subsidies (% of GDP)(b) Marginal Tax Rates (Top Rate)(c) Conscription
IV. International Sector(a) Taxes on International Trade (Avg.)(b) Black Market Exchange Rates (Prem.)(c) Size of Trade Sector (% of GDP)
(d) Capital Transactions with Foreigners
1.63
20
0
8.18
4
-
-
-
8
5.4
10
3
0
2.9
0
4
8
2
(13.7)
(9.2)
(10.7)
(0.8)(56)
(13.4)(13)
(48.1)
3.6
4
7
0
0
6.8
9
4
-
-
-
8
4.5
10
1
0
4.7
4
6
8
2
(11.1)
(2-9)
(9.1)
(1.1)(70)
(6.8)
(3)(52.0)
2.16
1
00
6.3
10
4
-
-
-
4
5.8
10
1
10
4.7
5
5
8
2
(8.0)(16.4)
(7.6)
(0.2)
(60)
(6.2)
(7)(45.8)
2.626
0
0
5.0
8
4
2-
-8
8.6
10
7
10
4.7
4
5
10
2
(18.7)
(3.3)
(10.1)
(0.9)(35)
(6.6)
(7)(61.3)
6.63
6
10
10
4.9
9
4
3
50
10
8.6
10
710
5.0
28
10
2
(12.4)(3.7)
(8.6)
(0.8)(35)
(8.2)
(1)(62.3)
190
www.fraserinstitute.org

PHILIPPINES
Part 2: Recent Economic Indicators:Population 1994: 67.3 Real Per Capita GDP :
(in millions) (in 1985 U.S. dollars)
Annual Rate of Change (1980-94): 2.4% Avg. Growth Rate:
1994= $1,720
1980-90= -0.7%
1985-94= 0.8%
Economic Indicators:
Change in Real GDP:Aggregate
: Per Capita
Inflation Rate (CPI)
Change in Money Supply: (Ml)
:(M2)Investment/GDP Ratio
Central Government Budget
Deficit (-) or Surplus (+)
As a Percent of GDP
Unemployment Rate
1987
4.3
1.9
3.8
24.6
13.0
18.0
-2.5
-
1988
6.8
4.4
8.8
19.2
21.3
18.8
-2.9
10.8
1989
6.2
3.8
12.2
18.9
27.8
18.8
-2.1
9.2
1990
2.7
-0.5
14.1
21.4
25.7
24.8
-3.5
8.3
1991
-0.5
-2.9
18.0
18.2
20.9
20.4
-2.1
10.6
1992
0.6
-1.8
8.9
15.4
12.8
21.3
-1.2
9.8
1993
2.0
-0.5
7.6
15.5
18.7
24.1
-1.5
10.2
1994
4.3
2.0
9.1
13.9
23.8
25.2
+ 1.1
9.4
The average of our three indexes places the Philippines 36th among the countries in ourstudy. Like Indonesia, the Philippines ranks in the middle among the Asian economies, lessfree than Hong Kong, Singapore, Malaysia, Thailand, South Korea, and Taiwan, but more freethan India, Bangladesh, and Nepal.
The economic freedom rating of the Philippines has shown modest but steadyimprovement during the last two decades. The growth of per capita GDP, while still low, haschanged from negative to positive. The primary factors contributing to the rating improvementwere legalization of foreign currency bank accounts, reduction in marginal tax rates (the toprate was reduced from 70% in 1980 and 60% in 1985 to the current rate of 35%), relaxationof exchange rate controls, and an increase in the size of the trade sector. The majordeficiencies are persistent monetary instability, excessive regulation (price controls,discriminatory tariffs, and restrictions on capital movements), and particularly a legal systemthat is often arbitrary and discriminatory. The problem of political favoritism is furthercomplicated by the government enterprises that are spread throughout the economy.
If this economy is going to prosper in the future, it needs the security provided by rule oflaw, a strong dose of deregulation, and far greater reliance on markets.
191
www.fraserinstitute.org

POLAND
Part 1: The Economic Freedom Ratings for the Components and Various Area andSummary Indexes: 1975, 1980, 1985, 1990 and 1993-95.(The numbers in parentheses indicate the actual values for the components.)
19751980
1985
19901993-95
Summary RatingsIe
N/RN/R
2.53.1
4.8
I s l
N/RN/R
2.23.3
4.8
Is2
N/RN/R
2.52.74.7
Summary Ratin g
ing
(0
on
o
6
4
2
o
-
-
-
N/R
1975
Is1:5
N/R
1980
Year Periods |
3.3
• •• •1985 199 0Year
4.8•••1993-95
Components of Economic Freedom 1975 1980 1985 1990 1993-95
I. Money and Inflation 10.0 10.0(a) Annual Money Growth (last 5 yrs.)
(b) Inflation Variablity (last 5 yrs.)
(c) Ownership of Foreign Currency 10 10
(d) Maint. of Bank Account Abroad 10 10
3.9 3.6
1 (20.9) 0 (110.8)
0 (37.4) 0 (178.3)
10 10
10 10
3.60 (70.4)0 (172.3)
10
10
II. Government Operation(a) Govern. Consumption (% of GDP)(b) Government Enterprises
(c) Price Controls(d) Entry Into Business(e) Legal System
(f) Avoidance of Neg. Interest Rates
III. Takings(a) Transfers and Subsidies (% of GDP)
(b) Marginal Tax Rates (Top Rate)(c) Conscription
IV. International Sector(a) Taxes on International Trade (Avg.)(b) Black Market Exchange Rates (Prem.)(c) Size of Trade Sector (% of GDP)
(d) Capital Transactions with Foreigners
0.0
-
0
-
-
-
-
0.0
-
-0
0.0
-
0(3786)-
0
4.4
9 (9.2)0
-
-
-
-
0.0
-
-
0
1.6
-
0 (298)
7 (59.2)0
4.4
9
0
-
-
-
-
0.0
0
-
0
1.1
20
3
0
(9.2)
(27.4)
(8.6)(301)
(35.0)
3.0
9
0
2-
-0
3.8
5
-0
2.9
-5
4
0
(8.3)
(7.2)
(9)(45.8)
5.78
25
7.5
7.5
4
3.1
-
4
0
5.6
-
10
4
2
(10.2)
(45)
(0)(43.5)
192
www.fraserinstitute.org
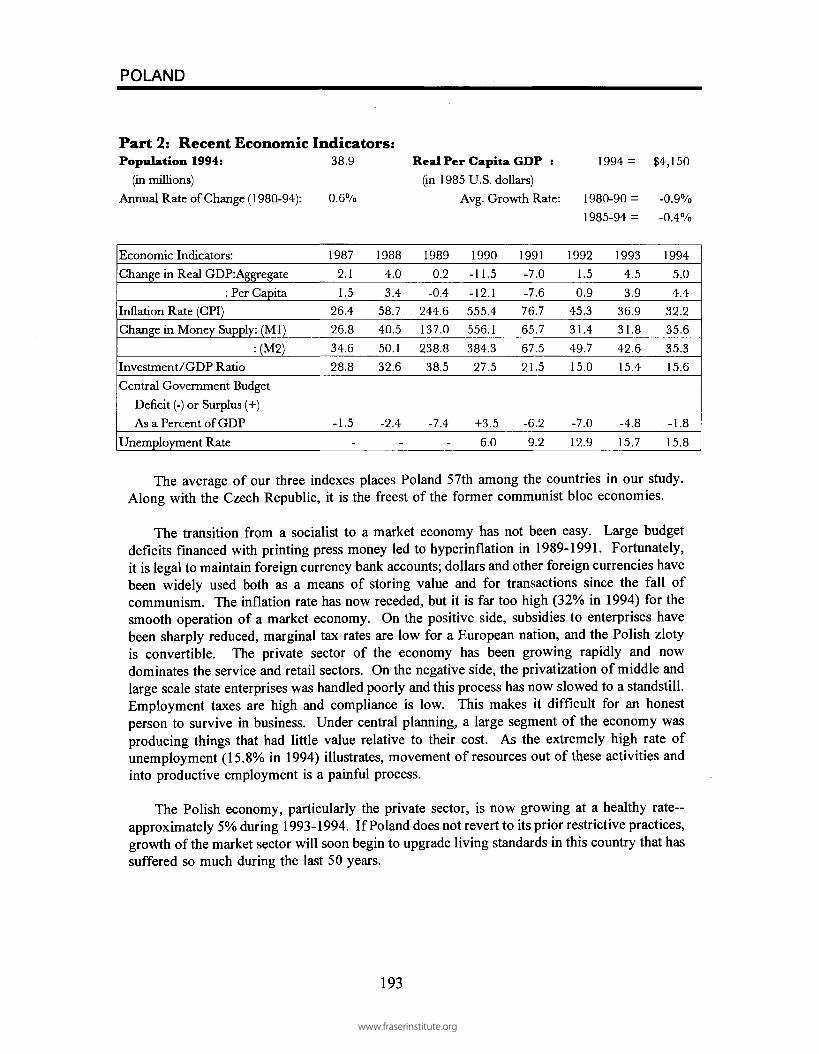
POLAND
Part 2: Recent Economic Indicators:Population 1994: 38.9
(in millions)
Annual Rate of Change (1980-94): 0.6%
Real Per Capita GDP :
(in 1985 U.S. dollars)
Avg. Growth Rate:
1994 =
1980-90 =
1985-94 =
$4,150
-0.9%
-0.4%
Economic Indicators:
Change in Real GDP:Aggregate
: Per Capita
Inflation Rate (CPI)
Change in Money Supply: (Ml)
:(M2)Investment/GDP Ratio
Central Government Budget
Deficit (-) or Surplus (+)
As a Percent of GDP
Unemployment Rate
1987
2.1
1.5
26.4
26.8
34.6
28.8
-1.5
-
1988
4.0
3.4
58.7
40.5
50.1
32.6
-2.4
-
1989
0.2
-0.4
244.6
137.0
238.8
38.5
-7.4
-
1990
-11.5
-12.1
555.4
556.1
384.3
27.5
+3.5
6.0
1991
-7.0
-7.6
76.7
65.7
67.5
21.5
-6.2
9.2
1992
1.5
0.9
45.3
31.4
49.7
15.0
-7.0
12.9
1993
4.5
3.9
36.9
31.8
42.6
15.4
-4.8
15.7
1994
5.0
4.4
32.2
35.6
35.3
15.6
-1.8
15.8
The average of our three indexes places Poland 57th among the countries in our study.Along with the Czech Republic, it is the freest of the former communist bloc economies.
The transition from a socialist to a market economy has not been easy. Large budgetdeficits financed with printing press money led to hyperinflation in 1989-1991. Fortunately,it is legal to maintain foreign currency bank accounts; dollars and other foreign currencies havebeen widely used both as a means of storing value and for transactions since the fall ofcommunism. The inflation rate has now receded, but it is far too high (32% in 1994) for thesmooth operation of a market economy. On the positive side, subsidies to enterprises havebeen sharply reduced, marginal tax rates are low for a European nation, and the Polish zlotyis convertible. The private sector of the economy has been growing rapidly and nowdominates the service and retail sectors. On the negative side, the privatization of middle andlarge scale state enterprises was handled poorly and this process has now slowed to a standstill.Employment taxes are high and compliance is low. This makes it difficult for an honestperson to survive in business. Under central planning, a large segment of the economy wasproducing things that had little value relative to their cost. As the extremely high rate ofunemployment (15.8% in 1994) illustrates, movement of resources out of these activities andinto productive employment is a painful process.
The Polish economy, particularly the private sector, is now growing at a healthy rate-approximately 5% during 1993-1994. If Poland does not revert to its prior restrictive practices,growth of the market sector will soon begin to upgrade living standards in this country that hassuffered so much during the last 50 years.
193
www.fraserinstitute.org

PORTUGAL
Part 1: The Economic Freedom Ratings for the Components and Various Area andSummary Indexes: 1975, 1980, 1985, 1990 and 1993-95.(The numbers in parentheses indicate the actual values for the components.)
1975
1980
19851990
1993-95
Summary RatingsIe
2.4
3.3
3.9
4.1
5.7
I s l
2.4
3.1
3.5
4.1
5.5
Is2
2.0
3.0
3.7
3.9
6.1
Summary Rating Isl: 5 Year Periods
Components of Economic Freedom 1975 1980 1985 1990 1993-95
I. Money and Inflation(a) Annual Money Growth (last 5 yrs.)(b) Inflation Variablity (last 5 yrs.)
(c) Ownership of Foreign Currency(d) Maint. of Bank Account Abroad
II. Government Operation(a) Govern. Consumption (% of GDP)
(b) Government Enterprises
(c) Price Controls(d) Entry Into Business(e) Legal System
(f) Avoidance of Neg. Interest Rates
III. Talcings(a) Transfers and Subsidies (% of GDP)(b) Marginal Tax Rates (Top Rate)
(c) Conscription
IV. International Sector(a) Taxes on International Trade (Avg.)(b) Black Market Exchange Rates (Prem.)(c) Size of Trade Sector (% of GDP)(d) Capital Transactions with Foreigners
2.23
4
0
0
3.5
5
2--
--
1.23
0
0
3.4
6
23
2
(12.8)
(5.2)
(15.0)
(14.6)
(82)
(4.6)
(42)
(53.2)
2.93
6
0
0
3.6
5
2--
-4
0.H
2
0
0
5.7
8
7
5
2
(12.2)
(3.4)
(14.5)
(16.3)
(84)
(2.1)
(2)(69.4)
3.3
3
7
0
0
4.8
5
2--
-10
0.4
1
0
0
6.3
9
7
7
2
(12.0)
(2.5)
(15.5)
(19.5)
(69)
(1.2)
(2)(78.7)
2.626
0
0
3.8
3
24
-
-
8
3.1
25
0
6.6
9
6
6
5
(17.0)
(3.4)
(16.7)
(15.5)
(40)
(1.0)
(3)(81.8)
6.23
5
10
10
5.4
2
26
7.5
7.5
10
3.5
3
5
0
7.4
9
10
4
5
(12.8)
(4.1)
(18.3)
(14.5)
(40)
(0.5)
(0)(67.5)
194
www.fraserinstitute.org

PORTUGAL
Part 2: Recent Economic Indicators:Population 1994: 9.8
(in millions)Annual Rate of Change (1980-94): 0.1 %
Real Per Capita GDP :(in 1985 U.S. dollars)
Avg. Growth Rate:
1994 =
1980-90 =1985-94 =
$7,685
2.6%3.3%
Economic Indicators:Change in Real GDP:Aggregate
: Per Capita
Inflation Rate (CPI)Change in Money Supply: (Ml)
:(M2)Investment/GDP RatioCentral Government Budget
Deficit (-) or Surplus (+)
As a Percent of GDP
Unemployment Rate
19875.1
5.0
9.4
27.8
18.1
27.4
-10.4
7.0
19884.0
3.9
9.6
12.9
14.329.8
-8.7
5.7
19894.9
4.8
12.68.9
12.5
29.1
-4.0
5.0
1990
4.1
4.0
13.412.9
13.129.1
-5.3
4.6
1991
2.1
2.0
11.4
21.3
20.8
28.3
-6.1
4.1
19921.1
1.0
8.9
16.3
24.928.3
-3.8
4.1
1993
-1.0
-1.16.5
14.216.827.5
-8.0
5.5
1994
1.0
0.9
4.9
4.6
8.6
28.5
-7.16.8 a
a First 9 months of the year.
In 1975, only three countries (Uganda, Israel, and Pakistan) had a lower economicfreedom rating (Isl) than Portugal. Since that time this country has moved steadily toward a freereconomy. In 1993-1995, the average of our three indexes placed it 41st (the Isl rankings placedit 47th) among the 103 countries in our study. In terms of economic freedom, Portugal is one ofthe most improved countries in the world.
The highlights of Portugal's advancement include:• legalization of foreign currency accounts in the early 1990s;• reduction of the top marginal tax rate from 82% in 1975 to 69% in 1985 and to the
current 40% in the late 1980s;• substantial reductions in tariffs;• movement to a convertible currency and therefore the elimination of the black
market in foreign exchange; and• a sizeable increase in the size of the trade sector.
More needs to be done. Monetary policy is still far to expansionary—note the continueddouble digit growth rates of the money supply and inflationary side effects. Both the governmentconsumption and transfer sectors are large and this spending is fueling the large and unsustainablebudget deficits.
The movement to a freer economy has paid off. The country is on a strong growth path.Among the European countries, Portugal's 3.3% growth of per capita income during the lastdecade is one of the highest in Europe.
195
www.fraserinstitute.org

SINGAPORE
Part 1: The Economic Freedom Ratings for the Components and Various Area andSummary Indexes: 1975, 1980, 1985, 1990 and 1993-95.(The numbers in parentheses indicate the actual values for the components.)
1975
1980
198519901993-95
Ie
6.5
7.0
7.9
8.5
8.2
Summary RatingsI s l
6.8
7.1
8.0
8.5
8.2
Is2
5.9
6.4
7.5
8.5
8.2
Summary Rating Is1: 5 Year Periods
Components of Economic Freedom 1975 1980 1985 1990 1993-95
I. Money and Inflation(a) Annual Money Growth (last 5 yrs.)(b) Inflation Variablity (last 5 yrs.)
(c) Ownership of Foreign Currency
(d) Maint. of Bank Account Abroad
II. Government Operation(a) Govern. Consumption (% of GDP)(b) Government Enterprises
(c) Price Controls(d) Entry Into Business
(e) Legal System
(f) Avoidance of Neg. Interest Rates
III. Takings(a) Transfers and Subsidies (% of GDP)(b) Marginal Tax Rates (Top Rate)(c) Conscription
IV. International Sector(a) Taxes on International Trade (Avg.)
(b) Black Market Exchange Rates (Prem.)(c) Size of Trade Sector (% of GDP)
(d) Capital Transactions with Foreigners
3.8
7
5
0
0
8.0
8
8
-
-
-
-
5.9
10
4
0
9.29
10
10
8
(5.2)(4.7)
(10.6)
(1.4)(55)
(0.7)
(0)(289.1)
4.79
6
0
0
8.4
8
8
-
-
-
10
5.9
10
4
0
9.29
10
10
8
(3.1)(3.7)
(9.8)
(1.1)(55)
(0.5)
(0)(423.3)
7.3
10
7
10
0
7.3
5
8
-
-
-
10
7.3
9
8
0
9.7
9
10
10
10
(0.1)(2.7)
(14.3)
(1.8)(40)
(0.3)
(0)(318.0)
8.4
8
7
10
10
8.3
8
8
8
-
-
10
7.48
9
0
10.010
10
10
10
(4.6)
(2.8)
(10.5)
(2.6)
(33)
(0.2)
(0)(372.7)
9.4
8
10
10
10
7.29
8
8
7.5
0
10
7.48
9
0
10.010
10
10
10
(4.5)
(0.4)
(9.4)
(2.9)
(30)
(0.2)
(0)(340.8)
196
www.fraserinstitute.org

SINGAPORE
Part 2: Recent Economic Indicators:Population 1994: 2.9
(in millions)
Annual Rate of Change (1980-94): 1.8%
Real Per Capita GDP :
(in 1985 U.S. dollars)
Avg. Growth Rate:
1994 =
1980-90 =
1985-94 =
$14,415
5.2%
5.9%
Economic Indicators:
Change in Real GDP:Aggregate
: Per Capita
Inflation Rate (CPI)
Change in Money Supply: (Ml)
:(M2)
Investment/GDP Ratio
Central Government Budget
Deficit (-) or Surplus (+)
As a Percent of GDP
Unemployment Rate
1987
9.4
7.6
0.5
18.3
17.4
39.0
-2.6
4.7
1988
11.1
9.3
1.5
6.1
12.8
36.9
+6.7
3.3
1989
9.2
7.4
2.4
14.3
22.8
35.5
+9.9
2.2
1990
8.3
6.5
3.4
11.8
21.9
39.5
+ 10.6
1.7
1991
7.0
5.2
3.4
4.4
14.3
38.0
+8.7
1.9
1992
6.1
4.3
2.3
14.0
11.7
40.4
+ 12.5
2.7
1993
9.9
8.1
2.4
17.8
6.2
43.8
-
1994
7.2
5.4
3.6
11.5
11.6
-
-
The average of our three indexes ranks Singapore's economy as the third most free inthe world, behind only Hong Kong and New Zealand. The Isl index places it second. Itsranking was persistently high throughout the last two decades.
Some may be troubled by Singapore's high rating. After all, Freedom House has givenit a relatively low rating with regard to both political and civil liberties in recent years. Inaddition, there have been well publicized restrictive practices, such as the government imposedlimitations on the domestic circulation of the Wall Street Journal. The case of Singaporehighlights the difference between economic liberty and political and civil liberty. Consider thedata underlying the rating of Singapore. Monetary expansion has been modest (afteradjustment for the growth of real GDP) and, as a result, the inflation is both low and stable.Citizens are free to maintain foreign currency bank accounts. As a share of GDP, bothgovernment consumption expenditures and transfers and subsidies are low, particularly for ahigh-income nation. Government-operated enterprises are few and they produce only a smallportion of the total output. The top marginal tax rate of Singapore is 30%. The Singaporedollar is freely convertible to other currencies. There are virtually no tariffs; the size of thetrade sector as a share of the economy is the largest in the world; and the restrictions on themovement of capital into and out of the country are minimal. Singapore is not perfect. It usesconscription, often fails to provide citizens with equal protection under the law, and its forcedsaving plan (which our index does not register) is also a violation of economic freedom. Allthings considered, however, it is still one of the world's freest economies.
197
www.fraserinstitute.org

SOUTH AFRICA
Part 1: The Economic Freedom Ratings for the Components and Various Area andSummary Indexes: 1975, 1980, 1985, 1990 and 1993-95.(The numbers in parentheses indicate the actual values for the components.)
1975
19801985
1990
1993-95
Summary RatingsIe
4.1
4.4
4.5
4.4
4.9
I s l
3.9
4.6
4.5
4.6
4.9
Is2
3.7
3.7
4.0
4.1
4.8
Summary Rating Is1: 5 Year Periods
8
1975 1980 1985 1990 1993-95Year
Components of Economic Freedom 1975 1980 1985 1990 1993-95
I. Money and Inflation(a) Annual Money Growth (last 5 yrs.)
(b) Inflation Variablity (last 5 yrs.)
(c) Ownership of Foreign Currency
(d) Maint. of Bank Account Abroad
II. Government Operation(a) Govern. Consumption (% of GDP)
(b) Government Enterprises
(c) Price Controls(d) Entry Into Business
(e) Legal System
(f) Avoidance of Neg. Interest Rates
III. Takings(a) Transfers and Subsidies (% of GDP)
(b) Marginal Tax Rates (Top Rate)(c) Conscription
IV. International Sector(a) Taxes on International Trade (Avg.)(b) Black Market Exchange Rates (Prem.)(c) Size of Trade Sector (% of GDP)
(d) Capital Transactions with Foreigners
3.25
5
0
0
5.0
6
4
-
-
-
-
0.8
-
1
0
6.0
8
6
9
2
(9.3)(4.8)
(13.8)
(66)
(2.0)
(6)(58.6)
2.54
4
0
0
4.8
6
4
-
-
-
4
4.18
2
0
6.3
9
6
9
2
(11.0)(5.1)
(13.5)
(3.2)
(60)
(1.2)
(6)(64.7)
3.6
29
0
0
4.53
4
-
-
-
8
4.3
6
4
0
5.59
3
9
2
(18.3)(1.9)
(17.3)
(4.8)(50)
(1.4)(25)
(55.4)
4.0
210
0
0
3.8
1
4
4
-
-
8
4.76
5
0
5.58
6
6
2
(17.0)(0.9)
(19.5)
(4.8)(45)
(2.2)
(3)(47.2)
3.9
3
9
0
0
4.4
1
4
4
5
5
10
5.6
6
4
10
5.8
-
10
5
2
(12.5)
(1.8)
(21.1)
(5.0)(43)
(0)(43.8)
198
www.fraserinstitute.org

SOUTH AFRICA
Part 2: Recent Economic Indicators:Population 1994: 41.5
(in millions)
Annual Rate of Change (1980-94): 2.4%
Real Per Capita GDP :
(in 1985 U.S. dollars)
Avg. Growth Rate:
1994 =
1980-90 =
1985-94 =
$3,025
-1.0%
-1.4%
Economic Indicators:
Change in Real GDP:Aggregate
: Per Capita
Inflation Rate (CPI)
Change in Money Supply: (Ml)
:(M2)
Investment/GDP Ratio
Central Government Budget
Deficit (-) or Surplus (+)
As a Percent of GDP
Unemployment Rate
1987
2.1
-0.3
16.1
20.9
10.2
19.4
-7.0
1988
4.2
1.8
12.8
31.8
33.3
21.5
-5.3
1989
2.4
0.0
14.7
14.2
38.5
21.2
-0.2
1990
-0.3
-2.7
14.4
12.4
18.5
19.1
-4.3
1991
-1.0
-3.4
15.3
16.1
-6.1
1992
-2.2
-4.6
13.9
15.1
-6.2
1993
1.1
-1.3
9.7
15.9
-7.7
1994
2.3-0.1
9.0
18.0
-5.8
The average of our three indexes places South Africa in a tie (with Greece and Cyprus)for 54th place. Its Isl summary rating places it 56th. Thus South Africa ranks in the middlerange among the 103 countries in our study. This rating has been relatively steady—there is noevidence of a consistent commitment to or movement toward economic freedom.
Of course, uncertainty about the future political stability of this racially divided countryreduces the security of property rights and the incentive of both foreigners and domestics toinvest. So, too, do policies that restrict economic freedom and undermine the workings of amarket economy. Such policies abound in South Africa. During the last two decades, themonetary authorities have typically increased the money supply at annual rates between 10% and20%. As the result of this excessive monetary growth, double-digit inflation rates have beencommon. Government consumption expenditures account for more than 30% of GDP and publicenterprises operate in several sectors of the economy. These factors, along with the high taxesfor their support, distort and weaken the operation of markets. In recent years, budget deficitshave averaged around 6% of GDP. Deficits in this range are unsustainable. If they are notbrought under control, they will eventually lead to printing-press finance of government andhyper-inflation.
The political future of this country is both uncertain and complex. From an economicviewpoint, the best thing South Africa could do would be to move swiftly and consistently towarda freer economy. Voluntary exchange tends to bring people together, while the political processpulls them apart. South Africa need more of the former and less of the latter.
199
www.fraserinstitute.org
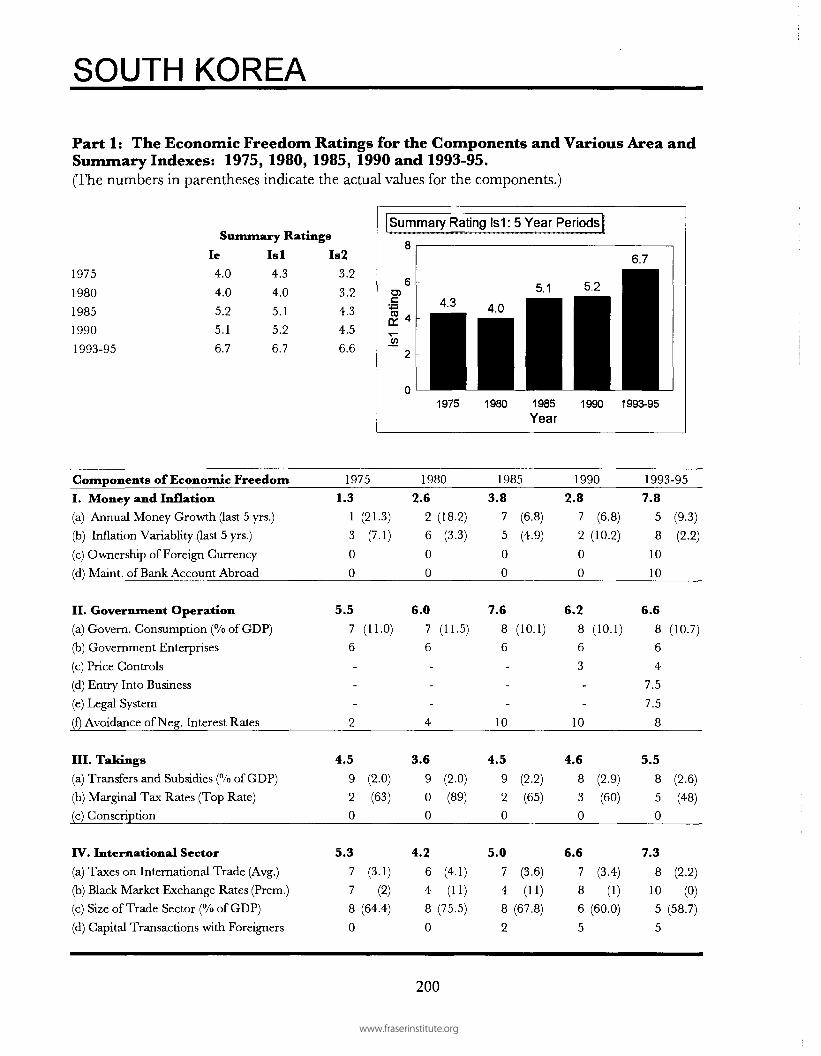
SOUTH KOREA
Part 1: The Economic Freedom Ratings for the Components and Various Area andSummary Indexes: 1975, 1980, 1985, 1990 and 1993-95.(The numbers in parentheses indicate the actual values for the components.)
1975
1980
1985
1990
1993-95
Summary RatingsIe
4.0
4.0
5.2
5.1
6.7
I s l
4.3
4.0
5.1
5.2
6.7
Is2
3.2
3.2
4.3
4.5
6.6
Summary Rating Is1: 5 Year Periods
1975 1980 1985 1990 1993-95
Year
Components of Economic Freedom 1975 1980 1985 1990 1993-95
I. Money and Inflation(a) Annual Money Growth (last 5 yrs.)
(b) Inflation Variablity (last 5 yrs.)
(c) Ownership of Foreign Currency
(d) Maint. of Bank Account Abroad
II. Government Operation
(a) Govern. Consumption (% of GDP)
(b) Government Enterprises
(c) Price Controls
(d) Entry Into Business
(e) Legal System
(f) Avoidance of Neg. Interest Rates
III. Takings
(a) Transfers and Subsidies (% of GDP)
(b) Marginal Tax Rates (Top Rate)
(c) Conscription
IV. International Sector
(a) Taxes on International Trade (Avg.)
(b) Black Market Exchange Rates (Prem.)
(c) Size of Trade Sector (% of GDP)
(d) Capital Transactions with Foreigners
1.31
3
0
0
5.5
7
6
-
-
-
2
4.5
9
2
0
5.3
7
7
8
0
(21.3)
(7.1)
(11.0)
(2.0)
(63)
(3.1)
(2)(64.4)
2.62
6
0
0
6.0
7
6
-
-
-
4
3.6
9
0
0
4.2
6
4
8
0
(18.2)
(3.3)
(11.5)
(2.0)
(89)
(4.1)
(11)(75.5)
3.87
5
0
0
7.6
8
6
-
-
-
10
4.5
9
2
0
5.0
7
4
8
2
(6.8)
(4.9)
(10.1)
(2.2)
(65)
(3.6)
(11)(67.8)
2.87
2
0
0
6.2
8
6
3
-
-
10
4.6
8
3
0
6.6
7
8
6
5
(6.8)
(10.2)
(10.1)
(2.9)
(60)
(3.4)
(1)(60.0)
7.85
8
10
10
6.6
8
6
4
7.5
7.5
8
5.5
8
5
0
7.3
8
10
5
5
(9.3)
(2.2)
(10.7)
(2.6)
(48)
(2.2)
(0)(58.7)
200
www.fraserinstitute.org

SOUTH KOREA
Part 2: Recent Economic Indicators:Population 1994: 44.7
(in millions)
Annual Rate of Change (1980-94): 1.1%
Real Per Capita GDP :
(in 1985 U.S. dollars)
Avg. Growth Rate:
1994 =
1980-90 =
1985-94 =
88,565
7.9%
7.7
Economic Indicators:
Change in Real GDP:Aggregate
: Per Capita
Inflation Rate (CPI)
Change in Money Supply: (Ml)
:(M2)
Investment/GDP Ratio
Central Government Budget
Deficit (-) or Surplus (+)
As a Percent of GDP
Unemployment Rate
1987
11.5
10.4
3.0
18.0
18.2
29.8
+0.4
3.1
1988
11.3
10.2
7.1
11.5
18.1
31.1
+ 1.5
2.5
1989
6.4
5.3
5.7
14.2
18.3
33.6
+0.2
2.6
1990
9.5
8.4
8.6
22.0
21.7
36.9
-0.7
2.4
1991
9.1
8.0
9.3
19.7
19.6
38.9
-1.7
2.3
1992
5.1
4.0
6.2
35.6
19.2
36.6
-0.5
2.4
1993
5.7
4.6
4.8
18.4
17.7
34.3
+0.6
2.8
1994
8.4
7.3
6.3
9.8
15.2
35.7
2.5
Throughout the late 1970s and 1980s, South Korea ranked in the middle of the worldin terms of economic freedom. Its Isl summary economic freedom rating increased from 4.3in 1975 to 5.2 in 1990—a modest but unremarkable increase. Its Isl rating in 1993-95,however, increased to 6.7, placing South Korea in a tie for 12th place among the 102 countriesrated that year. Based of the average of the three indexes, it ranks a little lower, in a tie withFrance for 20th place.
The recent improvement in the summary rating is primarily the result of a more stablemonetary regime and the recent legalization of foreign currency bank accounts bothdomestically and abroad. Thus, its rating in the monetary area has jumped by 5 points since1990. Over the last two decades, a more competitive and stable credit market, lower marginaltax rates (the top rate is now 48%, down from 89% in 1980), and some relaxation ofrestrictions of capital transactions with foreigners have also contributed to Korea's improvedrating.
Like many other emerging economic powers in Asia, South Korea is not known forits political and civil freedoms. However, its recent move toward economic liberalization hasincreased per capita GDP to $8,565 and has resulted in extraordinary growth rates in per capitaGDP of over 7% per year for well over a decade.
201
www.fraserinstitute.org

SPAIN
Part 1: The Economic Freedom Ratings for the Components and Various Area andSummary Indexes: 1975, 1980, 1985, 1990 and 1993-95.(The numbers in parentheses indicate the actual values for the components.)
19751980
1985
19901993-95
Summary RatingsIe
3.6
4.0
4.5
4.8
6.3
I s l
3.9
3.9
4.1
4.7
5.8
Is2
3.0
3.8
4.4
4.7
6.9
Summary Rating Is1: 5 Year Periods
1975 1980 1985 1990 1993-95
Year
Components of Economic Freedom 1975 1980 1985 1990 1993-95
I. Money and Inflation(a) Annual Money Growth (last 5 yrs.)
(b) Inflation Variablity (last 5 yrs.)(c) Ownership of Foreign Currency
(d) Maint. of Bank Account Abroad
II. Government Operation(a) Government Consumption (% of GDP)
(b) Government Enterprises
(c) Price Controls(d) Entry Into Business
(e) Legal System(f) Avoidance of Neg. Interest Rates
III. Takings(a) Transfers and Subsidies (% of GDP)(b) Marginal Tax Rates (Top Rate)
(c) Conscription
IV. International Sector(a) Taxes on International Trade (Avg.)
(b) Black Market Exchange Rates (Prem.)(c) Size of Trade Sector (% of GDP)(d) Capital Transactions with Foreigners
2.626
0
0
6.0
8
4
-
-
-
-
3.1
-
4
0
4.3
5
7
22
(15.7)
(3.7)
(10.5)
(55)
(6.1)
(2)(30.9)
2.93
6
0
0
5.26
4
-
-
-
6
1.73
1
0
6.5
7
10
25
(12.3)(3.5)
(13.2)
(12.3)(66)
(2.7)
(0)(33.8)
4.55
9
0
0
5.7
5
4
-
-
-
10
1.3
21
0
6.1
7
7
5
5
(8.3)
(2-1)
(14.7)
(16.9)(66)
(3.0)
(2)(43.5)
3.6
29
0
0
5.8
5
4
6
-
-
10
2.223
0
7.29
7
3
8
(15.9)
(2.0)
(15.5)
(16.0)(56)
(1.3)
(2)(37.5)
9.4
8
10
10
10
5.6
3
4
6
7.5
5
10
2.22
3
0
8.0
9
10
3
8
(3.7)
(1.2)
(17.0)
(16.3)(56)
(0.9)
(0)(38.0)
202
www.fraserinstitute.org
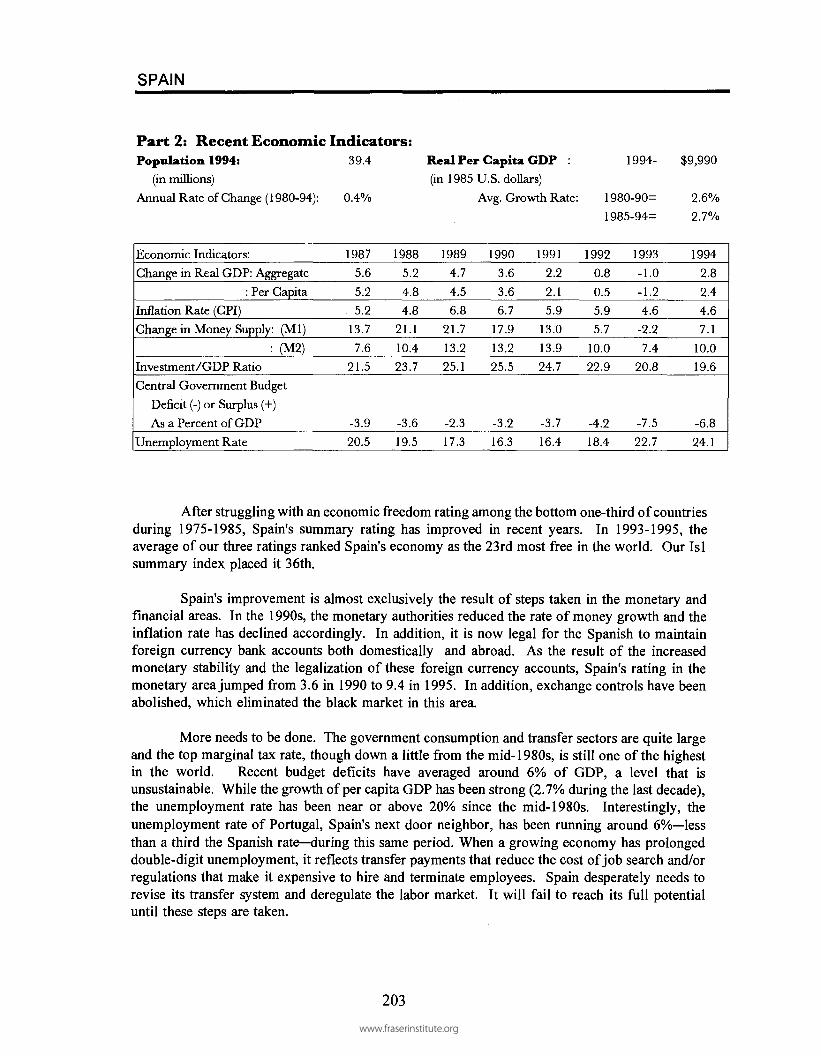
SPAIN
Part 2: Recent Economic Indicators:Population 1994: 39.4 Real Per Capita GDP :
(in millions) (in 1985 U.S. dollars)Annual Rate of Change (1980-94): 0.4% Avg. Growth Rate:
1994- $9,990
1980-90=
1985-94=
2.6%2.7%
Economic Indicators:Change in Real GDP: Aggregate
: Per Capita
Inflation Rate (CPI)Change in Money Supply: (Ml)
:(M2)Investment/GDP Ratio
Central Government Budget
Deficit (-) or Surplus (+)
As a Percent of GDP
Unemployment Rate
1987
5.6
5.25.2
13.7
7.621.5
-3.9
20.5
1988
5.24.84.8
21.1
10.423.7
-3.6
19.5
19894.7
4.56.8
21.7
13.225.1
-2.3
17.3
19903.6
3.66.7
17.9
13.225.5
-3.216.3
1991
2.2
2.15.9
13.0
13.924.7
-3.7
16.4
19920.8
0.55.95.7
10.022.9
-4.218.4
1993
-1.0
-1.24.6
-2.27.4
20.8
-7.5
22.7
1994
2.8
2.44.6
7.1
10.019.6
-6.8
24.1
After struggling with an economic freedom rating among the bottom one-third of countriesduring 1975-1985, Spain's summary rating has improved in recent years. In 1993-1995, theaverage of our three ratings ranked Spain's economy as the 23rd most free in the world. Our Islsummary index placed it 36th.
Spain's improvement is almost exclusively the result of steps taken in the monetary andfinancial areas. In the 1990s, the monetary authorities reduced the rate of money growth and theinflation rate has declined accordingly. In addition, it is now legal for the Spanish to maintainforeign currency bank accounts both domestically and abroad. As the result of the increasedmonetary stability and the legalization of these foreign currency accounts, Spain's rating in themonetary area jumped from 3.6 in 1990 to 9.4 in 1995. In addition, exchange controls have beenabolished, which eliminated the black market in this area.
More needs to be done. The government consumption and transfer sectors are quite largeand the top marginal tax rate, though down a little from the mid-1980s, is still one of the highestin the world. Recent budget deficits have averaged around 6% of GDP, a level that isunsustainable. While the growth of per capita GDP has been strong (2.7% during the last decade),the unemployment rate has been near or above 20% since the mid-1980s. Interestingly, theunemployment rate of Portugal, Spain's next door neighbor, has been running around 6%—lessthan a third the Spanish rate—during this same period. When a growing economy has prolongeddouble-digit unemployment, it reflects transfer payments that reduce the cost of job search and/orregulations that make it expensive to hire and terminate employees. Spain desperately needs torevise its transfer system and deregulate the labor market. It will fail to reach its full potentialuntil these steps are taken.
203www.fraserinstitute.org

SWEDEN
Part 1: The Economic Freedom Ratings for the Components and Various Area andSummary Indexes: 1975, 1980, 1985, 1990 and 1993-95.(The numbers in parentheses indicate the actual values for the components.)
1975
198019851990
1993-95
Summary RatingsIe
3.9
4.0
5.0
5.2
6.1
I s l
3.5
3.4
4.2
4.5
5.5
Is2
4.3
4.4
5.5
5.8
6.7
Summary Rating Is1: 5 Year Periods
8
1975 1980 1985 1990 1993-95Year
Components of Economic Freedom 1975 1980 1985 1990 1993-95
I. Money and Inflation(a) Annual Money Growth (last 5 yrs.)
(b) Inflation Variablity (last 5 yrs.)
(c) Ownership of Foreign Currency
(d) Maint. of Bank Account Abroad
II. Government Operation(a) Govern. Consumption (% of GDP)(b) Government Enterprises(c) Price Controls(d) Entry Into Business
(e) Legal System
(f) Avoidance of Neg. Interest Rates
III. Takings(a) Transfers and Subsidies (% of GDP)
(b) Marginal Tax Rates (Top Rate)(c) Conscription
IV. International Sector(a) Taxes on International Trade (Avg.)
(b) Black Market Exchange Rates (Prem.)
(c) Size of Trade Sector (% of GDP)(d) Capital Transactions with Foreigners
5.8
5
7
10
0
2.5
0
4
-
-
-
4
0.8
0
1
0
6.29
8
5
2
(8.3)
(2-9)
(24.2)
(25.0)
(70)
(1.0)
(1)(55.9)
6.1
4
9
10
0
3.3
0
4
-
-
-
8
0.0
0
0
0
5.79
6
5
2
(10.1)
(1.5)
(29.3)
(24.7)
(87)
(0.7)
(5)(60.8)
7.47
10
10
0
3.7
0
4
-
-
-
10
0.0
0
0
0
7.3
9
8
7
5
(5.9)
(1.2)
(27.9)
(26.0)
(80)
(0.3)
(1)(69.0)
7.07
9
10
0
4.4
0
4
6
-
-
10
0.0
0
0
0
8.3
9
8
510
(6.1)(1.4)
(27.4)
(29.9)
(72)
(0-4)
(1)(59.4)
6.9
10
6
10
0
6.7
0
4
8
10
10
10
0.5
0
1
0
8.79
10
4
10
(1.9)
(3.1)
(27.3)
(31.7)
(56-63)
(0.6)
(0)(54.0)
204
www.fraserinstitute.org

SWEDEN
Part 2: Recent Economic Indicators:Population 1994: 8.8
(in millions)
Annual Rate of Change (1980-94): 0.4%
Real Per Capita GDP :(in 1985 U.S. dollars)
Avg. Growth Rate:
1994=
1980-90=1985-94=
$13,930
1.7%0.4%
Economic Indicators:Change in Real GDP: Aggregate
: Per Capita
Inflation Rate (CPI)Change in Money Supply: (Ml)
: (M2)
Investment/GDP RatioCentral Government Budget
Deficit (-) or Surplus (+)As a Percent of GDP
Unemployment Rate
1987
2.8
2.4
4.2
7.4
10.218.4
+0.41.9
19882.7
2.3
5.8
3.4
7.8
19.3
+0.81.6
19892.4
1.7
6.4
6.2
9.3
21.3
+0.61.4
19901.4
0.5
10.5-
11.3
20.5
+0.61.5
1991-1.1-1.79.3
-
4.0
17.2
-1.12.7
1992-1.4-2.0
2.3
-
3.2
16.5
-2.34.8
1993-2.6-3.0
4.6
-
4.0
14.2
-11.9
8.2
1994
2.2
1.8
2.5
-
0.2
13.7
8.0
Based on the average of our three economic freedom indexes, in 1993-1995 Swedenplaced 31st among the countries in our study. The Isl summary rating ranked it 47th. Sweden'seconomic freedom rating is the lowest of the 20 high-income industrial nations. Its most recentrating is higher than prior figures. However, this change is more apparent than real. The higher1993-1995 rating is primarily the result of its high ratings for the two new components—entry intobusiness and the legal system—included for the first time in the most recent index. The onlycomponent where Sweden's more recent rating was substantially higher than in 1980 was "capitaltransactions with foreigners", suggesting that there has been some relaxation of prior restrictionson the mobility of capital. Even though its top marginal tax rate has been reduced from aconfiscatory 87% in 1980 to the 60% range in 1994, it is still one of the highest in the world.Only Romania, Cameroon, Gabon, and Zaire had lower or comparable 1994 ratings in this area.Political rather than market choices allocate 27% of GDP. Another 32% is taxed from the earnerand transferred to someone else. Thus, approximately 60% of the Swedish output is channelledthrough the government. Again, this figure is one of the highest is the world. Conscription andrestrictions limiting the maintenance of bank accounts abroad further limit the economic freedomof Swedes.
These policies are taking a toll on economic growth, Sweden's 0.4% growth of per capitaGDP during the last decade is the lowest among the high-income industrial nations. In 1975,Sweden's per capita GDP was the fourth highest in the world, behind only United States,Switzerland, and Canada. In 1994 it was 11th and it will almost certainly drop several morenotches in the near future unless it begins to reverse its course and move toward a freer economy.
205
www.fraserinstitute.org

SWITZERLAND
Part 1: The Economic Freedom Ratings for the Components and Various Area andSummary Indexes: 1975, 1980, 1985, 1990 and 1993-95.(The numbers in parentheses indicate the actual values for the components.)
Summary Ratings
1975
1980
1985
1990
1993-95
Ie7.1
7.3
7.8
7.7
7.9
Is l7.1
7.1
7.3
7.3
7.5
Is27.2
7.9
8.4
8.2
8.3
I Summary Ratin g Is1 : 5 Year Periods )
10
O)
I s
oc
7.1 7. 1 7.3 7. 3 7. 5
mil1975 1980 1985 1990 1993-95Year
Components of Economic Freedom 1975 1980 1985 1990 1993-95
I. Money and Inflation(a) Annual Money Growth (last 5 yrs.)
(b) Inflation Variablity (last 5 yrs.)
(c) Ownership of Foreign Currency
(d) Maint. of Bank Account Abroad
II. Government Operation
(a) Govern. Consumption (% of GDP)
(b) Government Enterprises
(c) Price Controls
(d) Entry Into Business
(e) Legal System
(f) Avoidance of Neg. Interest Rates
III. Takings
(a) Transfers and Subsidies (°/o of GDP)
(b) Marginal Tax Rates (Top Rate)
(c) Conscription
IV. International Sector(a) Taxes on International Trade (Avg.)
(b) Black Market Exchange Rates (Prem.)
(c) Size of Trade Sector (% of GDP)
(d) Capital Transactions with Foreigners
10.010
10
10
10
7.278
-
-
-
6
5.5-
7
0
6.27
10
5
2
(1.9)
(1.1)
(12.6)
(38-42)
(3.5)
(0)(60.0)
9.17
10
10
10
7.27
8
-
-
-
6
4.53
7
0
8.78
10
6
10
(5.2)
(1.1)
(12.7)
(13.4)
(31-44)
(2.4)
(0)(77.0)
9.710
9
10
10
7.76
8
-
-
-
10
4.537
0
8.9
8
10
7
10
(0.1)
(2.0)
(13.3)
(13.2)
(33-46)
(2.0)
(0)(77.6)
10.010
10
10
10
7.56
8
7
-
-
10
4.5
28
0
8.6
8
10
5
10
(0.6)
(1.2)
(13.4)
(16.0)
(33-43)
(1.9)
(0)(72.7)
9.7
10
9
10
10
7.9
5
8
6
10
10
10
5.029
0
8.6
8
10
5
10
(0.2)
(1.9)
(14.3)
(16.0)
(26-32)
(1.9)
(0)(68.4)
206
www.fraserinstitute.org
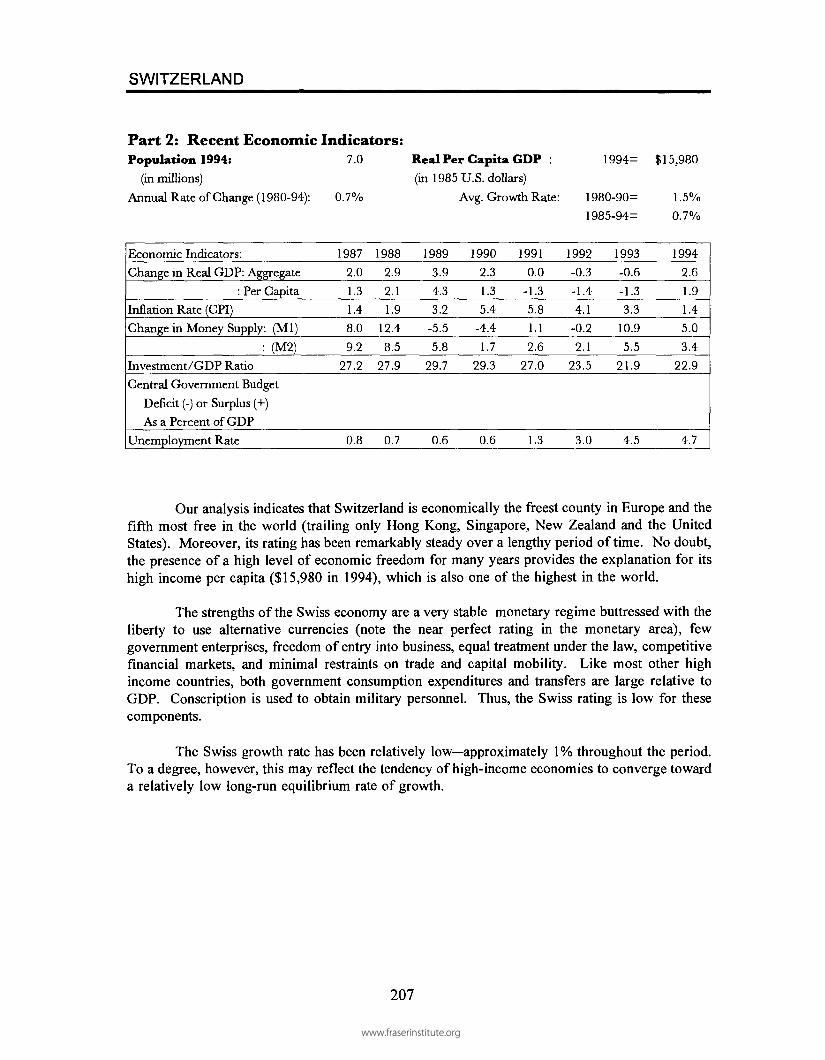
SWITZERLAND
Part 2: Recent Economic Indicators:Population 1994: 7.0 Real Per Capita GDP : 1994= $15,980
(in millions) (in 1985 U.S. dollars)
Annual Rate of Change (1980-94): 0.7% Avg. Growth Rate: 1980-90=
1985-94=
1.5%
0.7%
Economic Indicators:
Change in Real GDP: Aggregate
: Per Capita
Inflation Rate (CPI)
Change in Money Supply: (Ml)
: (M2)Investment/GDP Ratio
Central Government Budget
Deficit (-) or Surplus (+)
As a Percent of GDP
Unemployment Rate
1987
2.0
1.3
1.4
8.0
9.2
27.2
0.8
1988
2.9
2.1
1.9
12.4
8.5
27.9
0.7
1989
3.9
4.3
3.2
-5.5
5.8
29.7
0.6
1990
2.3
1.3
5.4
-4.4
1.7
29.3
0.6
1991
0.0
-1.3
5.8
1.1
2.6
27.0
1.3
1992
-0.3
-1.4
4.1
-0.2
2.1
23.5
3.0
1993
-0.6
-1.3
3.3
10.9
5.5
21.9
4.5
1994
2.6
1.9
1.4
5.0
3.4
22.9
4.7
Our analysis indicates that Switzerland is economically the freest county in Europe and thefifth most free in the world (trailing only Hong Kong, Singapore, New Zealand and the UnitedStates). Moreover, its rating has been remarkably steady over a lengthy period of time. No doubt,the presence of a high level of economic freedom for many years provides the explanation for itshigh income per capita ($15,980 in 1994), which is also one of the highest in the world.
The strengths of the Swiss economy are a very stable monetary regime buttressed with theliberty to use alternative currencies (note the near perfect rating in the monetary area), fewgovernment enterprises, freedom of entry into business, equal treatment under the law, competitivefinancial markets, and minimal restraints on trade and capital mobility. Like most other highincome countries, both government consumption expenditures and transfers are large relative toGDP. Conscription is used to obtain military personnel. Thus, the Swiss rating is low for thesecomponents.
The Swiss growth rate has been relatively low—approximately 1% throughout the period.To a degree, however, this may reflect the tendency of high-income economies to converge towarda relatively low long-run equilibrium rate of growth.
207
www.fraserinstitute.org

SYRIA
Part 1: The Economic Freedom Ratings for the Components and Various Area andSummary Indexes: 1975, 1980, 1985, 1990 and 1993-95.(The numbers in parentheses indicate the actual values for the components.)
19751980
1985
19901993-95
Summary RatingsIe
3.9
3.4
2.8
3.2
2.6
Isl3.7
3.1
2.7
3.2
2.6
Is24.53.9
3.3
2.6
2.1
Summary Rating Is1: 5 Year Periods8
in 6O)
•j=£4 3.73 1 2.7 2L 2.6
1975 1980 1985 1990 1993-95Year
Components of Economic Freedom 1975 1980 1985 1990 1993-95
I. Money and Inflation(a) Annual Money Growth (last 5 yrs.)(b) Inflation Variablity (last 5 yrs.)(c) Ownership of Foreign Currency
(d) Maint. of Bank Account Abroad
II. Government Operation(a) Govern. Consumption (% of GDP)(b) Government Enterprises
(c) Price Controls(d) Entry Into Business
(e) Legal System(f) Avoidance of Neg. Interest Rates
III. Takings(a) Transfers and Subsidies (% of GDP)
(b) Marginal Tax Rates (Top Rate)(c) Conscription
TV. International Sector(a) Taxes on International Trade (Avg.)
(b) Black Market Exchange Rates (Prem.)(c) Size of Trade Sector (% of GDP)(d) Capital Transactions with Foreigners
4.9
22
10
10
3.6
1
6
-
-
-
-
0.0
-
-0
3.5
28
4
0
(15.9)
(12.2)
(21.1)
(8.5)
(1)(55.4)
6.326
10
10
2.0
0
4
-
-
-
-
0.0
-
-
0
1.9
3
23
0
(15.9)(3.8)
(23.2)
(7.1)
(35)(53.7)
5.624
10
10
1.0
0
2-
---
0.0
-
-
0
2.06
0
1
0
(15.5)(5.3)
(23.8)
(5.6)
(251)
(37.2)
4
3
0
2.
.526
10
0
.5
5
2-
---
.0
-
-
0
,7
7
0
4
0
(14.5)
(3.2)
(14.4)
(2.9)(301)(55.1)
3.924
10
0
1.9
5
20
2.5
0-
0.0
-
-
0
2.97
0
5
0
(15.5)(15.1)
(14.4)
(3.6)
(283)(64.0)
208
www.fraserinstitute.org

SYRIA
Part 2: Recent Economic Indicators:Population 1994: 13.7
(in millions)
Annual Rate of Change (1980-94): 3.3%
Real Per Capita GDP :(in 1985 U.S. dollars)
Avg. Growth Rate:
1993= $4,270
1980-90= -1.2%1985-93= 0.6%
Economic Indicators:Change in Real GDP: Aggregate
: Per CapitaInflation Rate (CPI)
Change in Money Supply: (Ml)
:(M2)Investment/GDP RatioCentral Government Budget
Deficit (-) or Surplus (+)
As a Percent of GDP
Unemployment Rate
19871.9
-1.459.5
13.3
14.0
18.2
-2.6
1988
13.3-10.034.614.0
16.9
14.0
+ 1.3
1989-9.0
-12.311.417.5
20.1
16.2
-0.6
1990
7.64.3
19.4
21.6
22.7
16.5
+0.3
199111.6
8.37.7
27.6
33.4
17.7
+ 1.4
19929.6
6.39.5
27.6
25.8
23.6
+ 1.9
1993 19943.9
0.611.8 8.723.9
21.0
25.7
Syria's 2.6 freedom rating (Isl index) in 1993-1995 placed it 99th among the 103countries in our study. It was one of only nine countries that never managed to achieve arating as high as 4.0 during the period of our study.
Several factors underlie Syria's persistently low ratings. Monetary policy has generallybeen both erratic and highly expansionary, although there is some evidence of improvementduring the last few years. Government enterprises are widespread and legal restraints limit thefreedom of private firms to compete in several areas. Government consumption expendituresare large, particularly for a low-income country. Conscription, exchange rate controls (notethat the black market premium has persistently exceeded 250% during the last decade), andrestrictions on trade and capital mobility also contributed to Syria's low rating.
Predictably, the economy is stagnating. Syria's 1993 per capita income was actuallyslightly lower than its 1980 figure. Like several other countries in this region, Syria is payinga price for ignoring the laws of economics and the path to prosperity.
209
www.fraserinstitute.org

TAIWAN
Part 1: The Economic Freedom Ratings for the Components and Various Area andSummary Indexes: 1975, 1980, 1985, 1990 and 1993-95.(The numbers in parentheses indicate the actual values for the components.)
19751980
1985
1990
1993-95
Ie
4.9
5.4
5.8
6.1
6.8
Summary RatingsI s l
4.9
5.3
5.5
5.9
6.6
Is24.8
5.4
5.8
6.4
7.0
Summary Rating Is1: 5 Year Periods
1975 198 0 198 5 199 0 1993-9 5Year
Components of Economic Freedom 1975 1980 1985 1990 1993-95
I. Money and Inflation(a) Annual Money Growth (last 5 yrs.)
(b) Inflation Variability (last 5 yrs.)
(c) Ownership of Foreign Currency(d) Maint. of Bank Account Abroad
II. Government Operation(a) Govern. Consumption (% of GDP)(b) Government Enterprises
(c) Price Controls
(d) Entry Into Business(e) Legal System
(f) Avoidance of Neg. Interest Rates
III. Takings(a) Transfers and Subsidies (% of GDP)
(b) Marginal Tax Rates (Top Rate)(c) Conscription
IV. International Sector(a) Taxes on International Trade (Avg.)(b) Black Market Exchange Rates (Prem.)(c) Size of Trade Sector (% of GDP)
(d) Capital Transactions with Foreigners
4.9
22
10
10
4.8
4
4
-
-
-
8
5.0
9
3
0
4.8
6
6
5
2
(19.1)(12.6)
(15.8)
(2.2)
(60)
(4.8)
(5)(82.5)
5.9
25
10
10
4.8
4
4
-
-
-
8
4.6
8
3
0
6.0
7
8
7
2
(15.1)
(4.3)
(15.9)
(2.6)
(60)
(3.6)
(1)(106.3)
7.47
5
10
10
5.3
4
4
-
-
-
10
4.6
8
3
0
5.47
6
7
2
(5.0)
(4.8)
(16.2)
(3.6)
(60)
(2.8)
(3)(96.6)
7.6
3
9
10
10
5.0
24
6
-
-
10
4.76
5
0
7.3
8
10
5
5
(13.1)
(1.3)
(17.6)
(4.7)
(50)
(2.1)
(0)(90.5)
10.010
10
10
10
5.74
4
7
7.5
2.5
10
5.3
5
7
0
7.3
8
10
5
5
(0.1)
(0.4)
(16.0)
(5.9)
(40)
(2.0)
(0)(86.5)
210
www.fraserinstitute.org

TAIWAN
Part 2: Recent Economic Indicators:Population 1994: 21.3
(in millions)
Annual Rate of Change (1980-94): 1.0%
Real Per Capita GDP :
(in 1985 U.S. dollars)
Avg. Growth Rate:
1994 =
1980-90 =
1985-94 =
$10,152
6.5%
6.7%
Economic Indicators:
Change in Real GDP:Aggregate
: Per Capita
Inflation Rate (CPI)
Change in Money Supply: (Ml)
:(M2)
Investment/GDP Ratio
Central Government Budget
Deficit (-) or Surplus (+)
As a Percent of GDP
Unemployment Rate
1987
12.7
11.7
0.5
37.8
20.6
+ 1.4
2.0
1988
7.8
6.8
1.3
24.4
23.7
+2.9
1.7
1989
8.2
7.2
4.4
6.1
23.4
+3.6
1.6
1990
5.4
4.4
4.1
-6.7
23.1
+0.8
1.7
1991
7.6
6.6
3.6
12.1
23.3
+0.5
1.5
1992
6.8
5.8
4.5
12.4
24.9
+0.2
1.5
1993
6.3
5.3
2.9
15.3
25.2
+0.6
1.5
1994
7.0
6.0
3.4
The Taiwanese economic freedom rating has continuously improved during the last twodecades. The Isl index rose from 4.8 1975 to 5.5 in 1985 and 6.6 in 1993-95. Thisimprovement propelled Taiwan into a tie (with Panama) for 15th place among the 103countries of our study.
Improvements in the monetary and international areas account for most of the gains.In the 1970s, money growth was rapid (15% or more even after adjustment for the long-termgrowth of real GDP) and inflation was a persistent problem. This is no longer the case.During the last five years, the inflation rate has remained within a narrow band between 2.9%and 4.5%. (Note the perfect 10 rating in the money and inflation area in 1993-1995.) In theinternational area, lower tariffs, elimination of exchange rate controls, and a relaxation ofvarious restrictions on capital movements have led to a higher rating. Large governmentexpenditures, state-operated enterprises, and conscription are the major factors pulling downthe overall Taiwanese rating.
Rapid economic growth has accompanied the steady expansion in economic freedom.Since 1980, the per capita GDP of Taiwan has increased at an annual rate of 6.5%. TheTaiwanese economy is now one of the fastest growing in the world.
211
www.fraserinstitute.org

TANZANIA
Part 1: The Economic Freedom Ratings for the Components and Various Area andSummary Indexes: 1975, 1980, 1985, 1990 and 1993-95.(The numbers in parentheses indicate the actual values for the components.)
1975
1980198519901993-95
Summary RatingsIe
3.0
3.4
1.6
2.3
3.3
Isl3.3
4.0
1.9
2.3
3.7
Is22.4
2.3
0.9
1.5
2.6
Summary Rating Is1: 5 Year Periods
8
• • s
a. •4.0
• • • • I1975 1980 1985 1990 1993-95
Year
Components of Economic Freedom 1975 1980 1985 1990 1993-95
I. Money and Inflation(a) Annual Money Growth (last 5 yrs.)
(b) Inflation Variablity (last 5 yrs.)
(c) Ownership of Foreign Currency(d) Maint. of Bank Account Abroad
II. Government Operation(a) Govern. Consumption (% of GDP)
(b) Government Enterprises
(c) Price Controls(d) Entry Into Business
(e) Legal System
(f) Avoidance of Neg. Interest Rates
III. Takings(a) Transfers and Subsidies (% of GDP)(b) Marginal Tax Rates (Top Rate)(c) Conscription
IV. International Sector(a) Taxes on International Trade (Avg.)
(b) Black Market Exchange Rates (Prem.)(c) Size of Trade Sector (% of GDP)(d) Capital Transactions with Foreigners
1.9
2
4
0
0
2.53
2
-
-
-
-
5.3
10
0
10
2.23
1
6
0
(15.3)
(5.8)
(17.2)
(0.1)
(80)
(7.3)
(203)
(52.1)
1.61
4
0
0
4.3
7
2
-
-
-
4
10.0
10
-
10
1.4
3
0
3
0
(22.1)
(5.7)
(13.0)
(0.1)
(7.7)
(224)
(39.5)
2.3
3
4
0
0
1.9
5
0
-
-
-
0
2.46
0
0
1.24
0
0
0
12.3)
(5.9)
(15.4)
(5.2)
(95)
(6.3)
(259)
(21.0)
1.01
20
0
2.78
0
0
-
-
4
2.3
-
3
0
2.7-
1
10
0
(30.0)
(9.5)
(10.4)
(50)
(78)
(76.0)
1.01
20
0
3.27
0
4
2.5
2.5
-
6.2
-
8
0
4 .7
-
6
10
0
(26.6)
(8.9)
(11.3)
(30)
(6)(85.8)
212
www.fraserinstitute.org

TANZANIA
Part 2: Recent Economic Indicators:Population 1994: 27.5
(in millions)
Annual Rate of Change (1980-94): 3.0%
Real Per Capita GDP :(in 1985 U.S. dollars)
Avg. Growth Rate:
1993 =
1980-90 =1985-93 =
$470
0.6%0.5%
Economic Indicators:Change in Real GDP:Aggregate
: Per Capita
Inflation Rate (CPI)Change in Money Supply: (Ml)
:(M2)Investment/GDP RatioCentral Government Budget
Deficit (-) or Surplus (+)
As a Percent of GDP
Unemployment Rate
1987
5.1
2.130.0
33.5
29.230.4
1988
4.2
1.231.234.3
30.430.6
19894.0
1.025.835.7
40.234.4
19904.81.8
19.7
32.939.846.6
19913.9
0.922.3
32.940.638.5
19923.6
0.622.1
26.223.942.4
1993 1994-9.0
-12.023.530.7
27.557.0
Despite the recent improvement, the economic freedom rating of Tanzania is still one ofthe lowest in the world. In 1985, Tanzania's Isl rating fell to 1.9, fourth lowest (only Nicaragua,Somalia, and Uganda had lower ratings) among the countries in our study. Its 1990 rating wasonly slightly higher. Since 1990, Tanzania's rating has risen from 2.3 to 3.7.
The major factors contributing to the recent improvement were lower marginal tax rates,relaxation of exchange rate controls, and a substantial increase in the size of the trade sector.Tanzania's astronomical 95% top marginal tax rate of 1985 was cut to 50% in 1990 and 30% in1994. Its black market exchange rate premium is now at single digit levels, down from 259%in 1985 and 78% in 1990. The exchange rate controls of the mid-1980s virtually stifled theability of Tanzanians to engage in international trade. Thus, the growth of the trade sector as thecontrols were relaxed is not surprising.
A highly unstable monetary policy (in recent years money growth has generally exceeded30% and the inflation rate 20%), legal restraints imposed on private sector business, insecureproperty rights, inefficient state-operated enterprises, price controls, conscription, and restrictionson capital mobility continue to plague this extremely poor country. Major changes are needed ifthis nation is going to throw off the curse of both state oppression and poverty.
213
www.fraserinstitute.org

THAILAND
Part 1: The Economic Freedom Ratings for the Components and Various Area andSummary Indexes: 1975, 1980, 1985, 1990 and 1993-95.(The numbers in parentheses indicate the actual values for the components.)
1975
1980
1985
1990
1993-95
Summary Ratings
Ie
4.6
4.7
5.3
6.2
6.9
I s l
4.9
5.0
5.3
6.3
7.0
Is23.7
3.9
4.6
5.5
6.7
Summary Rating Is1: 5 Year Periods10
1993-95
Components of Economic Freedom 1975 1980 1985 1990 1993-95
I. Money and Inflation 3.1
(a) Annual Money Growth (last 5 yrs.) 8
(b) Inflation Variablity (last 5 yrs.) 2
(c) Ownership of Foreign Currency 0
(d) Maint. of Bank Account Abroad 0
(4.9)(8.4)
3.9
5
7
0
0
(8.8)(2-8)
5.49800
(-2.9)(2.5)
6.4
5
910
0
(10.0)
(1.7)
8.879
10
10
(5.8)
(1.8)
II. Government Operation
(a) Govern. Consumption (% of GDP)
(b) Government Enterprises
(c) Price Controls
(d) Entry Into Business
(e) Legal System
(f) Avoidance of Neg. Interest Rates
III. Takings
(a) Transfers and Subsidies (% of GDP)
(b) Marginal Tax Rates (Top Rate)
(c) Conscription
IV. International Sector
(a) Taxes on International Trade (Avg.)
(b) Black Market Exchange Rates (Prem.)
(c) Size of Trade Sector (% of GDP)
(d) Capital Transactions with Foreigners
7.0
8
6
-
-
-
-
5.4
10
3
0
4.5
4
7
5
2
(10.3)
(0.6)
(60)
(7.0)
(2)(41.4)
6.0
7
6
-
-
-
4
5.4
10
3
0
4.5
4
6
7
2
(12.3)
(0.7)
(60)
(6.9)
(5)(54.5)
6.8
6
6
-
-
-
10
4.9
10
20
4.5
4
6
7
2
(13.5)
(1.2)
(65)
(6.5)
(3)(49.1)
6.5
9
6
4
-
-
8
5.9
10
4
0
6.7
6
10
10
2
(9.4)
(1.0)
(55)
(5.4)
(0)(75.5)
5.5
8
6
5
5
0
10
7.3
10
7
0
7.5
6
10
10
5
(10.3)
(0.9)
(37)
(3.9)
(0)(77.1)
214
www.fraserinstitute.org

THAILAND
Part 2: Recent Economic Indicators:Population 1994: 60.0
(in millions)
Annual Rate of Change (1980-94): 1.8%
Real Per Capita GDP :
(in 1985 U.S. dollars)
Avg. Growth Rate:
1994 =
1980-90 =
1985-94 =
$4,450
5.9%
7.6%
Economic Indicators:
Change in Real GDP:Aggregate
: Per Capita
Inflation Rate (CPI)
Change in Money Supply: (Ml)
:(M2)Investment/GDP Ratio
Central Government Budget
Deficit (-) or Surplus (+)
As a Percent of GDP
Unemployment Rate a
1987
9.5
7.7
2.5
22.9
16.1
23.9
-2.3
6.3
1988
13.2
11.4
3.9
18.5
18.5
28.8
0.7
4.6
1989
12.0
10.2
5.4
19.7
23.3
31.5
3.1
3.6
1990
10.0
8.2
5.9
16.8
29.2
36.8
4.7
2.2
1991
6.7
4.9
5.7
2.4
20.2
-
4.9
3.5
1992
6.8
5.0
4.1
19.7
18.2-
2.9
3.6
1993
8.0
6.2
3.6
10.1
16.1
-
1994
8.4
6.6
5.3
20.1
13.0
-
a Data for 1987-90 are based on an average of a few months during each year.
As the result of substantial improvement during the last two decades, the Thaieconomy is now one of the world's most free. In 1995 its Isl economic freedom rating was7.0, up from 4.5 in 1975. This places Thailand in a tie for sixth (with United Kingdom andMalaysia) among the countries in our study.
Thailand has improved in almost every area. Its price level is now more stable—theinflation rate has fluctuated between 4% and 6% during the last five years. Beginning in thelate 1980s, Thais were permitted to own foreign currency bank accounts domestically and themaintenance of bank accounts abroad was authorized in the early 1990s. These movescontributed to a jump in the money and inflation area rating. Deregulation of the credit markethas integrated the domestic financial markets with the global economy. The negative interestrates of the late 70s are now a thing of the past. The top marginal tax rate was reduced from65% in 1985 to 55% in 1990 and 37% in 1994. Tariff rates have been reduced; the Thai bahtis now fully convertible; the size of the trade sector as a share of GDP has nearly doubledsince the mid-70s; and restrictions on the flow of capital were relaxed in the early 1990s. Allof these factors contributed to the growth of economic freedom.
The economy has responded. The annual growth rate of per capita GDP was 7.6%during 1985-1994, up from 3.7% during 1970-1985. The central government has generallyrun a budget surplus in recent years and the unemployment rate is relatively low.
215
www.fraserinstitute.org

TURKEY
Part 1: The Economic Freedom Ratings for the Components and Various Area andSummary Indexes: 1975, 1980, 1985, 1990 and 1993-95.(The numbers in parentheses indicate the actual values for the components.)
19751980
198519901993-95
Summary RatingsIe
2.5
2.0
3.8
4.5
4.2
I s l
2.8
2.3
3.8
4.6
4.2
Is21.9
1.43.04.4
4.3
Summary Rating Is1: 5 Year Periods
8
1975 1980 1985 1990 1993-95Year
Components of Economic Freedom 1975 1980 1985 1990 1993-95
I. Money and Inflation(a) Annual Money Growth (last 5 yrs.)
(b) Inflation Variablity (last 5 yrs.)
(c) Ownership of Foreign Currency
(d) Maint. of Bank Account Abroad
II. Government Operation(a) Govern. Consumption (% of GDP)
(b) Government Enterprises(c) Price Controls
(d) Entry Into Business
(e) Legal System(f) Avoidance of Neg. Interest Rate
III. Takings(a) Transfers and Subsidies (% of GDP)
(b) Marginal Tax Rates (Top Rate)(c) Conscription
IV. International Sector(a) Taxes on International Trade (Avg.)(b) Black Market Exch. Rates (Prem.)
(c) Size of Trade Sector (% of GDP)(d) Capital Transactions with Foreigners
2.325
00
4.77
4
-
-
-
2
3.85
-
0
1.30
4
1
0
(20.2)
(4.4)
(12.3)
(6.0)
(14.4)
(11)(19.3)
0.6
1
1
0
0
4.3
7
4
-
-
-
0
2.05
0
0
2.34
4
0
0
(39.7)
(31.4)
(12.6)
(6.0)
(75)
(6.3)
(16)
(20.6)
1.01
20
0
6.89
4-
--
8
3.0430
4.776
6
0
(31.7)
(8.4)
(8.6)
(10.3)
(60)
(3.0)
(3)(44.4)
4.00
1
10
10
4.9
6
4
6
-
-
2
4.77
4
0
4.8
7
7
5
0
(48.9)
(13.9)
(14.1)
(3.9)
(50)
(2.8)
(2)(42.0)
4.00
1
1010
3.8
243
7.5
06
3.9540
5.48
8
50
(59.0)
(18.8)
(18.6)
(5.8)
(55)
(2.3)
(1)(44.4)
216
www.fraserinstitute.org

TURKEY
Part 2: Recent Economic Indicators:Population 1994: 60.9
(in millions)
Annual Rate of Change (1980-94): 2.3%
Real Per Capita GDP :
(in 1985 U.S. dollars)
Avg. Growth Rate:
1994= $3,665
1980-90= 3.2%
1985-94= 2.9%
Economic Indicators:
Change in Real GDP: Aggregate
: Per Capita
Inflation Rate (CPI)
Change in Money Supply: (Ml)
:(M2)Investment/GDP Ratio
Central Government Budget
Deficit (-) or Surplus (+)
As a Percent of GDP
Unemployment Rate
1987
7.4
5.1
38.8
62.6
49.4
25.2
-4.0
-
1988
3.8
1.5
73.7
44.4
57.1
24.0
-3.8
8.3
1989
1.3
-1.0
63.3
63.7
74.8
22.7
-4.5
8.5
1990
9.2
6.9
60.3
71.4
61.3
23.9
-4.2
7.4
1991
0.3
-2.0
66.0
45.9
66.5
22.4
-5.2
8.3
1992
5.1
3.8
70.1
59.2
88.3
23.2
-4.3
7.8
1993
6.0
3.7
66.1
78.4
66.7
26.2
1994
-5.4
-7.7
106.3
84.4
128.4
27.5
The average of our three indexes places Turkey in a tie (with Bangladesh and Israel) for66th place in our 1993-1995 rankings. Its Isl summary rating places it 70th. Thus, Turkey ranksin the lower-middle range among the 103 countries in our study. Its 1975 and 1980 rankings wereeven lower. During the 1980s, Turkey took some significant steps toward a freer economy (notethe increase in its summary ratings). The key elements of Turkey's improvement during thisperiod were:
• legalization of foreign currency bank accounts;• reductions in tax rates—the top marginal rate was cut from 75% in 1980 to 50% in 1990
(recently it has been increased to 55%);• lower tariffs—the average tax on international trade fell from 14.4% in 1975 to 2.3%
during the most recent period;• relaxation of exchange rate controls—the black market in this area has virtually
disappeared; and• a substantial increase in the size of the trade sector.
The most serious obstacle to further advancement is the current mismanagement of bothmonetary and fiscal policy. During the last five years, the Turkish monetary authorities haveexpanded the money supply at almost a 70% annual rate. Predictably, the price level hasincreased by a similar magnitude. The 1994 Turkish inflation rate of 106% was one of thehighest in the world. After making significant progress toward economic freedom andexperiencing a healthy growth rate (per capita GDP increased 3.2% annually during the 1980s),it would be tragic if these policy failures once again sent the economy into stagnation andregression.
217
www.fraserinstitute.org

UNITED KINGDOM
Part 1: The Economic Freedom Ratings for the Components and Various Area andSummary Indexes: 1975, 1980, 1985, 1990 and 1993-95.(The numbers in parentheses indicate the actual values for the components.)
1975
19801985
19901993-95
Summary RatingsIe
4.7
4.7
6.8
7.0
7.5
Isl ]5.0
4.5
6.0
6.6
7.0
i
Is24.75.37.97.88.3
Summary Rating
Rat
ing
Is1 I
m
8
6
4
2
0
• 5.0MHMH
1975
Is1:5
4.5
I1980
Year Periods |
6.0 _?£.
iULflHJHi1985 199 0Year
7.0•1WM1993-95
Components of Economic Freedom 1975 1980 1985 1990 1993-95
I. Money and Inflation(a) Annual Money Growth (last 5 yrs.)
(b) Inflation Variablity (last 5 yrs.)(c) Ownership of Foreign Currency(d) Maint. of Bank Account Abroad
II. Government Operation(a) Govern. Consumption (% of GDP)
(b) Government Enterprises
(c) Price Controls(d) Entry Into Business
(e) Legal System(f) Avoidance of Neg. Interest Rates
III. Takings(a) Transfers and Subsidies (% of GDP)(b) Marginal Tax Rates (Top Rate)
(c) Conscription
IV. International Sector(a) Taxes on International Trade (Avg.)
(b) Black Market Exchange Rates (Prem.)(c) Size of Trade Sector (% of GDP)
(d) Capital Transactions with Foreigners
2.24
3
0
0
2.81
4
-
-
-
4
5.8
3
7
10
7.410
10
7
2
(10.4)
(7.4)
(22.4)
(15.0)(41)
(0.0)
(0)(53.6)
3.6
4
7
0
0
2.81
4
-
-
-
4
2.120
10
9.2
10
10
5
10
(10.3)
(2.6)
(21.6)
(15.8)(83)
(0.0)
(0)(52.3)
7.24
7
10
10
4.9
1
6
-
-
-
10
3.1
22
10
9.7
10
10
8
10
(10.9)(2.5)
(21.1)
(17.9)(60)
(0.0)
(0)(56.6)
7.0
1
9
10
10
5.9
1
6
8
-
-
10
4.9
3
5
10
9.2
10
10
5
10
(28.0)(1.4)
(20.6)
(14.9)(40)
(0.0)
(0)(51.4)
8.8
7
9
10
10
6.8
1
6
9
10
5
10
4.5
2
5
10
9.2
10
10
5
10
(5.3)
(1.6)
(21.5)
(17.3)(40)
(o.i)(0)
(49.0)
218
www.fraserinstitute.org

UNITED KINGDO M
Part 2: Recent Economic Indicators:Population 1994: 58.0
(in millions)
Annual Rate of Change (1980-94): 0.2%
Real Per Capita GDP :
(in 1985 U.S. dollars)
Avg. Growth Rate:
1994=
1980-90=
1985-94=
$13,430
2.5%
1.8%
Economic Indicators:
Change in Real GDP: Aggregate
: Per Capita
Inflation Rate (CPI)
Change in Money Supply: (Ml)
: (M2)Investment/GDP Ratio
Central Government Budget
Deficit (-) or Surplus (+)
As a Percent of GDP
Unemployment Rate
1987
4.8
4.5
4.1
26.5
23.6
18.0
-0.7
10.3
1988
5.0
4.7
4.9
13.7
15.9
20.3
+ 1.6
8.6
1989
2.21.9
7.8
10.8
18.7
21.0
+ 1.5
7.3
1990
0.4
0.1
7.5
11.5
15.6
19.2
+0.7
6.9
1991
-2.2-2.6
5.9
9.2
8.1
15.9
-1.0
8.8
1992
-0.6
-0.8
3.7
5.7
1.6
15.2
-5.0
10.0
1993
2.0
1.8
1.6
3.8
5.4
14.9
-6.9
10.4
1994
3.9
3.7
3.3
6.5
4.3
14.9
-5.6
9.4
Our analysis indicates that in the mid-1990s the economy of the United Kingdom is oneof the most free in the world. Among the countries in our study, each of our three indexes rankedit sixth. Since 1980, the UK economic freedom rating has improved steadily. The Isl ratingjumped from 4.5 in 1980 to 6.6 in 1990 and 7.0 in 1993-1995. The major factors underlying thisimprovement were greater monetary and price stability, removal of restrictions limiting the useof foreign currencies, privatization, and the sharp reduction in marginal tax rates (the top rate wassliced from 83% in 1980 to 60% in 1985 and 40% later in the decade).
Growth since 1980 has been impressive even though the British economy was hard hit bythe 1990-92 recession. Between 1980 and 1994, the annual growth of per capita GDP averaged1.9%, compared to, for example, 1.8% for Germany and 1.4% for France. Both these economieshad grown more rapidly than the UK between 1960 and 1980.
The UK economy still confronts serious problems. Its government consumption andtransfer sectors are among the largest in the world. Employment regulations and a complex webof social benefits reduce worker mobility and labour market flexibility. Unemployment, whichhas been falling for three years, though high by U.S. and Japanese standards, is nevertheless lowerthan in several major European countries. The extent to which the size of the government sectorcan be reduced and labour market flexibility increased will determine the future direction of theBritish economy.
219
www.fraserinstitute.org
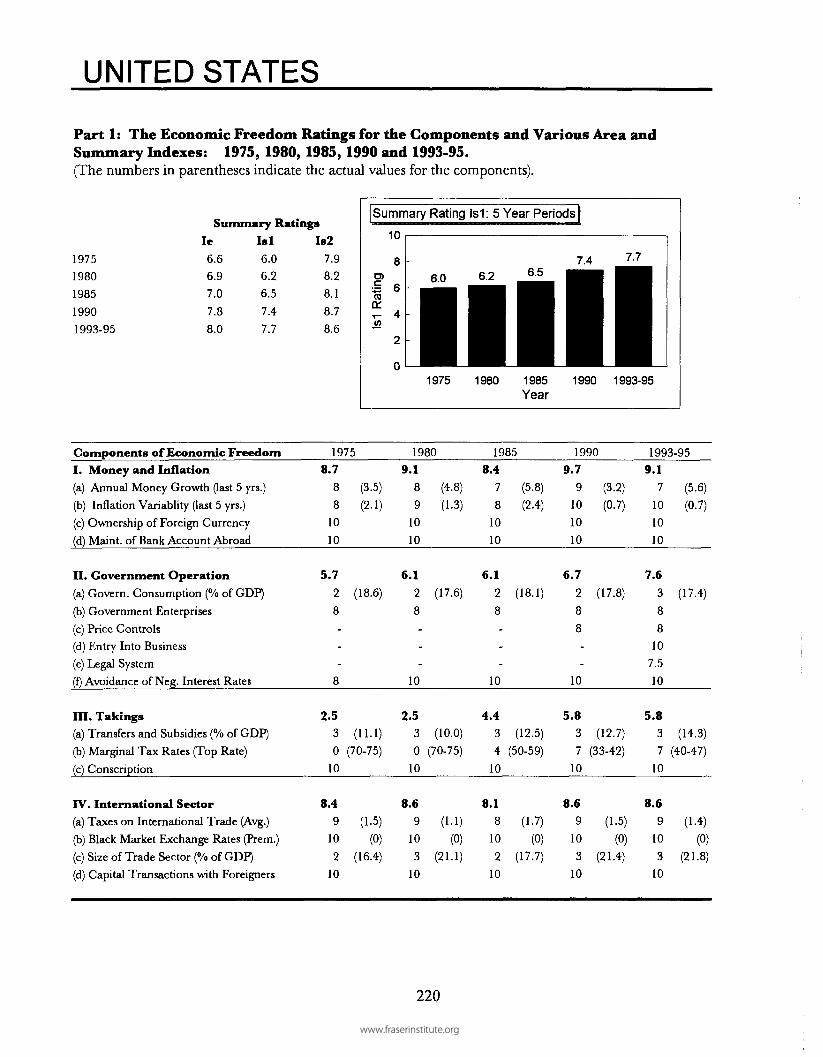
UNITED STATES
Part 1: The Economic Freedom Ratings for the Components and Various Area andSummary Indexes: 1975, 1980, 1985, 1990 and 1993-95.(The numbers in parentheses indicate the actual values for the components).
Summary Ratings
1975
1980
1985
1990
1993-95
Ie6.6
6.9
7.0
7.8
8.0
Is l6.0
6.2
6.5
7.4
7.7
Is27.9
8.2
8.1
8.7
8.6
Summary Rating Is1: 5 Year Periods
10
1975 1990 1993-95
Components of Economic Freedom 1975 1980 1985 1990 1993-95
I. Money and Inflation(a) Annual Money Growth (last 5 yrs.)
(b) Inflation Variablity (last 5 yrs.)
(c) Ownership of Foreign Currency
(d) Maint. of Bank Account Abroad
II. Government Operation
(a) Govern. Consumption (% of GDP)
(b) Government Enterprises
(c) Price Controls
(d) Entry Into Business
(e) Legal System
(f) Avoidance of Neg. Interest Rates
III. Takings(a) Transfers and Subsidies (% of GDP)
(b) Marginal Tax Rates (Top Rate)
(c) Conscription
IV. International Sector(a) Taxes on International Trade (Avg.)
(b) Black Market Exchange Rates (Prem.)
(c) Size of Trade Sector (% of GDP)
(d) Capital Transactions with Foreigners
8.78
8
10
10
5.7
2
8
-
-
-
8
2.53
0
10
8.49
10
2
10
(3.5)
(2.1)
(18.6)
(11.1)(70-75)
(1.5)
(0)(16.4)
9.18
9
10
10
6.1
2
8
-
-
-
10
2.53
0
10
8.6
9
10
3
10
(4.8)
(1.3)
(17.6)
(10.0)
(70-75)
(1.1)
(0)(21.1)
8.47
8
10
10
6.1
28
-
-
-
10
4.4
3
4
10
8.1
8
10
2
10
(5.8)
(2.4)
(18.1)
(12.5)
(50-59)
(1.7)
(0)(17.7)
9.79
10
10
10
6.7
2
8
8
-
-
10
5.8
3
7
10
8.6
9
10
3
10
(3.2)
(0.7)
(17.8)
(12.7)
(33-42)
(1.5)
(0)(21.4)
9.17
10
10
10
7.6
3
8
8
10
7.5
10
5.8
3
7
10
8.6
9
10
3
10
(5.6)
(0.7)
(17.4)
(14.3)
(40-47)
(1.4)
(0)(21.8)
220
www.fraserinstitute.org

UNITED STATES
Part 2: Recent Economic Indicators:Population 1994: 260.7
(in millions)
Annual Rate of Change (1980-94): 1.0%
Real Per Capita GDP '.
(in 1985 U.S. dollars)
Avg. Growth Rate:
1994=
1980-90=
1985-94=
$18,
1
1
850
.7%
.6%
Economic Indicators:
Change in Real GDP: Aggregate
: Per Capita
Inflation Rate (CPI)
Change in Money Supply: (Ml)
:(M2)Investment/GDP Ratio
Central Government Budget
Deficit (-) or Surplus (+)
As a Percent of GDP
Unemployment Rate
1987
3.1
2.1
3.7
9.4
6.2
18.9
-3.3
6.2
1988
3.9
2.9
4.0
4.7
6.5
18.4
-3.25.5
1989
2.7
1.7
4.8
0.7
4.6
18.2
-2.8
5.3
1990
1.20.8
5.4
3.9
5.9
16.9
-4.0
5.5
1991
-1.2-1.7
4.26.1
4.5
15.3
-4.8
6.7
1992
3.4
2.4
3.0
11.7
2.3
15.7
-4.9
7.4
1993
3.0
2.0
3.0
12.6
1.1
16.5
-4.1
6.8
1994
4.0
3.0
2.6
1.7
0.9
15.3
-3.3
6.1
Other than Hong Kong and Switzerland, no economy has achieved more persistentlyhigh ratings throughout the last two decades than the United States. The U.S. ranked in theTop Ten during each of our rating years and its ranking has improved. It moved from 10thin 1975 to 6th in 1985 to 4th in the mid-1990s. Only Hong Kong, Singapore, and NewZealand were rated higher in our most recent rating year.
The U. S. received below average ratings for only two components: size of the transfersector and international trade as a share of GDP. Increased price stability (the inflation ratehas generally been between 2% and 4% for more than a decade) and a reduction in the topmarginal tax rate (the combined federal and state top rate was reduced from over 70% in 1980to the 40% range) were the primary factors contributing to the increase in the U.S. rating.Compared to the high-income industrial nations of Europe, the size of the governmentconsumption and transfer sectors are slightly smaller in the United States. In addition, thelabor market is more flexible and therefore the unemployment rate of the United States haspersistently been lower than the rates of most industrial nations.
Our analysis suggests that persistent economic freedom over a prolonged time periodwill lead to a high per capita income. The experience of the United States is consistent withthis viewpoint. The U.S. is not only one of the two or three persistently most free economies,the per capita income of Americans ($18,850 in 1994) is still the highest in the world.Economic freedom leads to progress.
221
www.fraserinstitute.org

VENEZUELA
Part 1: The Economic Freedom Ratings for the Components and Various Area andSummary Indexes: 1975, 1980, 1985, 1990 and 1993-95.(The numbers in parentheses indicate the actual values for the components.)
1975
1980
1985
19901993-95
Summary RatingsIe
6.4
6.3
5.0
5.24.0
Isl6.9
6.6
5.25.5
4.5
Is26.3
6.1
4.7
5.0
3.2
Summary Rating Is1: 5 Year Periods
10
O)••G(0
a:
" 6. 9 6.6• •15.2
15.5
14.5
1975 198 0 1985Year
1990 1993-9 5
Components of Economic Freedom 1975 1980 1985 1990 1993-95
I. Money and Inflation(a) Annual Money Growth (last 5 yrs.)
(b) Inflation Variablity (last 5 yrs.)
(c) Ownership of Foreign Currency
(d) Maint. of Bank Account Abroad
II. Government Operation(a) Govern. Consumption (% of GDP)(b) Government Enterprises
(c) Price Controls
(d) Entry Into Business(e) Legal System
(f) Avoidance of Neg. Interest Rates
III. Takings(a) Transfers and Subsidies (% of GDP)(b) Marginal Tax Rates (Top Rate)(c) Conscription
IV. International Sector(a) Taxes on International Trade (Avg.)
(b) Black Market Exchange Rates (Prem.)(c) Size of Trade Sector (% of GDP)(d) Capital Transactions with Foreigners
4.3
1
1
10
10
6.5
7
6
-
-
-
-
7.8
8
10
0
7.66
10
6
8
(25.5)
(15.0)
(11.5)
(2.3)
(20)
(3.7)
(0)(50.7)
5.53
3
10
10
5.5
7
4
-
-
-
-
6.8
9
7
0
7.8
7
10
5
8
(13.6)
(7.4)
(11.8)
(2.0)
(45)
(3.0)
(0)(50.7)
5.9
3
4
10
10
6.0
8
4
-
-
-
-
6.0
7
7
0
3.1
1
3
4
5
(13.3)
(5.2)
(10.5)
(4.5)
(45)
(9.1)
(25)
(40.7)
4.621
10
10
4.29
24
-
-
0
5.25
7
0
7.68
10
7
5
(19.9)
(30.4)
(8.4)
(5.8)
(45)
(2.2)
(0)(59.6)
0.6
1
1
0
0
3.9
10
2250
4
6.1
6
8
0
6.3
6
8
6
5
(39.8)
(13.9)
(7.3)
(5.3)
(30)
(3.8)
(1)(54.3)
222
www.fraserinstitute.org

VENEZUELA
Part 2: Recent Economic Indicators:Population 1994: 21.2
(in millions)
Annual Rate of Change (1980-94): 2.6%
Real Per Capita GDP :
(in 1985 U.S. dollars)
Avg. Growth Rate:
1994=
1980-90=
1985-94=
$6,395
-1.7%
0.2%
Economic Indicators:
Change in Real GDP: Aggregate
: Per Capita
Inflation Rate (CPI)
Change in Money Supply: (Ml)
:(M2)
Investment/GDP Ratio
Central Government Budget
Deficit (-) or Surplus (+)
As a Percent of GDP
Unemployment Rate
1987
4.5
1.9
28.1
21.9
20.6
25.2
-5.9
9.1
1988
6.2
3.6
29.5
18.4
16.6
27.9
-7.7
7.3
1989
-7.8
-10.4
84.2
20.7
35.2
12.9
-1.6
9.2
1990
6.9
4.3
40.8
25.0
49.7
10.2
+ 1.1
10.4
1991
9.7
7.1
34.2
52.6
56.9
18.7
+4.4
9.5
1992
6.8
4.2
31.4
26.5
25.1
23.2
-3.2
7.8
1993
-1.0
-3.6
38.1
-2.5
21.8
18.0
-3.0
-
1994
-3.3
-6.9
60.8
101.4
56.0
15.8
-
While most South American countries have been moving toward greater economicfreedom, Venezuela is a clear exception to the trend. In 1975, Venezuela's 6.9 Isl summary ratingplaced it as the 5th freest economy in the world. Since that time, the freedom rating of thiseconomy has gone steadily down. In 1993-1995, Venezuela's 4.5 Isl summary rating placed it ina tie with India and Kenya for 63rd place. Based on the average of our three indexes, Venezuela'sranking is even lower, 75th. Except for Brazil, Venezuela now has the least free economy in SouthAmerica.
Why did Venezuela's rating decline? The major contributing factors were: monetary andprice instability, removal in the early 1990s of the freedom to maintain foreign currency bankaccounts, and increased use of price controls. Low ratings for the widespread use of public sectorenterprises, a weak and often arbitrary legal system, interest rate controls, and conscription also pulldown the summary rating. There are a few bright spots. The size of government consumption asa share of GDP is relatively small and the top marginal tax rate is only 30%, down from 45% in1990.
A fall in income has accompanied Venezuela's decline in economic freedom. Its 1994 percapita GDP ($6,395) was almost 15% less than the 1980 figure ($7,401). If prosperity is going toreturn to this economy, Venezuela would do well to emulate several of its neighbors—Chile andPeru, for example—and begin moving toward a freer economy.
223
www.fraserinstitute.org
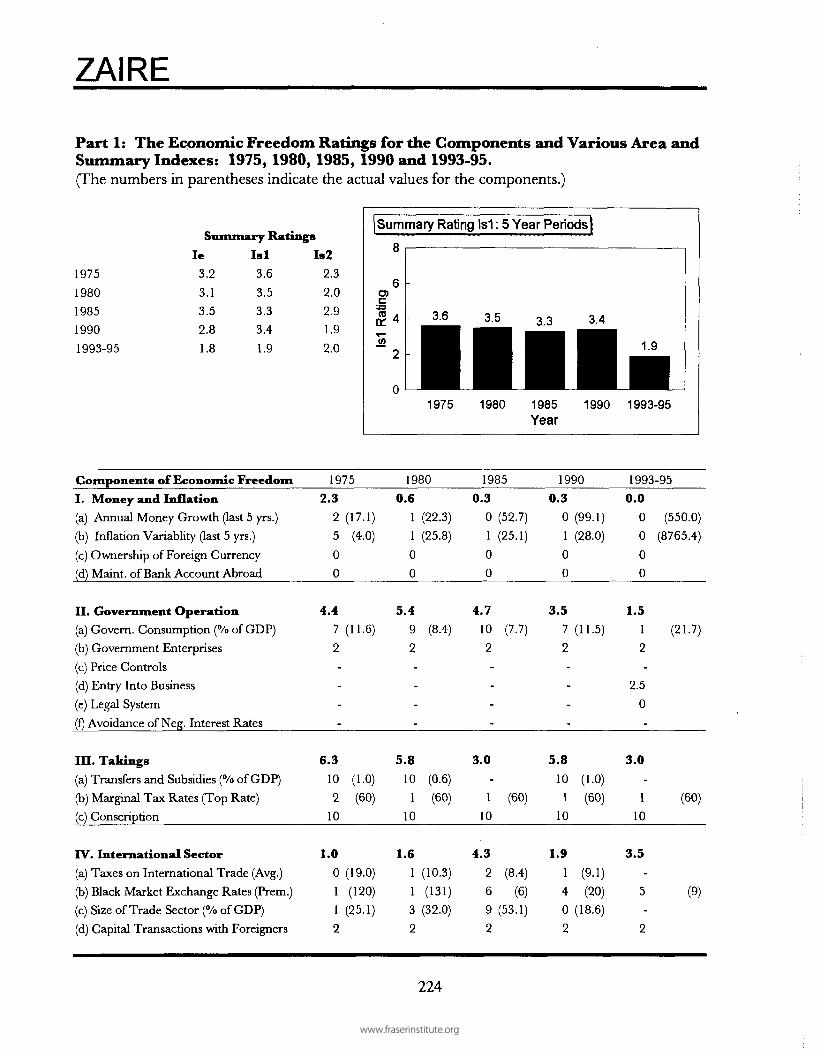
ZAIRE
Part 1: The Economic Freedom Ratings for the Components and Various Area andSummary Indexes: 1975, 1980, 1985, 1990 and 1993-95.(The numbers in parentheses indicate the actual values for the components.)
1975
1980
1985
1990
1993-95
Summary RatingsIe
3.2
3.1
3.5
2.8
1.8
I s l
3.6
3.5
3.3
3.4
1.9
Is2
2.3
2.0
2.9
1.9
2.0
Summary Rating Is1: 5 Year Periods |
8
1.9
1975 198 0 198 5 199 0 1993-9 5Year
Components of Economic Freedom 1975 1980 1985 1990 1993-95
I. Money and Inflation 2.3 0.6 0.3 0.3 0.0
(a) Annual Money Growth (last 5 yrs.) 2(17.1) 1(22.3) 0(52.7) 0(99.1) 0 (550.0)
(b) Inflation Variablity (last 5 yrs.) 5 (4.0) 1(25.8) 1(25.1) 1(28.0) 0 (8765.4)
(c) Ownership of Foreign Currency 0 0 0 0 0
(d) Maint. of Bank Account Abroad 0 0 0 0 0
II. Government Operation
(a) Govern. Consumption (% of GDP)
(b) Government Enterprises
(c) Price Controls
(d) Entry Into Business
(e) Legal System
(f) Avoidance of Neg. Interest Rates
III. Takings
(a) Transfers and Subsidies (% of GDP)
(b) Marginal Tax Rates (Top Rate)
(c) Conscription
IV. International Sector
(a) Taxes on International Trade (Avg.)
(b) Black Market Exchange Rates (Prem.)
(c) Size of Trade Sector (% of GDP)
(d) Capital Transactions with Foreigners
4.4
7
2
-
-
-
-
6.3
10
2
10
1.0
0
1
1
2
(11.6)
(1.0)
(60)
(19.0)
(120)
(25.1)
5.4
9
2
-
-
-
-
5.8
10
1
10
1.6
1
1
3
2
(8.4)
(0.6)
(60)
(10.3)
(131)
(32.0)
4.7
10
2
-
-
-
-
3.0
-
1
10
4.3
2
6
9
2
(7.7)
(60)
(8.4)
(6)(53.1)
3.5
7
2
-
-
-
-
5.8
10
1
10
1.9
1
4
0
2
(11.5)
(1.0)
(60)
(9.1)
(20)
(18.6)
1.5
1
2
-
2.5
0
-
3.0
-
1
10
3.5
-
5
-
2
(21.7)
(60)
(9)
224
www.fraserinstitute.org

ZAIRE
Part 2: Recent Economic Indicators:Population 1994: 42.0
(in millions)
Annual Rate of Change (1980-94): 3.0%
Real Per Capita GDP a :
(in 1985 U.S. dollars)
Avg. Growth Rate:
1992 =
1980-90 =
1985-92 =
$300
-2.0%
-5.3%
Economic Indicators:
Change in Real GDP:Aggregate
: Per Capita
Inflation Rate (CPI)
Change in Money Supply: (Ml)
:(M2)
Investment/GDP Ratio
Central Government Budget
Deficit (-) or Surplus (+)
As a Percent of GDP
Unemployment Rate*
1987
2.6
-0.4
90.4
79.7
82.6
14.2
1988
0.6
-2.4
82.7
97.7
99.0
14.4
1989
-1.4
-4.4
104.1
105.3
105.9
14.3
-8.0
1990
-2.5
-5.5
81.3
86.7
94.1
9.1
1991
-12.3
-15.3
2154.4
1083.4
1171.1
5.6
-6.5
1992
-10.4
-13.4
4129.2
5497.6
4987.5
6.9
-14.4
1993
-
1986.9
1658.0
1716.5
-
-12.1
1994
23773.0
8377.0
a Derived by purchasing power parity method.
In 1993-1995, this country ranked last among the 102 nations that we were able to rate. Itis easy to see why. Economic freedom is restricted in almost every area. Monetary expansionof more than 1,000% per year has led to hyperinflation. Citizens are prohibited from using othercurrencies. Government expenditures consume more than one-fifth of GDP. The legal structureis arbitrary (it is under the control of an authoritarian political regime) and corrupt. Restrictionsabound. Interest and exchange rate controls, restrictions on entry into business, political controlof capital movements, and high marginal tax rates (the top rate is currently 60%) are all part ofthis economic tragedy. This is a politically controlled economy run by an authoritarian leader.
The results have been tragic. Already one of the world's poorest nations, income haspersistently declined during the last two decades. Per capita GDP is now approximately one-halfthe figure of the mid-1970s. Until there is a dramatic change in political and economic structure,the suffering will continue.
225
www.fraserinstitute.org

ZIMBABWE
Part 1: The Economic Freedom Ratings for the Components and Various Area andSummary Indexes: 1975, 1980, 1985, 1990 and 1993-95.(The numbers in parentheses indicate the actual values for the components.)
1975
1980
198519901993-95
Summary RatingsIe
N/R3.7
3.0
2.6
3.5
I s l
N/R3.7
2.6
2.3
3.4
Is2
N/R
3.4
2.9
2.6
3.3
Summary Rating Is1: 5 Year Periods
8
O)
I43.7 3.4
2.6 2.3
N/R
1975 1980 1985 1990 1993-95Year
Components of Economic Freedom 1975 1980 1985 1990 1993-95
I. Money and Inflation(a) Annual Money Growth (last 5 yrs.)(b) Inflation Variablity (last 5 yrs.)
(c) Ownership of Foreign Currency(d) Maint. of Bank Account Abroad
II. Government Operation(a) Govern. Consumption (% of GDP)(b) Government Enterprises(c) Price Controls
(d) Entry Into Business(e) Legal System(f) Avoidance of Negative Interest Rates
III. Takings(a) Transfers and Subsidies (% of GDP)(b) Marginal Tax Rates (Top Rate)(c) Conscription
IV. International Sector(a) Taxes on International Trade (Avg.)(b) Black Market Exchange Rates (Prem)(c) Size of Trade Sector (% of GDP)(d) Capital Transactions with Foreigners
3.4
-
7 (2.7)
0
0
5.57 (12.8)4
-
-
-
-
-
-
-
5.5
8 (2.1)2 (54)
7 (60.2)
3.3
3
7
0
0
3.3
1
4
-
-
-
6
3.5
3
5
0
4.3
8
1
7
2
(11.5)(2.7)
(19.7)
(11.4)(45)
(1.7)
(84)(63.6)
3.16
4
0
0
3.71
4
-
-
-
8
1.6
4
0
0
2.7
226
2
(7.4)
(5.5)
(21.5)
(10.0)(63)
(8.0)
(42)(56.4)
1.9
24
0
0
3.21
4
2--
8
0.8
-
1
0
2.91
4
6
2
(15.8)(5.7)
(22.5)
(60)
(9.2)(15)
(59.0)
1.3
1
3
0
0
3.6
24
25.0
2.5
8
2.3
-3
0
6.0
-
8
9
2
(29.4)(7.0)
(18.8)
(50)
(1)(74.8)
226
www.fraserinstitute.org
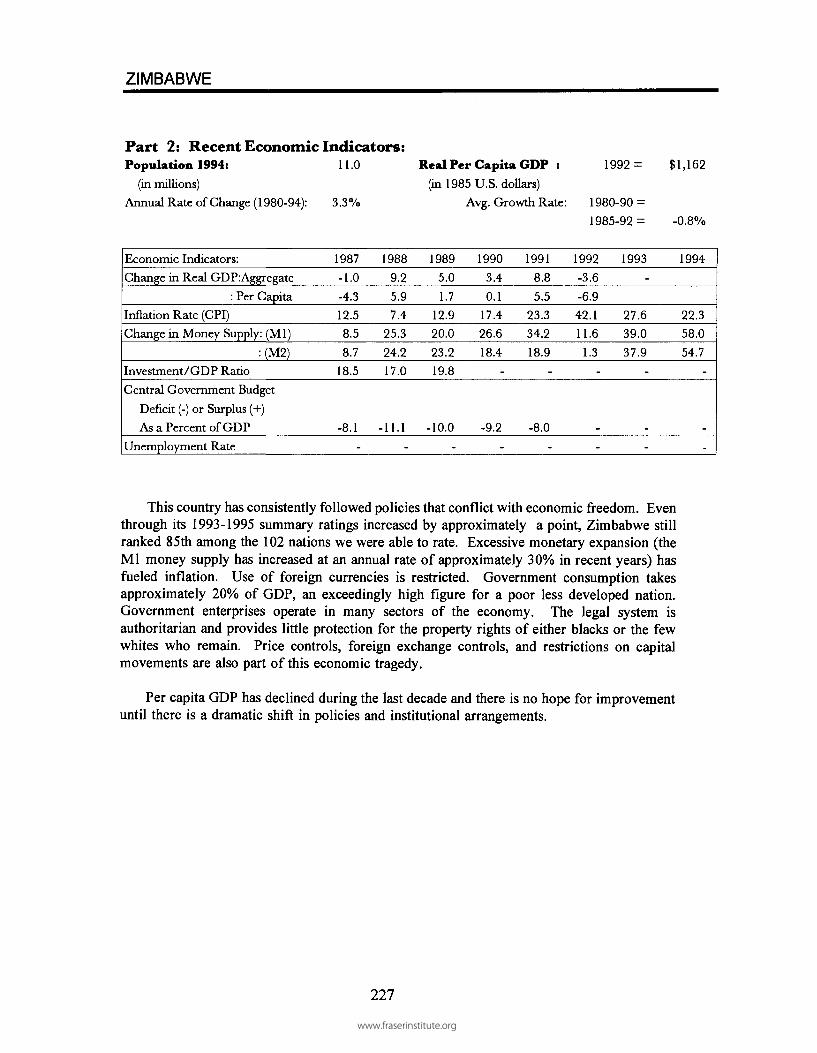
ZIMBABWE
Part 2: Recent Economic Indicators:Population 1994: 11.0
(in millions)
Annual Rate of Change (1980-94): 3.3%
Real Per Capita GDP :(in 1985 U.S. dollars)
Avg. Growth Rate:
1992= $1,162
1980-90
1985-92 -0.8%
Economic Indicators:
Change in Real GDP:Aggregate
: Per CapitaInflation Rate (CPI)Change in Money Supply: (Ml)
:(M2)Investment/GDP Ratio
Central Government Budget
Deficit (-) or Surplus (+)
As a Percent of GDP
Unemployment Rate
1987-1.0
-4.312.58.5
8.7
18.5
-8.1-
1988
9.25.9
7.425.3
24.217.0
-11.1-
19895.0
1.712.920.0
23.219.8
-10.0-
1990
3.4
0.117.426.6
18.4-
-9.2-
1991
8.8
5.523.3
34.218.9
-
-8.0-
1992-3.6
-6.9
42.111.6
1.3-
-
1993-
27.639.0
37.9-
-
1994
22.358.0
54.7-
-
This country has consistently followed policies that conflict with economic freedom. Eventhrough its 1993-1995 summary ratings increased by approximately a point, Zimbabwe stillranked 85th among the 102 nations we were able to rate. Excessive monetary expansion (theMl money supply has increased at an annual rate of approximately 30% in recent years) hasfueled inflation. Use of foreign currencies is restricted. Government consumption takesapproximately 20% of GDP, an exceedingly high figure for a poor less developed nation.Government enterprises operate in many sectors of the economy. The legal system isauthoritarian and provides little protection for the property rights of either blacks or the fewwhites who remain. Price controls, foreign exchange controls, and restrictions on capitalmovements are also part of this economic tragedy.
Per capita GDP has declined during the last decade and there is no hope for improvementuntil there is a dramatic shift in policies and institutional arrangements.
227
www.fraserinstitute.org

www.fraserinstitute.org

Appendix I:
The Ratings for Each of the Components
and the Summary Ratings for 1990,
1985, 1980 and 1975
List of Tables—Appendix I
Table Al-1: Component and Summary Index Ratings: 1990 230
Table Al-2: Component and Summary Index Ratings: 1985 233
Table Al-3: Component and Summary Index Ratings: 1980 236
Table Al-4: Component and Summary Index Ratings: 1975 239
www.fraserinstitute.org

Table A1-1: Component and Summary Index Ratings: 1990
INDUSTRIAL
COUNTRIES
United StatesCanadaAustraliaJapanNew ZealandAustriaBelgiumDenmarkFinlandFranceGermanyIcelandIrelandItalyNetherlandsNorwaySpainSwedenSwitzerlandUnited Kingdom
CENTRAL/SOUTH
ArgentinaBelizeBoliviaBrazilChileColombiaCosta RicaDominican RepEcuadorEl SalvadorGuatemalaHaitiHondurasJamaicaMexicoNicaraguaPanama
A
983918967951878227
101
1B
10
10
9
10
4
10
10
10
10
10
10
6
710
10
6
9
9
10
9
AMERICA
0
6
1
0
1
1
3
1
1
3
2
5
2
2
0
0
10
0
7
0
0
6
8
6
1
1
2
1
3
3
4
0
0
10
C
10
10
10
10
10
10
10
10
10
10
10
10
0
10
10
10
0
10
10
10
10
0
10
0
10
0
10
0
10
0
10
10
10
0
10
0
10
D
10
10
10
10
10
10
10
10
10
10
10
10
0
10
10
10
0
0
10
10
10
0
10
0
10
0
10
0
10
0
10
10
10
0
10
0
10
A
2
1
2
9
3
2
5
0
1
22
1
53
5
1
5
0
6
1
10
1
6
59
8
2
9
9
7
10
-
7
6
9
0
2
II
B
8
6
6
8
6
2
6
46
6
6
4
4
2
6
24
4
8
6
4
8
4
2
8
48
6
6
8
8
6
8
4
4
0
6
C
8
8
6
6
9
5
2
6
6
6
9
-
75
7
56
6
7
8
0
-
6
0
8
6
-
4
0
-
6
2
-
4
0
-
2
F
10
10
10
10
10
10
10
10
10
8
10
6
10
10
10
10
10
10
10
10
0
10
8
0
8
8
8
-
0
8
8
-
8
8
8
0
10
A
3
23
4
0
0
0
0
20
2
4
2
0
0
0
2
0
23
4
10
8
3
4
7
6
9
7
10
9
-
9
9
5
5
5
III
B
7
5327
4
20
0
3
3
-
1
5
0
3
3
0
8
5
7
4
10
9
3
8
9
0
5
2
7
9
577
-
3
C
10
10
10
10
10
0
0
0
0
0
0
10
10
0
0
0
0
0
0
10
0
10
0
0
0
0
10
10
0
0
0
10
0
10
0
0
10
A
9
9
7
9
8
9
10
10
9
10
10
6
710
10
10
9
9
8
10
0
18
6
6
3
4
2
6
6
7
4--
8
6
6
IV
B
10
10
10
10
6
10
10
10
10
10
10
6
8
10
10
10
78
10
10
10
3
10
410
4
10
1
10
3
10
710
3
10
4
10
C
3
9
5
14
8
10
3
2
58
2
8
4
9
6
3
5
5
5
0
3
50
7
3
3
2
5
0
1
0
5
5
4
43
D
10
8
8
8
10
5
10
5
25
10
2
5
5
8
8
8
10
10
10
0
8
2020
5
2
2
2
5
0
0
2
5
0
10
Summary Ratings
(le)
7.8
7.56.5
7.46.4
6.0
6.7
5.4
5.5
6.2
7.0
4.8
5.55.9
6.7
5.3
4.8
5.2
7.77.0
3.4
5.2
5.8
2.1
6.1
4.4
6.5
3.4
4.6
4.0
6.3
5.1
5.9
4.7
5.1
1.5
6.7
(Is1)
7.4
6.9
6.0
6.9
6.0
5.4
5.9
4.6
4.8
5.5
6.3
4.7
5.0
5.4
5.8
4.8
4.7
4.5
7.3
6.6
3.8
5.4
6.3
2.9
5.7
4.8
6.6
3.6
4.9
4.3
6.6
5.46.0
5.2
5.3
2.0
6.3
(Is2)
8.7
8.5
7.3
7.9
7.2
6.7
7.5
6.4
6.3
7.0
7.8
5.4
5.7
6.4
7.6
6.1
4.7
5.8
8.2
7.8
3.2
5.1
5.5
1.4
6.3
3.5
7.1
2.7
4.3
3.1
6.0
5.2
5.7
3.8
4.8
1.1
7.5
230
www.fraserinstitute.org

Table A1 -1:1990 (coni)
CENTRAU- A BSOUTH AMERICA (coni)
ParaguayPeruTrinidad/TobagoUruguayVenezuela
1
0802
EUROPE/MIDDLE EAST
BulgariaCyprusCzechoslovakia
Czech RepSlovakia
EgyptGreeceHungaryIranIsraelJordanMaltaPolandPortugalRomaniaSyriaTurkey
ASIA
BangladeshFiji
Hong KongIndiaIndonesiaMalaysiaNepalPakistanPhilippinesSingaporeSouth KoreaSri LankaTaiwanThailand
3
II
604
21
29 1 0
10
623215
5
973622
10 1 002620
93453725287335
06361
8979
4
4
9
8
6
7
2
5
9
9
C
10
10
0
10
10
0
0
0
10
10
0
10
10
0
0
10
0
0
10
10
0
0
10
0
10
10
0
10
0
10
0
0
10
10
D
10
0
0
10
10
0
0
0
10
0
0
10
0
0
0
10
0
0
0
10
0
0
10
0
10
10
0
0
0
10
0
0
10
0
A
10
10
4
6
9
2
6
1
7
1
8
70
0
2
9
3
6
5
6
6
3
10
7
9
6
7
5
8
8
8
9
2
9
II
B
8
4
2
6
2
0
6
0
2
2
0
2
2
6
4
0
2
0
2
4
6
6
10
0
2
6
4
4
4
8
6
4
4
6
C
4
2
4
4
4
0
0
0
2
0
6
2
0
2
0
2
4
0
-
6
0
6
10
3
6
5
-
-
2
8
3
-
6
4
F
20680
-10
-
686-
64
1008--
2
106-
81010106
1010108
108
A
9
8
4
3
5
0
4
0
4
0
0
72
72521-
7
-1010598--
108856
10
III
B
847
107
-04
2430450-
5--
4
-39276-
3793-
54
C
00
10100
000
00000
101000000
101010100
1010101000
1000
A
76768
966
51063966-
9977
149087204
107286
IVB
3
4
2
10
10
1
6
2
2
6
4
0
6
4
7
5
6
0
0
7
1
6
10
4
10
10
4
4
5
10
8
3
10
10
C
8
1
1
1
7
4
2
6
10
3
5
4
2
10
4
4
6
1
4
5
1
8
10
3
10
10
1
4
10
10
6
5
5
10
D
520
105
000
02002220500
0
02
10225022
105052
Summary Ratings
(le)
6.13.44.06.15.2
1.74.02.5N/RIN/r\
N/R4.73.53.13.22.94.24.33.14.12.13.24.5
4.05.29.23.76.57.34.14.55.48.55.14.26.16.2
(Is1)
6.44.04.36.35.5
1.63.82.4N/Ri\/r\
N/R4.23.43.03.23.04.43.83.34.12.23.24.6
3.85.39.33.76.67.14.14.25.78.55.24.25.96.3
(Is2)
5.62.43.56.55.0
1.43.72.4N/RIN/r\
N/R
4.73.52.73.02.84.14.52.73.91.52.64.4
3.64.89.23.36.07.43.64.34.48.54.53.46.45.5
231
www.fraserinstitute.org

Table A1 -1:1990 (cont )
AFRICA
AlgeriaBeninBotswanaBurundiCameroonC African RepChadCongo PeoplesCote d' IvoireGabonGhanaKenyaMadagascarMalawiMaliMauritiusMoroccoNigerNigeriaRwandaSenegalSierra LeoneSomaliaSouth AfricaTanzaniaTogoTunisiaUgandaZaireZambiaZimbabwe
A
9
10
2
10
9
10
7
8
9
10
1
3
2
1
7
25
10
2
10
9
0
0
2
1
9
10
0
0
0
2
1
B
28
2
3
53
3
1
7
2
5
9
5
4
5
10
7
4
1
6
7
0
0
10
2
99
0
1
1
4
C
0
0
0
0
0
0
0
0
0
0
10
0
0
0
0
0
0
0
0
0
0
0
0
0
0
0
0
0
0
0
0
D
0
0
0
0
0
0
0
0
0
0
0
0
0
0
0
0
0
0
0
0
0
0
0
0
0
0
0
0
0
0
0
A
3
6
2
8
7
8
1
22382
1056755755
10-
18549721
II
B
4464464046246446262666440442204
C
--
6-
2--
0--
02-
2--
0-
4-
4204024
-
-
0
2
F
-
8
4
-
8
10
8
10
8
8
2
10
-
6
8
8
0
-
0
10
8
0
0
8
4
8
-
0
-
0
8
A
-
-
5
-
8
-
10
-
-
10
8
8
9
8
10
7
8
-
-
8
-
9
-
6
-
-
4
-
10
-
-
IllB
--
3-
1--
44123-
3-
70-
2-
4--
53--
3101
C
00
10101000
100
1010100
100
1000
10100
1000000
1010100
A
--
40616-
161405632-
60-
5-
8-
11-
161
IVB
1656666666565465463361161652404
C
72
10023865516536663
1003136
1048109
6
D
005000000000
022
2
5
0
0
0
0
0
0
2
0
0
5
0
2
2
2
Summary Ratings
(le)
2.9*
4.3
4.4
3.7
4.4
4.3
4.4
3.4
3.8
4.8
3.3
4.4
3.9
3.8
4.9
5.4
3.0
3.8
3.3*
4.6
4.3
3.2
0.9
4.4
2.3
3.9
4.5
2.2
2.8
1.9
2.6
(Is1)
2 .7*
4.4
4.3
3.9
4.5
4.2
4.7
3.3
3.7
4.9
3.6
4.5
4.4
4.1
5.4
5.6
3.2
3.9
3.3*
4.7
4.3
3.9
0.8
4.6
2.3
3.8
4.3
2.5
3.4
1.8
2.3
(Is2)
2.6*
3.8
4.43.4
3.9
3.7
3.7
3.1
3.7
4.4
2.6
4.0
2.7
3.2
4.0
4.8
2.5
3.5
2.9*
4.1
4.0
2.2
0.9
4.1
1.5
3.6
4.3
1.5
1.9
1.8
2.6
* Thes e summary ratings should be interpreted with caution because they are based on data for only ten of the potential fifteencomponents in the index for this year.
232
www.fraserinstitute.org
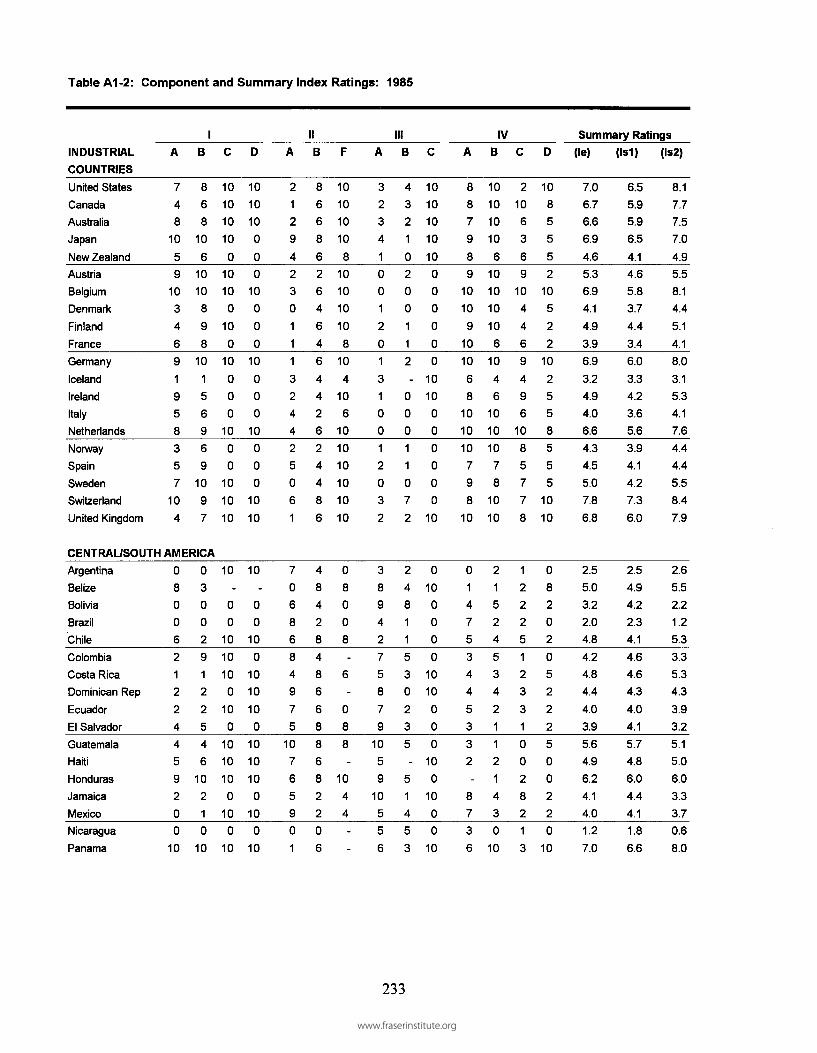
Table A1-2: Component and Summary Index Ratings: 1985
INDUSTRIAL
COUNTRIES
United StatesCanadaAustraliaJapan
New ZealandAustriaBelgiumDenmark
FinlandFranceGermany
IcelandIrelandItalyNetherlandsNorwaySpainSwedenSwitzerlandUnited Kingdom
A
748
10
59
103469
1958357
10
4
B
8
6
8
10
6
10
10
8
9
8
10
1
5
6
9
6
9
10
9
7
CENTRAL/SOUTH AMERICA
ArgentinaBelizeBoliviaBrazilChileColombiaCosta RicaDominican RepEcuadorEl SalvadorGuatemalaHaitiHondurasJamaicaMexicoNicaraguaPanama
0
8
0
0
6
2
1
2
2
4
4
5
9
2
0
0
10
0
3
0
0
2
9
1
2
2
5
4
6
10
2
1
0
10
c
10
10
10
10
0
10
10
0
10
0
10
0
0
010
0
0
10
10
10
10
-
0
0
10
10
10
0
10
0
10
10
10
0
10
0
10
D
10
10
10
0
0
0
10
0
0
0
10
0
0
0
10
0
0
0
10
10
10
-
0
0
10
0
10
10
10
0
10
10
10
0
10
0
10
A
2129
4
2
3
0
11
1
3
2
4
4
2
5
0
6
1
7
0
6
8
6
8
4
9
75
10765901
II
B
8668
6264
646
4
4
2
6
2
4
48
6
4
8
4
2
8
4
8
6
6
8
8
6
8
2
2
0
6
F
10
10
10
10
8
10
10
10
10
8
10
4
10
6
10
10
10
10
10
10
0
8
0
0
8
-
6
-
0
8
8
-
10
4
4
-
A
32341001
20
1
3
1
0
0
1
2
0
3
2
3
8
9
4
2
7
5
8
7
9
10
5
9
10
5
5
6
III
B
4
3
2
1
0
2
0
0
1
1
2-
0
0
0
1
1
0
7
2
2
4
8
1
1
5
3
0
2
3
5
-
5
1
4
5
3
C
10
10
10
10
10
0
0
0
0
0
0
10
10
0
0
0
0
0
0
10
0
10
0
0
0
0
10
10
0
0
0
10
0
10
0
0
10
A
8
8
79
8
9
10
10
9
10
10
6
8
10
10
10
7
9
8
10
0
1
4
7
5
3
4
4
5
3
3
2
-
8
7
3
6
IV
B
10
10
10
10
6
10
10
10
10
6
10
4
6
10
10
10
7
8
10
10
2
1
5
2
4
5
3
4
2
1
1
2
1
4
3
0
10
C
21063
69
104
469
496
1085778
12225123
31
002821
3
D
10855
52
105
22
10
2
5
5
8
5
5
51010
08202052
22500220
10
Summary Ratings
(le)
7.0
6.7
6.6
6.9
4.6
5.3
6.9
4.1
4.93.9
6.9
3.2
4.9
4.0
6.6
4.3
4.5
5.0
7.8
6.8
2.5
5.0
3.2
2.0
4.8
4.2
4.8
4.4
4.0
3.9
5.6
4.9
6.2
4.1
4.0
1.2
7.0
(Is1)
6.55.9
5.9
6.5
4.1
4.6
5.8
3.7
4.4
3.4
6.0
3.3
4.2
3.6
5.6
3.9
4.1
4.2
7.3
6.0
2.5
4.9
4.2
2.3
4.1
4.6
4.6
4.3
4.0
4.1
5.7
4.8
6.0
4.4
4.1
1.8
6.6
(Is2)
8.1
7.7
7.5
7.0
4.9
5.5
8.1
4.4
5.1
4.1
8.0
3.1
5.3
4.1
7.6
4.4
4.4
5.5
8.4
7.9
2.6
5.5
2.2
1.2
5.3
3.3
5.3
4.3
3.9
3.2
5.1
5.0
6.0
3.3
3.7
0.6
8.0
233
www.fraserinstitute.org

Table A1-2:1985 (cont)
CENTRAU- ASOUTH AMERICA (cont)
ParaquayPeruTrinidad/TobagoUruguayVenezuela
50
6
1
3
EUROPE/MIDDLE EAST
BulgariaCyprusCzechoslavakia
Czech RepSlovakia
EgyptGreeceHungaryIranIsraelJordanMaltaPolandPortugalRomaniaSyriaTurkey
ASIA
BangladeshFijiHong KongIndiaIndonesiaMalaysiaNepalPakistanPhilippinesSingapore
South KoreaSri LankaTaiwan
Thailand
-
8
9
-
-
6
2
8
1
0
10
9
1
3
9
2
1
3
8
9
4
5
10
4
76
10
7
5
7
9
I
B
3
0
1
1
4
7
7
8
-
-
6
8
10
3
0
46
0
7
5
4
2
7
57
10
7
7
8
81
7
5
3
5
8
C
10
10
0
10
10
0
0
0
-
-
10
10
0
10
10
10
0
10
0
0
10
0
0
0
10
0
10
10
0
0
0
10
0
0
10
0
D
10
0
0
10
10
0
0
0
-
-
10
0
0
10
0
0
0
10
0
0
10
0
0
0
10
0
10
0
0
0
0
0
0
0
10
0
A
10
9
1
5
8
9
6
1
-
-
3
1
8
5
0
0
2
9
51009
102
1077587
10
5
8
8
4
6
II
B
8
4
2
6
4
0
6
0
-
-
22022
6402024
66
10
0266248
6446
F
--
88
-
-
8-
--
66--
0-
10-
10-
-8
68-
8-
10684
10
108
1010
A
99
34
7
24-
--
32081
6201
4
-4
-7
10
58
8
-
-
10
9
9
6
8
10
III
B
8
0
4107
-1
-
--
21
-03-
0-
0-
-3
1
39
076-
11
8
2032
C
00
10100
000
--
00000
101000000
101010
100
101010100
01000
A
82551
66-
--
19607
5629-
67
039
08530597174
IV
B
02
2103
0
80
--
1
30056507006
1
510
45
10465
104466
C
4411
4
537
--
849059337116
14
10
29
10158
108577
D
52
0105
000
--
02002
2202000
05
10
225022
102022
Summary Ratings
(le)
6.23.23.06.35.0
2.84.32.7*N/RN/R3.93.53.62.62.4
5.64.22.53.93.12.83.8
3.54.89.5
3.56.07.24.34.24.77.9
5.23.85.85.3
(Is1)
6.53.43.16.55.2
2.94.12.4*N/RN/R3.33.23.32.72.5
5.43.72.23.53.22.73.8
3.34.89.53.46.17.14.43.94.9
8.05.13.65.55.3
(Is2)
5.72.22.96.74.7
1.84.02 .4*N/RN/R4.23.43.02.52.55.74.42.53.71.93.33.0
3.04.89.5
3.15.67.03.84.03.87.54.33.35.84.6
234
www.fraserinstitute.org

Table A1-2:1985 (cont )
AFRICA
AlgeriaBeninBotswanaBurundiCameroonC African Rep
ChadCongo Peoples R
Cote d' IvoireGabonGhanaKenyaMadagascarMalawiMaliMauritiusMoroccoNigerNigeriaRwandaSenegalSierra LeoneSomaliaSouth AfricaTanzaniaTogoTunisiaUgandaZaireZambiaZimbabwe
A
358
57
6
2
6
8
3
1
8
5
6
4
10
79
7
10
8
1
1
2
3
7
3
0
0
2
6
1
B
5
3
2
3
9
3
22
5
6
0
10
3
7
5
9
10
4
3
4
9
1
1
9
4
4
6
0
1
24
C
0
0
0
0
0
0
0
0
0
0
0
0
0
0
0
0
0
0
0
0
0
0
0
0
0
0
0
0
0
0
0
D
0
0
0
0
0
0
0
0
0
0
0
0
0
0
0
0
0
0
0
0
0
0
0
0
0
0
0
0
0
0
0
A
450
10
9
6
3
3
6
2
9
3
8
2
784
56
7
3
10
2
3
56
3
7
10
0
1
II
B
448446
404604644624264644042220
4
F
-
8
8
6
6
8
8
8
10
8
0
10
-
8
6
10
6
-
4
8
6
0
0
8
0
8
6
0
-
0
8
A
-
-
5
-
10
-
-
-
-
-
10
6
-
8
8
6
7
-
10
-
-
10
-
6
6
-
5--
74
IIIB
-
-2-
2--
-
5-
10-
3-
70-
3-
1--
40-
201
00
c
00
1010100
0100
1010100
100
1000
10100
1000000
1010
100
A
-
-305--
-1
403-
261
4-
6-
21-
9
4
201242
IVB
084388
88881
753885802811308436
22
C
65
10057
81087052
3947730600908609
106
D
005000
000000022250000
0020000222
Summary Ratings
(le)
2.5*3.84.73.45.44.4
3.54.24.54.62.14.73.3*4.24.96.04.24.1 *3.84.43.83.11.04.51.64.22.81.63.5
2.63.0
(Is1)
2.4 *3.74.43.55.64.4
3.34.04.44.52.84.33.5*4.35.26.04.14.1 *4.34.43.53.91.14.51.94.12.81.73.32.72.6
(Is2)
2.1 *3.35.12.84.63.9
3.13.84.04.51.04.62.7*3.94.05.53.93.6*2.93.93.82.10.94.00.93.72.41.32.92.42.9
N/R = No rating given because data were available for less than ten of the components of the index.
* These summary ratings should be interpreted with caution because they are based on ratings for only ten of the fourteen
components in the index for this year.
235
www.fraserinstitute.org

Table A1-3: Component and Summary Index Ratings: 1980
INDUSTRIAL
COUNTRIES
United StatesCanadaAustraliaJapan
New ZealandAustriaBelgiumDenmarkFinlandFranceGermanyIcelandIreland
ItalyNetherlands
NorwaySpainSwedenSwitzerlandUnited Kingdom
CENTRAU-
SOUTH AMERICA
ArgentinaBelizeBoliviaBrazilChileColombiaCosta RicaDominican RepEcuador
El SalvadorGuatemalaHaitiHondurasJamaicaMexico
NicaraguaPanamaParaguay
A
81059
7101077481328
103474
0-
11
01282242321
152
1B
9
9
9
9
9
10
9
10
9
10
10
3
6
8
9
769
107
0621
05555
362745174
C
10101010
010100
101010
000
1000
10100
10-
100
100
10
010
01010100
10
101010
D
1010100
00
10000
10000
10000
100
10-
10000
10
1010
010
10100
10
101010
A
2228
2220221
325326071
6369
78
210
5
6
9
8
7
1
8
1
2
10
IIB
8
6
6
8
6
2
6
4
6
4
6
44
2
6
24
4
8
4
4864
84
866886822668
F
10101010
68
101088
10
464
1066864
086-
8-
--
--
8--
44-
--
A
3344
1101
302421013032
4893385968
10---
7769
IIIB
0420
2200133-
1
0001
070
6-
34225-
5
38-
804
53-
C
10101010
10000000
1010000000
10
0100000
10
100
00
1010100
0100
A
9879
89
10109
1010
47
10109798
10
1231
73613461490
275
IVB
10108
10
101010786
10
51010106
106
1010
8344641
241444211
105
C
3953
57
103556275872565
0322422
13211541352
D
10822
52
1052282558252
1010
08202022
2
2
50
0
220
10
5
Summary Ratings
(le)
6.97.56.06.4
5.15.26.84.35.04.66.6
3.24.53.86.43.84.04.07.34.7
3.35.84.42.54.13.14.9
5.34.63.46.44.56.12.93.73.56.65.8
(Is1)
6.26.85.55.9
4.84.65.73.84.64.26.0
3.44.23.65.43.43.93.47.14.5
3.6
5.94.52.7
3.93.54.8
5.54.63.76.84.3
6.12.83.8
3.66.36.1
(Is2)
8.28.56.86.4
5.65.48.04.65.24.77.6
3.14.83.87.54.03.84.47.95.3
3.46.14.31.73.8
2.1
5.4
4.9
4.7
2.6
6.0
4.6
6.1
2.9
3.4
3.6
7.5
5.5
236
www.fraserinstitute.org

Table A1-3:1980 (con t)
CENTRAU-
S. AMERICA (coni)
PeruTrinidad/Tobago
UruguayVenezuela
EUROPE/-
MIDDLE EAST
BulgariaCyprusCzechoslovakia
Czech RepSlovakia
EgyptGreeceHungaryIranIsrael
JordanMaltaPolandPortugalRomaniaSyriaTurkey
ASIA
BangladeshFijiHong KongIndia
IndonesiaMalaysiaNepalPakistanPhilippinesSingapore
South KoreaSri LankaTaiwanThailand
A
1
103
-2-
_
12-
11
27-
3821
210961522492225
1
B
1
223
-8-
58630
77-
6
761
14452649766657
C
00
1010
000
_
10100
1010
10-
1000
100
00
100
10100000
00
100
D
0
01010
000
«.
1000
1000-
100
0100
00
100
1010000000
100
A
8777
106
2
.
4
481
0
0495
1007
104
10983
10
89879
47
II
B
4264
060
_
2
20226402044
66
1002462486446
F
-
-
6-
-4-
_
466-
0-
6-
4-
-
0
66-
826668
104484
A
9
549
-5-
_
23-
51
53-
23-
5
-
810686--
10109
48
10
III
B
2-
107
01
-
_
03-
-1-
0-
0-
-
0
1
210
132-
214
0033
C
010100
000
_
0
000
0101000
000
101010100
101010000
1000
A
17
27
-6
-
0
7606
46-
8-
34
059073
2049
61
74
IVB
42
1010
160
_
55018
10407
024
1
41067
10
1036
104586
C
41
05
23
-
102824
10475530
1
49
21010
148
10
8877
D
20
108
000
.
0
20022202000
05
1022502280022
Summary Ratings
(le)
3.03.06.06.3
N/R3.6N/RN/RI N/r\
N/R
3.53.83.32.62.4
5.34.5N/R3.33.2*3.42.0
2.94.99.33.84.96.0
4.33.64.77.0
4.03.75.44.7
(Is1)
3.43.46.36.6
N/R3.6N/RN/RIN/r\
N/R2.83.83.22.52.35.34.0N/R3.13.2*3.12.3
2.85.09.43.85.05.6
4.63.54.87.14.03.55.35.0
(ls2)
2.02.26.46.1
N/R3.2
N/RN/RiN#r\
N/R3.9
3.5
2.32.92.65.64.8
N/R3.02 . 2 *3.91.4
2.44.79.23.24.66.7
3.83.23.86.4
3.23.35.43.9
237
www.fraserinstitute.org
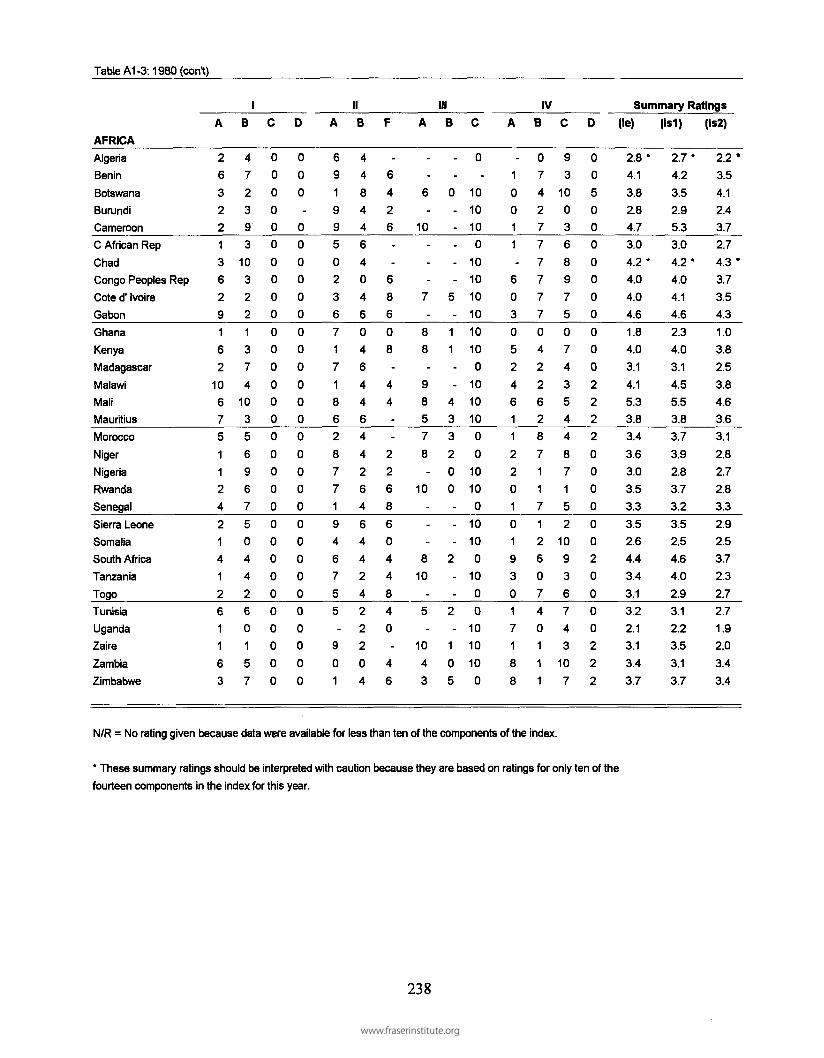
Table A1-3:1980 (cont )
AFRICA
AlgeriaBeninBotswanaBurundiCameroonC African Rep
ChadCongo Peoples RepCote d' IvoireGabonGhanaKenyaMadagascarMalawiMaliMauritiusMorocco
NigerNigeriaRwandaSenegal
Sierra LeoneSomaliaSouth AfricaTanzaniaTogoTunisiaUgandaZaire
ZambiaZimbabwe
A
26
3221
36291
62
10675
112421
412611
63
B
47
239
310322
1
3
74
10
3
56967
5044
2601
57
C
00
00000000000
0000
00000000000000
D
00
0-
000000000000000000000
0000
00
A
691
9950
23671718628
7
71
946755-
9
01
II
B
44
8446404604
644644264644
24222
04
F
-
6
426--
68608-
44
-
-
22686044840-
46
A
-
-6-
10--
-
7-
88
-9857
8-
10-
--
810
-
5-
10
43
III
B
-
-
0--
--
-
5-
11
--
433
200-
--
2--
2-
1
05
C
0
-
10
10
10
0
10
10
10
10
10
10
0
10
10
10
0
0
10
10
0
10
10
0
10
0
0
10
10
10
0
A
-
1
0011-
6030524611
2201
01930171
88
IV
B
07
427777770422628
71
1712607401
11
C
9
310036
8975074
3544
87152
10936743
107
D
00
500000000002222
00000020000222
Summary Ratings
(le)
2.8*4.13.82.84.73.04 .2 *4.04.04.61.84.03.14.15.33.83.4
3.63.03.53.33.52.64.43.43.13.22.13.13.43.7
(Is1)
2.7*4.2
3.52.95.33.04 .2*4.04.1
4.62.34.03.14.55.53.83.73.92.83.73.23.52.54.64.02.93.12.23.5
3.13.7
(Is2)
2 .2 *3.54.12.43.72.74 .3*
3.73.54.31.03.82.53.84.63.63.1
2.82.72.83.32.92.53.72.32.72.71.92.03.43.4
N/R = No rating given because data were available for less than ten of the components of the index.
* These summary ratings should be interpreted with caution because they are based on ratings for only ten of thefourteen components in the index for this year.
238
www.fraserinstitute.org

Table A1-4: Component and Summary Index Ratings: 1975
INDUSTRIAL
COUNTRIES
United StatesCanada
Australia
Japan
New Zealand
AustriaBelgiumDenmark
FinlandFranceGermany
Iceland
Ireland
ItalyNetherlandsNorway
Spain
Sweden
Switzerland
United Kingdom
CENTRAL/-
S.AMERICA
Argentina
BelizeBoliviaBrazil
ChileColombia
Costa Rica
Dominican RepEcuador
El SalvadorGuatemala
HaitiHondurasJamaica
Mexico
Nicaragua
PanamaParaguay
A
87
74
3
66
525
61
636
4
25
10
4
0-
21
02
2
5
235
272
43
72
B
85
5
4
6
107g
4
710
2
54
10
g
6
710
3
0
213
04
2
31
53
44
23
2
63
1
C
1010
10
10
0
1010
0100
100
0
0
100
0
1010
0
10-
100
00
10
0
100
0
10100
10
10
1010
D
1010
10
0
0
010
000
10
0
00
10
0
00
10
0
10-
100
00
10
0
100
10
0100
1010
1010
A
21
3
8
4
33
0
331
3
263
1
8
07
1
7-
88
4g
5
10
57
10
g7
2gg
210
II
B
86
6
8
6
26
464
64
4
262
4
48
4
6
864
66
8
6
68
8
6822
6
88
F
86
4
4-
66
8-
8
8
2
466-
-
46
4
-
-
--
-
-
-
-
--
-
--
-
-
-
--
A
34
4
4
1
10
23
02
4
220
-
-
0
-
3
4-
10-
48
-
-
-
810
-
105
7
8
7g
inB
04
21
3
421
25
4-
0
55
0
41
7
7
4-
-
5
06
5
5
5
49-
92
510
4-
C
1010
1010
10
00
000
010
10
00
0
0
00
10
0-
00
00
10
00-
0
10-
10
00
100
A
96
6
9
8
8109
810
10
2
6
1099
59
7
10
0-
25
63
5
0
246
166
36
72
IV
B
1010
8
10
6
1010
88
10
101
105
10
87
810
10
1
3
62
6
3
5
3
644
10104
104
104
C
2g
43
5
69
344
63
6
59
9
2
55
7
0-
82
52
3
2
5
32
0530
4
71
D
108
2
2
5
210
5
228
2
5552
2
22
2
0-
20
20
2
2
2250
0
2
25
105
Summary Ratings
(le)
6.66.5
5.4
5.3
4.5
4.86.2
4.14.04.46.4
2.6
4.24.06.33.8
3.6
3.97.1
4.7
3.1
N/R
5.32.8
2.83.7
5.3
3.4
4.44.3
5.94.57.13.0
4.86.0
7.35.3
(Is1)
6.06.1
5.05.2
4.3
4.65.5
3.83.94.3
5.92.7
3.94.15.73.6
3.g
3.5
7.1
5.0
3.1
N/R
5.53.2
2.84.3
5.2
3.64.34.7
6.5
4.87.43.2
5.0
6.4
7.0
5.6
(Is2)
7.g7.5
6.15.3
4.6
4.97.3
4.34.04.4
7.3
2.4
4.6
3.67.13.8
3.0
4.3
7.2
4.7
3.1
N/R
4.92.0
2.52.6
5.6
2.7
4.6
3.65.34.1
6.82.8
4.55.5
8.25.0
239
www.fraserinstitute.org

Table 1-4:1975 (Continued)
CENTRAL/-
S. AMERICA (con't)
PeruTrinidad/TobagoUruguay
Venezuela
EUROPE/-
MIDDLE EAST
Bulgaria
CyprusCzechoslavakia
Czech RepSlovakia
EgyptGreeceHungary
IranIsraelJordan
MaltaPoland
Portugal
Romania
SyriaTurkey
ASIA
BangladeshFijiHong KongIndia
Indonesia
Malaysia
NepalPakistan
Philippines
Singapore
South KoreaSri LankaTaiwan
Thailand
A
2
201
-
7-
--
2
3-
222
6-
3-
2
2
-
355
1
5
34
3
71
828
B
4101
-
7-
--
6
37-
2
48-
4-
25
1
2
5
3
1
2
22
2
5
3
3
2
2
1
C
0
0
10
10
0
0
0
-
-
0
10
0
10
10
0
-
10
0
0
10
0
0
0
10
0
10
0
0
0
0
0
0
0
10
0
o
0
0
10
10
0
0
0
-
-
0
0
0
0
0
0
-
10
0
0
10
0
00
10
0
10
10
0
0
0
0
0
0
10
0
A
7
7
6
7
-
3
-
-
-
0
58
0
0
0
2-
5-
17
107
109
9
3
108
8
879
4
8
II
B
426
6
0
60
--
4
20
426
40
20
6
4
6
6100
4
4
6
24
86
246
F
-
-
-
-
-
-8
--
-
-
4--
-
-
-
-
-
-
2
-0
--
2-
--
8-
2-
8_
A
9-
3
8
-
4
-
--
0
4-
4-
-
3-
3-
-
5
-9
107
95
--
10
10949
10
III
B
4
-
7
10
-
3
-
--
-
4
-8-
-
-
-
0
-
-
-
-3
100
4
4
-1
3
42-
33
C
010
10
0
0
0
-
--
0
00
00
10-
0
0
0
00
10101010
0
10
1010
10
00
10
00
A
17
7
6
-
7
-
-
-
0
7-
7
2
46-
6-
20
3
4
90
64
200
9
71
6
4
IV
B
2
210
10
1
60
--
8
60
728
60
20
8
4
2
4105
5
10
24
4
1071
67
C
221
6
-
2-
--
10
210
104
105-
3-
41
0491
9
10
048
1085
55
D
2
08
8
0
0
0
--
0
20
522
02
00
0
0
0
5102
25
02
2
80
02
2
Summer Ratings
(le)
3.1
2.9
5.7
6.4
N/R
3.8
N/R
N/R
N/R
2.7
3.73.1 *
4.92.24.3
N/RN/R
2.3N/R
3.9
2.5
3.3 *4.19.03.0
5.05.4
3.23.0
4.4
6.54.03.64.9
4.6
(IS1)
3.7
3.25.8
6.9
N/R
3.9N/R
N/RN/R
2.4
3.9
3.0 *
5.0
2.1
4.2
N/R
N/R
2.2
N/R
3.7
2.8
3.5 *
4.6
9.2
3.3
5.2
5.2
3.4
2.94.6
6.8
4.3
3.6
4.9
4.9
(ls2)
2.1
2.3
6.2
6.3
N/R
3.6
N/R
N/RN/R
3.0
3.22.1 *
4.82.34.4
N/R
N/R
1.8
N/R
4.51.9
2.5 *
3.69.02.3
4.65.9
2.6
2.63.6
5.93.2
2.84.8
3.7
240
www.fraserinstitute.org

Table 1-4: 197 5 (con't)
AFRICA
AlgeriaBenin
Botswana
Burundi
Cameroon
C African RepChad
Congo Peoples RepCote d1 Ivoire
Gabon
GhanaKenya
Madagascar
MalawiMaliMauritiusMorocco
Niger
Nigeria
Rwanda
Senegal
Sierra LeoneSomaliaSouth Africa
TanzaniaTogo
Tunisia
Uganda
Zaire
Zambia
Zimbabwe
A
21
-
9
4
63
7
5
2
19
73
212
21
3
2
335
23
3
12
5
-
B
14
31
439
10
21
22
3441
21
1
1
4
35541
31
5
2
7
IC
00
0-
0
00
00
0
0
0
-0
00
0
0
0
-
00
0000
000
0
0
D
0
0
0
-
0
00
0
0
0
00
0
0
000
00
00
00000
0
00
0
0
A
79278
30
2
3
7
7
2
8
6
8
7
48
73
5
71
6
3
5
5
-
7
0
7
IIB
4
48
4464
0
46
04
6
446444
64
64424
2
22
0
4
F
-----•
-
-
-
-
-
4
4---
-
-
2
--
-
4-
--
-
-
-
4-
A
--
6-
9-----
8-
-10
855-
8
109
9--
10-
9-
10
5
-
Ill
B
-
-
0
--
-
-
--
-
00-
0--
8
-
0
--
-
-
1
0-
-
-
2
0-
c
10
10
10
-
10-
10
1010
101010
-
10
10100
1010
10-
10100
10-
0
1010
10-
A
-
1
1
1
0
-
1
6
-
2
0
6
0
6
0
4
3
44
0
2
108
331
0
078
IVB
27
22
7
777771
5
3
35
2
6
72
2723617401
1
2
C
10
3
10
0
4
78
88
61
8
46
556
6
6
0
73296
6
5
01
107
D
0
0
-
0
0
00
00
0
00
0
22
2
0
0
0
0
0
0
0
2
0
0
0
0
22-
Summary Ratings
(le)
3.6 *
3.5
3.9
N/R4.2
N/R3.8
4.5
3.9 *
3.8
2.13.8
3.74.1
4.03.73.4
3.83.23.1
3.8
3.82.64.1
3.03.1 *
2.9
1.2 *
3.2
3.1N/R
(Is1)
3.5 *
3.8
3.5N/R
4.7N/R
3.7
4.53.9 *
3.92.5
3.4
3.6
4.3
4.43.93.9
4.0
3.3
3.8
4.3
4.22.63.9
3.33.2 *
3.4
1.2 *3.6
2.9N/R
(ls2)
3.0 *3.0
4.0N/R
3.3N/R4.0
4.23.8 *
3.41.33.9
3.23.4
3.23.12.8
3.32.5
2.53.0
2.92.73.72.42.7 *
1.9
1.3 *
2.3
3.0
N/R
N/R= N o rating given because data were available for less than ten of the components of the index.
* Thes e summary rating s should be interpreted with caution because they are based on ratings for only ten of the
fourteen components in the index for this year.
241
www.fraserinstitute.org

www.fraserinstitute.org

Appendix II:
The Underlying Data and Country
Ratings for Each of the
17 Components in
the Index
List of Tables
Table I-A: The Expansion in the Money Supply Relative to theGrowth in Real Output 244
Table I-B: The Standard Deviation of the Annual Rate of InflationAs Measured by the GDP Deflator 248
Table I-C: Freedom of Residents to Own Foreign Currencies Domestically . . . . 252Table I-D: Freedom of Citizens to Maintain Bank Balances Abroad 255
Table II-A: General Government Consumption Expenditures As a Percentof GDP 258
Table II-B: The Role of Government Enterprise in the Economy 262Table II-C: The Extent Countries Imposed Price Controls on Various Goods
and Services, 1989 and 1994 266Table II-D: Freedom of Businesses and Cooperatives to Compete 269Table II-E: Equality of Citizens Under the Law and Access to a Non-
discriminatory Judiciary 271Table II-F: Freedom from Government Regulations and Policies That
Cause Negative Interest Rates 273
Table III-A: Transfers and Subsides as a Percent of GDP 277Table III-B: Top Marginal Tax Rate and Income Threshold 281Table III-C: The Use of Conscription to Obtain Military Personnel 288
Table IV-A: The Average Tax Rate on International Trade 291Table IV-B: The Black Market Exchange Rate Premiums 295Table IV-C: The Actual Size of the Trade Sector 299Table FV-D: Freedom to Engage in Capital (Investment) Transactions
with Foreigners 305
www.fraserinstitute.org

Table I-A: The Expansion in the Money Supply (M1) Minus the Annual Growth
Rate of Potential Real GDP: 1971-75,1976-80,1981-85,1986-90,
and 1990-94
INDUSTRIALCOUNTRIESUnited StatesCanadaAustraliaJapanNew ZealandAustriaBelgiumDenmarkFinlandFranceGermanyIcelandIrelandItalyNetherlandsNorwaySpainSwedenSwitzerlandUnited Kingdom
CENTRAL/SOUTHArgentinaBelizeBoliviaBrazilChileColombiaCosta RicaDominican RepublicEcuadorEl SalvadorGuatemalaHaitiHondurasJamaicaMexico
Annual
1971-753.56.07.0
10.811.88.07.99.6
18.98.47.5
24.87.7
12.67.9
10.215.78.31.9
10.4
AMERICA78.2
-19.328.9
210.715.716.09.4
16.912.19.7
14.16.4
17.111.2
(8)(7)(7)(4)(3)(6)(6)(5)(2)(5)(6)(D(6)(3)(6)(4)(2)(5)
(10)(4)
(0)
(2)(D(0)(2)(2)(5)(2)(3)(5)(2)(7)(2)(4)
Growth Rate of the Money Supply (M1) Minus AnnualGrowth Rate of Potential Real GDP(The rating <1976-804.81.68.72.45.51.01.57.05.5
10.24.5
36.712.917.23.91.6
12.310.15.2
10.3
150.0-
21.341.693.523.815.73.7
14.613.910.714.312.918.324.7
(8)(10)
(5)(9)(7)
(10)(10)
(7)(7)(4)(8)(D(3)(2)(8)
(10)(3)(4)(7)(4)
(0)
(D(D(0)(D(2)(8)(2)(2)(4)(2)(3)(2)(D
af each country is1981-855.8
11.33.30.98.62.31.7
12.510.38.13.1
41.42.89.84.9
12.78.35.90.1
10.9
295.33.3
569.5137.8
7.316.932.113.919.010.410.18.62.6
18.144.4
(7)(4)(8)
(10)(5)(9)
(10)(3)(4)(6)(9)(D(9)(5)(8)(3)(5)(7)
(10)(4)
(0)(8)(0)(0)(6)(2)(1)(2)(2)(4)(4)(5)(9)(2)(0)
> in parenthesis)1986-903.24.0
11.92.0
40.24.22.97.36.83.09.6
26.94.37.04.4
17.115.96.10.6
28.0
515.47.9
38.1648.6
24.727.713.037.438.912.418.38.7
15.719.567.1
(9)(8)(3)(9)(D(8)(9)(6)(7)(9)(5)(D(8)(7)(8)(2)(2)(7)
(10)(D
(0)(6)(D(0)(D(D(3)d)(D(3)(2)(5)(2)(2)(0)
1990-945.62.59.62.43.44.93.32.4
29.1-1.28.7
10.22.13.72.65.73.71.90.25.3
371.61.0
33.01232.5
18.327.915.918.646.315.121.120.617.844.736.0
(7)(9)(5)(9)(8)(8)(8)(9)(D
(10)(5)(4)(9)(8)(9)(7)(8)
(10)(10)
(7)
(0)a(10)(D(0)a
( 2 ) a
(1)a
(2)(2)(0)a
(2)
(D(2)3
(2)(0)(1)
244
www.fraserinstitute.org

Table I-A: Money Supply (continued)
CENTRAU-S. AMERICA
Annual Growth Rate of the Money Supply (M1) Minus AnnualGrowth Rate of Potential Real GDP
(The rating of each country is in parenthesis)1971-75 1976-80 1981-85 1986-90
South KoreaSri LankaTaiwanThailand
21.33.6
19.14.9
(D(8)(2)(8)
18.2 (2)20.4 (2)15.1 (2)8.8 (5)
6.8 (7)9.5 (5)5.0 (7)
-2.9 (9)
6.811.813.110.0
(7)(3)(3)(5)
1990-94NicaraguaPanamaParaguayPeruTrinidad & TobagoUruguayVenezuela
EUROPE/MIDDLEBulgariaCyprusCzechoslovakia
Czech RepublicSlovakia
EgyptGreeceHungaryIranIsraelJordanMaltaPolandPortugalRomaniaSyriaTurkey
ASIABangladeshFijiHong KongIndiaIndonesiaMalaysiaNepalPakistanPhilippinesSingapore
12.36.0
14.118.617.360.325.5
EAST-
6.0---
13.812.9
-18.118.215.17.1
-12.8
-15.920.2
-11.99.38.7
32.68.9
11.610.213.75.2
(3)(7)(2)(2)(2)(0)
(D
(7)
(2)(3)
(2)
(2)(2)(6)
(3)
(2)(2)
(3)(5)(5)(D(5)(3)(4)(3)(7)
26.68.6
19.739.121.658.313.6
-16.0
---
21.514.1
-35.140.014.15.5
-12.24.0
15.939.7
18.0-1.32.97.8
24.89.7
14.416.411.13.1
(1)(5)(2)d)d)(0)(3)
(2)
d)(2)
(Dd)(2)(7)
(3)(8)(2)(D
(2)(10)
(9)(6)
(D(5)(2)(2)(4)0)
70.0-0.58.8
98.48.0
38.013.3
-4.63.0
--
7.816.54.4
23.4169.3
-0.7-2.120.912.02.3
15.531.7
13.34.52.9
10.88.80.9
10.86.58.00.1
(0)(10)(5)(0)(6)(D(3)
(8)(9)
(6)(2)(8)d)(0)
(10)(9)d)(3)
(9)(2)
(1)
(3)(8)
(9)(4)(5)
(10)(4)(7)(6)
(10)
2073.50.4
32.0690.2
4.675.819.9
13.12.30.4
--
7.318.611.914.842.6
9.0-0.2
110.517.07.4
14.548.9
2.712.110.39.4
13.16.5
15.29.4
18.74.6
(0)(10)(D(0)(8)(0)(2)
(3)(9)
(10)
(6)(2)(3)(2)(D(5)
(10)(0)(2)(6)(2)(0)
(9)(3)(4)(5)(3)(7)(2)(5)(2)(8)
322.918.722.4
249.113.067.839.8
67.03.2
-13.913.58.4
16.523.518.917.03.30.6
70.412.893.215.559.0
10.82.69.9
12.713.214.015.59.3
12.44.5
(0)(2)(D(0)(3)(0)(D
(0)(9)a
(2)(3)(5)(2)(D(2)a
(2)(8)
(10)
(0)(3)(0)(2)3
(0)
(4)
(9)(5)(3)(3)3
(2)(2)3
(5)(3)(8)
9.3 (5)10.8 (4)0.1 (10)5.8 (7)
245
www.fraserinstitute.org

Table I-A: Mone y Supply (continued)
AFRICA
Annual Growth Rate of the Money Supply (M1) Minus AnnualGrowth Rate of Potential Real GDP(The rating of each country is in parenthesis)
1971-75 1976-80 1981-85 1986-90 1990-94AlgeriaBeninBotswanaBurundiCameroonCent Africian RepChadCongoCote d'lvoireGabonGhanaKenyaMadagascarMalawiMaliMauritiusMoroccoNigerNigeriaRwandaSenegalSierra LeoneSomaliaSouth AfricaTanzaniaTogoTunisiaUgandaZaireZambiaZimbabwe
18.221.6
-2.2
10.37.3
11.86.79.6
18.425.6
3.26.0
11.615.631.013.818.525.412.614.213.313.59.3
15.312.411.523.917.19.8
-
(2)(D
0)(4)(6)(3)(7)(5)(2)(D0)(7)(3)(2)d)(2)(2)(D(3)(2)(3)(3)(5)(2)(3)(3)(D(2)(5)
15.88.1
11.919.715.121.913.67.9
13.92.2
42.87.2
15.9-0.58.96.39.0
25.225.515.010.918.823.811.022.116.47.5
35.722.3
7.911.5
(2)(6)(3)(2)(2)(D(3)(6)(2)(9)(D(6)(2)
(10)(5)(7)(5)d)(D(2)(4)(2)(1)(4)(D(2)(6)(D(1)(6)(3)
13.39.94.28.36.37.2
19.38.14.9
13.343.9
4.59.77.9
11.0-0.86.33.06.8
-1.54.9
41.825.318.312.36.1
11.475.152.718.57.4
(3)(5)(8)(5)(7)(6)(2)(6)(8)(3)(D(8)(5)(6)(4)
(10)(7)(9)(7)
(10)(8)(Dd)(2)(3)(7)(3)(0)(0)(2)(6)
3.20.9
15.40.2
-3.2-0.7-6.4-3.7-3.1-0.937.912.218.721.2-5.616.29.80.0
20.20.7
-2.172.092.017.030.0-3.01.7
410.099.158.115.8
(9)(10)
(2)(10)
(9)(10)(7)(8)(9)
(10)(D(3)(2)(1)(7)(2)(5)
(10)(2)
(10)
(9)(0)(0)(2)(D(9)
(10)(0)(0)(0)(2)
13.813.10.5
11.1-2.911.7-6.06.29.71.3
25.023.120.724.6
6.17.9
10.01.8
30.05.73.8
33.7-
12.526.6
8.50.6
61.0550.060.029.4
(2)(3)
(10)(4) a(9)(3)(7)(7)(5)
(10)(D(D(D(D(7)(6)(5)
(10)d)b(7) a(8)(D
(3)(1)a(5)
(10)(0)b(0)(0)b
(D
a Indicate s data are for 1989-199 3 data.b Indicate s data are for 1988-199 2 data.
Source: Th e actual growth rate of real GDP during the last 10 years was used as the estimatefor the growth rat e of "potentia l rea l GDP" . Thus , this variable i s the annua l rat e o fgrowth i n the M1 money suppl y durin g the last 5 years minu s the annual growth rat eof rea l GDP during the las t 10 years.
When they were available, the money supply (narrow definition) an d rea l GDPdata from the World Bank, World Tables, 1994 were utilized. I f the money supply datawere unavailable from the World Bank, the money supply figures from the Internationa lMonetary Fund , International Financial Statistics Yearbook, 1994 (o r th e monthl yversion) wer e used . Th e bas e yea r fo r th e ratin g o f eac h countr y wa s 1985 . Th efollowing conversion table divided the 198 5 data into eleven intervals of equal size:
246
www.fraserinstitute.org
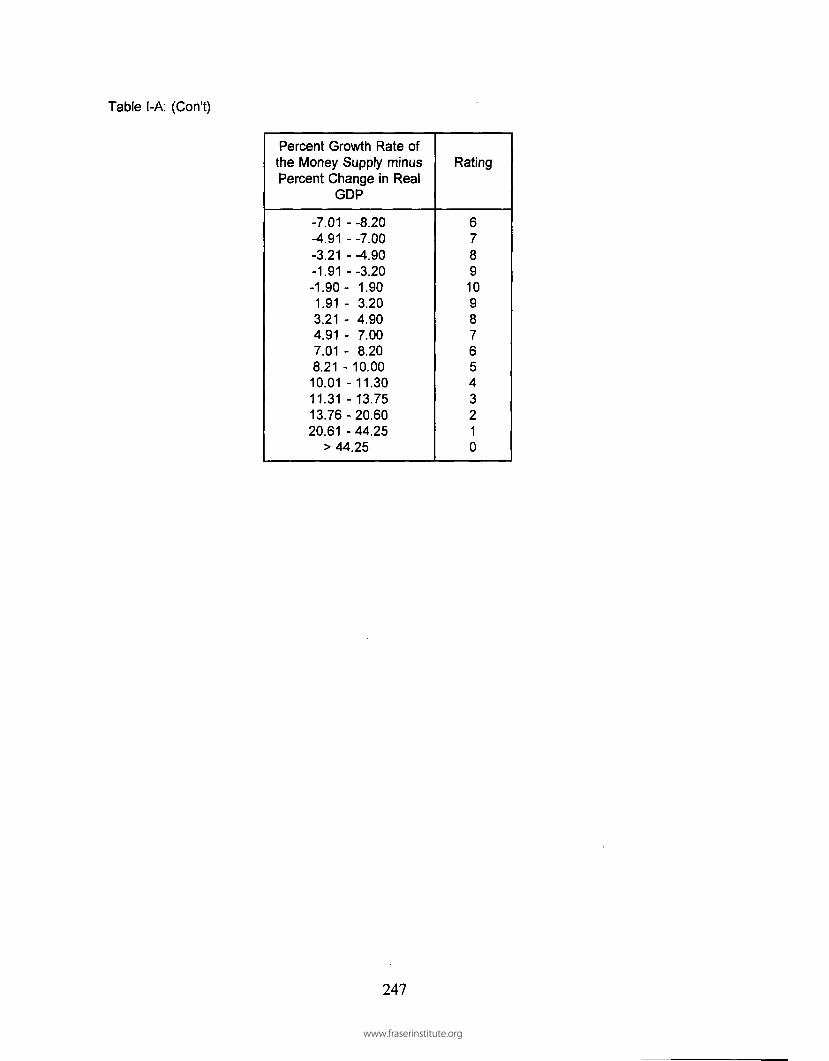
Table I-A : (Con't )
Percent Growth Rate ofthe Money Supply minu sPercent Change in Real
GDP
-7.01 - -8.20-4.91 - -7.00-3.21 - -4.90-1.91 --3.2 0-1.90- 1.9 01.91 - 3.2 03.21 - 4.9 04.91 - 7.0 07.01 - 8.2 08.21 - 10.0010.01 -11.3 011.31 -13.7 513.76-20.6020.61 - 44.25
> 44.25
Rating
6789109876543210
247
www.fraserinstitute.org

Table I-B: The Standard Deviation of the Annual Rate of Inflation As Measured by
the GDP Deflator (1971-75,1976-80,1981-85,1986-90 and 1990-94)
INDUSTRIALCOUNTRIES
United StatesCanadaAustraliaJapanNew ZealandAustriaBelgiumDenmarkFinlandFranceGermanyIcelandIrelandItalyNetherlandsNorwaySpainSwedenSwitzerlandUnited Kingdom
CENTRAL/S. AMERICA
ArgentinaBelizeBoliviaBrazilChileColombiaCosta RicaDominican RepEcuadorEl SalvadorGuatemalaHaitiHondurasJamaicaMexicoNicaraguaPanama
Standard Deviation
(The1971-752.1
4.04.25.63.71.13.02.15.52.60.9
11.14.75.20.72.13.72.91.17.4
61.88.3
21.06.9
234.05.78.96.8
14.64.57.85.95.49.96.08.83.2
(8)(5)(5)(4)(6)
(10)
(7)
0)(4)(7)
(10)(2)(5)(4)
(10)
(9)(6)(7)
(10)
(3)
(0)(2)
d)(3)(0)(4)(2)(3)(D(5)(3)(4)(4)(2)(3)(2)
(6)
rating of each1976-801.31.91.61.72.10.61.60.81.90.80.57.73.52.21.73.03.51.51.12.6
119.83.6
11.016.680.64.24.54.74.37.53.68.33.05.14.9
15.92.5
(9)(9)(9)(9)(9)
(10)
(9)(10)
(9)(10)(10)
(3)(6)(8)(9)(7)(6)(9)
(10)
(7)
(0)(6)(2)
(D(0)(5)(5)(5)(5)(3)(6)(2)(7)(4)(5)(D(7)
of the Inflation Rate (percent)
i country is in parenthesis)1981-852.4
3.22.20.83.11.30.82.41.92.31.0
17.24.83.81.93.32.11.22.02.5
207.66.5
4349.253.1
9.61.7
24.213.110.24.75.33.11.3
10.220.460.3
1.3
(8)
(6)(8)
(10)(6)
(10)(10)(8)(9)(8)
(10)
(D(5)(6)(9)(6)(9)
(10)
(9)(7)
(0)(3)(0)(0)(2)
(9)(D(2)(2)(5)(4)(6)
(10)
(2)(D(0)
(10)
1986-900.71.11.90.95.00.91.00.80.90.90.73.62.50.81.03.52.01.41.21.4
1185.02.8
91.2909.8
3.2
2.23.3
16.716.78.2
15.28.16.75.0
42.84853.2
0.8
(10)
(10)
(9)(10)
(4)(10)(10)(10)(10)
(10)(10)
(6)(7)
(10)(10)
(6)(9)(9)
(10)(9)
(0)(7)(0)(0)(6)(8)(6)(D(D(2)
d)(3)(3)(4)(0)(0)
(10)
1990-940.7
1.10.80.60.80.40.40.41.90.50.64.61.51.71.71.91.23.11.91.6
793.41.84.3
956.54.1
3.26.1
22.79.85.0
13.214.06.7
12.99.3
2875.91.0
(10)(10)(10)(10)(10)(10)(10)(10)
(9)(10)(10)(5)(9)(9)(9)(9)
(10)(6)
(9)(9)
(0)
(9)(5)
(0)(5)
(6)(3)(D(2)(4)(2)(D(3)(2)
(2)
(0)(10)
248
www.fraserinstitute.org

Table I-B: Annual Rate of Inflation (continued)
CENTRAL-
S. AMERICA (con't)
Standard Deviation of the Inflation Rate (percent)
(The rating of each country is in parenthesis)1971-75 1976-8 0 1981-8 5 1986-9 0 1990-9 4
ParaguayPeruTrinidad/TobagoUruguayVenezuela
EUROPE/MIDDLE EAST
BulgariaCyprusCzechoslovakia
Czech RepublicSlovakia
EgyptGreeceHungaryIranIsraelJordanMaltaPolandPortugalRomaniaSyriaTurkey
ASIA
Bangladesh
FijiHong KongIndiaIndonesiaMalaysiaNepalPakistanPhilippinesSingapore
7.55.9
18.536.615.0
-3.0
---
3.57.32.9
-9.45.82.3
-5.2
-12.24.4
31.59.03.97.2
16.38.3
11.38.69.24.7
(3)(4)(D(0)
(D
(7)
(6)(3)(7)
(2)(4)(8)
(4)
(2)(5)
(D(2)(5)(3)(1)(2)(2)(2)(2)(5)
5.317.59.6
11.97.4
-2.3
---
4.42.43.86.1
33.22.63.0
-3.42.83.8
31.4
14.45.75.24.8
10.23.15.41.62.93.7
(4)(1)(2)(2)(3)
(8)
(5)(8)(6)(3)(0)(7)(7)
(6)(7)(6)d)
(D(4)(4)(5)(2)(6)(4)0)(7)(6)
8.038.113.920.4
5.2
2.52.82.2
--
3.42.31.06.8
101.75.13.1
37.42.54.85.38.4
3.03.92.51.13.02.62.22.3
16.42.7
(3)(0)(D(D(4)
(7)(7)(8)
(6)(8)
(10)
(3)(0)(4)(6)(0)(7)(5)(4)(2)
(7)(5)(7)
(10)
(7)(7)(8)(8)(D(7)
3.62302.8
5.612.630.4
11.30.74.0
--
1.62.97.83.6
13.08.30.7
178.33.46.03.2
13.9
2.12.02.91.45.15.21.92.43.32.8
(6)(0)(4)(2)
(D
(2)(10)
(5)
(9)(7)(3)(6)(2)(2)
(10)
(0)(6)(3)(6)(D
(8)(9)(7)(9)(4)(4)(9)(8)(6)(7)
8.22380.4
5.923.713.9
82.10.6
-17.418.55.43.48.74.33.62.41.1
172.34.1
75.55.1
18.8
2.42.74.52.10.91.13.93.03.70.4
(3)(0)(4)(D(D
(0)(10)
(D(D(4)(6)(2)(5)(6)(8)
(10)
(0)(5)(0)(4)(D
(8)(7)(5)(9)
(10)(10)
(5)(7)(6)
(10)South KoreaSri LankaTaiwanThailand
7.1 (3)8.1 (3)
12.6 (2)
8.4 (2)
3.3 (6 )3.6 (6 )4.3 (5 )2.8 (7 )
4.9 (5 )6.2 (3 )4.8 (5 )2.5 (8 )
10.2 (2)4.7 (5)1.3 (9)1.7 (9)
2.2 (8)4.2 (5)0.4 (10)1.8 (9)
249
www.fraserinstitute.org

Table I-B: Annual Rate of Inflation (continued)
AFRICA 1971-75
Standard Deviation of the Inflation Rate (percent)
(The rating of each country is in parenthesis)1976-80 1981-8 5 1986-9 0 1990-9 4
AlgeriaBeninBotswanaBurundiCameroonC African RepChadCongo Peoples RepCote d' IvoireGabonGhanaKenyaMadagascarMalawiMaliMauritiusMoroccoNigerNigeriaRwandaSenegalSierra LeoneSomaliaSouth AfricaTanzaniaTogoTunisiaUgandaZaireZambiaZimbabwe
17.35.77.7
16.65.36.72.00.99.6
26.38.79.37.65.55.9
20.18.4
16.615.730.0
5.47.94.84.85.8
16.87.8
15.54.0
12.12.7
(D(4)(3)(D(4)(3)O)
(10)(2)(D(2)(2)(3)(4)(4)(D(2)(D(D(D(4)(3)(5)(5)(4)
(1)(3)
(D(5)(2)(7)
5.73.08.86.01.96.40.87.2
10.111.416.96.12.85.91.38.04.53.31.53.32.54.4
35.85.15.7
11.23.5
33.825.84.62.7
(4)(7)(2)(3)
(9)(3)
(10)
(3)(2)(2)
(D(3)(7)(4)
(10)(3)(5)(6)(9)(6)(7)(5)(0)(4)(4)(2)(6)(0)(D(5)(7)
4.26.88.87.31.56.59.4
11.03.93.6
38.21.27.92.64.51.40.95.76.05.31.7
28.018.7
1.95.95.03.8
45.725.112.65.5
(5)(3)(2)(3)
(9)(3)(2)(2)(5)(6)(0)
(10)(3)(7)(5)(9)
(10)
(4)(3)(4)(9)(D(D(9)(4)(4)(6)(0)(D(2)(4)
9.52.48.76.94.26.08.2
14.53.0
13.04.81.44.85.93.81.32.65.3
19.33.82.7
38.967.5
0.99.51.61.8
67.728.023.3
5.7
(2)(8)(2)(3)(5)(3)(3)
(D(7)(2)(5)(9)(5)(4)(5)
(10)
(7)(4)(D(6)(7)(0)(0)
(10)(2)(9)(9)(0)(D(D(4)
12.30.82.54.14.12.83.53.0
11.63.58.67.5
10.54.64.11.71.0
15.917.75.7
12.430.763.2
1.88.91.80.9
17.88765.4
38.37.0
(2)(10)
(7)(5)(5)(7)(6)(7)(2)(6)(2)(3)(2)(5)(5)(9)
(10)
(D(D(4)(2)(D(0)a
(9)(2)
(9)(10)
(D(0)(0)(3)
a Indicate s data are for 1988-1992 .
Source: Prio r to 199 4 the inflatio n rat e was derived from th e data on the GD P Deflato r o f the Worl dBank, World Tables, 1994. Th e base year for the rating of each country was 1985. Sinc e theywere available for most all countries, the CPI data from the IMF, Monthly International FinancialStatistics, wer e use d t o deriv e th e inflatio n rate s fo r 1994 . Th e followin g conversio n tabl edivided the 198 5 data into eleven intervals o f equal size:
250
www.fraserinstitute.org
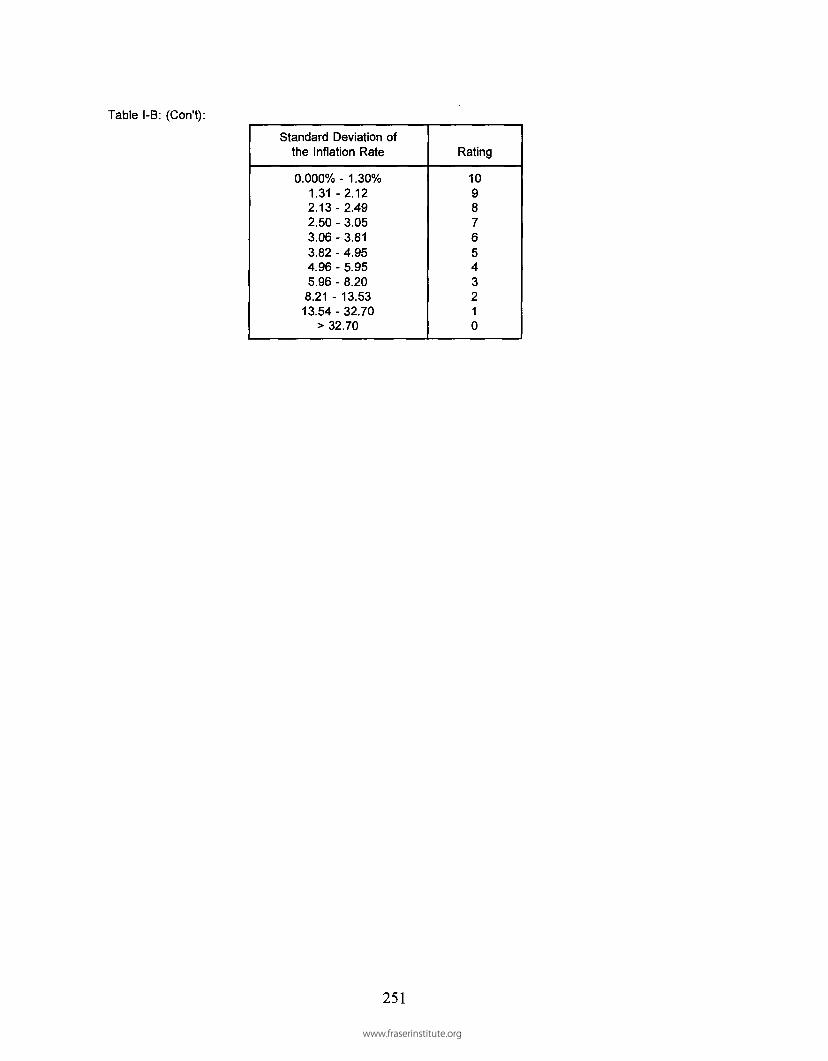
Table I-B : (Con't) :
Standard Deviatio n ofthe Inflatio n Rat e
0.000%- 1.30 %1.31 -2.1 22.13 - 2.4 92.50 - 3.0 53.06 - 3.8 13.82 - 4.954.96 - 5.955.96 - 8.2 08.21 - 13.5 313.54-32.70
> 32.7 0
Rating
109876543210
251
www.fraserinstitute.org

Table I-C: Freedom of Residents to Own Foreign Currencies Domestically(Countries Where Citizens are Free to Own Foreign Currencies are Givena Rating of 10; Countries that Restrict This Freedom are Given a Ratingof Zero.)
INDUSTRIALCOUNTRIES
Is It Legal (without restrictions) for Citizens toOwn Foreign Money Domestically?
1975 198 0 198 5 199 0
NicaraguaPanama
Yes 1 0Yes 1 0
Yes 1 0Yes 1 0
No 0Yes 1 0
No 0Yes 1 0
1993-94
United StatesCanadaAustraliaJapanNew ZealandAustriaBelgiumDenmarkFinlandFranceGermanyIcelandIrelandItalyNetherlandsNorwaySpainSwedenSwitzerlandUnited Kingdom
CENTRAL/SOUTHArgentinaBelizeBoliviaBrazilChileColombiaCosta RicaDominican RepEcuadorEl SalvadorGuatemalaHaitiHondurasJamaicaMexico
YesYesYesYesNoYesYesNoYesNoYesNoNoNoYesNoNoYesYesNo
101010100
10100
100
10000
100
010100
AMERICAYes
-
YesNoNoNoYesNoYesNoNoYesYesNoYes
10
10000
100
1000
10100
10
YesYesYesYesNoYesYesNoYesNoYesNoNoNoYesNoNoYesYesNo
Yes-
YesNoYesNoYesNoYesNoYesYesYesNoYes
101010100
10100
10010000
1000
10100
10
100
100
100
100
1010100
10
YesYesYesYesNoYesYesNoYesNoYesNoNoNoYesNoNoYesYesYes
Yes-
NoNoYesYesYesNoYesNoYesYesYesNoYes
101010100
10100
100
10000
1000
101010
10
00
1010100
100
1010100
10
YesYesYesYesYesYesYesYesYesYesYesYesNoYesYesYesNoYesYesYes
YesNoYesNoYesNoYesNoYesNoYesYesYesNoYes
1010101010101010101010100
1010100
101010
100
100
100
100
100
1010100
10
YesYesYesYesYesYesYesYesYesYesYesYesYesYesYesYesYesYesYesYes
YesNoYesNoYesYesYesNoYesYesYesYesYesYesYes
10101010101010101010101010101010
10101010
100
100
1010100
10101010101010
No 0Yes 10
252
www.fraserinstitute.org

Table I-C: Freedo m t o Own Foreign Money (continued)
Is It Legal (without restrictions) for Citizens to
Own Foreign Money Domestically?
CENTRAL/- 197 5 198 0 198 5 199 0
S. AMERICA (con't)
1993-94
ParaguayPeruTrinidad/TobagoUraguayVenezuela
EUROPE/MIDDLEBulgariaCyprusCzechoslovakia
Czech RepSlovakia
EgyptGreeceHungaryIranIsraelJordanMaltaPolandPortugalRomaniaSyriaTurkey
ASIABangladeshFijiHong KongIndiaIndonesiaMalaysiaNepalPakistanPhilippinesSingaporeSouth KoreaSri LankaTaiwanThailand
YesNoNoYesYes
EASTNoNoNo-
-
NoYesNoYesYesNo-
YesNoNoYesNo
NoNoYesNoYesNoNoNoNoNo
NoNoYesNo
1000
1010
000
0100
10100
1000
100
00
100
100000000
100
YesNoNoYesYes
NoNoNo-
-
YesYesNoYesYesYes
-
YesNoNo
YesNo
NoNoYesNoYesYesNoNoNoNoNoNoYesNo
1000
1010
000
10100
101010
1000
100
00
100
1010000
0
00
100
YesNoNoYesYes
NoNoNo-
-
YesYesNoYesYesYesNo
YesNo
NoYesNo
NoNoYesNoYesYesNoNoNoYesNoNoYesNo
10100
1010
000
10100
1010100
100
0100
00
100
1010000
1000
100
YesYesNo
YesYes
NoNoNo-
-
YesYesNoYesYesNoNo
YesNoNo
YesYes
NoNoYesNoYesYesNoYesNoYesNoNoYesYes
10100
1010
000
10100
101000
100
01010
00
100
10100
100
1000
1010
YesYesYesYesNo
YesNo-
YesYesYesYesNoNoYesNo
YesYesYesYesYesYes
NoNo
YesNoYesYesNoYesYesYesYesNoYesYes
101010100
100
1010101000
100
101010101010
00
100
10100
101010100
1010
253
www.fraserinstitute.org

Table I-C; Freedom to Own Foreign Money (continued)
COUNTRYAFRICA (cont)
Is It Legal (without restrictions) for Citizens toOwn Foreign Money Domestically?
1975 198 0 198 5 199 0 1993-94
AlgeriaBeninBotswanaBurundiCameroonC African RepChadCongo Peoples RepCote d' IvoireGabonGhanaKenyaMadagascarMalawiMaliMauritiusMoroccoNigerNigeriaRwandaSenegalSierra LeoneSomaliaSouth AfricaTanzaniaTogoTunisiaUgandaZaireZambiaZimbabwe
NoNoNo-
NoNoNoNoNoNoNoNo
-NoNoNoNoNoNo-
NoNoNoNoNoNoNoNoNoNoNo
000
00000000
000000
00000000000
NoNoNoNoNoNoNoNoNoNoNoNoNoNoNoNoNoNoNoNoNoNoNoNoNoNoNoNoNoNoNo
0000000000000000000000000000000
NoNoNoNoNoNoNoNoNoNoNoNoNoNoNoNoNoNoNoNoNoNoNoNoNoNoNoNoNoNoNo
0000000000000000000000000000000
NoNoNoNoNoNoNoNoNoNoYesNoNoNoNoNoNoNoNoNoNoNoNoNoNoNoNoNoNoNoNo
0000000000
1000000000
000000000000
NoNoNoNoNoNoNoNoNoNo
YesNoNoNoNoNoNoNoNoYesNoYesNoNoNoNoNoNoNoNoNo
0000000000
1000000000
100
10000000000
Source: Internationa l Currency Analysis, World Currency Yearbook, (various issues)and International Monetary Fund , Exchange Arrangements and ExchangeRestrictions: Annual Report 1994.
254
www.fraserinstitute.org
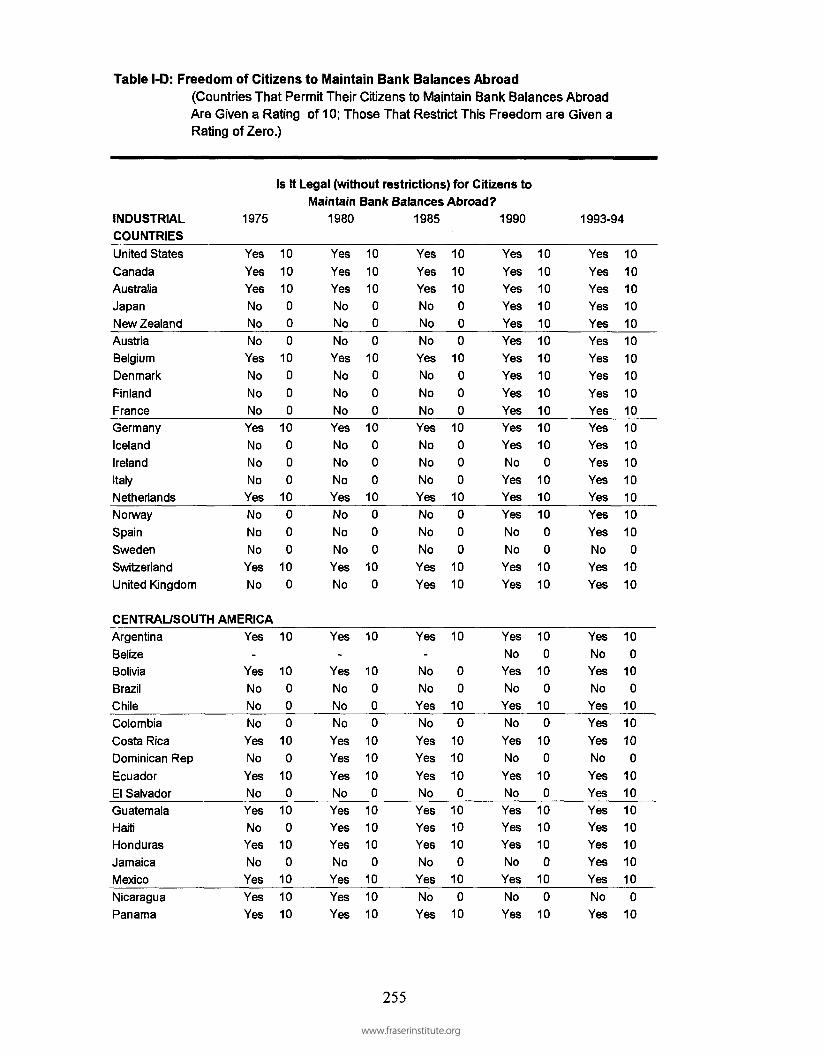
Table I-D: Freedom of Citizens to Maintain Bank Balances Abroad
(Countries That Permit Their Citizens to Maintain Bank Balances AbroadAre Given a Rating o f 10; Those That Restrict This Freedom are Given aRating of Zero.)
INDUSTRIALCOUNTRIES
Is It Legal (without restrictions) for Citizens toMaintain Bank Balances Abroad?
1975 198 0 198 5 199 0
NicaraguaPanama
Yes 1 0Yes 1 0
Yes 1 0Yes 1 0
No 0Yes 1 0
No 0Yes 1 0
1993-94
United StatesCanadaAustraliaJapanNew ZealandAustriaBelgiumDenmarkFinlandFranceGermanyIcelandIrelandItalyNetherlandsNorwaySpainSwedenSwitzerlandUnited Kingdom
CENTRAL/SOUTHArgentinaBelizeBoliviaBrazilChileColombiaCosta RicaDominican RepEcuadorEl SalvadorGuatemalaHaitiHondurasJamaicaMexico
YesYesYesNoNoNoYesNoNoNo
YesNoNoNoYesNoNoNo
YesNo
AMERICAYes
-
YesNoNoNoYesNo
YesNoYesNoYesNoYes
10
1010000
10000
10000
10000
100
10
10000
100
100
100
100
10
YesYesYesNoNoNoYesNoNoNoYesNoNoNoYesNoNoNoYesNo
Yes-
YesNoNoNo
YesYesYesNoYesYesYesNoYes
101010000
10000
10000
10000
100
10
10000
1010
100
1010100
10
YesYesYesNoNoNoYesNoNoNoYesNoNoNoYesNoNoNoYesYes
Yes-
NoNo
YesNoYesYesYesNoYesYesYesNoYes
101010000
100
00
10000
100
00
1010
10
00
100
1010
100
1010100
10
YesYesYesYesYesYesYesYesYesYesYesYesNoYesYesYesNoNoYesYes
YesNoYesNo
YesNoYesNo
YesNoYesYesYesNoYes
10
10101010101010101010100
101010
00
1010
100
100
100
100
100
1010100
10
YesYesYesYesYesYesYesYesYesYesYesYesYesYesYesYesYesNoYesYes
YesNoYesNoYesYesYesNo
YesYesYesYesYesYesYes
10
10101010101010
1010101010101010100
1010
100
100
1010
100
10101010101010
No 0Yes 1 0
255
www.fraserinstitute.org

Table I-D: Freedo m to Maintain Bank Balances (continued)
CENTRAL/-
S. AMERICA (con't)
Is It Legal (without restrictions) for Citizens to
Maintain Bank Balances Abroad?
1975 198 0 198 5 199 0
SingaporeSouth KoreaSri LankaTaiwanThailand
No 0No 0No 0Yes 10No 0
NoNoNoYes 10No 0
000
No 0No 0No 0Yes 10No 0
Yes 10No 0No 0Yes 10No 0
1993-94
ParaguayPeruTrinidad/TobagoUraguayVenezuela
EUROPE/MIDDLE
BulgariaCyprusCzechoslovakia
Czech RepSlovakia
EgyptGreeceHungaryIranIsraelJordanMaltaPolandPortugalRomaniaSyriaTurkey
ASIABangladeshFijiHong KongIndiaIndonesiaMalaysiaNepalPakistanPhilippines
YesNoNoYesYes
EASTNoNoNo--
NoNoNoNoNoNo-
YesNoNoYesNo
NoNoYesNoYesYesNoNoNo
1000
1010
000
000000
1000
100
00
100
1010000
YesNoNoYesYes
NoNoNo--
YesNoNoYesNoNo-
YesNoNoYesNo
NoNoYesNoYesYesNoNoNo
1000
1010
000
1000
1000
1000
100
00
100
1010000
YesNoNoYesYes
NoNoNo--
YesNoNoYesNoNoNoYesNoNoYesNo
NoNoYesNoYesNoNoNoNo
1000
1010
000
1000
10000
1000
100
00
100
100000
YesNoNoYesYes
NoNoNo--
YesNoNoYesNoNoNoYesNoNoNoYes
NoNoYesNoYesYesNoNoNo
1000
1010
000
1000
10000
10000
10
00
100
1010000
YesYesYesYesNo
YesNo-
YesYesYesNoNoNoNoNoNoYesYesNoNoYes
NoNoYesNoYesYesNoNoYes
101010100
100
101010000000
101000
10
00
100
101000
10Yes 1 0Yes 1 0No 0Yes 1 0Yes 1 0
256
www.fraserinstitute.org

Table I-D: Freedo m to Maintain Bank Balances (continued)
COUNTRYAFRICA (cont)
Is It Legal (without restrictions) for Citizens toMaintain Bank Balances Abroad?
1975 1980 1985 1990 1993-94
AlgeriaBeninBotswanaBurundiCameroonC African RepChadCongo Peoples RepCote d1 IvoireGabonGhanaKenyaMadagascarMalawiMaliMauritiusMoroccoNigerNigeriaRwandaSenegalSierra LeoneSomaliaSouth AfricaTanzaniaTogoTunisiaUgandaZaireZambiaZimbabwe
NoNoNo-
NoNoNoNoNoNoNoNoNoNoNoNoNoNoNoNoNoNoNoNoNoNoNoNoNoNoNo
000
000000000000000000000000000
NoNoNo-
NoNoNoNoNoNoNoNoNoNoNoNoNoNoNoNoNoNoNoNoNoNoNoNoNoNoNo
000
000000000000000000000000000
NoNoNoNoNoNoNoNoNoNoNoNoNoNoNoNoNoNoNoNoNoNoNoNoNoNoNoNoNoNoNo
0000000000000000000000000000000
NoNoNoNoNoNoNoNoNoNoNoNoNoNoNoNoNoNoNoNoNoNoNoNoNoNoNoNoNoNoNo
0000000000000000000000000000000
NoNoNoNoNoNoNoNoNoNoNoNoNoNoNoNoNoNoNoNoNoNoNoNoNoNoNoNoNoNoNo
0000000000000000000000000000000
Source: Internationa l Currency Analysis, World Currency Yearbook, (various issues)and International Monetary Fund , Exchange Arrangements and ExchangeRestrictions: Annual Report 1994.
257www.fraserinstitute.org

Table Il-A: General Government Consumption Expenditures As APercent of GDP
INDUSTRIAL
COUNTRIES
United StatesCanadaAustraliaJapanNew ZealandAustriaBelgiumDenmarkFinlandFranceGermanyIcelandIrelandItalyNetherlandsNorwaySpainSwedenSwitzerlandUnited Kingdom
1975
18.619.517.210.015.617.216.524.617.016.620.516.517.7
14.116.919.310.524.212.622.4
CENTRAL/SOUTH AMERICA
ArgentinaBelizeBoliviaBrazilChileColombiaCosta RicaDominican RepublicEcuadorEl SalvadorGuatemalaHaitiHondurasJamaicaMexico
12.6-
10.510.615.78.9
15.26.2
14.511.26.99.0
12.418.69.3
(2)(D(3)(8)(4)(3)(3)(0)(3)(3)(D(3)(2)(6)(3)(D(8)(0)(7)(D
(7)
(8)(8)(4)(9)(5)
(10)(5)(7)
(10)(9)(7)(2)(9)
Government Consumption As A Percent of GDP
(The rating of each country is in parenthesis)1980
17.619.218.09.8
17.918.017.826.718.018.120.316.918.914.717.418.813.229.312.721.6
13.417.214.19.2
12.510.118.27.6
14.514.08.0
10.112.720.210.0
(2)(2)(2)(8)(2)(2)(2)(0)(2)(2)(D(3)(2)(5)(3)(2)(6)(0)(7)(1)
(6)(3)(6)(9)(7)(8)(2)
(10)(5)(6)(9)(8)(7)(D(8)
18.120.118.99.6
16.218.917.125.320.219.420.117.517.616.415.718.514.727.913.321.1
12.022.813.39.9
13.410.715.88.0
11.515.57.1
11.913.115.59.2
1985
(2)
(D(2)(9)(4)(2)(3)(0)(1)d)(D(3)(2)(4)(4)(2)(5)(0)(6)(D
(7)(0)(6)(8)(6)(8)(4)(9)(7)(5)
(10)(7)(6)(5)(9)
1990
17.820.317.89.1
17.017.814.525.321.117.918.319.415.117.414.521.115.527.413.420.6
5.619.614.015.59.6
10.318.29.38.6
11.36.8
-12.914.18.4
(2)
(1)(2)(9)(3)(2)(5)(0)(1)(2)(2)d)(5)(3)(5)
d)(5)(0)(6)(D
(10)
(D(6)(5)(9)(8)(2)(9)(9)(7)
(10)
(7)(6)(9)
1994
17.420.119.09.8
15.2
19.015.025.322.419.817.520.816.417.614.921.917.027.314.321.5
5.119.615.216.59.3
12.817.310.97.39.36.4
-10.613.19.3
(3)(D(2)(8)(5)(2)(5)(0)(D(1)(3)(D(4)(2)(5)
(D(3)(0)(5)d)
(10)
(D(5)(3)(9)(7)(3)(8)
(10)
(9)(10)
(8)(6)(9)
a
ab
aaa
a
a
a
aa
Nicaragua 9.1 (9 ) 19. 7 (1 ) 35. 7 (0 ) 32. 6 (0 ) 15. 9 (4 )
258
www.fraserinstitute.org
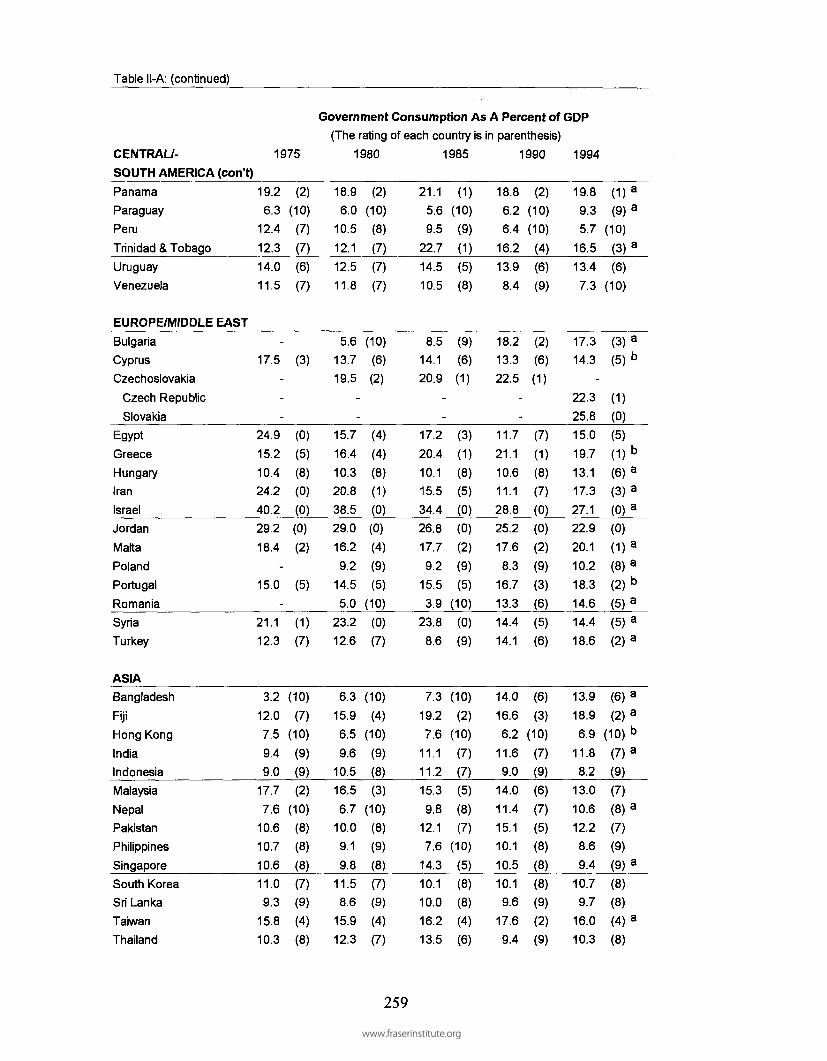
Table Il-A: (continued)
CENTRAU-
SOUTH AMERICA (con't)
1975
Government Consumption As A Percent of GDP
(The rating of each country is in parenthesis)1980 198 5 199 0 199 4
PanamaParaguayPeruTrinidad & TobagoUruguayVenezuela
EUROPE/MIDDLE EAST
BulgariaCyprusCzechoslovakia
Czech RepublicSlovakia
EgyptGreeceHungaryIranIsraelJordanMaltaPolandPortugalRomaniaSyriaTurkey
ASIA
BangladeshFijiHong KongIndiaIndonesiaMalaysiaNepalPakistanPhilippinesSingapore
19.26.3
12.412.314.011.5
-17.5
---
24.915.210.424.240.229.218.4
-15.0
-21.112.3
3.212.07.59.49.0
17.77.6
10.610.710.6
(2)(10)
(7)(7)(6)(7)
(3)
(0)(5)(8)(0)(0)(0)(2)
(5)
(D(7)
(10)
(7)(10)
0)0)(2)
(10)(8)(8)(8)
18.96.0
10.512.112.511.8
5.613.719.5
--
15.716.410.320.838.529.016.29.2
14.55.0
23.212.6
6.315.96.59.6
10.516.56.7
10.09.19.8
(2)(10)
(8)(7)(7)(7)
(10)(6)(2)
(4)(4)(8)(1)(0)(0)(4)(9)(5)
(10)(0)(7)
(10)
(4)(10)
(9)(8)(3)
(10)(8)(9)(8)
21.15.69.5
22.714.510.5
8.514.120.9
--
17.220.410.115.534.426.817.79.2
15.53.9
23.88.6
7.319.27.6
11.111.215.39.8
12.17.6
14.3
d)(10)
(9)(D(5)(8)
(9)(6)d)
(3)
(D(8)(5)(0)(0)(2)(9)(5)
(10)
(0)(9)
(10)
(2)(10)
(7)(7)(5)(8)(7)
(10)
(5)
18.86.26.4
16.213.98.4
18.213.322.5
--
11.721.110.611.128.825.217.68.3
16.713.314.414.1
14.016.66.2
11.69.0
14.011.415.110.110.5
(2)(10)(10)(4)(6)(9)
(2)(6)(D
(7)
(1)(8)(7)(0)(0)(2)(9)(3)(6)(5)(6)
(6)(3)
(10)
(7)(9)(6)(7)(5)(8)(8)
19.89.35.7
16.513.47.3
17.314.3
-22.325.815.019.713.117.327.122.920.110.218.314.614.418.6
13.918.96.9
11.88.2
13.010.612.28.69.4
(D(9)
(10)
(3)(6)
(10)
(3)(5)
(D(0)(5)
(1)(6)(3)(0)(0)(D(8)(2)(5)(5)(2)
(6)(2)
(10)
(7)(9)(7)(8)(7)(9)(9)
aa
a
ab
baaa
aabaaa
aaba
a
a
South KoreaSri LankaTaiwanThailand
11.09.3
15.810.3
(7)(9)(4)(8)
11.58.6
15.912.3
(7)(9)(4)(7)
10.1 (8 )10.0 (8 )16.2 (4)13.5 (6)
10.1 (8 )9.6 (9 )
17.6 (2 )9.4 (9 )
10.7 (8 )9.7 (8 )
16.0 (4 ) a
10.3 (8 )
259
www.fraserinstitute.org

Table Il-A: (continued)
Government Consumption As A Percent of GDP
(The rating of each country is in parenthesis)1975 198 0 198 5 199 0 199 4
AFRICA
AlgeriaBeninBotswanaBurundiCameroonCentral African RepChadCongo Peoples RepCote d'lvoireGabonGhanaKenyaMadagascarMalawiMaliMauritiusMoroccoNigerNigeriaRwandaSenegalSierra LeoneSomaliaSouth AfricaTanzaniaTogoTunisiaUgandaZaireZambiaZimbabwe
12.99.3
18.811.610.917.325.318.017.012.213.018.310.814.110.311.116.310.812.616.615.211.120.313.817.215.014.6
-11.626.812.8
(7)(9)(2)(7)(8)(3)(0)(2)(3)(7)(7)(2)(8)(6)(8)(7)(4)(8)(7)(3)(5)(7)(D(6)(3)(5)(5)
(7)(0)(7)
13.88.6
19.39.28.7
15.125.417.616.913.211.219.812.119.310.414.118.310.311.912.522.0
8.415.613.513.014.814.5
-8.4
25.519.7
(6)(9)(D(9)
(9)(5)(0)c
(2)(3)(6)(7)(D(7)(D(8)(6)(2)(8)(7)(7)
(D(9)(4)(6)(7)(5)(5)
(9)(0)
(1)
15.715.424.27.89.0
13.816.716.513.918.69.4
17.59.8
17.712.410.215.815.013.511.316.87.2
18.017.315.413.116.511.97.7
23.921.5
(4)(5)(0)
(10)
(9)(6)(3)(3)(6)(2)(9)(3)(8)(2)(7)(8)(4)(5)(6)(7)(3)
(10)
(2)(3)(5)(6)(3)(7)
(10)
(0)(D
16.613.219.110.412.99.9
20.919.218.116.910.918.76.2
15.213.511.115.415.011.415.414.66.6
-19.510.415.216.48.8
11.519.022.5
(3)(6)(2)(8)(7)(8)(D(2)(2)(3)(8)(2)
(10)(5)(6)(7)(5)(5)(7)(5)(5)
(10)
(D(8)(5)(4)(9)(7)(2)(D
18.511.524.610.413.69.8
16.622.320.419.311.713.15.6
16.912.812.916.516.65.3
26.412.511.2
-21.111.316.516.610.021.714.718.8
(2)(7)(0)(8)(6)(8)(3)(D(D(D(7)(6)
(10)(3)(7)(7)(3)(3)
(10)
(0)(7)(7)
(D(7)(3)(3)(8)(D(5)(2)
aaaa
aaaa
aaaa
aaaaa
baa
aa
abba
a Indicate s data are for 1993 .b Indicate s data are for 1992 .c Th e 198 0 dat a were unavailable . Thes e dat a ar e fo r 1978 , the closes t yea r fo r whic h dat a wer eavailable.
Source: Bot h the general government consumption expenditures and the GDP data used to derived theratio are from the World Bank , World Tables, 1994. I n cases where the 199 4 data were notyet availabl e fro m th e Worl d Bank , dat a fro m th e Internationa l Monetar y Fund , MonthlyInternational Financial Statistics, were used. Th e base year for the rating of each country was1985. Th e following conversion table divided the 1985 data into eleven intervals of equal size.
260
www.fraserinstitute.org

Table Il-A (con't )
General Governmen tConsumption Expenditure s As A
Percent o f GDP
0.000% - 7.90%7.91 - 9.6 79.68- 10.9 1
10.92- 13.0 713.08- 14.1 614.17-15.5015.51 - 16.4 516.46- 17.5 617.57- 19.2 619.27 - 22.78
> 22.7 8
Rating
109876543210
261
www.fraserinstitute.org

Table Il-B: The Role of Government Enterprises in the Economy
Size of Government Enterprises As A Share of Economy
(A higher rating indicates that government enterprises play a less significant role.)INDUSTRIAL 197 5 198 0 198 5 199 0 199 5COUNTRIES
United States (8 ) (8 ) (8 ) (8 ) (8 )Canada (6 ) (6 ) (6 ) (6 ) (6 )Australia (6 ) (6 ) (6 ) (6 ) (6 )Japan (8 ) (8 ) (8 ) (8 ) (8 )New Zealand (6 ) (6 ) (6 ) (6 ) (8 )Austria (2 ) (2 ) (2 ) (2 ) (2 )Belgium (6 ) (6 ) (6 ) (6 ) (6 )Denmark (4 ) (4 ) (4 ) (4 ) (4 )Finland (6 ) (6 ) (6 ) (6 ) (6 )France (4 ) (4 ) (4 ) (6 ) (6 )Germany (6 ) (6 ) (6 ) (6 ) (6 )Iceland (4 ) (4 ) (4 ) (4 ) (4 )Ireland (4 ) (4 ) (4 ) (4 ) (4 )Italy (2 ) (2 ) (2 ) (2 ) (2 )Netherlands (6 ) (6 ) (6 ) (6 ) (6 )Norway (2 ) (2 ) (2 ) (2 ) (2 )Spain (4 ) (4 ) (4 ) (4 ) (4 )Sweden (4 ) (4 ) (4 ) (4 ) (4 )Switzerland (8 ) (8 ) (8 ) (8 ) (8 )United Kingdom (4 ) (4 ) (6 ) (6 ) (6 )
CENTRAL/SOUTH AMERICA
Argentina (6 ) (4 ) (4 ) (4 ) (6 )Belize (8 ) (8 ) (8 ) (8 ) (8 )Bolivia (6 ) (6 ) (4 ) (4 ) (4 )Brazil (4 ) (4 ) (2 ) (2 ) (2 )Chile (6 ) (8 ) (8 ) (8 ) (8 )Colombia (6 ) (4 ) (4 ) (4 ) (4 )Costa Rica (8 ) (8 ) (8 ) (8 ) (8 )Dominican Rep (6 ) (6 ) (6 ) (6 ) (6 )Ecuador (6 ) (6 ) (6 ) (6 ) (6 )El Salvador (8 ) (8 ) (8 ) (8 ) (8 )Guatemala (8 ) (8 ) (8 ) (8 ) (8 )Haiti (6 ) (6 ) (6 ) (6 ) (4 )Honduras (8 ) (8 ) (8 ) (8 ) (8 )Jamaica (2 ) (2 ) (2 ) (4 ) (4 )Mexico (2 ) (2 ) (2 ) (4 ) (6 )Nicaragua (6 ) (6 ) (0 ) (0 ) (0 )
262
www.fraserinstitute.org

Table Il-B: (continued)
Size of Government Enterprises As A Share of Economy(A higher rating indicates that government enterprises play a less significant role.)
CENTRAL/- 197 5 198 0 198 5 199 0 199 5S. AMERICA (cont)PanamaParaguayPeruTrinidad/TobagoUraguayVenezuela
EUROPE/MIDDLE EAST
(8)(8)(4)(2)(6)(6)
(6)(8)(4)(2)(6)(4)
(6)(8)(4)(2)(6)(4)
(6)(8)(4)(2)(6)(2)
(6)(8)(6)(2)(6)(2)
Bulgaria (0 ) (0 ) (0 ) (0 ) (0 )Cyprus (6 ) (6 ) (6 ) (6 ) (6 )Czechoslovakia (0 ) (0 ) (0 ) (0 )
Czech Republic - - - (4 )Slovakia - - - - (4) _
Egypt (4 ) (2 ) (2 ) (2 ) (2 )Greece (2 ) (2 ) (2 ) (2 ) (2 )Hungary (0 ) (0 ) (0 ) (0 ) (2 )Iran (4 ) (2 ) (2 ) (2 ) (2 )Israel (2 ) (2 ) (2 ) (2 ) (2 )Jordan (6 ) (6 ) (6 ) (6 ) (6 )Malta (4 ) (4 ) (4 ) (4 ) (4 )Poland (0 ) (0 ) (0 ) (0 ) (2 )Portugal (2 ) (2 ) (2 ) (2 ) (2 )Romania (0 ) (0 ) (0 ) (0 ) (0) _Syria (6 ) (4 ) (2 ) (2 ) (2 )Turkey (4 ) (4 ) (4 ) (4 ) (4 )
ASIABangladeshFijiHong KongIndiaIndonesia
(6)(6)
(10)(0)(4)
(6)(6)
(10)(0)(2)
(6)(6)
(10)(0)(2)
(6)(6)
(10)(0)(2)
(6)(6)
(10)(2)(2)
MalaysiaNepalPakistanPhilippines
(4)(6)(2)(4)
(4)(6)(2)(4)
(6)(6)(2)(4)
(6)(4)(4)(4)
(6)(4)(4)(4)
SingaporeSouth KoreaSri LankaTaiwanThailand
(8)(6)(2)(4)(6)
(8)(6)(4)(4)(6)
(8)(6)(4)(4)(6)
(8)(6)(4)(4)(6)
(8)(6)(4)(4)(6)
263
www.fraserinstitute.org

Table Il-B: (continued)
Size of Government Enterprises As A Share of Economy
(A higher rating indicates that government enterprises play a less significant role.)1975 1980 1985 1990 1995
AFRICA
Algeria (4 ) (4 ) (4 ) (4 ) (4 )Benin (4 ) (4 ) (4 ) (4 ) (4 )Botswana (8 ) (8 ) (8 ) (6 ) (6 )Burundi (4 ) (4 ) (4 ) (4 ) (4 )Cameroon (4 ) (4 ) (4 ) (4 ) (4) _C African Rep (6 ) (6 ) (6 ) (6 ) (6 )Chad (4 ) (4 ) (4 ) (4 ) (4 )Congo Rep (0 ) (0 ) (0 ) (0 ) (0 )Cote d1 Ivoire (4 ) (4 ) (4 ) (4 ) (4 )Gabon (6 ) (6 ) (6 ) (6 ) (6 )Ghana (0 ) (0 ) (0 ) (2 ) (2 )Kenya (4 ) (4 ) (4 ) (4 ) (4 )Madagascar (6 ) (6 ) (6 ) (6 ) (6 )Malawi (4 ) (4 ) (4 ) (4 ) (4 )Mali (4 ) (4 ) (4 ) (4 ) (4 )Mauritius (6 ) (6 ) (6 ) (6 ) (6 )Morocco (4 ) (4 ) (2 ) (2 ) (2 )Niger (4 ) (4 ) (4 ) (6 ) (6 )Nigeria (4 ) (2 ) (2 ) (2 ) (2 )Rwanda (6 ) (6 ) (6 ) (6 ) (6 )Senegal (4 ) (4 ) (4 ) (6 ) (6 )Sierra Leone (6 ) (6 ) (6 ) (6 ) (6 )Somalia (4 ) (4 ) (4 ) (4 ) (4 )South Africa (4 ) (4 ) (4 ) (4 ) (4 )Tanzania (2 ) (2 ) (0 ) (0 ) (0 )Togo (4 ) (4 ) (4 ) (4 ) (4 )Tunisia (2 ) (2 ) (2 ) (4 ) (4 )Uganda (2 ) (2 ) (2 ) (2 ) (2 )Zaire (2 ) (2 ) (2 ) (2 ) (2 )Zambia (0 ) (0 ) (0 ) (0 ) (0 )Zimbabwe (4 ) (4 ) (4 ) (4 ) (4 )
264
www.fraserinstitute.org

Source and Explanation of Ratings:
The ratin g for each country was designed to reflect the following:
Rating Rol e of Government Enterprise s i n Country
10 Ther e are very few government-operated enterprise s and they produc eless then 1 percent of the country's total output .
8 Ther e are very few government-operated enterprises other than power -generating plant s and those operating i n industries where economies o fscale generally reduc e the effectiveness o f competition.
6 Governmen t enterprise s are generally presen t i n power generating,transportation (airlines , railroads, and bus lines), communication s(television and radio stations, telephone companies, and post offices )and the development o f energy sources , bu t private enterprise sdominates other sectors o f the economy.
4 Ther e are a substantial number of government-operated enterprise s inmany sectors of the economy, includin g the manufacturing sector .Most of the large enterprises o f the economy are operated b y thegovernment; privat e enterprises ar e generally small . Employmen t an doutput in the government-operated enterprise s generall y comprise sbetween 1 0 and 20 percent of the total non-agricultura l employmen tand output.
2 Numerou s government enterprises o f all sizes are present and theyoperate i n many sectors o f the economy, includin g manufacturin g an dretail sales. Employmen t an d output i n the government-operate denterprises generally comprise s betwee n 20 and 30 percent o f the totalnon-agricultural employment an d output.
0 Th e economy i s dominated by government-operated enterprises .Employment and output i n the government-operated enterprise sgenerally exceed s 30 percent of the total non-agricultura l employmen tand output.
Data on the number of government enterprises and the activities of these enterprisesfrom th e Internationa l Monetar y Fund , Government Finance Statistics Yearbook, (variou sissues) were used to assist with the determination of the rating for each country. I n addition,the followin g publication s wer e helpfu l i n determinin g th e prope r classificatio n fo r variou scountries: V.V. Ramanadham, ed., Privatization in Developing Countries, London: Routledge,1989; Rexfor d A . Ahen e an d Bernar d S . Katz , eds. , Privatization and Investment in Sub-Saharan Africa, Ne w York : Praeger , 1992 ; Manue l Sanche z an d Rossan a Corona , eds. ,Privatization in Latin America, Washington , D.C. : Inter-America n Developmen t Bank , 1993 ;Iliya Hari k an d Deni s J . Sullivan, eds. , Privatization and Liberalization in the Middle East,Bloomington, IN : Indian a Universit y Press , 1992 ; OECD Economic Surveys, Italy ;Organization fo r Economi c Co-Operatio n an d Development , Januar y 1994 ; Joh n R . Nellis ,"Public Enterprises in Sub-Saharan Africa," World Bank Discussion Paper, no. 1 (Washington ,DC: November , 1986) ; Bos Dieter , Public Enterprise Economics, Ne w York: Nort h Holland ,1989; and Raymond Vernon, editor, The Promise of Privatization: A Challenge for AmericanForeign Policy, Ne w York: Counci l on Foreign Relations , 1988 .
265
www.fraserinstitute.org

Table Il-C: The Extent Countries Imposed Price Controls on Various Goodsand Services, (1989 and 1994)
(TenINDUSTRIAL
COUNTRIES
United StatesCanadaAustraliaJapanNew ZealandAustriaBelgiumDenmarkFinlandFranceGermanyIcelandIrelandItalyNetherlandsNorwaySpainSwedenSwitzerlandUnited Kingdom
Rating
indicates little or noof price controls)
1989
8
8
6
6
g526
6
6
9
-
7
5
7
5
6
6
7
8
CENTRAL/S. AMERICA
ArgentinaBelizeBoliviaBrazilChileColombiaCosta RicaDominican RepublicEcuadorE! SalvadorGuatemalaHaitiHondurasJamaicaMexicoNicaraguaPanamaParaguay
0
-
6
0
8
6
-
4
0
-
6
2-
4
0
-
2
4
use
1994
8
8
7
5
10
6
5
8
8
7
9
-
8
5
7
7
6
8
6
g
8
6
8
4
8
6
6
6
0
6
6
0
4
4
72
4
4
(TenCENTRAU-
S. AMERICA (con't)
PeruTrinidad/TobagoUruguayVenezuela
Rating
indicates little or noof price controls)
1989
2
4
4
4
EUROPE/MIDDLE EAST
BulgariaCyprusCzechoslovakia
Czech RepSlovakia
EgyptGreeceHungaryIranIsraelJordanMaltaPolandPortugalRomaniaSyriaTurkey
ASIA
BangladeshFijiHong KongIndiaIndonesiaMalaysiaNepalPakistanPhilippinesSingaporeSouth KoreaSri LankaTaiwanThailand
0
0
0-
-
20
6
20
20
2
4
0-
6
0
6
10
3
6
5-
-
2
8
3-
6
4
use
1994
6
4
6
2
4
2
-
5
4
2
6
7
-
4
2
2
5
6
4
0
3
0
6
g3
3
4-
43
8
4
6
7
5
266
www.fraserinstitute.org

Table Il-C: (continued )
Rating
AFRICA
AlgeriaBeninBotswanaBurundiCameroonC African RepChadCongo PeoplesCote d' IvoireGabonGhanaKenyaMadagascarMalawiMaliMauritius
(Ten indicates littleof price controls)
1989
-
-
6
-
2-
-
Rep 0
-
-
0
2
-
2
-
or no use
1994
-
2
6
-
2-
-
0
4
4
6
4
-
2
-
Rating
AFRICA (cont)
MoroccoNigerNigeriaRwandaSenegalSierra LeoneSomaliaSouth AfricaTanzaniaTogoTunisiaUgandaZaireZambiaZimbabwe
(Ten indicates littleof price controls)
1989
0
-
4
-
4
2
0
4
0
2
4
-
-
0
2
or no use
1994
4
-
4
-
4
2
-
4
4
2
6
-
-
2
2
Source: Th e foundation for these rating s was provided by the data of the World Economi cForum, The World Competitiveness Report, (198 9 an d 1994 ) an d Pric eWaterhouse, Doing Business Series. The World Competitiveness Report containssurvey dat a indicatin g the "extent to which companie s ca n set thei r price s freely :0 = not at all, to 10 0 = very much so". Thirty-tw o countries were rated in the 198 9survey an d 4 1 countrie s i n th e 199 4 survey . Sinc e thes e dat a wer e th e mos tcomprehensive quantifiable indicators of the presence or absence of price controlswhich w e coul d find , w e use d the m t o rat e th e followin g countries : Austria ,Australia, Belgium , Brazil , Canada, Denmark, Finland , France, Germany, Greece,Hong Kong, India, Indonesia, Ireland, Italy, Japan, Malaysia, Mexico, Netherlands,New Zealand, Norway, Portugal , Singapore, Spain, Sweden, Switzerland, Taiwan,Thailand, Turkey , Unite d Kingdom , an d Unite d State s fo r bot h 198 9 an d 1994 .These dat a were als o use d to rat e Argentina , Columbia, Chile , Czec h Republic ,Hungary, Denmark, Poland, Philippines, South Africa, and Venezuela in 1994. Th efollowing tabl e indicate s th e relationshi p betwee n th e Worl d Economi c Foru msurvey data and our 0 to 1 0 rating system.
267
www.fraserinstitute.org

Percent Indicating Companies Ca nSet Prices Freel y
more than 90%85-9080-8575-8070-7565-7060-6555-6050-5545-50
less than 40%
Rating
109876543210
The Pric e Waterhouse bookle t provide d a verbal description o n the genera lpresence o r absenc e o f pric e controls which helpe d u s classify othe r countries . I nsome instances, this information was supplemented with similar information which wasavailable fro m countr y sources . Thes e descriptiv e dat a wer e use d t o classif ycountries and place them into the following categories :
General Characteristics o f CountryRating
No Price controls or marketing boards are present .
Except in industries (e.g. , electric powe r generation )where economics o f scale may reduce the effectivenes sof competition, prices are generally determined bymarket forces.
Price controls are often applied in energy markets ;marketing boards often influenc e price s of agricultura lproducts; controls are also present i n a few other areas,but most prices are determined b y market forces.
Price controls are levied on energy, agricultural , andmany stable products (e . g. food products , clothing andhousing) tha t are widely purchase d b y households; bu tmost other prices are set by market forces.
Price controls apply to a significant numbe r of product sin both agricultural and manufacturing industries .
There is widespread us e of price controls throughout theeconomy.
10
268
www.fraserinstitute.org

Table Il-D: Freedom of Businesses and Cooperatives to Compete inthe Marketplace
Are Businesses and Cooperatives Free to Compete?
(1994-95 Rating-th eINDUSTRIAL
COUNTRIES
United StatesCanadaAustraliaJapanNew ZealandAustriaBelgiumDenmarkFinlandFranceGermanyIcelandIrelandItalyNetherlandsNorwaySpainSwedenSwitzerlandUnited Kingdom
Higher the Rating the Greater the Freedom to Compete
10.07.5
10.07.5
10.07.57.5
10.07.57.57.5
10.07.57.57.57.57.5
10.010.010.0
CENTRAL/SOUTH AMERICA
ArgentinaBelizeBoliviaBrazilChileColombiaCosta RicaDominican RepEcuadorEl SalvadorGuatemalaHaitiHondurasJamaicaMexicoNicaraguaPanama
10.010.07.57.5
10.07.5
10.07.57.55.07.52.57.57.57.55.07.5
CENTRAL7-
S. AMERICA (con't)
ParaguayPeruTrinidad/TobagoUruguayVenezuela
EUROPE/MIDDLE EAST
BulgariaCyprusCzech RepublicEgyptGreeceHungaryIranIsraelJordanMaltaPolandPortugalRomaniaSlovakiaSyriaTurkey
ASIA
Bangladesh
FijiHong KongIndiaIndonesiaMalaysiaNepalPakistanPhilippinesSingaporeSouth KoreaSri LankaTaiwanThailand
)
7.57.5
10.07.55.0
7.510.05.02.57.55.02.57.55.07.57.57.55.05.02.57.5
7.57.5
10.05.02.57.55.05.05.07.57.55.07.55.0
269www.fraserinstitute.org

Table Il-D: (ConT)
Are Businesses and Cooperatives Free to Compete?
(1994-95 Rating-the Higher the Rating the Greater the Freedom to Compete)COUNTRY
AFRICA (cont)AlgeriaBeninBotswanaBurundiCameroonC African RepChadCongo RepCote d1 IvoireGabonGhanaKenyaMadagascarMalawiMaliMauritius
2.55.07.52.55.05.05.05.05.07.55.05.05.07.55.0
10.0
MoroccoNigerNigeriaRwandaSenegalSierra LeoneSomaliaSouth AfricaTanzaniaTogoTunisiaUgandaZaireZambiaZimbabwe
5.05.05.02.55.05.02.55.02.55.05.05.02.55.05.0
Source: Se e Freedom House, Freedom in the World: The Annual Survey of PoliticalRights and Civil Liberties, 1994-95. Th e surve y tea m o f Freedo m Hous eranked countrie s wit h regar d t o th e economi c freedo m o f businesse s an dcooperatives to compete i n the marketplace (Ite m 9 on their checklis t o f 1 3civil libert y categories) . Eac h countr y wa s give n a ratin g o f 0 t o 4 wit h arating o f 4 indicatin g th e countrie s fo r whic h businesse s an d cooperative swere mos t free to compete . W e transformed th e 0 to 4 ratin g o f Freedo mHouse to our 0 to 1 0 scale (0 = 0, 1 = 2.5, 2 = 5, 3 = 7.5 and 4 = 10) . Th eactual ratings for the specific checklis t item s were unavailable i n the AnnualSurvey publication. However , Joseph Ryan, a senior scholar at the FreedomHouse, graciously supplie d them to us.
270www.fraserinstitute.org

Table Il-E: Equality of Citizens Under the Law and Access to aNondiscriminatory Judiciary
Equality of Citizens Under the Law
(1994-1995: th e higher rating indicates greater equality under the law)INDUSTRIAL
COUNTRIES
United StatesCanadaAustraliaJapanNew ZealandAustriaBelgiumDenmarkFinlandFranceGermanyIcelandIrelandItalyNetherlandsNorwaySpainSwedenSwitzerlandUnited Kingdom
7.5
7.5
7.5
7.5
10.07.5
10.010.010.07.5
7.5
10.07.5
7.5
10.010.05.0
10.010.05.0
CENTRAL/SOUTH AMERICA
ArgentinaBelizeBoliviaBrazilChileColombiaCosta RicaDominican RepEcuadorEl SalvadorGuatemalaHaitiHondurasJamaicaMexicoNicaraguaPanama
2.5
7.5
2.5
0.05.0
0.07.5
2.5
2.5
2.5
0.00.02.5
2.5
0.00.02.5
CENTRAL/-S. AMERICA (con't)
ParaguayPeruTrinidad/TobagoUruguayVenezuela
EUROPE/MIDDLE EAST
BulgariaCyprusCzech Republic
EgyptGreeceHungaryIranIsraelJordanMaltaPolandPortugalRomaniaSlovakiaSyriaTurkey
ASIA
BangladeshFijiHong KongIndiaIndonesiaMalaysiaNepalPakistanPhilippinesSingaporeSouth KoreaSri LankaTaiwanThailand
2.50.07.55.00.0
7.57.57.50.05.07.50.05.02.5
10.07.57.55.05.00.00.0
5.05.07.52.50.02.50.00.00.00.07.50.02.50.0
271www.fraserinstitute.org

Table Il-E: (continued)
Equality of Citizens Under the Law
(1994-1995: th e higher rating indicates greater equality under the law)
AFRICA
Algeria 0. 0 Morocc o 0. 0Benin 5. 0 Nige r 0. 0Botswana 5. 0 Nigeri a 0. 0Burundi 0. 0 Rwand a 0. 0Cameroon 0 ^ Senega l Z5 _C African Rep 2. 5 Sierr a Leone 0. 0Chad 0. 0 Somali a 0. 0Congo Rep 2. 5 Sout h Africa 5. 0Cote d' Ivoire 0. 0 Tanzani a 2. 5Gabon 0. 0 Tog o 0. 0Ghana 2. 5 Tunisi a 0. 0Kenya 0. 0 Ugand a 0. 0Madagascar 2. 5 Zair e 0. 0Malawi 5. 0 Zambi a 0. 0Mali 0. 0 Zimbabw e 2. 5Mauritius 7. 5
Source: Thes e dat a ar e fro m th e annua l surve y o f politica l an d civi l libertie sconducted by the Freedom House . Ite m 5 of the 13 item civil libertieschecklist is : "Ar e citizens equal under the law, do they have access toan independent , non-discriminator y judiciary , an d are they respecte dby the security forces?" Countrie s were given ratings rangin g from 0to 4. Th e highe r the rating , the greater the degree o f equality unde rthe law. W e transformed the 0 to 4 rating s of the Freedom House toour 0 to 10 scale (0 = 0, 1 = 2.5, 2 = 5, 3 = 7.5, and 4=10). W e areindebted t o Josep h Rya n o f th e Freedo m Hous e fo r supplyin g th erating for each country to us. Se e Freedom House, Survey of PoliticalRights and Civil Liberties, 1994-95. Thi s variable was not available forthe early period s of our study.
272www.fraserinstitute.org

Table Il-F: Freedom from Government Regulations and PoliciesThat Cause Negative Interest Rates
Have Government Regulations, Interest RateControls, and Inflationary Monetary Policy Caused
Negative Interest Rates and Credit Market Disruptions?(When this is the case, a country is given a low rating.)
1973-75 1978-8 0 1983-8 5 1988-9 0 1991-9 3INDUSTRIAL COUNTRIES
United StatesCanadaAustraliaJapanNew ZealandAustriaBelgiumDenmarkFinlandFranceGermanyIcelandIrelandItalyNetherlandsNorwaySpainSwedenSwitzerlandUnited Kingdom
8644-
668-
882466
--
464
CENTRAL/SOUTH AMERICA
ArgentinaBelizeBoliviaBrazilChileColombiaCosta RicaDominican RepEcuadorEl SalvadorGuatemalaHaitiHondurasJamaicaMexicoNicaraguaPanama
----------------_
1010101068
101088
10464
1066864
086-
8-----
8--
44-
101010108
101010108
104
106
101010101010
08008-
6-
088-
1044-_
10101010101010101081061010101010101010
01080888-
088-
8880
10
1010101010610101081061010101010101010
81080
1088-
6108-
6480
10
273
www.fraserinstitute.org

Table Il-F: (continued)
--
88
20680
82864
Have Government Regulations, Interest Rate
Controls, and Inflationary Monetary Policy Caused
Negative Interest Rates and Credit Market Disruptions?
(When this is the case, a country is given a low rating.)1973-75 1978-8 0 1983-8 5 1988-9 0 1991-9 3
CTRL/S. AMERICAParaguayPeruTrinidad/TobagoUraguay - 6Venezuela
EUROPE/MIDDLE EASTBulgaria -Cyprus 8 4 8 1 0 8Czechoslovakia -
Czech Rep . . . . 6Slovakia - - - - 4 _
Egypt - 4 6 6 8Greece 4 6 6 8 8Hungary - 6 - 6 6Iran -Israel - 0 0 6 8 _Jordan - - - 4 6Malta 6 1 0 1 0 1 0Poland - - - 0 4Portugal - 4 1 0 8 1 0Romania - - - - -Syria . . . . .Turkey 2 0 8 2 6
ASIABangladesh - 6 6 1 0 1 0Fiji 0 6 8 6 6Hong Kong . . . . .India - 8 8 8 1 0Indonesia 2 2 - 1 0 10 _Malaysia - 6 1 0 1 0 1 0Nepal 6 6 1 0Pakistan - 6 8 6 8Philippines 8 8 4 8 1 0Singapore : 1 0 1 0 1 0 10 _South Korea 2 4 1 0 1 0 8Sri Lanka - 4 8 8 1 0Taiwan 8 8 1 0 1 0 1 0Thailand - 4 1 0 8 1 0
274
www.fraserinstitute.org

Table Il-F: (continued)
Have Government Regulations, Interest RateControls, and Inflationary Monetary Policy Caused
Negative Interest Rates and Credit Market Disruptions?
(When this is the case, a country is given a low rating.)1973-75 1978-8 0 1983-8 5 1988-9 0 1992-9 4
AFRICA (cont)AlgeriaBeninBotswanaBurundiCameroonC African RepChadCongo PeoplesCote d' IvoireGabonGhanaKenyaMadagascarMalawiMaliMauritiusMoroccoNigerNigeriaRwandaSenegalSierra LeoneSomaliaSouth AfricaTanzaniaTogoTunisiaUgandaZaireZambiaZimbabwe
Rep
6426
68
_6_08
44
226860
44840
8866888
1080
10
86
106
48600
86
84
108
10882
10
68
80
1080084
0
0
8868
48
10
80682
10
275
www.fraserinstitute.org
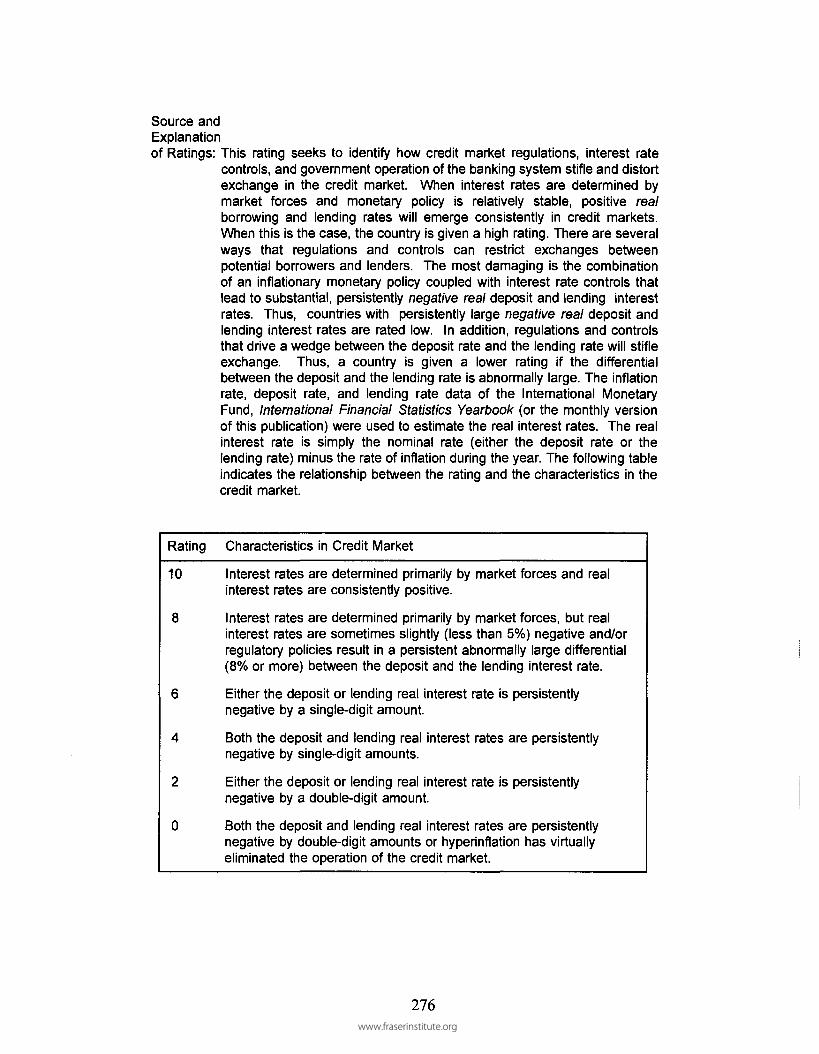
Source andExplanationof Ratings : This ratin g seek s t o identif y ho w credi t marke t regulations , interes t rat e
controls, and government operation of the banking system stifle and distortexchange i n the credi t market . Whe n interes t rate s ar e determine d b ymarket force s an d monetar y polic y i s relativel y stable , positiv e realborrowing an d lendin g rate s wil l emerg e consistentl y i n credi t markets .When this is the case, the country is given a high rating. There are severalways tha t regulation s an d control s ca n restric t exchange s betwee npotential borrower s and lenders . Th e mos t damaging i s the combinatio nof a n inflationar y monetar y polic y couple d wit h interes t rat e control s tha tlead to substantial, persistently negative real deposit and lending interes trates. Thus , countrie s with persistentl y larg e negative real deposi t an dlending interes t rate s are rate d low. I n addition, regulations an d control sthat drive a wedge between the deposit rate and the lending rate will stifleexchange. Thus , a countr y i s give n a lowe r ratin g i f th e differentia lbetween the deposit and the lending rate is abnormally large . The inflationrate, deposi t rate , an d lendin g rat e dat a o f th e Internationa l Monetar yFund, International Financial Statistics Yearbook (or the monthl y versio nof this publication) were used to estimate the real interest rates. Th e rea linterest rat e i s simpl y th e nomina l rat e (eithe r th e deposi t rat e o r th elending rate) minus the rate of inflation during the year. The following tableindicates the relationship between the rating and the characteristics i n thecredit market .
Rating Characteristic s i n Credit Marke t
10 Interes t rate s are determined primaril y b y market forces and rea linterest rates are consistently positive .
8 Interes t rate s are determined primaril y b y market forces, but rea linterest rate s are sometimes slightly (les s than 5%) negativ e and/o rregulatory policie s resul t i n a persistent abnormall y larg e differentia l(8% or more) between the deposit and the lending interest rate .
6 Eithe r the deposit or lending rea l interest rate is persistentlynegative b y a single-digit amount .
4 Bot h the deposit and lending rea l interest rate s are persistentl ynegative by single-digit amounts .
2 Eithe r the deposit or lending rea l interest rate is persistentl ynegative by a double-digit amount .
0 Bot h the deposit and lending rea l interest rates are persistentl ynegative by double-digit amounts or hyperinflation ha s virtuallyeliminated the operation of the credit market .
276www.fraserinstitute.org

Table Ill-A: Transfers and Subsides As A Percent of GDP(1975,1980,1985,1990, and 1992)
INDUSTRIAL
COUNTRIES
United StatesCanadaAustraliaJapanNew ZealandAustriaBelgiumDenmarkFinlandFranceGermanyIcelandIrelandItalyNetherlandsNorwaySpainSwedenSwitzerlandUnited Kingdom
CENTRAL/SOUTH
ArgentinaBelizeBoliviaBrazilChileColombiaCosta RicaDominican RepublicEcuadorEl SalvadorGuatemalaHaitiHondurasJamaicaMexicoNicaraguaPanama
1975
11.19.18.59.6
20.219.428.517.814.124.017.49.9
18.317.525.6
--
25.0-
15.0
AMERICA
7.9-
1.3-
10.53.0
-
-
-
2.50.8
-
0.57.04.12.43.8
(3)
(4)
(4)
(4)
(D(D(0)(2)(3)(0)(2)(4)(2)(2)(0)
(0)
(3)
(4)
(10)
(4)
(8)
(8)(10)
(10)
(5)
(7)
(8)
(7)
Transfers and:Subsidies As A Percent of GDP
(Rating in parenthesis)1980
10.914.510.110.021.922.126.020.814.326.117.610.617.720.929.422.112.324.713.415.8
9.72.61.6
12.412.92.96.01.65.22.71.2
---
4.44.14.9
(3)(3)(4)(4)(Dd)(0)
(D(3)
(0)
(2)(4)(2)(1)(0)(D(3)(0)(3)(2)
(4)(8)O)(3)(3)(8)(5)0)(6)(8)
(10)
(7)(7)(6)
1985
12.516.310.910.420.623.127.620.415.826.819.011.720.528.531.621.416.926.013.217.9
11.73.61.8
10.015.34.47.22.54.02.01.37.42.30.65.46.24.8
(3)(2)(3)(4)(D(0)(0)(D(2)(0)
(D(3)(D(0)(0)(D(2)(0)(3)(2)
(3)(8)(9)(4)(2)(7)(5)(8)(7)(9)
(10)
(5)(9)
(10)(5)(5)(6)
1990
12.715.610.79.9
27.522.425.022.616.025.217.910.117.127.128.727.316.029.916.014.9
8.51.22.8
10.710.54.65.01.54.31.41.8
-2.22.06.46.87.4
(3)(2)(3)(4)(0)(0)(0)(0)(2)(0)(2)(4)(2)(0)(0)(0)(2)(0)(2)(3)
(4) a(10)
(8)(3)(4)(7)(6)(9)(7)
(10)(9) a
(9)(9)(5)(5)(5)
1992
14.317.713.410.015.723.426.624.621.126.922.411.018.128.630.727.016.331.716.017.3
12.81.22.6
11.810.85.74.71.43.01.51.9
-4.03.97.16.29.8
(3)(2)b
(3)(4)(2)(0)(0)(0)d)(0)(0)(3)(2)b
(0)(0)(0)( 2 ) b
(0)(2)(2)
(3)(10)
(8)( 3 ) b
(3)(5)(6)(9)(8)
(9)(9)
(7)(7)(5)(5)
(4)
277
www.fraserinstitute.org

Table Ill-A: (con't)
CENTRAL/-
SOUTH AMERICA
ParaguayPeruTrinidad & TobagoUruguayVenezuela
EUROPE/MIDDLE EAST
BulgariaCyprusCzechoslovakia
Czech RepublicSlovakia
EgyptGreeceHungaryIranIsraelJordanMaltaPolandPortugalRomaniaSyriaTurkey
ASIA
BangladeshFijiHong KongIndiaIndonesiaMalaysiaNepalPakistanPhilippinesSingapore
1975
2.01.9
-11.82.3
-10.3
---
25.08.5
-8.9
--
14.7-
14.6--
6.0
-1.91.13.81.56.4
--
0.81.4
0)(9)
(3)(8)
(4)
(0)(4)
(4)
(3)
(3)
(5)
(9)(10)(7)(9)(5)
(10)(10)
Transfers and Subsidies As A Percent of GDP
(Rating in parenthesis)1980
2.01.96.09.12.0
-6.6
---
17.212.5
-7.0
20.86.3
12.2-
16.314.1
-6.0
-2.50.65.43.34.8
--
1.11.1
(9)(9)(5)(4)(9)
(5)
(2)(3)
(5)(D(5)
(3)
(2)
(3)
(5)
(8)(10)
(6)
(8)
(6)
(10)
(10)
1985
2.11.8
14.910.04.5
17.58.1
---
13.918.033.33.0
19.75.1
15.627.419.58.0
-10.3
-4.50.96.52.53.6
--
0.21.8
(9)(9)(3)(4)(7)
(2)(4)
(3)(2)(0)(8)(D(6)(2)(0)(D(4)
(4)
(7)(10)
(5)(8)(8)
(10)
(9)
1990
1.83.0
10.012.05.8
27.28.3
37.2--
8.927.128.74.4
16.73.7
15.67.2
15.518.6
-3.9
-1.00.96.52.02.4
--
0.92.6
(9)
(8)
(4)
(3)
(5)
(0)
(4)
(0)
(4)
(0)
(0)
(7)
(2)
(7)
(2)
(5)
(2)
(D
(7)
(10)(10)
(5)(9)(8)
(10)
(8)
1992
3.32.88.3
15.95.3
15.69.9
---
10.615.625.0
-15.23.1
15.2-
14.520.9
-5.8
-1.01.26.70.74.2
--
0.82.9
(8)(8)(4)(2)(6)
(2)( 4 ) b
(4)(2)(0)
(2)(8)( 2 ) b
(3)(D
(5)
(10)(10)
( 5 ) b
(10)(7)
(10)(8)
South KoreaSri LankaTaiwanThailand
2.0 (9)8.1 (4)2.2 (9)0.6 (10)
2.0 (9)8.4 (4)2.6 (8)0.7 (10)
2.2 (9 )5.1 (6)3.6 (8)1.2 (10 )
2.9 (8)6.0 (5)4.7 (6)1.0 (10)
2.6 (8)6.0 (5)5.9 (5)0.9 (10)
278
www.fraserinstitute.org

Table Ill-A: (con't)Transfers and Subsidies As A Percent of GDP
(Rating in parenthesis)1975 1980 1985 1990 1992
AFRICA
AlgeriaBeninBotswanaBurundiCameroonCentral African RepChadCongoCote d'lvoireGabonGhanaKenyaMadagascarMalawiMaliMauritiusMoroccoNigerNigeriaRwandaSenegalSierra LeoneSomaliaSouth AfricaTanzaniaTogoTunisiaUgandaZaireZambiaZimbabwe
--
5.5-
1.4-----
3.1--
1.02.36.66.0
2.90.41.91.6
--
0.1-
1.9-
1.07.0
-
(6)
(9)
(8)
(10)(8)(5)(5)
(8)(10)
O)(9)
(10)
(9)
(10)(5)
--
4.9-
0.8---
4.2-
2.42.3
-2.12.36.54.12.5
-0.4
---
3.20.1
-5.6
-0.68.7
11.4
(6)
(10)
(7)
(8)(8)
(9)(8)(5)(7)(8)
(10)
(8)(10)
(5)
(10)(4)(3)
--
7.3-
0.6-----
1.34.7
-2.32.35.24.6
-1.4
--
0.6-
4.85.2
-6.8
--
4.210.0
(5)
(10)
(10)
(6)
(8)(8)(6)(7)
(10)
(10)
(6)(6)
(5)
(7)(4)
--
6.6-
2.7-
0.9--
1.22.62.81.42.40.64.22.3
--
3.5-
1.6-
4.8--
9.3-
1.0--
(5)
(8)
(10)
(10)(8)(8)(9)(8) a
(10)(7)(8)
(8)
(9)
(6)
(4)
(10)
--
6.9-
2.7-
0.9--
1.23.31.71.4
--
4.9---
2.2-
3.3-
5.0--
8.3----
(5)
(8)
(10) b
(10) b
(7)
(9)( 9 ) b
(6)
(9)
(8)
( 6 ) b
( 4 ) b
a Indicate s data are for 1989.b Indicate s data are for 1991.
Source: Th e GDP data are from the World Bank , World Tables, 1994. Th e data ontransfers an d subsidies ar e from Internationa l Monetar y Fund , GovernmentFinance Statistics Yearbook, (various years). I n addition, supplementary dataon transfers and subsides from Inter-American Development Bank, Economicand Social Progress in Latin America, 1994 , were als o utilized . Th e 199 2data wer e the mos t recen t availabl e a t th e time this stud y was completed .The bas e yea r fo r th e ratin g o f eac h countr y wa s 1985 . Th e followin gconversion table divided the 198 5 data into eleven intervals of equal size:
279
www.fraserinstitute.org

Table Ill-A: (corVt)Transfers and Subsidies
As a Percent of GDP
0.0%-1.3%1.4-2.22.3 - 3.63.7 - 4.64.7 - 5.35.4 - 7.7
7.8 - 10.610.7-15.115.2-18.518.6-22.3
>22.3
Rating
109876543210
280
www.fraserinstitute.org

Table Ill-B: Top Marginal Tax Rate and Income Threshold (Measuredin 1982-84 dollars) at which Top Rate Takes Affect
INDUSTRIAL
COUNTRIES
United StatesCanadaAustraliaJapanNew ZealandAustria
BelgiumDenmarkFinlandFranceGermanyIcelandIrelandItalyNetherlandsNorwaySpainSwedenSwitzerlandUnited Kingdom
CENTRAL/SOUTH
ArgentinaBelizeBoliviaBrazilChileColombiaCosta RicaDominican RepEcuadorEl SalvadorGuatemalaHaitiHondurasJamaica
Top
Marginal
Tax Rate
70-7543-61
646860546463
61-684856
804846745570
38-4241
AMERICA
51
5080415049505534
2760
1974
Threshold
Income
Level
185,000130,10974,348
185,00083,642
185,000185,00037,174
111,522130,109167,283
46,468185,000185,000111,522185,00074,348
111,522185,000
65,055
65,055185,000111,52283,642
185,000148,696185,000185,000
185,00027,881
Rating
0
4
2
1
3
4
2
1
2
5
4
0
5
5
0
4
1
7
7
4
5
0
6
5
5
5
4
9
9
2
Top
Marginal
Tax Rate
70-7547-62
627560627666
65-716056
607272756687
31-4483
45
4855605650
506040
4080
1979
Threshold
Income
Level
82,645115,84051,928
546,69431,818
153,581187,87937,05288,843
126,722193,939
19,559819,559127,54882,645
195,59253,30676,17166,942
101,515
15,152105,23442,42436,50156,061
150,000137,741688,700
688,70023,967
Rating
0
4
2
0
2
2
0
0
1
3
3
1
0
0
0
1
0
7
0
6
3
4
2
2
5
5
3
8
8
0
281
www.fraserinstitute.org

Table Ill-B: (continued)
CENTRAL/-
S. AMERICA (con't)
MexicoNicaraguaPanamaParaguayPeruTrinidad/TobagoUruguayVenezuela
Top
Marginal
Tax Rate
472152
51
4120
EUROPE/MIDDLE EAST
BulgariaCyprusCzechoslovakia
Czech RepublicSlovakia
EgyptGreeceHungaryIranIsraelJordanMaltaPolandPortugalRomaniaSyriaTurkey
ASIA
BangladeshFijiHong KongIndiaIndonesiaMalaysiaNepalPakistanPhilippinesSingaporeSouth KoreaSri LankaTaiwanThailand
54
52
40
82
5315774850
61565563
6060
1974
Threshold
Income
Level
83,642185,000185,000
55,761
185,000185,000
37,174
130,109
150,900
167,283
27,00027,88113,94037,17446,468
27,881167,00083,642
110,000
111,500100,000
Rating
5104
4
710
3
4
8
0
310044
1342
33
Top
Marginal
Tax Rate
555056
65
0
45
60
8060
66
65
84
75
605315605060
55705589
60.56060
1979
Threshold
Income
Level
90,634275,482275,482
53,719
1,350,000
19,146
196,832113,223
70,000
18,000
28,788
60,000
10,00013,77428,51216,52921,21247,383
6,88794,353
255,096238,567
3,500110,00068,871
Rating
4
5
3
2
10
7
1
0
3
1
0
0
0
1
2
101
3
2
2
1
4
0
0
3
3
282www.fraserinstitute.org
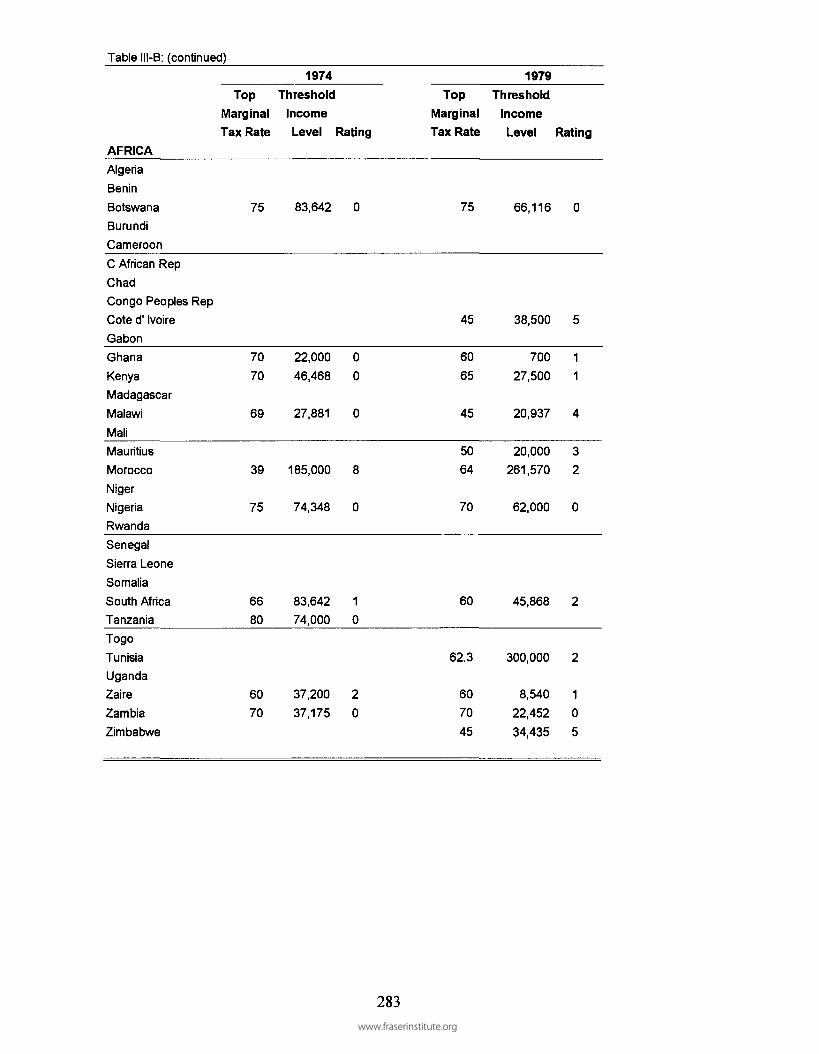
Table Ill-B: (continued)
AFRICA
AlgeriaBeninBotswanaBurundiCameroonC African RepChadCongo Peoples RepCote d1 IvoireGabonGhanaKenyaMadagascarMalawiMaliMauritiusMoroccoNigerNigeriaRwandaSenegalSierra LeoneSomaliaSouth AfricaTanzaniaTogoTunisiaUgandaZaireZambiaZimbabwe
Top
Marginal
Tax Rate
75
7070
69
39
75
6680
6070
1974
Threshold
Income
Level
83,642
22,00046,468
27,881
185,000
74,348
83,64274,000
37,20037,175
Rating
0
0
0
0
8
0
1
0
2
0
Top
Marginal
Tax Rate
75
45
6065
45
5064
70
60
62.3
607045
1979
Threshold
Income
Level
66,116
38,500
70027,500
20,937
20,000261,570
62,000
45,868
300,000
8,54022,45234,435
Rating
0
5
1
1
4
3
2
0
2
2
1
0
5
283www.fraserinstitute.org

Table Ill-B: (continued)
INDUSTRIAL
COUNTRIES
United States
CanadaAustraliaJapan
New Zealand
AustriaBelgiumDenmarkFinlandFranceGermanyIceland
Ireland
Italy
NetherlandsNorway
SpainSweden
SwitzerlandUnited Kingdom
TopMarginal
Tax Rate
50-59
49-60607066
627673
64-706556
65
81
72646680
33-4660
CENTRAL/SOUTH AMERICA
Argentina
BelizeBoliviaBrazilChileColombiaCosta RicaDominican RepEcuador
El SalvadorGuatemalaHaitiHonduras
JamaicaMexicoNicaraguaPanamaParaguayPeruTrinidad/Tobago
6250
3060574950
73.158
4848
46
58555056306550
1984
Threshold
Income
Level
156,300
43,100
28,400305,500
17,200
65,35060,60021,40059,30030,70039,650
19,000
248,200
59,10032,60067,70038,100
145,30040,100
65,400
30,00045
10,4003,600
55,4002,200
497,238
27,80011,700
324,350
476,400
2,40059,30067,600
192,5008,200
4034,600
Rating
43
21
0
20011
2
0
0
01
1
072
2
481
1530235
51
4
53804
TopMarginal
Tax Rate
33-4242-47
496533
50
55-6568
63-695356
58
50
72545672
33-4340
3545
10
255030257340
60343046
3340
5630
4535
1989
Threshold
Income
Level
58,93735,888
23,555178,000
15,194
42,72846,37924,802
47,12829,929
114,764
20,214
180,906
90,67528,11757,11424,346
176,000
24,700
40,465
23,9801 i
1,4343,709
32,8229,843
183,00021,78739,370
3,791
193,000393,701
1,48989,000
157,4803,822
12,5589,330
Rating
75327
4
20
033
1
5
033
085
7
4i 1 0
9389
05
279
5
77
38
47
TopMarginal
Tax Rate
40-4744-54
4765
33
5055-65
65
55-615753
48
51
604256
56-6326-32
40
3045
1335483725
27253025
46
25353030303040
1994
Threshold
Income
Level
168,900
30,25033,675
178,571
16,981
57,66067,01751,11848,405
103,060139,073
14,570
118,798
30,11323,60252,24416,072
522,68723,621
80,97220,243
1
83,9363,522
22,7079,407
8,09738,12115,4067,522
91,804
38218,57219,128
134,95310,18228,545
4,590
Rating
74
4
2
7
5
2
2
2
3
4
3
4
2431
9
5
9
4a 1 0
835989
89
59
789
a 885
Uruguay
Venezuela
0
4510
1,110,000 70
4510
234,000 70
30 27,054
108
284
www.fraserinstitute.org

Table Ill-B: (continued)
EUROPE/-
MIDDLE EAST
BulgariaCyprusCzechoslovakia
TopMarginal
Tax Rate
60
Czech RepublicSlovakia
EgyptGreeceHungaryIran
IsraelJordan
MaltaPoland
PortugalRomania
SyriaTurkey
ASIA
Bangladesh
FijiHong Kong
IndiaIndonesiaMalaysiaNepalPakistanPhilippinesSingapore
South KoreaSri Lanka
TaiwanThailand
AFRICA
Algeria
BeninBotswanaBurundiCameroon
65
63
9060
65
69
60
6050
25
623545
60604065
60.56065
60
60
1984
Threshold
Income
Level
20,900
148,000
36,500
59,700
55,000
10,000
39,900
53,800
8,20016,6504,900
7,70044,750
117,300
6,50024,350
325,00069,600
2,220
100,00070,700
34,300
30,000
Rating
1
21
03
0
0
3
139
0
76
1
1820
32
2
2
TopMarginal
Tax Rate
6255
65505075
5145
65
40
50
5025
53
3545
50353360
5055
50
60
1989
Threshold
Income
Level
18,54752,500
61,75028,5949,900
140,82782,00049,000
3,030
16,171
32,800
21,8727,066
5,194
22,73190,161
8,39418,031
161,850110,000
97,65862,270
16,472
20,600
Rating
04
2
430
450
5
4
3
9
276
379
3
54
3
1
TopMarginal
Tax Rate
40
4447
50
404454
50
35454060
55
3525
45
3534
38353048
4037
40
60
1994
Threshold
Income
Level
10,391
24,32422,000
13,57518,9973,694
116,434
34,575
1,3335,741
21,2164,400
112,009
6,4826,996
2,15815,99024,872
6,68012,180
168,06153,473
75,901105,473
13,126
17,155
Rating
5
4335444
7451
4
79
477
5795
77
5
1
285
www.fraserinstitute.org

Table Ill-B: (continued )
AFRICA (cont)
C African Re pChadCongo People sCote d' IvoireGabon
GhanaKenya
MadagascarMalawi
MaliMauritius
MoroccoNigerNigeriaRwandaSenegalSierra Leone
SomaliaSouth Africa
TanzaniaTogo
Tunisia
UgandaZaireZambia
Zimbabwe
Top
Marginal
Tax Rate
Rep45
6065
50
35
87
55
65
50
95
62.37060
80
63
1984
Threshold
Income
Level
25,050
4009,900
13,500
10,00075,500
40,000
39,000
32,250
19,293
351,300
4,4401,350
10,700
22,200
Rating
5
1
0
3
7
0
3
1
4
0
2
0
1
0
0
TopMarginal
Tax Rate
504560
5550
50
35
87
55
48
45
50
506075
60
1989
Threshold
Income
Level
34,250
14,500
15,0003,700
400
7,194
2,750
28,699
4,200
31,000
26,4561,200
2,020854
2,375
13,287
Rating
4
412
3
3
7
0
2
4
5
3
31
01
TopMarginal
Tax Rate
50
506635
40
35
30
47
35
50 b
43
30
3060 b
3550
1994
Threshold
Income
Level
18,299
5,500
2,745
11,588
2,970
5,337
2,006
8,537
3,067
31,700
16,006422
2,464100
8673,744
Rating
3
30
75
7
8
3
7
b 4
4
8
8b 1
73
Flat tax rate on all taxable income.Based on the 199 3 data.
Source: Th e dat a ar e fro m Pric e Waterhouse , Individual Taxes: A WorldwideSummary, (various issues). Th e exchange rate at beginning of the year wasused t o conver t th e incom e threshol d dat a t o U.S . dollars , an d th e U.S .Consumer Pric e Inde x wa s use d t o conver t th e threshol d t o rea l 1982-8 4dollars. Th e following conversion table/matrix was devised to transform themarginal tax rate/income threshold data for each country into the zero to tenrating system:
286
www.fraserinstitute.org

Table Ill- B (con't )
Top Margina lTax Rat e
20% or less21 to 2526 to 3031 to 3536 to 4041 to 4546 to 5051 to 5556 to 6061 to 6566 to 70
more than 70%
Income Threshold Leve l (1982-84 U.S. Dollars )
Less than25,000
1098754321000
25,000 to50,000
1098765432100
50,000 to150,000
10109876543210
more than150,000
10109987543210
287
www.fraserinstitute.org

Table Ill-C: The Use of Conscription to Obtain Military Personnel
(Countries with Voluntary Military Service are given a Rating of10; Countries that Use Conscription to Obtain Military Personnelare Give n a Rating of Zero.)
INDUSTRIAL
COUNTRIES
United StatesCanadaAustraliaJapanNew ZealandAustriaBelgiumDenmarkFinlandFranceGermanyIcelandIrelandItalyNetherlandsNorwaySpainSwedenSwitzerlandUnited Kingdom
CENTRAUS. AMERICA
ArgentinaBelizeBoliviaBrazilChileColombiaCosta RicaDominican RepEcuadorEl SalvadorGuatemalaHaitiHondurasJamaicaMexico
1974-75
NoNoNoNoNo
YesYesYesYesYesYesNoNo
YesYesYesYesYesYesNo
Yes-
YesYesYesYesNo
YesYes
-YesNo
-No
Yes
1010101010000000
1010000000
10
0
0000
1000
010
100
Are Individuals
1979-80
NoNoNoNoNo
YesYesYesYesYesYesNoNo
YesYesYesYesYesYesNo
YesNo
YesYesYesYesNoNo
YesYesYesNoNoNo
Yes
1010101010000000
1010000000
10
0100000
1010000
1010100
Conscripted into the Military?
1984-85
NoNoNoNoNo
YesYesYesYesYesYesNoNo
YesYesYesYesYesYesNo
YesNo
YesYesYesYesNoNo
YesYesYesNo
YesNo
Yes
1010101010000000
1010000000
10
0100000
1010000
100
100
1989-90
NoNoNoNoNo
YesYesYesYesYesYesNoNo
YesYesYesYesYesYesNo
YesNo
YesYesYesYesNoNo
YesYesYesNo
YesNo
Yes
1010101010000000
1010000000
10
0100000
1010000
100
100
1993-94
NoNoNoNoNo
YesYesYesYesYesYesNoNo
YesYesYesYesYesYesNo
YesNo
YesYesYesYesNoNo
YesYesYesNo
YesNo
Yes
1010101010000000
1010000000
10
0100000
1010000
100
100
288
www.fraserinstitute.org

Table Ill-C: (continued)
CENTRAU-
S. AMERICA (con't)
NicaraquaPanamaParaguayPeruTrinidad/TobagoUruguayVenezuela
EUROPE/MIDDLE EAST
BulgariaCyprusCzechoslovakia
Czech RepublicSlovakia
EgyptGreeceHungaryIranIsraelJordanMaltaPolandPortugalRomaniaSyriaTurkey
ASIA
BangladeshFijiHong KongIndiaIndonesiaMalaysiaNepalPakistanPhilippinesSingaporeSouth KoreaSri LankaTaiwanThailand
1974-75
YesNo
YesYesNoNo
Yes
Yes-
Yes--
YesYesYesYesYesNo
-YesYesYesYesYes
No-
NoNo
YesNoNo
YesYesYesYesNo
YesYes
01000
10100
0
0
00000
10
00000
10
10100
10100000
1000
Are Individuals
1979-80
YesNo
YesYesNoNo
Yes
YesYesYes
--
YesYesYesYesYesNoNo
YesYesYesYesYes
NoNoNoNo
YesNoNoNo
YesYesYesNo
YesYes
01000
10100
000
00000
101000000
101010100
101010000
1000
Conscripted into the Military?
1984-85
YesNo
YesYesNoNo
Yes
YesYesYes
--
YesYesYesYesYesNoNo
YesYesYesYesYes
NoNoNoNo
YesNoNoNoNo
YesYesNo
YesYes
01000
10100
000
00000
101000000
101010100
1010101000
1000
1989-90
YesNo
YesYesNoNo
Yes
YesYesYes
--
YesYesYesYesYesNoNo
YesYesYesYesYes
NoNoNoNo
YesNoNoNoNo
YesYesNo
YesYes
01000
10100
000
00000
101000000
101010100
1010101000
1000
1993-94
NoNo
YesYesNoNo
Yes
YesYes
-
YesYesYesYesYesYesYesNoNo
YesYesYesYesYes
NoNoNoNo
YesNoNoNoNo
YesYesNo
YesYes
101000
10100
00
0000000
101000000
101010100
1010101000
1000
289www.fraserinstitute.org

Table Ill-C: (continued)
Are Individuals Conscripted into the Military?
1974-75 1979-8 0 1984-8 5 1989-9 0 1993-9 4AFRICA
AlgeriaBeninBotswanaBurundiCameroonC African RepChadCongo Peoples RepCote d' IvoireGabonGhanaKenyaMadagascarMalawiMaliMauritiusMoroccoNigerNigeriaRwandaSenegalSierra LeoneSomaliaSouth AfricaTanzaniaTogoTunisiaUgandaZaireZambiaZimbabwe
No-
NoNoNo
-NoNoNoNoNoNo
-NoNoNo
YesNoNoNo
-NoNo
YesNo
-YesNoNoNo
-
10
1010
10
101010101010
10101001010
10
1010010
01010
10
Yes-
NoNoNo
YesNoNoNoNoNoNo
YesNoNoNo
YesYesNoNo
YesNoNo
YesNo
YesYesNoNoNo
Yes
0
1010100
1010101010100
10101000
10100
10100
1000
1010100
YesYesNoNoNo
YesYesNo
YesNoNoNo
YesNo
YesNo
YesYesNoNo
YesNo
YesYesYesYesYesNoNoNo
Yes
00
10101000
100
1010100
100
1000
10100
1000000
1010100
YesYesNoNoNo
YesYesNo
YesNoNoNo
YesNo
YesNo
YesYesNoNo
YesNo
YesYesYesYesYesNoNoNo
Yes
00
10101000
100
1010100
100
1000
10100
1000000
1010100
YesYesNoNoNo
YesYesNo
YesNoNoNo
YesNo
YesNo
YesYesNoNo
YesNo
YesNo
YesYesYesNoNoNo
Yes
00
10101000
100
1010100
100
1000
10100
100
10000
1010100
Source: Internationa l Institut e for Strategic Studies, The Military Balance, (various issues).
290www.fraserinstitute.org

Table IV-A: The Average Tax Rate on International Trade
INDUSTRIAL
COUNTRIES
Taxes on Trade As A Percent of Exports Plus Imports
(The rating of each country is in parenthesis)1975 198 0 198 5 199 0 1992
United StatesCanadaAustraliaJapanNew ZealandAustriaBelgiumDenmarkFinlandFranceGermanyIcelandIrelandItalyNetherlandsNorwaySpainSwedenSwitzerlandUnited Kingdom
1.503.674.361.252.421.650.010.921.610.050.028.064.820.261.330.516.110.953.500.00
CENTRAL/SOUTH AMERICA
ArgentinaBelizeBoliviaBrazilChileColombiaCosta RicaDominican RepEcuadorEl SalvadorGuatemalaHaitiHondurasJamaicaMexico
12.90-
8.905.655.567.395.91
16.128.886.405.629.305.323.997.87
0)(6)(6)(9)(8)(8)
(10)
(9)(8)
(10)(10)
(2)(6)
(10)
(9)(9)(5)(9)(7)
(10)
(0)
(2)(5)(6)(3)(5)(0)(2)(4)(6)
(D(6)(6)(3)
1.132.383.600.892.510.710.000.050.810.050.016.542.980.040.000.302.690.662.420.04
9.508.707.80
10.002.797.775.309.767.206.244.819.866.700.87
17.56
(9)(8)(7)(9)(8)(9)
(10)(10)
(9)(10)(10)
(4)(7)
(10)(10)
(9)(7)(9)(8)
(10)
(D(2)(3)(D(7)(3)(6)(D(3)(4)(6)
(D(4)(9)(0)
1.731.673.220.822.010.600.000.040.420.030.004.572.530.020.000.252.970.321.950.00
12.7210.867.013.225.697.466.926.456.217.137.478.03
-1.712.57
(8)(8)(7)(9)(8)(9)
(10)(10)
(9)(10)(10)
(6)(8)
(10)(10)(10)(7)(9)(8)
(10)
(0)(D(4)(7)(5)(3)(4)(4)(5)(3)(3)(2)
(8)(7)
1.451.183.070.931.650.650.010.040.590.010.003.962.610.010.000.271.330.391.870.04
12.7610.762.313.663.697.097.038.203.954.133.556.70
--
1.95
(9)(9)(7)(9)(8)(9)
(10)(10)
(9)(10)(10)
(6)(7)
(10)(10)(10)
(9)(9)(8)
(10)
(0)a
(D(8)(6)(6)(3) a(4)(2)(6)(6)(7)(4) a
(8)
1.371.202.260.901.190.670.000.040.570.000.004.162.380.020.00
-0.900.621.930.06
-9.562.823.243.73
-5.03
--
3.793.58
----
(9)(9)b(8)(9)
(9)(9)
(10)(10)
(9)(10)(10)
(6)(8)b
(10)(10)
(9)b
(9)(8)b
(10)
(D(7)(7)b(6)
(6)
(6)(7)b
Nicaragua 4.88 (6 ) 8.7 0 (2 ) 7.3 8 (3 ) 4.3 0 (6 ) 7.97 (2 )
291www.fraserinstitute.org

Table IV-A: (confined)
CENTRAU-
S. AMERICA (cont)
1975
Taxes on Trade As A Percent of Exports Plus Imports
(The rating of each country is in parenthesis)1980 198 5 199 0 199 2
PanamaParaguayPeruTrinidad/TobagoUruguayVenezuela
EUROPE/MIDDLE
BulgariaCyprusCzechoslovakia
Czech RepublicSlovakia
EgyptGreeceHungaryIranIsraelJordanMaltaPolandPortugalRomaniaSyriaTurkey
ASIA
BangladeshFijiHong KongIndiaIndonesiaMalaysiaNepalPakistanPhilippinesSingapore
3.208.819.522.603.413.74
EAST
-3.45
---
16.733.46
-3.597.966.754.59
-4.61
-8.48
14.43
7.906.580.70
14.774.007.048.90
15.3213.380.74
(7)(2)
(D(7)(7)(6)
(7)
(0)(7)
(7)(2)(4)(6)
(6)
(2)(0)
(3)(4)(9)(0)(6)(4)(2)(0)(0)(9)
3.076.04
10.623.178.872.98
-4.00
---
13.083.234.97
16.955.057.064.87
-2.11
-7.126.33
13.415.780.50
15.522.897.718.60
15.296.750.47
(7)(5)(D(7)(2)(7)
(6)
(0)(7)(6)(0)(6)(4)(6)
(8)
(3)(4)
(0)(5)(9)(0)(7)(3)(2)(0)(4)(9)
4.142.228.305.715.829.14
5.404.42
---
12.060.333.74
14.182.856.094.468.591.24
-5.632.96
17.887.870.60
24.191.595.657.71
14.746.200.32
(6)(8)(2)(5)(5)(D
(6)(6)
(D(9)(6)(0)(7)(5)(6)(2)(9)
(6)(7)
(0)(3)(9)(0)(8)(5)(3)(0)(5)
(9)
4.453.263.862.685.612.21
1.304.153.99
--
5.920.054.977.320.924.964.85
-1.020.442.932.81
12.116.430.40
20.732.463.208.80
16.456.640.15
(6)(7)(6)(7) a
(6)(8)
(9)(6)(6)
(5)(10)
(6)(3)(9)(6)(6)
(9)(9)(7)(7)
d)a(4)(9)(0)(8)(7)(2)(0)(4)
(10)
4.143.524.35
-5.033.76
2.224.20
---
6.420.07
-8.671.059.234.76
-0.472.273.632.26
-5.910.30
16.981.862.81
--
8.160.17
(6)(7)(6)
(6)(6)
(8)(6) b
(4)(10)
(2)(9)(D(6)
(9)b
(8)(7)(8)
(5)(9)(0)(8)(7)
(2)(10)
South KoreaSri LankaTaiwanThailand
3.07 (7 )11.13 (1 )4.83 (6 )7.00 (4 )
4.14 (6 )11.72 (1 )3.60 (7 )6.88 (4 )
3.5510.592.806.48
(7)d)(7)(4)
3.428.812.145.40
(7)(2)(8)(6)
2.216.991.973.86
(8)(4)(8)(6)
292www.fraserinstitute.org

Table IV-A: (continued)
Taxes on Trade As A Percent of Exports Plus Imports
(The rating of each country is in parenthesis)1975 1980 1985 1990 1992
AFRICA
AlgeriaBeninBotswanaBurundiCameroonC African RepChadCongo Peoples ReCote d1 IvoireGabonGhanaKenyaMadagascarMalawiMaliMauritiusMoroccoNigerNigeriaRwandaSenegalSierra LeoneSomaliaSouth AfricaTanzaniaTogoTunisiaUgandaZaireZambiaZimbabwe
a Dat a are forb Dat a are for
-9.17
10.3912.1813.44
-9.165.43
-8.20
20.585.47
13.803.75
14.097.067.516.706.64
16.498.66
10.4414.012.027.337.20
10.7020.4019.022.612.10
1989.1991.
(D(D(D(0)
(D(6)
(2)(0)(6)(0)(6)(0)(4)(3)(4)(4)(0)(2)(D(0)(8)(3)(3)(D(0)(0)(7)(8)
-10.6012.8018.0811.0010.60
-3.80
12.787.25
17.276.068.506.583.819.55
10.688.408.50
13.3011.4013.3310.50
1.217.72
12.438.993.07
10.282.391.67
d)(0)(0)
0)d)
(6)(0)(3)(0)(5)(2)(4)(6)(1)d)(2)(2)(0)d)(0)
d)O)(3)(0)d)(7)d)(8)(8)
--
7.1217.016.07
---
11.796.43
21.677.38
-8.804.979.646.39
-5.09
-8.30
11.90-
1.416.258.63
13.3011.608.396.408.03
(3)(0)(5)
(D(4)(0)(3)
(2)(6)(D(4)
(6)
(2)(D
0)(4)(2)(0)
(D(2)(4)(2)
--
6.6122.90
5.3911.503.87
-10.924.78
11.596.26
14.005.654.607.618.59
-4.00
14.15-
5.97-
2.22-
9.209.49
-9.104.209.19
(4)(0)a
(6)(1)a
(6)
(D(6)
(1)(4)(0)(5)(6) a
(3)(2)
(6) a
(0)
(5)
(8)
(1)a
(D
(D(6) a
(D
--
9.59-
7.71-
2.17--
6.328.603.708.69
--
7.50---
14.63-
8.27----
9.91---
-
(1) b
(3)
(8)b
(4)b
(2)(6)(2)b
(3)
(0)
(2)
(Db
Source: Th e data on tax revenue are from the International Monetary Fund , GovernmentFinance Statistics Yearbook, (variou s issues), Table A, line 6 entitled, "Taxes onInternational Trad e Transactions. " Th e dat a o n th e volum e o f export s an dimports are from the World Bank, World Tables, 1994. Th e following conversiontable divided the 1985 base year data into eleven interval s of equal size:
293
www.fraserinstitute.org

Table IV-A: (con't)
Average Tax Rate
0.000% - 0.285%0.285-1.5001.500-2.5502.550 - 3.6453.645 - 5.6405.640 - 6.2306.230 - 7.0657.065 - 7.9507.950 - 8.970
8.970 - 12.390> 12.390
Rating
109876543210
294www.fraserinstitute.org

Table IV-B: The Black Market Exchange Rate Premium
(The premium one must pay to exchange the domestic currency for dollars in theblack market relative to the official exchange rate. Th e data are year-end exceptfor the 1995 figures.)
INDUSTRIAL
COUNTRIES
United StatesCanadaAustraliaJapanNew ZealandAustriaBelgiumDenmarkFinlandFranceGermanyIcelandIrelandItalyNetherlandsNorwaySpainSwedenSwitzerlandUnited Kingdom
CENTRAL/SOUTHArgentinaBelizeBoliviaBrazilChileColombiaCosta RicaDominican RepEcuadorEl SalvadorGuatemalaHaitiHondurasJamaicaMexico
•
00105001100
10609012100
1975
(10)(10)
(8)(10)
(6)(10)(10)
(8)(8)
(10)(10)
(D(10)(5)
(10)(8)(7)(8)
(10)(10)
AMERICA
12432
549
529
828
5201000
220
(D(3)(6)(2)(6)(3)(5)(3)(6)(4)(4)
(10)(10)
(4)(10)
00100002130900030500
13422186
16693713
1001020206192
Black Market Exchange Rate Premium
(The1980
(10)(10)
(8)(10)(10)(10)(10)(7)
(8)(6)
(10)(5)
(10)(10)(10)(6)
(10)
(6)(10)(10)
(8)(3)(4)(4)(6)(4)(1)(2)(4)(D(4)(4)(4)(2)(D
rating of eacl
00004000040
1630002100
4063
94922
9241448
1958960651925
1985
(10)(10)(10)(10)
(6)(10)(10)(10)(10)
(6)(10)
(4)(6)
(10)(10)(10)
(7)(8)
(10)(10)
(2)(D(5)(2)(4)(5)(3)(4)(2)(D(1)(2)
(D(4)(3)
i countr y is in1988
0 (10 )0 (10 )0 (10 )0 (10 )0 (10 )0 (10 )0 (10 )0 (10 )0 (10 )2 (7 )0 (10 )5 (6 )2 (7 )1 (8 )0 (10 )
1 (8 )2 (7 )0 (10 )0 (10 )0 (10 )
50 (2 )25 (3 )
6 (6 )57 (2 )29 (3 )15 (4 )23 (3 )12 (4 )25 (3 )
195 (1 )28 (3 )
151 (1 )85 (1 )22 (4 )15 (4 )
parenthesis)•
00005000000310002100
025
0100
170
660
24020
27
0
1990
(10)(10)(10)(10)
(6)(10)(10)(10)(10)(10)(10)
(6)(8)
(10)(10)(10)
(7)
(8)(10)(10)
(10)(3)
(10)(4)
(10)
(4)(10)(D
(10)(3)
(10)
(7)(10)(3)
(10)
00000000000300010000
0140959435
134
785
122
1992
(10)(10)(10)(10)(10)(10)(10)(10)(10)(10)(10)
(6)(10)(10)(10)
(8)(10)(10)(10)(10)
(10)(4)
(10)(5)(6)(5)(6)(6)(6)(4)(6)(D(6)(4)(7)
1995(March)
0 (10 )0 (10 )0 (10 )0 (10 )0 (10 )0 (10 )0 (10 )0 (10 )0 (10 )0 (10 )0 (10 )
1 (8 )0 (10 )0 (10 )0 (10 )0 (10 )0 (10 )0 (10 )0 (10 )0 (10 )
0 (10 )6 (6 )1 (8 )5 (6 )4 (6 )1 (8 )1 (8 )2 (7 )
1 (8 )18 (4 )4 (6 )
224 (0 )3 (6 )
1 (8 )0 (10 )
Nicaragua 21 (4) 91 (1) 382 (0) 416 (0) 10 (4) 27 (3) 4 (6 )
295
www.fraserinstitute.org

Table IV-B: (Continued)
CENTRAL/-
S. AMERICA (con't)
1975
Black Market Exchange Rate Premium
(The rating of each country is in parenthesis)1980 1985 1988 1990 1992 1995
(March)PanamaParaguayPeruTrinidad/TobagoUraguayVenezuela
EUROPE/MIDDLEBulgariaCyprusCzechoslovkia
Czech RepublicSlovakia
EgyptGreeceHungaryIranIsraelJordanMaltaPolandPortugalRomaniaSyriaTurkey
ASIABangladeshFijiHong KongIndiaIndonesiaMalaysiaNepalPakistanPhilippinesSingapore
0135643
00
EAST175
6359
--13
3172
6015
378642
5961
11
51170970
4017130
(10)(4)(2)(2)
(10)(10)
d)(6)(0)
(8)(6)(0)(7)(2)(8)(6)(0)(2)(0)(8)(4)
(2)(4)
(10)(5)(5)
(10)(2)(4)(4)
(10)
07
1849
00
1754
387--97
244164
10
12298
2628
3516
1111805200
2730
(10)(5)(4)(2)
(10)(10)
(D(6)(0)
(5)(5)(0)(D(8)
(10)(4)(0)(7)(0)(2)(4)
(D(4)
(10)(6)(7)
(10)(10)(3)(6)
(10)
0213
5139
025
4351
423-
14625
210533
737
3012
1246251
3
16880
1470
11470
(10)(0)(2)(2)
(10)(3)
(0)(8)(0)
(D(3)(0)(0)(5)(6)(5)(0)(7)(0)(0)(6)
(D(5)
(10)(4)(5)
(10)(4)(6)(5)
(10)
0127240
5700
6913
763--
2488
561030
18103
53713
561354
8
318130
14160
611030
(10)(D(0)(2)
(10)(10)
(0)(6)(0)
(0)(5)(2)(0)(4)(4)(6)(0)(4)(0)(0)(5)
(0)(4)
(10)(4)(4)
(10)(2)(4)(6)
(10)
0261640
00
1005
61--
563
222197
411293
416301
2
16540
1000
161470
(10)(3)(4)(2)
(10)(10)
(1)(6)(2)
(2)(6)(4)(0)(6)(4)(7)(5)(6)(0)(0)(7)
(D(6)
(10)(4)
(10)(10)
(4)(4)(5)
(10)
0141215
„
5
-8
31--117
3034071
470
41273
3
11310
23160
501320
(10)(4)(4)(4)
(6)
(5)(3)
(8)(8)(5)(0)
(10)(5)(8)(2)
(10)(2)(0)(6)
(D(8)
(10)(3)(4)
(10)(2)(4)(7)
(10)
012
1011
5-~09109
15611400
25283
1
3010020
25010
(10)(4)(8)
(10)(8)(8)
(6)
(10)(5)(8)
(10)(5)d)(8)(8)(6)
(10)(10)
(3)(0)(8)
(3)(8)
(10)(10)(7)
(10)(3)
(10)(8)
(10)South KoreaSri LankaTaiwanThailand
2 (7 )92 (1 )
5 (6 )2 (7 )
11 (4)9 (5)1 (8)5 (6)
11 (4)20 (4)
3 (6)3 (6)
10 (4)36 (2)
1 (8)1 (8)
1 (8)24 (3)
0 (10)0 (10)
4 (6)13 (4)0 (10)0 (10)
0 (10)0 (10)0 (10)0 (10)
296
www.fraserinstitute.org

Table IV-B: (Continued)
1975 1980
Black Market Exchange Rate Premium(The rating of each country is in parenthesis)
1985 198 8 199 0 199 2AFRICA
1995(March)
AlgeriaBeninBotswanaBurundiCameroonC African RepChadCongo Peoples RepCote d1 IvoireGabonGhanaKenyaMadagascarMalawiMaliMauritiusMoroccoNigerNigeriaRwandaSenegalSierra LeoneSomaliaSouth AfricaTanzaniaTogoTunisiaUgandaZaireZambiaZimbabwe
562
4446
222222
678
23287
4732
4345
253286
2032
1139012014054
(2)(7)(2)(2)(7)(7)(7)(7)(7)(7)
(D(5)(3)(3)(5)(2)(6)(7)(2)(2)(7)(2)(3)(6)(D(7)(4)(0)(D(D(2)
2632
1045
222222
304105148
540
12
7267
26241
6224
218
3601317084
(0)(7)(4)(2)(7)(7)(7)(7)(7)(7)(0)(4)(2)(2)(6)(2)(8)(7)(D(D(7)(D(2)(6)(0)(7)(4)(0)(D(D(D
3351
2225
111111
1422g
301171
27049
120614725
2591
12256
3842
(0)(8)(4)(3)(8)(8)(8)(8)(8)(8)
(D(7)(5)(3)(8)(8)(5)(8)(0)(2)(8)
(D(D(3)(0)(8)(4)(3)(6)(2)(2)
4162
5325
222222
361316272342
87302
140648
5100
212
26115
90047
(0)
(7)
(2)
(3)
(7)
(7)
(7)
(7)(7)(7)(2)(4)(4)(3)(7)(6)(6)(7)(D(3)(7)(0)(2)(6)(D(7)(4)(0)(4)(0)(2)
140476444444767
1448
134
2328
4165200
37848
4020
21215
(D(6)(5)(6)(6)(6)(6)(6)(6)(6)(5)(6)(5)(4)(6)(5)(4)(6)(3)(3)(6)
d)d)(6)(1)(6)(5)(2)(4)(0)(4)
3391
1654
111111
11107
734
1511
4399
11-1
1914
17202
130
(0)(8)(4)(2)(8)(8)(8)(8)(8)(8)(4)(D(5)(3)(8)(6)(8)(8)(2)(D(8)(8)
(8)(4)(8)(6)(4)(D(8)(3)
20511
4211111126
3021
1541
277105
11-0615
12911
(1)(8)(8)(2)(8)(8)(8)(8)(8)(8)(7)(6)(3)(4)(8)(6)(6)(8)(0)(D(8)(8)
(10)
(6)(8)(6)(4)(5)(8)(8)
Source: Internationa l Currency Analysis, Inc., World Currency Yearbook (various issues ofthe yearboo k an d th e monthl y repor t supplement ) an d Inter-nationa l Monetar yFund, International Financial Statistics (various monthly issues) . Th e 198 5 bas eyear data were used to derive the rating intervals . Th e following conversion tabl edivided the 198 5 data into eleven intervals of equal size:
297
www.fraserinstitute.org

Table IV-B: (con't)
Black Market Exchange RatePremium (percent)
012
3 - 67 - 9
10-2223-3435-6162 - 208
210 or more
Rating
10876543210
298
www.fraserinstitute.org

Table IV-C: The Actual Size of the Trade Sector (Exports plus Imports divided byGDP) Compared to the Expected Size: 1975,1980,1990, and 1993
INDUSTRIAL
COUNTRIES
United StatesCanadaAustraliaJapanNew ZealandAustriaBelgiumDenmarkFinlandFranceGermanyIcelandIrelandItalyNetherlandsNorwaySpainSwedenSwitzerlandUnited Kingdom
CENTRAL/SOUTH
ArgentinaBelizeBoliviaBrazilChileColombiaCosta RicaDominican RepublicEcuadorEl SalvadorGuatemalaHaitiHondurasJamaicaMexico
Actual
Trade
16.447.228.825.655.963.1
107.061.154.036.946.578.987.341.192.290.330.955.960.053.6
AMERICA
11.8-
58.219.052.929.868.657.758.971.545.337.570.480.914.7
1975
Expected
Trade
21.831.528.829.052.452.767.472.058.136.937.987.573.339.162.859.939.651.758.541.1
34.5-
42.524.547.238.581.771.055.780.563.375.870.196.331.6
Actual-Expected
Expected
-24.8%
49.8%0.0%
-11.8%6.7%
19.7%58.8%
-15.1%-7.1%
0.0%
22.7%-9.8%
19.1%5.1%
46.8%
50.8%-21.9%
2.6%
2.6%
30.4%
-65.8%
36.9%-22.4%12.1%
-22.6%-16.0%-18.7%
5.7%
-11.2%-28.4%
-50.5%0.4%
-16.0%-53.5%
(2)
(9)
(4)
(3)
(5)
(6)
0)(3)
(4)
(4)
(6)
(3)
(6)
(5)
(9)
(9)
(2)
(5)
(5)
(7)
(0)
(8)
(2)
(5)
(2)
(3)
(2)
(5)
(3)
(2)
(0)
(5)
(3)
(0)
Actual
Trade
21.155.133.928.361.875.6
128.366.567.244.353.372.6
107.546.5
100.988.533.860.877.052.3
11.6124.037.720.449.831.863.348.150.667.447.152.180.3
105.323.7
1980
Expected
Trade
24.435.232.232.558.959.475.981.065.341.442.797.981.844.070.467.244.358.266.046.3
38.4149.947.027.152.542.7
90.078.561.489.369.984.376.8
107.734.9
Actual-Expected
Expected
-13.5% (3 )56.5% (9 )
5.3% (5 )-13.0% (3 )
4.9% (5 )27.3% (7 )69.0% (10 )
-17.9% (3 )2.9% (5 )7.0% (5 )
24.8% (6 )-25.8% (2 )31.4% (7 )
5.7% (5 )43.3% (8 )31.7% (7 )
-23.7% (2 )4.5% (5 )
16.7% (6 )13.0% (5 )
-69.7% (0 )-17.3% (3 )-19.8% (2 )-24.7% (2 )
-5.1% (4 )-25.5% (2 )-29.7% (2 )-38.7% (1 )-17.6% (3 )-24.5% (2 )-32.6% (1 )-38.2% (1 )
4.6% (5 )-2.2% (4 )
-32.1% (1 )Nicaragua 65.7 71.5 -8.1% (4) 67.5 78.7 -14.2% (3)
299
www.fraserinstitute.org

Table IV-C: (Continued)
CENTRAL/-
S. AMERICA (cont)
PanamaParaguayPeruTrinidad & TobagoUruguayVenezuela
EUROPE/MIDDLE EAST
BulgariaCyprusCzechoslovakia
Czech RepublicSlovakia
EgyptGreeceHungaryIranIsraelJordanMaltaPolandPortugalRomaniaSyriaTurkey
ASIA
Bangladesh
FijiHong KongIndiaIndonesiaMalaysiaNepalPakistanPhilippinesSingaporeSouth KoreaSri LankaTaiwanThailand
Actual
Trade
102.031.932.888.237.150.7
-92.2
---
61.543.790.475.077.4
128.8179.1
-53.2
-55.419.3
11.086.6
162.512.844.286.822.333.148.1
289.164.462.582.541.4
1975
Expected
Trade
79.652.040.8
116.767.543.5
-118.3
---
36.658.349.535.282.677.9
178.5-
60.0-
57.937.1
41.591.1
111.120.828.050.345.933.934.5
124.948.857.476.238.6
Actual-Expected
Expected
28.1%-38.7%-19.6%-24.4%-45.0%16.6%
--22.1%
---
68.0%-25.0%82.6%
113.1%-6.3%65.3%
0.3%-
-11.3%
-4.3%-48.0%
-73.5%-4.9%46.3%
-38.3%57.9%72.6%
-51.4%-2.4%39.4%
131.5%32.0%8.9%8.3%7.3%
(7)(D(2)(2)(D(6)
(2)
(10)
(2)(10)(10)(4)
(10)
(5)
(3)
(4)(D
(0)(4)(9)d)(9)
(10)(0)(4)(8)
(10)(8)(5)(5)(5)
Actual
Trade
91.644.041.689.435.750.7
66.4108.3
---
73.447.180.329.790.4
146.6187.459.269.475.353.720.6
24.1100.0180.7
16.653.3
112.630.336.652.0
423.375.587.0
106.354.5
1980
Expected
Trade
881.057.246.0
130.175.747.8
82.9132.7
---
40.565.055.638.691.485.3
197.947.067.566.363.641.1
45.9101.2122.523.631.055.750.737.338.2
138.354.363.884.642.7
Actual-Expected
Expected
-89.6% (5 )-23.1% (2 )
-9.6% (4 )-31.3% (1 )-52.8% (0 )
6.1% (5 )
-19.9% (2 )-18.4% (3 )
---
81.2% (10 )-27.5% (2 )44.4% (8 )
-23.1% (2 )-1.1% (4 )71.9% (10 )-5.3% (4 )26.0% (7 )2.8% (5 )
13.6% (5 )-15.6% (3 )-49.9% (0 )
-47.5% (1 )-1.2% (4 )
47.5% (9 )-29.7% (2 )71.9% (10 )
102.2% (10 )-40.2% (1 )
-1.9% (4 )36.1% (8 )
206.1% (10 )39.0% (8 )36.4% (8 )25.6% (7 )27.6% (7 )
300www.fraserinstitute.org

Table IV-C: (Continued)
AFRICA
AlgeriaBeninBotswanaBurundiCameroonCentral African RepChadCongo Peoples RepCote d'lvoireGabonGhanaKenyaMadagascarMalawiMaliMauritiusMoroccoNigerNigeriaRwandaSenegalSierra LeoneSomaliaSouth AfricaTanzaniaTogoTunisiaUgandaZaireZambiaZimbabwe
Actual
Trade
76.559.9
109.127.348.265.357.299.673.397.437.864.336.875.041.3
112.355.950.341.226.978.461.139.358.652.197.166.718.525.192.960.2
1975
Expected
Trade
37.870.160.866.452.051.843.169.655.381.153.946.541.964.140.8
108.544.840.934.165.161.574.053.837.842.178.961.244.335.744.446.1
Actual-Expected
Expected
102.4%-14.6%79.4%
-58.9%-7.3%26.1%32.7%43.1%32.5%20.1%
-29.9%38.3%
-12.2%17.0%1.2%3.5%
24.8%23.0%20.8%
-58.7%27.5%
-17.4%-27.0%55.0%23.8%23.1%
9.0%-58.2%-29.7%109.2%30.6%
(10)
(3)(10)
(0)(4)(7)(8)(8)(8)(6)
(D(8)(3)(6)(5)(5)(6)(6)(6)(0)(7)(3)(2)(9)(6)(6)(5)(0)(1)
(10)
(7)
Actual
Trade
64.766.3
116.432.151.368.965.1
120.176.296.417.667.043.163.751.1
112.645.365.948.040.872.365.7
121.764.739.5
107.485.844.732.086.863.6
1980
Expected
Trade
41.677.466.773.557.452.247.876.660.588.359.950.946.270.545.2
120.649.645.037.571.667.882.159.341.746.287.167.648.939.448.950.8
Actual-Expected
Expected
55.5% (9 )-14.3% (3 )74.5% (10 )
-56.3% (0 )-10.6% (3 )32.0% (6 )36.2% (8 )56.8% (9 )26.0% (7 )
9.2% (5 )-70.6% (0 )31.6% (7 )-6.7% (4 )-9.6% (3 )13.1% (5 )-6.6% (4 )-8.7% (4 )46.4% (8 )28.0% (7 )
-43.1% (1 )6.6% (5 )
-20.0% (2 )105.2% (10 )55.2% (9 )
-14.5% (3 )23.3% (6 )26.9% (7 )-8.6% (4 )
-18.8% (3 )77.5% (10 )25.2% (7 )
301www.fraserinstitute.org

Table IV-C: (Continued)
INDUSTRIALCOUNTRIES
United StatesCanadaAustraliaJapanNew ZealandAustriaBelgiumDenmarkFinlandFranceGermanyIcelandIrelandItalyNetherlandsNorwaySpainSwedenSwitzerlandUnited Kingdom
ActualTrade
17.754.435.225.564.481.2
151.273.058.147.161.581.8
113.446.0
116.886.043.569.077.656.6
CENTRAL/SOUTH AMERICA
ArgentinaBelizeBoliviaBrazilChileColombiaCosta RicaDominican RepublicEcuadorEl SalvadorGuatemalaHaitiHondurasJamaicaMexicoNicaraguaPanamaParaguayPeruTrinidad & TobagoUruguayVenezuela
18.0109.730.219.353.826.363.264.247.652.225.038.454.1
132.525.736.571.049.539.461.086.040.7
1985
ExpectedTrade
22.232.129.229.753.754.569.774.459.838.039.389.274.740.364.561.640.553.460.442.5
35.0135.142.324.547.638.680.971.055.281.562.876.468.798.031.570.879.651.240.6
118.469.243.0
Actual-ExpectedExpected
-20.3%69.5%20.5%-14.3%19.9%49.0%
116.9%-1.9%-2.8%
23.9%56.5%-8.3%
51.8%14.1%81.1%39.6%7.4%
28.5%28.5%33.2%
-48.6%-18.8%-28.6%-21.2%13.0%
-31.9%-21.9%
-9.6%
-13.8%-36.0%-60.2%-49.7%-21.3%35.2%
-18.4%-48.4%-10.8%
-3.3%
-3.0%-48.5%24.3%-5.3%
(2)(10)
(6)(3)(6)
(9)(10)
(4)(4)
(6)(9)
(4)(9)
(6)(10)
(8)(5)(7)(7)
(8)
(D(2)(2)(2)(5)
(D(2)
(3)
(3)
(D(0)(0)
(2)(8)(2)
(D(3)(4)(4)(D(1)(4)
ActualTrade
21.451.234.321.054.079.1
145.065.547.646.158.069.4
113.541.4
103.781.137.559.472.751.4
15:3127.346.812.665.435.375.459.260.143.043.434.475.2
111.032.768.573.175.526.873.846.259.6
1990Expected
Trade
23.734.331.131.857.658.575.080.064.240.642.195.180.543.469.066.143.557.264.645.6
37.1142.544.726.050.641.085.275.158.386.566.181.072.1
104.733.474.784.36.0
43.0126.174.145.4
Actual-ExpectedExpected
-9.7%49.3%10.3%
-34.0%-6.2%35.2%93.3%
-18.1%-25.9%13.5%37.8%
-27.0%41.0%-4.6%50.3%22.7%
-13.8%3.8%
12.5%12.7%
-58.8%-10.7%
4.7%-51.5%29.2%
-13.9%-11.5%-21.2%
3.1%-50.3%-34.3%-57.5%
4.3%6.0%
-2.1%-8.3%
-13.3%1158.3%
-37.7%-41.5%-37.7%31.3%
(3)(9)(5)(1)(4)(8)
(10)(3)(2)(5)(8)(2)(8)(4)(9)(6)(3)(5)(5)(5)
(0)(3)(5)(0)(7)(3)(3)(2)(5)(0)(D(0)(5)
(5)(4)
(4)(3)
(8)
(1)(1)(D(7)
ActualTrade
21.854.037.418.059.477.8
135.666.452.545.059.964.3
116.139.8
100.079.038.054.068.449.0
14.8128.140.416.560.035.382.064.559.242.845.0
-65.3
153.030.765.275.661.722.469.842.754.3
1993Expected
Trade
24.134.831.632.558.659.676.481.765.441.443.096.882.144.270.367.444.458.365.746.6
37.8144.445.326.451.441.686.376.359.187.867.0
-73.0
106.734.075.785.654.643.7
128.375.646.0
Actual-ExpectedExpected
-9.5%55.2%18.4%
-44.6%1.4%
30.5%77.5%
-18.7%-19.7%
8.7%39.3%
-33.6%41.4%
-10.0%42.2%17.2%
-14.4%-7.4%4.1%5.2%
-60.8%-11.3%-10.8%-37.5%16.7%
-15.1%-5.0%
-15.5%0.2%
-51.3%-32.8%
-10.5%43.4%
-9.7%-13.9%-11.7%13.0%
-48.7%-45.6%-43.5%18.0%
(3)(9)(6)(1)(5)C7)
(10)
(2)(2)(5)
(8)
(1)(8)
(3)
(8)(6)(3)(4)(5)
(5)
(0)(3)(3)
(1)(6)(3)
(4)(3)
(4)(0)
(1)
(3)
(8)(3)
(3)
(3)(5)
(1)(1)(1)(6)
302
www.fraserinstitute.org

Table IV-C: (con't)
EUROPE/-MIDDLE EAST
BulgariaCyprusCzechoslovakia
Czech RepublicSlovakia
EgyptGreeceHungaryIranIsraelJordanMaltaPolandPortugalRomaniaSyriaTurkey
ASIABangladeshFijiHong KongIndiaIndonesiaMalaysiaNepalPakistanPhilippinesSingaporeSouth KoreaSri LankaTaiwanThailand
AFRICAAlgeriaBeninBotswanaBurundiCameroonCentral African RepChadCongoCote d'lvoireGabon
ActualTrade
86.0107.569.7
--
52.053.982.316.085.8
113.5160.835.078.741.637.244.4
25.789.1
209.515.042.6
104.631.034.045.8
318.067.863.096.649.1
43.876.8
115.030.857.665.161.4
112.778.1
100.0
1985Expected
Trade
76.1121.057.3
--
36.559.551.234.683.076.1
183.542.961.660.757.037.0
41.491.6
111.220.828.050.145.633.434.4
125.549.458.076.838.6
37.369.459.666.151.751.543.168.953.978.4
Actual-ExpectedExpected
13.0%-11.2%21.6%
--
42.5%-9.4%60.7%
-53.8%3.4%
49.1%-12.4%-18.4%27.8%
-31.5%-34.7%20.0%
-37.9%-2.7%88.4%
-27.9%52.1%
108.8%-32.0%
1.8%33.1%
153.4%37.2%8.6%
25.8%27.2%
17.4%10.7%93.0%
-53.4%11.4%26.4%42.5%63.6%44.9%27.6%
(5)(3)(7)
(8)(4)
(9)(0)(5)(9)(3)(3)(7)(D(1)(6)
(1)(4)
(10)(2)(9)
(10)(1)(5)(8)
(10)(8)(5)(7)(7)
(6)(5)
(10)(0)(5)(7)(8)
(10)(8)(7)
ActualTrade
69.8101.768.8
--
65.054.259.635.269.0
144.4184.145.881.842.855.142.0
26.9129.6262.918.752.6
151.233.735.061.3
372.760.067.390.575.5
50.152.3
118.135.341.549.060.086.564.083.5
1990
ExpectedTrade
82.3129.061.5
--
38.563.855.136.178.979.2
196.046.066.665.159.839.2
43.897.6
118.822.029.753.548.135.136.4
133.352.761.781.941.0
39.373.062.469.554.354.345.572.356.482.7
Actual-ExpectedExpected
-15.2%-21.2%11.9%
--
68.8%-15.0%
8.2%-2.5%
-12.5%82.3%-6.1%-0.4%22.8%
-34.3%-7.9%7.1%
-38.6%32.8%
121.3%-15.0%77.1%
182.6%-29.9%-0.3%68.4%
179.6%13.9%9.1%
10.5%84.1%
27.5%-28.4%89.3%
-49.2%-23.6%-9.8%31.9%19.6%13.5%1.0%
(4)(2)(6)
(10)(3)(5)(4)
(2)(10)(4)(4)
(6)(1)(4)(5)
(1)(8)
(10)(3)
(10)(10)0)(4)
(10)(10)(6)(5)(5)
(10)
(7)(2)
(10)(0)(2)(3)(8)(6)(5)(5)
ActualTrade
97.1108.2
-110.5139.765.156.174.231.164.4
135.2191.543.567.558.064.044.4
26.6109.8285.821.255.8
154.248.741.662.3
340.858.771.686.577.1
52.856.4
106.039.240.633.656.487.461.577.8
1993Expected
Trade
84.3131.3
-62.580.039.165.056.536.588.578.6
199.047.068.166.760.539.8
44.499.6
121.022.430.253.748.835.637.0
135.353.762.883.441.7
39.873.863.270.455.055.046.173.156.983.7
Actual-ExpectedExpected
15.2%-17.6%
-76.8%74.6%66.5%
-13.7%31.3%
-14.9%-27.2%72.0%-3.8%-7.4%-0.9%
-13.0%5.8%
11.6%
-40.1%10.2%
136.2%-5.4%84.8%
187.2%-0.2%16.9%68.4%
151.9%9.3%
14.0%3.7%
84.9%
32.7%-23.6%67.7%-44.3%-26.2%-38.9%22.3%19.6%8.1%
-7.0%
(6)(3)
(10)(10)(10)(3)(7)(3)(2)
(10)(4)(4)(4)(3)(5)(5)
(1)(5)
(10)(4)
(10)(10)(4)(6)
(10)(10)(5)(6)(5)
(10)
(8)(2)
(10)(1)(2)(D(6)(6)(5)(4)
303www.fraserinstitute.org

Table IV-C: (Continued)
AFRICA (cont)GhanaKenyaMadagascarMalawiMaliMauritiusMoroccoNigerNigeriaRwandaSenegalSierra LeoneSomaliaSouth AfricaTanzaniaTogoTunisiaUgandaZaireZambiaZimbabwe
ActualTrade
21.251.630.554.062.2
109.058.451.128.530.670.619.525.655.421.0
105.571.321.653.176.956.4
1985Expected
Trade
53.745.441.663.340.8
110.044.740.233.764.361.074.153.237.541.478.261.044.735.343.745.4
Actual-ExpectedExpected
-60.5%13.7%
-26.7%
-14.7%52.5%-0.9%30.6%
27.1%-15.4%-52.4%15.7%
-73.7%-51.9%47.7%
-49.3%34.9%16.9%
-51.7%
50.4%76.0%24.2%
(0)(5)(2)(3)(9)(4)(7)(7)(3)(0)(6)(0)(0)(9)(0)(8)(6)(0)(9)
(10)(6)
ActualTrade
39.457.544.057.850.6
142.154.538.064.622.255.644.847.547.276.078.489.324.518.674.159.0
1990Expected
Trade
56.347.143.666.343.0
117.347.142.335.467.664.178.256.039.643.681.864.546.536.646.047.7
Actual-ExpectedExpected
-30.0%22.1%0.9%
-12.8%17.7%21.1%15.7%
-10.2%82.5%
-67.2%
-13.3%-42.7%-15.2%19.2%74.3%-4.2%38.4%
-47.3%-49.2%61.1%23.7%
(D(6)(5)(3)(6)(6)(6)(3)
(10)(0)(3)(D(3)(6)
(10)(4)(8)(1)(0)(9)(6)
ActualTrade
42.854.041.163.046.8
128.352.032.073.729.450.750.4
-43.885.867.781.125.2
-66.774.8
1993Expected
Trade
57.048.344.267.143.5
119.447.842.836.068.565.079.3
-40.247.082.765.547.1
-46.548.3
Actual-ExpectedExpected
-24.9%11.8%-7.0%-6.1%7.6%7.5%8.8%
-25.2%104.7%-57.1%-22.0%-36.4%
9.0%82.6%
-18.1%23.8%
-46.5%
43.4%54.9%
(2)(5)(4)(4)(5)(5)(5)(2)
(10)(0)(2)d)
(5)(10)(3)(6)(1)
(8)(9)
Source: The data for exports, imports , and GDP used to derive the actual size of the internationa ltrade sector are from the World Bank, World Tables, 1994 (or International Monetary Fund,Monetary International Financial Statistics. Th e expecte d siz e o f th e trad e secto r wa sderived b y method s explaine d i n th e text . Th e ratin g o f eac h countr y i s indicate d i nparenthesis. Th e 198 5 bas e yea r dat a wer e use d t o deriv e th e ratin g intervals . Th efollowing conversion table divided the 198 5 data into eleven interval s of equal size.
Actual Relative to Expecte d(Percent Difference )
>61.2%46.1 to 61.231.9 to 46.025.0 to 31.813.9 to 24.9-0.3 to 13. 8-0.4 to -9.4-9.5 to -18.4
-18.5 to-29.7-29.8 to -49.0
<-49.0
Rating
109876543210
304www.fraserinstitute.org

Table IV-D: Freedom to Engage in Capital (Investment) Transactionswith Foreigners
INDUSTRIAL
COUNTRIES
United StatesCanadaAustraliaJapanNew ZealandAustriaBelgiumDenmarkFinlandFranceGermanyIcelandIrelandItalyNetherlandsNorwaySpainSwedenSwitzerlandUnited Kingdom
Freedom to Engage in Capital Transactions with
(Countries with Fewer Restrictions on this Freedom1975
1082252
105228255522222
CENTRAL/SOUTH AMERICA
ArgentinaBelizeBoliviaBrazilChileColombiaCosta RicaDominican RepEcuadorEl SalvadorGuatemalaHaitiHondurasJamaicaMexico
0-2020222250022
1980
1082252
1052282558252
1010
082020222250022
1985
1085552
10522
102558555
1010
082020522250022
are Rated1990
10888
105
10525
10255888
101010
082020522250025
Foreigners
Higher).
1993-94
10888
108
101088
105
108
10108
101010
10850
55525882585
305
www.fraserinstitute.org

Table IV-D: (Confined)Freedom to Engage in Capital Transactions with Foreigners
(Countries with Fewer Restrictions on this Freedom are Rated Higher).CENTRAL/- 197 5 198 0 198 5 199 0 1993-9 4S. AMERICA (con't)
NicaraguaPanamaParaguayPeruTrinidad/TobagoUraguayVenezuela
EUROPE/MIDDLE EAST
BulgariaCyprusCzechoslovakia
Czech RepSlovakia
EgyptGreeceHungaryIranIsraelJordanMaltaPolandPortugalRomaniaSyriaTurkey
ASIA
BangladeshFijiHong KongIndiaIndonesiaMalaysiaNepalPakistanPhilippinesSingaporeSouth KoreaSri LankaTaiwanThailand
51052088
000--020522202000
05
1022502280022
010520
108
000--020022202000
05
1022502280022
010520
105
000--020022202000
05
10225022
102022
010520
105
000--020022205000
02
10225022
105052
010588
105
50-50050022225500
02
10225022
105055
306
www.fraserinstitute.org

Table IV-D: (Con't )
Freedom to Engage in Capital Transactions with Foreigners
(Countries with Fewer Restrictions on this Freedom are Rated Higher).1975 198 0 198 5 199 0 1993-9 4
AFRICA
AlgeriaBeninBotswanaBurundiCameroonC African RepChadCongo Peoples RepCote d' IvoireGabonGhanaKenyaMadagascarMalawiMaliMauritiusMoroccoNigerNigeriaRwandaSenegalSierra LeoneSomaliaSouth AfricaTanzaniaTogoTunisiaUgandaZaireZambiaZimbabwe
00—
000000000022220000002000022-
0050000000000222200000020000222
0050000000000222500000020000222
0050000000000222500000020050222
2050000000000222500000020050222
Source: Internationa l Monetar y Fund , Exchange Arrangements andExchange Restrictions (variou s issues ) an d Price-Waterhouse ,Doing Business Series (booklets for various countries), wer e usedto rat e each country . Thes e publication s provide d the descriptiv echaracteristics of the capital market arrangements for each country.These descriptions were used to classify and rate each country asfollows:
307
www.fraserinstitute.org
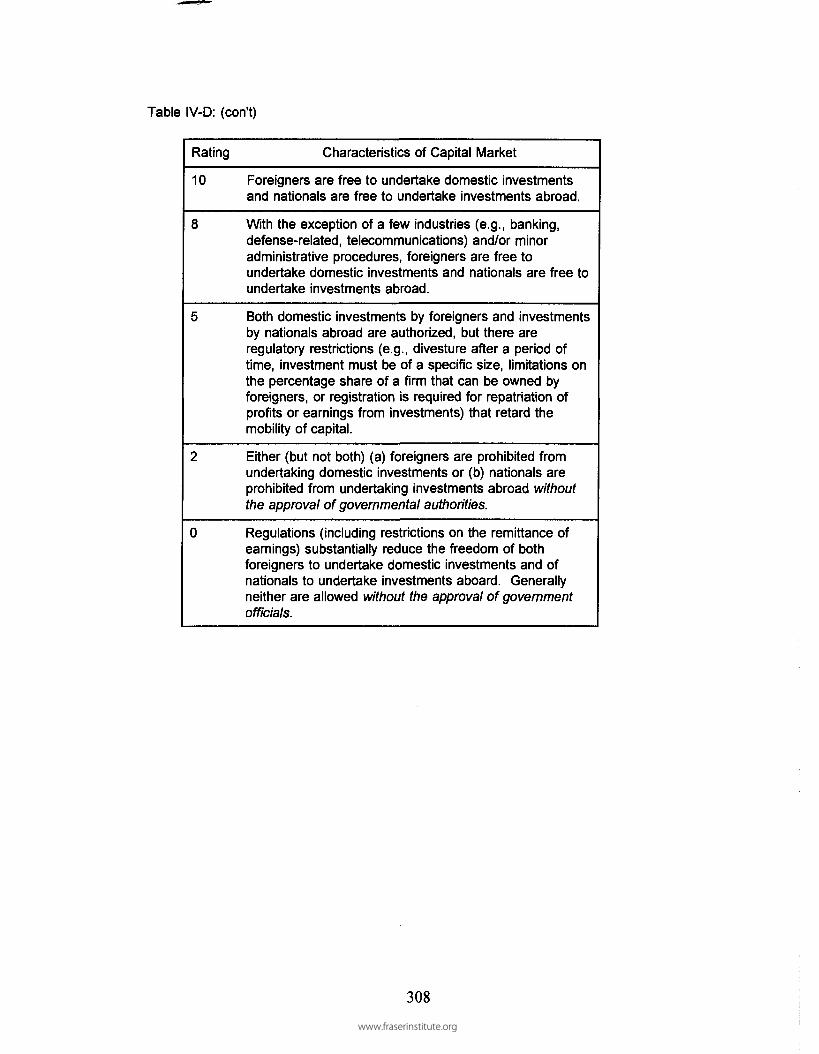
Table IV-D : (con't)
Rating Characteristic s o f Capita l Marke t
10 Foreigner s are free to undertake domestic investment sand nationals are free to undertake investments abroad.
With the exception of a few industries (e.g. , banking,defense-related, telecommunications) and/o r mino radministrative procedures , foreigners are free toundertake domestic investment s and nationals are free toundertake investments abroad.
Both domestic investment s b y foreigners and investment sby nationals abroad are authorized, but there areregulatory restriction s (e.g. , divesture after a period oftime, investmen t mus t be of a specific size, limitations onthe percentage share of a firm that can be owned byforeigners, or registration i s required for repatriation ofprofits or earnings from investments ) tha t retard themobility o f capital.
Either (but not both) (a ) foreigners are prohibited fromundertaking domestic investment s or (b) nationals areprohibited from undertaking investments abroad withoutthe approval of governmental authorities.
Regulations (includin g restrictions on the remittance o fearnings) substantiall y reduc e the freedom of bothforeigners to undertake domestic investments and ofnationals to undertake investments aboard . Generall yneither are allowed without the approval of governmentofficials.
308
www.fraserinstitute.org


![Solzhenitsyn - The Voice of Freedom [1975]](https://img.pdfslide.us/doc/110x75/577cc7351a28aba711a04d5f/solzhenitsyn-the-voice-of-freedom-1975.jpg)