Embed Size (px)
Citation preview
Kelp Inventory, 1995Nootka Sound
IEC Collaborative Marine Researchand Development Ltd.
Ministry of FisheriesSustainable Economic Development Branch
KELP INVENTORY, 1995NOOTKASOUND
prepared by
I. R. SutherlandIEC Collaborative Marine Research
and Development Ltd.
for
Ministry of Fisheries
and
Nuu-Chah-Nulth Tribal Council
Fisheries Development Report No. 39
Sustainable Economic Development BranchMinistry of Fisheries
Province of British Columbia
December, 1999
Canadian Cataloguing in Publication DataSutherland, I. R.
Kelp inventory, 1995 : Nootka Sound
(Fisheries development report, ISSN 0228-5975 ; no. 39)
Includes bibliographical references: p.ISBN 0-7726-4099-8
1. Nereocystis luetkeana - British Columbia - Nootka SoundRegion. 2. Macrocystis integrifolia - British Columbia - Nootka SoundRegion. 3. Algal populations - British Columbia - Nootka SoundRegion. I. British Columbia. Ministry of Fisheries. II. Nuu-Chah-NulthTribal Council. III. British Columbia. Fisheries Planning andInformation Branch. IV. Title. V. Series.
SH391.K44S97 1999 333.95'38 C00-960003-5
- i -
ABSTRACT
A modification of the Kelp Inventory Method (KIM-1) developed by Foreman
(1975) was used to estimate the total standing crop biomass and kelp bed area of
Nereocystis luetkeana and Macrocystis integrifolia along portions of the southwest
shore of Nootka Island, the west and south shores of Hesquiat Peninsula and a section
of Hesquiat Harbour for July 29, 1995. Results indicated that 9,611 tonnes of N.
luetkeana, 55,284 tonnes of M. integrifolia and 8,941 tonnes of N. luetkeana and M.
integrifolia in mixed beds were present. Total bed surface areas of N. luetkeana, M.
integrifolia and mixed beds were estimated to be 213.7, 518.1 and 117.8 hectares,
respectively. Five charts are presented which show the position, extent, species, and
density of every discernible kelp bed within the survey area. For management
purposes the area is divided into numbered, kilometre wide blocks.
Portions of the inventory area are compared with overlapping areas from a 1975
survey that used the KIM-1 method.
- ii -
ACKNOWLEDGMENTS
This project was inspired by Sennen Charleson of the Hesquiaht Band. The
success of the inventory was due to the efforts of the following people: Michael Coon,
Christine Hodgson and Barron Carswell of the Ministry of Agriculture, Fisheries and
Food; Jim Lane of the Nuu-chah-nulth Tribal Council; Dave Ignace and Paul Lucas of
the Hesquiaht First Nation; Larry Baird Jr. of the Ucluelet First Nation; and Charlie
Coots Jr. of the Uchuchlesaht First Nation, who carried out the field work. Christine
Hodgson and Jim Lane deserve special acknowledgement for organizing the field work.
Michael Coon, Christine Hodgson and Barron Carswell also coordinated the various
aspects of the project. Daniel Tresa and Erle Dzus of McElhanney Consulting Services
Ltd. provided computer mapping services. North West Geomatics Ltd. provided aerial
photographic coverage of the area. Kathy Evans of the Ministry of Agriculture,
Fisheries and Food provided licensing statistics and information on kelp use in British
Columbia. Mr. Bodo R. de Lange Boom, tides and currents analyst at the Canadian
Hydrographic Service, provided tidal height data for the inventory area.
- iii -
TABLE OF CONTENTS
Abstract i
Acknowledgements ii
Table of Contents iii
Introduction
Methods 2
Nereocystis 3
Macrocystis 4
Mixed Nereocystis and Macrocystis 5
Mapping of Kelp Beds 5
Results 7
Discussion 15
Comparison of 1975 and 1995 16
References 20
Appendix 22
- 1 -
INTRODUCTION
Nereocystis luetkeana (Mertens) Postels and Ruprecht and Macrocystisintegrifolia Bory form beds along extensive portions of the British Columbia coast. In1975 the Provincial Government undertook a program to locate and quantify thestanding crop of these economically important kelps using the inventory method (KIM-1)developed by Foreman (1975). Since that time major kelp stocks have beeninventoried throughout the province (Coon, 1981; Coon et al., 1976, 1979, 1980, 1981,1982; Field, 1996; Field et al., 1975, 1977, 1978; Sutherland, 1989, 1990).
The present report contains the results of a 1995 survey by the Ministry ofAgriculture, Fisheries and Food and the Nuu-chah-nulth Tribal Council for portions ofthe southwest shore of Nootka Island from Esperanza Inlet to Nootka Sound, the westand south shores of Hesquiat Peninsula and a portion of Hesquiat Harbour. For thefirst time in B.C., computerized mapping of the kelp resource has been used incombination with traditional inventory methods.
This kelp inventory took place on the 20th anniversary of the first KIM-1 survey ofNootka Sound in 1975 (Coon et al., 1976). In the 20 years that have elapsed, seasonaland annual variation as well as longer-term changes, including the successfulreintroduction of sea otters to the west coast of Vancouver Island and large scaleoceanic events (El Niño), have affected the local stands of large kelps. The 1995 workhas been undertaken to evaluate and document changes in kelp bed extent andcomposition that have occurred through time and to update stock information for use intreaty negotiations.
Accurate and comprehensive data on the standing crop of kelp in British Columbiaprovide a basis for allocating these resources through licensing and for establishingarea specific harvest quotas. Kelp beds are important to other marine species and kelpinventory charts and data will be of value to those preparing environmental impactstatements or conducting surveys for herring spawn, abalone, sea urchins, sea ottersand other species.
At the present time, the principal commercial use of large kelp species in B.C. isfor herring spawn on kelp. In 1995, 36 licenses to harvest Macrocystis were issued anda total of 97.5 tonnes were harvested for this purpose. As well, an additional 8 licensesharvested approximately 10 tonnes of Nereocystis and Macrocystis for use in the
- 2 -
restaurant trade, in health food stores, for fertilizers, plant sprays and otherapplications.
METHODS
The KIM-1 technique uses aerial photography in combination with field samplingto produce kelp bed maps and estimates of kelp bed areas and biomass. While thebasis of the KIM-1 method has remained the same, certain steps have changedthrough time to improve accuracy and/or decrease the field work component.Modifications of this method as stated by Coon et al. (1976), Field et al. (1977) andSutherland (1989 and 1990) were used in this study.
Briefly, the KIM-1 technique involves obtaining 24 cm. format, 1:7,200 scale, blackand white, infrared (IR) aerial photography of the kelp bed and shoreline in the desiredregion. The black and white IR negatives are used to prepare charts of the coastlineand the offshore kelp beds. The kelp bed charts produced are divided to sections, orblocks, that are 1 kilometre in width for statistical purposes. Kelp bed area data isderived from the charts.
The technique identifies six bed types on the basis of:a) species - Macrocystis or Nereocystis or mixed (considered to be 42% Nereocystis
and 58% Macrocystis; Foreman, 1975); andb) plant or frond density - low density (less than 10 plants or fronds per 10 square
meters) or high (greater than 10 plants or fronds per 10 square meters).Note: Macrocystis density values determined from field transects suggest that theactual density of fronds is higher than predicted by the KIM-1 technique. It follows thatthe division to high and low density Macrocystis beds is at a higher level than 10 frondsper 10 square meters. In the present survey Macrocystis density values determinedfrom field transects were applied to all Macrocystis areas. High and low density bedshave been kept separate on the chartwork and in area measurements,, however, toprovide detail as presented in previous inventories.
Near the time that the beds were photographed, field crews obtain samples of kelpfrom the inventory area for mean weight per plant (Nereocystis) or frond Macrocystisdetermination and record numbers of plants along bottom transects to determinedensity for Macrocystis. Density for Nereocystis and bed area for both species aredetermined from mapping and analysis of the aerial photographs. Kelp biomass is
- 3 -
determined by multiplying the mean weight per plant or frond values by the observed orfrond densities and multiplying this product by the observed bed areas. All biomassestimates in this report are of total standing crop.
Field sampling took place between August 3 to 7, 1995. Aerial photography wassecured on July 29, 1995. The Ministry of Agriculture, Fisheries and Food providedfield sampling data and aerial photography of kelp beds under contract to IECCollaborative Marine Research and Development Ltd. who undertook the initial airphoto interpretation and mapping of the kelp beds. The results were provided toMcElhanney Consulting Services Ltd., who integrated them on a computer mappingsystem and generated maps and kelp bed area data. IEC then completed the dataanalysis for the inventory and produced the present report.
Nereocystis
Prior to work at Porcher Island in 1981 (Coon, 1981), vertical biomass distributiondata for Nereocystis was used to produce estimates of biomass at various harvestingdepths relative to mean water level (MWL). Beginning in 1981, in order to minimizecostly field work, the time consuming weighing of each 1 meter increment ofNereocystis was not undertaken. In this inventory, wet weight was determined forNereocystis plants as they were sampled at randomly located stations in the surveyarea. The mean biomass per plant statistic for Nereocystis used in subsequentcalculations is derived from the mean of sample station means of wet weight per plant.
The density of Nereocystis on the surface at the time of photography isdetermined directly from the photographs with the aid of a microscope and using theKIM-1 point-intercept method (Foreman, 1975). A point-intercept to density regressionfor Nereocystis, as developed by Foreman and Cabot (1979), was employed in thisinventory. The tidal heights at the time of photography relate density data from thephotos to MWL for further calculations. After 1981, length measurements ofNereocystis plants merged relative to MWL were used to produce a table of cumulativenumbers of plants in 1 meter increments above and below MWL. These cumulativenumbers are used to convert the density observed from the photography to total orbottom density as follows:
Total density at bottom = (Conversion factor) X (Density derived fromphotography)
- 4 -
Where the conversion factor = Total no. plants in all samplesno. plants in all samples
extending to surface at tidalheight at time of photography
Calculations using data from previous inventories (Coon et al., 1977, 1979, 1980,1981, 1982. Field et al., 1977, 1978) have shown this method, in practice, producestotal standing crop estimates differing from those produced using the original KIM-1method by an average of 2 percent (Sutherland, 1990).
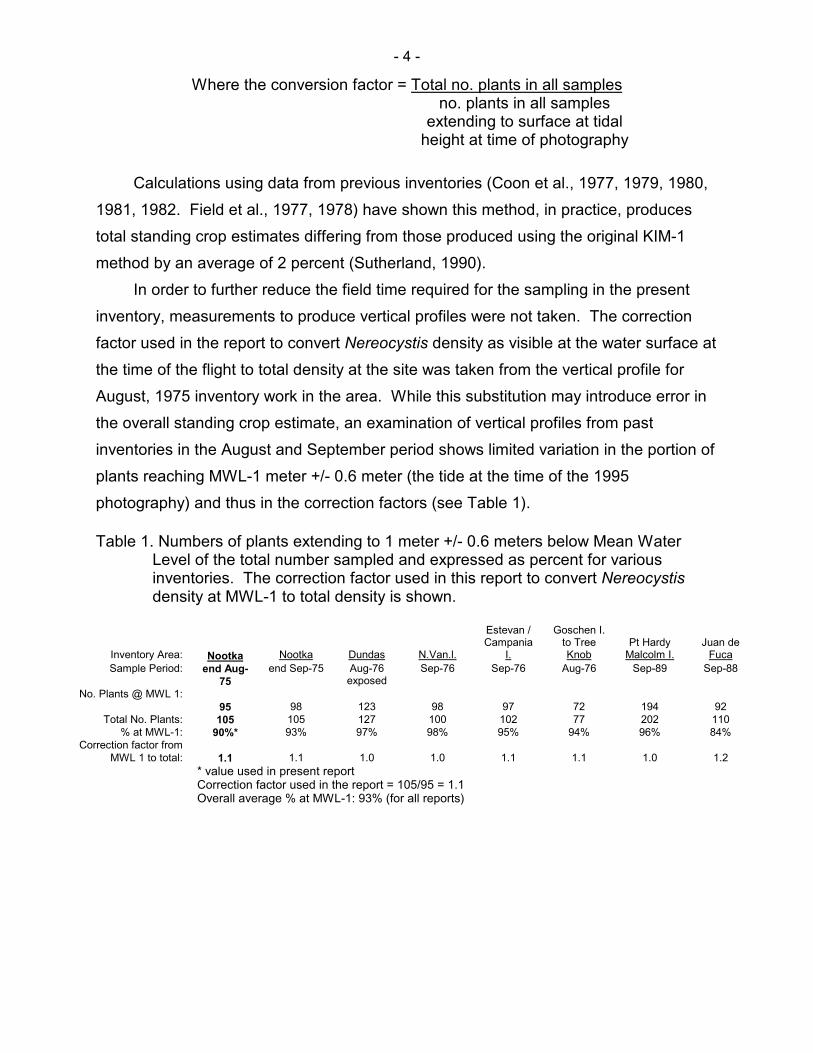
In order to further reduce the field time required for the sampling in the presentinventory, measurements to produce vertical profiles were not taken. The correctionfactor used in the report to convert Nereocystis density as visible at the water surface atthe time of the flight to total density at the site was taken from the vertical profile forAugust, 1975 inventory work in the area. While this substitution may introduce error inthe overall standing crop estimate, an examination of vertical profiles from pastinventories in the August and September period shows limited variation in the portion ofplants reaching MWL-1 meter +/- 0.6 meter (the tide at the time of the 1995photography) and thus in the correction factors (see Table 1).
Table 1. Numbers of plants extending to 1 meter +/- 0.6 meters below Mean WaterLevel of the total number sampled and expressed as percent for variousinventories. The correction factor used in this report to convert Nereocystisdensity at MWL-1 to total density is shown.
Inventory Area: Nootka Nootka Dundas N.Van.l.
Estevan /Campania
I.
Goschen I.to TreeKnob
Pt HardyMalcolm I.
Juan deFuca
Sample Period: end Aug-75
end Sep-75 Aug-76exposed
Sep-76 Sep-76 Aug-76 Sep-89 Sep-88
No. Plants @ MWL 1:95 98 123 98 97 72 194 92
Total No. Plants: 105 105 127 100 102 77 202 110% at MWL-1: 90%* 93% 97% 98% 95% 94% 96% 84%
Correction factor fromMWL 1 to total: 1.1 1.1 1.0 1.0 1.1 1.1 1.0 1.2
* value used in present reportCorrection factor used in the report = 105/95 = 1.1Overall average % at MWL-1: 93% (for all reports)
- 5 -
Macrocystis
Mean biomass per frond data was collected for Macrocystis at randomly locatedsample stations in the survey area. The mean biomass per frond value reported forMacrocystis is also the mean of the sample station means. Macrocystis density in thisinventory has been determined in the field from counts along underwater transects. Inthe KIM-1 method, Macrocystis density was derived using the point intercept methodsimilar to that presently used for Nereocystis. Beginning in 1982, as a result ofperceived underestimation of Macrocystis biomass by the KIM-1 technique, densities forthis species have been estimated from counts by SCUBA divers of the numbers offronds found within one meter on either side of randomly established 40 meter longtransects on the bottom. This provides frond numbers from 80 square meter sections ofthe bottom at each sample station. The mean density per square meter statistic forMacrocystis is derived from the mean of the station means.
Mixed Nereocystis and Macrocystis
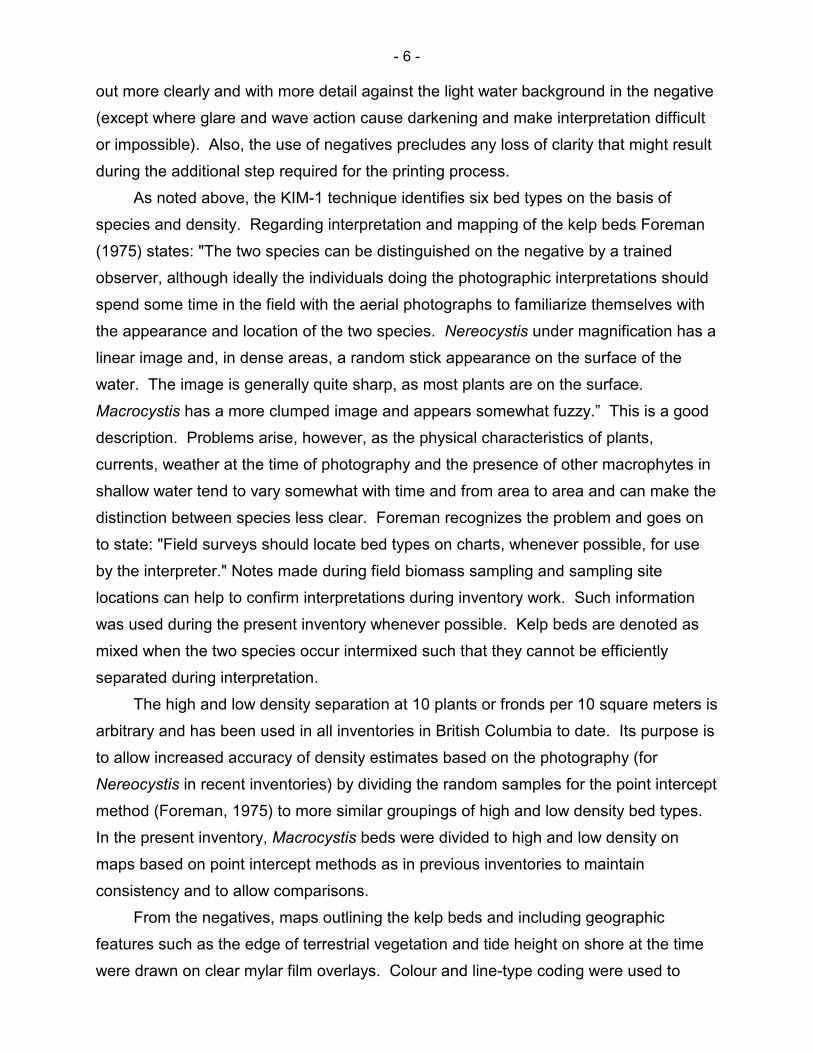
Changes to the method described above have required modification of the methodused to calculate mixed bed biomass. Mixed bed biomass per hectare for eachkilometer block has been calculated as follows:
Mean biomass Mean biomass Mean biomassper hectare of = .42 X per ha. of + .58 X per ha. of
low or high density low or high Macrocystismixed kelp Nereocystis
The 0.42 and 0.58 figures in the equation are derived from the KIM-1 method. As
can be noted, low or high density is not considered for the Macrocystis portion of the
calculation.
Mapping of Kelp Beds
Although the essentials of the air photo interpretation remain the same, somechanges in methods have been necessary to use digitized mapping techniques. Anoverview of the procedures used in the present inventory is presented below.
While prints of the IR film show land features more clearly and are typically usedin mapping, the black and white IR negatives viewed on a standard light table are usedin kelp bed interpretation. The dark kelp, especially when in low density beds, stands
- 6 -
out more clearly and with more detail against the light water background in the negative(except where glare and wave action cause darkening and make interpretation difficultor impossible). Also, the use of negatives precludes any loss of clarity that might resultduring the additional step required for the printing process.
As noted above, the KIM-1 technique identifies six bed types on the basis ofspecies and density. Regarding interpretation and mapping of the kelp beds Foreman(1975) states: "The two species can be distinguished on the negative by a trainedobserver, although ideally the individuals doing the photographic interpretations shouldspend some time in the field with the aerial photographs to familiarize themselves withthe appearance and location of the two species. Nereocystis under magnification has alinear image and, in dense areas, a random stick appearance on the surface of thewater. The image is generally quite sharp, as most plants are on the surface.Macrocystis has a more clumped image and appears somewhat fuzzy.” This is a gooddescription. Problems arise, however, as the physical characteristics of plants,currents, weather at the time of photography and the presence of other macrophytes inshallow water tend to vary somewhat with time and from area to area and can make thedistinction between species less clear. Foreman recognizes the problem and goes onto state: "Field surveys should locate bed types on charts, whenever possible, for useby the interpreter." Notes made during field biomass sampling and sampling sitelocations can help to confirm interpretations during inventory work. Such informationwas used during the present inventory whenever possible. Kelp beds are denoted asmixed when the two species occur intermixed such that they cannot be efficientlyseparated during interpretation.
The high and low density separation at 10 plants or fronds per 10 square meters isarbitrary and has been used in all inventories in British Columbia to date. Its purpose isto allow increased accuracy of density estimates based on the photography (forNereocystis in recent inventories) by dividing the random samples for the point interceptmethod (Foreman, 1975) to more similar groupings of high and low density bed types.In the present inventory, Macrocystis beds were divided to high and low density onmaps based on point intercept methods as in previous inventories to maintainconsistency and to allow comparisons.
From the negatives, maps outlining the kelp beds and including geographicfeatures such as the edge of terrestrial vegetation and tide height on shore at the timewere drawn on clear mylar film overlays. Colour and line-type coding were used to
- 7 -
separate the bed types and geographic features. These overlays were found to becompatible with the digitizing activities used in the present inventory provided:
• one overlay sheet of mylar film was used per frame;• the overlay positioning was related to frames by marking the positions of• feducials from each frame on corresponding overlays (feducials are reference
marks on frames); and• the frame number was noted in the same corner of the overlay as it appears on
the frame for identification and to confirm proper orientation of the overlay.McElhanney Consulting Services Ltd. were contracted to digitize the polygons
provided on the mylar sheets and the shoreline from aerial photographs usingmonorestitution techniques. The company also placed the statistical kilometre blocks,calculated the areas of kelp bed polygons, provided computer data files (ARCINFOspatial data set) and 1:20,000 scale maps very similar in format to those used inprevious kelp inventory reports.
RESULTS
Kelp bed area for all bed types and density estimates for Nereocystis provided inthis report are based on the aerial photography for the inventory area which was flownJuly 29, 1995 between 10:17 AM and 11:00 AM local time (Pacific Daylight SavingTime). This places the timing of the photography within the desired 10:00 AM to 2:00PM range that provides proper sun angles for adequate picture quality.
Tidal data and correction factors were provided by the Canadian HydrographicService, Institute of Ocean Sciences. The tidal gauge at Tofino, the closest recorder tothe Nootka Sound area, was not in service at the time of inventory work. Asrecommended by the Service, readings from the tidal gauge at Bamfield were correctedto Tofino and subsequently to Saavedra Island, Nootka Sound, the tidal station for thesurvey area. Required corrections were quite small. Tidal height at the time ofphotography was within the MWL minus 1 meter +/- 0.6 meter KIM-1 tidal range.
Winds and waves at the time of photography were rising. Two foot seas reportedin the area at 07:00 AM reached six foot moderate seas by 2:00 PM with winds to NW35 knots. A low SW swell was also present (Climat Services, telephonecommunication). The combination of winds, waves and sun angle resulted in glare on
- 8 -
some photographs and rendered portions of the film unusable. Unusable sections werenot mapped during photo interpretation.
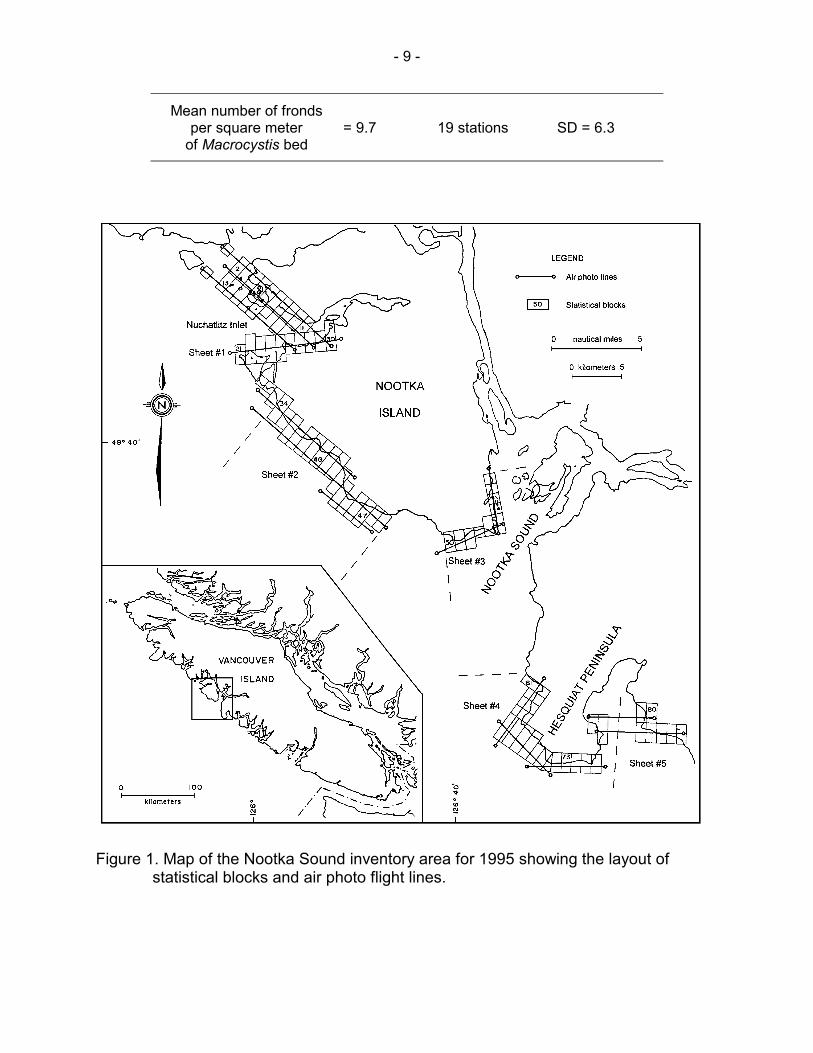
Chart Sheets 1 through 5 (Appendix) illustrate the disposition of kelp bedresources by bed type along the inventory area (Figure 1). The numbering andplacement of the kilometer wide statistical blocks have changed from the 1975inventory layout due to differing photographic coverage and to more accurate mappingand measurement procedures used in positioning of blocks.
Table 2 presents the field-determined mean biomass per plant (wet weight)estimates obtained from means of twelve Nereocystis and eighteen Macrocystissampling stations in the inventory area. A total of 124 Nereocystis plants and 457Macrocystis fronds were sampled at these stations August 3 to 7, 1995. TheMacrocystis density value derived from transect counts performed on the same datesand at the same locations as Macrocystis biomass samples were taken (with theexception of 1 station where biomass sampling was not done) is shown in Table 3. Ascan be seen from the standard deviation (SD) values reported, considerable variabilityexists between stations. Maximum and minimum station mean biomass values were7.3 and 0.7 kg. per Nereocystis plant and 2.3 and 0.4 kg. per Macrocystis frond.Maximum and minimum Macrocystis mean station densities from transects were 29.2and 1.6 fronds per square meter. High densities found in the area are supported by thepresence of uniform rocky substrate for secure holdfast attachment (M. Coon, pers.comm.).
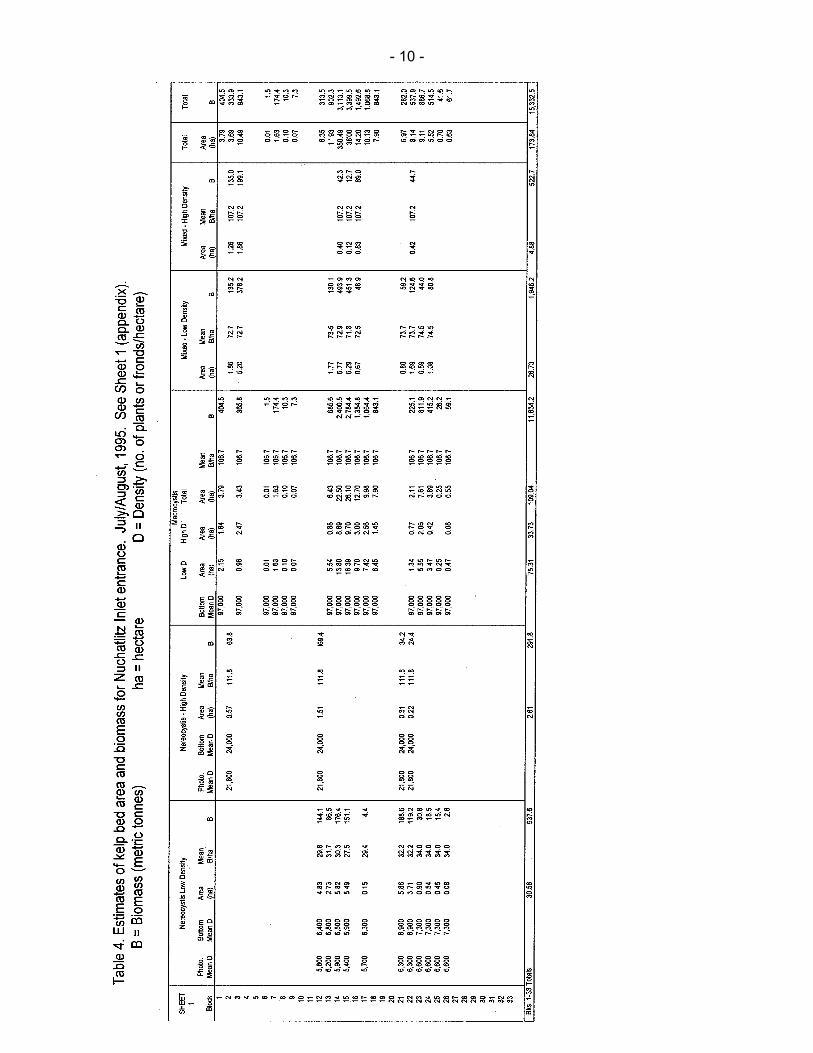
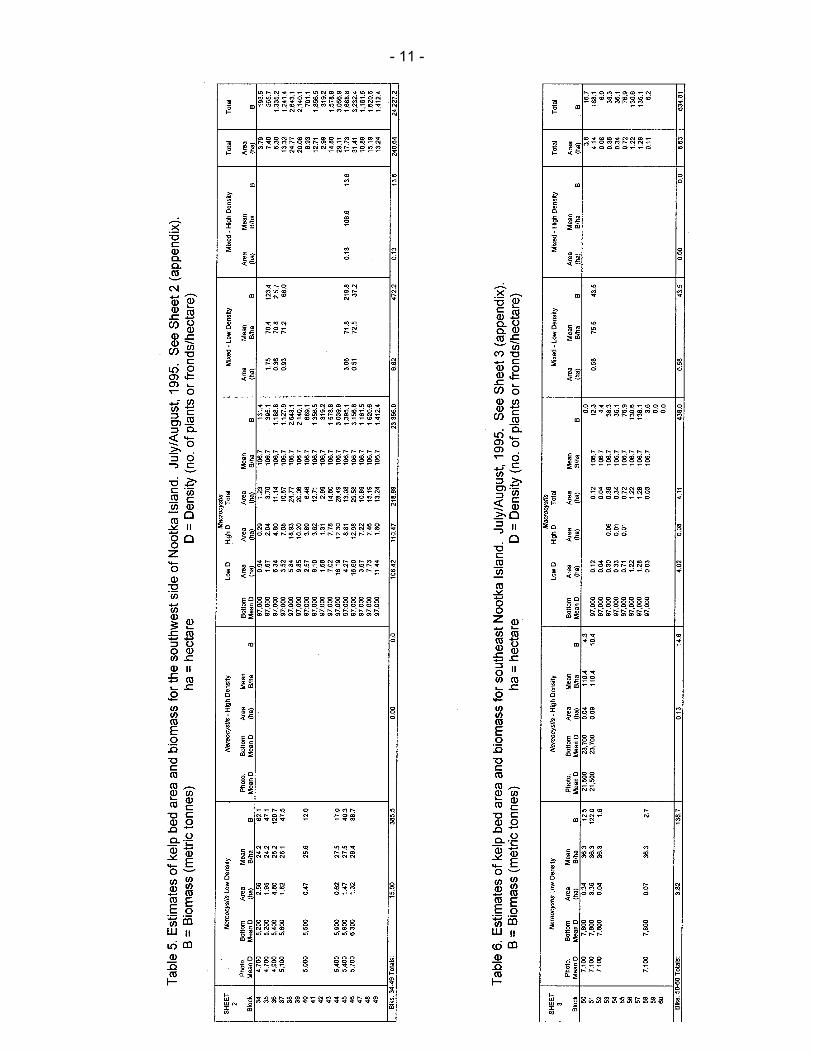
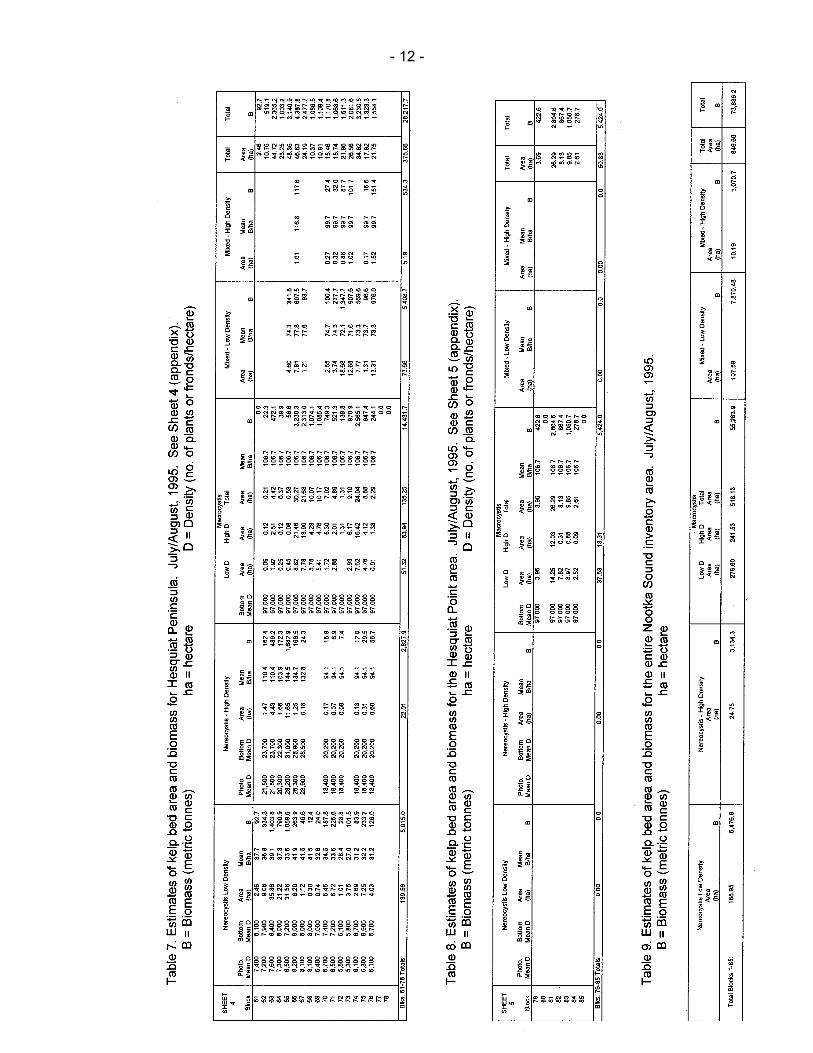
Tables 4 through 8 present estimates of kelp bed areas, density and biomass foreach block in Chart Sheets 1 through 5. Table 9 summarizes the data for the entirearea. Tables 10, 11 and 12 summarize the bed area and biomass estimates, thepercent biomass and the percent bed area composition, respectively, for each bed typein each chart area.
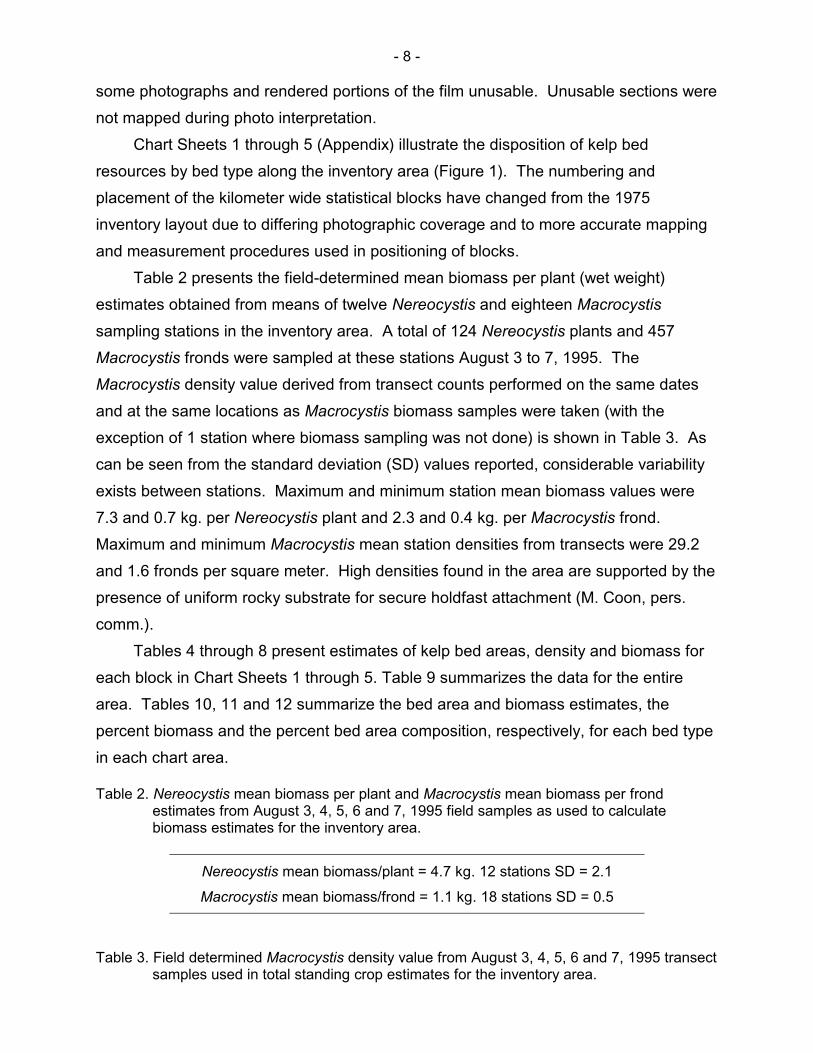
Table 2. Nereocystis mean biomass per plant and Macrocystis mean biomass per frondestimates from August 3, 4, 5, 6 and 7, 1995 field samples as used to calculatebiomass estimates for the inventory area.
Nereocystis mean biomass/plant = 4.7 kg. 12 stations SD = 2.1
Macrocystis mean biomass/frond = 1.1 kg. 18 stations SD = 0.5
Table 3. Field determined Macrocystis density value from August 3, 4, 5, 6 and 7, 1995 transectsamples used in total standing crop estimates for the inventory area.
- 9 -
Mean number of frondsper square meter = 9.7 19 stations SD = 6.3
of Macrocystis bed
Figure 1. Map of the Nootka Sound inventory area for 1995 showing the layout ofstatistical blocks and air photo flight lines.
- 10 -
- 11 -
- 12 -
- 13 -
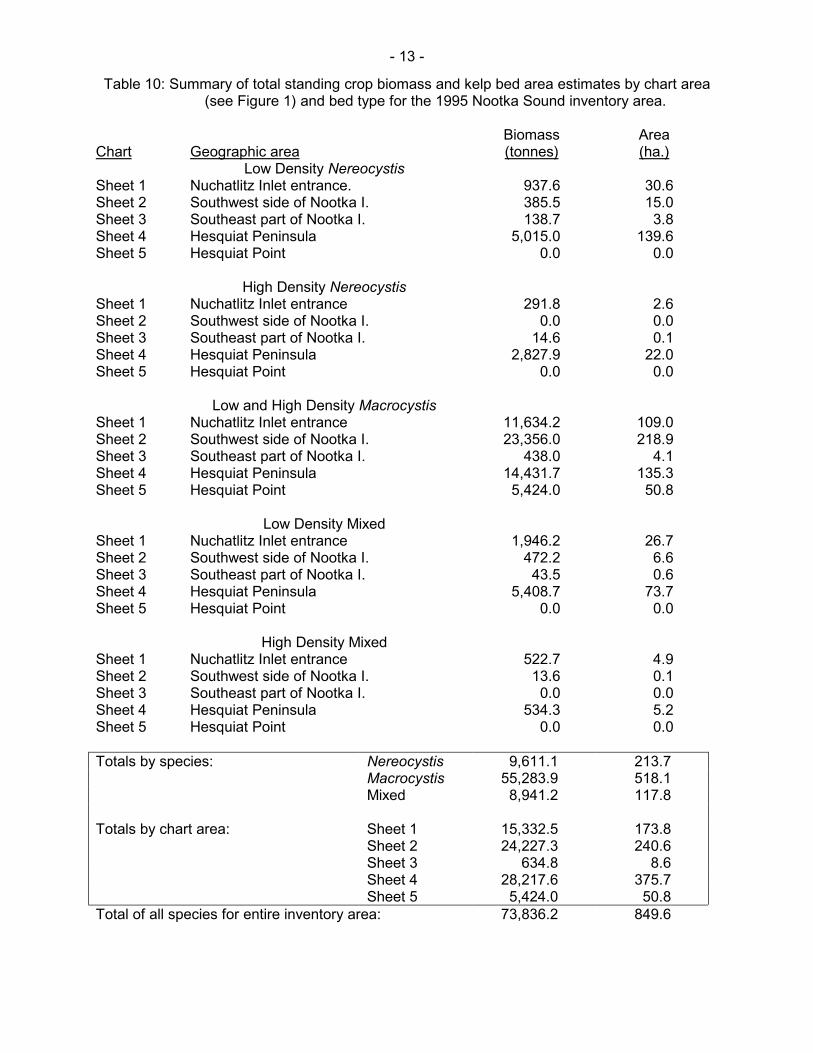
Table 10: Summary of total standing crop biomass and kelp bed area estimates by chart area(see Figure 1) and bed type for the 1995 Nootka Sound inventory area.
Biomass AreaChart Geographic area (tonnes) (ha.)
Low Density NereocystisSheet 1 Nuchatlitz Inlet entrance. 937.6 30.6Sheet 2 Southwest side of Nootka I. 385.5 15.0Sheet 3 Southeast part of Nootka I. 138.7 3.8Sheet 4 Hesquiat Peninsula 5,015.0 139.6Sheet 5 Hesquiat Point 0.0 0.0
High Density NereocystisSheet 1 Nuchatlitz Inlet entrance 291.8 2.6Sheet 2 Southwest side of Nootka I. 0.0 0.0Sheet 3 Southeast part of Nootka I. 14.6 0.1Sheet 4 Hesquiat Peninsula 2,827.9 22.0Sheet 5 Hesquiat Point 0.0 0.0
Low and High Density MacrocystisSheet 1 Nuchatlitz Inlet entrance 11,634.2 109.0Sheet 2 Southwest side of Nootka I. 23,356.0 218.9Sheet 3 Southeast part of Nootka I. 438.0 4.1Sheet 4 Hesquiat Peninsula 14,431.7 135.3Sheet 5 Hesquiat Point 5,424.0 50.8
Low Density MixedSheet 1 Nuchatlitz Inlet entrance 1,946.2 26.7Sheet 2 Southwest side of Nootka I. 472.2 6.6Sheet 3 Southeast part of Nootka I. 43.5 0.6Sheet 4 Hesquiat Peninsula 5,408.7 73.7Sheet 5 Hesquiat Point 0.0 0.0
High Density MixedSheet 1 Nuchatlitz Inlet entrance 522.7 4.9Sheet 2 Southwest side of Nootka I. 13.6 0.1Sheet 3 Southeast part of Nootka I. 0.0 0.0Sheet 4 Hesquiat Peninsula 534.3 5.2Sheet 5 Hesquiat Point 0.0 0.0
Totals by species: Nereocystis 9,611.1 213.7Macrocystis 55,283.9 518.1Mixed 8,941.2 117.8
Totals by chart area: Sheet 1 15,332.5 173.8Sheet 2 24,227.3 240.6Sheet 3 634.8 8.6Sheet 4 28,217.6 375.7Sheet 5 5,424.0 50.8
Total of all species for entire inventory area: 73,836.2 849.6
- 14 -
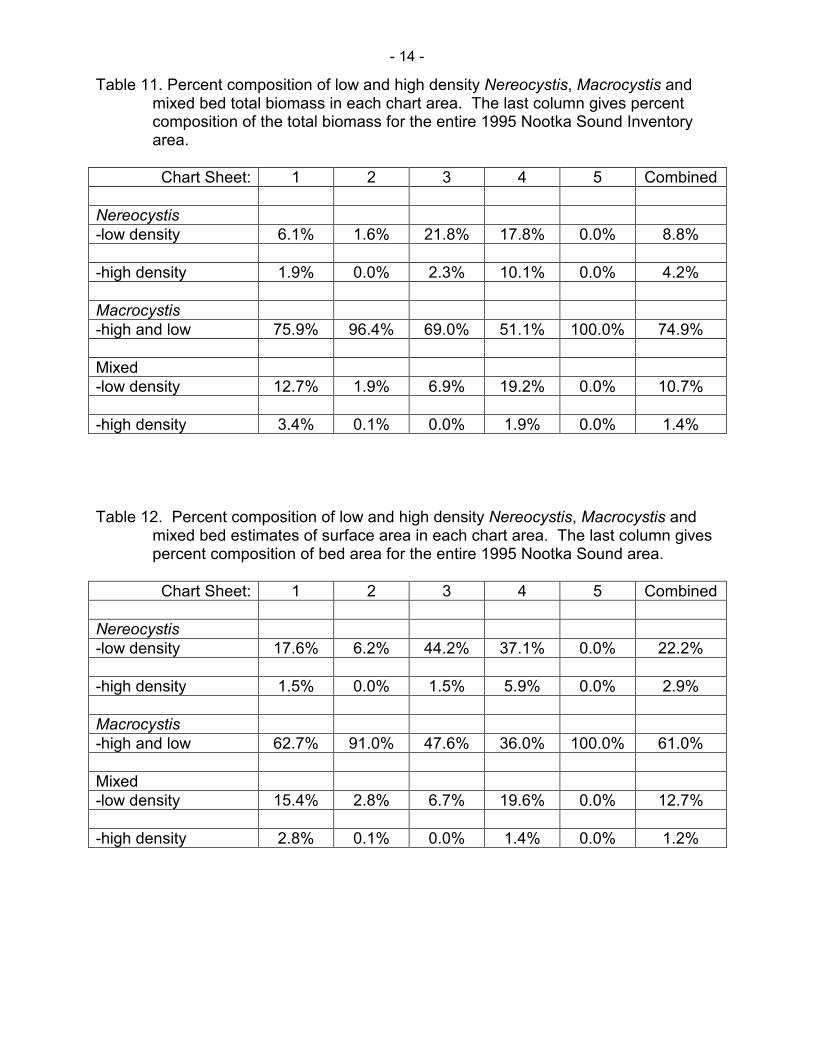
Table 11. Percent composition of low and high density Nereocystis, Macrocystis andmixed bed total biomass in each chart area. The last column gives percentcomposition of the total biomass for the entire 1995 Nootka Sound Inventoryarea.
Chart Sheet: 1 2 3 4 5 Combined
Nereocystis-low density 6.1% 1.6% 21.8% 17.8% 0.0% 8.8%
-high density 1.9% 0.0% 2.3% 10.1% 0.0% 4.2%
Macrocystis-high and low 75.9% 96.4% 69.0% 51.1% 100.0% 74.9%
Mixed-low density 12.7% 1.9% 6.9% 19.2% 0.0% 10.7%
-high density 3.4% 0.1% 0.0% 1.9% 0.0% 1.4%
Table 12. Percent composition of low and high density Nereocystis, Macrocystis andmixed bed estimates of surface area in each chart area. The last column givespercent composition of bed area for the entire 1995 Nootka Sound area.
Chart Sheet: 1 2 3 4 5 Combined
Nereocystis-low density 17.6% 6.2% 44.2% 37.1% 0.0% 22.2%
-high density 1.5% 0.0% 1.5% 5.9% 0.0% 2.9%
Macrocystis-high and low 62.7% 91.0% 47.6% 36.0% 100.0% 61.0%
Mixed-low density 15.4% 2.8% 6.7% 19.6% 0.0% 12.7%
-high density 2.8% 0.1% 0.0% 1.4% 0.0% 1.2%
- 15 -
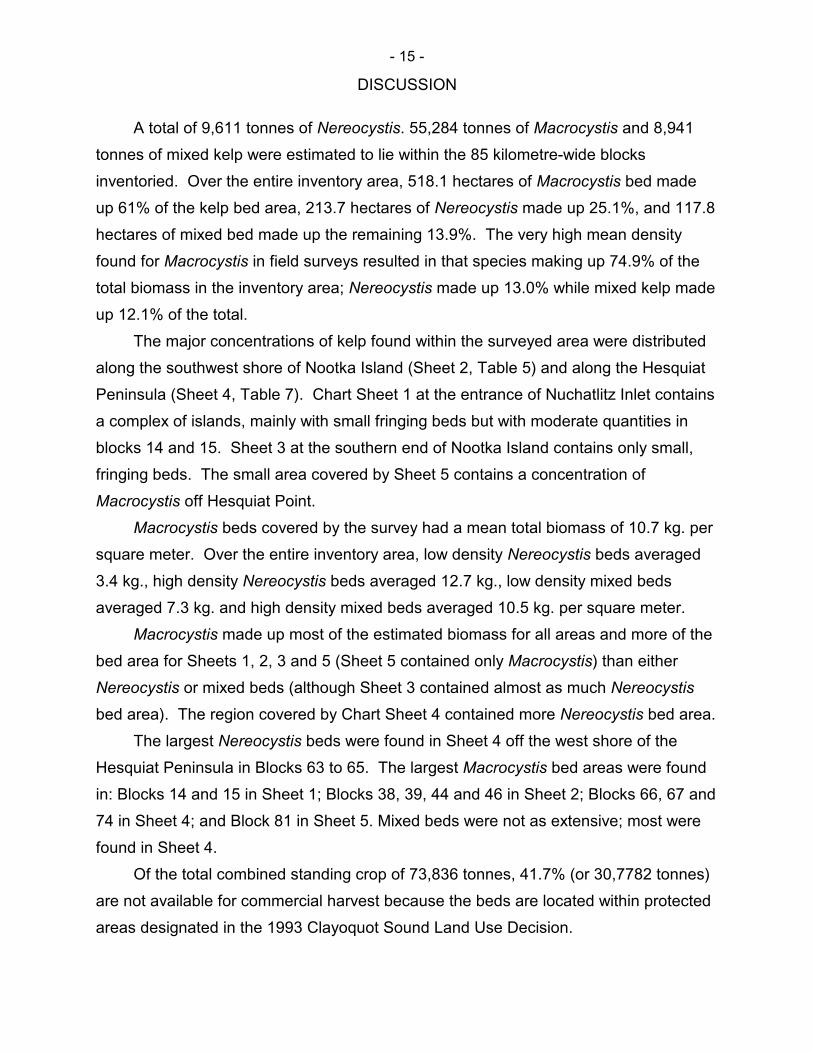
DISCUSSION
A total of 9,611 tonnes of Nereocystis. 55,284 tonnes of Macrocystis and 8,941tonnes of mixed kelp were estimated to lie within the 85 kilometre-wide blocksinventoried. Over the entire inventory area, 518.1 hectares of Macrocystis bed madeup 61% of the kelp bed area, 213.7 hectares of Nereocystis made up 25.1%, and 117.8hectares of mixed bed made up the remaining 13.9%. The very high mean densityfound for Macrocystis in field surveys resulted in that species making up 74.9% of thetotal biomass in the inventory area; Nereocystis made up 13.0% while mixed kelp madeup 12.1% of the total.
The major concentrations of kelp found within the surveyed area were distributedalong the southwest shore of Nootka Island (Sheet 2, Table 5) and along the HesquiatPeninsula (Sheet 4, Table 7). Chart Sheet 1 at the entrance of Nuchatlitz Inlet containsa complex of islands, mainly with small fringing beds but with moderate quantities inblocks 14 and 15. Sheet 3 at the southern end of Nootka Island contains only small,fringing beds. The small area covered by Sheet 5 contains a concentration ofMacrocystis off Hesquiat Point.
Macrocystis beds covered by the survey had a mean total biomass of 10.7 kg. persquare meter. Over the entire inventory area, low density Nereocystis beds averaged3.4 kg., high density Nereocystis beds averaged 12.7 kg., low density mixed bedsaveraged 7.3 kg. and high density mixed beds averaged 10.5 kg. per square meter.
Macrocystis made up most of the estimated biomass for all areas and more of thebed area for Sheets 1, 2, 3 and 5 (Sheet 5 contained only Macrocystis) than eitherNereocystis or mixed beds (although Sheet 3 contained almost as much Nereocystisbed area). The region covered by Chart Sheet 4 contained more Nereocystis bed area.
The largest Nereocystis beds were found in Sheet 4 off the west shore of theHesquiat Peninsula in Blocks 63 to 65. The largest Macrocystis bed areas were foundin: Blocks 14 and 15 in Sheet 1; Blocks 38, 39, 44 and 46 in Sheet 2; Blocks 66, 67 and74 in Sheet 4; and Block 81 in Sheet 5. Mixed beds were not as extensive; most werefound in Sheet 4.
Of the total combined standing crop of 73,836 tonnes, 41.7% (or 30,7782 tonnes)are not available for commercial harvest because the beds are located within protectedareas designated in the 1993 Clayoquot Sound Land Use Decision.
- 16 -
Comparison With Kelp Inventory 1975, Nootka Sound
The following section compares areas covered by both 1975 and 1995 inventoriesand examines changes in bed area and estimated total standing crop biomass. Nocomparison was made with earlier estimates made for the area by Huff (1967). Adiscussion of Huff’s estimates, the methods used and differences from 1975 estimatescan be found in Coon et al. (1976).
In comparing the results of the two inventories, it is important to keep in mind thechanges to methodologies and manner of reporting the data that have taken place.When good aerial photographic coverage is available, kelp bed area determination canbe quite exacting. Methods used for measuring area have taken advantage of newtechnologies but in general the process has changed little. Mean biomass per plant orfrond and density estimation have both undergone changes. Both are used incombination with bed area to estimate kelp biomass.
In the 1975 inventory work for Nootka Sound (Coon et al., 1976), results wereported as biomass above mean water level, as well as total standing crop (see table 1.9Coon et al. (1976)). Changes to techniques noted in the method, and the requirementfor total standing crop information for harvest quota determination have resulted in thereporting of total standing crop biomass. Total standing crop biomass is always higherthan the biomass above mean water level for these species and care should be usedwhen comparing estimates from past inventory work. In this comparison, 1975 valueshave been converted to total standing crop biomass.
Mean biomass per plant and density methodologies have changed significantlysince the 1975 inventory. The Macrocystis density values derived from the underwatertransect counts are known to be higher than those that result when KIM-1 densitymethods are used as was the case in 1975. This higher density in turn results in ahigher biomass per hectare estimate.
Average total biomass per hectare of high or low density Macrocystis in 1995 isestimated at 106.7 tonnes while the maximum biomass per hectare in late August, 1975for high and low density begins was 39.5 tonnes and 15.2 tonnes, respectively (1975values converted to total biomass; overall average values of biomass per hectare forMacrocystis in 1975 would be lower than these maximum values). The mean totalbiomass per plant for Nereocystis and frond for Macrocystis were both higher in 1975than in 1995 as shown in Table 13.
- 17 -
Table 13. The mean total biomass per plant is presented for both the 1975 and 1995inventories. Data for the 1975 inventory has been converted to total biomass by usingthe reported conversion factors.
Sample Date Nereocystis MacrocystisJuIy/August, 1975 5.0 2.0Early August, 1995 4.7 1.1
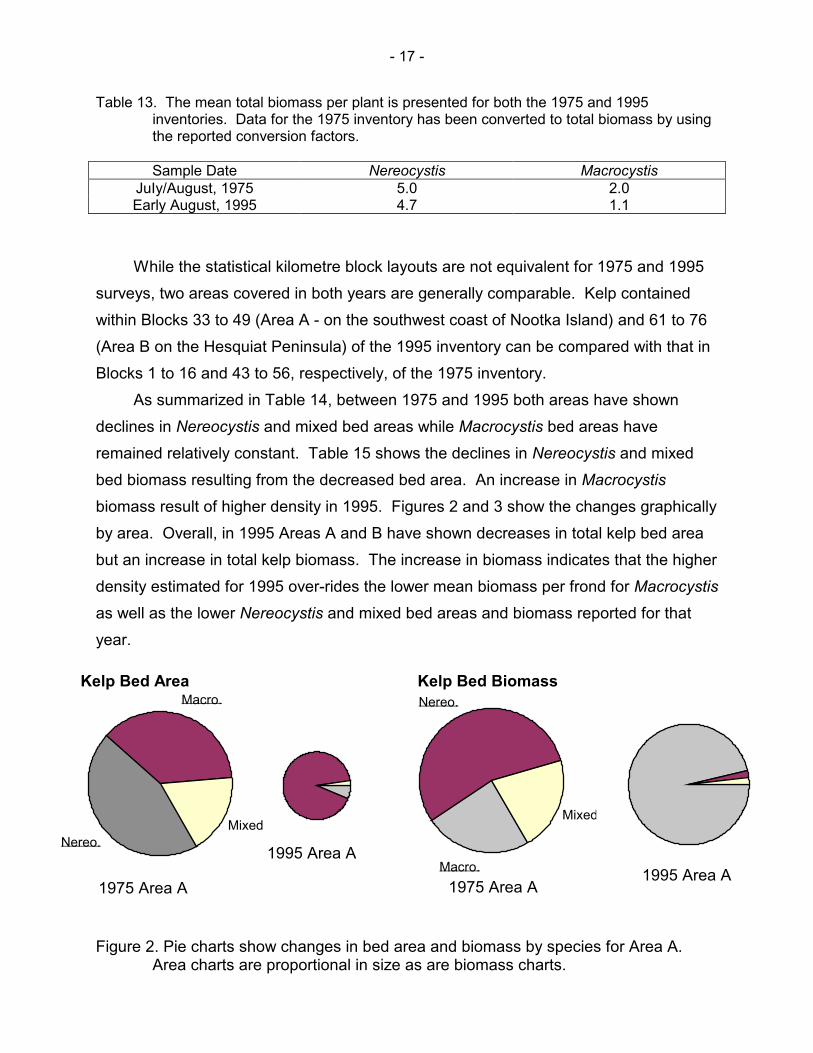
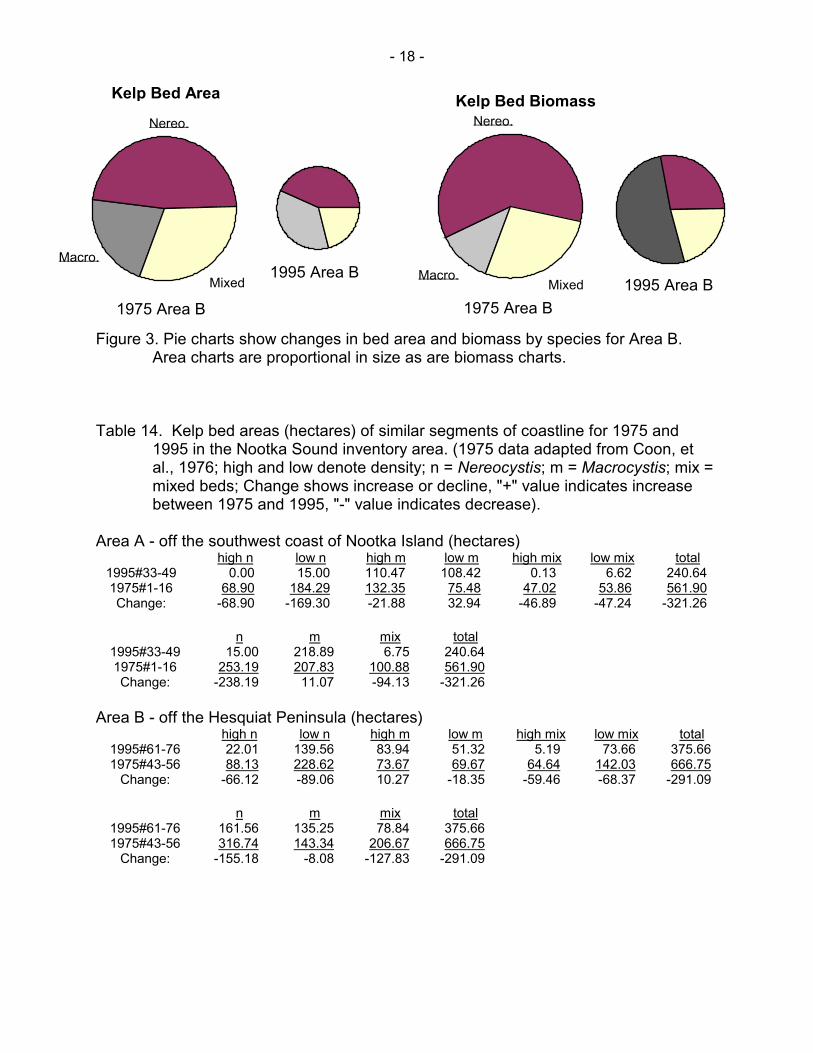
While the statistical kilometre block layouts are not equivalent for 1975 and 1995surveys, two areas covered in both years are generally comparable. Kelp containedwithin Blocks 33 to 49 (Area A - on the southwest coast of Nootka Island) and 61 to 76(Area B on the Hesquiat Peninsula) of the 1995 inventory can be compared with that inBlocks 1 to 16 and 43 to 56, respectively, of the 1975 inventory.
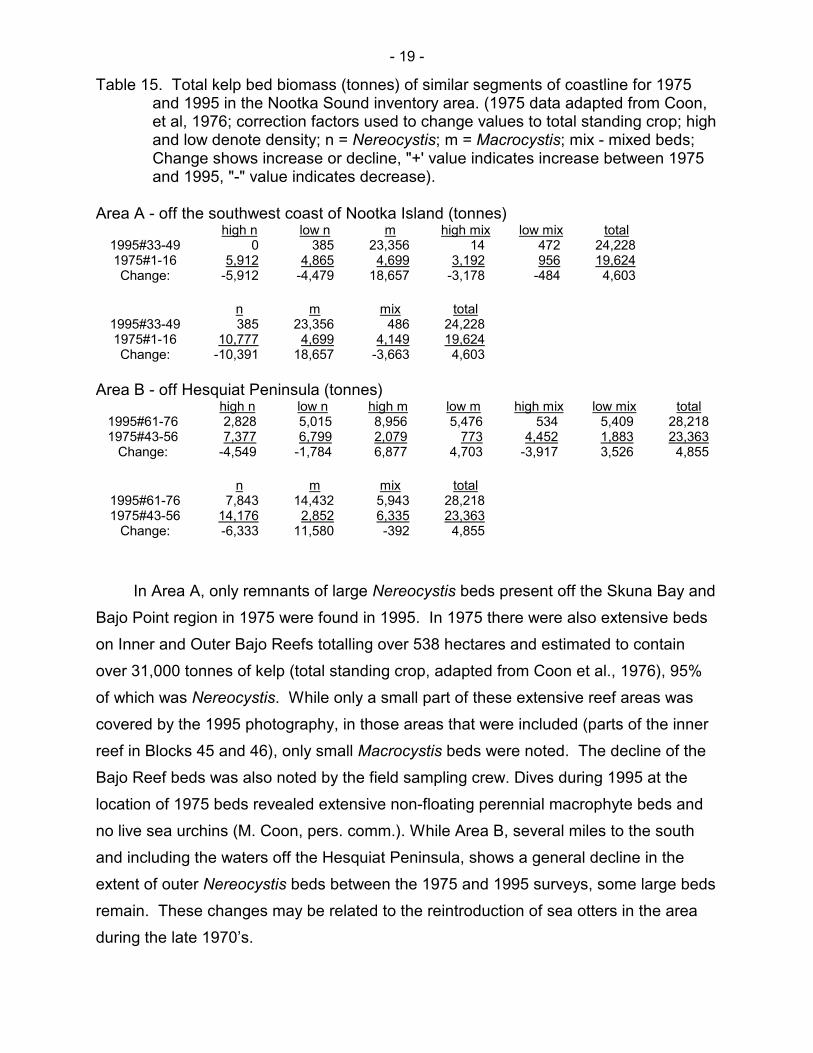
As summarized in Table 14, between 1975 and 1995 both areas have showndeclines in Nereocystis and mixed bed areas while Macrocystis bed areas haveremained relatively constant. Table 15 shows the declines in Nereocystis and mixedbed biomass resulting from the decreased bed area. An increase in Macrocystisbiomass result of higher density in 1995. Figures 2 and 3 show the changes graphicallyby area. Overall, in 1995 Areas A and B have shown decreases in total kelp bed areabut an increase in total kelp biomass. The increase in biomass indicates that the higherdensity estimated for 1995 over-rides the lower mean biomass per frond for Macrocystisas well as the lower Nereocystis and mixed bed areas and biomass reported for thatyear.
Figure 2. Pie charts show changes in bed areArea charts are proportional in size a
Nereo.
Macro.
Mixed
1975 Area A
1995 Area A
Kelp Bed Biomass
Kelp Bed Areaa and biomass by species for Area A.s are biomass charts.
Macro.
Nereo.
Mixed
1995 Area A1975 Area A
Figu
Tabl
Area
199197C
19919C
Area
199197
C
199197
C
Macro.
1
- 18 -
Kelp Bed Area
re 3. Pie charts show changes in bed area anArea charts are proportional in size as are
e 14. Kelp bed areas (hectares) of similar seg1995 in the Nootka Sound inventory area.al., 1976; high and low denote density; n =mixed beds; Change shows increase or debetween 1975 and 1995, "-" value indicate
A - off the southwest coast of Nootka Island high n low n high m l
5#33-49 0.00 15.00 110.47 15#1-16 68.90 184.29 132.35
hange: -68.90 -169.30 -21.88
n m mix5#33-49 15.00 218.89 6.75 275#1-16 253.19 207.83 100.88 5hange: -238.19 11.07 -94.13 -3
B - off the Hesquiat Peninsula (hectares)high n low n high m
5#61-76 22.01 139.56 83.945#43-56 88.13 228.62 73.67hange: -66.12 -89.06 10.27
n m mix5#61-76 161.56 135.25 78.84 35#43-56 316.74 143.34 206.67 6hange: -155.18 -8.08 -127.83 -2
Nereo.
Mixed1995 Area B
975 Area B
Macr
Kelp Bed Biomass
d biomass by species for Area B. biomass charts.
ments of coastline for 1975 and (1975 data adapted from Coon, et Nereocystis; m = Macrocystis; mix =cline, "+" value indicates increases decrease).
(hectares)ow m high mix low mix total08.42 0.13 6.62 240.6475.48 47.02 53.86 561.9032.94 -46.89 -47.24 -321.26
total40.6461.9021.26
low m high mix low mix total51.32 5.19 73.66 375.6669.67 64.64 142.03 666.75
-18.35 -59.46 -68.37 -291.09
total75.6666.7591.09
o.
Nereo.
Mixed 1995 Area B1975 Area B
- 19 -
Table 15. Total kelp bed biomass (tonnes) of similar segments of coastline for 1975and 1995 in the Nootka Sound inventory area. (1975 data adapted from Coon,et al, 1976; correction factors used to change values to total standing crop; highand low denote density; n = Nereocystis; m = Macrocystis; mix - mixed beds;Change shows increase or decline, "+' value indicates increase between 1975and 1995, "-" value indicates decrease).
Area A - off the southwest coast of Nootka Island (tonnes)high n low n m high mix low mix total
1995#33-49 0 385 23,356 14 472 24,2281975#1-16 5,912 4,865 4,699 3,192 956 19,624Change: -5,912 -4,479 18,657 -3,178 -484 4,603
n m mix total1995#33-49 385 23,356 486 24,2281975#1-16 10,777 4,699 4,149 19,624Change: -10,391 18,657 -3,663 4,603
Area B - off Hesquiat Peninsula (tonnes)high n low n high m low m high mix low mix total
1995#61-76 2,828 5,015 8,956 5,476 534 5,409 28,2181975#43-56 7,377 6,799 2,079 773 4,452 1,883 23,363
Change: -4,549 -1,784 6,877 4,703 -3,917 3,526 4,855
n m mix total1995#61-76 7,843 14,432 5,943 28,2181975#43-56 14,176 2,852 6,335 23,363
Change: -6,333 11,580 -392 4,855
In Area A, only remnants of large Nereocystis beds present off the Skuna Bay andBajo Point region in 1975 were found in 1995. In 1975 there were also extensive bedson Inner and Outer Bajo Reefs totalling over 538 hectares and estimated to containover 31,000 tonnes of kelp (total standing crop, adapted from Coon et al., 1976), 95%of which was Nereocystis. While only a small part of these extensive reef areas wascovered by the 1995 photography, in those areas that were included (parts of the innerreef in Blocks 45 and 46), only small Macrocystis beds were noted. The decline of theBajo Reef beds was also noted by the field sampling crew. Dives during 1995 at thelocation of 1975 beds revealed extensive non-floating perennial macrophyte beds andno live sea urchins (M. Coon, pers. comm.). While Area B, several miles to the southand including the waters off the Hesquiat Peninsula, shows a general decline in theextent of outer Nereocystis beds between the 1975 and 1995 surveys, some large bedsremain. These changes may be related to the reintroduction of sea otters in the areaduring the late 1970’s.
- 20 -
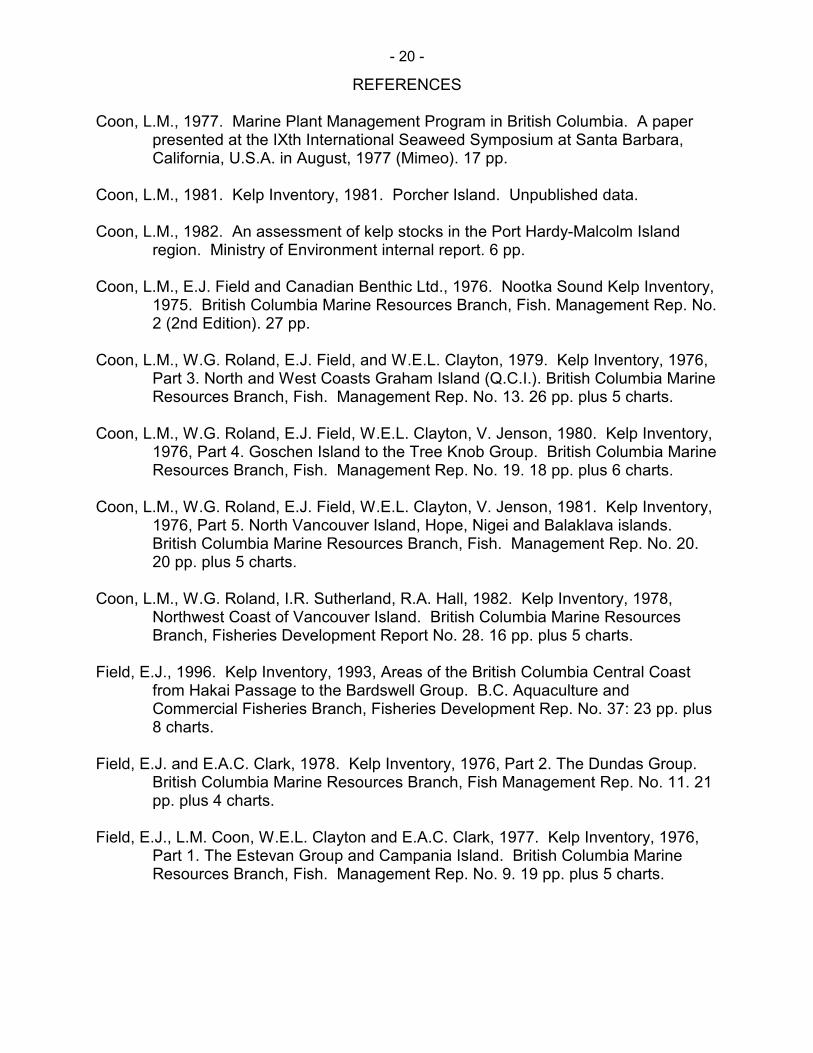
REFERENCES
Coon, L.M., 1977. Marine Plant Management Program in British Columbia. A paperpresented at the IXth International Seaweed Symposium at Santa Barbara,California, U.S.A. in August, 1977 (Mimeo). 17 pp.
Coon, L.M., 1981. Kelp Inventory, 1981. Porcher Island. Unpublished data.
Coon, L.M., 1982. An assessment of kelp stocks in the Port Hardy-Malcolm Islandregion. Ministry of Environment internal report. 6 pp.
Coon, L.M., E.J. Field and Canadian Benthic Ltd., 1976. Nootka Sound Kelp Inventory,1975. British Columbia Marine Resources Branch, Fish. Management Rep. No.2 (2nd Edition). 27 pp.
Coon, L.M., W.G. Roland, E.J. Field, and W.E.L. Clayton, 1979. Kelp Inventory, 1976,Part 3. North and West Coasts Graham Island (Q.C.I.). British Columbia MarineResources Branch, Fish. Management Rep. No. 13. 26 pp. plus 5 charts.
Coon, L.M., W.G. Roland, E.J. Field, W.E.L. Clayton, V. Jenson, 1980. Kelp Inventory,1976, Part 4. Goschen Island to the Tree Knob Group. British Columbia MarineResources Branch, Fish. Management Rep. No. 19. 18 pp. plus 6 charts.
Coon, L.M., W.G. Roland, E.J. Field, W.E.L. Clayton, V. Jenson, 1981. Kelp Inventory,1976, Part 5. North Vancouver Island, Hope, Nigei and Balaklava islands.British Columbia Marine Resources Branch, Fish. Management Rep. No. 20.20 pp. plus 5 charts.
Coon, L.M., W.G. Roland, I.R. Sutherland, R.A. Hall, 1982. Kelp Inventory, 1978,Northwest Coast of Vancouver Island. British Columbia Marine ResourcesBranch, Fisheries Development Report No. 28. 16 pp. plus 5 charts.
Field, E.J., 1996. Kelp Inventory, 1993, Areas of the British Columbia Central Coastfrom Hakai Passage to the Bardswell Group. B.C. Aquaculture andCommercial Fisheries Branch, Fisheries Development Rep. No. 37: 23 pp. plus8 charts.
Field, E.J. and E.A.C. Clark, 1978. Kelp Inventory, 1976, Part 2. The Dundas Group.British Columbia Marine Resources Branch, Fish Management Rep. No. 11. 21pp. plus 4 charts.
Field, E.J., L.M. Coon, W.E.L. Clayton and E.A.C. Clark, 1977. Kelp Inventory, 1976,Part 1. The Estevan Group and Campania Island. British Columbia MarineResources Branch, Fish. Management Rep. No. 9. 19 pp. plus 5 charts.
- 21 -
Foreman, R.E., 1975. KIM-1. A method for inventory of floating kelps and itsapplication to selected areas of Kelp License Area 12. Benthic EcologicalResearch Program Report 75-1. Report to Federal Fisheries and MarineService and Provincial Marine Resources Branch. 81 pp.
Foreman, R.E., 1979. Supplementary evaluation of the KIM-1 Method for Nereocystis.Benthic Ecological Research Program Report 79-2. 18 pp.
Foreman, R.E., E. Cabot and B. Oates, 1982. Studies on Nereocystis luetkeana I:Annual and seasonal dynamics of the floating kelp beds off the northwest coastof Malcolm Island. Report to the B.C. Marine Resources Branch, Ministry ofEnvironment. 54 pp.
Foreman, R.E., 1984. Studies on Nereocystis growth in British Columbia.Hydrobiologia 116/117, 325-332.
Sutherland, I.R., 1989. Kelp Inventory, 1988 Juan de Fuca Strait. B.C. Aquacultureand Commercial Fisheries Branch, Fisheries Development Rep. No. 35. 18 pp.plus 6 charts.
Sutherland, I.R., 1990. Kelp Inventory, 1989 The Vancouver Island and Malcolm Islandshores of Queen Charlotte Strait, including a summary of historical inventoryinformation for the area. B.C. Aquaculture and Commercial Fisheries Branch,Fisheries Development Rep. No. 36. 41 pp. plus 3 charts.
- 22 -
APPENDIX
Charts on Sheets 1 through 5 are enclosed in the following envelope in reduced format.Charts at 1:20,000 scale are available by special request from the Ministry.