Embed Size (px)
Citation preview
1
Economic Feasibility of Sustainable High Oilseed-Based Biofuel Production:
The Case for Biodiesel in North Carolina
Anthony Yeboah, Cephas Naanwaab, Osei Yeboah, John Owens, and J. Bynum
Department of Agribusiness, Applied Economics and Agriscience Education.
North Carolina A&T State University. 1601 E Market St, Greensboro, NC 27411.
Selected Paper prepared for presentation at the Southern Agricultural Economics Association
Annual Meeting, Birmingham, AL, February 4-7, 2012
Copyright 2012 by A.Yeboah, C. Naanwaab, O. Yeboah, J. Owens, and J. Bynum. All rights reserved. Readers
may make verbatim copies of this document for non-commercial purposes by any means, provided
this copyright notice appears on all such copies.
Corresponding author. Email: [email protected]
2
Abstract
We assess the economic feasibility of a 10 MMGY biodiesel plant using a Monte Carlo Cash
Flow model programmed in Excel using @Risk, a simulation and risk analysis software. The
model incorporates stochastic components to capture uncertainty in the analysis. The stochastic
components are mainly variables that may exhibit risk, such as input prices, output prices, and
expected revenues, and these are assigned probability distributions in the model. The model is
programmed with three output variables: stream of revenues, profits/loss, and the resulting net
present value (NPV) over ten year forecast period.
Results from the cash flow analysis show that average expected revenues from the sale of
biodiesel and co-products will be $48.5 million and total operating costs of $42.05 million per
year. The economic feasibility of this biodiesel production plant is determined from the model
calibration and sensitivity analysis. Using a discount rate of 7.5%, the simulated average NPV is
$16.8 million and since this is positive, it indicates the project may be economically feasible
subject to model assumptions. We find that the likelihood of the NPV greater than zero is 61%
on average. Sensitivity and scenario analysis show that the NPV is most affected by fluctuations
in biodiesel price, canola seed price, and the price of seed meal.
3
Economic Feasibility of Sustainable High Oilseed-Based Biofuel Production:
The Case for Biodiesel in North Carolina
Introduction
Much of the renewable fuel produced in the U.S. is ethanol, although biodiesel production has
been increasing rapidly in the past decade (Outlaw et al., 2007). Both ethanol and biodiesel
have experienced significant increases in number of plants in operation or under construction in
response to the passage of the Renewable Fuel Standard (RFS) and Energy Independence and
Security Act (EISA) of 2007. Corn-based ethanol production is becoming less profitable due to
rising corn prices. At the current rate, ethanol production from corn is expected to more than
double from the current 6.5 billion gallons to 15 billion gallons by 2015 (BR&DB, 2008). This
level of ethanol production would require about 42% of 2007 corn crop to be devoted to ethanol
production (WASDE, 2008). This would fuel more corn price increases, making ethanol
production from corn less competitive. Currently, over 97 percent of ethanol production in the
U.S. uses corn (BR&DB, 2008), representing about 20% of the U.S. corn crop.
While ethanol remains the leading biofuel produced in the U.S., there is potential for
biodiesel production to catch-up or outpace ethanol production, especially as corn price
continues its upward trajectory. Ethanol production increased from 3.4 billion gallons in 2004
to 8.9 billion gallons in 2008, representing an increase of 161%. In the same period, biodiesel
production increased from 23 million gallons to 691million gallons, a whopping increase of
2,900%.
Among first generation biofuels, biodiesel production from oilseeds such as soybean,
canola (also known as rapeseed), sunflower and other vegetable oils is gaining popularity.
4
Second generation biofuels, mainly cellulosic sources such as corn stovers, rice and wheat straw,
wood biomass, and energy grasses (e.g.switchgrass and miscanthus), are equally gaining traction,
albeit with a higher per unit production cost than ethanol production using corn.
Objective
We assess the economic feasibility of a proposed biodiesel plant in North Carolina that uses
canola seeds as primary feedstocks. Our analysis is based on a 10 million gallon per year
(MMGY) operating capacity. We perform a stochastic Monte Carlo financial simulation using
historical data on biodiesel and seed meal prices, as well as costs of feedstocks, to determine the
economic feasibility of the proposed plant.
Canola Seeds as feedstocks
Biodiesel production in the State of North Carolina relies on eight small-scale plants that use
mainly waste vegetable oils (WVOs) and animal fats as feedstock (Table 1). The plant with the
largest production capacity in the state is Patriot Biodiesel LLC, located in Greensboro, North
Carolina. With a capacity of 6.5 MMGY, this plant uses multi-feedstock, but waste vegetable
oils from restaurants form the major feedstock. Several plants, capacity ranging from 5 to 15
MMGY, are either under construction or being planned in the state. Soybean, one of the major
oil-seeds for biodiesel production, is grown in the state, albeit not by any means large enough to
feed the planned increases in biodiesel production. As a result, canola (Canadian oil low acid),
so named because of its low erucic acid content, has become a candidate oil-seed crop for
biodiesel production in North Carolina. Canola is an improved cultivar from cross-breeding of
four main Brassica oil-seed species, namely, rapeseed (Brassica napus), field mustard (B. rapa),
Indian mustard (B. juncea), and Ethiopian mustard (B. carinata).
5
Nationally, there are 5 biodiesel plants that use canola oil as feedstock—these include,
Archer Daniels Midland Co. of North Dakota (with operating capacity of 85 MMGY), Double
Diamond Energy Inc. of Texas (operating capacity 30 MMGY), Inland Empire Oilseeds of
Washington (operating capacity 8 MMGY), and Sun Power Biodiesel LLC of Wyoming
(capacity 5 MMGY). Many other plants use some combination of multi-feedstocks that include
canola, soy oil, and other vegetable oils. Agrigold Renewables in Texas uses sunflower oil and
yellow grease to operate its 2 MMGY plant. According to data on plant capacity and utilization
provided by the National Biodiesel Board (2008), soybean oil is the predominant feedstock
choice for most of the biodiesel plants in the U.S. accounting for about 40% of biodiesel
feedstock. Canola accounts for about 5% and recycled and waste vegetable oils make up less
than 1 percent of feedstock. Canola and sunflowers have an oil content of 40%, while soybeans
have 20%, thus capital and operational costs for the former oilseeds are lower (they require less
extruder and press capacity) than the latter (Bender, 1999). However, soybean byproduct—meal
cake—has a higher monetary value than canola and sunflower meals.
Canola oil has been proven to be an excellent feedstock for biodiesel production (George
et al., 2008). EPA (2010) cleared canola oil as an approved biodiesel pathway; in its findings,
the EPA states that canola oil biodiesel pathway creates a 50 percent reduction in greenhouse gas
emissions compared to conventional diesel fuel baseline. The EPA study conducted a life cycle
analysis on biodiesel production from canola oil and found canola oil has high conversion
efficiencies compared to biodiesel produced from soy bean oil. They found that a pound of
canola produces 0.40 pounds of oil compared to 0.18 pounds from soy beans. Moreover, canola
biodiesel has a higher cetane number than soy biodiesel and petroleum-based diesel (56, 47, and
43, respectively). The higher cetane number of canola biodiesel gives better engine efficiency
6
such as easier starting, quieter engine operation and lower engine temperatures (George et al.,
2008). Thus canola oil now meets the standard as an advanced biofuel under the Energy
Independence and Security Act of 2007.
Canola has been trialed and found to grow well in North Carolina as a winter annual
crop. Its production practices are much similar to winter wheat, and thus, farmers who already
grow winter wheat in the state could grow canola. The soil and fertilizer requirements of canola
are similar to those of winter wheat (George et al., 2008). Besides, canola is a good choice for
biodiesel production because it gives a better oil yield per acre, more than twice that of soybean
(approximately 110 gallons per acre versus 45 gallons per acre). A proposed canola farmers’
cooperative association is under formation by researchers at North Carolina A&T State
University. The proposed canola farmers’ cooperative will grow canola to feed a 10 MMGY
biodiesel plant.
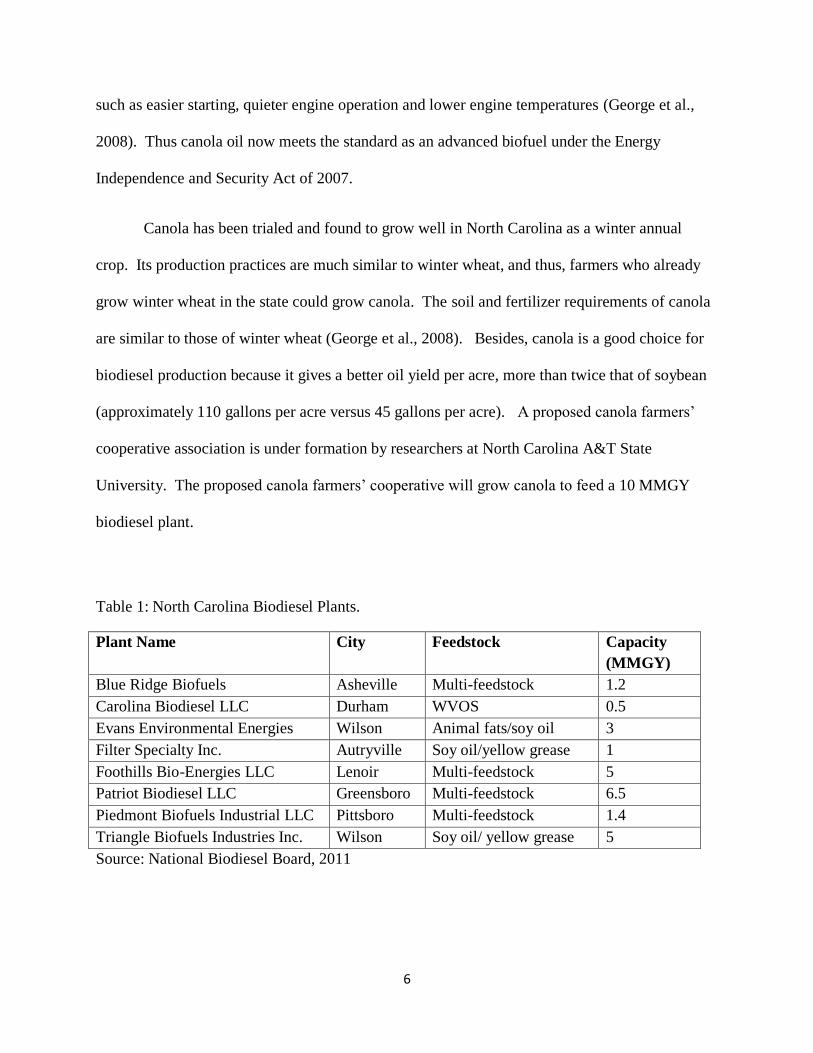
Table 1: North Carolina Biodiesel Plants.
Plant Name City Feedstock Capacity
(MMGY)
Blue Ridge Biofuels Asheville Multi-feedstock 1.2
Carolina Biodiesel LLC Durham WVOS 0.5
Evans Environmental Energies Wilson Animal fats/soy oil 3
Filter Specialty Inc. Autryville Soy oil/yellow grease 1
Foothills Bio-Energies LLC Lenoir Multi-feedstock 5
Patriot Biodiesel LLC Greensboro Multi-feedstock 6.5
Piedmont Biofuels Industrial LLC Pittsboro Multi-feedstock 1.4
Triangle Biofuels Industries Inc. Wilson Soy oil/ yellow grease 5
Source: National Biodiesel Board, 2011
7
Biodiesel Production
Biodiesel, an alcohol ester, is a renewable fuel produced from vegetable oils or animal fats
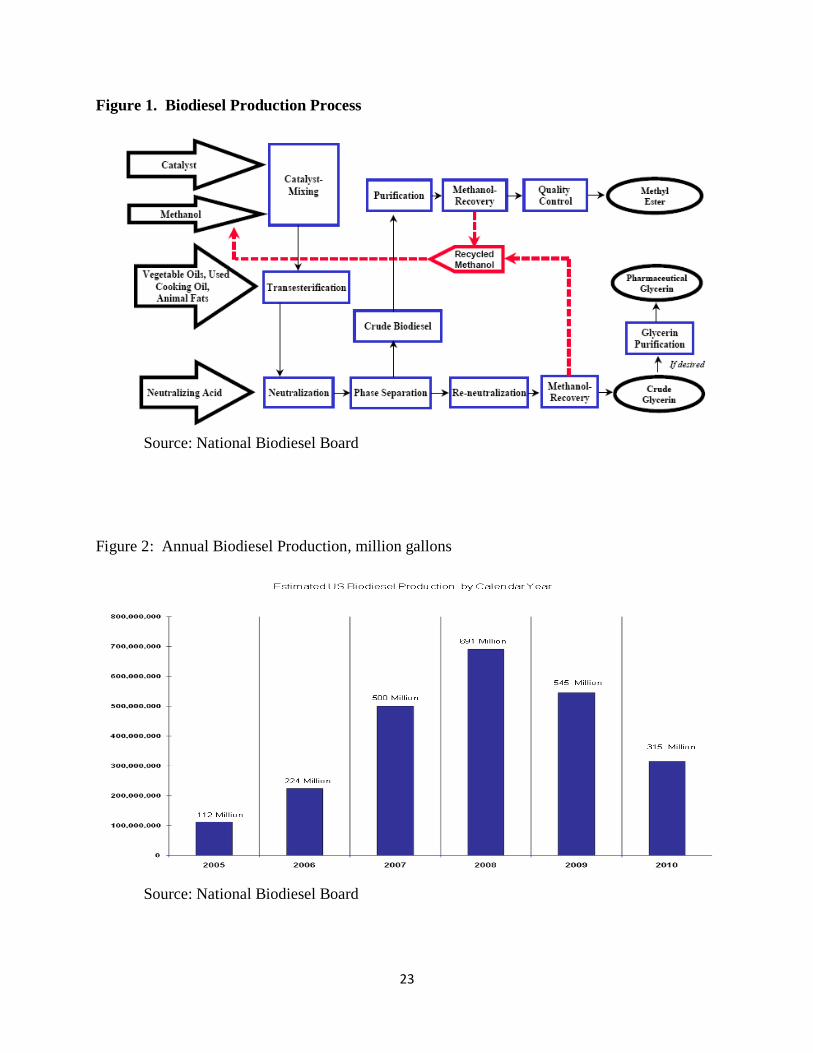
(Bender, 1999). Biodiesel is made through a chemical process called transesterification (Figure
1), in which methanol/ethanol reacts with triglycerides resulting in methyl/ethyl esters (Barnwal
and Sharma, 2004). As Figure 1 indicates, the process of producing biodiesel is to transesterify
triacylglycerols in vegetable oils or animal fats with an alcohol (commonly methanol), in the
presence of an alkali or acid catalyst (Zhang et al., 2003). The commonest alcohol used in
biodiesel production is methanol owing to its lower cost. The resulting products are methyl
ester (biodiesel), a co-product (crude glycerin), and some waste. The commonest used catalyst is
either sodium hydroxide (NaOH) or potassium hydroxide (KOH).
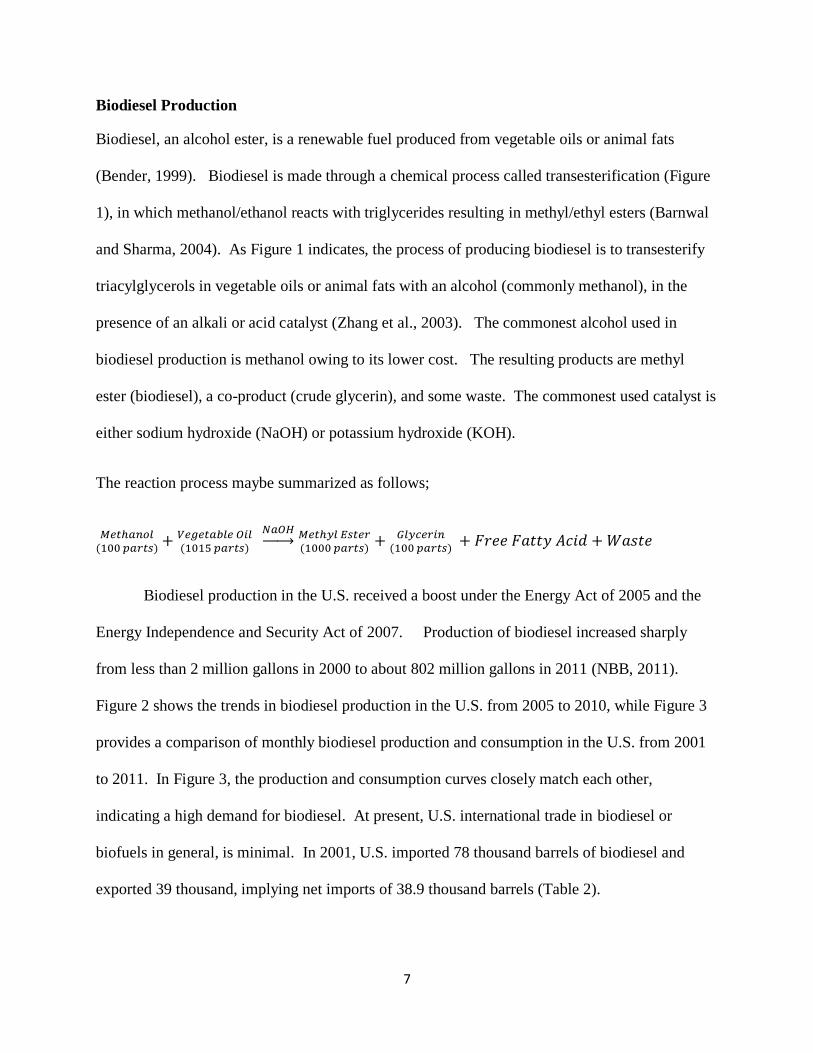
The reaction process maybe summarized as follows;
Biodiesel production in the U.S. received a boost under the Energy Act of 2005 and the
Energy Independence and Security Act of 2007. Production of biodiesel increased sharply
from less than 2 million gallons in 2000 to about 802 million gallons in 2011 (NBB, 2011).
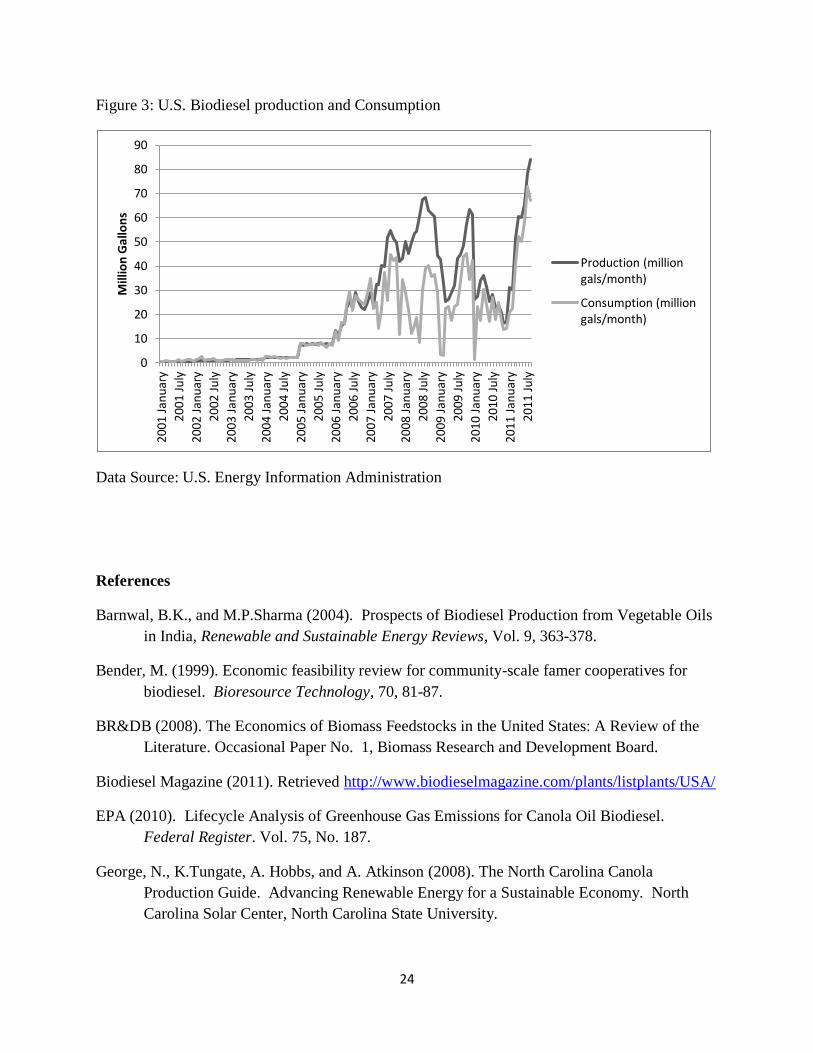
Figure 2 shows the trends in biodiesel production in the U.S. from 2005 to 2010, while Figure 3
provides a comparison of monthly biodiesel production and consumption in the U.S. from 2001
to 2011. In Figure 3, the production and consumption curves closely match each other,
indicating a high demand for biodiesel. At present, U.S. international trade in biodiesel or
biofuels in general, is minimal. In 2001, U.S. imported 78 thousand barrels of biodiesel and
exported 39 thousand, implying net imports of 38.9 thousand barrels (Table 2).
8
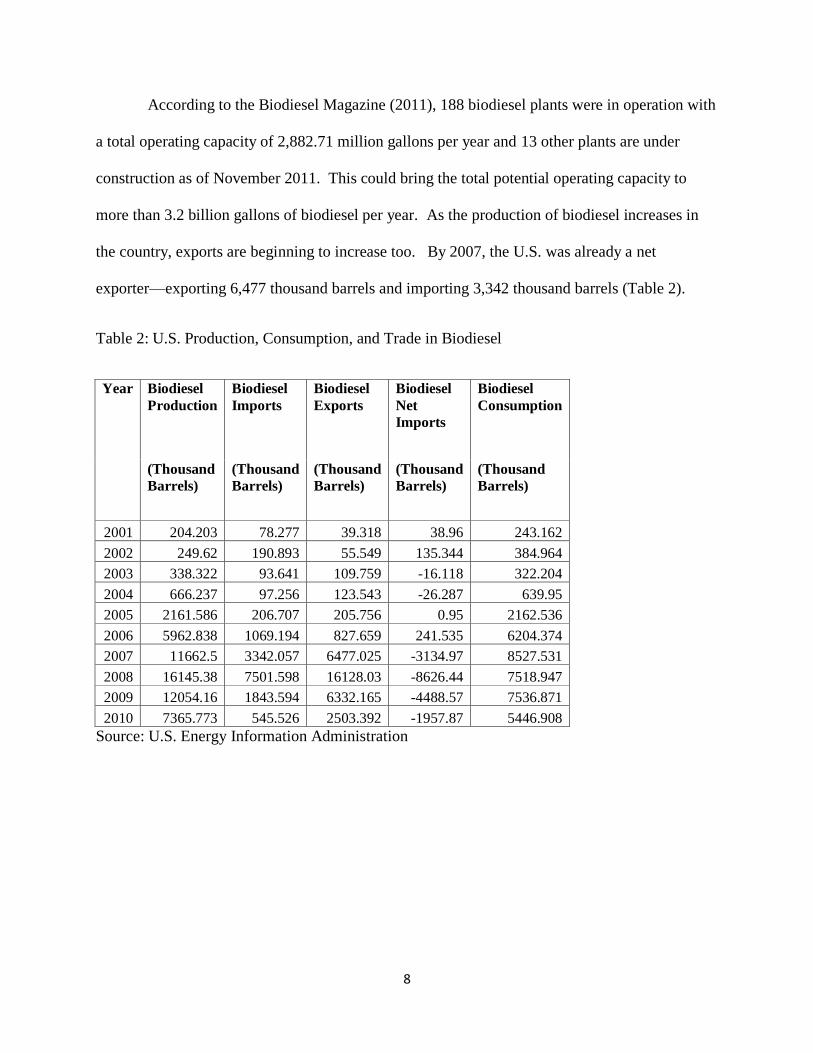
According to the Biodiesel Magazine (2011), 188 biodiesel plants were in operation with
a total operating capacity of 2,882.71 million gallons per year and 13 other plants are under
construction as of November 2011. This could bring the total potential operating capacity to
more than 3.2 billion gallons of biodiesel per year. As the production of biodiesel increases in
the country, exports are beginning to increase too. By 2007, the U.S. was already a net
exporter—exporting 6,477 thousand barrels and importing 3,342 thousand barrels (Table 2).
Table 2: U.S. Production, Consumption, and Trade in Biodiesel
Year Biodiesel
Production
Biodiesel
Imports
Biodiesel
Exports
Biodiesel
Net
Imports
Biodiesel
Consumption
(Thousand
Barrels)
(Thousand
Barrels)
(Thousand
Barrels)
(Thousand
Barrels)
(Thousand
Barrels)
2001 204.203 78.277 39.318 38.96 243.162
2002 249.62 190.893 55.549 135.344 384.964
2003 338.322 93.641 109.759 -16.118 322.204
2004 666.237 97.256 123.543 -26.287 639.95
2005 2161.586 206.707 205.756 0.95 2162.536
2006 5962.838 1069.194 827.659 241.535 6204.374
2007 11662.5 3342.057 6477.025 -3134.97 8527.531
2008 16145.38 7501.598 16128.03 -8626.44 7518.947
2009 12054.16 1843.594 6332.165 -4488.57 7536.871
2010 7365.773 545.526 2503.392 -1957.87 5446.908
Source: U.S. Energy Information Administration
9
Biodiesel Production Costs
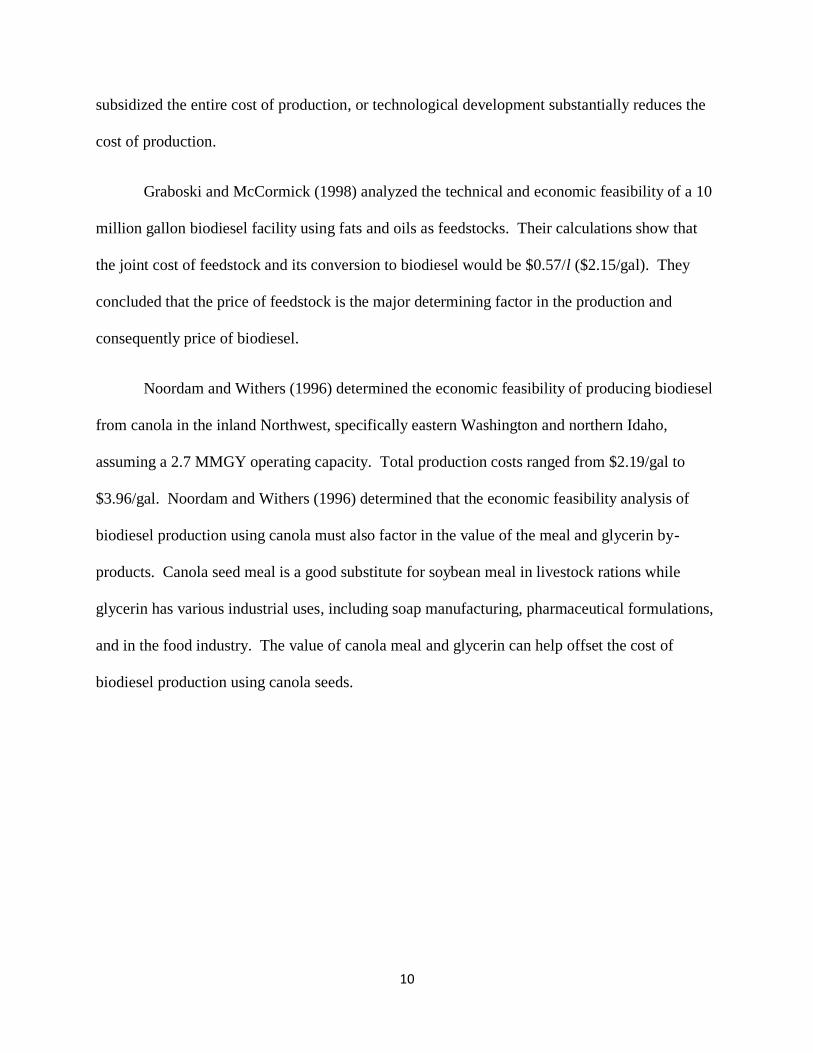
Estimates show that biodiesel production using oilseeds is more costly than ethanol production
from corn and cellulosic sources (Table 3). In the U.S. it costs $2.50 to produce a gallon of
biodiesel from soybean oil compared to $1.50 to produce ethanol from corn. In the EU, it will
cost $3.29 to produce a gallon of biodiesel using rapeseed. Conventional diesel and gasoline
costs per gallon are $1.50 and $1.29 respectively. Haas et al. (2006) in their study of a medium-
sized industrial biodiesel production facility estimated that the cost per gallon ranges from $1.48
(if degummed soybean cost 33 cents per kg) to $2.96 (if degummed soybean costs 77 cents per
kg). For their 10 MMGY plant, estimated investment costs were $11.5 million ($1.12 per
gallon), operating cost of 27.1 cents per gallon, and capital cost of 15 percent rate of return,
assuming a 10-year life span. The co-product, glycerin, priced at 33 cents per kg, would provide
a credit of 12.8 cents gallon, which could reduce production costs by about 6%.
Bender (1999) reviewed 12 studies on the economic feasibility of biodiesel production.
Estimated cost of production (including cost of feedstock and conversion to biodiesel) ranged
from $0.30/l ($1.14/gal) for biodiesel from soybeans to $0.69/l ($2.62/gal) for biodiesel
produced from rapeseed. Bender also reviewed the economics of biodiesel from canola and
sunflower, through a farmers’ cooperative in Austria that has 290 members and grows about 430
ha of canola and sunflowers with an average yield of 3 t/ha. This is a government subsidized
cooperative which enables farmers to grow canola on set-aside lands. At a canola price of
$106/t, and 3000 kg of canola required to produce 1000 l of biodiesel, Bender’s calculations
show that the cost of canola feedstock was $0.32/l biodiesel. This translates into a capital and
operating cost of $0.86/l ($3.26/gal) of biodiesel. At these costs, Bender concluded that
biodiesel production from these oilseeds was not economically feasible, unless the government
10
subsidized the entire cost of production, or technological development substantially reduces the
cost of production.
Graboski and McCormick (1998) analyzed the technical and economic feasibility of a 10
million gallon biodiesel facility using fats and oils as feedstocks. Their calculations show that
the joint cost of feedstock and its conversion to biodiesel would be $0.57/l ($2.15/gal). They
concluded that the price of feedstock is the major determining factor in the production and
consequently price of biodiesel.
Noordam and Withers (1996) determined the economic feasibility of producing biodiesel
from canola in the inland Northwest, specifically eastern Washington and northern Idaho,
assuming a 2.7 MMGY operating capacity. Total production costs ranged from $2.19/gal to
$3.96/gal. Noordam and Withers (1996) determined that the economic feasibility analysis of
biodiesel production using canola must also factor in the value of the meal and glycerin by-
products. Canola seed meal is a good substitute for soybean meal in livestock rations while
glycerin has various industrial uses, including soap manufacturing, pharmaceutical formulations,
and in the food industry. The value of canola meal and glycerin can help offset the cost of
biodiesel production using canola seeds.
11
Table 3: Cost of Biofuel production from selected feedstocks
Biofuel/Country Feedstock Feedstock (% of total) Total production costs
Biodiesel Percent $ per gallon
United States Soybean Oil 80-85 2.50
Malaysia Palm Oil 80-85 2.04
EU Rapeseed 80-85 3.29
India Jatropha 80-85 1.99
Diesel
United States Diesel 75 1.50
Ethanol
United States Corn 39-50 1.50
United States Cellulosic sources 90 2.69
Brazil Sugarcane 37 0.98
EU Wheat 68 2.23
EU Sugar beets 34 2.88
Gasoline
United States Gasoline 73 1.29
Source: IMF, 2007; BR&DB, 2008
Data and Methods
In analyzing project returns under conditions of uncertainty, Reutlinger (1970) proposed the use
of probability distributions to estimate the net present value of an investment. Monte Carlo
simulations have become one of the preferred methods for analyzing investments under
conditions of risk and uncertainty (Richardson and Mapp, 1976). In Monte Carlo analysis,
stochastic variables that affect the investment’s returns are assigned objective or subjective
probability distributions, so that during the simulations, random values are drawn repeatedly
from these distributions to determine the probability distribution of the net present value of the
12
investment. Outlaw et al. (2007) describe the net present value (NPV) as a good measure for
determining the overall economic feasibility of a proposed investment.
Richardson and Mapp (1976) describe the probability of economic success as the
probability that the NPV is greater than zero, with the reason that if the NPV>0, then the
investment will yield a return (IRR) that exceeds the investor’s discount rate or opportunity cost
of capital. For example, if the probability that the NPV>0 from an investment is found to be
90% at a discount rate of 5%, it means that there is a 90% chance that the project will be
economically successful and will generate a rate of return exceeding 5%. Richardson and Mapp
further outline the steps involved in a Monte Carlo simulation model to generate probabilistic
cash flows for business decision-making.
The simulation model we use in this paper is an annual Monte Carlo Cash Flow model
which is calibrated to historical data of biodiesel prices, input prices, and other operating
expenses. Where there is no data on these variables for North Carolina, we use comparable
national averages as proxies. Our Monte Carlo Cash Flow model is programmed in Excel using
@Risk (http://www.palisade.com/risk/), a simulation and risk analysis software that is an add-in
to excel. The model incorporates stochastic components to capture uncertainty or risk in the
analysis. The stochastic components are variables that may exhibit risks, such as input and
output prices. The risky variables are assigned probability distributions in the model based on
objective (using historical data) or subjective judgment of the researchers (Table 4).
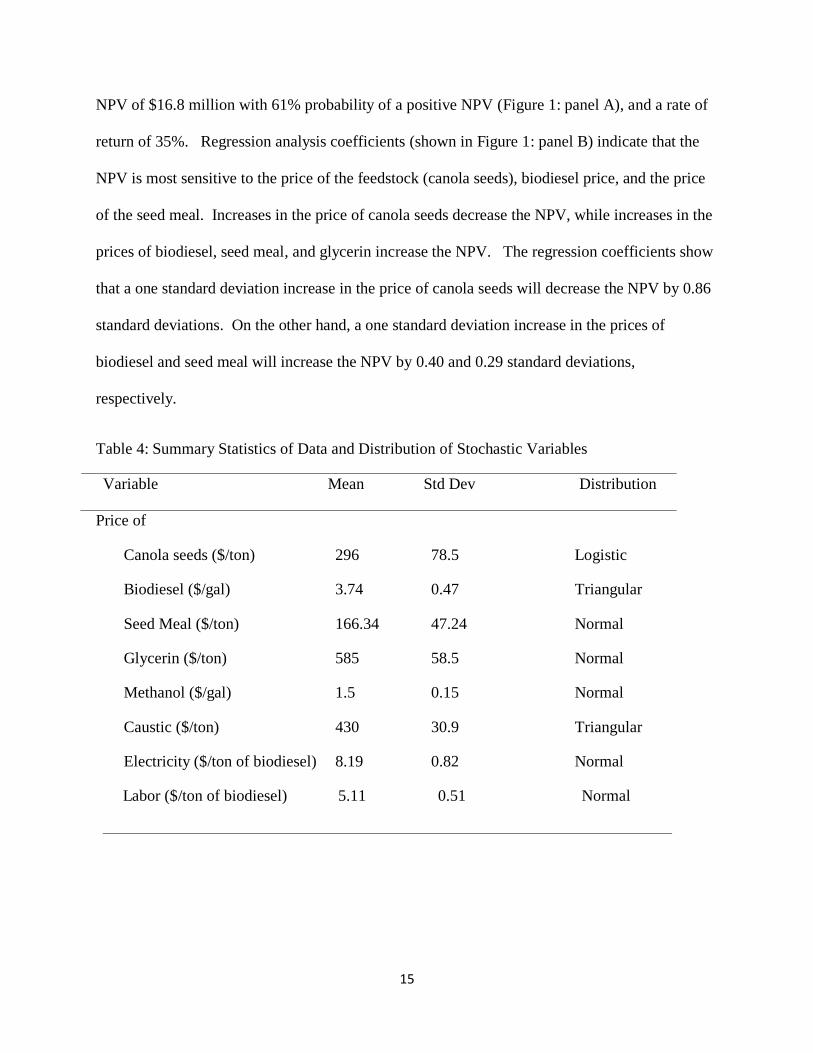
Using @Risk distribution fitting tools, we determine the historical price of canola seeds
follows a logistic distribution. Price of biodiesel follows a triangular distribution with three
parameters; minimum ($3.08/gal), mean ($3.74/gal), and maximum ($5.07/gal). Prices of seed
13
meal and glycerin co-products are assumed to be normally distributed. The model is
programmed with three output variables— stream of revenues over ten years, stream of
profits/loss over ten year period, and the resulting net present value (NPV). The NPV is
computed as the average discounted net cash flows (DCF) less the initial equity investment, as
defined below. An NPV value greater than zero indicates that the project can be economically
feasible subject to model assumptions (Table 5). The most important output variable in this
simulation analysis is the NPV which determines the economic viability of the proposed plant
(Richardson and Mapp, 1976; Palma et al., 2011).
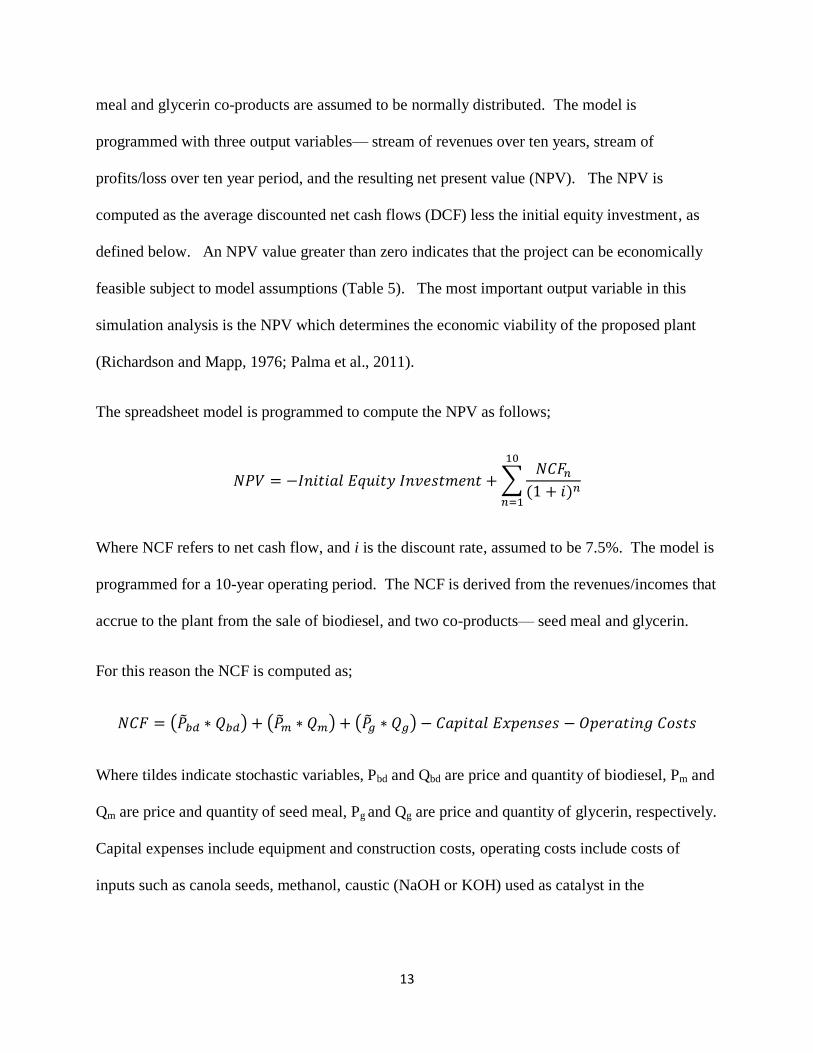
The spreadsheet model is programmed to compute the NPV as follows;
Where NCF refers to net cash flow, and i is the discount rate, assumed to be 7.5%. The model is
programmed for a 10-year operating period. The NCF is derived from the revenues/incomes that
accrue to the plant from the sale of biodiesel, and two co-products— seed meal and glycerin.
For this reason the NCF is computed as;
Where tildes indicate stochastic variables, Pbd and Qbd are price and quantity of biodiesel, Pm and
Qm are price and quantity of seed meal, Pg and Qg are price and quantity of glycerin, respectively.
Capital expenses include equipment and construction costs, operating costs include costs of
inputs such as canola seeds, methanol, caustic (NaOH or KOH) used as catalyst in the
14
transesterification process. Other operating expenses are labor, electricity, steam, repairs and
maintenance, and overhead costs. Table 4 presents the summary statistics of these variables.
Results and Discussion
The Monte Carlo model is programmed under assumptions presented in Table 5. The 10
MMGY canola biodiesel plant is assumed to have a daily crushing capacity of 320 tons. With an
annual crushing capacity of 97,280 tons, oil extraction rate of 44%, and efficiency of 90%, the
plant is expected to produce 38,523 tons of oil, which yields 10 M gallons of biodiesel per year.
The production of biodiesel will generate two co-products, seed meal and glycerin. Under the
assumed operating capacity, 54,477 tons of seed meal, and 3,500 tons of glycerin will be
produced per annum. These co-products are expected to add to the revenues generated from the
sale of biodiesel.
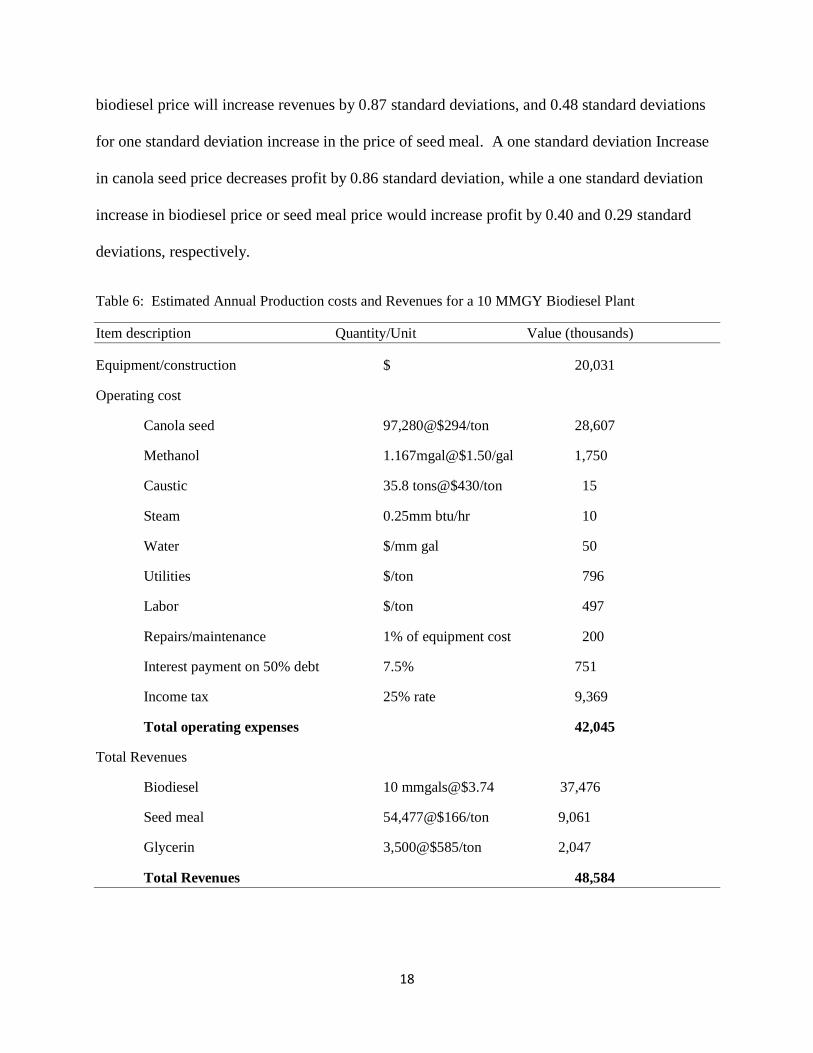
Mean values for estimated revenues and costs of production are summarized in Table 6.
For our 10MMGY canola biodiesel plant, we estimate initial equipment and construction costs
(one-time investment cost) of $20.03 million ($2/gal), while annual operating cost will average
about $42.05 million. Total revenues from sale of biodiesel will average $37.5 million per year,
sale of seed meal will average $9 million per year, and sale of glycerin will bring in $2 million
per year. Thus, the average total revenues per year will amount to about $48.5 million (Table 6).
This implies a net income of $6.45 million per year.
For purposes of determining the economic viability of the project, we performed Monte
Carlo simulations with 1000 iterations using the model assumptions. The simulations were
programmed over a ten year project operating period. The simulation results indicate an average
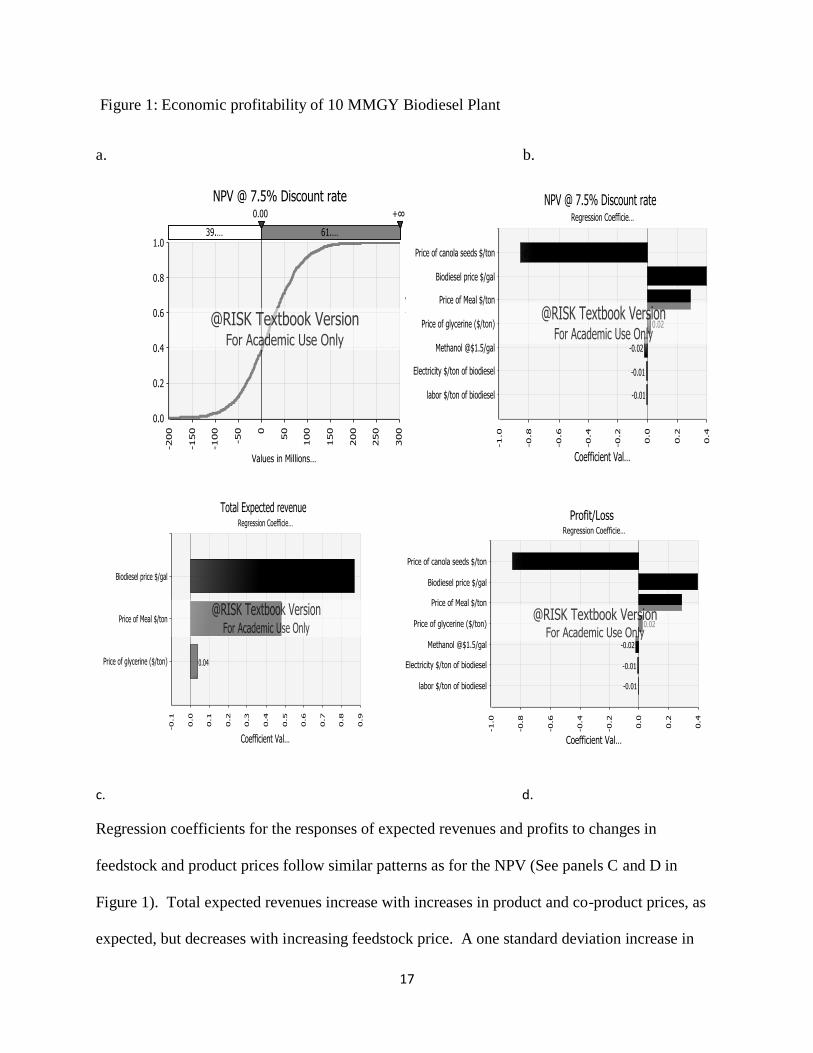
15
NPV of $16.8 million with 61% probability of a positive NPV (Figure 1: panel A), and a rate of
return of 35%. Regression analysis coefficients (shown in Figure 1: panel B) indicate that the
NPV is most sensitive to the price of the feedstock (canola seeds), biodiesel price, and the price
of the seed meal. Increases in the price of canola seeds decrease the NPV, while increases in the
prices of biodiesel, seed meal, and glycerin increase the NPV. The regression coefficients show
that a one standard deviation increase in the price of canola seeds will decrease the NPV by 0.86
standard deviations. On the other hand, a one standard deviation increase in the prices of
biodiesel and seed meal will increase the NPV by 0.40 and 0.29 standard deviations,
respectively.
Table 4: Summary Statistics of Data and Distribution of Stochastic Variables
Variable Mean Std Dev Distribution
Price of
Canola seeds ($/ton) 296 78.5 Logistic
Biodiesel ($/gal) 3.74 0.47 Triangular
Seed Meal ($/ton) 166.34 47.24 Normal
Glycerin ($/ton) 585 58.5 Normal
Methanol ($/gal) 1.5 0.15 Normal
Caustic ($/ton) 430 30.9 Triangular
Electricity ($/ton of biodiesel) 8.19 0.82 Normal
Labor ($/ton of biodiesel) 5.11 0.51 Normal
16
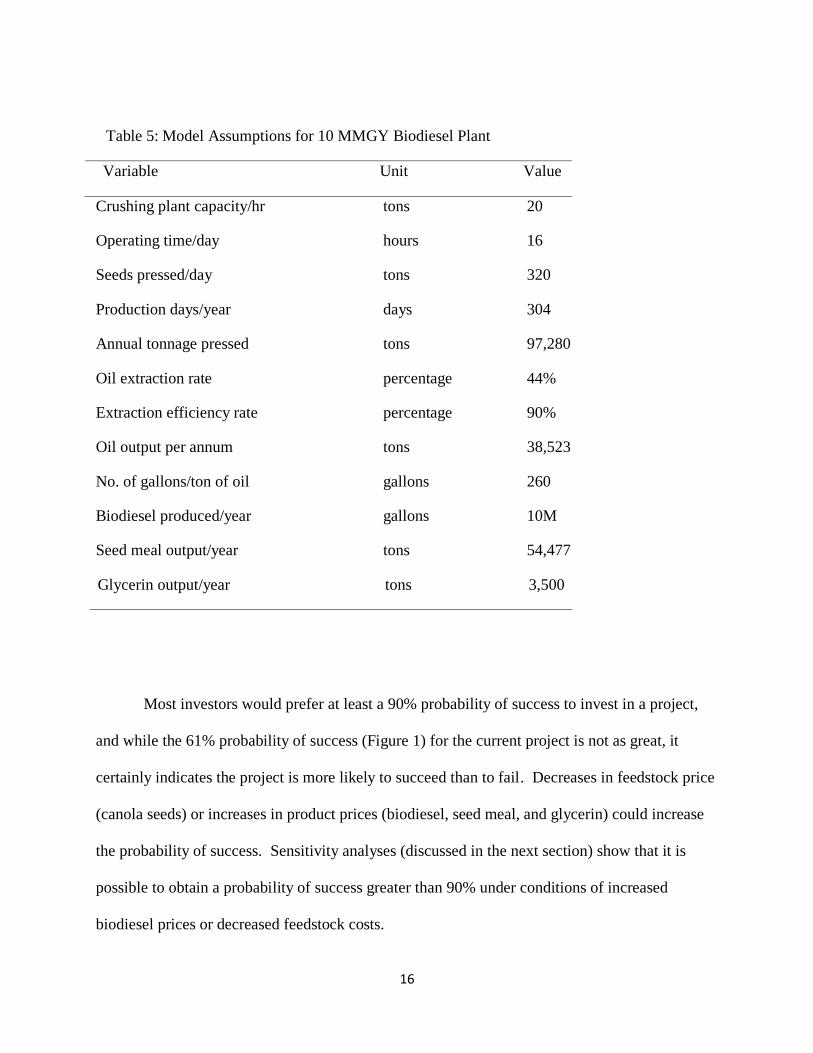
Table 5: Model Assumptions for 10 MMGY Biodiesel Plant
Variable Unit Value
Crushing plant capacity/hr tons 20
Operating time/day hours 16
Seeds pressed/day tons 320
Production days/year days 304
Annual tonnage pressed tons 97,280
Oil extraction rate percentage 44%
Extraction efficiency rate percentage 90%
Oil output per annum tons 38,523
No. of gallons/ton of oil gallons 260
Biodiesel produced/year gallons 10M
Seed meal output/year tons 54,477
Glycerin output/year tons 3,500
Most investors would prefer at least a 90% probability of success to invest in a project,
and while the 61% probability of success (Figure 1) for the current project is not as great, it
certainly indicates the project is more likely to succeed than to fail. Decreases in feedstock price
(canola seeds) or increases in product prices (biodiesel, seed meal, and glycerin) could increase
the probability of success. Sensitivity analyses (discussed in the next section) show that it is
possible to obtain a probability of success greater than 90% under conditions of increased
biodiesel prices or decreased feedstock costs.
17
Figure 1: Economic profitability of 10 MMGY Biodiesel Plant
a. b.
c. d.
Regression coefficients for the responses of expected revenues and profits to changes in
feedstock and product prices follow similar patterns as for the NPV (See panels C and D in
Figure 1). Total expected revenues increase with increases in product and co-product prices, as
expected, but decreases with increasing feedstock price. A one standard deviation increase in
18
biodiesel price will increase revenues by 0.87 standard deviations, and 0.48 standard deviations
for one standard deviation increase in the price of seed meal. A one standard deviation Increase
in canola seed price decreases profit by 0.86 standard deviation, while a one standard deviation
increase in biodiesel price or seed meal price would increase profit by 0.40 and 0.29 standard
deviations, respectively.
Table 6: Estimated Annual Production costs and Revenues for a 10 MMGY Biodiesel Plant
Item description Quantity/Unit Value (thousands)
Equipment/construction $ 20,031
Operating cost
Canola seed 97,280@$294/ton 28,607
Methanol 1.167mgal@$1.50/gal 1,750
Caustic 35.8 tons@$430/ton 15
Steam 0.25mm btu/hr 10
Water $/mm gal 50
Utilities $/ton 796
Labor $/ton 497
Repairs/maintenance 1% of equipment cost 200
Interest payment on 50% debt 7.5% 751
Income tax 25% rate 9,369
Total operating expenses 42,045
Total Revenues
Biodiesel 10 mmgals@$3.74 37,476
Seed meal 54,477@$166/ton 9,061
Glycerin 3,500@$585/ton 2,047
Total Revenues 48,584
19
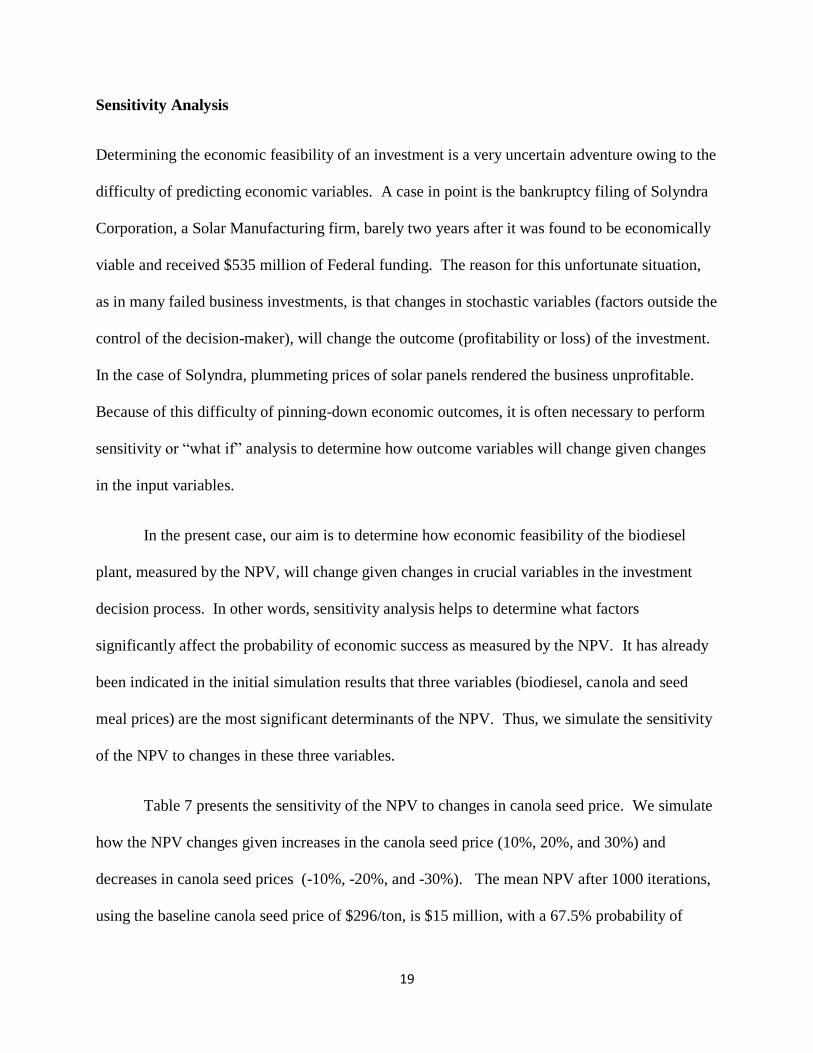
Sensitivity Analysis
Determining the economic feasibility of an investment is a very uncertain adventure owing to the
difficulty of predicting economic variables. A case in point is the bankruptcy filing of Solyndra
Corporation, a Solar Manufacturing firm, barely two years after it was found to be economically
viable and received $535 million of Federal funding. The reason for this unfortunate situation,
as in many failed business investments, is that changes in stochastic variables (factors outside the
control of the decision-maker), will change the outcome (profitability or loss) of the investment.
In the case of Solyndra, plummeting prices of solar panels rendered the business unprofitable.
Because of this difficulty of pinning-down economic outcomes, it is often necessary to perform
sensitivity or “what if” analysis to determine how outcome variables will change given changes
in the input variables.
In the present case, our aim is to determine how economic feasibility of the biodiesel
plant, measured by the NPV, will change given changes in crucial variables in the investment
decision process. In other words, sensitivity analysis helps to determine what factors
significantly affect the probability of economic success as measured by the NPV. It has already
been indicated in the initial simulation results that three variables (biodiesel, canola and seed
meal prices) are the most significant determinants of the NPV. Thus, we simulate the sensitivity
of the NPV to changes in these three variables.
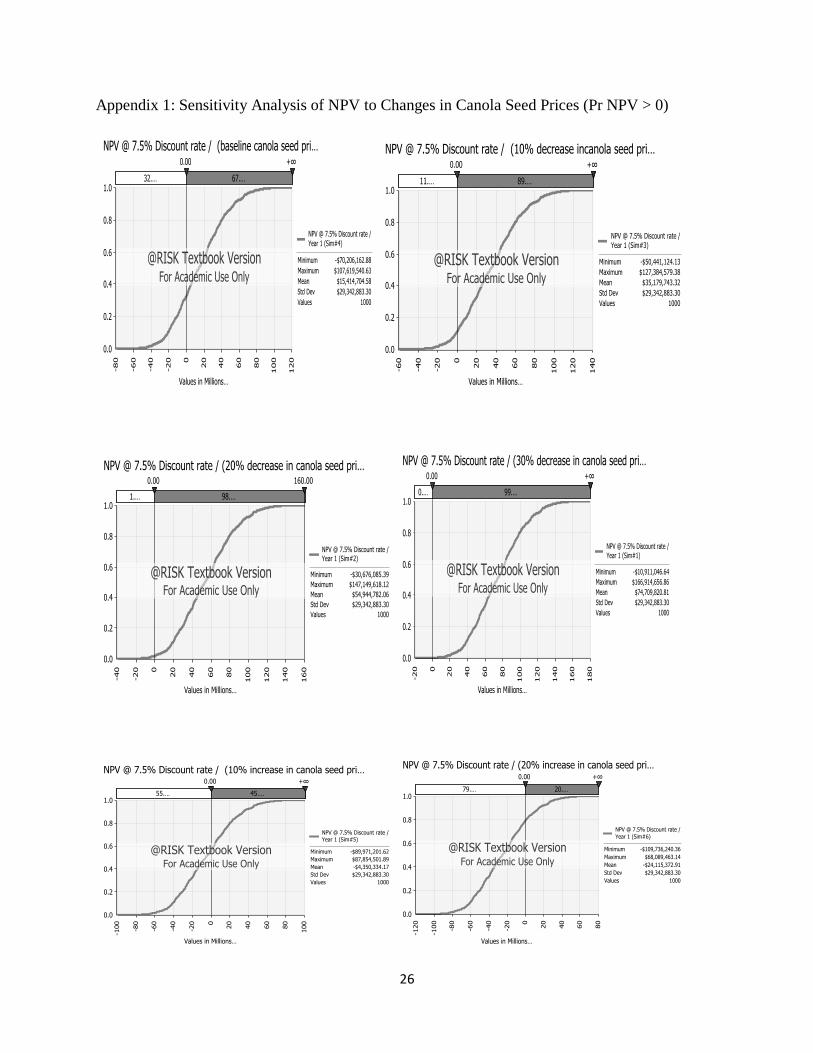
Table 7 presents the sensitivity of the NPV to changes in canola seed price. We simulate
how the NPV changes given increases in the canola seed price (10%, 20%, and 30%) and
decreases in canola seed prices (-10%, -20%, and -30%). The mean NPV after 1000 iterations,
using the baseline canola seed price of $296/ton, is $15 million, with a 67.5% probability of
20
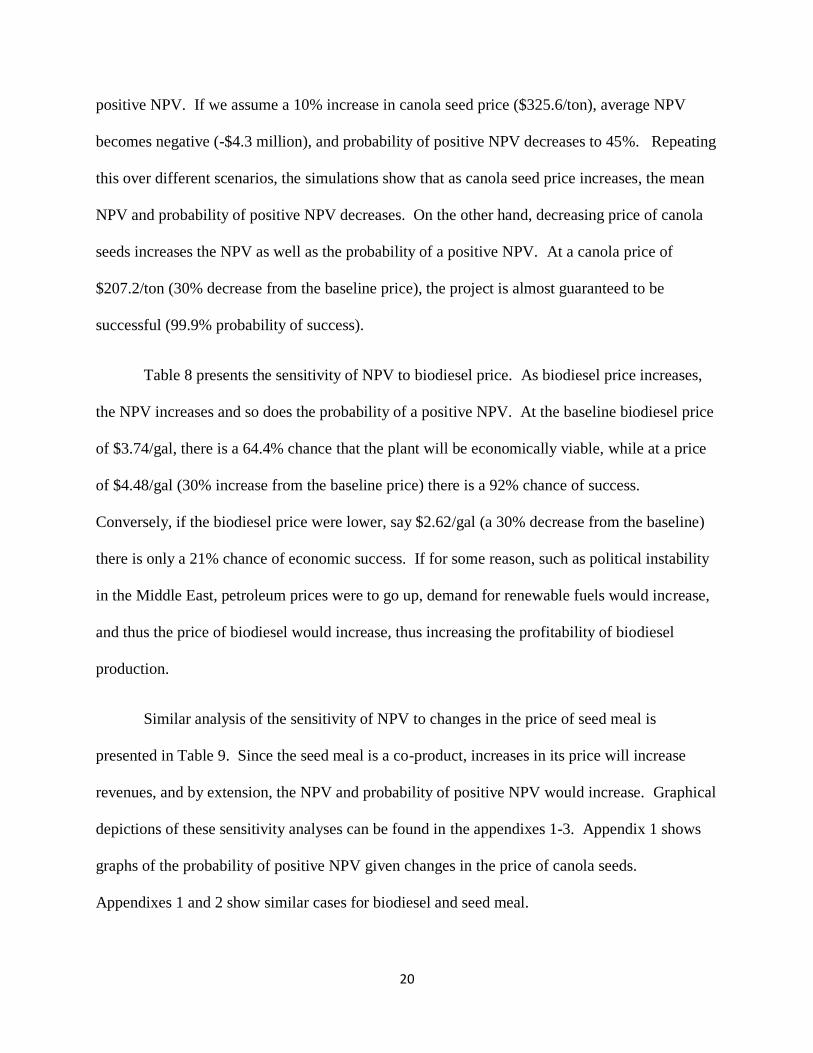
positive NPV. If we assume a 10% increase in canola seed price ($325.6/ton), average NPV
becomes negative (-$4.3 million), and probability of positive NPV decreases to 45%. Repeating
this over different scenarios, the simulations show that as canola seed price increases, the mean
NPV and probability of positive NPV decreases. On the other hand, decreasing price of canola
seeds increases the NPV as well as the probability of a positive NPV. At a canola price of
$207.2/ton (30% decrease from the baseline price), the project is almost guaranteed to be
successful (99.9% probability of success).
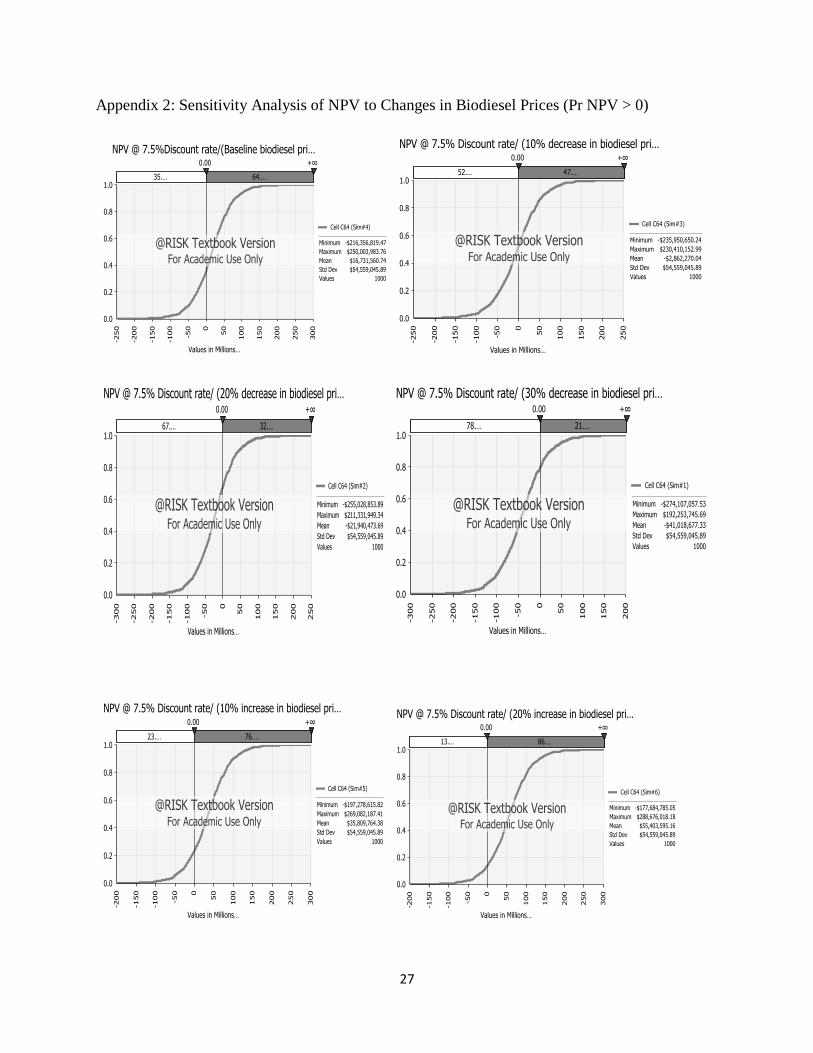
Table 8 presents the sensitivity of NPV to biodiesel price. As biodiesel price increases,
the NPV increases and so does the probability of a positive NPV. At the baseline biodiesel price
of $3.74/gal, there is a 64.4% chance that the plant will be economically viable, while at a price
of $4.48/gal (30% increase from the baseline price) there is a 92% chance of success.
Conversely, if the biodiesel price were lower, say $2.62/gal (a 30% decrease from the baseline)
there is only a 21% chance of economic success. If for some reason, such as political instability
in the Middle East, petroleum prices were to go up, demand for renewable fuels would increase,
and thus the price of biodiesel would increase, thus increasing the profitability of biodiesel
production.
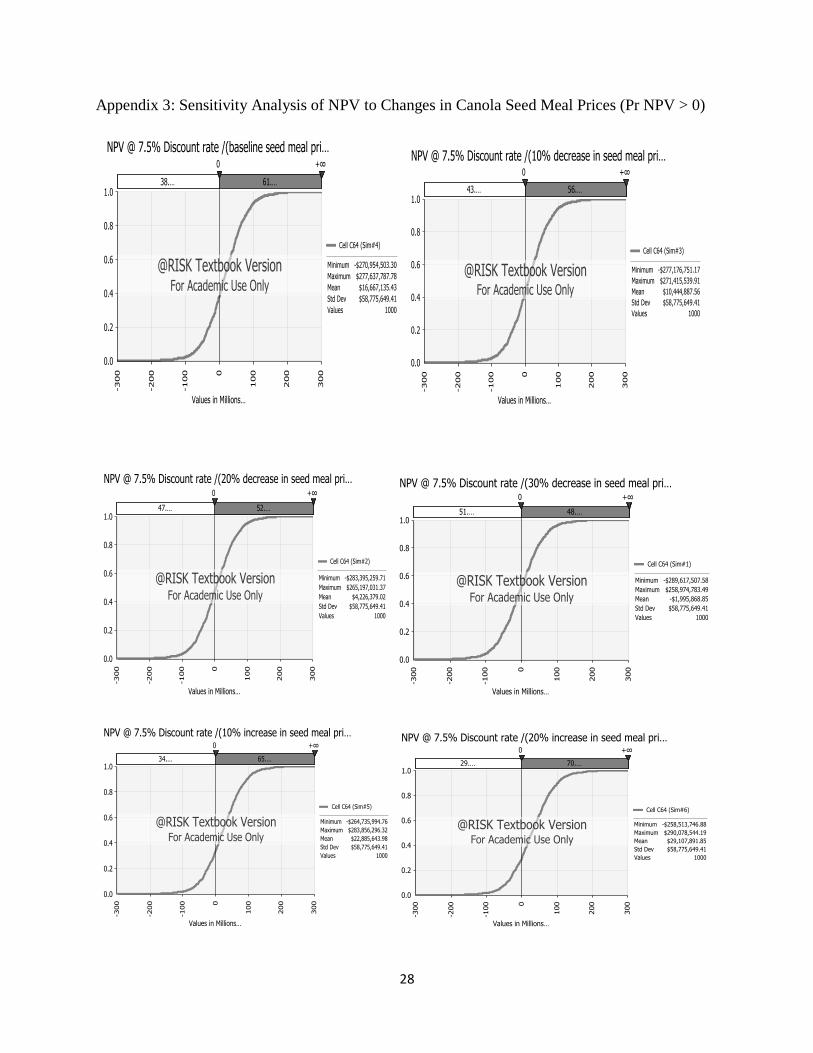
Similar analysis of the sensitivity of NPV to changes in the price of seed meal is
presented in Table 9. Since the seed meal is a co-product, increases in its price will increase
revenues, and by extension, the NPV and probability of positive NPV would increase. Graphical
depictions of these sensitivity analyses can be found in the appendixes 1-3. Appendix 1 shows
graphs of the probability of positive NPV given changes in the price of canola seeds.
Appendixes 1 and 2 show similar cases for biodiesel and seed meal.
21
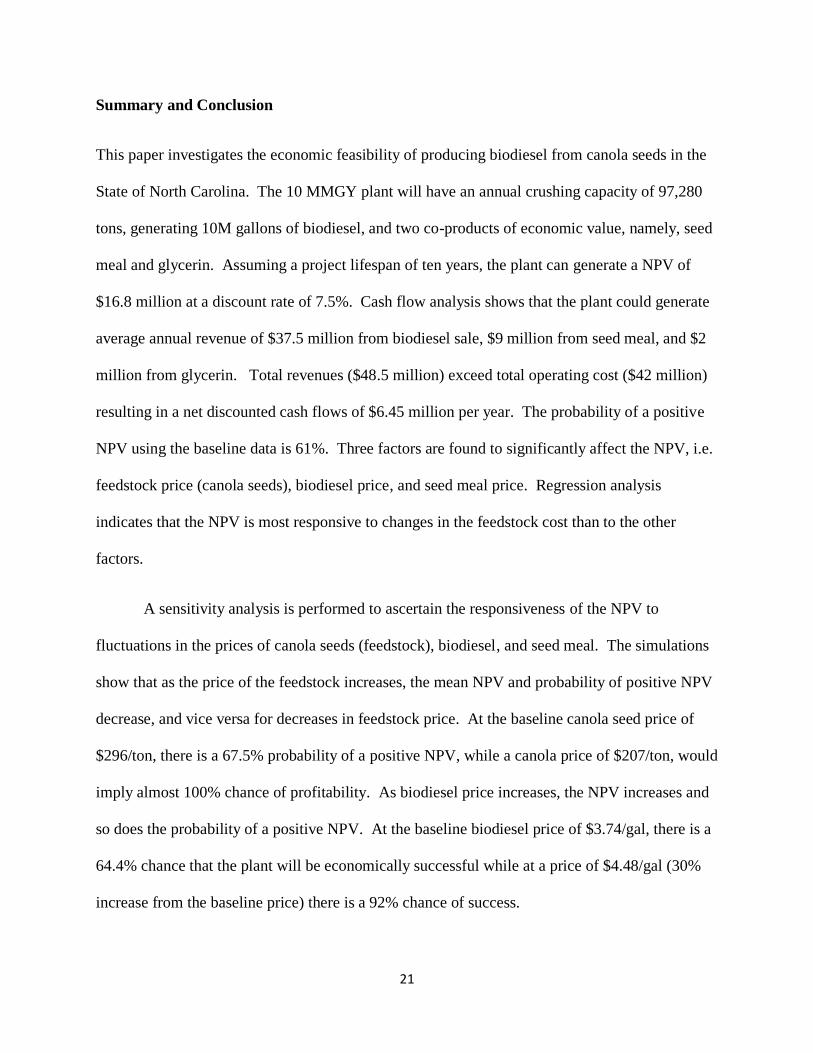
Summary and Conclusion
This paper investigates the economic feasibility of producing biodiesel from canola seeds in the
State of North Carolina. The 10 MMGY plant will have an annual crushing capacity of 97,280
tons, generating 10M gallons of biodiesel, and two co-products of economic value, namely, seed
meal and glycerin. Assuming a project lifespan of ten years, the plant can generate a NPV of
$16.8 million at a discount rate of 7.5%. Cash flow analysis shows that the plant could generate
average annual revenue of $37.5 million from biodiesel sale, $9 million from seed meal, and $2
million from glycerin. Total revenues ($48.5 million) exceed total operating cost ($42 million)
resulting in a net discounted cash flows of $6.45 million per year. The probability of a positive
NPV using the baseline data is 61%. Three factors are found to significantly affect the NPV, i.e.
feedstock price (canola seeds), biodiesel price, and seed meal price. Regression analysis
indicates that the NPV is most responsive to changes in the feedstock cost than to the other
factors.
A sensitivity analysis is performed to ascertain the responsiveness of the NPV to
fluctuations in the prices of canola seeds (feedstock), biodiesel, and seed meal. The simulations
show that as the price of the feedstock increases, the mean NPV and probability of positive NPV
decrease, and vice versa for decreases in feedstock price. At the baseline canola seed price of
$296/ton, there is a 67.5% probability of a positive NPV, while a canola price of $207/ton, would
imply almost 100% chance of profitability. As biodiesel price increases, the NPV increases and
so does the probability of a positive NPV. At the baseline biodiesel price of $3.74/gal, there is a
64.4% chance that the plant will be economically successful while at a price of $4.48/gal (30%
increase from the baseline price) there is a 92% chance of success.
22
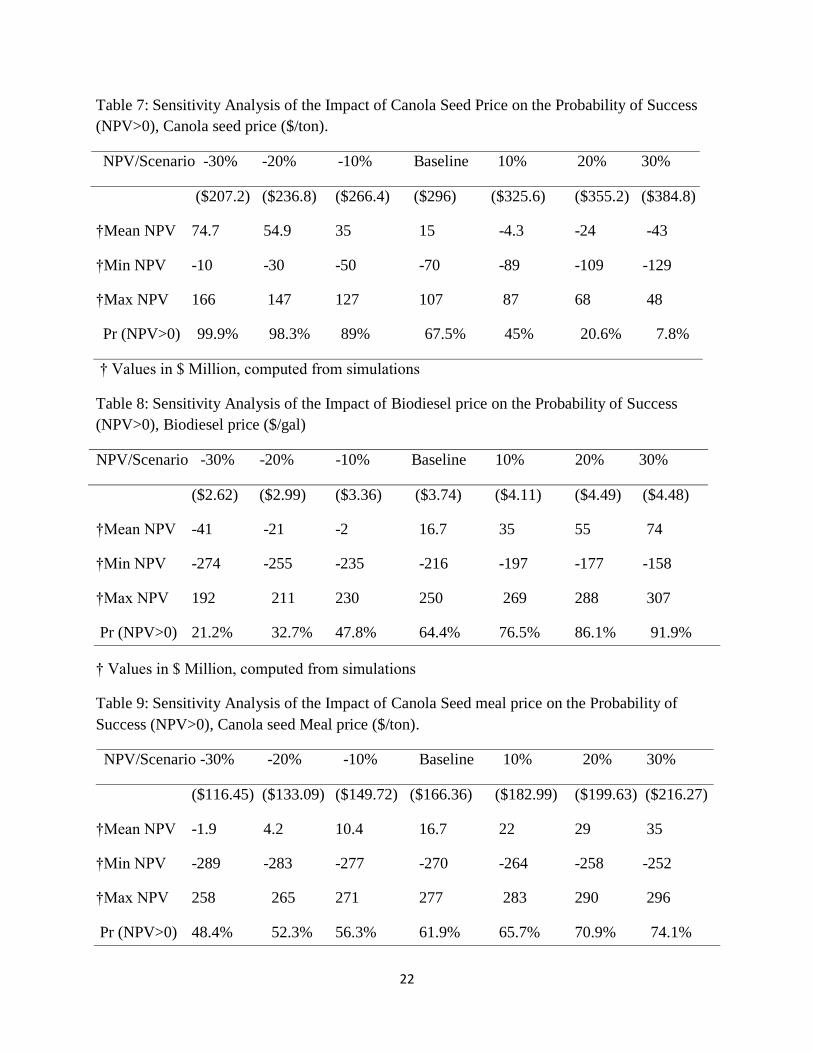
Table 7: Sensitivity Analysis of the Impact of Canola Seed Price on the Probability of Success
(NPV>0), Canola seed price ($/ton).
NPV/Scenario -30% -20% -10% Baseline 10% 20% 30%
($207.2) ($236.8) ($266.4) ($296) ($325.6) ($355.2) ($384.8)
†Mean NPV 74.7 54.9 35 15 -4.3 -24 -43
†Min NPV -10 -30 -50 -70 -89 -109 -129
†Max NPV 166 147 127 107 87 68 48
Pr (NPV>0) 99.9% 98.3% 89% 67.5% 45% 20.6% 7.8%
† Values in $ Million, computed from simulations
Table 8: Sensitivity Analysis of the Impact of Biodiesel price on the Probability of Success
(NPV>0), Biodiesel price ($/gal)
NPV/Scenario -30% -20% -10% Baseline 10% 20% 30%
($2.62) ($2.99) ($3.36) ($3.74) ($4.11) ($4.49) ($4.48)
†Mean NPV -41 -21 -2 16.7 35 55 74
†Min NPV -274 -255 -235 -216 -197 -177 -158
†Max NPV 192 211 230 250 269 288 307
Pr (NPV>0) 21.2% 32.7% 47.8% 64.4% 76.5% 86.1% 91.9%
† Values in $ Million, computed from simulations
Table 9: Sensitivity Analysis of the Impact of Canola Seed meal price on the Probability of
Success (NPV>0), Canola seed Meal price ($/ton).
NPV/Scenario -30% -20% -10% Baseline 10% 20% 30%
($116.45) ($133.09) ($149.72) ($166.36) ($182.99) ($199.63) ($216.27)
†Mean NPV -1.9 4.2 10.4 16.7 22 29 35
†Min NPV -289 -283 -277 -270 -264 -258 -252
†Max NPV 258 265 271 277 283 290 296
Pr (NPV>0) 48.4% 52.3% 56.3% 61.9% 65.7% 70.9% 74.1%
23
Figure 1. Biodiesel Production Process
Source: National Biodiesel Board
Figure 2: Annual Biodiesel Production, million gallons
Source: National Biodiesel Board
24
Figure 3: U.S. Biodiesel production and Consumption
Data Source: U.S. Energy Information Administration
References
Barnwal, B.K., and M.P.Sharma (2004). Prospects of Biodiesel Production from Vegetable Oils
in India, Renewable and Sustainable Energy Reviews, Vol. 9, 363-378.
Bender, M. (1999). Economic feasibility review for community-scale famer cooperatives for
biodiesel. Bioresource Technology, 70, 81-87.
BR&DB (2008). The Economics of Biomass Feedstocks in the United States: A Review of the
Literature. Occasional Paper No. 1, Biomass Research and Development Board.
Biodiesel Magazine (2011). Retrieved http://www.biodieselmagazine.com/plants/listplants/USA/
EPA (2010). Lifecycle Analysis of Greenhouse Gas Emissions for Canola Oil Biodiesel.
Federal Register. Vol. 75, No. 187.
George, N., K.Tungate, A. Hobbs, and A. Atkinson (2008). The North Carolina Canola
Production Guide. Advancing Renewable Energy for a Sustainable Economy. North
Carolina Solar Center, North Carolina State University.
0
10
20
30
40
50
60
70
80
90 20
01 J
anu
ary
2001
Ju
ly
2002
Jan
uar
y
2002
Ju
ly
2003
Jan
uar
y
2003
Ju
ly
2004
Jan
uar
y
2004
Ju
ly
2005
Jan
uar
y
2005
Ju
ly
2006
Jan
uar
y
2006
Ju
ly
2007
Jan
uar
y
2007
Ju
ly
2008
Jan
uar
y
2008
Ju
ly
2009
Jan
uar
y
2009
Ju
ly
2010
Jan
uar
y
2010
Ju
ly
2011
Jan
uar
y
2011
Ju
ly
Mill
ion
Ga
llon
s
Production (million gals/month)
Consumption (million gals/month)
25
Graboski, M.S. and R.L. McCormick (1998). Combustion of fat and vegetable oil derived fuels
in diesel engines. Prog. Energy Combust. Sci. 24, 125-164.
Haas, M., A. McAloon, W. Yee, and T. Foglia (2006). A Process Model to Estimate Biodiesel
Production Costs. Bioresource Technolgy 97: 671-678.
International Monetary Fund (20 07). World Economic Outlook, Globalization and Inequality.
Oct.
NBB (National Biodiesel Board) (2011). Biodiesel Industry Sets New Annual Production
Record, Fueling Job Creation. Press Release, # 202-737-8801/202-997-1919. November
28, 2011. WWW.biodiesel.org
Noordam,M. and R. Withers (1996). Producing Biodiesel from Canola in the Inland Northwest:
An Economic Feasibilty Study. Idaho Agricultural Experiment Station Bulletin No. 785.
University of Idaho College of Agriculture, Moscow, Idaho, p 12.
Outlaw, J.L., L.A. Ribera,J.W.Richardson, J. da Silva, H.Bryant, and S.L. Klose (2007).
Economics of Sugar-Based Ethanol Production and Related Policy Issues. Journal of
Agricultural and Applied Economics, 39, 2; 357-363.
Palma, M.A., J.W. Richardson, B.E. Roberson, L.A. Ribera, J. Outlaw, and C. Munster (2011).
Economic Feasibility of a Mobile Fast Pyrolysis System for Sustainable Bio-crude Oil
Production. International Food and Agribusiness Management Review, Vol. 14, Issue 3.
Richardson, J.W., and H.P.Mapp Jr. (1976). Use of Probabilistic Cash Flows in Analysing
Investments Under Conditions of Risk and Uncertainty, Southern Journal of Agricultural
Economics, Vol. 8, pp 19-24.
Reutlinger, S. (1970). Techniques for Project Appraisal under Uncertainty. World Bank Staff
Occasional Papers Number ten. Baltimore, MD: John Hopkins University Press.
Zhang, Y., M.A. Dube, D.D. McLean, and M. Kates (2003). Biodiesel Production from Waste
Cooking Oil: 2. Economic Assessment and Sensitivity Analysis. Bioresource
Technology, 90, 229-240.
26
Appendix 1: Sensitivity Analysis of NPV to Changes in Canola Seed Prices (Pr NPV > 0)
27
Appendix 2: Sensitivity Analysis of NPV to Changes in Biodiesel Prices (Pr NPV > 0)
28
Appendix 3: Sensitivity Analysis of NPV to Changes in Canola Seed Meal Prices (Pr NPV > 0)