Embed Size (px)
Citation preview
I
Final Report
on
Biodiesel Production from Microalgae
- A Feasibility Study –
Presented to StatoilHydro ASA
Oslo, Norway
May 16, 2008
Principal investigators: Tutors: Merit Lassing Christian Hulteberg, Lund University Peter Mårtensson Hans T. Karlsson, Lund University Erik Olsson Børre T. Børresen, StatoilHydro ASA Marcus Svensson Hans Eklund, StatoilHydro ASA
KET050 Biodiesel Production from Microalgae
Dept of Chemical Engineering, Lund University, Faculty of Engineering
II
Disclaimer
This report was prepared as a project in the course ”Feasibility Studies on Industrial Plants,
(KET050)”, Department of Chemical Engineering, Faculty of Engineering, LTH, Lund
University Sweden in cooperation with the Norwegian company StatoilHydro. Neither Lund
University nor the authors of this report or StatoilHydro may be held responsible for the effects
following from using the information in this report. Nor the authors, Lund university or
StatoilHydro makes any warranty, expressed or implied, or assumes any legal liability or
responsibility for the accuracy or completeness of this information.
No reproduction is authorized without the written permission from the authors, or StatoilHydro
or Lund University.
III
Abstract
This is a student assignment for the Norwegian oil and gas company StatoilHydro, The aim of
this study is to investigate the potential of large scale production of biodiesel from microalgae.
Since the technology is new and no large facilities exist to date, this report focuses on suitable
technologies for future biodiesel production.
There exist many different algae strains with high oil content e.g. Phaeodactylum tricornutum,
Nannochloropsis salina and Botryococcus braunii. The alga Botryococcus braunii was first
selected for large scale biodiesel production, but after encountering many problems when
looking into the process, the string of Nannochloropsis salina was chosen instead. The high
hydrocarbon content of B. braunii was one of the key factors when this alga initially was chosen,
together with the algae’s ability to produce hydrocarbons during growth without the use of
methods such as nitrogen starvation. Difficulties encountered when using this alga strain were
separation problems since B. braunii has its hydrocarbons on the outside connecting the colonies,
hence it is quite slimy. At the same time the colonies could be an advantage since the larger size
means an easier separation. The fact that B. braunii is a fresh water algae is a big disadvantage in
large scale production of biodiesel, if not having fresh water readily available, since this require
a large desalination facility. Nannochloropsis salina on the other hand is a halotolerant string
that prefers saline water similar to common seawater and has characteristics of producing high
oil content within its cells. Nannochloropsis salina is therefore the alga strain used in this
feasibility study for large scale biodiesel production.
It is concluded that the most promising reactor type is the closed photobioreactor, since the other
main alternative, the open pond, suffers from contamination risks, high evaporative losses of
water and diffusion losses of CO2. Among the different types of closed photobioreactors; tubular,
flat and polyethylene bags, the tubular seems to be the best choice since it has a higher
photoefficiency than the flat reactor. The polyethylene bag reactor still needs developing and is
not yet a viable alternative.
After the algae have been harvested it is suggested that an increased dry weight is accomplished
by a flocculation and sedimentation stage. The chosen method for the disruption of the cells is
the utilization of a hydrodynamic cavitation process, followed by a stirring settling tank, where
the oil floats and the cell debris sediment. Since hydrodynamic cavitation is a relatively unknown
method, an alternative process using a wet bead mill for the cell breakage is presented as an
alternative. However calculations are only performed on the former process alternative.
In order to minimize losses in further refining and fulfill the EN 14214 standard for biodiesel
production, the algal oil will in most cases need some kind of pretreatment. The most important
purification steps will be degumming, which removes phosphorous content, as well as reaction
of free fatty acids into methyl esters in order to avoid soap formation in the transesterification
process.
Suitable plant locations for StatoilHydro to put up a large scale biodiesel production facility are
Qatar, South Africa and Australia. All cost estimates are made for a plant location in South
Africa where the most suitable conditions can be found.
IV
The following factors showed to be most accountable in the cost estimates of this production
facility:
The productivity of algae
Lifespan of the photobioreactor
Interest rate on capital for investment
Harvesting concentration
Different scenarios were estimated and the production cost ranges from 0.38 €/L to 1.95 €/L
between the best and worst case scenario with 0.87 €/L as the base case. An approximation that
has been made is that nutrient/flocculant cost and algae meal revenue will balance each other. If
the algae meal turns out to be worthless this will increase the algae oil price by 0.26 €/L and
hence could be fatal to the biodiesel production from microalgae.
The price of comparable bio-based crude oil is today 122 $ barrel (palm oil) (1), which is
approximately 0.49 € per liter. This shows that even though profitability is still not achieved, it is
concluded that profitability is not far away.
V
Contents 1 Introduction .............................................................................................................................................. 1
1.1 Why Algae for Production of Biodiesel? ............................................................................................ 1
1.2 Technology State-of-the-Art ............................................................................................................... 2
1.3 Brief Description of Production System ............................................................................................. 2
2 Technology Suitable for Large-Scale Production ................................................................................. 4
2.1 Problems in Photobioreactors ............................................................................................................. 4
2.1.1 Oxygen Oversaturation ............................................................................................................... 5
2.1.2 pH-value ...................................................................................................................................... 5
2.1.3 Temperature ................................................................................................................................ 5
2.2 Open Pond System .............................................................................................................................. 5
2.2.1 Advantages .................................................................................................................................. 6
2.2.2 Disadvantages ............................................................................................................................. 6
2.3 Closed Photobioreactors ..................................................................................................................... 6
2.3.1 Advantages .................................................................................................................................. 6
2.3.2 Disadvantages ............................................................................................................................. 6
2.3.3 Comparison of Different Systems of Closed Photobioreactors ................................................... 6
2.4 Conclusions - Type of Reactor ........................................................................................................... 7
2.5 Choosing the Right Algae ................................................................................................................... 7
2.5.1 General Aspects to Consider ....................................................................................................... 7
2.5.2 Algae Strains with High Oil Content ........................................................................................... 8
2.5.3 Phaeodactylum tricornutum ........................................................................................................ 8
2.5.4 Chlorella protothecoides ............................................................................................................. 9
2.5.5 Botryococcus braunii .................................................................................................................. 9
2.5.6. Nannochloropsis salina ............................................................................................................ 11
2.5.7 Choosing an Algae Strain ......................................................................................................... 12
2.6 Harvesting of Algae - Separation of Particles from Water ............................................................... 13
2.6.1 Flocculation .............................................................................................................................. 13
2.6.2 Gravity Sedimentation ............................................................................................................... 14
2.6.3 Centrifugal Recovery ................................................................................................................. 14
2.6.4 Ultrasound ................................................................................................................................. 14
2.6.5 Filtration ................................................................................................................................... 14
2.6.6 Dissolved Air Flotation ............................................................................................................. 15
VI
2.6.7 Conclusion - Separation of Particles from Water ..................................................................... 15
2.7 Extraction of Microalgal Oil from Biomass ..................................................................................... 16
2.7.1 Bead Mills ................................................................................................................................. 16
2.7.2 Presses ....................................................................................................................................... 17
2.7.3 Solvent Extraction ..................................................................................................................... 17
2.7.4 Cavitation .................................................................................................................................. 17
2.7.5 Less Known Methods ................................................................................................................. 18
2.7.6 Conclusion - Extraction of Microalgal Oil from Biomass ........................................................ 18
2.8 Termochemical Liquefaction - an Alternative Path? ........................................................................ 18
2.9 Post Processing – Crude Oil to Biodiesel ......................................................................................... 19
2.9.1 EN 14214 ................................................................................................................................... 19
2.9.2 Pretreatment of Crude Oil ......................................................................................................... 19
2.10 Transesterification of Crude Oil to Biodiesel ................................................................................. 22
2.10.1 Heterogeneous Catalysis ......................................................................................................... 23
2.10.2 Supercritical Methanol ............................................................................................................ 23
2.11 Suitable Plant Location ................................................................................................................... 23
2.12 Conclusion ...................................................................................................................................... 24
3 Flow Diagram ......................................................................................................................................... 26
3.1 Main Process Alternative .................................................................................................................. 26
3.2 An Alternative Process ..................................................................................................................... 26
4 Cost Estimates ........................................................................................................................................ 29
4.1 Total Annual Cost ............................................................................................................................. 29
4.1.1 Capital Costs ............................................................................................................................. 29
4.1.2 Operating Costs......................................................................................................................... 30
4.2 General Assumptions ........................................................................................................................ 30
4.3 Mass Balances .................................................................................................................................. 31
4.4 Cost Estimates of Unit Operations ................................................................................................... 31
4.4.1 Cost of Photobioreactor Facility ............................................................................................... 31
4.4.2 Cost of Sedimentation Equipment ............................................................................................. 34
4.4.3 Cost of Cavitation Equipment ................................................................................................... 36
4.4.4 Cost for Separation of the Water Oil Algae Mixture ................................................................. 38
4.4.5 Cost of Degumming Equipment ................................................................................................. 39
4.4.6 Cost for Removal of Free Fatty Acids ....................................................................................... 40
VII
4.4.7 Cost for Spray Drying Equipment ............................................................................................. 41
4.5 Revenues and Costs not Directly Derived from Unit Operations ..................................................... 42
4.5.1 Byproducts ................................................................................................................................. 42
4.5.2 Cost of Storage Tanks ............................................................................................................... 42
4.5.3 Labor Costs ............................................................................................................................... 43
4.6 Summarized Costs for the Base Case ............................................................................................... 43
4.7 Sensitivity Analysis of Production Cost ........................................................................................... 44
4.7.1 The Production Rate of Algae ................................................................................................... 45
4.7.2 Concentration upon Harvest ..................................................................................................... 46
4.7.3 Assumed Life Span of Facility and Interest Rate on Capital Investment .................................. 46
4.8 Conclusion ........................................................................................................................................ 47
5 Bibliography ........................................................................................................................................... 48
Appendix 1 ............................................................................................................................................. 55
Appendix 2 ............................................................................................................................................. 56
Appendix 3 ............................................................................................................................................. 57
Appendix 4 ............................................................................................................................................. 59
Appendix 5 ............................................................................................................................................. 63
Appendix 6 ............................................................................................................................................. 64
Appendix 7 ............................................................................................................................................. 68
Appendix 8 ............................................................................................................................................. 69
Appendix 9 ............................................................................................................................................. 70
Appendix 10 ........................................................................................................................................... 71
Appendix 11 ........................................................................................................................................... 72
Appendix 12 ........................................................................................................................................... 73
Appendix 13 ........................................................................................................................................... 77
Appendix 14 ........................................................................................................................................... 79
Appendix 15 ........................................................................................................................................... 80
Appendix 16 ........................................................................................................................................... 81
1
1 Introduction
Petroleum products as the source of transport fuels have to be replaced soon by renewable
biofuels/energy sources due to problems with global warming and limited availability. Today the
renewable biofuels are bioethanol produced mainly by sugarcane, and biodiesel by oil crops like
oil palm. One of the main reasons why ethanol and biodiesel is looked upon as an energy carrier
in transport fuel is the possibility to use it with current drive trains and infrastructure. To replace
the world demand of petroleum products by these crops is not a sustainable alternative. The
productivity per hectare of land based crops is not sufficient for large scale production. In an
example with biofuels replacing the petroleum products in the US, it is calculated that over 60 %
of the agricultural land has to be used for biofuel production if the grown crop is oil palm. This
would lead to insufficient land to produce food and fodder for the animal production. Microalgae
production rates are much higher than land based crops, the calculation for the US biofuel
replacement with biodiesel from microalgae states that only 3 % of the farmed area has to be
used (2).
The waste products of the biodiesel production can be used to produce animal fodder, heat or
generating electricity. Bioethanol produced by sugarcane is a product that is competitive with
petroleum products today, concerning the price. The productivity per hectare is however a
problem for full scale replacement of petroleum fuels by bioethanol, about the same amount of
agricultural land has to be used for total replacement as for oil palm. The problem with
microalgae for biodiesel production is the economics, the prices for production today is
substantially larger, almost ten times the price of petroleum diesel and even more expensive than
biodiesel from oil crops. Today the microalgae production plants are mainly used for production
of high value specialty chemicals such as pigments and virtually no biodiesel is derived from
algae: the reduction of the costs for microalgae production has to be reduced substantially if
competitiveness compared to petroleum products, can be achieved without the subsidies for
renewable fuels found in Europe and the US (2).
The aim of this study is to investigate the potential of large scale production of biodiesel from
microalgae, as a student assignment for the Norwegian oil and gas company StatoilHydro. Since
the technology is new and no large facilities exist to date, this report focuses on suitable
technologies for future biodiesel production.
1.1 Why Algae for Production of Biodiesel?
Microalgae have been suggested as very good candidates for fuel production because of their
advantages of higher photosynthetic efficiency; higher biomass production and faster growth
compared to other energy crops (3). Algal biomass can be produced on lands not suitable for
higher plants, therefore resulting in a more effective use of global land surface (4). Therefore
2
microalgae production does not compete with the production of food for a growing population
and is the only viable alternative for a large scale biodiesel production seen today.
1.2 Technology State-of-the-Art
The algae industry has been present for a long time, but commercial biodiesel feedstock
production is a new path. Earlier the industry has been specialized on producing high value
products such as specific proteins, colorants or other substances that are highly valuable.
Today, only small amounts of biodiesel are produced from microalgae (2). Several
manufacturers have produced pilot plants and demonstration scale production but on their
homepages they say that they can or have built plants for large scale production but when
contacting them, no commercial production is yet operating on their system.
The main problem found with microalgae for biodiesel today is the economics; biodiesel from
microalgae is even more costly than biodiesel from other sources. Today the biodiesel is only an
alternative in the US and Europe due to the high subsidies found on alternative fuel sources (2).
Many scientific papers have been written on the subject of microalgae. Most of these are
optimistic about further development of the algae industry, but it seems that many problems have
to be overcome before biodiesel from microalgae can become a commercial alternative for
petroleum products derived from fossil fuel, or other renewable fuel derived from land based
crops.
1.3 Brief Description of Production System
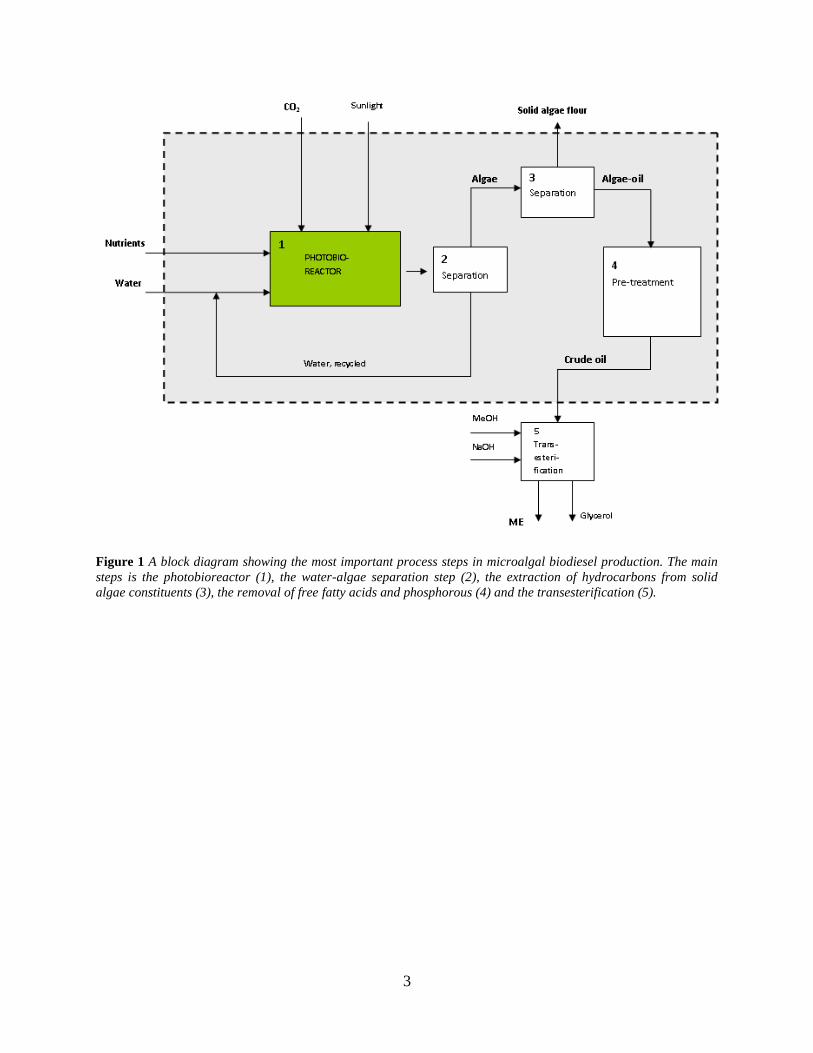
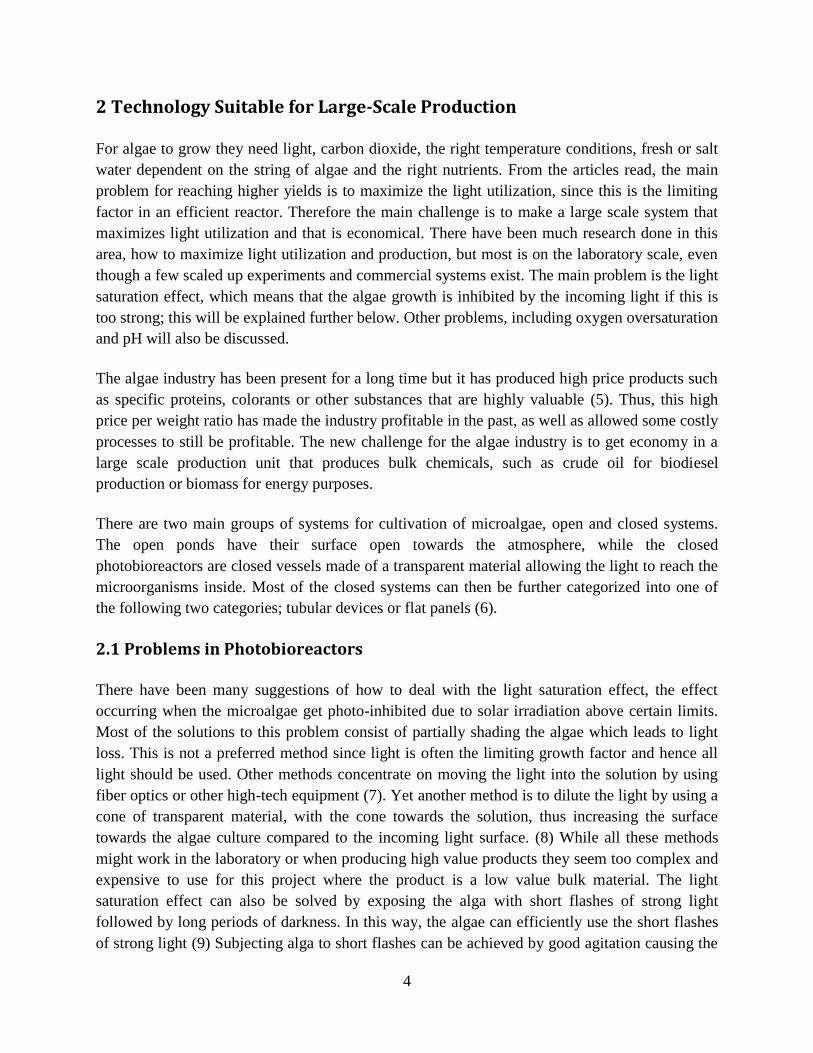
In Figure 1 is a brief overview of the production system for biodiesel production from algae,
including the system boundaries.
The core of the production unit is the photobioreactor, where the algae grow in a water
environment enriched with carbon dioxide and nutrients. The limiting growth factor is the
incoming light. The algae are then separated from the water; the separated water is recycled and
the algae continue to the next separation step. In this step the algae are crushed and the solid
algae membranes and other solid constituents are separated from the algae oil. The algae oil
contains free fatty acids and phosphorous that needs to be eliminated before transesterification;
this is done in the pre-treatment. After the pretreatment the crude oil is ready to be used in a
regular transesterification process for biodiesel production.
3
Figure 1 A block diagram showing the most important process steps in microalgal biodiesel production. The main
steps is the photobioreactor (1), the water-algae separation step (2), the extraction of hydrocarbons from solid
algae constituents (3), the removal of free fatty acids and phosphorous (4) and the transesterification (5).
4
2 Technology Suitable for Large-Scale Production
For algae to grow they need light, carbon dioxide, the right temperature conditions, fresh or salt
water dependent on the string of algae and the right nutrients. From the articles read, the main
problem for reaching higher yields is to maximize the light utilization, since this is the limiting
factor in an efficient reactor. Therefore the main challenge is to make a large scale system that
maximizes light utilization and that is economical. There have been much research done in this
area, how to maximize light utilization and production, but most is on the laboratory scale, even
though a few scaled up experiments and commercial systems exist. The main problem is the light
saturation effect, which means that the algae growth is inhibited by the incoming light if this is
too strong; this will be explained further below. Other problems, including oxygen oversaturation
and pH will also be discussed.
The algae industry has been present for a long time but it has produced high price products such
as specific proteins, colorants or other substances that are highly valuable (5). Thus, this high
price per weight ratio has made the industry profitable in the past, as well as allowed some costly
processes to still be profitable. The new challenge for the algae industry is to get economy in a
large scale production unit that produces bulk chemicals, such as crude oil for biodiesel
production or biomass for energy purposes.
There are two main groups of systems for cultivation of microalgae, open and closed systems.
The open ponds have their surface open towards the atmosphere, while the closed
photobioreactors are closed vessels made of a transparent material allowing the light to reach the
microorganisms inside. Most of the closed systems can then be further categorized into one of
the following two categories; tubular devices or flat panels (6).
2.1 Problems in Photobioreactors
There have been many suggestions of how to deal with the light saturation effect, the effect
occurring when the microalgae get photo-inhibited due to solar irradiation above certain limits.
Most of the solutions to this problem consist of partially shading the algae which leads to light
loss. This is not a preferred method since light is often the limiting growth factor and hence all
light should be used. Other methods concentrate on moving the light into the solution by using
fiber optics or other high-tech equipment (7). Yet another method is to dilute the light by using a
cone of transparent material, with the cone towards the solution, thus increasing the surface
towards the algae culture compared to the incoming light surface. (8) While all these methods
might work in the laboratory or when producing high value products they seem too complex and
expensive to use for this project where the product is a low value bulk material. The light
saturation effect can also be solved by exposing the alga with short flashes of strong light
followed by long periods of darkness. In this way, the algae can efficiently use the short flashes
of strong light (9) Subjecting alga to short flashes can be achieved by good agitation causing the
5
algae to be at the surface of the closed system only a short period of time before being shielded
by other algae again. This together with the solution conducted by J.M Fernandez et al, in which
the problem with photo-inhibition is minimized by having more optically dense cultures and
thereby decrease the irradiance inside the reactor, seems to be a good alternative (10).
2.1.1 Oxygen Oversaturation
During the photosynthesis the microalgae produce oxygen, in closed bioreactors this can be a
problem since the oxygen is trapped in the solution and create an oversaturation that is harmful
for the algae culture. This has been reported to be true for the microalga Phaeodactylum
tricornutum, where the growth rate decrease when oxygen saturation levels approaches 400%
compared with the levels reached by equilibrium with air. Values over 400 % caused the culture
to collapse (11). This indicates that the oversaturation must be solved in a closed
photobioreactor.
2.1.2 pH-value
The pH value needs to be controlled within certain limits. The additional CO2 that needs to be
added for the alga culture to grow rapidly lowers pH, while the respiration and usage of CO2
increases pH. Nutrients also have to be added without affecting the pH value too much.
2.1.3 Temperature
Different alga strings prefer different temperatures, but most high producing algae prefers
temperatures around 25 °C. High temperatures can cause the culture to collapse, e.g.
Phaeodactylum tricornutum collapsed at temperatures above 35 degrees in experiments done by
Acién Fernández et al 2003 (11). This indicates that the temperature should always be kept under
a certain limit, either by a colder climate or an emergency cooling systems for days when the
temperature are too high.
2.2 Open Pond System
The open pond can be compared with the natural shallow lake, but the artificial open pond has
specific engineered solutions to deal with problems such as keeping the algae from
sedimentation, keeping the stirring continuous and at the right rate.
6
2.2.1 Advantages
Low cost construction that is easy to build.
No cooling needed.
No problems with solutions oversaturated with oxygen.
2.2.2 Disadvantages
Low productivity per area and volume (8), due to the low light over volume ratio.
The system can easily be contaminated by other microorganisms, which can harm the
cultivation of the desired alga string.
High loss of water through evaporation from the open surface.
Diffusion of CO2 to the atmosphere. (12)
2.3 Closed Photobioreactors
The closed photobioreactor system consists of a number of transparent reactors. The reactors are
designed to maximize the absorption of the incoming light and to minimize negative effects such
as oxygen oversaturation.
2.3.1 Advantages
High productivity per areal of land and per volume (5).
High algae content per volume makes separation easier and cheaper, because less water
per kg dry biomass has to be removed.
Easier to prevent contamination from other microalgae, due to the fact that the system is
closed to the environment.
Small evaporative losses of water compared to open systems.
2.3.2 Disadvantages
Cooling needed to prevent the system from overheating (5).
Problems due to oversaturation of oxygen (5)
Cleaning problems due to bio-adhesion on the inside of transparent surfaces.
Expensive construction that is complex to build.
2.3.3 Comparison of Different Systems of Closed Photobioreactors
The comparison between different types of reactors are hard to do, since they have different
forms and thus also volume to surface ratio. Therefore when comparisons are made, the way
these are made should always be examined. The usual comparison is made on one of the
7
following parameters: volumetric productivity, irradiance area productivity and land area
productivity. When a tubular and a flat reactor are compared with reference to the photo
efficiency during the day, it can be seen that the flat reactor suffers more from the light saturation
effect. The photo efficiency of the tubular reactor was greater due to the dilution effect caused by
the curved surface area. The experiments conducted by Tredici et al shows that the photo
efficiency drops for the flat reactor during maximum illumination, which occurs at mid day. The
tubular reactor had a significantly higher production and growth rate because of the higher photo
efficiency. However, the flat reactor had a higher volumetric productivity (7), this shows how
hard general conclusions are to make, and that many of the comparing values depend on the
specific details of the reactor. Another reactor type with promising experiments is a reactor in
polyethylene sleeves. These experiments have been done by Ephraim Cohen et al but since the
sleeves in this case are very thin 0.2 mm they would most likely deteriorate from the forces of
climate unless a protective greenhouse was build to shield from these forces (13). For large scale
production this would be very expensive. For this reason and also that only a few articles has
been found on this reactor type, this method is not investigated further at the moment. But in the
future it might be an interesting possibility.
2.4 Conclusions - Type of Reactor
The preferred reactor will be the closed photobioreactor, since the open ponds suffer from
contamination risks together with high evaporative losses of water and diffusion losses of CO2.
This means that the investment cost will be significantly higher, but also that the separation step
will be easier, due to dense cell cultures.
Land area unsuitable for agricultural activities are generally sparse on fresh water, why the loss
of water should be minimized, this supports the closed reactor.
Of the different kinds of closed reactors, tubular, flat and in polyethylene bags, the tubular
reactor is chosen. The research on polyethylene bags is not sufficient for the bags to be an
alternative. The tubular reactor has a better photo efficiency than the flat reactors, and will be the
preferred choice.
2.5 Choosing the Right Algae
2.5.1 General Aspects to Consider
There are many aspects to consider when choosing the right algae for biodiesel production. In
order to achieve the highest possible production rate of oil, oil content has to be balanced against
growth kinetics. Furthermore there are many advantages in having a robust species of alga since
the system will be less sensitive to variations in parameters like temperature, pH and salinity.
Size and oil composition are also important in order to achieve a simple separation and post
8
processing. Last but not least, it is important that the alga strain is well known and that sufficient
research and information exists.
2.5.2 Algae Strains with High Oil Content
Algae with high oil content from the list in Micro- and Macro- Algae: Utility for industrial
applications by Anders S Carlsson et al 2007 (14) were investigated. When considering
important parameters it resulted in further evaluation of the following three algae:
Phaeodactylum tricornutum, Chlorella Protothecoides and Botryococcus braunii. After a
conversation with the commercial company Algae Link the algae Nannochloropsis salina was
also investigated.
2.5.3 Phaeodactylum tricornutum
Phaeodactylum tricornutum has been considered as a possible algae strain for biodiesel
production. The reasons for this can be summarized by the following: relative high oil content
(15-20 % of dry weight), extensive research on this alga, ability to grow to high cell densities
and high productivity.
These characteristics lead to a more detailed search where the main interest was the conditions
for cultivation, how to achieve maximum productivity and the composition of this strain.
The growth rate and fatty acid composition of Phaeodactylum tricornutum is greatly affected on
growth conditions such as nitrogen source and other inorganic nutrients. Generally the options
which give the highest productivity give the lowest fatty acid content. This alga is a fresh water
strain that is affected drastically with increased salinity. Many nutrients will change the pH of the
growth media from the optimum pH. This will be a problem since the change in pH affects the
production negatively. Temperature differences also affect the production rates significantly; the
preferred temperature is in the range of 21.5-23 °C. (15)
Photoautotrophic growth in outdoor pilot scale photobioreactors give the following results.
Temperatures above 35 °C are lethal for the algal culture; temperatures above 30 °C severely
affect the growth rate but, by keeping the temperature below 28 °C, significant growth occurs. In
order to achieve maximum productivity of 1.3 g/L in batch mode the following measures needs
to be taken: pH must be kept at 7.7 by automatic CO2 injection, nutrient limitation must be
prevented and oxygen saturation kept at less than 350 %. For a continuous mode, productivity of
1.4 g/L d was achieved (10).
The report by García et al 2004 examines how the carbon and nitrogen sources affect biomass
production and fatty acid composition in mixotrophic growth. Mixotrophic growth, a
combination of heterotrophic and photoautotrophic, in general gives higher productivity than
9
photoautotrophic growth. In the García report the results show that the combination of glycerol
as carbon source and urea as nitrogen source gives the highest productivity in mixotrophic
growth. This increase in productivity was 9-fold compared to photoautotrophic growth (16).
By comparing mixotrophic and photoautotrophic growth in an outdoor pilot scale plant the
following results were achieved: The results show that the growth rate increases with
mixotrophic growth, up to 1.87 g/L and day, 4 times more than what can be achieved with
photoautotrophic conditions. The biomass concentration supported in the reactor can be almost
tenfold. The fatty acid concentration of the algae is also increased as well as the photosynthetic
efficiency because of the higher algae concentrations (10).
Due to the low oil content of this algae strain, another alga has been chosen to be used in this
feasibility study. However because of the many favourable characteristics of this strain and more
research being done the Phaeodactylum tricornutum could in future be a viable feedstock for the
production of biodiesel from microalgae.
2.5.4 Chlorella protothecoides
Chlorella protothecoides can grow both photoautotrophic and heterotrophic. Most literature
found on Chlorella protothecoides was about heterotrophic growth, where the carbon sources
can be constituted of acetate or glucose. When growing Chlorella protothecoides the lipid
content in the cells reaches values about four times higher under heterotrophic- than under
phototrophic conditions.
Heterotrophic growth of Chlorella p. followed by transesterification resulted in biodiesel with a
high heating value, 41 MJ/kg, which is comparable with that of conventional diesel (17). When
grown under heterotrophic conditions, there is a disappearance of chlorophyll in the cells and
therefore the algal cannot utilize the available energy from the sun (17). Because of this and the
lack of information on phototrophic growth of Chlorella p. this alga is not used in this study.
2.5.5 Botryococcus braunii
Botryococcus braunii is a green colonial microalga which produces high levels of lipids, mainly
hydrocarbons and ether lipids. Metzger and Largeau define lipids as “all compounds that are
readily soluble in organic solvents but only sparingly soluble in water. (18)
Botryococcus braunii is an alga that forms colonies. The sizes of these colonies have a wide
range with volume average diameters ranging from 0.05-0.2 mm and are strongly dependent on
light intensity in the experiments (19). Botryococcus braunii contains lower contents of nitrogen
and phosphorus than many other algae on an organic basis, therefore the energy requirement for
fertilizers are smaller (4).
10
B. braunii strains can be found in all climate zones except the Antarctic. There are three races, A
and B which grow in alpine, continental, temperate and tropical lakes and L which has only been
found in tropical conditions. The classification into different races depends on the hydrocarbon
production. Race A produce C23-C33 odd numbered n-alkadienes, from mono- to tetraenes, where
oleic acid is found to be precursor of the dienes and trienes. Race L produce only lycopadiene,
which is a tetraterpenoid hydrocarbon. Algae of race B produce polymethylated triterpenoid
hydrocarbons, called botryococcenes which range from C30 to C37. Other hydrocarbons, which
the B race synthesizes in trace amounts, are squalene and C31-C34 methylated squalenes.
Hydrocarbon contents of up to 61 % in algae of race A have been discovered. Race B usually
gives hydrocarbon contents of 30-40 % while the L race has a hydrocarbon content of maximum
8 %. (18)
For B. braunii, hydrocarbon productivity is optimal when growth is in the exponential or early
linear phase, which means hydrocarbon production kinetics is growth associated. This also
indicates that the optimal operating conditions are when maximum growth rate is obtained. In the
linear growth phase the following empirical expression was obtained by Kojima et al.:
406.0
ρ – Production rate of hydrocarbons
μ – Specific growth rate
The growth related hydrocarbon production is a special feature of B. braunii, compared to many
other microalgae like Chlorella, which mainly produce fatty acids during nitrogen starvation.
(20) In fact hydrocarbon production does not take place during nitrogen and phosphorus
starvation of B. braunii (21) (22).
Factors important for growth are CO2, light, nutrients and water, as well as temperature
conditions and pH. Several studies have been performed on Botryococcus braunii to investigate
the ability to affect growth rate and hydrocarbon yield by changing different parameters.
It has been showed that air enriched with 1 % CO2 enhances growth; the doubling time of the
biomass was approximately 2.7 days instead of about 7 days with non-enriched air. Hydrocarbon
production also increased five times with CO2 enriched air. (23)
B. braunii requires light intensities in the range 40-90 W/m2 for optimal hydrocarbon production
(24) (25). It has been reported that B. braunii accepts irradiances between 15 and 180 W/m2 (24)
although Li et al. found a slow growing Japanese strain that was not affected in growth or lipid
content at the irradiance 300 W/m2 (25).
11
Studies on B. braunii indicate that to achieve optimal growth the temperature of the medium
should be around 25°C. Li et al. made a comparison between three different strains from
temperate to subtropical climate zones which all exhibited optimal growth at 25°C (25).
Furthermore most studies on B. braunii are performed at 25°C (26) (27) (28) (20). However,
differences between different strains and races are possible; especially since B. braunii can be
found in most climate zones.
Depending on the algae’s ability to adapt to salinity, they are categorized in two groups.
Halophilic algae that need salt to enhance growth and halotolerant algae which can survive in
salinity. Both groups, however, produce metabolites to protect them from the salt. Ranga Rao et
al showed that B. braunii (race A, strain LB 572 from University of Texas, USA) is adaptable to
lower levels of salinity. The lower salinity levels also give an increased production of biomass,
hydrocarbon content and fat. Maximum hydrocarbon content is 28 % w/w in the salinity range of
50-70 mM, while maximum biomass was achieved in 20-30 mM salinity. Total fat content was
24-28 % w/w where palmitic and oleic acids were the major fatty acids compared to the control
culture where the major fatty acids were stearic and linoleic acids. (29) B. braunii does not seem
to be particularly sensitive to changes in pH in the range of pH 6-11, although optimal growth
seems to occur at pH 6. (30)
Nutrients are also an important factor in growing the algae; the most commonly used growth
medium in different studies of the different B. braunii races is a modified Chu-13 medium, see
Appendix 1 (18) (28) (30). The effects of four major nutrients in this medium; potassium
dihydrogen phosphate, potassium nitrate, magnesium sulphate and ferric citrate, were examined
on a race A strain. The best combination was found to be concentrations of 0.0195, 0.05, 0.2 and
0.0185 g/l respectively. This composition gave a biomass yield of 0.65 g/l and a hydrocarbon
production of 50.6 % (w/w) after four weeks of incubation. (27) Furthermore, there is a
possibility to use treated wastewater as a source of nutrients. A study of the ability to remove
nitrogen and phosphorus from secondarily treated piggery wastewater, using B. braunii, gave a
dry cell weight of 8.5 g/l and hydrocarbon levels of 0.95 g/l after 12 days cultivation. (28)
2.5.6. Nannochloropsis salina
When talking to Algae Link, information was received that they are using an algae strain of
Nannochloropsis salina. Considering the problems encountered when using Botryococcus
braunii and the fact that useful data was accessible for Nannochloropsis salina the decision was
made to use the alga Nannochloropsis salina in the suggested process. This alga belongs to the
class Eustigmatophyceae and is a yellow-green unicellular microalga with a cell shape of an
ellipsoid and an average length of 3.3 and width of 1.9 μm. The dry weight of N. salina cells
reported by Volkman et al. is 8.3 pg. One has to bear in mind that these data are not absolute and
changes with the algae’s physiological state when harvested. This in turn will depend on many
factors such as light regime, growth temperature, nutrients supply etc. (31)
12
A study conducted by Boussiba et al. showed that permitted growth temperature for
Nannochloropsis salina (in laboratory experiments) ranged between 17-32 °C with optima at
28°C. The results from this study also pointed out that seawater did not have any effect on the
lipid content of the cells. The same is true when considering the pH of the culture. Decreased
productivity was observed only at the higher pH conditions in the permitted range of growth, pH
5-10.5. The study by Boussiba et al. also reports that to avoid contamination in a monoculture of
Nannochloropsis salina with diatoms, it is possible to use urea as a nitrogen source. (32)
From personal communication with the sales office at Algae Link the oil content of the cells
when harvested is 50 % (dry weight). However, in calculations in this report the oil content used
will be 40% (dry weight) since it is more consistent with other studies conducted on this subject.
2.5.7 Choosing an Algae Strain
B. braunii is one of the most known hydrocarbon producing algae. This fact that it’s well known
and thoroughly researched is one of its strengths. If an unknown alga strain is chosen, expert
knowledge and extensive research are required to produce necessary data concerning oil
composition and to properly dimension the equipment.
The high hydrocarbon content of race B and the fact that the alga produces these hydrocarbons
during growth and not starvation was one of the key factors for choosing this alga at first. The
fact that the alga grows in colonies has several positive but also negative effects. One positive
effect is easy separation since big particles (colonies) are easier to separate than small (cells).
The negative effects are problems caused by the extracellular matter causing clogging, the need
for fresh water as well as difficulties determining if the algae cellular material ends up in the
water or oil phase.
A supplier of photobioreactors for commercial use is Algae Link. For biodiesel purposes they
use the algae strain Nannochloropsis salina. Nannochloropsis salina has the following
advantages over Botryococcus braunii:
Nannochloropsis grows in seawater, which means there is no need for desalination
Nannochloropsis is no colony forming microalga (see Appendix 2), and has no
extracellular matter
Nannochloropsis is used in the photobioreactors produced by Algae Link; hence a more
accurate approximation can be done concerning yield in these specific photobioreactors.
Nannochloropsis salina is therefore the preferred algae strain in this feasibility study for use in
large scale biodiesel production and the calculations in the report will be based on
Nannochloropsis salina.
13
2.6 Harvesting of Algae - Separation of Particles from Water
Harvesting of microalgae is a major contributor to the total cost of algal biomass and might
contribute as much as 20-30 %. The harvesting method must handle large volumes due to dilute
culture broths, sometimes less than 0.5 grams dry algal biomass per litre broth. The small size of
microalgae, typically ranging from 3-30 microns in diameter makes the process complex. Many
separation processes could be used for the harvesting of microalgae, the choice of method
depends on a number of parameters such as algal species, cell density and culture conditions
(13).
The level of moisture is dependent on the harvesting method. Since mechanical dewatering is
less expensive than thermal drying, any thermal drying should be preceded by an effective
mechanical dewatering step (33).
2.6.1 Flocculation
Flocculation is a method that can be used to aggregate particles to increase the particle size and
thereby easing other separation methods such as sedimentation, filtration and centrifugation.
To aggregate microalgae cells the net negative charge of the cells must be neutralized or reduced
by adding a so called flocculants such as multivalent cations or cationic polymers. Some of these
flocculants may not be acceptable when the biomass is to be used in certain ways, such as
feedstock for animals. Higher cell concentrations and gentle mixing helps flocculation since this
makes the cell encounters more frequent. Excessive shear force as can be found in centrifugation
can disrupt the flocks (34).
Changing the pH of the solution by adding acids or bases can also act as a flocculent since the
ionization of functional groups on the algal cell surface are highly pH dependent. A combination
of cat ions and pH can also be used. For many algae such as Botryococcus braunii the most
efficient method of flocculation seems to be to change pH to around 11. A method suggested is
to change pH to 11 with potassium hydroxide to flocculate 85 % of the algae, and then treat the
water and remaining 15 % of algae back to appropriate pH with nitric acid after the removal of
the flocs. (34). The water-algae mixture is then recirculated and hence no major loss of algae
occurs. These chemicals are chosen since the salts they produce will function as nutrients which
are needed downstream in the process.
14
2.6.2 Gravity Sedimentation
Gravity sedimentation is a process that separates particles from liquids on the base of their
density difference and the particle diameter. If the solids that are to be separated consists of
individual particles of sizes of only a few micrometer in diameter the settling rates will be low
(35). The chosen alga, Nannochloropsis salina, is a unicellular alga culture. After flocculation
the cells aggregate which makes the sedimentation faster due to the larger effective diameter.
However, since the flocks are porous the rate of sedimentation will not be as fast as non porous
particles would be, due to the water content.
2.6.3 Centrifugal Recovery
Centrifugal separation uses the same principles as gravity sedimentation but enhances the settling
rate by centrifuging the particles. This method often replaces the gravity separators, since their
higher efficiency and smaller apparatus size for a given capacity (34).
Centrifugal recovery is often a preferred method for recovery of algal cells. High concentration
factors as well as high percentages of solids in concentrate can be obtained. Centrifugal recovery
is a rapid method but also an energy intensive method (33).
The use of centrifugation for harvest of low concentration of suspended solids is limited by the
power cost of handling large quantities of water. In the experiments conducted by T.-S Sim et al.
the energy demand is 1.3 kWh/m3 of pond water in order to produce 4-5 % of dry solid content
by weight from pond water containing 0.04-0.07 % of total suspended solids (36).
2.6.4 Ultrasound
Ultrasound is a method that can be used to harvest microalgae. The ultrasound process is based
on acoustically induced aggregation and enhanced sedimentation. Concentration factors of 20
can be reached with low biomass concentrations and low flow rates. This method uses more
energy than centrifugation, has less efficiency and lower concentration factors. Some benefits by
using ultrasound compared to centrifugation can be found at lab or pilot scale when other
parameters are important than for industrial scale (35).
2.6.5 Filtration
There are three main groups of filters; two of the main groups of filters may be used to recover
algal cells from a broth. These are: cake filtration in which the broth is filtered through a filter,
leaving a cake behind and cross flow filters, in which the suspension flows across the filter
medium at high velocities and pressure, leaving a more concentrated suspension behind. The
15
third main group is clarifying filters, but these do not suit the need of the harvesting methods,
since they are used to remove small amounts and the particles get trapped inside the filter (37).
In cake filtration the particles get immobilized in the filter and soon a cake is formed on the filter
surface, this cake has to be removed periodically. Cake filtration can be performed continuously
or discontinuously with pressure applied either upstream (positive pressure) or downstream
(vacuum) (37).
Both filter presses and rotary drum filters operating under pressure or vacuum are satisfactory for
recovering relatively large microalgae, but not satisfactory when the algae size approaches
bacterial dimensions. Pre-coating the filter with filter aid is possible to make the filtration easier,
but not suitable when contamination of the biomass cannot be tolerated (36).
In experiments conducted by T.-S Sim et al., using 12 µm mesh filter, the power requirement
ranged from 0.3-0.5 kWh per m3 broth giving about 3 % solids, the power consumption is
thereby much lower than their experiments with a centrifuge. Their experiments suggest
insignificant or small improvement in performance when flocculants were used. With small
algae the filter can clog and the flow through can get much lower (36).
Cross flow filtration may be applied to concentrate suspensions of fine particles. Cross flow
filtration can be useful for suspensions of very small particles as an alternative to normal
filtration since cakes formed by small particles give a high resistance to flow and thereby low
filtration rates (37).
Cross flow filtration is not an economical method for larger production volumes where
centrifugation is a more economic method (34).
2.6.6 Dissolved Air Flotation
In dissolved air flotation, air bubbles are passed into a solution in order to increase the buoyancy
and cause the particles to float by adhering themselves to the algal particles. For this method the
particle-size is crucial, the size is therefore often increased by flocculation. From the results of
T.S Sim et al tests, they found that dissolved air flotation is an economical method, but that
filtration is a better method when the size of the algae is not a problem (36).
2.6.7 Conclusion - Separation of Particles from Water
First flocculation as a pre-treatment method is used to increase the particle size by aggregating
the algae cells. This is necessary since Nannochloropsis salina grows in a unicellular manner.
Gravity sedimentation is used since it is a method that has low capital costs even if large scale
basins are needed. Centrifugal separation of dilute solution is rejected due to the large energy
16
costs. The use of ultrasound is not a viable option for large scale operations because of the
extremely high operating costs. Cross flow filtration as a harvest method rejects due to the large
scale of harvesting. Dissolved air flotation is a good and economical method for harvest of
microalgae. Although, after a discussion with Professor Jes la Cour Jansen, Department of
Chemical Engineering, Faculty of Engineering, Lund University, concerning flotation
experiments conducted on unicellular algae where the micro bubbles did not stick to the algae,
this is not used. The used method is flocculation followed by gravity sedimentation.
2.7 Extraction of Microalgal Oil from Biomass
In general, all separation methods of oils and fats from animal and vegetable materials share the
following common objectives: to obtain the fat or oil intact and free from undesirable impurities,
to gain the highest yield possible and at the same time not to interfere with the economy of the
process, to produce a residue with as high value as possible. (38)
To disrupt microorganisms, such as algae, may at first seem as an easy task to be done, but
Wimpenny among others refers that this is not true. Microorganisms are in fact more robust than
is generally believed. For example Wimpenny points out that the internal pressure inside the
organisms (studied organism were Micrococcus lysodeikticus and Sarcina lutea) can be as high
as 20 atmospheres. The structures, cellular walls and membranes, which resist this high pressure,
are in fact about as strong, weight for weight, as reinforced concrete. (39)
Most of the cell disruption methods developed for use with non-photosynthetic microorganisms
can also be applied to microalgae (39). For choosing the right extraction method for the large
scale recovery of algal oil from the cells certain parameters have to be considered. Among those
are: the ease with which the cells disrupt, the cost of method, the speed of the extraction method
applied etc. In the following sections some of the more promising extraction methods are
discussed.
2.7.1 Bead Mills
One way to disrupt the cells is by agitation in presence of small glass, steel or ceramic beads,
approximately 0.5 mm in diameter, in bead mills (39).
Cell disruption in bead mills is regarded as one of the most efficient techniques for physical cell
disruption. These mills consist of either a vertical or a horizontal cylindrical chamber with a
motor-driven central shaft supporting a collection of off-centered discs or other agitating
element. The chamber is filled to the desired level of beads which provide the grinding action.
(39)
17
2.7.2 Presses
There are a many different presses available on the market, i.e. screw, expeller, piston. Suitable
press configuration for the extraction is largely dependent on which algae strain that is being
used, since there is a vast variation among different strains in their physical attributes such as cell
dimensions, rigidity in the cell structures etc.
The amount of oil recovered from the cells depends on many factors. Among those is the rate at
which pressure is applied, the maximum pressure attained, the time allowed for oil drainage at
full pressure, and the temperature or the viscosity of the oil. (38)
Screw presses are used for extracting oils and fats from soybeans, cottonseed, peanuts and are
possible to use with almost any other variety of oil seed. This method for extraction can give as
low oil content as 3-4 % in the resulting cake. (38) Information about applying this extraction
method to algae cells is missing in literature, but could emerge as a viable alternative if the low
oil content in the cake is true when applying this technique on microalgae instead.
2.7.3 Solvent Extraction
Solvent extraction of oil in algae can be performed with a two solvent system. When allowing
algae to be in short contact with hexane experiments conducted by P. Metzger showed an
extraction yield of up to 70 % of the total hydrocarbons contained in the cells (18).
The disadvantages when using solvent extraction in commercial large scale is that the process
requires an extra energy input because the solvent needs to be distillated of, but also the risk for
the solvent used to contaminate the products, thereby limiting the options for their end use. (40)
One way to overcome the problems mentioned above could be to use the final product biodiesel
as the solvent. By recirculation of the final product to be used as the solvent, distillation would
not be necessary since the biodiesel can follow the crude oil through pretreatment and
transesterification. This would eliminate the large energy input needed to distillate the solvent
but also solve the problem related to contamination of the product – biodiesel.
2.7.4 Cavitation
Cavitation is a method that uses pressure differences and the resulting cavities collapses as a
result of the shifting pressures. The collapses cause high shock waves in the micro environment
and this causes the algae’s cell membranes to break. There are two types of cavitation, one using
ultrasonic cavitation and the other hydrodynamic cavitation. Ultrasonic cavitation utilizes sound
to create the oscillating pressure, causing the formation and collapse of cavities. The other is
18
hydrodynamic cavitation, where the pressure drop over simple geometrics like venturi pipes or
orifice are used. (41)
2.7.5 Less Known Methods
In lab scale there exists many ways to disrupt microbial cells, some of which are supercritical
CO2 extraction, osmotic shock, enzymatic and chemical lysis. However, none of these have been
object for further studies for large scale production of micro-algal-oil. The reason for this is
probably due to the high processing cost.
2.7.6 Conclusion - Extraction of Microalgal Oil from Biomass
The chosen method for the extracting the oil is the utilization of cavitation, since this is the most
viable method to disrupt the algae cell membranes. This method also eliminates the need of
adding solvents, which thereby lower the costs. The most suitable method of cavitation would be
hydrodynamic cavitation, since this is a safer and requires less energy than the ultrasonic
cavitation.
2.8 Termochemical Liquefaction - an Alternative Path?
By thermochemical liquefaction, it is possible to obtain greater amount of liquid fuel than just
the hydrocarbons, since other materials in the algal cells such as protein and fiber can be
converted to liquid fuel. The reaction can be performed in the temperature range of 200-350 °C
with or without a catalyst, such as sodium carbonate (4). In the thermochemical liquefaction the
algal mass is treated in a sealed autoclave with 20-30 MPa. Thermochemical liquefaction has the
advantage of being able to treat wet material, with water contents above 60 % based on total
weight, meaning no drying process is needed (5). Thermochemical liquefaction is best conducted
at 300 °C, the highest yield of fuel over mass achieved in this process, is well above the
maximum yield in any extraction step. With higher temperatures than 300 °C, thermochemical
degradation occurs (4).
The reaction mixture from the liquefaction is separated in a series of steps. The gas mixture,
mainly consisting of CO2 that could be sent back to the process, is easy to collect. Solvent
extraction is used to separate the oil and water phase, the solid residues are filtered and may be
dried if necessary. The solvent is separated from the oil by evaporation under low temperature
and pressure (4). There is a possibility to save money by reusing the waste water from the
liquefaction stage since it contains large parts of many of the inorganic nutrients supplied to the
algae as a fertilizer (5). Solid energy yield of the liquefaction process can be as high as 5 %, the
yield decreases with increased catalyst and increased temperature (42). The solids should be
taken care of to increase the total energy yield of the process.
19
When conducting thermochemical liquefaction on Botryococcus braunii, three separate fractions
are formed. One fraction is hydrocarbons with mean molecular weights in the range of 200-300;
this fraction is probably degraded products from the oil substances. The second fraction is the
botryococcenes, the oil produced from the algae. The third fraction is fairly large polar
substances. The first two fractions are suitable as energy feedstock. The third fraction might be
suitable for a feedstock for boiler fuel (43).
Thermochemical liquefaction might be an alternative to more conventional extraction steps. The
higher yield possible in this step as well as ability to threat wet materials might make this process
step a viable alternative even though large amounts of heat energy has to be supplied.
No further calculations were made on this alternative due to the complexity of this process step
with multiple purification steps, high temperature and pressure as well as problems finding any
data concerning the needs of this process.
2.9 Post Processing – Crude Oil to Biodiesel
2.9.1 EN 14214
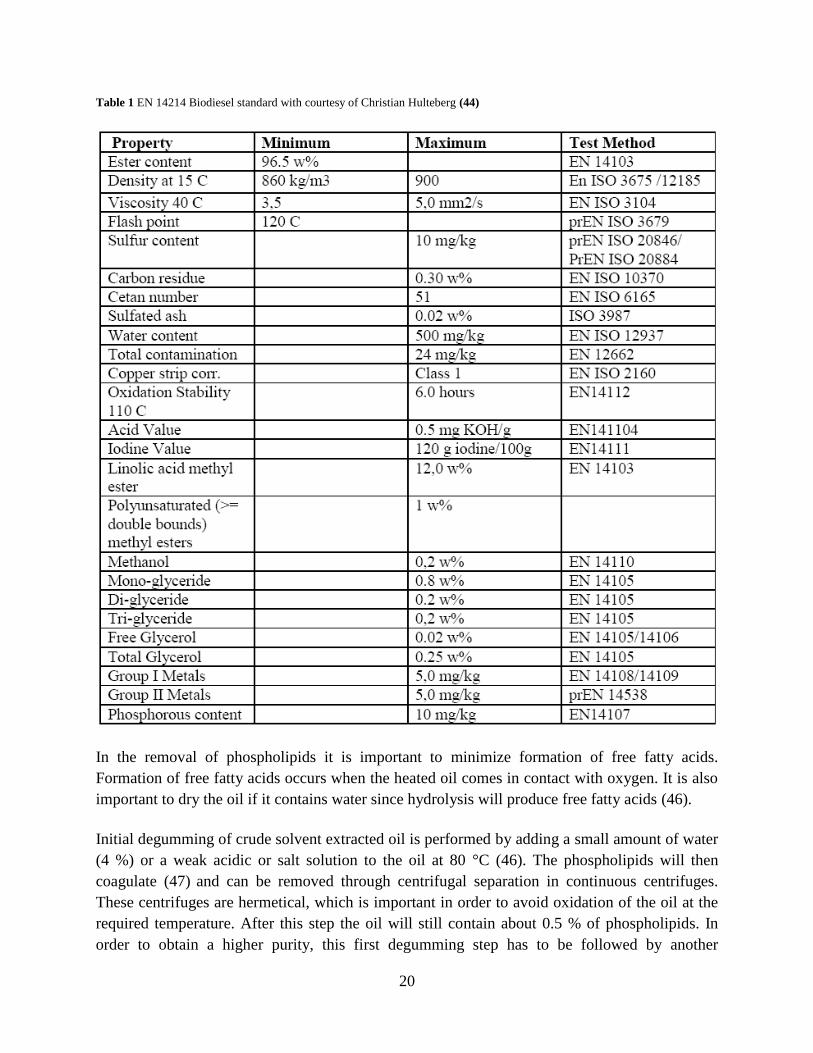
The common European standard for biodiesel is EN 14214. This standard sets specific demands
on the physical and chemical properties on the biodiesel for use in compression ignition motors.
The standard can be seen in Table 1. (44)
2.9.2 Pretreatment of Crude Oil
In order to minimize losses in further refining and fulfill the EN 14214 standard the algal oil will
most likely need some kind of pretreatment. The most important purification steps will be
removal of free fatty acids and degumming, which will remove phosphorous content.
2.9.2.1 Degumming – Removal of Phospholipids
Just like vegetable oils, oil from microalgae contains phosphorus in the form of phospholipids.
Phospholipids consist of hydrophilic heads and hydrophobic tails and will form reversed micelles
in non-aqueous systems (45). Since phosphorous will cause losses due to formation of emulsions
in the further refining of the oil (46) and a decrease in the efficiency of the catalytic converters in
diesel vehicles (47), phosphorous content of more than 10 mg l-1
is not allowed according to the
EN 14214 standard. It is important to remove the phospholipids, just after the extraction step,
otherwise the phospholipids will settle out in the containers when the oil is stored (46). The
phospholipid content will differ depending on which algae strain is used.
20
Table 1 EN 14214 Biodiesel standard with courtesy of Christian Hulteberg (44)
In the removal of phospholipids it is important to minimize formation of free fatty acids.
Formation of free fatty acids occurs when the heated oil comes in contact with oxygen. It is also
important to dry the oil if it contains water since hydrolysis will produce free fatty acids (46).
Initial degumming of crude solvent extracted oil is performed by adding a small amount of water
(4 %) or a weak acidic or salt solution to the oil at 80 °C (46). The phospholipids will then
coagulate (47) and can be removed through centrifugal separation in continuous centrifuges.
These centrifuges are hermetical, which is important in order to avoid oxidation of the oil at the
required temperature. After this step the oil will still contain about 0.5 % of phospholipids. In
order to obtain a higher purity, this first degumming step has to be followed by another
21
degumming step. Then, the oil is treated with 0.25-0.3 % (v/v) of 85 % phosphoric acid; the
remaining impurities will form a precipitate that is removed by a separator. After this step
neutralization is necessary to get stable oil. Neutralization is performed by adding the oil to a
0.1-0.3 M sodium hydroxide solution in a neutralizing column. The neutralized oil will then
contain traces of soap which will be removed by adding a water solution containing 0.05 %
(w/w) citric acid before drying the oil. When drying the oil, small amounts of free fatty acids and
sodium citrate are formed instead of citric acid and soap. Citrate has to be removed in a
bleaching step. (46)
Another way of degumming the oil is to use acetic anhydride. A small amount of acetic acid is
added to the oil together with water to hydrate the gum. The solution is heated before the
hydrated gums are centrifugally separated. To remove all of the acetic anhydride, the oil has to
be washed with water, before it is vacuum dried. This process will produce oil which needs no
neutralization with alkalis to obtain a stable product (38).
There is also a possibility of removing the phospholipids through ultrafiltration of crude oil.
Fluxes achieved in experiment are however too small for large scale production. Reported
numbers are; 0.75 kg/m2h with 3 MPa pressure and roughly 95 % removal of phospholipids (48),
20 l/m2h with 5 bar pressure and a retention on phospholipids of 73 % (48). Therefore it will not
be possible to use ultrafiltration in this case.
A final possibility would be to remove the final phospholipid content by distillation, since
phospholipids have a higher molecular weight than the crude oil they will remain in the residue
from the distillation. It is recommended to use wiped-film short-path evaporators with 10-200 Pa
operating pressure. (47)
2.9.2.2 Purification of Free Fatty Acids
Oil derived from algae such as Botryococcus braunii might contain high levels of free fatty acids
(FFA). Kalacheva et al. has shown that B. braunii Kützing contains about 10 % of total lipid
content. Although it is disputed that this particular strain belongs to B. braunii, analysis of the oil
composition suggests that this strain instead belongs to B. sudeticus. (49). In regular
transesterification of the oil into biodiesel by using base catalysts and methanol, the free fatty
acids will react with the base catalyst to produce soap. This will deactivate the catalyst or cause a
lower production yield. (50) This reaction will cause problems at levels as small as 0.5 % of total
lipid content. (51) To prevent this reaction, the FFAs should be either removed or converted into
an inert or useful material.
Studies have been made to convert the FFA to fatty acid methyl esters through esterification
using heterogenic acid catalysts and methanol. Batch reactions with catalysts in powder form
showed that the catalysts which gave the highest FFA conversion were WO3/ZrO2 and
22
SO42-
/ZrO2. The WO3/ZrO2 catalyst was chosen for a longer operation test in packed-bed since
loss of SO4-2
from the SO42-
/ZrO2 catalyst was likely. The longer operation test lasted for 140
hours and showed an FFA conversion of 65 %, which rose to 85 % after 20 hours just to decrease
back to 65 %. The increase after 20 h was due to the generated biodiesel, which improved the
miscibility of oil and methanol. Normally, increased temperature would lead an increased
catalyst activity; in this case however, catalyst activity only rose by 5 % between 75 C and
200 C due to the vaporization of methanol. With reaction time the catalyst structure changed,
although this was due to deposition of soybean oil, which is regenerable, and not due to W
leaching. This means it is possible to regenerate the catalyst. Powder catalysts gave a FFA
conversion of 85-90 % for both catalysts and the pellet-type WO3/ZrO2 catalyst a conversion of
65 %. (51)
Many different catalysts can be used for the esterification reaction, the best homogenous phase
catalyst choice might be ferric sulfate due to the easier separation and lower cost than for sulfuric
acid, and this reaction setup can produce conversions up to 97% at 3 hours residence time and
95 °C (52). The downside with this reaction is that the catalyst has to be separated from the
reaction mixture to be recirculated. Heterogeneous catalysts such a WO3/ZrO2 catalyst give a
conversion of 65-70% at one hour residence time and a high methanol to FFA ratio and a 75 °C
(51) Higher conversions can be achieved by increasing the residence time in the reactor, 3 hours
give a yield about 80% and 10 hours almost 100% yield for a tungsten-zirconia catalyst at
120 °C (53)
Another solution to the problem would be to have a pre-treatment process using a homogeneous
catalyst. FFA is converted into esters by mixing the crude oil with methanol in a 0.60 w/w
methanol-to-oil ratio and using 1 % w/w H2SO4 as catalyst. The reaction takes place at a
temperature of 50 C and reaction time is one hour. (54)
2.10 Transesterification of Crude Oil to Biodiesel
The most common process for transesterification today uses a base catalyst, either sodium
hydroxide or potassium hydroxide, in a homogenous phase reaction. The reaction takes place at
atmospheric pressure, just below the boiling temperature of methanol; the reaction time is about
two hours. (55)
This process has some major drawbacks like the undesired saponification reaction in which the
base catalyst is consumed by the free fatty acids present in the oil. Another drawback is the
complicated purification when the products and catalyst has to be separated (56).
Due to these major drawbacks of the homogenously catalyzed transesterification step, many
other methods have been investigated and some seem promising. The main types of processes
23
possible for transesterification described in the literature are base catalyzed, acid catalyzed,
enzyme catalyzed and supercritical processes.
2.10.1 Heterogeneous Catalysis
One of the main reasons for considering heterogeneous catalysis is that the post processing with
heterogeneous catalysis is less complicated than for homogenous catalysis. But due to diffusion,
the three phase system often gives low reaction rates in experiments. Compounds suitable as
catalysts are alkaline earth metal hydroxides, oxides and alkoxides (57).
2.10.2 Supercritical Methanol
Transesterification can be conducted by a supercritical methanol process; this process is
conducted at high temperature in the range of 200-350 °C and at pressures around 35 MPa.
Supercritical processes have some advantages compared to catalytic processes that make them
interesting. One of the most striking differences is the absence of a catalyst. This leads to the
following: no saponification, less after-process separation, less sensibility to water content, no
problems with corrosive environment and fewer waste products. The reaction time for the
supercritical process is extremely short, only 4 min (58), compared to other transesterification
processes (59). This means that a smaller reaction vessel is required which, together with easier
post treatment and no catalyst cost, may compensate for the more expensive process equipment
and costs for higher temperature and pressure.
2.11 Suitable Plant Location
Biodiesel production of microalgae can be cultivated in many different environments. If
biodiesel from microalgae are to be the large scale solution for our growing energy demand, food
production for a growing population might be affected if farmland is used for fuel production.
Therefore the location should preferably be land with no major farming opportunities.
Microalgae, as all photosynthetic life forms need sunlight to grow. The production facilities are
costly and therefore it is important to have a high total production of the plant, in order to
achieve this, sunlight must be readily available. Most microalgae prefer water temperatures
around 25 °C but need to have water temperatures below 30 °C to survive. In closed
photobioreactors the temperature of the system increases by the incoming sunlight and cooling of
the growth medium is therefore extremely important. Possibility to cool the growth medium to
optimal temperature is an extremely important parameter when choosing the location, if the
natural temperature is not optimal. The daily variation and seasonal changes in weather, as well
as the availability, price and temperature of cooling water, limits the location to coastal areas or
inland areas with readily available water. Since microalgae need large amounts of carbon dioxide
and other inorganic nutrients, the availability and price of these products are important. Large
industrial complexes can supply carbon dioxide as flue gas from combustion of various organic
24
substances. Other necessary nutrients must be purchased and transported to the site, if not
acquired for free as partially treated waste water from a large city. Many algae strains suitable
for biodiesel production are fresh water strains. If no freshwater is available, desalination must
be performed since the used algae can be freshwater strains which do not grow optimally and
sometimes not at all in saline water.
The perfect location has many hours of sunlight per year and low seasonal variations in
temperature, suitably a desert. The location should also be next to a power plant which is a
source of free carbon dioxide. There is also need for a secure source of water for both cultivation
and cooling. Is there such a place on earth? Probably not, but the sunlight must be the most
important factor closely followed by the possibility to cool the growth media with sufficiently
cool water.
One alternative would be to locate the facility in Qatar. Firstly Hydro is building two large
aluminum smelting plants in Qatar which solves the problem with free access to carbon dioxide.
Secondly Qatar has a lot of land area that would not compete with areal for food production. It is
also one of the best places in the world when comparing sun-hours, though a big drawback
would be the high day temperatures from March to December. The Persian Gulf might also have
a too high temperature in order for Qatar to be a perfect choice for a plant location. Future
molecular level engineering of the algae strain can possibly solve this problem through increased
temperature tolerance (2).
When considering other options South Africa seems like a favorable alternative. There are
aluminium smelting plants in South Africa as well. South Africa has lower air and sea
temperatures than Qatar although one downside is less hours of sun.
Locations that might be suitable are coastal areas in Qatar, South Africa and Australia. The main
reasons for choosing these places can be summarized by the following factors:
Suitable climate, sunlight and temperatures, for microalgae production.
Production facilities that releases CO2
Access to water
Non-expensive land
2.12 Conclusion
The location of the production facilities for microalgae cultivation needs land with suitable
characteristics such as many sunlight hours and cooling possibilities if the temperature gets too
high. Readily available carbon dioxide as well as excess energy from other industrial processes is
also important aspects to consider when choosing the location. Three suitable places for algae
cultivation are Qatar, South Africa and Australia. When considering the factors above South
25
Africa was chosen. Qatar has too high temperatures and it is concluded that it would be difficult
to find a cooling system that would handle such large quantities of water without affecting the
overall feasibility. However, if this problem is solved Qatar would be the best alternative
considering the number of sun-hours.
The cultivation should be carried out in closed tubular photobioreactors since they provide the
most favorable characteristics.
The separation step is carried out through flocculation and sedimentation. This is the most
suitable alternative, considering the dilute solutions which will make other separation techniques
energy consuming.
The method of choice for the extraction, where the crude oil from the microalgae is derived, is
hydrodynamic cavitation.
Since the phospholipid content of Nannochloropsis salina is unknown, it is assumed that the
crude oil needs some pre-treatment to remove phospholipids. The chosen method is the most
common method of using phosphoric acid.
The crude oil contains free fatty acids; these are removed by converting the FFA to fatty acid
methyl esters through esterification using heterogenic acid catalysts and methanol.
The pre-treated crude oil is converted to biodiesel through homogenous phase base catalyzed
transesterification. This is a well known process and is the same whether upgrading soybean oil,
oil from oil palm or crude oil from micro algae.
26
3 Flow Diagram
In Flowsheet A, the process chosen in the conclusion of the chapter above “Technology Suitable
for Large-Scale Production” is presented; this is the process that was designed and cost
estimated. Another process alternative is also presented in Flowsheet B, but it is not investigated
through calculations in this report. It could have been interesting to compare the two processes’
cost effectiveness, but no calculations of the alternative process have been made; this mostly due
to the limited time available for the project.
3.1 Main Process Alternative
The chosen method for producing algae oil from N. salina consists of a number of unit
operations. The algae are cultivated in a closed photobioreactor consisting of multiple pipes and
the algae-water mixture is separated by a flocculation-sedimentation unit. 85% of the algae is
separated, the water containing the remaining algae is recirculated and hence no major loss of
algae occurs. The algae cells are disrupted by a hydrodynamic cavitation unit, the disrupted cells
and water are separated from the oil phase in a stirring settling tank unit followed by an oil water
separator. The phosphorous content of the oil is removed in a degumming step and the free fatty
acids are reacted with methanol in order to esterify the FFAs into methyl esters. All these main
unit operations can be seen in Flowsheet A.
3.2 An Alternative Process
Before the disruption method of algae cells using hydrodynamic cavitation emerged as an
alternative way for disruption of algae cells, an alternative process including a bead mill was
looked upon. This process can be seen in Flowsheet B. One of the main reasons why it was not
the chosen process was due to missing information, both on the wet bead mill’s ability for large
scale operation but also the lack of data for making it possible to calculate the energy needed for
operating the unit. Today wet bead mills are, to the principal investigators’ best knowledge, only
used for small scale disruption of microalgae, where high value products are extracted.
The main unit operation differing from the chosen process seen on Flowsheet A, is the use of a
wet bead mill instead of a cavitation equipment. Because a wet bead mill operates with a dry
weight of approximately 50 %, a larger amount of water has to be removed. Equipment for this
task have been suggested to include a centrifuge operating parallel with a spray dryer using the
flue gas from the facility feeding the photobioreactor with carbon dioxide. Here the spray dryer
is used to increase the dry weight of the algae before disruption occurs, while in the chosen
process the flue gas in the dryer is used to dry the byproduct constituted of crushed cell walls.
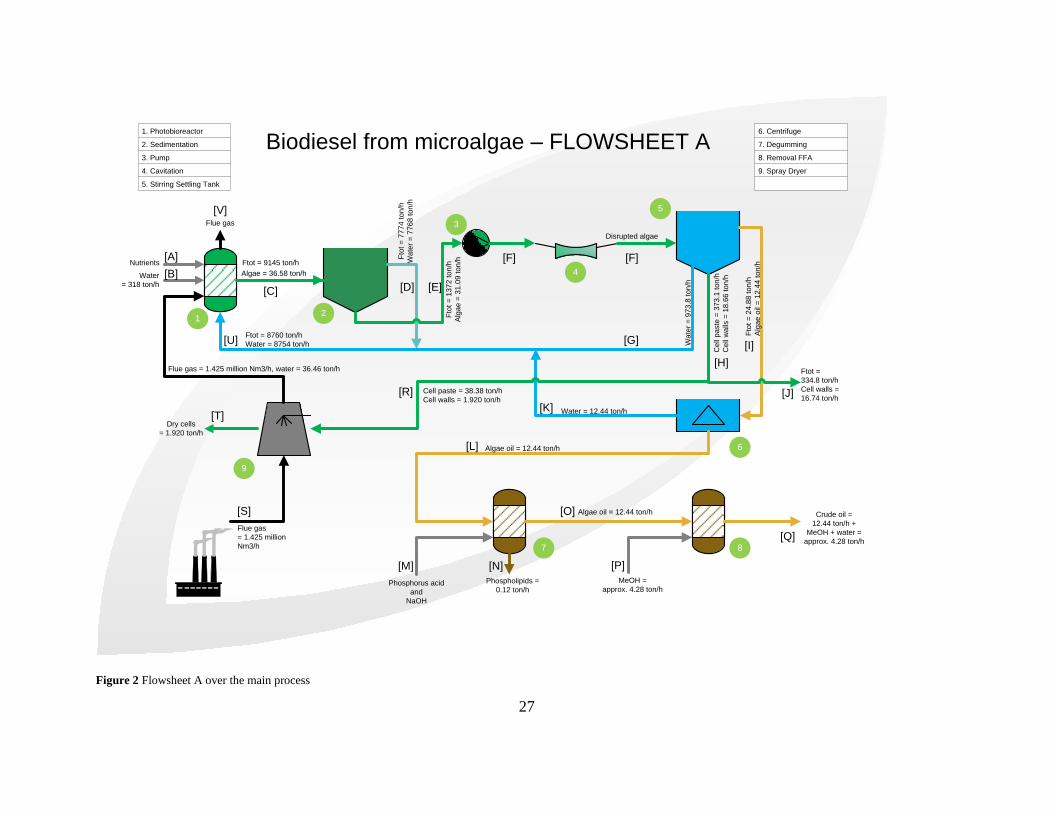
27
Biodiesel from microalgae – FLOWSHEET A
Nutrients
Water
= 318 ton/h
1
Ftot = 9145 ton/h
Ftot = 8760 ton/h
Water = 8754 ton/h
2 Fto
t =
13
72
to
n/h
Alg
ae
= 3
1.0
9 to
n/h
3
4
5
6
7 8
9
MeOH =
approx. 4.28 ton/hPhospholipids =
0.12 ton/hPhosphorus acid
and
NaOH
Ce
ll p
aste
= 3
73
.1 to
n/h
Ce
ll w
alls
= 1
8.6
6 to
n/h
Crude oil =
12.44 ton/h +
MeOH + water =
approx. 4.28 ton/h
Flue gas
= 1.425 million
Nm3/h
Wa
ter
= 9
73.8
to
n/h
Water = 12.44 ton/h
Fto
t =
77
74
to
n/h
Wa
ter
= 7
76
8 to
n/h
Dry cells
= 1.920 ton/h
Flue gas = 1.425 million Nm3/h, water = 36.46 ton/h
Disrupted algae
Fto
t =
24
.88
to
n/h
Alg
ae
oil
= 1
2.4
4 to
n/h
Algae oil = 12.44 ton/h
1. Photobioreactor
2. Sedimentation
3. Pump
4. Cavitation
5. Stirring Settling Tank
6. Centrifuge
7. Degumming
8. Removal FFA
9. Spray Dryer
Flue gas
Algae = 36.58 ton/h
Algae oil = 12.44 ton/h
Cell paste = 38.38 ton/h
Cell walls = 1.920 ton/h
[F][F]
[E][D][C]
[A]
[B]
[G]
[H]
[I]
[J]
[K]
[R]
[T]
[S]
[U]
[L]
[O]
[M] [N] [P]
[Q]
[V]
Ftot =
334.8 ton/h
Cell walls =
16.74 ton/h
Figure 2 Flowsheet A over the main process
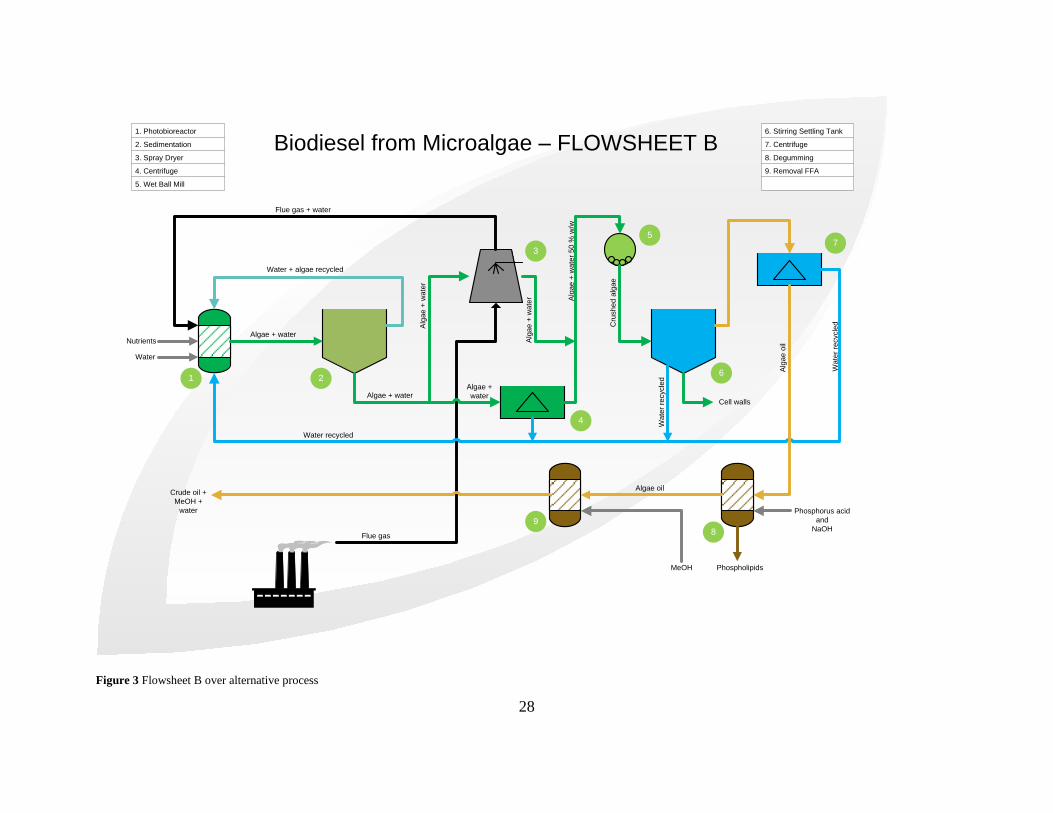
28
MeOH Phospholipids
Phosphorus acid
and
NaOH
Crude oil +
MeOH +
water
Water recycled
Wa
ter
recycle
d
Wa
ter
recycle
d
Flue gas + water
Water
NutrientsAlgae + water
Algae + water
Water + algae recycled
Cru
sh
ed
alg
ae
Alg
ae
oil
Alg
ae
+ w
ate
r 5
0 %
w/w
Cell walls
Biodiesel from Microalgae – FLOWSHEET B
Flue gas
1 2
3
4
5
6
7
8
9
1. Photobioreactor
2. Sedimentation
3. Spray Dryer
4. Centrifuge
5. Wet Ball Mill
6. Stirring Settling Tank
7. Centrifuge
8. Degumming
9. Removal FFA
Alg
ae
+ w
ate
r
Algae +
water
Alg
ae
+ w
ate
r
Algae oil
Figure 3 Flowsheet B over alternative process
29
4 Cost Estimates
4.1 Total Annual Cost
The total annual cost for algae oil production facility is summarized as the capital cost and the
operating cost. The results are summarized in Appendix 6.
4.1.1 Capital Costs
The capital investment is calculated by summarizing the cost of all process equipment found in
Appendix 3. Depending on the method used for cost estimation or the status of the equipment,
different add-on factors are used to the bare module costs.
For turnkey equipment and module factors calculated by the Ulrich method, the adding factors
were contingency and contracting (15%) and on site infrastructure/auxiliary facilities (5%). For
the non-turnkey equipment, where the cost was given by a commercial company, all add on
factors described in the book “Projekteringsmetodik” (60) with the given rule of thumb
approximations were used. These factors include; Installation, building, land improvement,
transportation and insurance as well as social benefits and overtime, engineering, contractor,
contingency and support equipment. The results are summarized in Appendix 4.
In the estimations of capital costs for the different equipment in the process a method described
in Ulrich, G. D., A guide to Chemical engineering Process Design and Economics, Wiley, 1984
is used (61). In this method the equipment’s total contribution to both the direct and indirect
construction cost, CBM , is calculated using Equation 1.
Equation 1
(1)
CBM is the installed bare module cost, Cp the purchased equipment cost and finally which is
a factor taking into consideration both the type of material and deviations from normal
temperature and pressure as well as including installation, buildings, land improvement,
transportation and insurance, social benefits and overtime and engineering.
The depreciated capital cost for the algae oil production facility is calculated with the well know
annuity factor model (62), the results are summarized in Appendix 5. The total value of the
factory at the end of its expected useful life span is set to zero when calculating the capital cost.
The tanks and equipment built in metal should have a positive value at the end of its useful life
30
span, but the main cost that is the photobioreactor mainly built in plastics could well result in a
net negative value.
4.1.1.1 Cost Estimation of Land Requirement
Estimations on cost of land requirement are usually not done, due to the increasing value of the
land making compensation for decreasing value unnecessary. A brief estimation also shows that
it is negligible. A search for available land in South Africa in the province Kwazulu Natal gave a
price of 9.950 000 ZAR for a land area of 350 Ha (63). This is less than half of what the
photobioreactors require (750 Ha). Considering that the price of 350 Ha of land is 896 658 Euro
and the difficulty to set an exact valid price due to large uncertainties on location, the cost of
land are seen as negligible at this stage. The cost of land is only a few percent or smaller of the
total capital cost. For exchange rates, see Appendix 9.
4.1.2 Operating Costs
The operating costs for producing algae oil is calculated by the method described in the book
“Projekteringsmetodik” (60) with the given rule of thumb approximations (60). The results are
summarized in Appendix 6.The major energy consumption units can be found in Appendix 3 and
are summarized in Appendix 4.
The electricity costs for large scale consumption in South Africa can be approximated as 0.1
ZAR/kWh according to Dr. Christian Hulteberg (64).
The total energy consumption of the facility is calculated by multiplying the energy consumption
of the large scale consuming equipment with a small factor. Extra equipment adds a total of 2 %
to the total energy consumption.
4.2 General Assumptions
In order to make a cost approximation, certain assumptions have been made regarding our base
case.
The algae contain 40% (w/w) oil
Nannochloropsis salina is possible to flocculate
No loss of algae biomass, since the water containing 15% of the algae is recirculated
from the sedimentation into the photobioreactors
The production in our photobioreactor is 500 g/(m3) day
Facility operating 335 days a year
Useful life span of factory is 15 years
31
The production facility is in close proximity to a 400 MW NGCC plant providing carbon
dioxide as well as support equipment
Production costs are calculated for South African conditions
Algae cultivation are performed in Algae Link’s photobioreactors
All process units are viable for their operation, for example the cavitation equipment can
process high dry weight content and disrupt the algae cell
The rate of interest for the capital investment is 10 %.
It should be noted that if any of these assumptions prove to be false this will have extensive
effects on the overall process. Therefore, a sensitivity analysis is performed and presented later
in this feasibility study,
4.3 Mass Balances
Calculations of the different flow rates in the process were performed on the base case, 0.4 %
concentration of algae when harvesting and a daily production rate of 500 g m-3
day-1
. The oil
content of the algae was set to 40 %. The calculated flow rates in the process, needed to meet the
required yearly production of 100 000 ton crude oil, can be seen on Flowsheet A and in
Appendix 7.
Assumptions made in the calculations of the flow rates are:
Degree of separation of algae from water in the flocculation/sedimentation step is set
to 0.85
Flow ratio stream [D]/[E] = 0.85
Oil content in dry algae is set to be 40 % (dry weight)
Dry weight of cell paste in stream [H] = 0.05
100 % degree of separation in the centrifuge step (6) is assumed
Stream [N] is assumed to be 1 % of stream [L], resulting in 0.12 ton/h of phospholipids
Flow rates of H3PO3 and NaOH needed in the degumming stage (7) are not calculated
and neglected due to no large quantities are needed
4.4 Cost Estimates of Unit Operations
4.4.1 Cost of Photobioreactor Facility
No estimations are performed regarding the system for sterilization of the incoming seawater.
This might lead to an underestimation of the production costs.
The cost of the photobioreactor system is based on the commercial company Algae Link’s
photobioreactors. This technology is not yet proven in large scale facilities, why production
32
estimates are seen as future technology performance. The performance estimated in this
feasibility study therefore compensates for differences between future and current technology by
dividing the future performance value by 3. Using this estimation from a commercial company
with the current technology gives a more accurate price than if the facility should be estimated
without any commercial connection.
If the cost should be estimated without using Algae Link’s tubular photobioreactors, a number of
questions arise; questions which are very hard to answer without extensive laboratory and pilot
scale experiments. The questions involve: suitable diameter on the tubing, how agitation in the
tubing is solved, how cleaning of the inside of the photobioreactor is secured. Further questions
are; how the produced oxygen is removed to prevent the algae culture from suffering from
oxygen oversaturation and how the insertion of CO2 is solved. These are just a few of the
questions encountered while looking at tubular photobioreactor systems. Therefore the estimates
will be carried out as follows:
Algae Link, has given an approximate price for a facility producing 100 tons of dry algae mass
per day. Algae Link stresses the fact that they cannot give a real price until a pilot plant has been
run on the chosen location. This is due to the fact that the algae growth and hence the size of the
facility varies greatly dependent on the growth conditions on site.
Information on Algae Link’s homepage estimates a 100 tons facility to have a photobioreactor
volume of 66 667 m3. Simple calculations give that the growth rate per m
3 and day should be in
the order of 1500 grams/(m3·day). This is theoretical values which is not possible to achieve
today. When talking to Algae Link the following estimations were given.
Table 2 Table showing growth rates of the algae at different sun radiation
Sun radiation g/m3 day
Intermediate (production indoors, in the Netherlands) 300
Good 600
Very Good 900
Exceptionally good 1200
Theoretical 1500
An assumption of reaching 500 g/m3·day is made, thus the growing facility needs to be three
times as big as the theoretical value given by Algae Link.
This gives the approximate values for a 100 ton/day dry algae mass facility:
Purchase price: 15 million Euro · 3 = 45 million Euro
Energy demand pumps: 327 kW · 3 = 981 kW
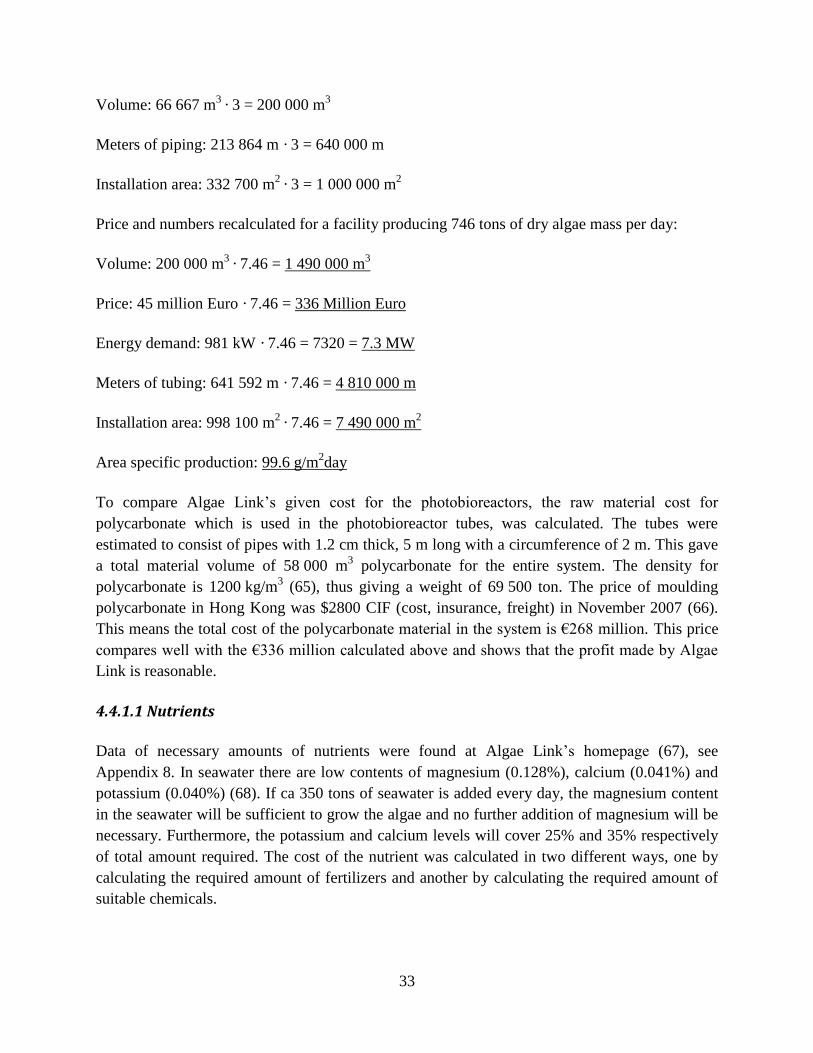
33
Volume: 66 667 m3
· 3 = 200 000 m3
Meters of piping: 213 864 m · 3 = 640 000 m
Installation area: 332 700 m2
· 3 = 1 000 000 m2
Price and numbers recalculated for a facility producing 746 tons of dry algae mass per day:
Volume: 200 000 m3
· 7.46 = 1 490 000 m3
Price: 45 million Euro · 7.46 = 336 Million Euro
Energy demand: 981 kW · 7.46 = 7320 = 7.3 MW
Meters of tubing: 641 592 m · 7.46 = 4 810 000 m
Installation area: 998 100 m2
· 7.46 = 7 490 000 m2
Area specific production: 99.6 g/m2day
To compare Algae Link’s given cost for the photobioreactors, the raw material cost for
polycarbonate which is used in the photobioreactor tubes, was calculated. The tubes were
estimated to consist of pipes with 1.2 cm thick, 5 m long with a circumference of 2 m. This gave
a total material volume of 58 000 m3 polycarbonate for the entire system. The density for
polycarbonate is 1200 kg/m3 (65), thus giving a weight of 69 500 ton. The price of moulding
polycarbonate in Hong Kong was $2800 CIF (cost, insurance, freight) in November 2007 (66).
This means the total cost of the polycarbonate material in the system is €268 million. This price
compares well with the €336 million calculated above and shows that the profit made by Algae
Link is reasonable.
4.4.1.1 Nutrients
Data of necessary amounts of nutrients were found at Algae Link’s homepage (67), see
Appendix 8. In seawater there are low contents of magnesium (0.128%), calcium (0.041%) and
potassium (0.040%) (68). If ca 350 tons of seawater is added every day, the magnesium content
in the seawater will be sufficient to grow the algae and no further addition of magnesium will be
necessary. Furthermore, the potassium and calcium levels will cover 25% and 35% respectively
of total amount required. The cost of the nutrient was calculated in two different ways, one by
calculating the required amount of fertilizers and another by calculating the required amount of
suitable chemicals.
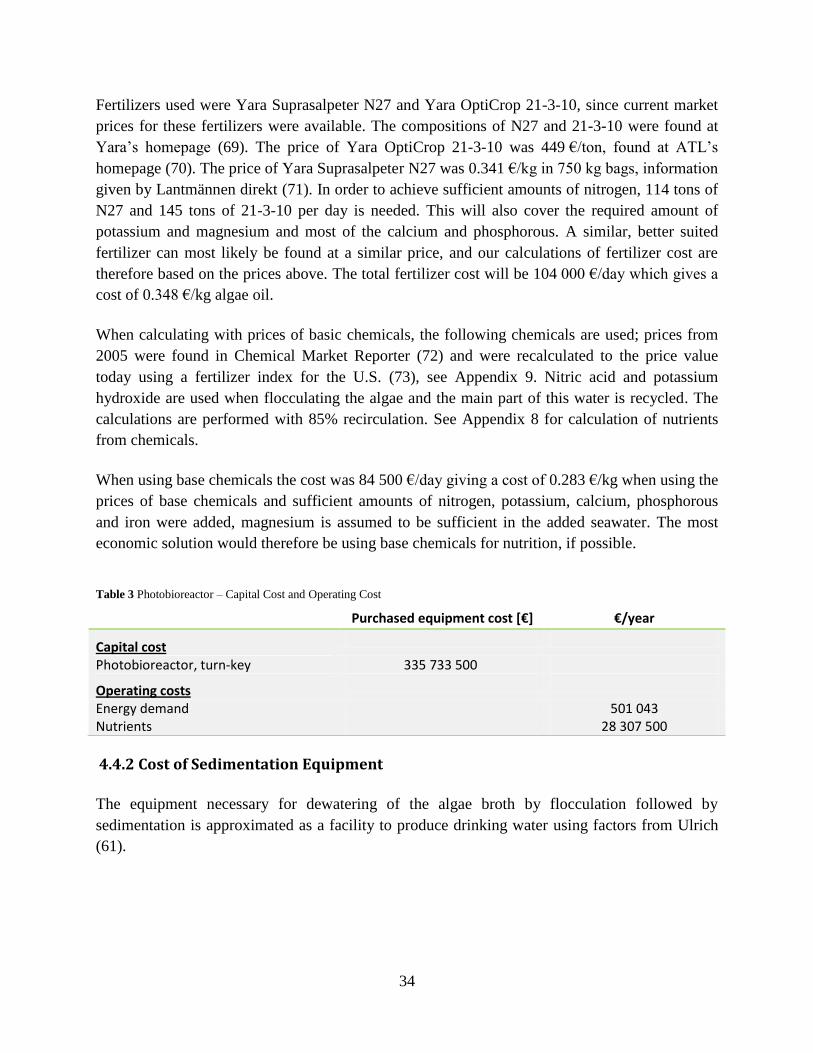
34
Fertilizers used were Yara Suprasalpeter N27 and Yara OptiCrop 21-3-10, since current market
prices for these fertilizers were available. The compositions of N27 and 21-3-10 were found at
Yara’s homepage (69). The price of Yara OptiCrop 21-3-10 was 449 €/ton, found at ATL’s
homepage (70). The price of Yara Suprasalpeter N27 was 0.341 €/kg in 750 kg bags, information
given by Lantmännen direkt (71). In order to achieve sufficient amounts of nitrogen, 114 tons of
N27 and 145 tons of 21-3-10 per day is needed. This will also cover the required amount of
potassium and magnesium and most of the calcium and phosphorous. A similar, better suited
fertilizer can most likely be found at a similar price, and our calculations of fertilizer cost are
therefore based on the prices above. The total fertilizer cost will be 104 000 €/day which gives a
cost of 0.348 €/kg algae oil.
When calculating with prices of basic chemicals, the following chemicals are used; prices from
2005 were found in Chemical Market Reporter (72) and were recalculated to the price value
today using a fertilizer index for the U.S. (73), see Appendix 9. Nitric acid and potassium
hydroxide are used when flocculating the algae and the main part of this water is recycled. The
calculations are performed with 85% recirculation. See Appendix 8 for calculation of nutrients
from chemicals.
When using base chemicals the cost was 84 500 €/day giving a cost of 0.283 €/kg when using the
prices of base chemicals and sufficient amounts of nitrogen, potassium, calcium, phosphorous
and iron were added, magnesium is assumed to be sufficient in the added seawater. The most
economic solution would therefore be using base chemicals for nutrition, if possible.
Table 3 Photobioreactor – Capital Cost and Operating Cost
Purchased equipment cost [€] €/year
Capital cost
Photobioreactor, turn-key 335 733 500
Operating costs
Energy demand 501 043 Nutrients 28 307 500
4.4.2 Cost of Sedimentation Equipment
The equipment necessary for dewatering of the algae broth by flocculation followed by
sedimentation is approximated as a facility to produce drinking water using factors from Ulrich
(61).
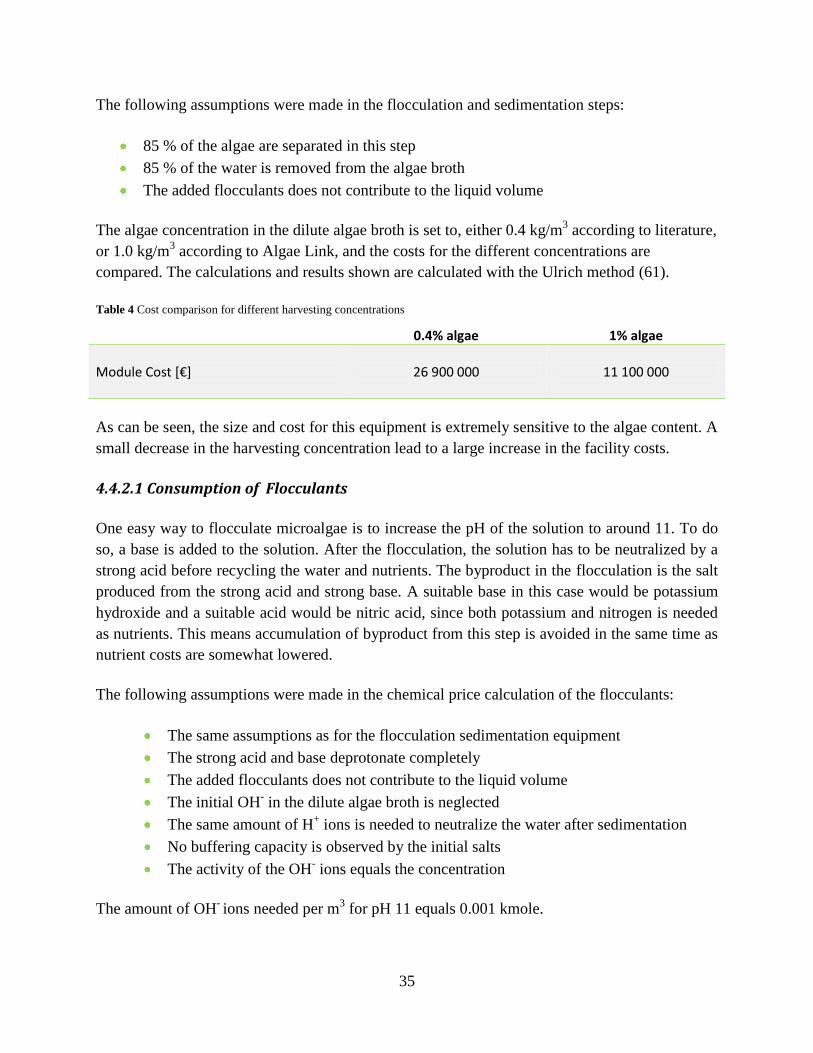
35
The following assumptions were made in the flocculation and sedimentation steps:
85 % of the algae are separated in this step
85 % of the water is removed from the algae broth
The added flocculants does not contribute to the liquid volume
The algae concentration in the dilute algae broth is set to, either 0.4 kg/m3 according to literature,
or 1.0 kg/m3 according to Algae Link, and the costs for the different concentrations are
compared. The calculations and results shown are calculated with the Ulrich method (61).
Table 4 Cost comparison for different harvesting concentrations
0.4% algae 1% algae
Module Cost [€]
26 900 000 11 100 000
As can be seen, the size and cost for this equipment is extremely sensitive to the algae content. A
small decrease in the harvesting concentration lead to a large increase in the facility costs.
4.4.2.1 Consumption of Flocculants
One easy way to flocculate microalgae is to increase the pH of the solution to around 11. To do
so, a base is added to the solution. After the flocculation, the solution has to be neutralized by a
strong acid before recycling the water and nutrients. The byproduct in the flocculation is the salt
produced from the strong acid and strong base. A suitable base in this case would be potassium
hydroxide and a suitable acid would be nitric acid, since both potassium and nitrogen is needed
as nutrients. This means accumulation of byproduct from this step is avoided in the same time as
nutrient costs are somewhat lowered.
The following assumptions were made in the chemical price calculation of the flocculants:
The same assumptions as for the flocculation sedimentation equipment
The strong acid and base deprotonate completely
The added flocculants does not contribute to the liquid volume
The initial OH- in the dilute algae broth is neglected
The same amount of H+ ions is needed to neutralize the water after sedimentation
No buffering capacity is observed by the initial salts
The activity of the OH- ions equals the concentration
The amount of OH- ions needed per m
3 for pH 11 equals 0.001 kmole.
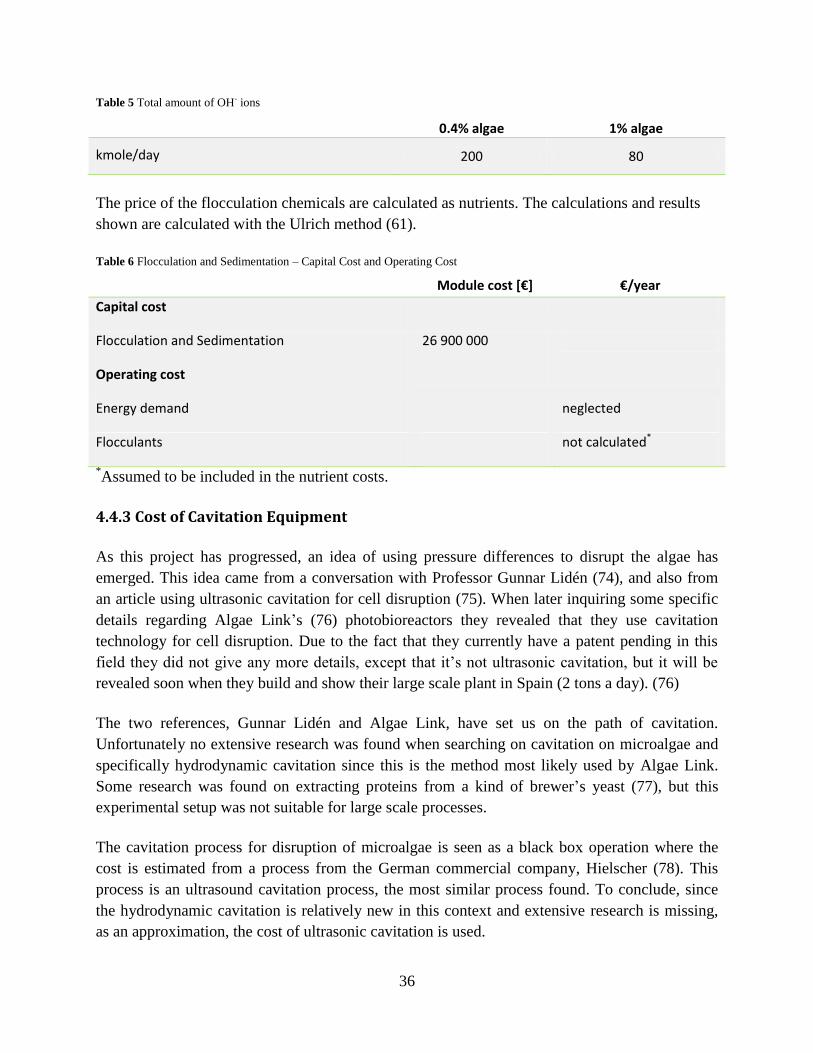
36
Table 5 Total amount of OH- ions
0.4% algae 1% algae
kmole/day 200 80
The price of the flocculation chemicals are calculated as nutrients. The calculations and results
shown are calculated with the Ulrich method (61).
Table 6 Flocculation and Sedimentation – Capital Cost and Operating Cost
Module cost [€] €/year
Capital cost
Flocculation and Sedimentation 26 900 000
Operating cost
Energy demand neglected
Flocculants not calculated*
*Assumed to be included in the nutrient costs.
4.4.3 Cost of Cavitation Equipment
As this project has progressed, an idea of using pressure differences to disrupt the algae has
emerged. This idea came from a conversation with Professor Gunnar Lidén (74), and also from
an article using ultrasonic cavitation for cell disruption (75). When later inquiring some specific
details regarding Algae Link’s (76) photobioreactors they revealed that they use cavitation
technology for cell disruption. Due to the fact that they currently have a patent pending in this
field they did not give any more details, except that it’s not ultrasonic cavitation, but it will be
revealed soon when they build and show their large scale plant in Spain (2 tons a day). (76)
The two references, Gunnar Lidén and Algae Link, have set us on the path of cavitation.
Unfortunately no extensive research was found when searching on cavitation on microalgae and
specifically hydrodynamic cavitation since this is the method most likely used by Algae Link.
Some research was found on extracting proteins from a kind of brewer’s yeast (77), but this
experimental setup was not suitable for large scale processes.
The cavitation process for disruption of microalgae is seen as a black box operation where the
cost is estimated from a process from the German commercial company, Hielscher (78). This
process is an ultrasound cavitation process, the most similar process found. To conclude, since
the hydrodynamic cavitation is relatively new in this context and extensive research is missing,
as an approximation, the cost of ultrasonic cavitation is used.
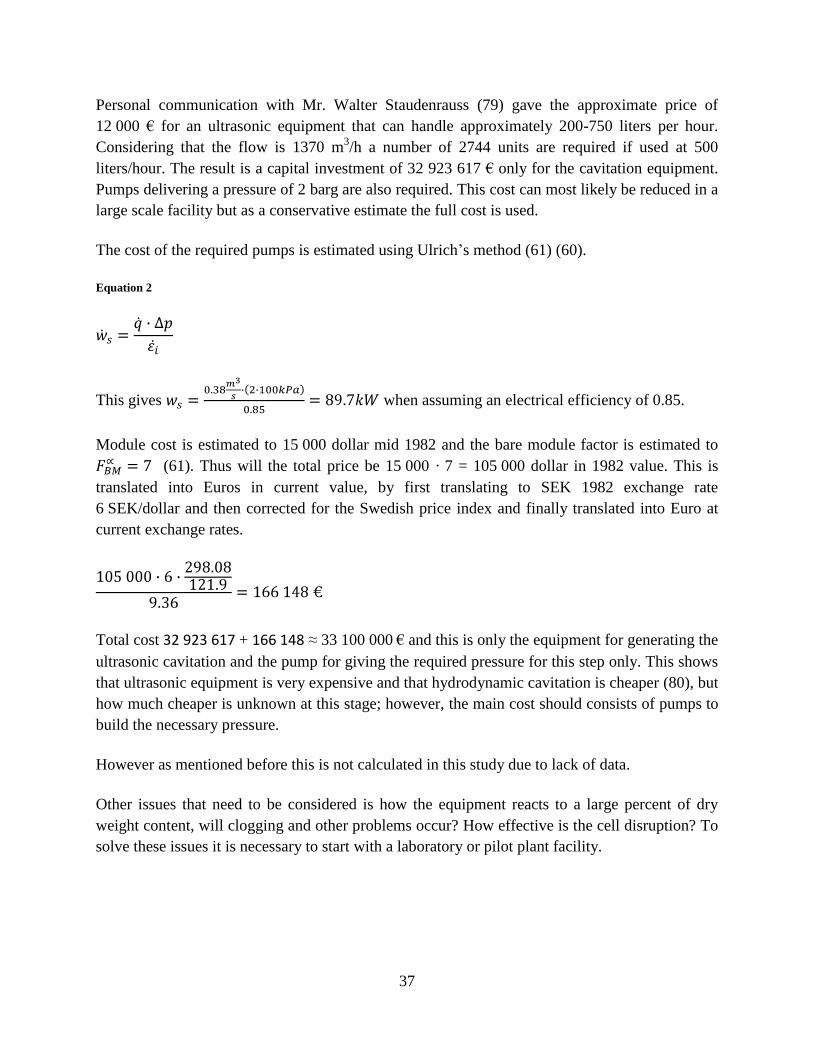
37
Personal communication with Mr. Walter Staudenrauss (79) gave the approximate price of
12 000 € for an ultrasonic equipment that can handle approximately 200-750 liters per hour.
Considering that the flow is 1370 m3/h a number of 2744 units are required if used at 500
liters/hour. The result is a capital investment of 32 923 617 € only for the cavitation equipment.
Pumps delivering a pressure of 2 barg are also required. This cost can most likely be reduced in a
large scale facility but as a conservative estimate the full cost is used.
The cost of the required pumps is estimated using Ulrich’s method (61) (60).
Equation 2
This gives when assuming an electrical efficiency of 0.85.
Module cost is estimated to 15 000 dollar mid 1982 and the bare module factor is estimated to
(61). Thus will the total price be 15 000 · 7 = 105 000 dollar in 1982 value. This is
translated into Euros in current value, by first translating to SEK 1982 exchange rate
6 SEK/dollar and then corrected for the Swedish price index and finally translated into Euro at
current exchange rates.
Total cost 32 923 617 + 166 148 ≈ 33 100 000 € and this is only the equipment for generating the
ultrasonic cavitation and the pump for giving the required pressure for this step only. This shows
that ultrasonic equipment is very expensive and that hydrodynamic cavitation is cheaper (80), but
how much cheaper is unknown at this stage; however, the main cost should consists of pumps to
build the necessary pressure.
However as mentioned before this is not calculated in this study due to lack of data.
Other issues that need to be considered is how the equipment reacts to a large percent of dry
weight content, will clogging and other problems occur? How effective is the cell disruption? To
solve these issues it is necessary to start with a laboratory or pilot plant facility.
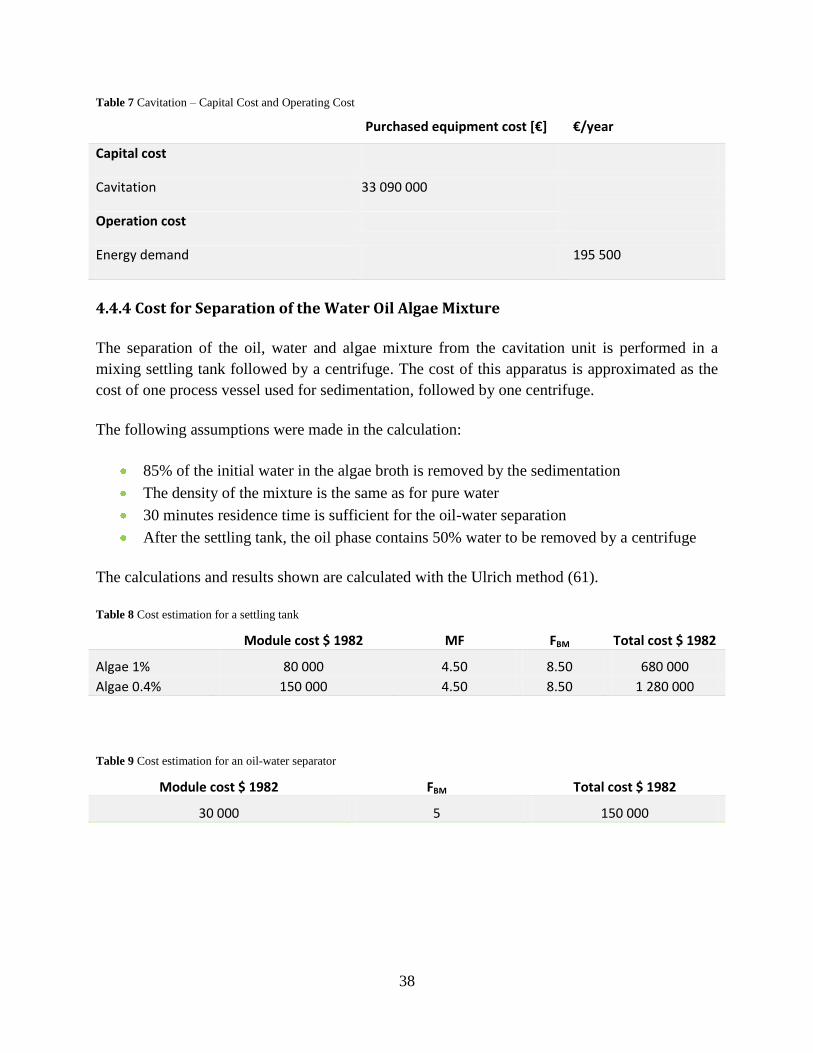
38
Table 7 Cavitation – Capital Cost and Operating Cost
Purchased equipment cost [€] €/year
Capital cost
Cavitation 33 090 000
Operation cost
Energy demand 195 500
4.4.4 Cost for Separation of the Water Oil Algae Mixture
The separation of the oil, water and algae mixture from the cavitation unit is performed in a
mixing settling tank followed by a centrifuge. The cost of this apparatus is approximated as the
cost of one process vessel used for sedimentation, followed by one centrifuge.
The following assumptions were made in the calculation:
85% of the initial water in the algae broth is removed by the sedimentation
The density of the mixture is the same as for pure water
30 minutes residence time is sufficient for the oil-water separation
After the settling tank, the oil phase contains 50% water to be removed by a centrifuge
The calculations and results shown are calculated with the Ulrich method (61).
Table 8 Cost estimation for a settling tank
Module cost $ 1982 MF FBM Total cost $ 1982
Algae 1% 80 000 4.50 8.50 680 000
Algae 0.4% 150 000 4.50 8.50 1 280 000
Table 9 Cost estimation for an oil-water separator
Module cost $ 1982 FBM Total cost $ 1982
30 000 5 150 000
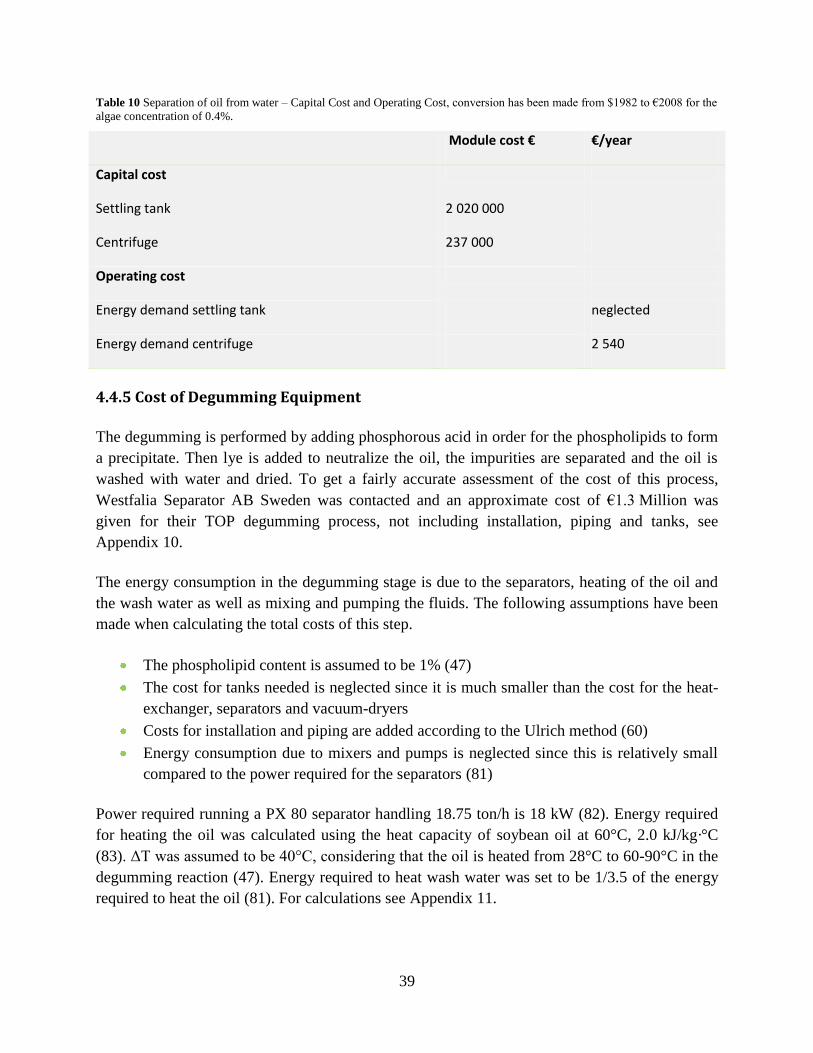
39
Table 10 Separation of oil from water – Capital Cost and Operating Cost, conversion has been made from $1982 to €2008 for the
algae concentration of 0.4%.
Module cost € €/year
Capital cost
Settling tank 2 020 000
Centrifuge 237 000
Operating cost
Energy demand settling tank neglected
Energy demand centrifuge 2 540
4.4.5 Cost of Degumming Equipment
The degumming is performed by adding phosphorous acid in order for the phospholipids to form
a precipitate. Then lye is added to neutralize the oil, the impurities are separated and the oil is
washed with water and dried. To get a fairly accurate assessment of the cost of this process,
Westfalia Separator AB Sweden was contacted and an approximate cost of €1.3 Million was
given for their TOP degumming process, not including installation, piping and tanks, see
Appendix 10.
The energy consumption in the degumming stage is due to the separators, heating of the oil and
the wash water as well as mixing and pumping the fluids. The following assumptions have been
made when calculating the total costs of this step.
The phospholipid content is assumed to be 1% (47)
The cost for tanks needed is neglected since it is much smaller than the cost for the heat-
exchanger, separators and vacuum-dryers
Costs for installation and piping are added according to the Ulrich method (60)
Energy consumption due to mixers and pumps is neglected since this is relatively small
compared to the power required for the separators (81)
Power required running a PX 80 separator handling 18.75 ton/h is 18 kW (82). Energy required
for heating the oil was calculated using the heat capacity of soybean oil at 60°C, 2.0 kJ/kg·°C
(83). ΔT was assumed to be 40°C, considering that the oil is heated from 28°C to 60-90°C in the
degumming reaction (47). Energy required to heat wash water was set to be 1/3.5 of the energy
required to heat the oil (81). For calculations see Appendix 11.
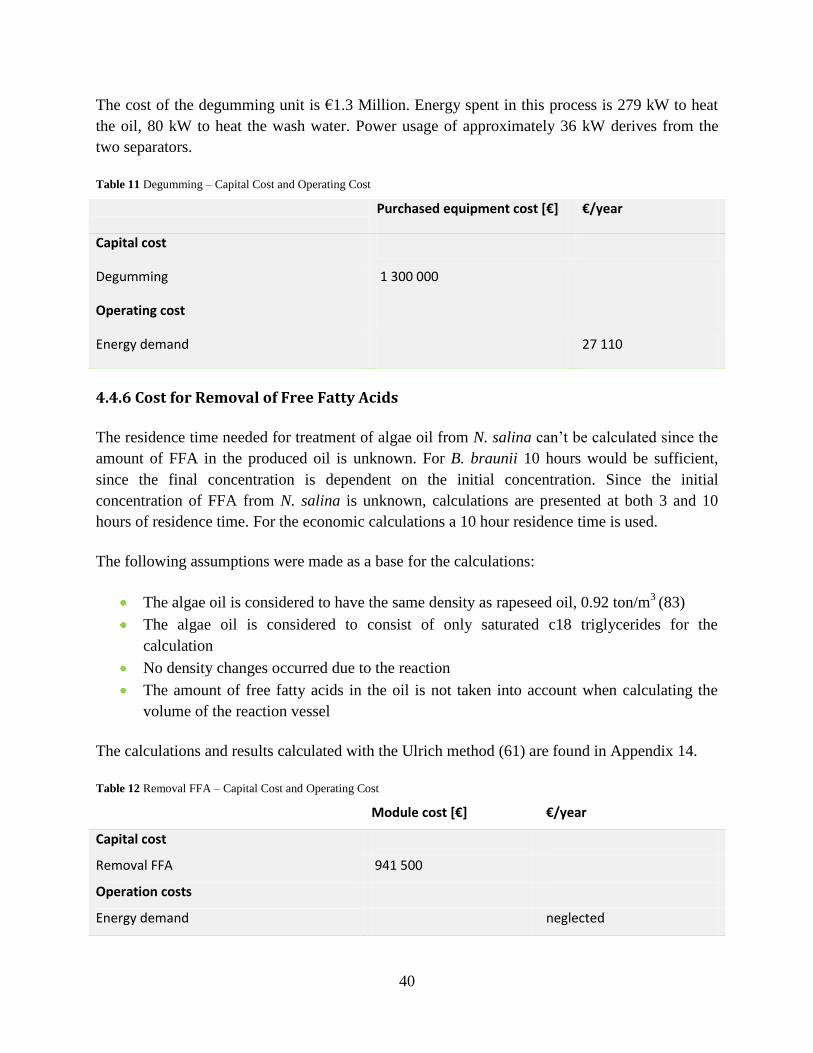
40
The cost of the degumming unit is €1.3 Million. Energy spent in this process is 279 kW to heat
the oil, 80 kW to heat the wash water. Power usage of approximately 36 kW derives from the
two separators.
Table 11 Degumming – Capital Cost and Operating Cost
Purchased equipment cost [€] €/year
Capital cost
Degumming 1 300 000
Operating cost
Energy demand 27 110
4.4.6 Cost for Removal of Free Fatty Acids
The residence time needed for treatment of algae oil from N. salina can’t be calculated since the
amount of FFA in the produced oil is unknown. For B. braunii 10 hours would be sufficient,
since the final concentration is dependent on the initial concentration. Since the initial
concentration of FFA from N. salina is unknown, calculations are presented at both 3 and 10
hours of residence time. For the economic calculations a 10 hour residence time is used.
The following assumptions were made as a base for the calculations:
The algae oil is considered to have the same density as rapeseed oil, 0.92 ton/m3
(83)
The algae oil is considered to consist of only saturated c18 triglycerides for the
calculation
No density changes occurred due to the reaction
The amount of free fatty acids in the oil is not taken into account when calculating the
volume of the reaction vessel
The calculations and results calculated with the Ulrich method (61) are found in Appendix 14.
Table 12 Removal FFA – Capital Cost and Operating Cost
Module cost [€] €/year
Capital cost
Removal FFA 941 500
Operation costs
Energy demand neglected
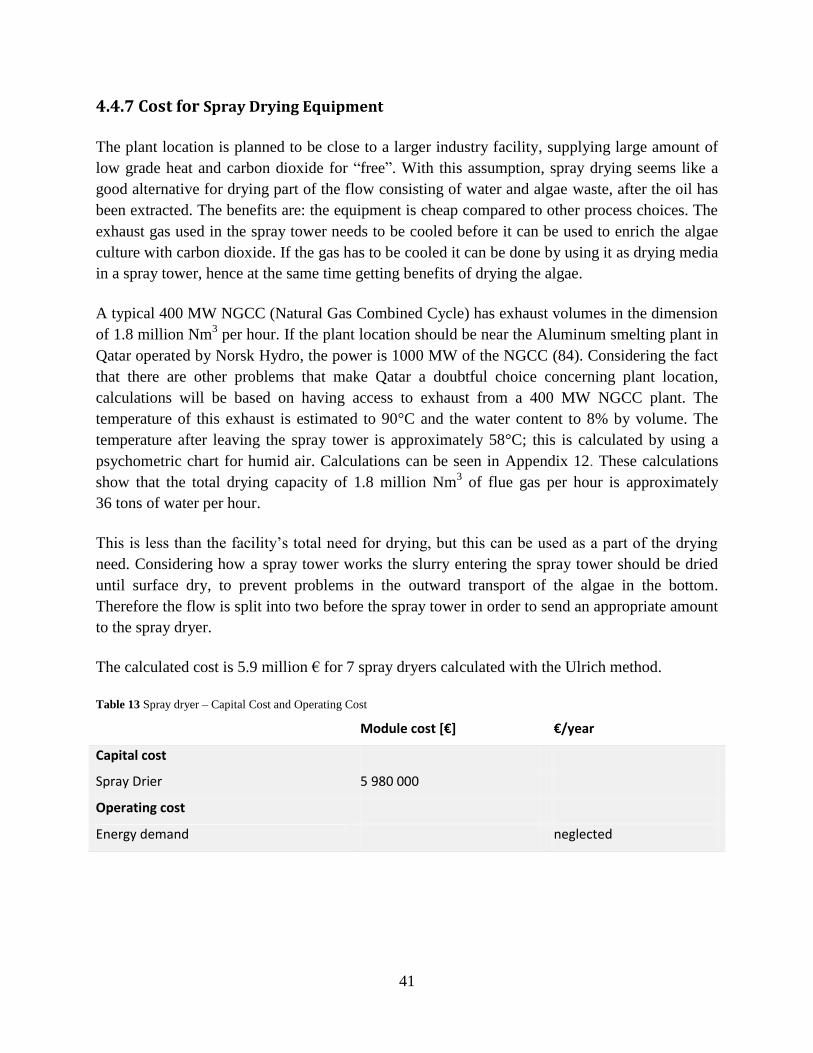
41
4.4.7 Cost for Spray Drying Equipment
The plant location is planned to be close to a larger industry facility, supplying large amount of
low grade heat and carbon dioxide for “free”. With this assumption, spray drying seems like a
good alternative for drying part of the flow consisting of water and algae waste, after the oil has
been extracted. The benefits are: the equipment is cheap compared to other process choices. The
exhaust gas used in the spray tower needs to be cooled before it can be used to enrich the algae
culture with carbon dioxide. If the gas has to be cooled it can be done by using it as drying media
in a spray tower, hence at the same time getting benefits of drying the algae.
A typical 400 MW NGCC (Natural Gas Combined Cycle) has exhaust volumes in the dimension
of 1.8 million Nm3 per hour. If the plant location should be near the Aluminum smelting plant in
Qatar operated by Norsk Hydro, the power is 1000 MW of the NGCC (84). Considering the fact
that there are other problems that make Qatar a doubtful choice concerning plant location,
calculations will be based on having access to exhaust from a 400 MW NGCC plant. The
temperature of this exhaust is estimated to 90°C and the water content to 8% by volume. The
temperature after leaving the spray tower is approximately 58°C; this is calculated by using a
psychometric chart for humid air. Calculations can be seen in Appendix 12. These calculations
show that the total drying capacity of 1.8 million Nm3 of flue gas per hour is approximately
36 tons of water per hour.
This is less than the facility’s total need for drying, but this can be used as a part of the drying
need. Considering how a spray tower works the slurry entering the spray tower should be dried
until surface dry, to prevent problems in the outward transport of the algae in the bottom.
Therefore the flow is split into two before the spray tower in order to send an appropriate amount
to the spray dryer.
The calculated cost is 5.9 million € for 7 spray dryers calculated with the Ulrich method.
Table 13 Spray dryer – Capital Cost and Operating Cost
Module cost [€] €/year
Capital cost
Spray Drier 5 980 000
Operating cost
Energy demand neglected
42
4.5 Revenues and Costs not Directly Derived from Unit Operations
4.5.1 Byproducts
When producing oil from microalgae, the main byproduct formed is the algae meal. This algae
meal consists mainly of proteins, carbohydrates, remaining lipids and micro nutrients. The algae
meal has a range of income bringing process alternatives, which can be investigated thoroughly
first when the properties of the flour are known. The three main alternatives are:
Dry the algae flour and sell it as animal fodder
Dry the algae flour and use it in direct combustion. Nutrients can be re-circulated back
into the process.
Use the algae flour to produce methane by anaerobic bacteria. Nutrients can be re-
circulated back into the process.
The price for animal fodder depends on the available energy and nutrients, the heating value will
affect the energy production. Which one of these steps that are the most economical alternative
and the economy of these steps are not investigated, but the revenue from the byproducts should
at least cover the cost of fertilizer.
The general assumption in this report is that the income from the byproducts cancels the cost of
fertilizers/flocculants.
4.5.2 Cost of Storage Tanks
4.5.2.1 Algae Culture Storage Tank
Algae Link recommends a tank capacity equal to half of the photobioreactor culture volume.
Therefore tanks of this volume are accounted for. Information on exactly how many and their
individual volume are missing, why 15 rubber lined tanks of 50 000 m3 each are used. They are
rubber lined to be able to withstand the growing medium seawater. The cost of these are 28
400 000 €. For calculations please see Appendix 13.
4.5.2.2 Product Storage Tank
The product will be transported by boat to the biodiesel refinery, calculations are made that 2
weeks production should be able to be kept in storage, and in case of delays 1 week extra storage
is calculated for. If this is a good solution can be discussed, but the alternative is that trucks have
to transport the product that cannot be contained in the tanks in case of delays. The required
volume is 7 300 m3 and the construction material stainless steel. The cost for this oil storage tank
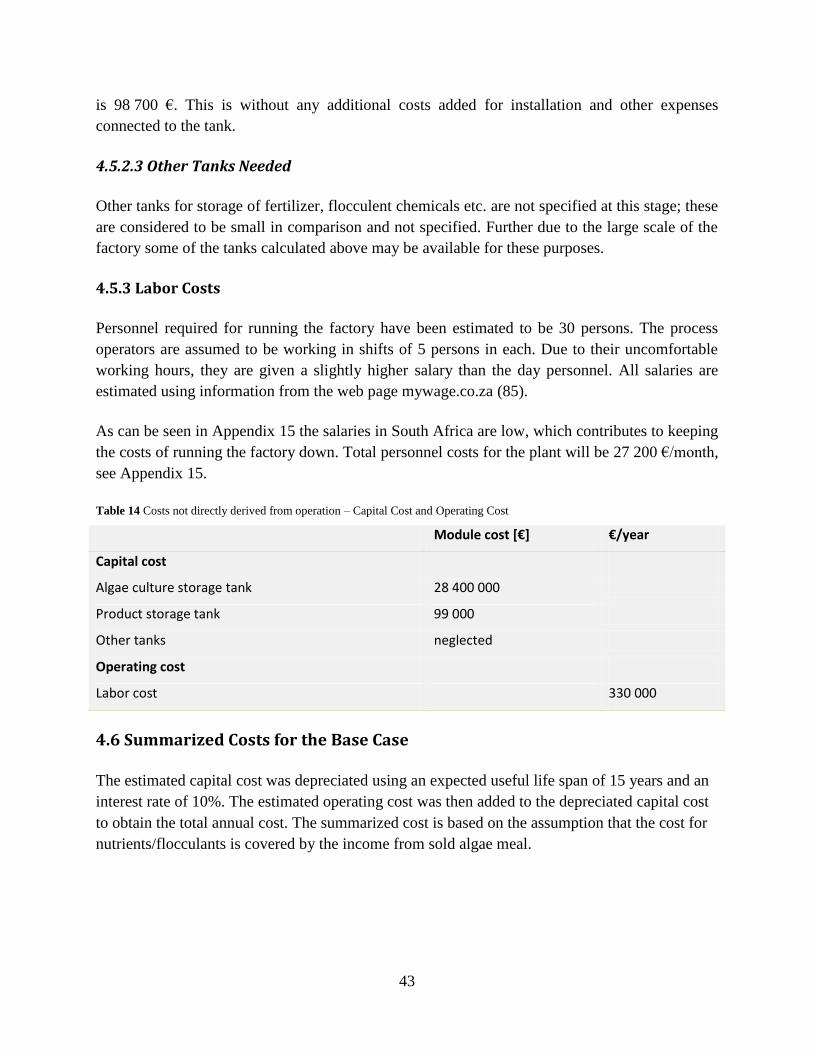
43
is 98 700 €. This is without any additional costs added for installation and other expenses
connected to the tank.
4.5.2.3 Other Tanks Needed
Other tanks for storage of fertilizer, flocculent chemicals etc. are not specified at this stage; these
are considered to be small in comparison and not specified. Further due to the large scale of the
factory some of the tanks calculated above may be available for these purposes.
4.5.3 Labor Costs
Personnel required for running the factory have been estimated to be 30 persons. The process
operators are assumed to be working in shifts of 5 persons in each. Due to their uncomfortable
working hours, they are given a slightly higher salary than the day personnel. All salaries are
estimated using information from the web page mywage.co.za (85).
As can be seen in Appendix 15 the salaries in South Africa are low, which contributes to keeping
the costs of running the factory down. Total personnel costs for the plant will be 27 200 €/month,
see Appendix 15.
Table 14 Costs not directly derived from operation – Capital Cost and Operating Cost
Module cost *€+ €/year
Capital cost
Algae culture storage tank 28 400 000
Product storage tank 99 000
Other tanks neglected
Operating cost
Labor cost 330 000
4.6 Summarized Costs for the Base Case
The estimated capital cost was depreciated using an expected useful life span of 15 years and an
interest rate of 10%. The estimated operating cost was then added to the depreciated capital cost
to obtain the total annual cost. The summarized cost is based on the assumption that the cost for
nutrients/flocculants is covered by the income from sold algae meal.
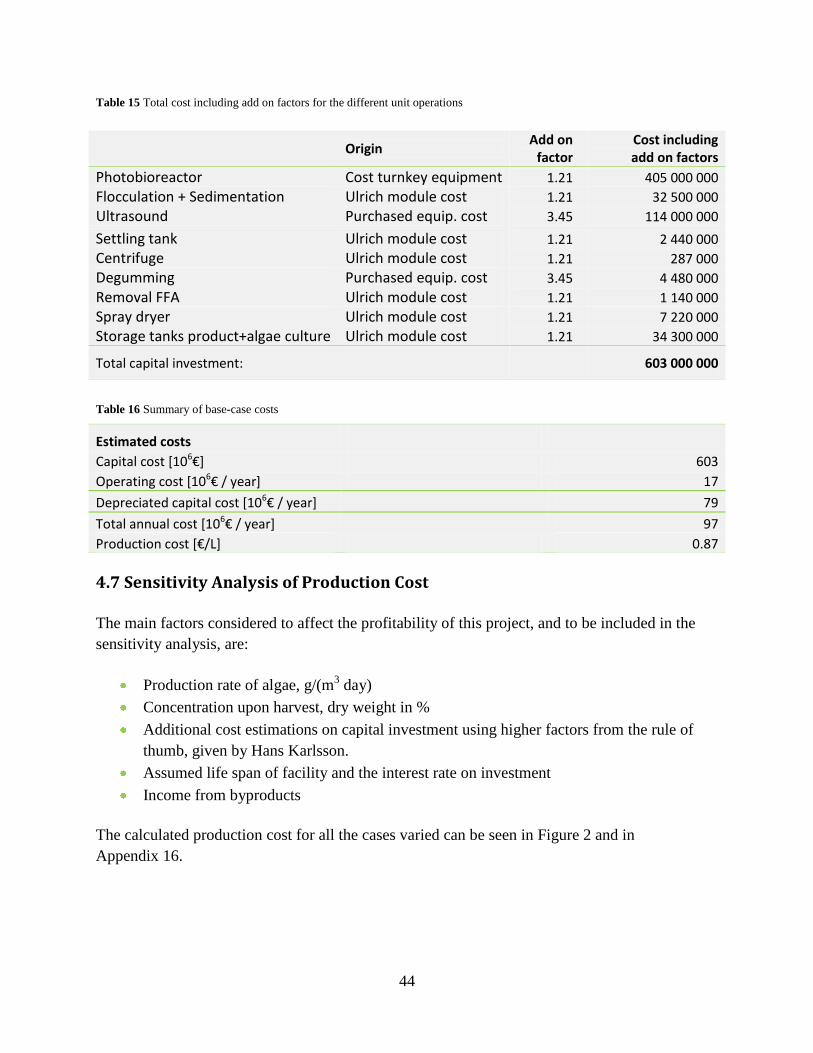
44
Table 15 Total cost including add on factors for the different unit operations
Table 16 Summary of base-case costs
Estimated costs
Capital cost [106€] 603
Operating cost [106€ / year] 17
Depreciated capital cost [106€ / year]
79
Total annual cost [106€ / year]
97
Production cost [€/L] 0.87
4.7 Sensitivity Analysis of Production Cost
The main factors considered to affect the profitability of this project, and to be included in the
sensitivity analysis, are:
Production rate of algae, g/(m3 day)
Concentration upon harvest, dry weight in %
Additional cost estimations on capital investment using higher factors from the rule of
thumb, given by Hans Karlsson.
Assumed life span of facility and the interest rate on investment
Income from byproducts
The calculated production cost for all the cases varied can be seen in Figure 2 and in
Appendix 16.
Origin Add on
factor Cost including add on factors
Photobioreactor Cost turnkey equipment 1.21 405 000 000
Flocculation + Sedimentation Ulrich module cost 1.21 32 500 000
Ultrasound Purchased equip. cost 3.45 114 000 000
Settling tank Ulrich module cost 1.21 2 440 000
Centrifuge Ulrich module cost 1.21 287 000
Degumming Purchased equip. cost 3.45 4 480 000
Removal FFA Ulrich module cost 1.21 1 140 000
Spray dryer Ulrich module cost 1.21 7 220 000
Storage tanks product+algae culture Ulrich module cost 1.21 34 300 000
Total capital investment:
603 000 000
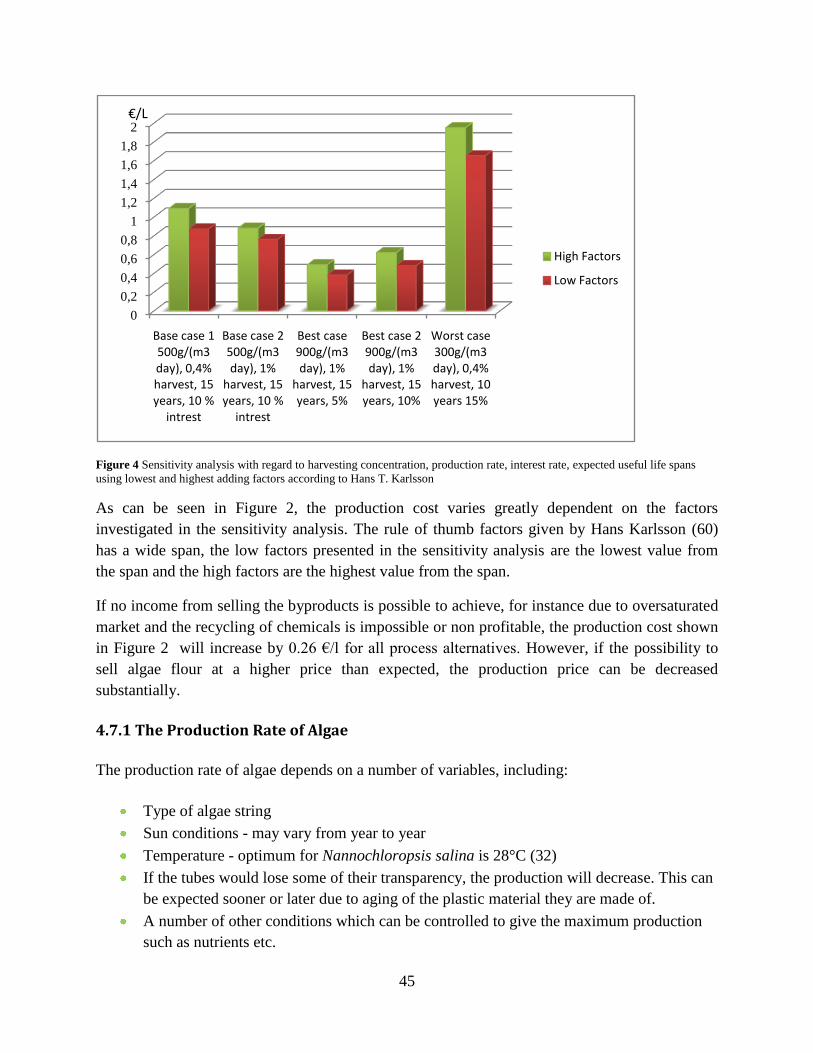
45
Figure 4 Sensitivity analysis with regard to harvesting concentration, production rate, interest rate, expected useful life spans
using lowest and highest adding factors according to Hans T. Karlsson
As can be seen in Figure 2, the production cost varies greatly dependent on the factors
investigated in the sensitivity analysis. The rule of thumb factors given by Hans Karlsson (60)
has a wide span, the low factors presented in the sensitivity analysis are the lowest value from
the span and the high factors are the highest value from the span.
If no income from selling the byproducts is possible to achieve, for instance due to oversaturated
market and the recycling of chemicals is impossible or non profitable, the production cost shown
in Figure 2 will increase by 0.26 €/l for all process alternatives. However, if the possibility to
sell algae flour at a higher price than expected, the production price can be decreased
substantially.
4.7.1 The Production Rate of Algae
The production rate of algae depends on a number of variables, including:
Type of algae string
Sun conditions - may vary from year to year
Temperature - optimum for Nannochloropsis salina is 28°C (32)
If the tubes would lose some of their transparency, the production will decrease. This can
be expected sooner or later due to aging of the plastic material they are made of.
A number of other conditions which can be controlled to give the maximum production
such as nutrients etc.
0
0,2
0,4
0,6
0,8
1
1,2
1,4
1,6
1,8
2
Base case 1 500g/(m3 day), 0,4% harvest, 15 years, 10 %
intrest
Base case 2 500g/(m3 day), 1%
harvest, 15 years, 10 %
intrest
Best case 900g/(m3 day), 1%
harvest, 15 years, 5%
Best case 2 900g/(m3 day), 1%
harvest, 15 years, 10%
Worst case 300g/(m3 day), 0,4% harvest, 10 years 15%
High Factors
Low Factors
€/L
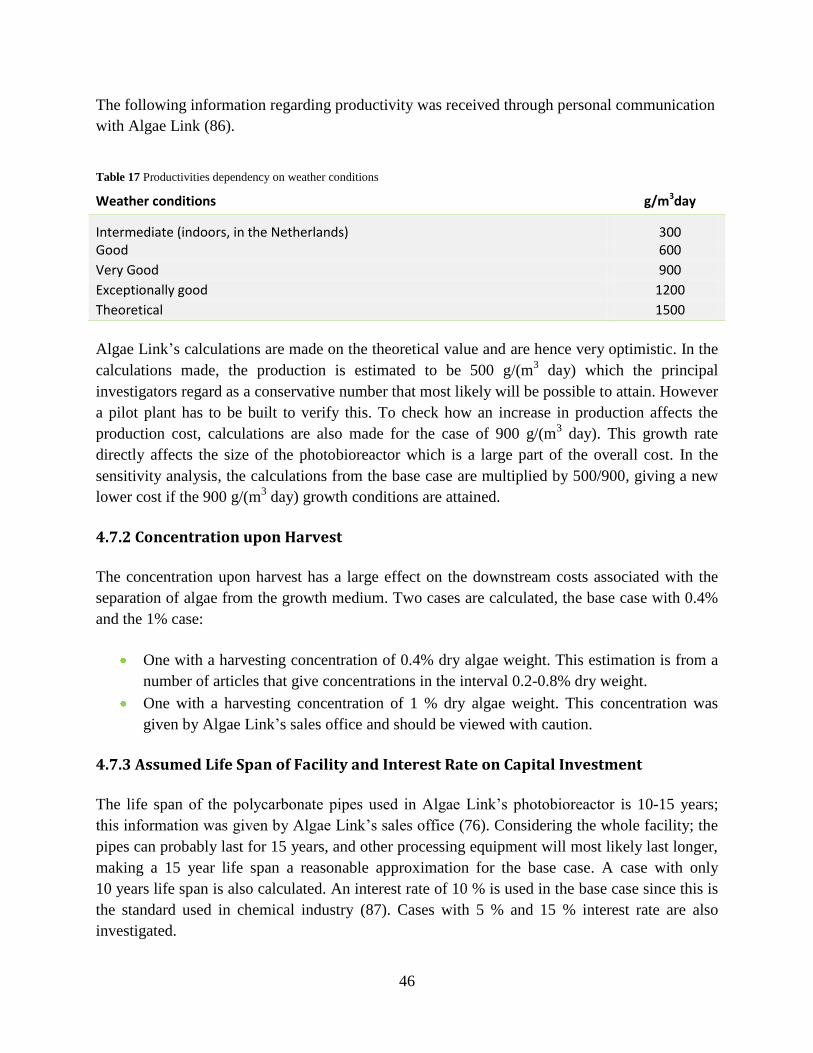
46
The following information regarding productivity was received through personal communication
with Algae Link (86).
Table 17 Productivities dependency on weather conditions
Weather conditions g/m3day
Intermediate (indoors, in the Netherlands) 300 Good 600 Very Good 900
Exceptionally good 1200 Theoretical 1500
Algae Link’s calculations are made on the theoretical value and are hence very optimistic. In the
calculations made, the production is estimated to be 500 g/(m3 day) which the principal
investigators regard as a conservative number that most likely will be possible to attain. However
a pilot plant has to be built to verify this. To check how an increase in production affects the
production cost, calculations are also made for the case of 900 g/(m3 day). This growth rate
directly affects the size of the photobioreactor which is a large part of the overall cost. In the
sensitivity analysis, the calculations from the base case are multiplied by 500/900, giving a new
lower cost if the 900 g/(m3 day) growth conditions are attained.
4.7.2 Concentration upon Harvest
The concentration upon harvest has a large effect on the downstream costs associated with the
separation of algae from the growth medium. Two cases are calculated, the base case with 0.4%
and the 1% case:
One with a harvesting concentration of 0.4% dry algae weight. This estimation is from a
number of articles that give concentrations in the interval 0.2-0.8% dry weight.
One with a harvesting concentration of 1 % dry algae weight. This concentration was
given by Algae Link’s sales office and should be viewed with caution.
4.7.3 Assumed Life Span of Facility and Interest Rate on Capital Investment
The life span of the polycarbonate pipes used in Algae Link’s photobioreactor is 10-15 years;
this information was given by Algae Link’s sales office (76). Considering the whole facility; the
pipes can probably last for 15 years, and other processing equipment will most likely last longer,
making a 15 year life span a reasonable approximation for the base case. A case with only
10 years life span is also calculated. An interest rate of 10 % is used in the base case since this is
the standard used in chemical industry (87). Cases with 5 % and 15 % interest rate are also
investigated.
47
4.8 Conclusion
This feasibility study of large scale biodiesel production shows large variation of production cost
depending on some key factors. The production cost in this study lies in an interval between 0.38
and 1.95 €/L with the base case of 0.87 €/L, for details please see sensitivity analysis above.
The calculated costs are considerably lower than the estimation earlier made by Y. Chisti (2)
where the production cost was approximately a factor nine higher when compared to fossil fuel
($100 per barrel). No income from biomass residues were considered in Chisti’s approximation.
The price of comparable bio-based crude oil is today 122 $ barrel (palm oil) (1), which is
approximately 0.49 € per liter. This shows that even though profitability is still not achieved but
it is concluded that profitability is not far away. Molecular level engineering of the algae may
have the answers to lowering the cost, photosynthetic efficiency, increase biomass growth rate,
increase of oil content and improved temperature tolerance are some of the areas that would
lower the cost if solved (2).
When estimating the capital and operating cost it was found that the capital cost is the major part
of the total cost. This means that the life span of the plant, as well as the interest rates paid on the
initial investment will have a large impact on the estimated costs. Another important factor will
be the productivity, since this directly affects the size of the photobioreactors and thereby the
capital cost. The large variation in production cost is to a large extent dependent on the weather
conditions present at the plant location, such as temperature and sun availability, the yield these
conditions give cannot easily be estimated. Therefore, it is vital to build a pilot plant to verify
growth rates and harvest concentration. When these values are given, a more accurate estimation
can be made. Another issue that should be addressed is the approximation that nutrient/flocculant
cost and algae meal revenue will balance each other. If the algae meal turns out to be worthless
this will increase the algae oil price with 0.26 €/L. The increasing climate threat is another big
issue that favors projects like this one. However, from an environmental perspective, additional
analysis has to be made to verify if and how much this production method really decreases
greenhouse gas emissions compared to fossil fuel. For this an LCA of algae biodiesel originating
in a plant similar to this one is suggested.
From the result of this feasibility study some general conclusions can be drawn. The production
of biodiesel from algae grown in photobioreactors could become a reality, with increasing fossil
fuel prices and a maturing algae technology the future might be a bright one. However, the effect
of increasing oil price on the construction cost has to be kept in mind.
48
5 Bibliography
1. CPO futures rise to highest level in a week . PalmOilHQ. [Online] May 08, 2008. [Cited: May 08, 2008.]
http://www.palmoilhq.com/PalmOilNews/cpo-futures-rise-to-highest-level-in-a-week/.
2. Chisti, Yusuf. Biodiesel from Microalgae Beats Bioethanol. Trends in Biotechnology. 2008, Vols. 26,
3:126-131, pp. 26, 3:126-131.
3. Carlozzi, Pietro. Dilution of Solar Radiation Through “Culture” Lamination in photobioreactor Rows
facing South-North: A way to Improve the Efficiency of Light Utilization by Cyanobacteria (Arthrospira
platensis). Biotechnology and bioengineering. 2003, Vols. 81, 5:305-315.
4. Sawayama S., Minowa T., Yokoyama S-Y. Possibility of renewable energy production and CO2
mitigation by thermochemical liquefaction of microalgae. Biomass and Bioenergy. 1999, Vols. 17, 33-39.
5. Dote, Y., et al. Recovery of Liquid Fuel from Hydrocarbon-rich Microalgae by Thermochemical
Liquefaction. Fuel. 1994, Vols. 73, 12:1855-1857.
6. Molina Grima, E., et al. Photobioreactors: Light regime, mass transfer, and scaleup. Journal of
Biotechnology. 1999, Vols. 70, 231-247.
7. Tredici, Mario R. and Chini Zittelli, Graziella. Efficiency of sunlight utilization: Tubular versus Flat
Photobioreactors. Biotechnology and bioengineering. 1998, Vols. 57, 2:187-197.
8. Morita, Masahiko, Watanabe, Yoshitomo and Saiki, Hiroshi. Investigation of Photobioreactor Design
for Enhancing the Photosynthetic Productivity of Microalgae. Biotechnology and bioengineering. 2000,
Vols. 69, 6:693-698.
9. Ogbonna, James C, Yada, Hirokazu and Tanaka, Hideo. Effect of Cell Movement by Random Mixing
between the Surface and Bottom of Photobioreactors on Algae Productivity. Journal of Fermentation
and Bioengineering. 1995, Vol. 79, 2:152-157.
10. Fernández Sevilla, J.M., et al. Pilot Plant Scale Outdoor Mixotrophic Cultures of Phaeodactylum
tricornutum Using Glycerol in Vertical Bubble Column and Airlift Photobioreactors: Studies in Fed-Batch
mode. Biothechnology Progress. 2004, Vols. 20, 728-736.
11. Acién Fernandez, F.G., et al. Outdoor Production of Phaeodactylum Tricornutum Biomass in a Helical
Reactor. Journal of Biotechnology. 2003, Vols. 103, 137-152.
12. Pulz, O. Photobioreactors: production systems for phototrophic microorganism. Appl Microbiol
Biotechnol. 2001, Vols. 57, 287-293.
13. Cohen, Ephraim, Koren, Avi and Arad, Shoshana M. A Closed System for Outdoor Cultivation of
Microalgae. Biomass and Bioenergy. 1991, Vols. 1, 2:83-88.
49
14. Carlsson, Anders S, et al. Micro- and Macro-Algae utility for industrial applications - Outputs from
the EPOBIO project. 2007.
15. Yongmanitchai, W. and Ward, O. P. Growth of and Omega-3 Fatty Acid Production by
Phaeodadctylum Tricornutum under Different Culture Conditions. Applied and Environmental
Microbiology. 1991, Vol. 57, 2, pp. 419-425.
16. Cerón García, M.C., et al. Mixotrophic Growth of the Microalga Phaeodactylum Tricornutum
Influence of Different Nitrogen and Organic Carbon Sources on Productivity and Biomass Composition.
Process Biochemistry. 2005, Vols. 40, 297-305.
17. Xu, Han, Miao, Xiaoling and Wu, Qingyu. High quality biodiesel production from a microalga
Chlorella protothecoides by heterotrophic growth in fermenters. Journal of Biotechnology. 2006 , Vols.
126, 499-507.
18. Metzger, P. and Largeau, C. Botryococcus braunii: a rich source for hydrocarbons and related ether
lipids. Applied Microbiology and Biotechnology. 2005, Vols. 66, 5:486–496.
19. Zhang, Kai and Kojima, Eiichi. Effect of Light Intensity on Colony Size of Microalga Botryococcus
Braunii. Journal of Fermentation and Bioengineering, . 1998, Vols. 86, 6:573-576.
20. Kojima, Eiichi and Zhang, Kai. Growth and hydrocarbon production of microalga Botryococcus
Braunii in bubble column photobioreactors. Journal of Bioscience and Bioengineering,. 1999, Vols. 87,
6:811-815.
21. Casadevall, D., et al. Studies on batch and continuous cultures of Bortyococcus braunii: hydrocarbon
production in relation to physiological state, cell structure, and phosphate nutrition. Biotechnology and
Bioengineering. 1985, Vols. 27, 286-295.
22. Chirac, C., et al. Bacterial influence upon growth ang hydrocarbon production of the green alga
Bortyococcus braunii. Journal of Phycology. 1985, Vols. 21, 380-387.
23. Wolf, FR, et al. Growth and branched hydrocarbon production in a strain of Botryococcus braunii
(Chlorophyta). Journal of Phycology. 1985, Vols. 21, 388-396.
24. Cepák, V. and Lukavsky, J. The effect of high irradiances on growth, biosynthetic activities and the
ultrastructure of the green alga Botryococcus braunii strain Droop 1950/807-1. Archiv für Hydrobiologie
Supplementband. 1994, Vols. 101, 1-17.
25. Li, Yan and Qin, Jian G. Comparison of growth and lipid content in three Botryococcus braunii
strains. Journal of Applied Phycology. 2005, Vols. 17, 551–556.
26. Dayananda, C., et al. Autotrophic cultivation of Botryococcus braunii for the production of
hydrocarbons and exopolysaccharides in various media. Biomass and Bioenergy. 2007, Vols. 31, 87–93.
50
27. Dayananda, C., et al. Effect of media and culture conditions on growth and hydrocarbon production
by Botryococcus braunii. Process Biochemistry . 2005, Vols. 40, 3125 3131.
28. An, J-Y., et al. Hydrocarbon production from secondarily treated piggery wastewater by the green
alga Botryococcus braunii. Journal of Applied Phycology. 2003, Vols. 15, 185-191.
29. Xiaoling Miao, Qingyau Wu,. Biodiesel production from heterotrophic microalgal oil. Bioresource
technology. 2006, Vols. 97, 841-846.
30. Ranga Rao, A., et al. Effect of salinity on growth of green algae Botryococcus braunii. Bioresource
Technology . 2007, Vols. 98, 560-564.
31. Volkman, J.K, et al. The biochemical composition of marine microalgae from the class
eustigmatophyceae. Journal of Phycolology. 1993, Vol. 29, 69-78.
32. Boussiba, S., et al. Lipid and biomass production by the halotolerant microalga Nannochloropsis
Salina. Biomass. 1987, Vol. 12, 37-47.
33. Molina Grima, E., et al. Recovery of Microalgal Biomass and Metabolites: Process Options and
Economics. Biotechnology Advances. 2002, Vols. 20, 491-515.
34. Lee, S.J., et al. Effects of Harvesting Method and Growth Stage on the Flocculation of the Green Alga
Botryococcus Braunii. Letters in Applied Microbiology. 1998, Vols. 27, 14-18.
35. Bosma, Rouke, et al. Ultrasound, a New Separation Technique to Harvest Microalgae. Journal of
Applied Phycology. 2002, Vols. 15, 143-153.
36. Sim, T-S., Goh, A. and Becker, E.W. Comparison of Centrifugation, Dissolved Air Flotation and Drum
Filtration Techniques for Harvesting Sewage Grown Alga. Biomass. 1988, Vols. 16, 51-62.
37. McCabe, Warren L., Smith, Julian C. and Harriott, Peter. Unit Operations of Chemical Engineering
7th edition. Singapore : McGraw-Hill, Int. ed. 2005.
38. Swern, D. Bailey’s Industrial Oil And Fat Products, Volume 2, 4th Edition. s.l. : Wiley- Interscience,
1982.
39. Chisti, Yusuf and Moo-Young, Murray. Disruption of Microbial Cells for Intracellular products.
Enzyme & Microbial Technology. April 1986, Vol. 8, pp. 194-204.
40. Ferrentino, Justin M and Farag, Ihab H. Microalgal Oil Extraction and in-Situ Transesterification.
AIChe 2006 Annual Meeting San Fransisco. [Online] [Cited: May 06, 08.]
http://aiche.confex.com/aiche/2006/preliminaryprogram/.
41. Moholkar, V.S. and Pandit, A. B. Numerical investigations in the behaviour of one-dimensional
bubbly flow in hydrodynamic cavitations. Chemical Engineering Science. 2001, Vol. 56, pp. 1411-1418.

51
42. Yang, Y.F., et al. Analysis of energy conversion characteristics in liquefaction of algae . Resources,
Conservation and Recycling. 2004, Vols. 43, 21-33.
43. Inoue, Seiichi, et al. Analysis of oil derived from Liquefaction of Botryococcus Braunii. Biomass and
Bioenergy. 1994, Vols. 6, 269-274.
44. Hulteberg, C. Bio-diesel Analysis, Methods, Complexity and Capital Requirement, Biofuel-Solution.
45. Subramanian, Rangaswamy, et al. Characterization of phospholipid reverse micelles in relation to
membrane processing of vegetable oils. European Journal of Lipid Science and Technology. 2001, Vols.
103, 93-97.
46. Cvengroš, Ján, et al. Rapeseed oil methyl esters with low phosphorus content;. Fett/Lipid. 1999,
Vols. 101, 6:261-265.
47. Appelqvist, L.Å. and Ohlson, R. Rapeseed (- Cultivation, Composition, Processing and Utilization).
Amsterdam : Elsevier Publishing Company, 1972.
48. Subramanian, R. and Nakajima, M. Membrane Degumming of Crude Soybean and Rapeseed Oils.
Journal of the American Oil Chemists' Society. 1997, Vols. 74, 8:971-975.
49. Koris, Andras and Marki, Edit. Ceramic ultrafiltration membranes for non-solvent vegetable oil
degumming (phospholipid removal). Desalination. 2006, Vols. 200, 537–539.
50. Kalacheva, G. S., Zhila, N. O. and Volova, T. G. Lipids of the Green Alga in a Batch Mode.
Microbiology. 2001, Vols. 70, 3:256–262.
51. Park, Young-Moo, et al. The heterogeneous catalyst system for the continuous conversion of free
fatty acids in used vegetable oils for the production of biodiesel. Catalysis Today. 2008, Vols. 131, 238–
243.
52. Wang, Y., et al. Preparation of Biodiesel from Waste Cooking Oil via Two-Step Catalysed Process.
Energy Conversion & Management. 2007, Vol. 48, pp. 184-188.
53. López, D.E., et al. Esterification and Transesterification Using Modified-Zircona Catalysts. Applied
Catalasys A: General. 2008, Vol. 339, pp. 76-83.
54. Marchetti, J.M., Miguel, V.U. and Errazu, A.F. Heterogeneous esterification of oil with high amount
of free fatty acids. Fuel. 2007, Vols. 86, 906–910.
55. Berchmans, Hanny Johanes and Hirata, Shizuko. Biodiesel production from crude Jatropha curcas L.
seed oil with a high content of free fatty acids. Bioresource Technology. 2008, Vols. 99, 1716–1721.
56. Demirbas, Ayhan. Comparison of transesterification methods for production of biodiesel from
vegetable oils and fats. Energy conversion and management. 2008, Vols. 49, 125-130.
52
57. Shibasaki-Kitakawa, Naomi, et al. Biodiesel production using anionic ion-exchange resin as
heterogenous catalyst. Bioresource technology. 2007, Vols. 98, 416-421.
58. Gryglewicz, S. Rapeseed Oil Methyl esters preparation using heterogeneous catalysts. Biosource
Technology. 1999, Vols. 70, 249-253.
59. Saka, S. and Kusdiana, D. Biodiesel fuel from rapeseed oil as prepared in supercritical methanol.
Fuel. 2001, Vols. 80, 225-231.
60. Karlsson, Hans T., Institutionen för Kemiteknik, Lunds Tekniska Högskola. Projekteringsmetodik.
Lund : KFS AB, 1992.
61. Ulrich, G.D. A Guide to Chemical Engineering Process Design and Economics. s.l. : John Wiley and
Sons Inc., 1984.
62. Ljung, Birger and Högberg, Olle. Investerings bedömning - en introduktion. Malmö : Liber Ekonomi,
2002.
63. MyProperty - South Africa. Vacant Land in Hluhluwe, Hluhluwe, South Africa - For Sale. [Online]
[Cited: 05 07, 2008.]
http://www.myproperty.co.za/property_search_detail.asp?PROPERTY_REF=46982&TYPE=1&E=T#x.
64. Hulteberg, Christian. Departement of Chemical Engineering, Faculty of Engineering, Lund University.
Email communication. April 25, 2008.
65. Volker Serini, Bayer AG, Krefeld-Uerdingen, Federal Republic of Germany. Polycarbonate.
Ullmann's Encyclopedia of Industrial Chemistry. [Online] June 15, 2000. [Cited: May 08, 2008.]
http://mrw.interscience.wiley.com/emrw/9783527306732/ueic/article/a21_207/current/pdf.
66. Xin, Liu. Polycarbonate (Asia Pacific). ICIS Pricing. [Online] November 07, 2007. [Cited: May 06,
2008.] http://www.icispricing.com/il_shared/Samples/SubPage10100035.asp.
67. Algaelink. 100 Ton P/Day plant. www.algaelink.com. [Online] AlgaeLink NV. [Cited: April 28, 2008.]
http://www.algaelink.com/100_ton_plant.htm.
68. Encyclopaedia Britannica. Principal constituents of seawater. Encyclopaedia Britannica online.
[Online] Encyclopædia Britannica, Inc. [Cited: April 29, 2008.] http://www.britannica.com/eb/article-
9116158/Principal-constituents-of-seawater.
69. Yara. Sortiment 2007/2008. www.yara.se. [Online] [Cited: April 28, 2008.]
http://fert.yara.se/library/attachments/news_room/publications/brochures/sortiment0708www.pdf.
70. ATL. Marknadsnoteringar. http://atl.nu/. [Online] ATL - Lantbrukets affärstidning. [Cited: April 28,
2008.] http://atl.nu/marknad/.
71. LantmännenDirekt. Sales departement. Personal communication. April 27, 2008.
53
72. Chemical Market Reporter. Prices & People. ICIS Chemical Business Americas, New York. [Online]
March 14, 2005. [Cited: April 29, 2008.]
http://proquest.umi.com/pqdlink?index=3&did=817487861&SrchMode=1&sid=1&Fmt=6&VInst=PROD
&VType=PQD&RQT=309&VName=PQD&TS=1210078397&clientId=53681.
73. Table 4 -- Indexes of Prices Recieved and Paid by Farmers, U.S. Average.
www.ers.usda.gov/Publications/AgOutlook/AOTables/. [Online] April 01, 2008. [Cited: April 29, 2008.]
http://www.ers.usda.gov/publications/agoutlook/aotables/2008/03Mar/aotab04.xls.
74. Lidén, Gunnar. Department of Chemical Engineering, Faculty of Engineering, Lund University.
Personal communication. 2008.
75. Belarbi, E.-H., Molina, E. and Chisti, Y. A process for high yield and scaleable recovery of high purity
eicosapentaenoic acid esters from microalgae and fish oil. Process Biochemistry. 2000, Vol. 35, 9, pp.
951-969.
76. Algae Link, sales department. Personal communication. April 22, 2008.
77. Balasundaram, B. and Pandit, A.B. Selective release of invertase by hydrodynamic cavitation.
Biochemical Engineering Journal. 2001, Vol. 8, 3, pp. 251-256.
78. Biodiesel from Algae using Ultrasonication. Hielscher - Ultrasound Technology. [Online] Hielscher
Ultrasonics Gmbh. [Cited: April 28, 2008.]
http://www.hielsher.com/ultrasonics/algae_extraction_01.htm.
79. Staudenrauss, Walter. Area sales manager at Hielscher. Personal communication. April 27, 2008.
80. Senthil Kumar, P., Siva Kumar, M. and Pandit, A.B. Experimental quantification of chemical effects
of hydrodynamic cavitation - Effect of cavitation. Chemical Engineering Science. 2000, Vol. 55, 9, pp.
1633-1639.
81. Latondress, E.G. Energy Saving Techniques in Continuous Degumming and Refining. Journal of the
American Oil Chemists' Society. 1984, Vol. 61, pp. 1380-1382.
82. PX 80 - Medium capacity disc stack centrifuge for fats and oils refining. www.alfalaval.com. [Online]
[Cited: May 06, 2008.] http://www.alfalaval.com/digitalassets/2/file32321_0_PX80.pdf.
83. Thomas, Alfred. Fats and Fatty Oils. Ullmann's Encyclopedia of Industrial Chemistry. [Online] June 15,
2000. [Cited: May 06, 2008.]
http://mrw.interscience.wiley.com/emrw/9783527306732/ueic/article/a10_173/current/pdf.
84. Eklund, Hans Ragnar. StatoilHydro. E-mail communication. April 11, 2008.
85. Salary check. mywage.co.za. [Online] [Cited: 05 07, 2008.]
http://www.mywage.co.za/main/Paycheck.
86. AlgaeLink. Sales Department. Personal Communication. April 28, 2008.

54
87. Karlsson, Hans. Departement of chemical engineering. Personal communication. 05 05, 2008.
88. SCB. Konsumentprisindex (1980=100), fastställda tal - Statistik från SCB. Statistiska centralbyrån -
Statistics Sweden. [Online] April 14, 2008. [Cited: May 07, 2008.]
http://www.scb.se/templates/tableOrChart____33847.asp.
89. AlgaeLink. Sales Department. E-mail communication. January 31, 2008.
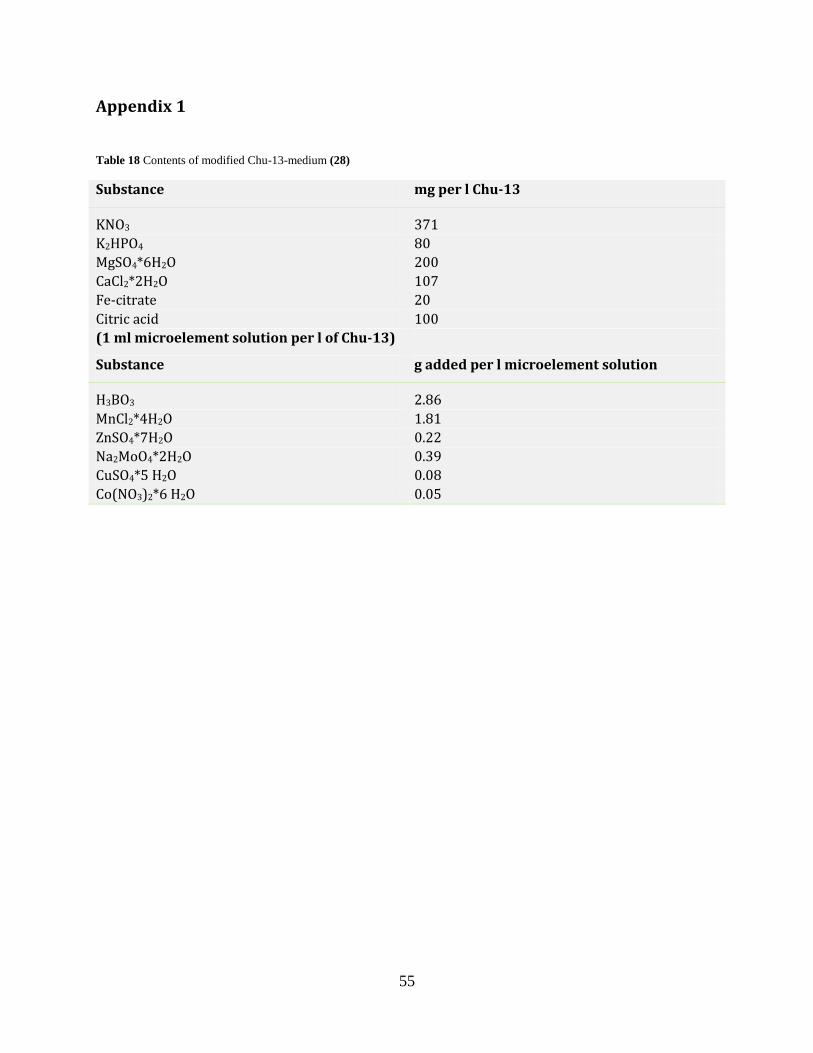
55
Appendix 1
Table 18 Contents of modified Chu-13-medium (28)
Substance mg per l Chu-13
KNO3 371
K2HPO4 80
MgSO4*6H2O 200
CaCl2*2H2O 107
Fe-citrate 20
Citric acid 100
(1 ml microelement solution per l of Chu-13)
Substance g added per l microelement solution
H3BO3 2.86
MnCl2*4H2O 1.81
ZnSO4*7H2O 0.22
Na2MoO4*2H2O 0.39
CuSO4*5 H2O 0.08
Co(NO3)2*6 H2O 0.05
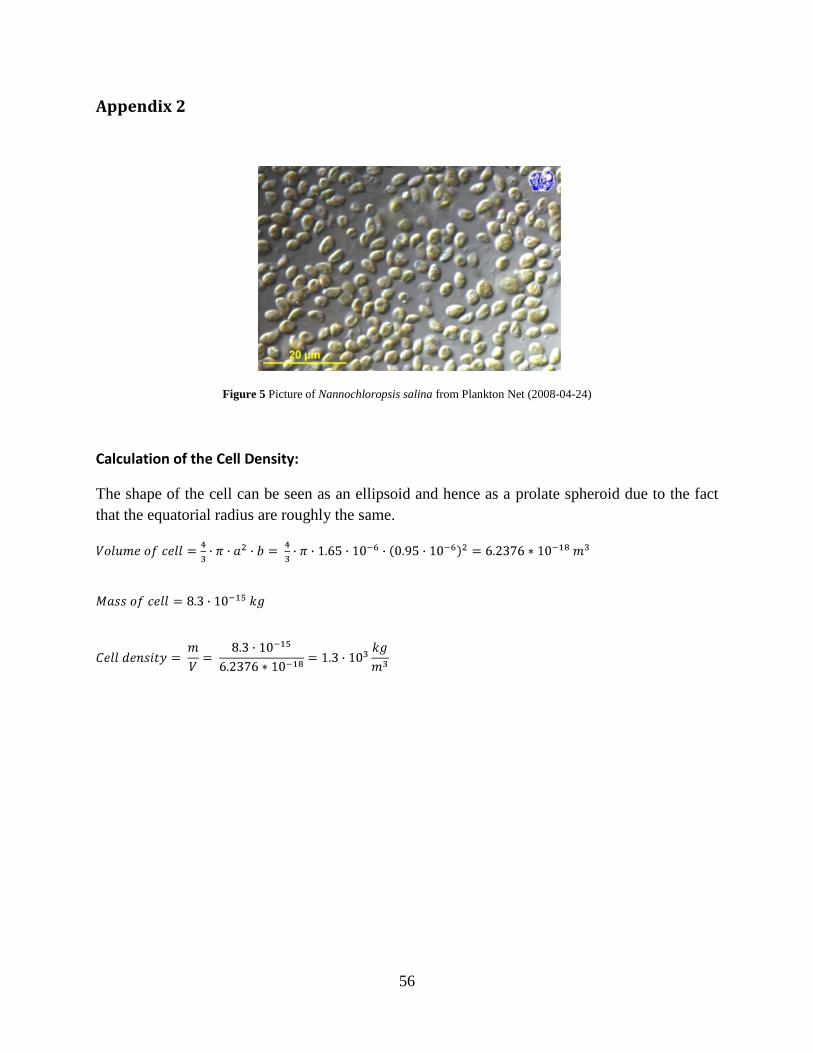
56
Appendix 2
Figure 5 Picture of Nannochloropsis salina from Plankton Net (2008-04-24)
Calculation of the Cell Density:
The shape of the cell can be seen as an ellipsoid and hence as a prolate spheroid due to the fact
that the equatorial radius are roughly the same.
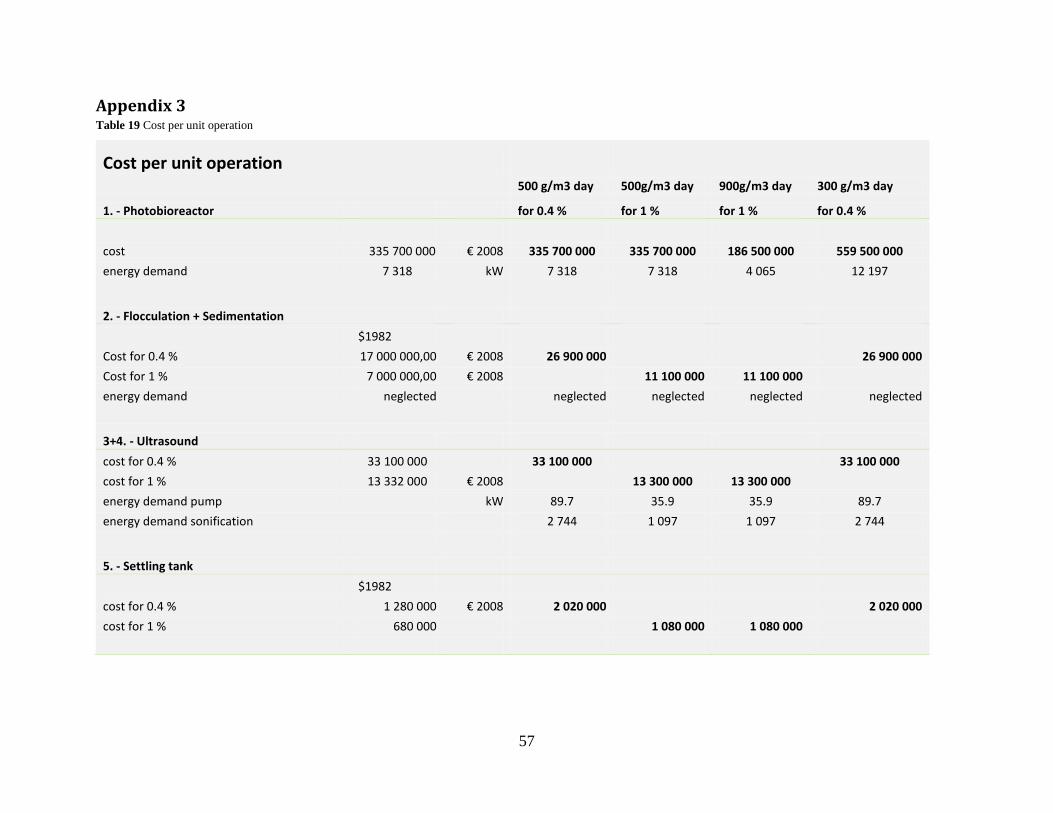
57
Appendix 3 Table 19 Cost per unit operation
Cost per unit operation
500 g/m3 day 500g/m3 day 900g/m3 day 300 g/m3 day
1. - Photobioreactor for 0.4 % for 1 % for 1 % for 0.4 %
cost 335 700 000 € 2008 335 700 000 335 700 000 186 500 000 559 500 000
energy demand 7 318 kW 7 318 7 318 4 065 12 197
2. - Flocculation + Sedimentation
$1982
Cost for 0.4 % 17 000 000,00 € 2008 26 900 000 26 900 000
Cost for 1 % 7 000 000,00 € 2008 11 100 000 11 100 000
energy demand neglected neglected neglected neglected neglected
3+4. - Ultrasound
cost for 0.4 % 33 100 000 33 100 000
33 100 000
cost for 1 % 13 332 000 € 2008
13 300 000 13 300 000 energy demand pump kW 89.7 35.9 35.9 89.7
energy demand sonification 2 744 1 097 1 097 2 744
5. - Settling tank
$1982
cost for 0.4 % 1 280 000 € 2008 2 020 000 2 020 000
cost for 1 % 680 000 1 080 000 1 080 000
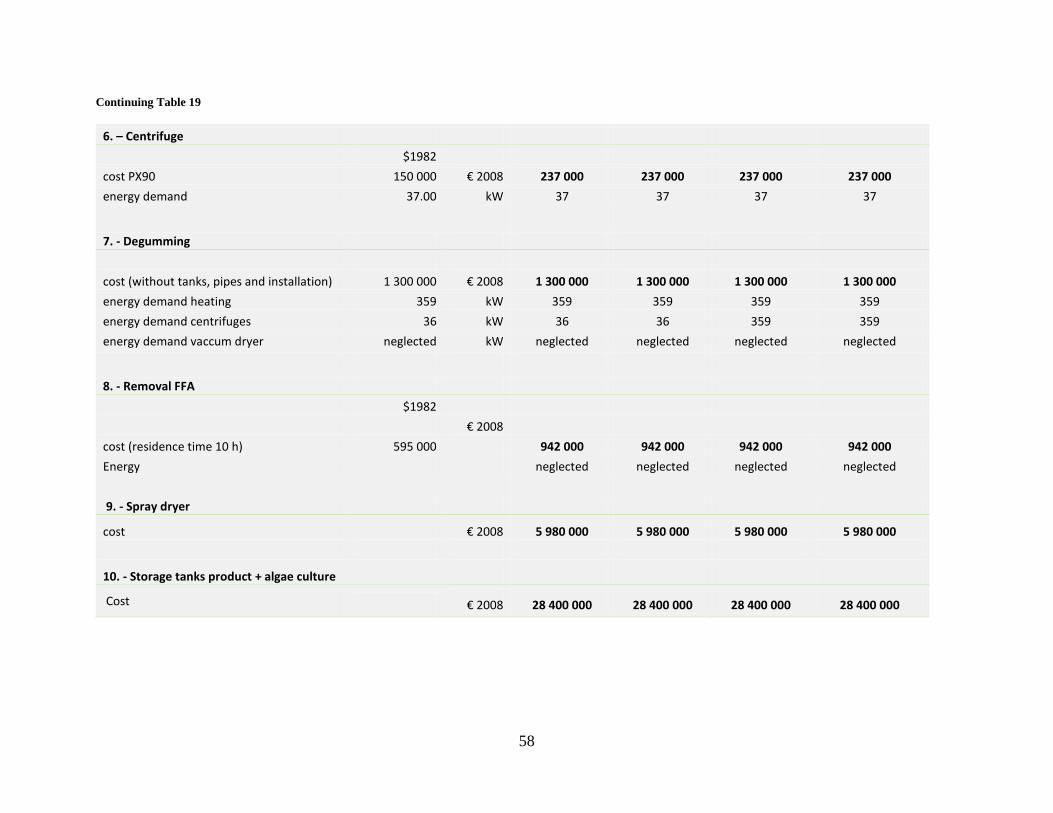
58
Continuing Table 19
6. – Centrifuge
$1982
cost PX90 150 000 € 2008 237 000 237 000 237 000 237 000
energy demand 37.00 kW 37 37 37 37
7. - Degumming
cost (without tanks, pipes and installation) 1 300 000 € 2008 1 300 000 1 300 000 1 300 000 1 300 000
energy demand heating 359 kW 359 359 359 359
energy demand centrifuges 36 kW 36 36 359 359
energy demand vaccum dryer neglected kW neglected neglected neglected neglected
8. - Removal FFA
$1982
€ 2008 cost (residence time 10 h) 595 000 942 000 942 000 942 000 942 000
Energy neglected neglected neglected neglected
9. - Spray dryer
cost € 2008 5 980 000 5 980 000 5 980 000 5 980 000
10. - Storage tanks product + algae culture
Cost € 2008 28 400 000 28 400 000 28 400 000 28 400 000
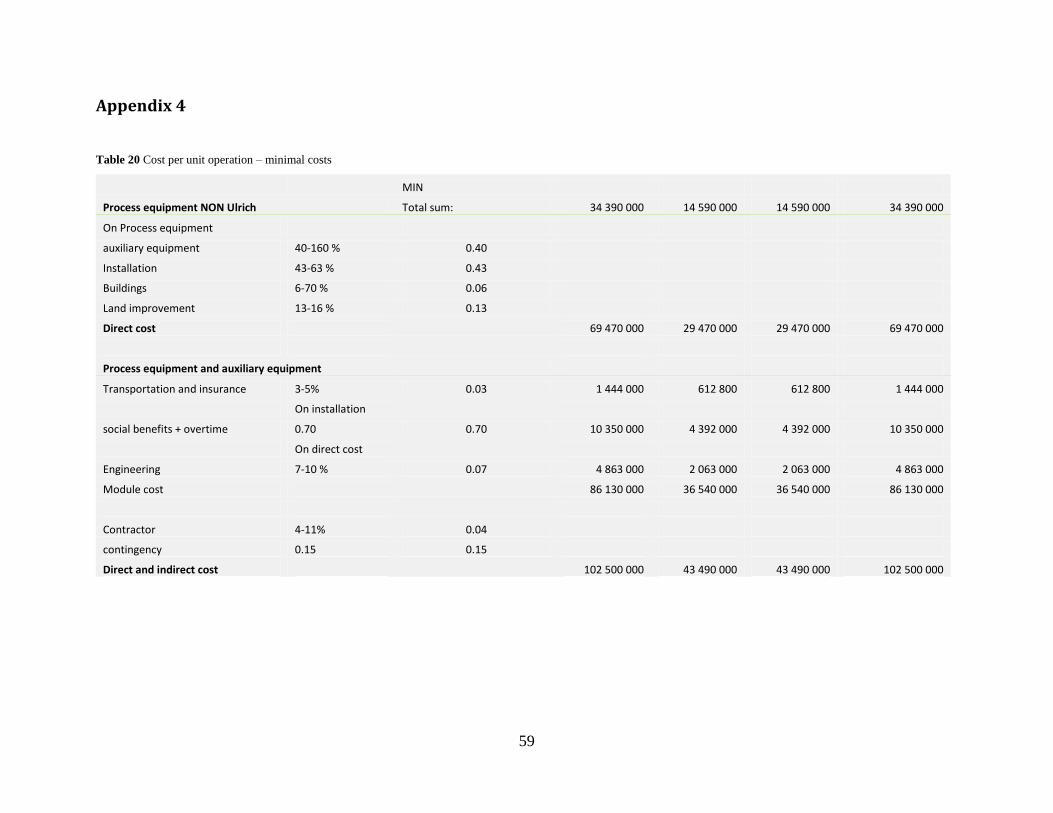
59
Appendix 4
Table 20 Cost per unit operation – minimal costs
MIN
Process equipment NON Ulrich Total sum: 34 390 000 14 590 000 14 590 000 34 390 000
On Process equipment
auxiliary equipment 40-160 % 0.40
Installation 43-63 % 0.43
Buildings 6-70 % 0.06
Land improvement 13-16 % 0.13
Direct cost
69 470 000 29 470 000 29 470 000 69 470 000
Process equipment and auxiliary equipment
Transportation and insurance 3-5% 0.03 1 444 000 612 800 612 800 1 444 000
On installation
social benefits + overtime 0.70 0.70 10 350 000 4 392 000 4 392 000 10 350 000
On direct cost
Engineering 7-10 % 0.07 4 863 000 2 063 000 2 063 000 4 863 000
Module cost
86 130 000 36 540 000 36 540 000 86 130 000
Contractor 4-11% 0.04
contingency 0.15 0.15
Direct and indirect cost
102 500 000 43 490 000 43 490 000 102 500 000
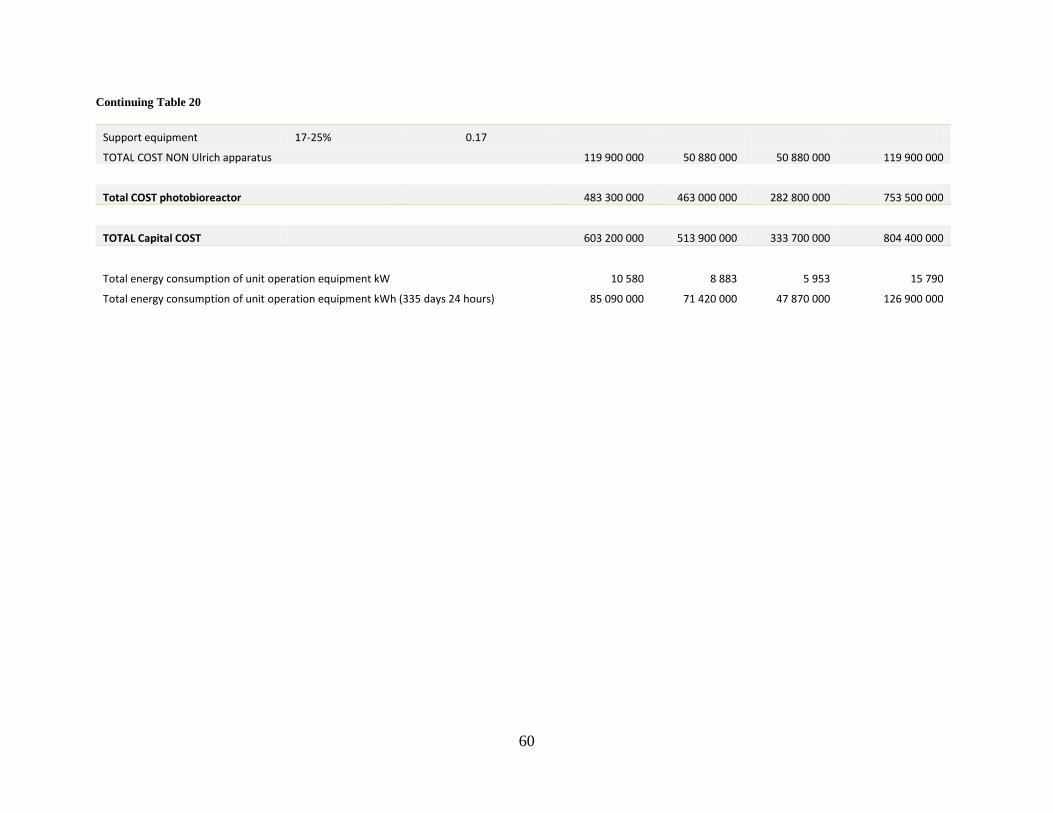
60
Continuing Table 20
Support equipment 17-25% 0.17
TOTAL COST NON Ulrich apparatus 119 900 000 50 880 000 50 880 000 119 900 000
Total COST photobioreactor 483 300 000 463 000 000 282 800 000 753 500 000
TOTAL Capital COST 603 200 000 513 900 000 333 700 000 804 400 000
Total energy consumption of unit operation equipment kW 10 580 8 883 5 953 15 790
Total energy consumption of unit operation equipment kWh (335 days 24 hours) 85 090 000 71 420 000 47 870 000 126 900 000
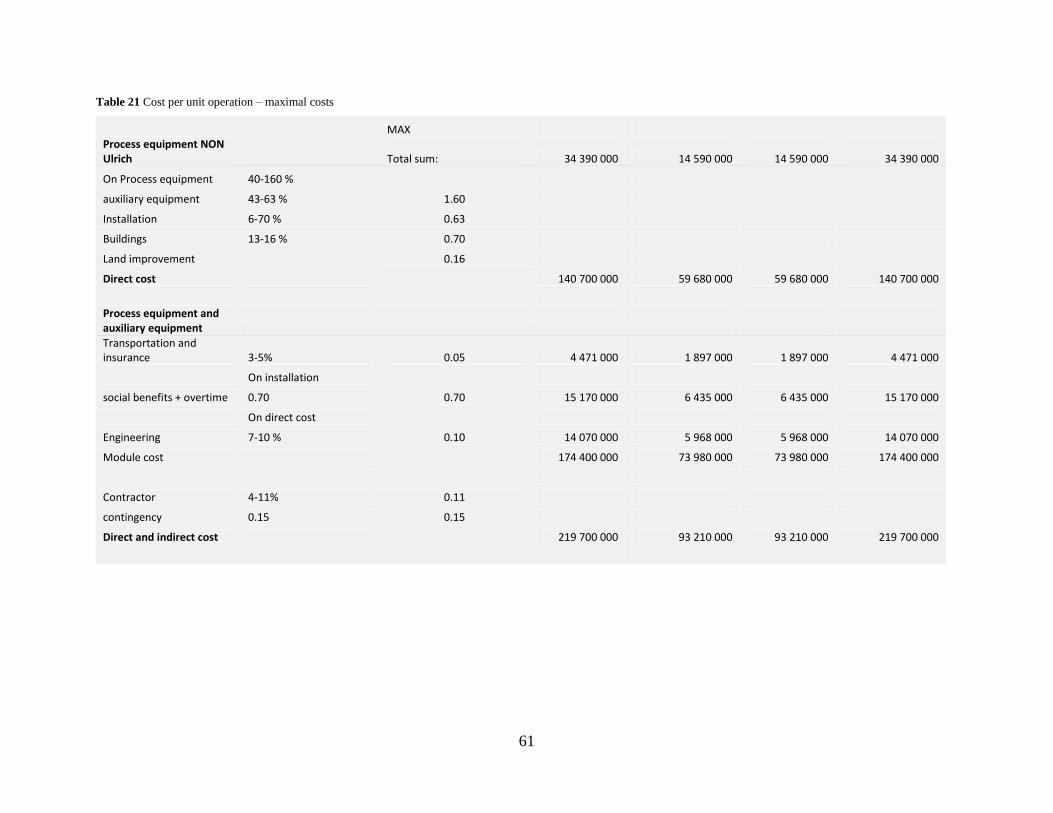
61
Table 21 Cost per unit operation – maximal costs
MAX Process equipment NON Ulrich
Total sum: 34 390 000 14 590 000 14 590 000 34 390 000
On Process equipment 40-160 %
auxiliary equipment 43-63 % 1.60
Installation 6-70 % 0.63
Buildings 13-16 % 0.70
Land improvement 0.16
Direct cost
140 700 000 59 680 000 59 680 000 140 700 000
Process equipment and auxiliary equipment
Transportation and insurance 3-5% 0.05 4 471 000 1 897 000 1 897 000 4 471 000
On installation
social benefits + overtime 0.70 0.70 15 170 000 6 435 000 6 435 000 15 170 000
On direct cost
Engineering 7-10 % 0.10 14 070 000 5 968 000 5 968 000 14 070 000
Module cost
174 400 000 73 980 000 73 980 000 174 400 000
Contractor 4-11% 0.11
contingency 0.15 0.15
Direct and indirect cost
219 700 000 93 210 000 93 210 000 219 700 000
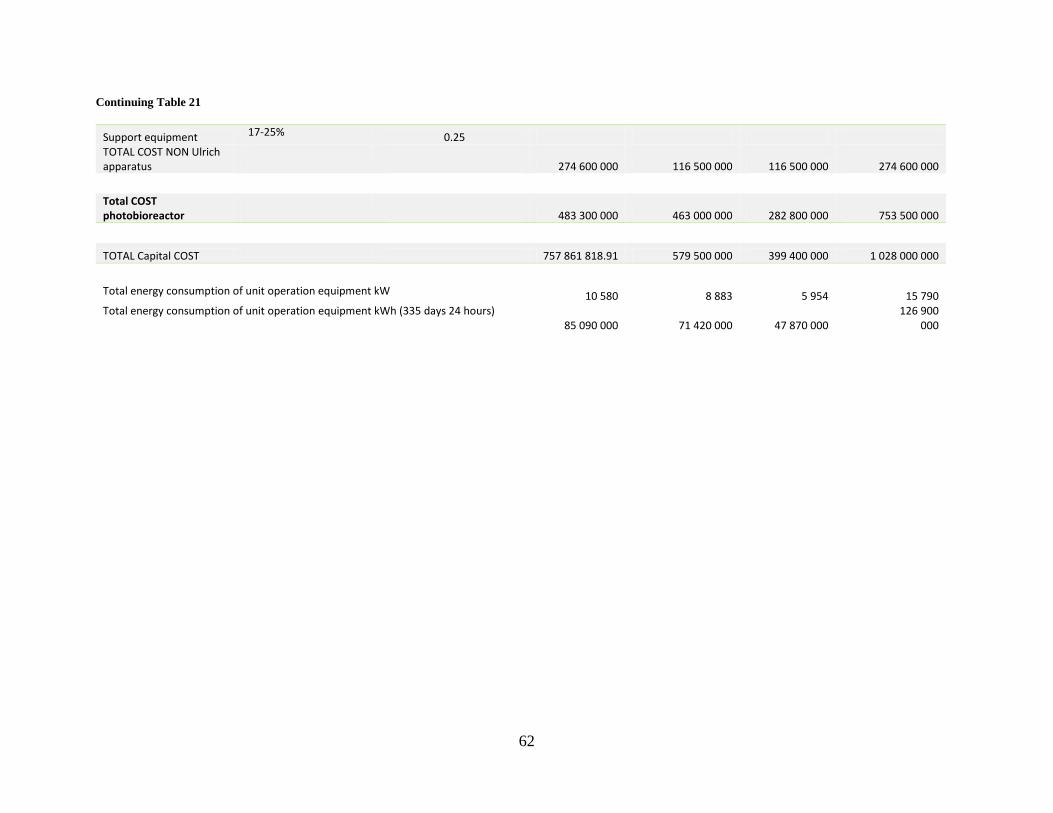
62
Continuing Table 21
Support equipment 17-25% 0.25 TOTAL COST NON Ulrich apparatus
274 600 000 116 500 000 116 500 000 274 600 000
Total COST photobioreactor
483 300 000 463 000 000 282 800 000 753 500 000
TOTAL Capital COST 757 861 818.91 579 500 000 399 400 000 1 028 000 000
Total energy consumption of unit operation equipment kW 10 580 8 883 5 954 15 790 Total energy consumption of unit operation equipment kWh (335 days 24 hours)
85 090 000 71 420 000 47 870 000 126 900
000
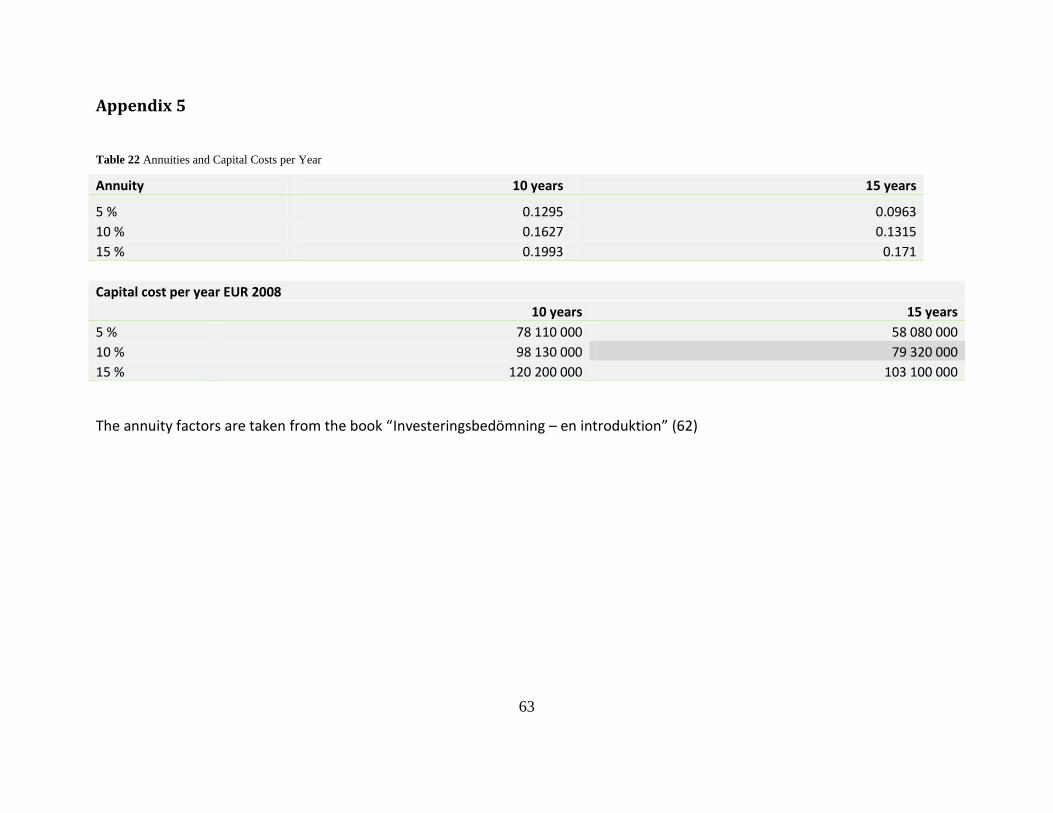
63
Appendix 5
Table 22 Annuities and Capital Costs per Year
Annuity 10 years 15 years
5 % 0.1295 0.0963
10 % 0.1627 0.1315
15 % 0.1993 0.171
Capital cost per year EUR 2008
10 years 15 years
5 % 78 110 000 58 080 000
10 % 98 130 000 79 320 000
15 % 120 200 000 103 100 000
The annuity factors are taken from the book “Investeringsbedömning – en introduktion” (62)
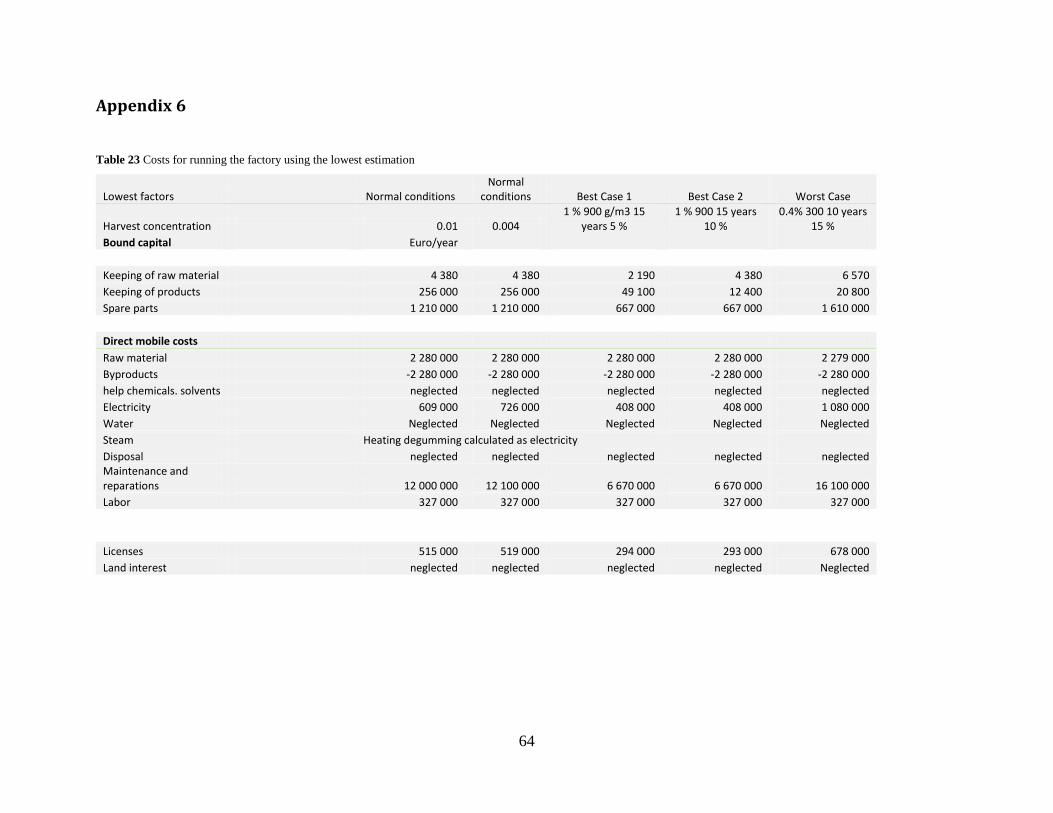
64
Appendix 6
Table 23 Costs for running the factory using the lowest estimation
Lowest factors
Normal conditions Normal
conditions Best Case 1 Best Case 2 Worst Case
Harvest concentration 0.01 0.004 1 % 900 g/m3 15
years 5 % 1 % 900 15 years
10 % 0.4% 300 10 years
15 %
Bound capital Euro/year
Keeping of raw material 4 380 4 380 2 190 4 380 6 570
Keeping of products 256 000 256 000 49 100 12 400 20 800
Spare parts 1 210 000 1 210 000 667 000 667 000 1 610 000
Direct mobile costs
Raw material 2 280 000 2 280 000 2 280 000 2 280 000 2 279 000
Byproducts -2 280 000 -2 280 000 -2 280 000 -2 280 000 -2 280 000
help chemicals. solvents neglected neglected neglected neglected neglected
Electricity 609 000 726 000 408 000 408 000 1 080 000
Water Neglected Neglected Neglected Neglected Neglected
Steam Heating degumming calculated as electricity
Disposal neglected neglected neglected neglected neglected Maintenance and reparations 12 000 000 12 100 000 6 670 000 6 670 000 16 100 000
Labor 327 000 327 000 327 000 327 000 327 000
Licenses 515 000 519 000 294 000 293 000 678 000
Land interest neglected neglected neglected neglected Neglected
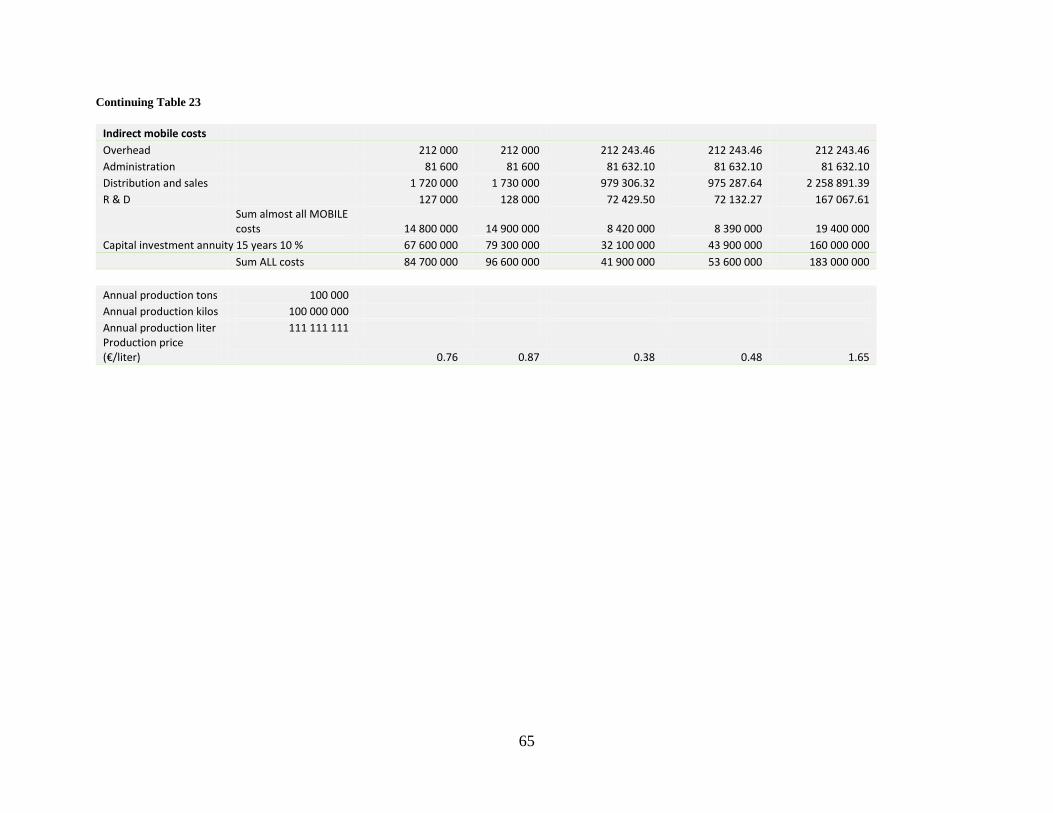
65
Continuing Table 23
Indirect mobile costs
Overhead 212 000 212 000 212 243.46 212 243.46 212 243.46
Administration 81 600 81 600 81 632.10 81 632.10 81 632.10
Distribution and sales 1 720 000 1 730 000 979 306.32 975 287.64 2 258 891.39
R & D 127 000 128 000 72 429.50 72 132.27 167 067.61
Sum almost all MOBILE costs 14 800 000 14 900 000 8 420 000 8 390 000 19 400 000
Capital investment annuity 15 years 10 % 67 600 000 79 300 000 32 100 000 43 900 000 160 000 000
Sum ALL costs 84 700 000 96 600 000 41 900 000 53 600 000 183 000 000
Annual production tons 100 000
Annual production kilos 100 000 000
Annual production liter 111 111 111 Production price (€/liter) 0.76 0.87 0.38 0.48 1.65
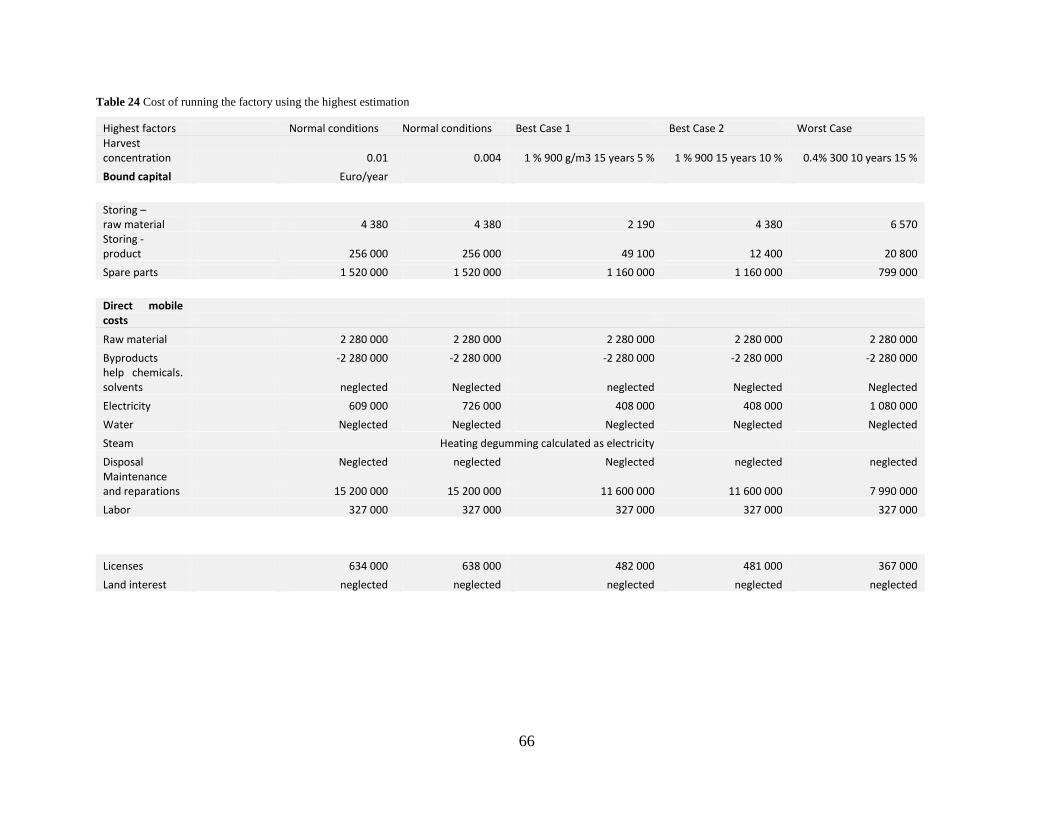
66
Table 24 Cost of running the factory using the highest estimation
Highest factors Normal conditions Normal conditions Best Case 1 Best Case 2 Worst Case Harvest concentration 0.01 0.004 1 % 900 g/m3 15 years 5 % 1 % 900 15 years 10 % 0.4% 300 10 years 15 %
Bound capital Euro/year
Storing –
raw material 4 380 4 380 2 190 4 380 6 570 Storing - product 256 000 256 000 49 100 12 400 20 800
Spare parts 1 520 000 1 520 000 1 160 000 1 160 000 799 000
Direct mobile
costs
Raw material 2 280 000 2 280 000 2 280 000 2 280 000 2 280 000
Byproducts -2 280 000 -2 280 000 -2 280 000 -2 280 000 -2 280 000 help chemicals. solvents neglected Neglected neglected Neglected Neglected
Electricity 609 000 726 000 408 000 408 000 1 080 000
Water Neglected Neglected Neglected Neglected Neglected
Steam Heating degumming calculated as electricity
Disposal Neglected neglected Neglected neglected neglected Maintenance and reparations 15 200 000 15 200 000 11 600 000 11 600 000 7 990 000
Labor 327 000 327 000 327 000 327 000 327 000
Licenses 634 000 638 000 482 000 481 000 367 000
Land interest neglected neglected neglected neglected neglected
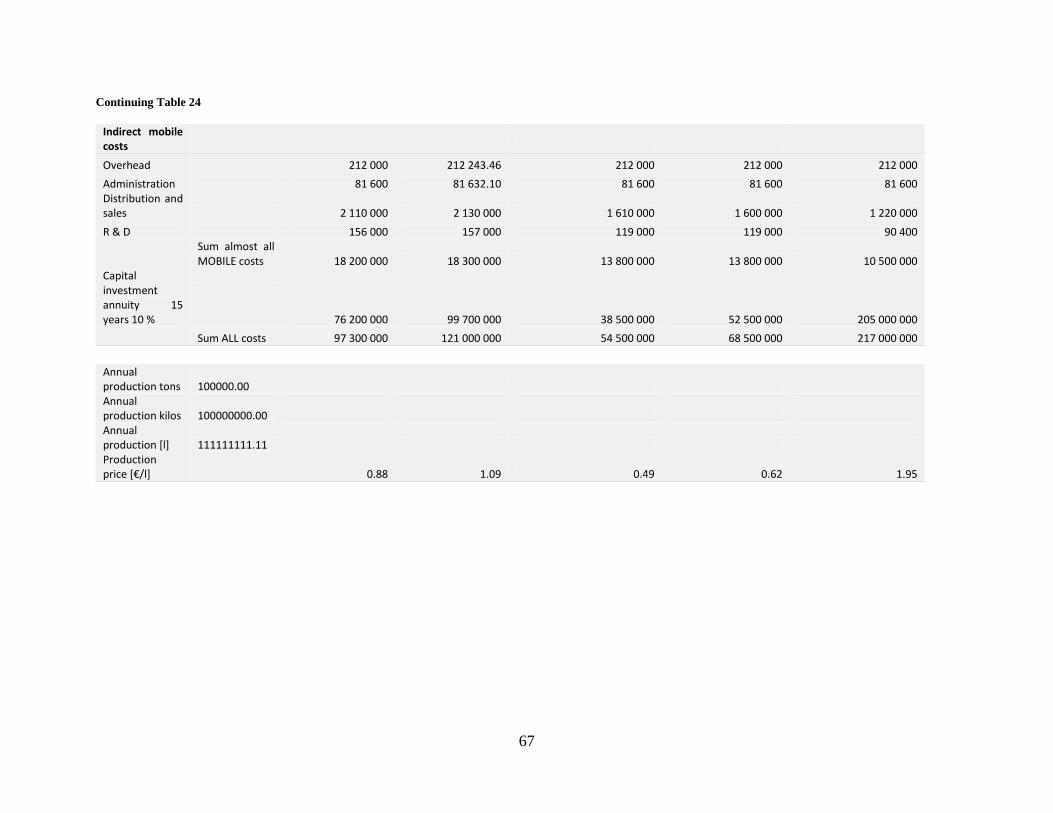
67
Continuing Table 24
Indirect mobile costs
Overhead 212 000 212 243.46 212 000 212 000 212 000
Administration 81 600 81 632.10 81 600 81 600 81 600 Distribution and sales 2 110 000 2 130 000 1 610 000 1 600 000 1 220 000
R & D 156 000 157 000 119 000 119 000 90 400
Sum almost all MOBILE costs 18 200 000 18 300 000 13 800 000 13 800 000 10 500 000
Capital investment annuity 15 years 10 %
76 200 000 99 700 000 38 500 000 52 500 000 205 000 000
Sum ALL costs 97 300 000 121 000 000 54 500 000 68 500 000 217 000 000
Annual
production tons 100000.00 Annual production kilos 100000000.00 Annual production [l] 111111111.11 Production price [€/l] 0.88 1.09 0.49 0.62 1.95
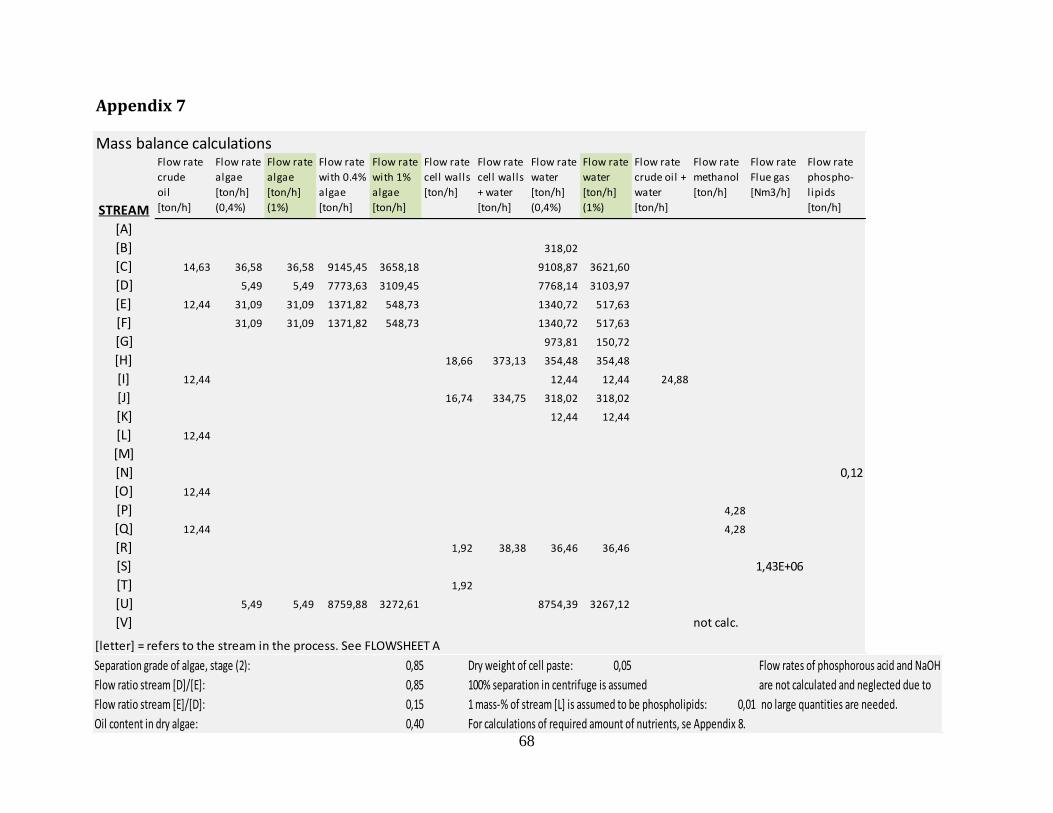
68
Appendix 7
Mass balance calculations
STREAM
Flow rate
crude
oil
[ton/h]
Flow rate
algae
[ton/h]
(0,4%)
Flow rate
algae
[ton/h]
(1%)
Flow rate
with 0.4%
algae
[ton/h]
Flow rate
with 1%
algae
[ton/h]
Flow rate
cell walls
[ton/h]
Flow rate
cell walls
+ water
[ton/h]
Flow rate
water
[ton/h]
(0,4%)
Flow rate
water
[ton/h]
(1%)
Flow rate
crude oil +
water
[ton/h]
Flow rate
methanol
[ton/h]
Flow rate
Flue gas
[Nm3/h]
Flow rate
phospho-
lipids
[ton/h]
[A]
[B] 318,02
[C] 14,63 36,58 36,58 9145,45 3658,18 9108,87 3621,60
[D] 5,49 5,49 7773,63 3109,45 7768,14 3103,97
[E] 12,44 31,09 31,09 1371,82 548,73 1340,72 517,63
[F] 31,09 31,09 1371,82 548,73 1340,72 517,63
[G] 973,81 150,72
[H] 18,66 373,13 354,48 354,48
[I] 12,44 12,44 12,44 24,88
[J] 16,74 334,75 318,02 318,02
[K] 12,44 12,44
[L] 12,44
[M]
[N] 0,12
[O] 12,44
[P] 4,28
[Q] 12,44 4,28
[R] 1,92 38,38 36,46 36,46
[S] 1,43E+06
[T] 1,92
[U] 5,49 5,49 8759,88 3272,61 8754,39 3267,12
[V] not calc.
[letter] = refers to the stream in the process. See FLOWSHEET A
Separation grade of algae, stage (2): 0,85 Dry weight of cell paste: 0,05 Flow rates of phosphorous acid and NaOH
Flow ratio stream [D]/[E]: 0,85 100% separation in centrifuge is assumed are not calculated and neglected due to
Flow ratio stream [E]/[D]: 0,15 1 mass-% of stream [L] is assumed to be phospholipids: 0,01 no large quantities are needed.
Oil content in dry algae: 0,40 For calculations of required amount of nutrients, se Appendix 8.
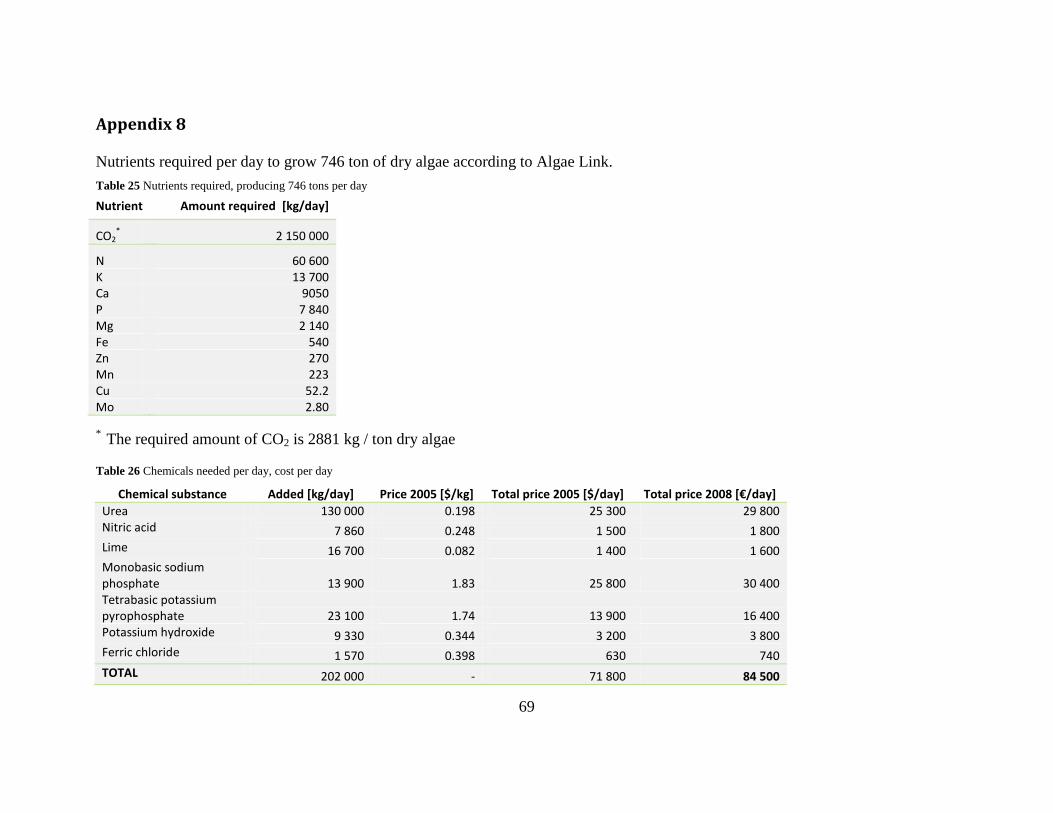
69
Appendix 8
Nutrients required per day to grow 746 ton of dry algae according to Algae Link.
Table 25 Nutrients required, producing 746 tons per day
Nutrient Amount required [kg/day]
CO2*
2 150 000
N 60 600 K 13 700 Ca 9050 P 7 840 Mg 2 140 Fe 540 Zn 270 Mn 223 Cu 52.2 Mo 2.80
* The required amount of CO2 is 2881 kg / ton dry algae
Table 26 Chemicals needed per day, cost per day
Chemical substance Added [kg/day] Price 2005 [$/kg] Total price 2005 [$/day] Total price 2008 *€/day+
Urea 130 000 0.198 25 300 29 800 Nitric acid 7 860 0.248 1 500 1 800 Lime 16 700 0.082 1 400 1 600 Monobasic sodium phosphate 13 900 1.83 25 800 30 400 Tetrabasic potassium pyrophosphate 23 100 1.74 13 900 16 400 Potassium hydroxide 9 330 0.344 3 200 3 800 Ferric chloride 1 570 0.398 630 740
TOTAL 202 000 - 71 800 84 500
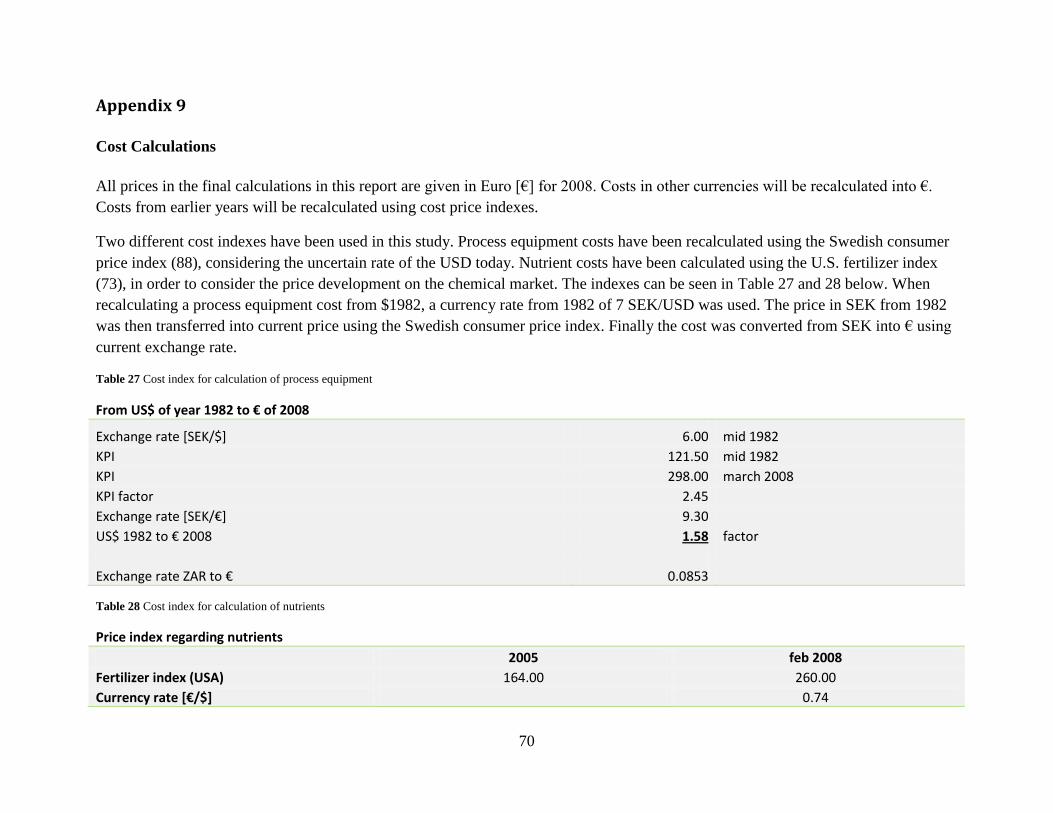
70
Appendix 9
Cost Calculations
All prices in the final calculations in this report are given in Euro [€] for 2008. Costs in other currencies will be recalculated into €.
Costs from earlier years will be recalculated using cost price indexes.
Two different cost indexes have been used in this study. Process equipment costs have been recalculated using the Swedish consumer
price index (88), considering the uncertain rate of the USD today. Nutrient costs have been calculated using the U.S. fertilizer index
(73), in order to consider the price development on the chemical market. The indexes can be seen in Table 27 and 28 below. When
recalculating a process equipment cost from $1982, a currency rate from 1982 of 7 SEK/USD was used. The price in SEK from 1982
was then transferred into current price using the Swedish consumer price index. Finally the cost was converted from SEK into € using
current exchange rate.
Table 27 Cost index for calculation of process equipment
From US$ of year 1982 to € of 2008
Exchange rate [SEK/$] 6.00 mid 1982 KPI 121.50 mid 1982 KPI 298.00 march 2008 KPI factor 2.45 Exchange rate [SEK/€] 9.30 US$ 1982 to € 2008 1.58 factor Exchange rate ZAR to € 0.0853
Table 28 Cost index for calculation of nutrients
Price index regarding nutrients 2005 feb 2008
Fertilizer index (USA) 164.00 260.00 Currency rate *€/$+
0.74
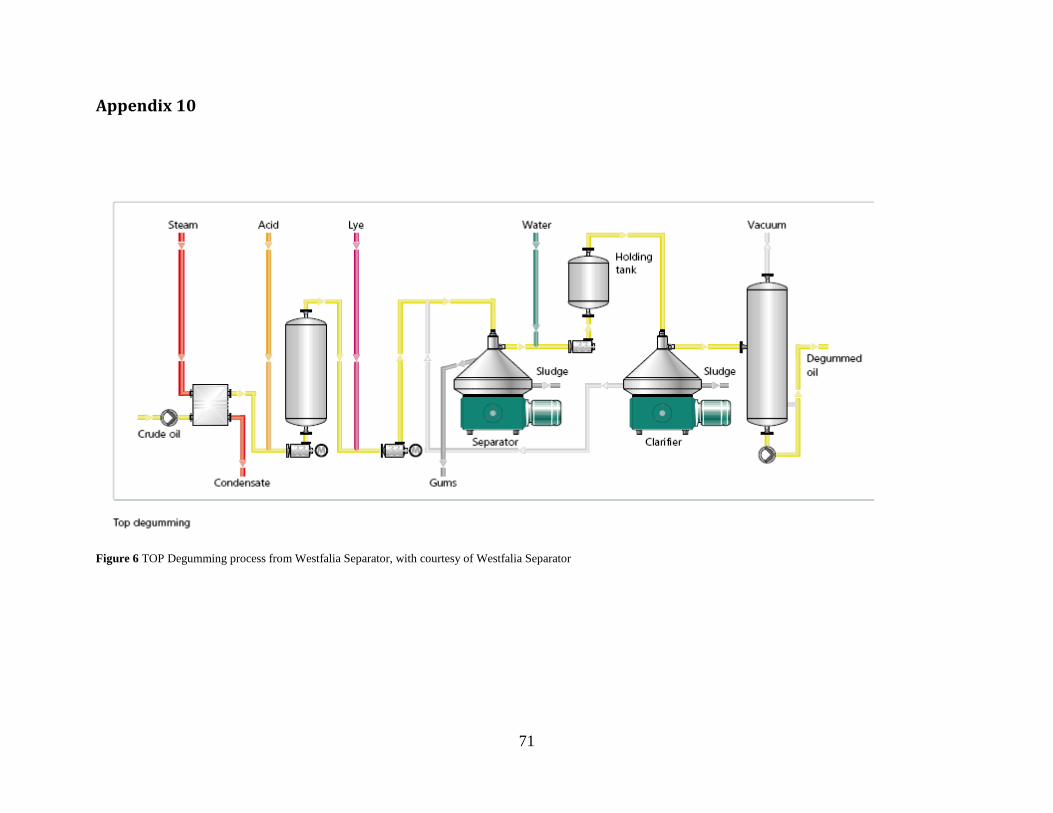
71
Appendix 10
Figure 6 TOP Degumming process from Westfalia Separator, with courtesy of Westfalia Separator
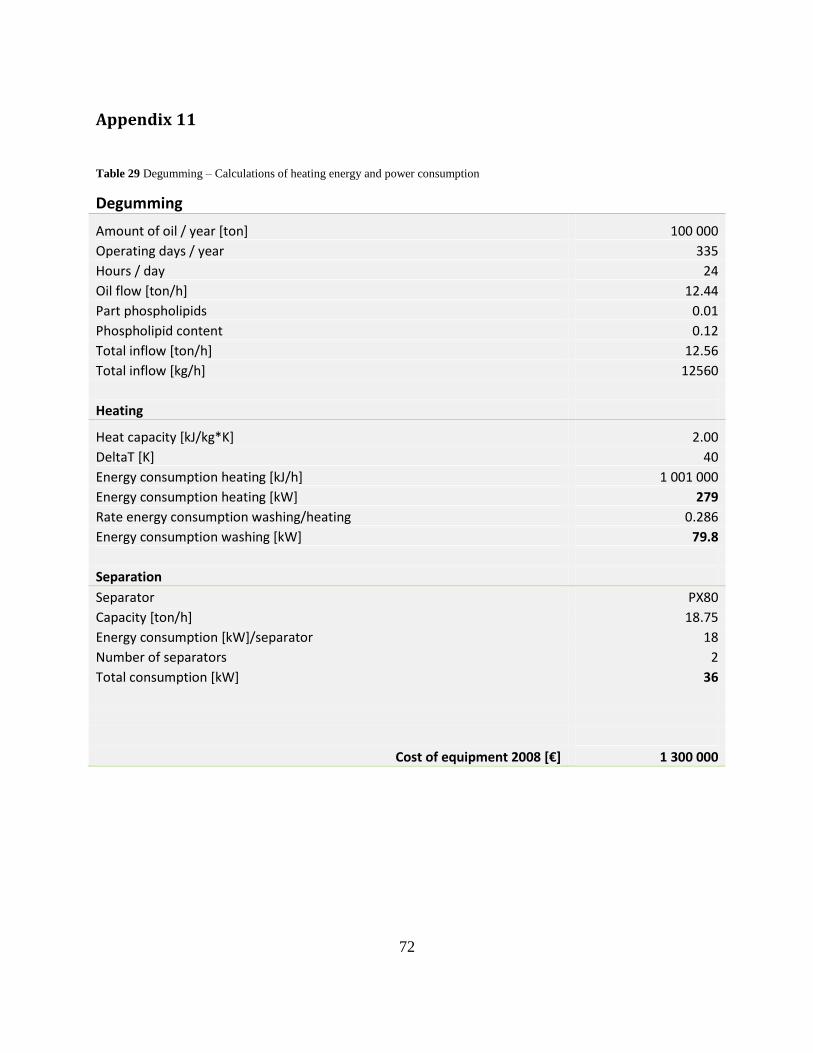
72
Appendix 11
Table 29 Degumming – Calculations of heating energy and power consumption
Degumming
Amount of oil / year [ton] 100 000
Operating days / year 335
Hours / day 24
Oil flow [ton/h] 12.44
Part phospholipids 0.01
Phospholipid content 0.12
Total inflow [ton/h] 12.56
Total inflow [kg/h] 12560
Heating
Heat capacity [kJ/kg*K] 2.00
DeltaT [K] 40
Energy consumption heating [kJ/h] 1 001 000
Energy consumption heating [kW] 279
Rate energy consumption washing/heating 0.286
Energy consumption washing [kW] 79.8
Separation
Separator PX80
Capacity [ton/h] 18.75
Energy consumption [kW]/separator 18
Number of separators 2
Total consumption [kW] 36
Cost of equipment 2008 *€+ 1 300 000
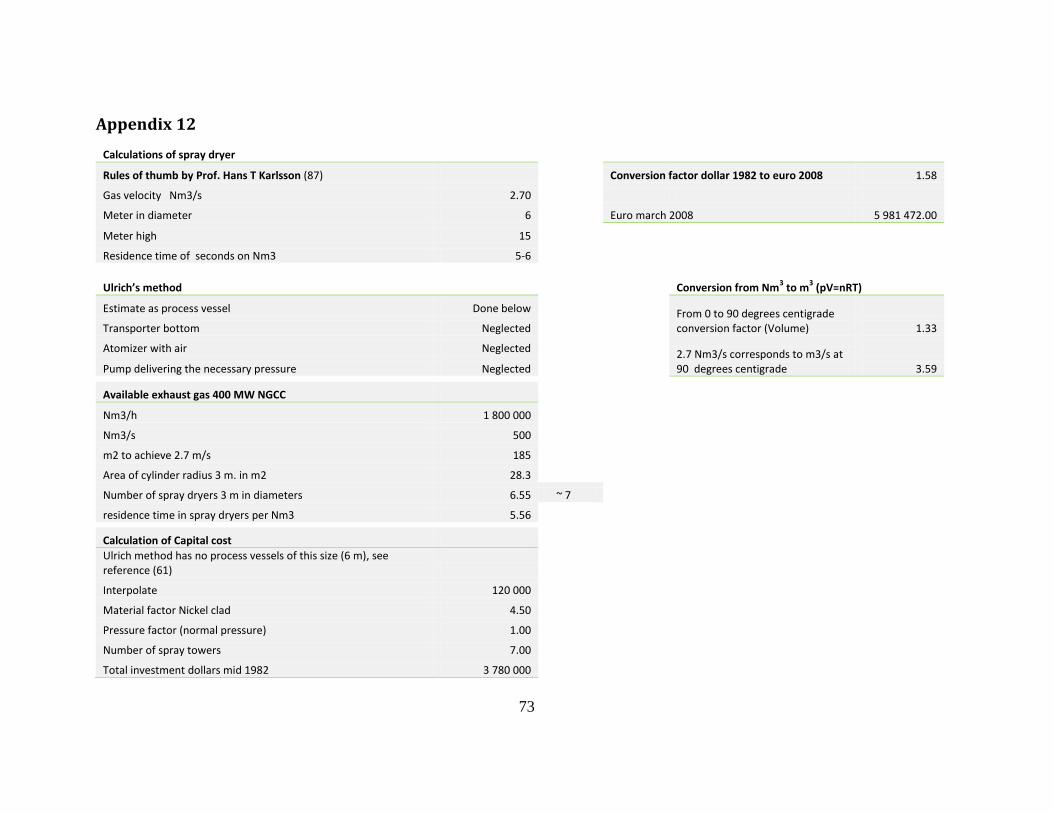
73
Appendix 12
Calculations of spray dryer
Rules of thumb by Prof. Hans T Karlsson (87)
Conversion factor dollar 1982 to euro 2008 1.58
Gas velocity Nm3/s 2.70
Meter in diameter 6
Euro march 2008 5 981 472.00
Meter high 15 Residence time of seconds on Nm3 5-6
Ulrich’s method
Conversion from Nm3 to m
3 (pV=nRT)
Estimate as process vessel Done below
From 0 to 90 degrees centigrade conversion factor (Volume)
Transporter bottom Neglected
1.33
Atomizer with air Neglected
2.7 Nm3/s corresponds to m3/s at 90 degrees centigrade
Pump delivering the necessary pressure Neglected
3.59
Available exhaust gas 400 MW NGCC Nm3/h 1 800 000 Nm3/s 500 m2 to achieve 2.7 m/s 185 Area of cylinder radius 3 m. in m2 28.3 Number of spray dryers 3 m in diameters 6.55 ~ 7
residence time in spray dryers per Nm3 5.56 Calculation of Capital cost Ulrich method has no process vessels of this size (6 m), see
reference (61) Interpolate 120 000 Material factor Nickel clad 4.50 Pressure factor (normal pressure) 1.00 Number of spray towers 7.00 Total investment dollars mid 1982 3 780 000
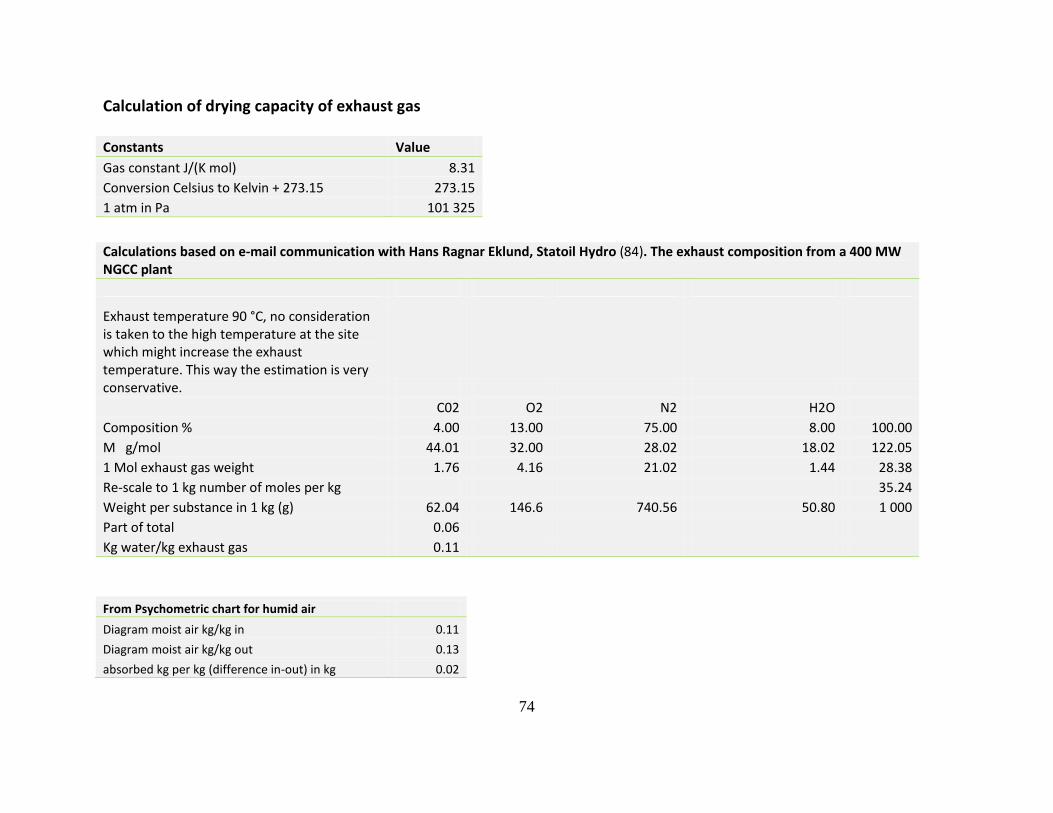
74
Calculation of drying capacity of exhaust gas
Constants Value Gas constant J/(K mol) 8.31 Conversion Celsius to Kelvin + 273.15 273.15 1 atm in Pa 101 325
Calculations based on e-mail communication with Hans Ragnar Eklund, Statoil Hydro (84). The exhaust composition from a 400 MW NGCC plant
Exhaust temperature 90 °C, no consideration is taken to the high temperature at the site which might increase the exhaust temperature. This way the estimation is very conservative.
C02 O2 N2 H2O Composition % 4.00 13.00 75.00 8.00 100.00 M g/mol 44.01 32.00 28.02 18.02 122.05 1 Mol exhaust gas weight 1.76 4.16 21.02 1.44 28.38 Re-scale to 1 kg number of moles per kg 35.24 Weight per substance in 1 kg (g) 62.04 146.6 740.56 50.80 1 000 Part of total 0.06 Kg water/kg exhaust gas 0.11
From Psychometric chart for humid air
Diagram moist air kg/kg in 0.11
Diagram moist air kg/kg out 0.13
absorbed kg per kg (difference in-out) in kg 0.02
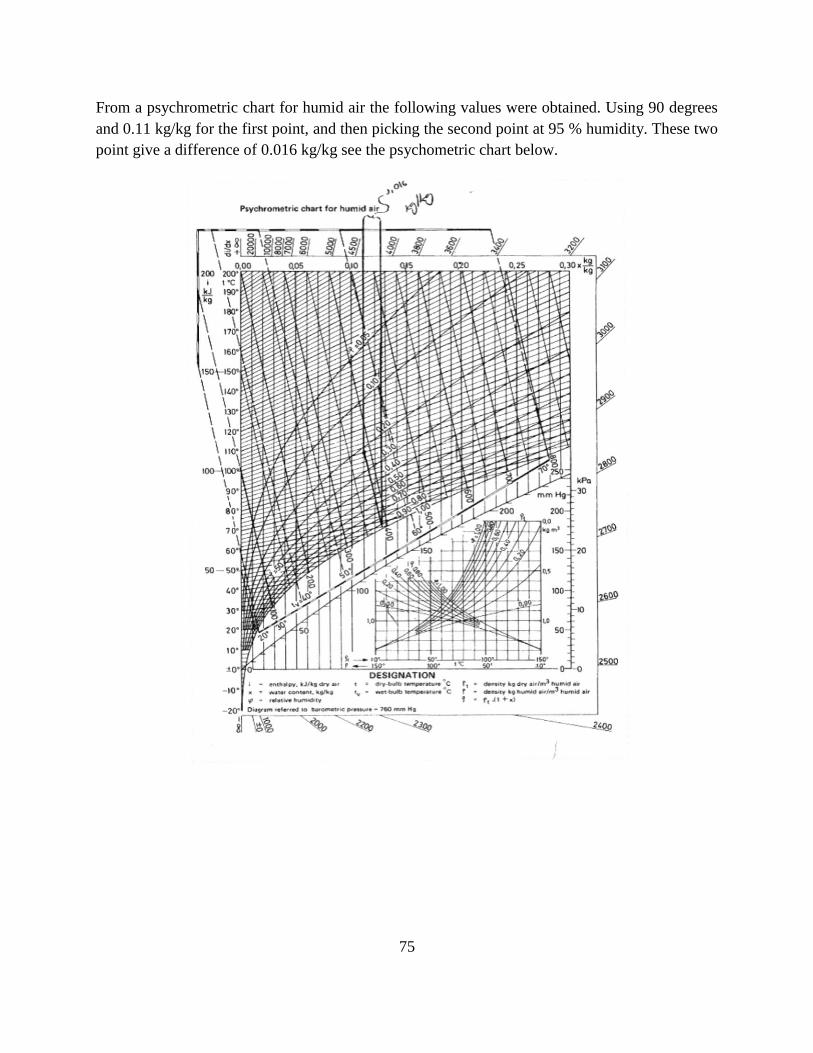
75
From a psychrometric chart for humid air the following values were obtained. Using 90 degrees
and 0.11 kg/kg for the first point, and then picking the second point at 95 % humidity. These two
point give a difference of 0.016 kg/kg see the psychometric chart below.
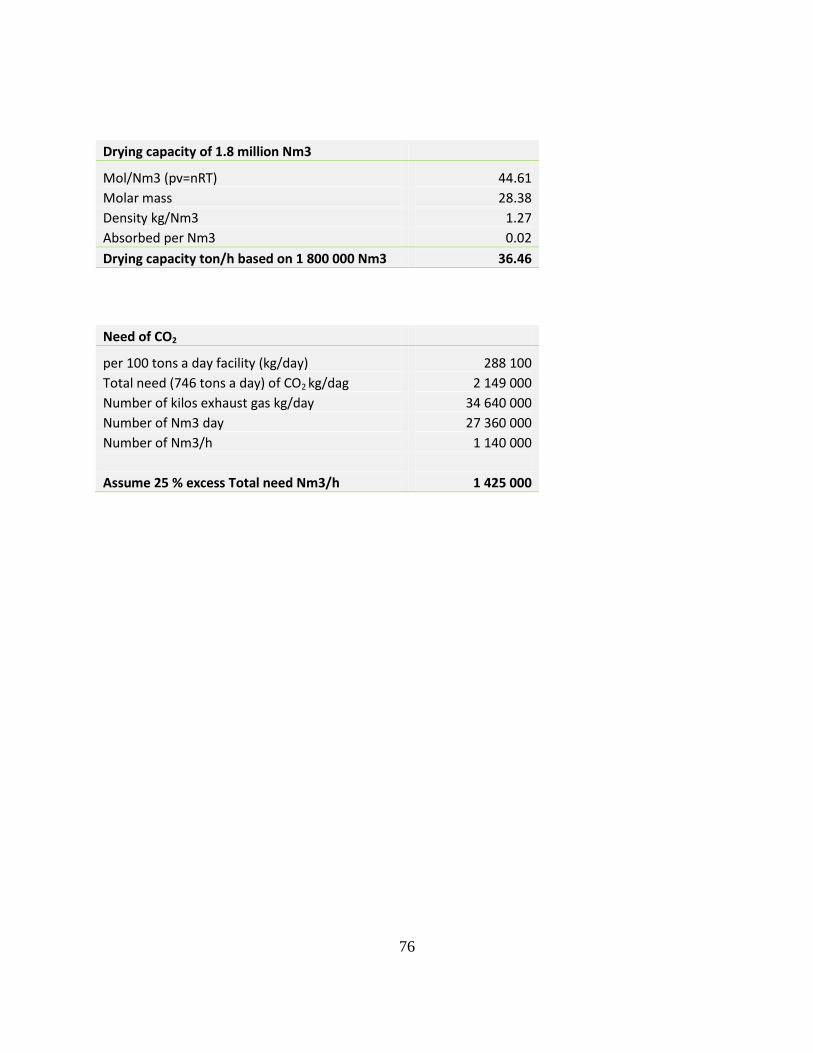
76
Drying capacity of 1.8 million Nm3
Mol/Nm3 (pv=nRT) 44.61
Molar mass 28.38
Density kg/Nm3 1.27
Absorbed per Nm3 0.02
Drying capacity ton/h based on 1 800 000 Nm3 36.46
Need of CO2
per 100 tons a day facility (kg/day) 288 100
Total need (746 tons a day) of CO2 kg/dag 2 149 000
Number of kilos exhaust gas kg/day 34 640 000
Number of Nm3 day 27 360 000
Number of Nm3/h 1 140 000
Assume 25 % excess Total need Nm3/h 1 425 000
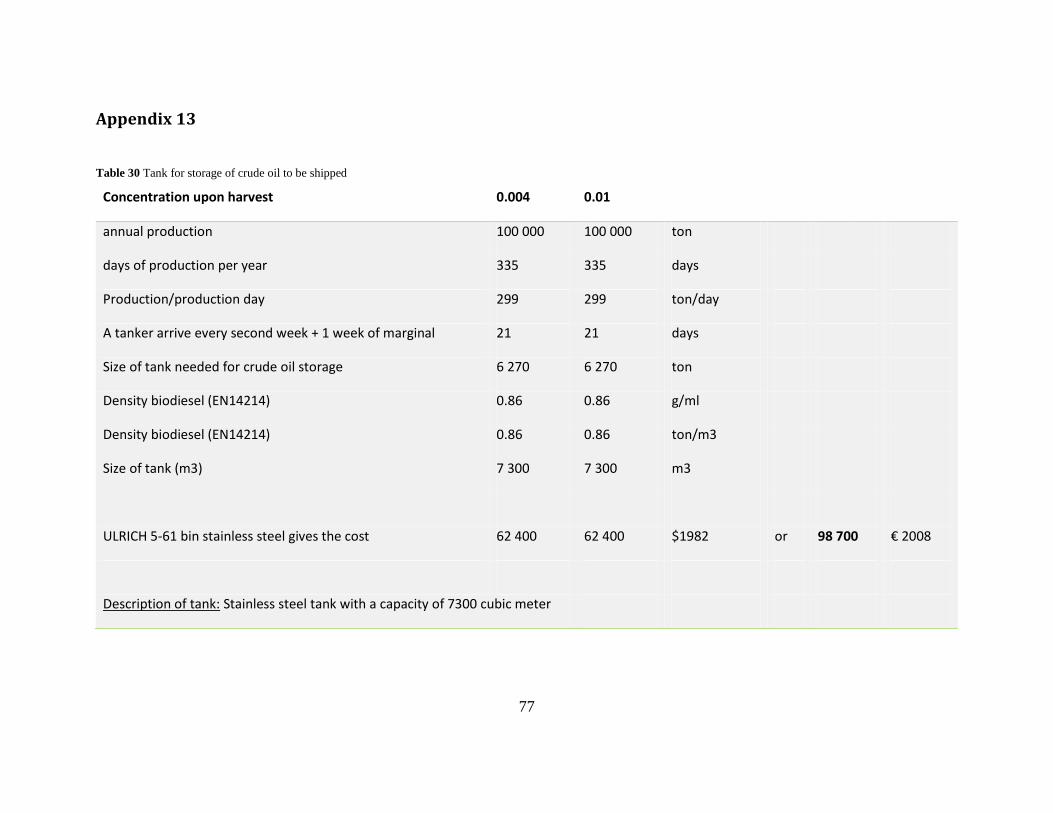
77
Appendix 13
Table 30 Tank for storage of crude oil to be shipped
Concentration upon harvest 0.004 0.01
annual production 100 000 100 000 ton
days of production per year 335 335 days
Production/production day 299 299 ton/day
A tanker arrive every second week + 1 week of marginal 21 21 days
Size of tank needed for crude oil storage 6 270 6 270 ton
Density biodiesel (EN14214) 0.86 0.86 g/ml
Density biodiesel (EN14214) 0.86 0.86 ton/m3
Size of tank (m3) 7 300 7 300 m3
ULRICH 5-61 bin stainless steel gives the cost 62 400 62 400 $1982 or 98 700 € 2008
Description of tank: Stainless steel tank with a capacity of 7300 cubic meter
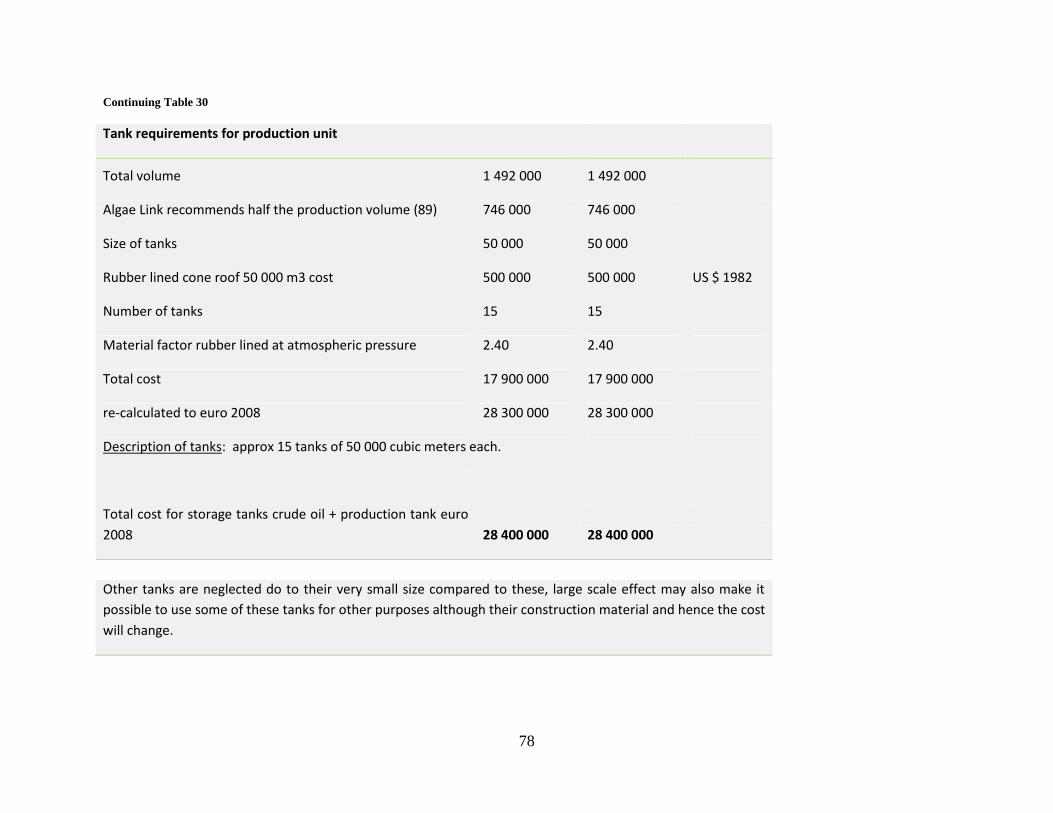
78
Continuing Table 30
Tank requirements for production unit
Total volume 1 492 000 1 492 000
Algae Link recommends half the production volume (89) 746 000 746 000
Size of tanks 50 000 50 000
Rubber lined cone roof 50 000 m3 cost 500 000 500 000 US $ 1982
Number of tanks 15 15
Material factor rubber lined at atmospheric pressure 2.40 2.40
Total cost 17 900 000 17 900 000
re-calculated to euro 2008 28 300 000 28 300 000
Description of tanks: approx 15 tanks of 50 000 cubic meters each.
Total cost for storage tanks crude oil + production tank euro
2008 28 400 000 28 400 000
Other tanks are neglected do to their very small size compared to these, large scale effect may also make it
possible to use some of these tanks for other purposes although their construction material and hence the cost
will change.
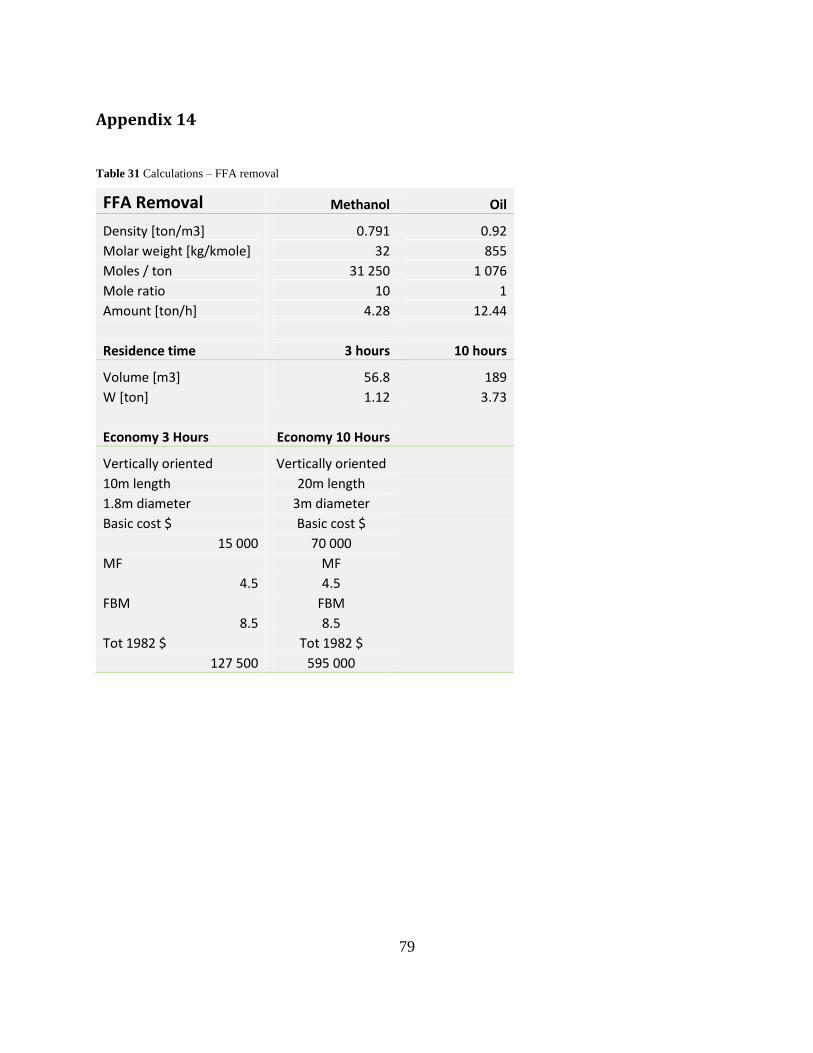
79
Appendix 14
Table 31 Calculations – FFA removal
FFA Removal Methanol Oil
Density [ton/m3] 0.791 0.92 Molar weight [kg/kmole] 32 855 Moles / ton 31 250 1 076
Mole ratio 10 1 Amount [ton/h] 4.28 12.44 Residence time 3 hours 10 hours
Volume [m3] 56.8 189 W [ton] 1.12 3.73
Economy 3 Hours Economy 10 Hours
Vertically oriented Vertically oriented
10m length 20m length
1.8m diameter 3m diameter
Basic cost $ Basic cost $
15 000 70 000
MF MF
4.5 4.5
FBM FBM
8.5 8.5
Tot 1982 $ Tot 1982 $
127 500 595 000
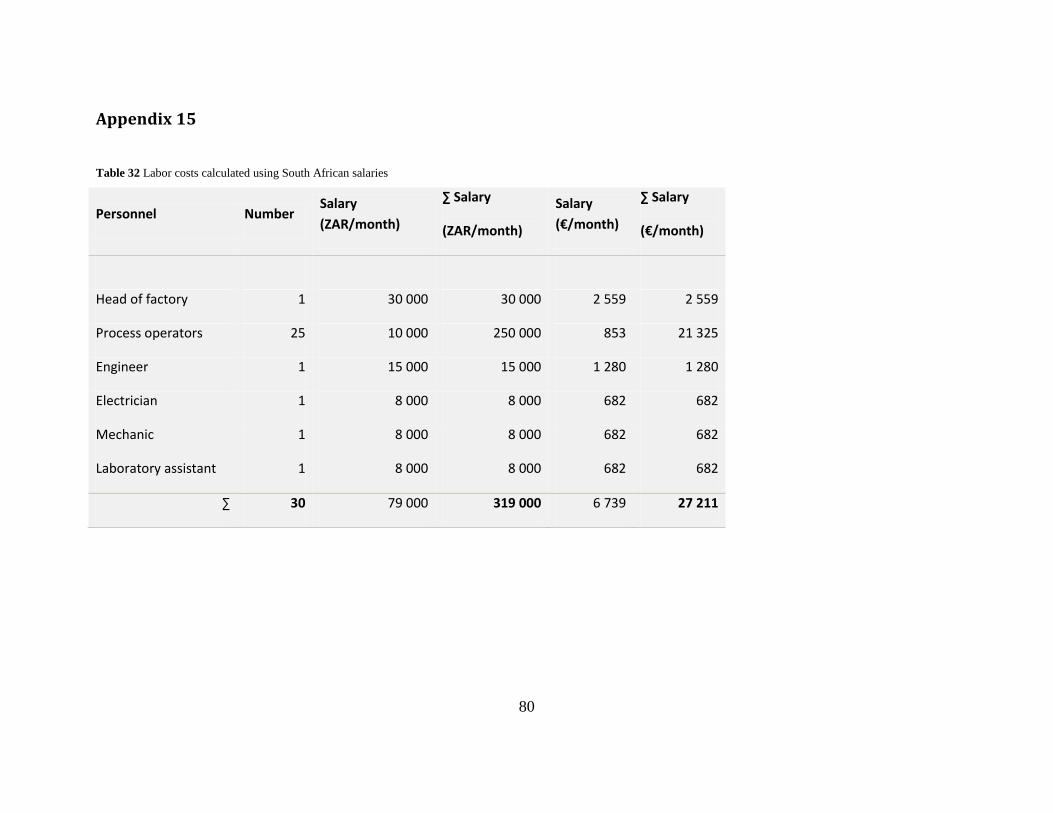
80
Appendix 15
Table 32 Labor costs calculated using South African salaries
Personnel Number Salary
(ZAR/month)
∑ Salary
(ZAR/month)
Salary
(€/month)
∑ Salary
(€/month)
Head of factory 1 30 000 30 000 2 559 2 559
Process operators 25 10 000 250 000 853 21 325
Engineer 1 15 000 15 000 1 280 1 280
Electrician 1 8 000 8 000 682 682
Mechanic 1 8 000 8 000 682 682
Laboratory assistant 1 8 000 8 000 682 682
∑ 30 79 000 319 000 6 739 27 211
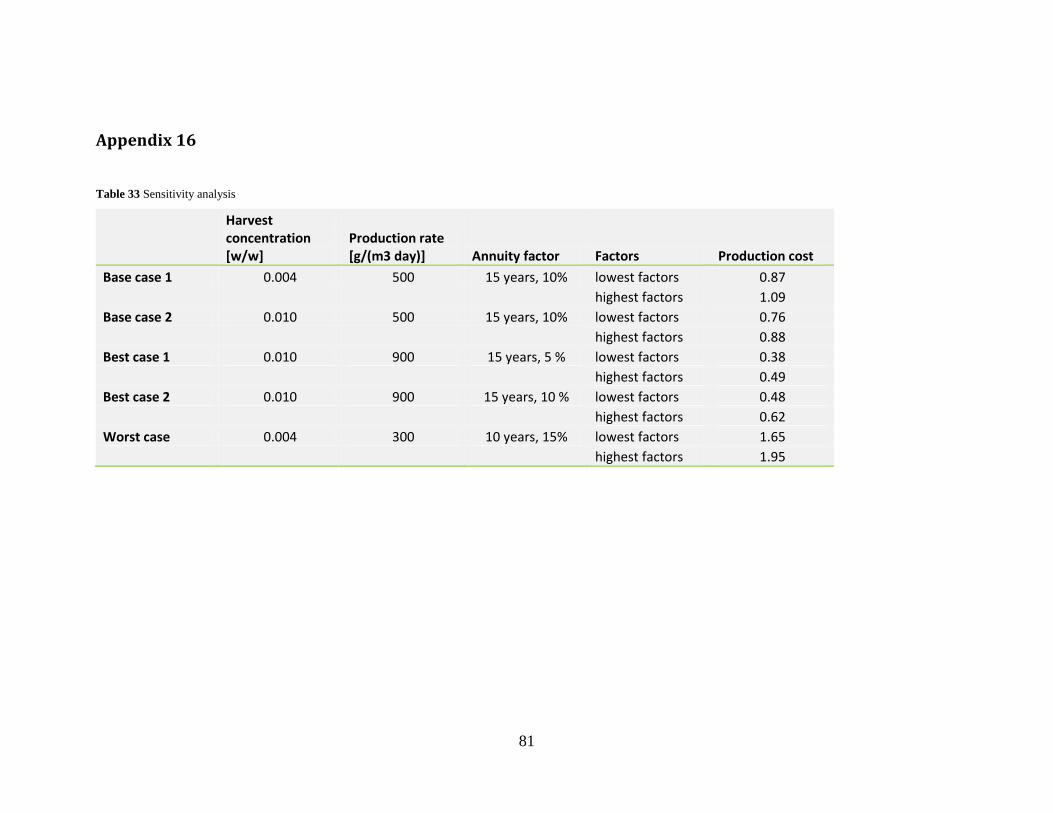
81
Appendix 16
Table 33 Sensitivity analysis
Harvest concentration [w/w]
Production rate [g/(m3 day)] Annuity factor Factors Production cost
Base case 1 0.004 500 15 years, 10% lowest factors 0.87
highest factors 1.09
Base case 2 0.010 500 15 years, 10% lowest factors 0.76
highest factors 0.88
Best case 1 0.010 900 15 years, 5 % lowest factors 0.38
highest factors 0.49
Best case 2 0.010 900 15 years, 10 % lowest factors 0.48
highest factors 0.62
Worst case 0.004 300 10 years, 15% lowest factors 1.65
highest factors 1.95