Embed Size (px)
Citation preview
Executive Summary
This study examines the prospective economic effects of a reduction below the current baseline in defense outlays of $100 billion per year over 10 years.
Several recent studies have attempted to esti-mate the supposedly adverse economic and em-ployment effects of reductions in government spending generally, and defense outlays in partic-ular. Such studies have tended to exaggerate the harmful effects of spending cuts and have ignored or understated the beneficial effects associated with redirecting resources to more productive uses.
A reduction in defense consumption and in-vestment shifts resources among economic sec-tors and thus has economic effects analogous to those caused by changes in demand and supply in any industry. The unemployment (or underem-ployment) of labor and other resources during the adjustment process can be politically significant but has only temporary economic effects; however painful for some, this process of resource reallo-
cation is economically beneficial in the aggregate over time. Moreover, the data suggest strongly that the adverse effects of spending cuts would be small in the aggregate because defense spending is a small component of GDP (less than 5 percent), and because estimates of the multiplier effects of defense expenditures reported in the scholarly lit-erature are relatively low.
The reduction in defense spending—and thus in federal spending in total—would reduce as well the economic costs of the excess burden that the tax system imposes upon the economy, in the form of distortions that reduce aggregate output. A conservative estimate of that effect is 35 percent of the reduction in defense spending. Accordingly, a reduction in defense outlays of $100 billion per year can be predicted, conservatively, to reduce economic costs by a total of $135 billion per year.
These potential savings in real resources are sufficiently large to justify a detailed analysis of U.S. national security needs and the outlays re-quired to defend them.
Economic Effects of Reductions in Defense Outlays
by Benjamin Zycher
No. 706 August 8, 2012
Benjamin Zycher is a senior fellow at the Pacific Research Institute, a visiting scholar at the American Enterprise Institute, and the president of Benjamin Zycher Economics Associates, Inc.

2
The longer-term security environment has yielded a
sharp reduction in the perceived
need for U.S. conventional
forces, including large pools
of manpower and munitions stockpiles and
heavy air, land, and sea force
structures.
Introduction
In this second decade of the 21st century, two obvious realities characterize the prospec-tive international security environment facing the United States. First, the Obama adminis-tration has implemented a significant reduc-tion of U.S. military operations in the Middle East and southwestern Asia, and a reversal of that dynamic is not likely. Obviously, new contingencies are possible given the nature of the evolving security environment in the Middle East and southwestern Asia writ large, and future U.S. military deployments in those regions cannot be assumed away. But U.S. operations in Iraq have ended, and they are diminishing in the Afghan theatre. The do-mestic political effects of those wars make re-newed ground operations in the Middle East highly unlikely.
Second, in the context of the longer-term security environment, the collapse of the So-viet Union and the attendant conventional threat in Europe has yielded a sharp reduc-tion in the perceived need for U.S. conven-tional forces, including large pools of man-power and munitions stockpiles and heavy air, land, and sea force structures.1 The end of the Soviet threat allowed a decline in U.S. active-duty manpower worldwide from about 2.1 million in 1990 to about 1.5 mil-lion in 1995 and about 1.4 million in 2000 and thereafter, which then increased again after 2001 to prosecute the wars in Iraq and Afghanistan.2 The Obama administration has announced its intent to reduce active-duty Army and Marine Corps manpower levels over the next five years by 92,000, or about 12 percent: for the Army from 562,000 to 490,000 and for the Marine Corps from 202,000 to 182,000, but both forces will re-main above their 2002 levels.3
In addition, current plans envision a U.S. military posture characterized by a continu-ing shift toward operations requiring smaller forces and a reduction (or a reduced growth rate) in defense outlays.4 This might yield a continuation of the downsizing of the force structure that began in the 1990s but was halt-
ed or reversed after 2001.5 In short, the chang-ing long-term threat environment facing the United States, at least arguably, will yield an optimal force structure smaller than that cur-rently supported.
The discussion above suggests that the demand for defense services as reflected in collective decisionmaking (a concept defined more fully below) may be declining. This is illustrated by the intensification of the pub-lic debate over the future of the defense budget, notwithstanding the reductions in the U.S. force structure that have been im-plemented since 1990. This paper does not offer an evaluation of the “correct” magni-tude of U.S. defense outlays over the next 10 fiscal years, nor of the proper allocation of such outlays (or the allocation of reductions in spending) across the many dimensions of the defense budget. Instead, the focus here is on the aggregate economic effects of re-ductions in defense outlays assumed to be implemented. Accordingly, for purposes of analysis we take as given a reduction of $1 trillion over the next 10 years, roughly con-sistent with the work by Benjamin H. Fried-man and Christopher Preble, and other re-cent studies.6
Table 1 presents data on recent and pro-jected new defense budget authority as re-quested in the Obama administration’s FY 2013 budget. An annual average reduction in defense outlays of about $100 billion would have been about 17.9 percent of to-tal defense spending (new budget authority) for fiscal year 2011; the respective figures for fiscal years 2012 through 2017, as estimat-ed by the Office of Management and Bud-get in the FY 2013 budget, range from 17.8 to 18.5 percent.7 For the 10-year period FY 2013–2021, the Budget Control Act (BCA) imposes, ostensibly, a spending (budget authority) reduction of $487 billion. Note, however, that this purported cut reflects the BCA spending limit relative to the FY 2012 budget proposal, which is not the same as an actual prior amount of spending (or budget authority).8 The FY 2013 budget proposal of the Obama administration comprises a mix
3
The changing long-term threat environment facing the United States, at least arguably, will yield an optimal force structure smaller than that currently supported.
of cuts and increases in various defense func-tions: Active-duty ground manpower, fighter aircraft, Navy surface combatants, and per-haps domestic bases would be reduced, while unmanned aircraft, cyber security, special operations, and submarine cruise missile ca-pacity would be increased.9 As noted above, the Friedman/Preble proposal would be a reduction in outlays of roughly 18 percent, yielding spending totals somewhat smaller than the BCA budget cap/sequestration fig-ures shown in Table 1 if the FY 2013 baseline shown in the table is assumed to be unbiased as an estimate of future defense outlays be-fore implementation of the BCA budget cap/sequestration limits.
In the next section, I discuss the nature of defense services as a good that protects hu-man, physical, and social capital from external
threats. In brief, defense services are similar to most other goods and services in an analytic sense, so that the unemployment and other economic effects resulting from a decline in the need for (or value of) defense services are irrelevant in terms of the appropriate level of defense spending. After that, I discuss the recent evidence on the relationship between defense outlays and GDP growth and exam-ine some peer-reviewed literature on the GDP growth effects of changes in government spending, whether for defense or nondefense. The central focus of the following section is the economic cost of the tax system needed to finance all federal outlays, including those for defense. Because of the tax system, the eco-nomic cost of federal spending is greater than the spending itself. The final section offers concluding observations.
Table 1Defense Budget Authority in FY 2013 Budget Proposal, Fiscal Years 2011–2017(billions of nominal dollars)
Fiscal Year
2011 2012 2013 2014 2015 2016 2017
Defense Totala 717.4 676.7 647.4 566.3 579.0 589.4 601.3
OCOb 158.8 115.1 88.5 26.2 39.5 42.5 43.4
Defense Baseline 558.6 561.6 558.9 540.1 539.5 546.9 557.9
Change from FY2012 –3.9 –62.6 –55.4 –102.4 –102.2 –104.8 n.a.
BCA budget cap/sequestration
n.a. n.a. 472.0 482.0 491.0 502.0 515.0
Change from FY2013baseline
n.a. –86.9 –58.1 –48.5 –44.9 –42.9 n.a.
Sources: FY2013 Budget, Historical Tables, Table 5.1, http://www.whitehouse.gov/sites/default/files/omb/budget/fy2013/assets/hist.pdf; FY2012 Budget, Historical Tables, Table 5.1, http://www.gpo.gov/fdsys/pkg/BUDGET-2012-TAB/pdf/BUDGET-2012-TAB.pdf; FY2013 Budget, http://www.whitehouse.gov/sites/default/files/omb/budget/fy2013/assets/defense.pdf, pp. 83-84; Todd Harrison, “$trategy in a Year of Fiscal Uncertainty,” Center for Strategic and Budgetary Assessments, February 2012, http://www.csbaonline.org/pub lications/2012/02/trategy-in-a-year-of-fiscal-uncertainty/, Table 1; and author computations.Notes: n.a.=not available or not applicable. aDefense total is outlay function 050 (total); FY2012–2017 are esti-mates. bOCO: Overseas Contingency Operations. Figures for 2014–2017 are placeholders from FY2013 budget.

4
To the extent that the defense
sector is too large, aggregate
resource use would be less
productive than otherwise might
be the case.
Defense Services as Economic Output
As a crude generalization, the ongoing de-bate over the size of the U.S. defense budget comprises two distinct focuses. The first is the nature and seriousness of the threat en-vironment facing the United States prospec-tively, and thus the appropriate magnitude and allocation of resources for defense. To the extent that defense services protect human, physical, and social capital from destruction or confiscation by foreign aggressors, such services protect life, liberty, property, and the benefits of civil society and encourage invest-ment and thus higher economic output (de-fined broadly) over the longer term.10 To the extent that the defense sector is too small or is allocated poorly across functions, or to the ex-tent that the defense budget is implemented inefficiently, external threats may loom too large and investment and the economy writ large are likely to be too small.11 To the extent that the defense sector is too large, aggregate resource use would be less productive than otherwise might be the case, and it is possible that the threat environment actually might grow as a foreign response to perceptions of an aggressive United States. The opposite ef-fect also is possible: by maintaining an over-whelming force structure, potential aggres-sors might be discouraged from the military competition. That type of model lies outside the scope of this paper. The optimal size and composition of the defense sector are shunted aside here; again, we assume cuts of $1 trillion or $100 billion per year for purposes of eco-nomic analysis.12
The second focus of the public debate—the topic of this paper—is on the economic effects of reductions in defense spending; the usual parameters discussed are direct em-ployment losses, and the indirect multiplier effects in related economic sectors.13 Except perhaps for purposes of short-run analysis of narrow economic shifts across sectors or industries, that general approach is prob-lematic because it ignores the benefits of an economic system that reallocates resources
to more productive uses as economic condi-tions change. Consider the market for any familiar good; the demand and supply of private security services is a good analogue. If the threat of crime declines we would ex-pect a decline in the demand for private se-curity services. A reduction in the quantity of security services, and perhaps a decline in the market price of such services, would re-flect this decline in demand.
This hypothetical reduction in the mar-ket size and price of private security services is a signal that such services have lost value. “Value” is the goods and services that a given demander (or the market as a whole) is will-ing to forgo to obtain security services. The declining value of security services means that the resources used in the production of those services—labor, buildings, vehicles, capital, and so on—now yield less (marginal) value when used in the production of se-curity services relative to their value in the production of other goods and services.14 Imagine a continuum of such resources, in-cluding labor, previously used to produce security services: some would be relatively better (more efficient) than others in pro-ductive activities in alternative economic sectors. The decline in the market price of se-curity services would induce those resources relatively more productive in alternative uses—and therefore relatively more costly to employ in the private security sector—to exit that sector and enter others earlier.
During the adjustment process, resourc-es, including labor, become unemployed (or perhaps underemployed). Some resources might be highly specialized in the produc-tion of security services; it may be difficult and time-consuming for the owners of these inputs to find new employment. Other re-sources might be less specialized but diffi-cult to move: they are specialized geographi-cally, and therefore also may find it difficult to find new employment quickly. Some re-sources—labor is a good example—may be more mobile than others, but the process of changing locales also might take substan-tial time. Even given that some of these re-

5
The movement of resources from less to more profitable sectors increases the aggregate productivity of the economy.
sources might find alternative employment quickly, increased unemployment of labor and other resources previously occupied in the production of private security services is certain for some period of time.
This shift of resources, including labor, across economic sectors is an example of what economists call “structural unemploy-ment.” It is the result of changes in the un-derlying economic conditions of demand and supply that yield shifts in the relative price signals inducing resources to flow toward and away from various sectors. In other words, as demand and supply condi-tions change, the “structure” of the economy changes as well: some industries grow while others decline, either absolutely or in a rela-tive sense. Structural unemployment is a fundamental feature of any dynamic econ-omy driven by constant changes in individ-ual preferences, individual choices, techno-logical shifts, and a myriad other factors.15 Any owner of an input, including workers suffering from unemployment caused by a change in market conditions, is worse off, at least temporarily. But the process of allow-ing market forces to redirect resource use increases aggregate output and wealth, thus making virtually all individuals better off over time on net. The movement of resources from less to more profitable sectors increases the aggregate productivity of the economy.16 Therefore, the increased unemployment and other adverse effects of the decline in the de-mand for private security services, however unpleasant for those bearing the brunt of the economic shifts, are not an adverse effect for the economy as a whole. To put it a bit differently, the short-term adverse effect of resources unemployed because of a shift in economic conditions is outweighed by the longer term benefit of a process in which re-sources are allocated and reallocated among alternative employments so as to increase the overall productivity or value of resource use, that is, aggregate wealth.17
There is one analytic difference between the simple example of a decline in the de-mand for private security services and a de-
cline in the demand for defense services: the latter is reflected in collective choices emerg-ing from democratic institutions and politi-cal processes rather than prices determined by market processes. A change in the aggre-gate demand for defense services is more difficult to measure (or to perceive) than is the case for goods and services traded in the private sector—value in the public sector is a good deal murkier—and public decisionmak-ers may have weaker incentives to respond to such changes in demand conditions.18 Nonetheless, if the threat environment has changed in ways yielding a perceived decline in the value of defense services, it is appropri-ate for some resources previously employed in the production of defense to become unemployed temporarily as they search for their most valuable uses under changed cir-cumstances.
Recent Research on Defense Outlays and the EconomyOnly rarely, if ever, do we ask in a policy
context about the unemployment effects of a decline in the rates of serious crimes, particu-larly with respect to such given sectors as pri-vate security services. Notwithstanding the straightforward standard analysis of struc-tural economic shifts, a substantial body of literature has attempted to estimate the supposedly adverse economic and employ-ment effects of reductions in government spending generally and defense outlays in particular. One recent estimate of the latter is presented by Stephen S. Fuller, professor of public policy with the Center for Region-al Analysis at George Mason University.19 Fuller’s analysis projects that a reduction in procurement spending of $45 billion in 2013 would yield the following impacts:
● About $164 billion in direct and indi-rect lost sales;20
● $59.4 billion in wage and salary reductions; ● About $27 billion in lost sales by sub-
contractors and other suppliers;

6
The use of labor (or any other resource) is a
cost of economic activity, and
the release of labor for more
productive uses is a benefit for
the economy as a whole.
● A decline of about $86.5 billion in GDP for 2013; and
● A loss of over one million full-time equivalent jobs.21
This analysis suffers from several prob-lems. At the outset, there is an obvious double-counting problem across the impact catego-ries: The adverse effects of the purported loss of employment (the fifth impact) already are captured in the previous four categories; more-over, the Fuller summary discussion, while a bit unclear, nonetheless suggests strongly that the $164 billion figure (the first impact) in-cludes the three subsequent categories.
At a general level, the Fuller study fails to distinguish between economic costs—the con-sumption of valuable resources, including labor—and the dynamics of resource alloca-tion shifts as a response to changes in relative prices. Lost employment is not a “cost” for the economy as a whole, notwithstanding the ad-verse effects suffered by the newly unemployed workers themselves. The unemployment of labor and other resources previously engaged in the production of defense services, howev-er difficult for the owners of those inputs, is part of a process yielding improved produc-tivity in the context of changing economic conditions.22 The use of labor (or any other resource) is a cost of economic activity, and the release of labor for more productive uses is a benefit for the economy as a whole. Jobs are not a benefit of defense spending or other policies; the use of labor (or, say, of any input, such as high-quality steel) in an economic ac-tivity is a cost of that activity because those re-sources no longer are available for other uses.
The Fuller analysis ignores the ancillary shifts attendant upon the assumed reduction in defense procurement. If the budget dollars previously spent on defense services are real-located to other government agencies, that increase in spending will offset the decline in defense outlays; in the short term there may be increased structural unemployment, but the analysis of that effect is identical to that summarized above in the private sector con-text.23 If government spending and borrow-
ing are reduced by the amount of the decline in defense procurement, those who otherwise would have lent to the government can lend to others instead, who in turn will consume (or invest in) some other set of goods and services. If taxation is reduced, taxpayers will have more to spend. The same general theme applies in each case: The decline in the govern-ment demand for defense goods and services will engender a shift of resources to other sec-tors, whether public or private, and under the assumption that the smaller defense sector reflects a lower value of (or need for) defense output, the structural unemployment that results is part of a process of resource reallo-cation that yields greater productivity for the economy as a whole.
The Fuller analysis summarized above sug-gests a GDP multiplier effect of 1.92 for 2013 as a result of a $45 billion reduction in de-fense procurement.24 The modern scholarly literature on the GDP effect of government spending growth casts significant doubt on any multiplier effect of that magnitude, even under the assumption that the concept of a multiplier effect is consistent with sound eco-nomic analysis. Cogan et al. estimate an ef-fect of only about 0.65 in the quarter with the highest impact of a large government “stimu-lus” policy, which obviously differs from a change in defense spending alone.25 Mount-ford and Uhlig, employing a different type of economic model, arrive at a very similar find-ing of 0.65 in the first quarter of a spending shock financed with debt.26 Both analyses find GDP effects that decline rapidly over the course of only several quarters. Similarly, Barro and Redlick find a multiplier effect for real GDP of 0.6 to 0.7 over a two-year period as an effect of temporary increases in defense spending. The estimated multiplier increases by 0.1 to 0.2 for permanent changes in defense expenditures. They find a somewhat stronger effect as the unemployment rate rises.27 Ramey finds a defense multiplier effect of 0.6 to 0.8 for the period after World War II.28 Hall finds a GDP multiplier of 0.7 to 1.0 for all govern-ment purchases, with a significantly higher estimate of 1.7 when the nominal rate of in-

7
A multiplier effect less than 1.0 suggests strongly that increases in defense spending (and government spending more generally) have effects on GDP that are offset by reductions in other economic activity.
terest is at zero.29 Parlow finds no effect of defense expenditures on the level or growth rate of GDP for the United States.30 In a new paper, Ramey finds a GDP multiplier from all government spending of about 0.5.31
Note that a GDP multiplier from changes in defense spending of approximately 0.6 to 0.8 is in the range reported in most of the scholarly literature.32 Table 2 presents the empirical findings summarized above.
That most of the empirical estimates of the multiplier effect are less than 1.0 suggests strongly that increases in defense spending (and government spending more generally) have effects on GDP that are offset by reduc-tions in other economic activity.
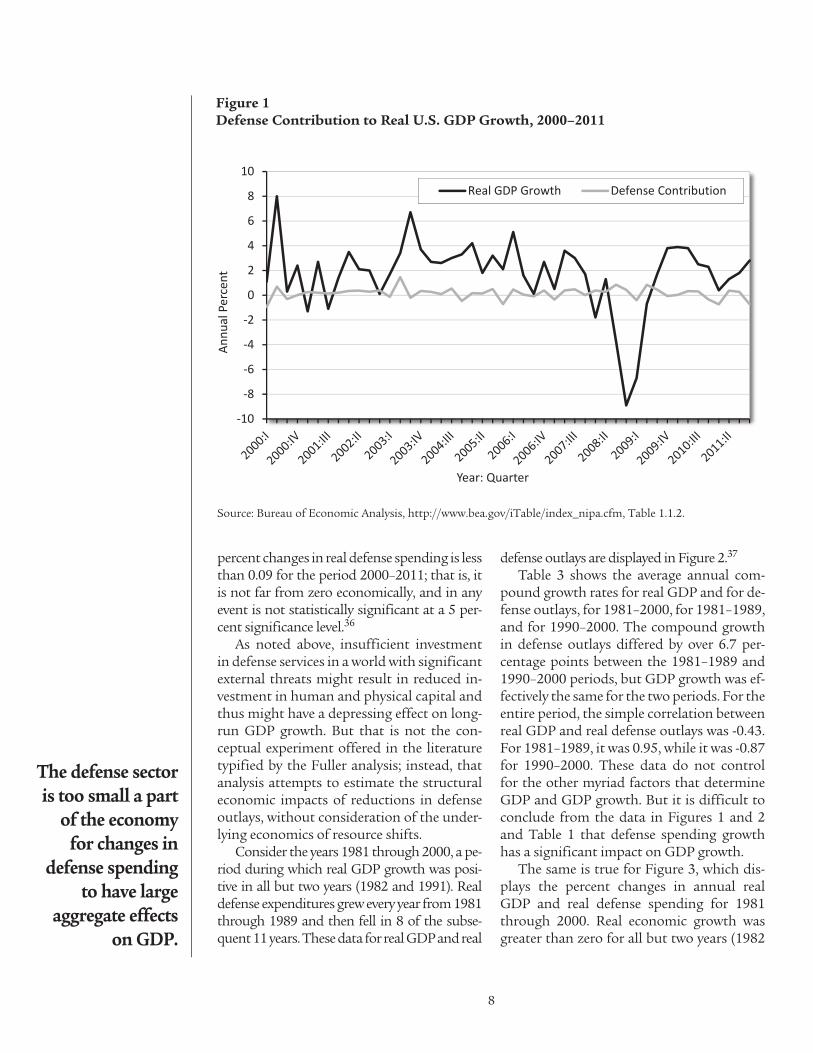
This conclusion is corroborated by compar-isons of defense spending and GDP growth. Consider Figure 1, below, which displays quar-terly data (at annual rates) on the defense con-tribution to GDP growth for 2000–2011.33 The defense contribution is zero statistically: the mean figure for the 48 quarters is 0.15 per-cent, with a standard deviation of 0.45. More-over, the mean in this case does not obscure
wide variation. The defense contribution to GDP growth is close to zero for virtually the entire period. This is not surprising. Defense spending as a proportion of GDP was 3 per-cent in fiscal year 2000, rising to 4.8 percent in FY2010, and then 4.7 percent in FY2011.34 In other words, even shunting aside the correct analysis of structural shifts, the defense sector is too small a part of the economy for changes in defense spending to have large aggregate effects on GDP. A proposal to reduce defense outlays by $100 billion annually would have amounted to only about 0.66 percent of GDP in 2011, a proportion that would decline each year thereafter as GDP grows.35 It is not plau-sible that a cut of that magnitude would have large aggregate effects, and the adverse short-term effects felt by particular individuals and communities properly are viewed as short–run structural shifts, as discussed above. Moreover, even apart from the conceptual difficulties with the commonly assumed relation between GDP growth and shifts in defense spending, the simple correlation between quarterly (at annual rates) percent changes in real GDP and
Table 2Estimated Multiplier Effects
Author Estimate Notes
Fuller 1.92 defense procurement
Cogan et al. 0.65 large stimulus
Mountford and Uhlig 0.65 spending “shock”
Barro and Redlick 0.6–0.9 increases in defense spending
Ramey (2011) 0.6–0.8 defense spending after WW2
Hall 0.7–1.0 all government purchases
Parlow 0 defense spending
Ramey (2012) 0.5 all government spending
Sources: See text above for sources.
8
The defense sector is too small a part
of the economy for changes in
defense spending to have large
aggregate effects on GDP.
percent changes in real defense spending is less than 0.09 for the period 2000–2011; that is, it is not far from zero economically, and in any event is not statistically significant at a 5 per-cent significance level.36
As noted above, insufficient investment in defense services in a world with significant external threats might result in reduced in-vestment in human and physical capital and thus might have a depressing effect on long-run GDP growth. But that is not the con-ceptual experiment offered in the literature typified by the Fuller analysis; instead, that analysis attempts to estimate the structural economic impacts of reductions in defense outlays, without consideration of the under-lying economics of resource shifts.
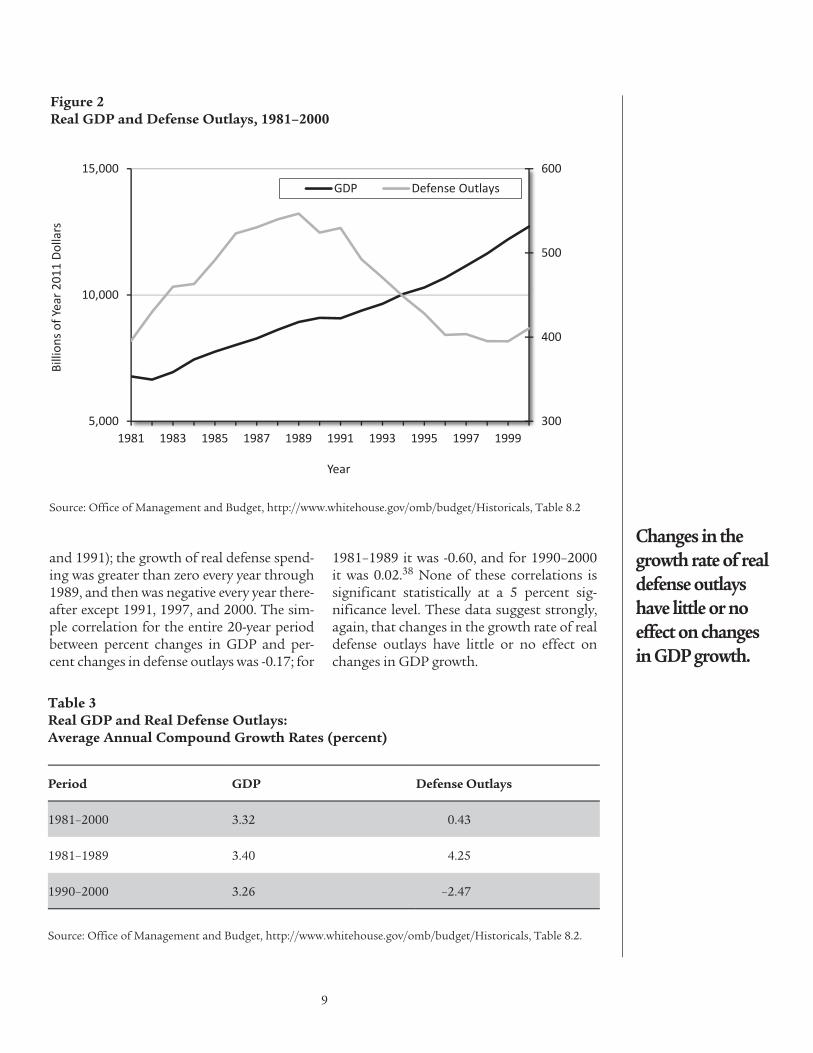
Consider the years 1981 through 2000, a pe-riod during which real GDP growth was posi-tive in all but two years (1982 and 1991). Real defense expenditures grew every year from 1981 through 1989 and then fell in 8 of the subse-quent 11 years. These data for real GDP and real
defense outlays are displayed in Figure 2.37
Table 3 shows the average annual com-pound growth rates for real GDP and for de-fense outlays, for 1981–2000, for 1981–1989, and for 1990–2000. The compound growth in defense outlays differed by over 6.7 per-centage points between the 1981–1989 and 1990–2000 periods, but GDP growth was ef-fectively the same for the two periods. For the entire period, the simple correlation between real GDP and real defense outlays was -0.43. For 1981–1989, it was 0.95, while it was -0.87 for 1990–2000. These data do not control for the other myriad factors that determine GDP and GDP growth. But it is difficult to conclude from the data in Figures 1 and 2 and Table 1 that defense spending growth has a significant impact on GDP growth.
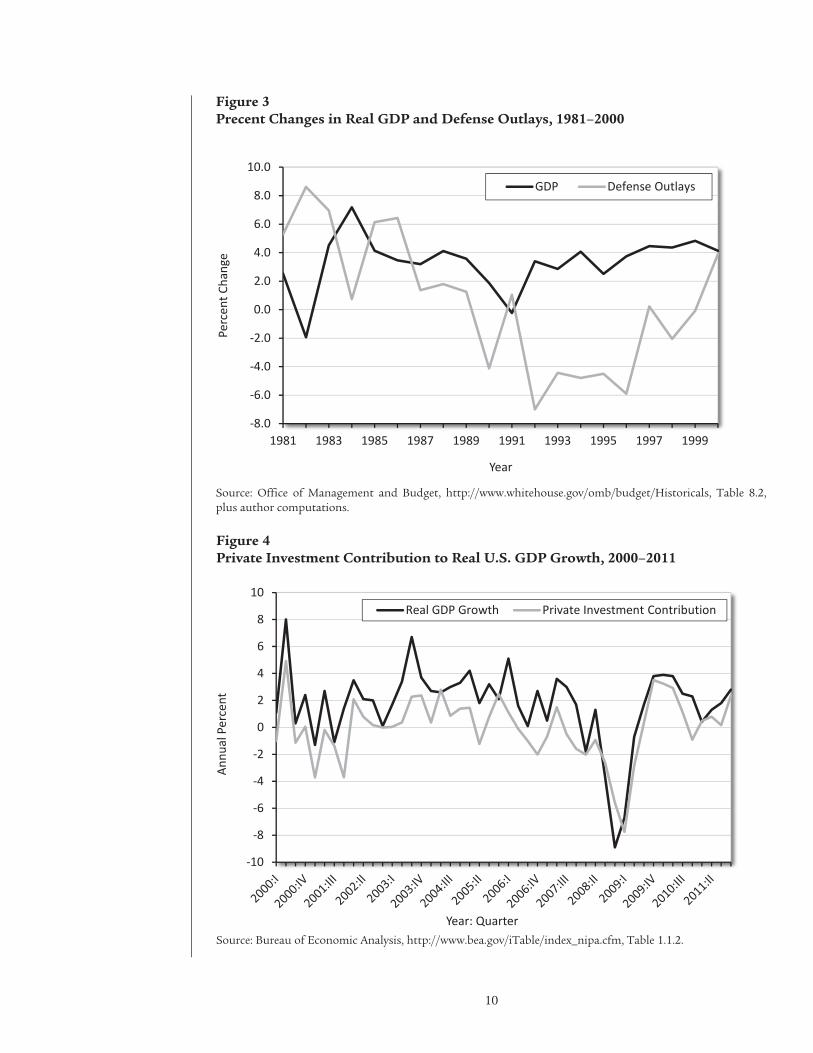
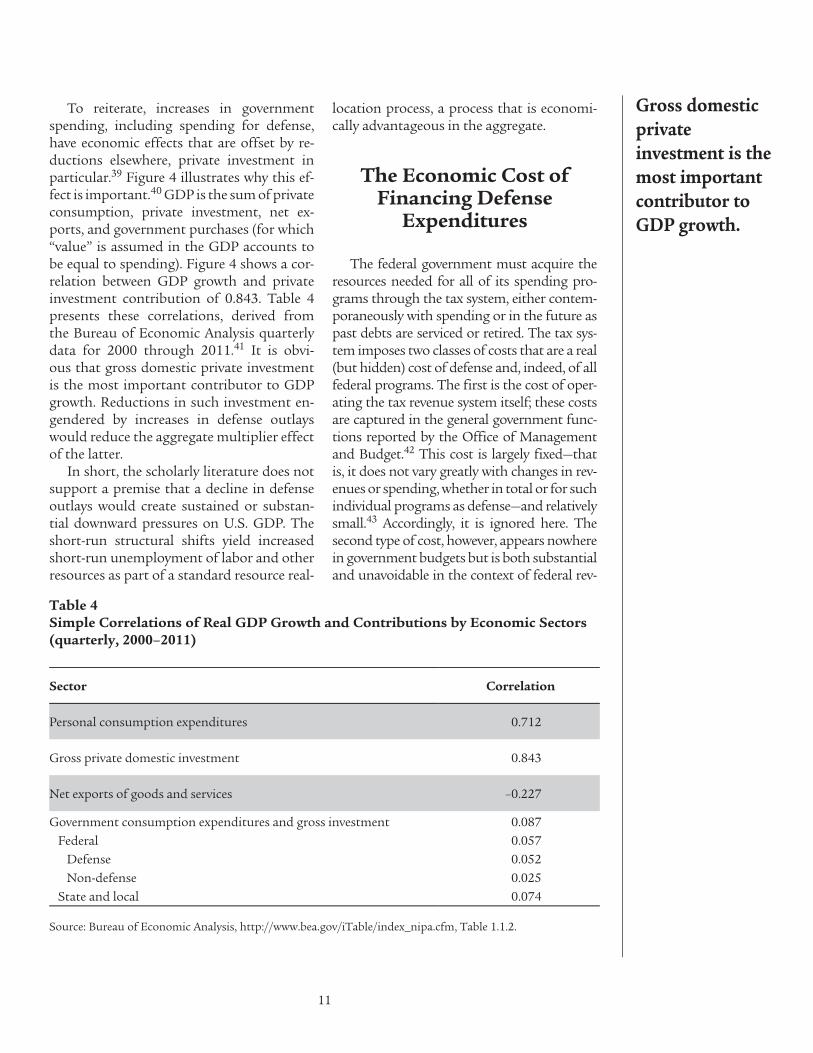
The same is true for Figure 3, which dis-plays the percent changes in annual real GDP and real defense spending for 1981 through 2000. Real economic growth was greater than zero for all but two years (1982
-10
-8
-6
-4
-2
0
2
4
6
8
10 Real GDP Growth Defense Contribution
Annu
al P
erce
nt
Year: Quarter
Figure 1Defense Contribution to Real U.S. GDP Growth, 2000–2011
Source: Bureau of Economic Analysis, http://www.bea.gov/iTable/index_nipa.cfm, Table 1.1.2.
9
Changes in the growth rate of real defense outlays have little or no effect on changes in GDP growth.
and 1991); the growth of real defense spend-ing was greater than zero every year through 1989, and then was negative every year there-after except 1991, 1997, and 2000. The sim-ple correlation for the entire 20-year period between percent changes in GDP and per-cent changes in defense outlays was -0.17; for
1981–1989 it was -0.60, and for 1990–2000 it was 0.02.38 None of these correlations is significant statistically at a 5 percent sig-nificance level. These data suggest strongly, again, that changes in the growth rate of real defense outlays have little or no effect on changes in GDP growth.
F
300
400
500
600
5,000
10,000
15,000
1981 1983 1985 1987 1989 1991 1993 1995 1997 1999
GDP Defense Outlays
Figure 2Real GDP and Defense Outlays, 1981–2000
Billi
ons o
f Yea
r 201
1 Do
llars
Year
Source: Office of Management and Budget, http://www.whitehouse.gov/omb/budget/Historicals, Table 8.2
Table 3Real GDP and Real Defense Outlays: Average Annual Compound Growth Rates (percent)
Period GDP Defense Outlays
1981–2000 3.32 0.43
1981–1989 3.40 4.25
1990–2000 3.26 –2.47
Source: Office of Management and Budget, http://www.whitehouse.gov/omb/budget/Historicals, Table 8.2.
10
-10
-8
-6
-4
-2
0
2
4
6
8
10 Real GDP Growth Private Investment Contribution
-8.0
-6.0
-4.0
-2.0
0.0
2.0
4.0
6.0
8.0
10.0
1981 1983 1985 1987 1989 1991 1993 1995 1997 1999
GDP Defense Outlays
Figure 3Precent Changes in Real GDP and Defense Outlays, 1981–2000
Source: Office of Management and Budget, http://www.whitehouse.gov/omb/budget/Historicals, Table 8.2, plus author computations.
Year
Year: Quarter
Perc
ent C
hang
eAn
nual
Per
cent
Figure 4Private Investment Contribution to Real U.S. GDP Growth, 2000–2011
Source: Bureau of Economic Analysis, http://www.bea.gov/iTable/index_nipa.cfm, Table 1.1.2.
11
Gross domestic private investment is the most important contributor to GDP growth.
To reiterate, increases in government spending, including spending for defense, have economic effects that are offset by re-ductions elsewhere, private investment in particular.39 Figure 4 illustrates why this ef-fect is important.40 GDP is the sum of private consumption, private investment, net ex-ports, and government purchases (for which “value” is assumed in the GDP accounts to be equal to spending). Figure 4 shows a cor-relation between GDP growth and private investment contribution of 0.843. Table 4 presents these correlations, derived from the Bureau of Economic Analysis quarterly data for 2000 through 2011.41 It is obvi-ous that gross domestic private investment is the most important contributor to GDP growth. Reductions in such investment en-gendered by increases in defense outlays would reduce the aggregate multiplier effect of the latter.
In short, the scholarly literature does not support a premise that a decline in defense outlays would create sustained or substan-tial downward pressures on U.S. GDP. The short-run structural shifts yield increased short-run unemployment of labor and other resources as part of a standard resource real-
location process, a process that is economi-cally advantageous in the aggregate.
The Economic Cost ofFinancing Defense
Expenditures
The federal government must acquire the resources needed for all of its spending pro-grams through the tax system, either contem-poraneously with spending or in the future as past debts are serviced or retired. The tax sys-tem imposes two classes of costs that are a real (but hidden) cost of defense and, indeed, of all federal programs. The first is the cost of oper-ating the tax revenue system itself; these costs are captured in the general government func-tions reported by the Office of Management and Budget.42 This cost is largely fixed—that is, it does not vary greatly with changes in rev-enues or spending, whether in total or for such individual programs as defense—and relatively small.43 Accordingly, it is ignored here. The second type of cost, however, appears nowhere in government budgets but is both substantial and unavoidable in the context of federal rev-
Table 4Simple Correlations of Real GDP Growth and Contributions by Economic Sectors(quarterly, 2000–2011)
Sector Correlation
Personal consumption expenditures 0.712
Gross private domestic investment 0.843
Net exports of goods and services –0.227
Government consumption expenditures and gross investment Federal Defense Non-defense State and local
0.0870.0570.0520.0250.074
Source: Bureau of Economic Analysis, http://www.bea.gov/iTable/index_nipa.cfm, Table 1.1.2.
12
The economic cost of financing defense takes the
form of a GDP that is smaller
than otherwise would be the
case.
enue operations. It is the real economic cost of the distortions created by the tax system, or the excess burden of that system, which takes the form of a GDP that is smaller than other-wise would be the case.
Federal tax instruments are applied to income of various classifications, to transac-tions, to capital assets, and the like. Those who bear the economic burdens of such tax-es attempt, ceteris paribus, to avoid them in whole or in part, and so, particularly in the long run, the taxes affect economic behav-ior—for example, work effort, saving and in-vestment, and transactions. Such distortions have the effect of lowering aggregate output below levels that would prevail in the absence of the taxes; that reduction in aggregate out-put, however hidden, is termed the “excess burden” of taxation.44
These actions have nothing to do with tax evasion. Instead, because of the tax system, some transactions that would yield net ben-efits for the economy—work, investment, and so forth—are avoided, so that the private sector bears a cost greater than a dollar to send a dol-lar to the federal government.
This adverse economic effect of various federal tax instruments has been recognized broadly for many years, although there is a range of estimates on the magnitude of the ef-fect. Martin Feldstein has noted that
the traditional method of analyzing the distorting effects of the income tax greatly underestimates its total dead-weight loss as well as the incremental deadweight loss of an increase in income tax rates. . . . The true deadweight losses are substantially greater than [prior] conventional estimates because the tra-ditional framework ignores the effect of higher income tax rates on tax avoid-ance through changes in the form of compensation . . . and through changes in the patterns of consumption45
That excess burden is a real economic cost of all federal spending, including that for de-fense, and therefore should be included as a
cost of defense programs (and, indeed, all fed-eral spending).46 Feldstein finds that higher marginal tax rates used to finance additional federal spending would impose upon the economy an excess burden of $0.76 per dollar of revenue; that is, that it would cost the pri-vate sector $1.76 (the dollar of tax payments plus $0.76 of economic losses) to send an additional dollar to the federal government, other things held constant.
Because that is a measure of the incremen-tal cost of federal spending, it is reasonable to assume that the average excess burden of existing spending is less than $0.76, because the incremental distortion is very likely to rise as spending and tax rates increase.47 In other words, the taxes needed to fund exist-ing spending impose an excess burden small-er than the taxes needed to fund increased spending. Therefore, it is reasonable to as-sume an excess burden figure smaller than the Feldstein estimate as part of the true cost of defense services.
The lowest, barely plausible assumption about the excess burden of the federal tax system is 20 percent; that is, the economic cost of a dollar of federal spending is at least $1.20 in terms of the resulting reduction in the size of the private sector.48 A more rea-sonable estimate of 35 percent is still con-servative given the scholarly estimates of the excess burden of the federal tax system avail-able in the literature.49 For all federal taxes across a number of studies, the mean weight-ed average is about 45–50 percent.
In short, the tax system imposes an excess burden on the economy by distorting the al-location of resources in ways that reduce ag-gregate output; accordingly, the private sec-tor becomes smaller by more than a dollar when it is forced to send a dollar to Washing-ton. The cost of federal spending, therefore, is greater than the spending itself. In the nar-row context of the defense budget and the tax system required to fund it, a reduction in annual defense outlays of $100 billion can be predicted with high confidence to increase the size of the private sector by at least $135 billion per year.

13
Because of the tax system, the private sector bears a cost greater than a dollar to send a dollar to the federal government.
Conclusions
There are good reasons to believe that the current and prospective security environment confronting the United States will justify a force structure less expensive than the cur-rent force, particularly given the end and re-duction, respectively, of substantial ground operations in Iraq and Afghanistan. This is-sue of the proper size and composition of the U.S. armed forces should be determined by a detailed analysis and delineation of U.S. inter-ests vital, important, desirable, and marginal, and analyses of the threats to those interests, the forces necessary to defend them, and the appropriate division of responsibilities among the United States and its allies. Such an analy-sis lies outside the scope of this study; but the discussion at the beginning of this paper sug-gests that there has been a decrease in the ag-gregate demand for (or marginal value of) de-fense services. Instead, this paper has assumed that a reduction in defense outlays of $100 bil-lion per year over 10 years is implemented and examines the economic effects of that spend-ing reduction.
A reduction in defense spending along those lines—and, crucially, in federal spending in to-tal—would also reduce the economic costs of the excess burden that the tax system imposes upon the economy. Accordingly, a reduction in defense outlays of $100 billion per year can be predicted, conservatively, to reduce economic costs by a total of $135 billion per year.
As the public debate proceeds on federal spending in general, and the defense budget in particular, these potential savings in real resources are sufficiently large to justify a de-tailed analysis of U.S. national security needs and the outlays needed to defend them.
NotesThe author is indebted to William R. Allen, Lau-rence A. Dougharty, Benjamin H. Friedman, Christopher A. Preble, and Simon Serfaty for useful suggestions, but the views expressed are those of the author alone.
1. This shift in the perceived security environ-
ment in Europe is a parameter separate from the issue of the proper allocation of defense burdens, both physical and pecuniary, among the members of NATO. Even with a continued Soviet threat, it might have been appropriate to shift some part of the alliance defense burden (however measured) to the European allies, thus yielding a possible de-cline in the size and cost of the U.S. force structure. For a short summary of this view not limited to Europe, see Christopher Preble, “Why Does U.S. Pay to Protect Prosperous Allies?” at http://www.cnn.com/2012/02/03/opinion/preble-military-budget/index.html?hpt=hp_bn9. For discussions of analytic approaches to this problem of burden-sharing—and the pitfalls inherent in the use of spending measures alone—see Charles A. Cooper and Benjamin Zycher, Perceptions of NATO Burden-Sharing, RAND Corporation R-3750-FF/RC, June 1989; and Benjamin Zycher, A Generalized Approach for Analysis of Alliance Burden-Sharing, RAND Corpo-ration N-3047-PCT, September 1990.
2. The annual data are available at http:// siadapp.dmdc.osd.mil/personnel/MMIDHOME.HTM. Active-duty manpower increased slightly from 1.37 million at the end of 2006 to 1.43 mil-lion at the end of 2010, and then fell to 1.41 million at the end of 2011. This modest increase obscures the considerable increase in the ground forces (the Army and Marine Corps) at the expense of the Air Force, Navy, and Coast Guard.
3. See Department of Defense, “Defense Budget Priorities and Choices,” January 2012, http://www.defense.gov/news/Defense_Budget_Priorities.pdf; and Jim Garamone, “Panetta Announces Fiscal 2013 Budget Priorities,” American Forces Press Service, U.S. Department of Defense, January 26, 2012, http://www.defense.gov/news/newsarticle.aspx?id=66940. The Army and Marine Corps had 480,801 and 172,934 active-duty personnel, respec-tively, as of September 30, 2001; see http://siadapp.dmdc.osd.mil/personnel/MILITARY/history/ milstr02.pdf.
4. Note that counterinsurgency operations can be manpower-intensive in cases in which large land areas must be occupied, pacified, and made safe for civilians and allied forces for extended periods. Whether any given counterinsurgency operation would defend a vital U.S. interest, again, is a topic outside the focus of this paper. See Joint Chiefs of Staff, Counterinsurgency Operations, October 5, 2009, http://www.dtic.mil/doctrine/new_pubs/jp3_24.pdf; and The U.S. Army/Marine Corps Counterinsur-gency Field Manual (Chicago: University of Chicago Press, 2007).
5. For useful discussions of the spending pro-jections over the budget horizon, see Russell Rum-baugh, “The Reality of the Defense Builddown,”
14
Stimson Center, http://stimson.org/images/up-loads/builddown_one_pager.pdf; Todd Harrison, “$trategy in a Year of Fiscal Uncertainty,” Center for Strategic and Budgetary Assessments, February 2012, http://www.csbaonline.org/publications/ 2012/02/trategy-in-a-year-of-fiscal-uncertainty/; and Mackenzie Eaglen and Diem Nguyen, “Super Committee Failure and Sequestration Put at Risk Ever More Military Plans and Programs,” Heritage Foundation Backgrounder 2625, December 5, 2011, http://www.heritage.org/research/reports/ 2011/12/debt-ceiling-deal-puts-at-risk-ever-more-military-plans-and-programs. See also Christo-pher Preble, “Being a Global Power on $469 bn a Year,” http://www.cato-at-liberty.org/being-a-global-power-on-469-bn-a-year/print/. For a brief discussion of the ongoing debate over the de-fense budget, see Elisabeth Bumiller and Thom Shanker, “Panetta to Offer Strategy for Cutting Military Budget,” New York Times, January 2, 2012, http://www.nytimes.com/2012/01/03/us/pentagon-to-present-vision-of-reduced-military.html?pagewanted=all. Because nondefense spend-ing lies outside the topic at hand, it is ignored here; but the focus in this paper on defense out-lays should not be interpreted to imply a view that nondefense spending should be immune from very substantial reductions.
6. Note that current budget proposals for fiscal year 2013 reflect some of the reductions in defense outlays that Friedman and Preble recommended in 2010, totaling $1.2 billion over 10 years. Accordingly, for the purposes of this study, the savings against the new baseline are assumed to be $1 trillion, or $100 billion per year. See Benjamin H. Friedman and Christopher Preble, “Budgetary Savings from Military Restraint,” Cato Institute Policy Analysis no. 667, September 23, 1010, http://www.cato.org/pub_display.php?pub_id=12151.
7. The dollar figures are nominal (unadjusted for expected inflation). See FY 2013 Budget, Histori-cal Tables, Table 5.1, http://www.whitehouse.gov/sites/default/files/omb/budget/fy2013/assets/ hist.pdf.
8. See Department of Defense, “Fact Sheet: The Defense Budget,” http://www.defense.gov/news/Fact_Sheet_Budget.pdf.
9. See Department of Defense, “Defense Budget Priorities and Choices.”
10. The term “social capital” is used here in a broad sense to comprise the large benefits of civil society and its institutions, individual freedom, democratic processes, the rule of law, and the other protections and benefits of U.S. constitutional and political institutions. For an analysis of the eco-nomic effects of differences in the level of social
capital, see Stephen Knack and Philip Keefer, “Does Social Capital Have an Economic Payoff? A Cross-Country Investigation,” Quarterly Journal of Econom-ics 112, no. 4 (November 1997): 1251–88, https://hec.unil.ch/docs/files/21/280/knack_keefer_ 1997.pdf.
11. If society deems a certain level of defense ser-vices (or outlays) to be necessary, those services might not be obtained even with the correspond-ing defense budget if there is inefficiency in the allocation of defense spending or in the imple-mentation of defense programs. One second-best mechanism with which to compensate for this, if the inefficiencies cannot be corrected, say, because of institutional constraints, would be a defense budget larger than the efficient one. This possibil-ity is ignored here.
12. See Friedman and Preble.
13. A substantial body of literature is available, with a wide range of findings of economic effects negative, positive, and insignificant attributable to (changes in) defense spending. See, e.g., Michael P. Gerace, “U.S. Military Expenditures and Economic Growth: Some Evidence from Spectral Methods,” Defence and Peace Economics 13, no. 1 (2002): 1–11; Uk Heo, “The Relationship between Defense Spending and Economic Growth in the United States,” Political Research Quarterly 63, no. 4 (2010): 760–70; H. Sonmez Atesoglu, “Defense Spending Promotes Aggregate Output in the United States—Evidence from Cointegration Analysis,” Defence and Peace Economics 13, no. 1 (2002): 55–60; Jesus Cre-spo Cuaresma and Gerhard Reitschuler, “A Non-Linear Defence-Growth Nexus? Evidence from the US Economy,” Defence and Peace Economics 15, no. 1 (2004): 71–82; John Dunne, Ronald Patrick Smith, and Dirk Willenbockel, “Models of Military Ex-penditure and Growth: A Critical Review,” Defence and Peace Economics 16, no. 6 (2005): 449–61; and Uk Heo and Robert J. Eger III, “Paying for Security: The Security-Prosperity Dilemma in the United States,” Journal of Conflict Resolution 49, no. 5 (Octo-ber 2005): 792–817.
14. Note that the decline in the demand for secu-rity services must be accompanied by an increase in the demand for other goods and services, other fac-tors held constant.
15. Note the implicit value judgment inherent in this brief analysis: The productivity or value of a given resource in a particular employment is deter-mined by the aggregated preferences of individuals, as reflected in market prices. Shifts in such prefer-ences determine shifts in those values. The struc-tural unemployment resulting from these shifts, therefore, is an effect of the freedom of individuals to change their consumption decisions.

15
16. In other words, a given individual may be worse off as a result of a particular economic shift; but that individual is very likely to be better off in the broader context as a result of an economy that is larger, and because of the freedom to make choic-es in a competitive market.
17. Again, the fundamental normative judg-ment is that “value” is determined by individual preferences.
18. Note that because most government services are not traded in markets—typically, Congress offers agencies a lump-sum budget in exchange for a lump-sum basket of outputs—it is difficult to place a value on government services. Accord-ingly, the value of government services in the na-tional income accounts usually is assumed to be the number of dollars spent on them respectively. This is a longstanding methodology fraught with problems, the analysis of which lies outside the scope of the issues addressed here.
19. Stephen S. Fuller, “The U.S. Economic Im-pact of Approved and Projected DOD Spending Reductions on Equipment in 2013: Summary of Research Findings,” http://armedservices.house.gov/index.cfm/files/serve?File_id=33a3bd4e-fcaa-4eef-bea6-12bd39265f9a. In an e-mail dated Janu-ary 4, 2012, Fuller stated that only the summary paper has been distributed, in that the remainder of the analysis comprises the respective discussions of over 700 economic sectors analyzed in an input/output model. I criticize the Fuller analysis here not because it is necessarily more flawed than most such analyses, but instead because it is quite typi-cal of that body of literature, and is the most recent that I have found. See, e.g., Atesoglu, pp. 55-60.
20. These are “losses in sales throughout the supply chain and . . . through the broader econo-my . . . [substantially] as a result of decreased con-sumer spending by workers directly and indirect-ly affected by these DOD spending reductions.”
21. Fuller argues in a separate interview that a “ten year defense budget cut will be felt in terms of layoffs starting in 2012, escalate and conclude by 2014.” See PR Newswire, “Analysis Projects One Mil-lion Jobs at Risk from Defense Cuts,” October 25, 2011, http://www.prnewswire.com/news-releases/ analysis-projects-one-million-jobs-at-risk-from-defense-cuts-132545243.html. That essentially is a description of a structural shift in which labor is re-allocated from the defense sector to other unspeci-fied sectors, over some adjustment time period difficult to predict. Fuller does not delve into the larger productivity implications of this structural shift.
22. Perhaps a bit more rigorously, the lost produc-tivity of the resources idled during the adjustment process is an economic cost of that process itself,
one that is productive for the economy as a whole.
23. Any such shift would imply a decline in the value of defense services relative to that of other government services, as determined by competi-tion under political and democratic institutions.
24. The Fuller analysis yields an estimate of $86.5 billion in reduced GDP for 2013.
25. John F. Cogan et al., “New Keynesian versus Old Keynesian Government Spending Multipli-ers,” Journal of Economic Dynamics and Control 34, no. 3 (March 2010): 281–95.
26. Andrew Mountford and Harald Uhlig, “What Are the Effects of Fiscal Policy Shocks?” Journal of Applied Econometrics 24, no. 6 (September/October 2009): 960–92.
27. See Robert J. Barro and Charles J. Redlick, “Macroeconomic Effects from Government Purchases and Taxes,” National Bureau of Eco-nomic Research Working Paper no. 15369, rev. December 5, 2011, http://www.nber.org/papers/w15369.
28. Valerie A. Ramey, “Identifying Government Spending Shocks: It’s All in the Timing,” Quarterly Journal of Economics 126, no. 1 (February 2011): 1–50.
29. Robert E. Hall, “By How Much Does GDP Rise If the Government Buys More Output?” Brookings Papers on Economic Activity, Fall 2009, pp. 183–231.
30. Anton Parlow, “Economic Growth, Defense Spending and Conflict: A Case Study of the U.S.,” working paper, Department of Economics, Univer-sity of Wisconsin, Milwaukee, https://pantherfile.uwm.edu/aparlow/www/papers/conflict_1.pdf.
31. Valerie A. Ramey, “Government Spending and Private Activity,” National Bureau of Economic Research Working Paper no. 17787, January 2012, http://www.nber.org/papers/w17787.
32. See Valerie A. Ramey, “Can Government Pur-chases Stimulate the Economy?” Journal of Econom-ic Literature 49, no. 3 (September 2011): 673–85.
33. See Bureau of Economic Analysis, http://www.bea.gov/iTable/index_nipa.cfm, at Table 1.1.2.
34. See Office of Management and Budget, http://www.whitehouse.gov/omb/budget/Historicals, Table 8.4.
35. See FY 2013 Budget, Historical Tables.
36. See Bureau of Economic Analysis, http://www.bea.gov/iTable/index_nipa.cfm at Table 1.1.6. This correlation means that a 1 percent change in
one of the parameters is associated statistically (but not necessarily in a causal sense) with less than a 0.09 percent change in the other, in the same direc-tion. The correlations for 1981–2000 are discussed below.
37. See Office of Management and Budget, http:// www.whitehouse.gov/omb/budget/Historicals, at Table 8.2.
38. Recall from the discussion above that the correlation for 2000–2011, based upon the quar-terly data, was less than 0.09. See the discussion of Figure 1.
39. Barro and Redlick, fn. 51.
40. See Bureau of Economic Analysis, http://www.bea.gov/iTable/index_nipa.cfm, Table 1.1.2.
41. Ibid. Obviously, expected GDP growth drives private investment also; but the contributions data belie the assertion that shifts in defense spending growth are an important source of shifts in GDP growth.
42. See Office of Management and Budget, http:// www.whitehouse.gov/omb/budget/Historicals, Table 3.2.
43. The total general government function es-timated for fiscal year 2012 is $31.8 billion, out of total federal outlays of about $3.8 trillion. The budget proposed for the Internal Revenue Ser-vice for fiscal year 2013 is about $12.8 billion. See, respectively, Office of Management and Budget, http://www.whitehouse.gov/omb/budget/ Historicals, Table 3.2, and the Internal Revenue Service at http://www.irs.gov/newsroom/article/ 0,,id=254281,00.html.
44. Strictly speaking, the excess burden (or “deadweight loss”) is the difference between ag-gregate output under the existing tax system and aggregate output under a different system of “lump-sum” taxes that would yield the same revenues without distorting economic activity. Because government output is not worthless, a zero-tax, zero-outlay, zero-excess burden environ-ment in principle might yield aggregate output
lower than that observed under the existing tax system even though, again, the excess burden of taxation would be zero. See also Jonathan Gru-ber, Public Finance and Public Policy (New York: Worth Publishers, 2005), p. 547.
45. Martin Feldstein, “Tax Avoidance and the Deadweight Loss of the Income Tax,” Review of Economics and Statistics 81, no. 4 (November 1999): 674. See also Jon Gruber and Emmanuel Saez, “The Elasticity of Taxable Income: Evidence and Implications,” Journal of Public Economics 84, no. 1 (April 2002): 1–32.
46. Martin Feldstein, “The Effect of Taxes on Effi-ciency and Growth,” National Bureau of Economic Research Working Paper no. 12201, May 2006; Mar-tin A. Feldstein, “The Effect of Taxes on Efficiency and Growth,” Tax Notes, May 8, 2006, pp. 679–684; and Christopher J. Conover, “Congress Should Ac-count for the Excess Burden of Taxation,” Cato In-stitute Policy Analysis no. 669, October 13, 2010. See also William A. Niskanen, “The Economic Burden of Taxation,” in Mark Wynne, Harvey Rosenblum, and Robert Formaini, eds., The Legacy of Milton and Rose Friedman’s Free to Choose: Economic Liberalism at the Turn of the 21st Century, Dallas: Federal Reserve Bank of Dallas, 2004; and the Report of the President’s Advisory Panel on Federal Tax Reform, November 1, 2005, p. 36, www.taxreformpanel.gov/final-report/. See also Benjamin Zycher, “A Preliminary Benefit/Cost Framework for Counterterrorism Public Expen-ditures,” Rand Corporation MR-1693-RC, May 2003.
47. A crude rule of thumb is that the excess bur-den of a tax increases as the square of the tax rate.
48. The Office of Management and Budget since 1992 has directed federal agencies to include a 25 percent adjustment for the excess burden of the federal tax system in benefit/cost analyses of public investment. See Office of Management and Budget Circular no. A-94 rev., “Guidelines and Discount Rates for Benefit-Cost Analysis of Federal Programs,” October 29, 1992, http://www.whitehouse.gov/omb/circulars_a094#11.
49. For a good summary of the various excess burden estimates for several federal tax instru-ments, see Conover, Table 1.