Embed Size (px)
Citation preview
Economic Effects of Bovine Respiratory Disease
on Feedlot Cattle During Backgrounding and Finishing Phases
P-1027
Oklahoma Agricultural Experiment StationDivision of Agricultural Sciences and Natural Resources
Oklahoma State University
Economic Effects of Bovine Respiratory Disease
on Feedlot Cattle During Backgrounding and Finishing Phases


Economic Effects of Bovine Respiratory Disease on Feedlot Cattle during Backgrounding and Finishing Phases
Kathleen R. BrooksDepartment of Agricultural Economics
Oklahoma State University521 A Agricultural Hall
Stillwater, OK 74078405-744-9985
Email: [email protected]
Kellie Curry RaperDepartment of Agricultural Economics
Oklahoma State University514 Agricultural HallStillwater, OK 74078
405-744-9819Email: [email protected]
Clement E. WardDepartment of Agricultural Economics
Oklahoma State University513 Agricultural HallStillwater, OK 74078
405-744-9821Email: [email protected]
Ben P. HollandWillard Sparks Beef Research Center
Oklahoma State UniversityStillwater, OK 74078
405-377-8501Email: [email protected]
Clint R. KrehbielDepartment of Animal Science
Oklahoma State University208 Animal Science Building
Stillwater, OK 74078405-744-8857
Email: [email protected]
Douglas L. StepVeterinary Clinical SciencesOklahoma State University
002 BVMTH Stillwater, OK 74078405-744-8578
The authors acknowledge funding support from USDA Cooperative State Research, Education & Extension Service, Hatch project H-2438.
Abstract
Bovine respiratory disease (BRD) can lead to significant economic losses for cattle producers. The objective of this research was to determine economic effects from a risk assessment of calves based on haptoglobin (Hp) concentration and number of treatments for BRD in cattle backgrounding and finishing phases. During the backgrounding phase, 337 heifers were grouped by Hp level and monitored daily for signs of BRD. After the backgrounding phase, 193 heifers were then grouped by number of BRD treatments in the finishing phase. Net returns decreased in the backgrounding phase and the combined backgrounding-finishing phases as the num-ber of BRD treatments increased. However, Hp concentration had no significant effect on net returns.
Key Words: animal health, bovine respiratory disease, cattle backgrounding, cattle feeding, haptoglobin, net returns
JEL Classifications: Q10, Q12
Introduction
Bovine respiratory disease (BRD) is the most com-mon disease among feedlot cattle in the United States. It accounts for approximately 75 percent of feedlot morbidity and 50 percent to 70 percent of all feedlot deaths (Edwards, 1996; Galyean, Perino, and Duff, 1999; Loneragan et al., 2001). The majority of deaths due to BRD occur shortly after arrival to the feedlot or within the first 45 days (Edwards, 1996; Loneragan et al., 2001). In fact, Buhman et al. (2000) reported that about 91 percent of calves diagnosed with BRD were diagnosed within the first 27 days after arrival. BRD causes an estimated $800 million to $900 million annu-ally in economic losses from death, reduced feed effi-ciency, and treatment costs (Chirase and Greene, 2001). Medical costs attributable to the treatment of BRD are substantial, and the economic impacts of BRD on carcass merit and meat quality further increase the eco-nomic costs. Medicine costs accounted for 21 percent of the decrease, while 79 percent was attributable to lower carcass weight (8.4 percent less) and lower qual-ity grade (24.7 percent more USDA Standard quality grade carcasses). BRD can also cause economic losses due to decreased gain and carcass values (Duff and Galyean, 2007). A Texas Ranch-to-Rail study found BRD morbidity accounted for 8 percent higher produc-tion costs, not including losses related to decreased performance (Griffin, Perino, and Wittum, 1995). They found cattle with BRD had a 3 percent decrease in gain compared with healthy cattle and cost the program $111.38 per sick animal. Snowder et al. (2006) estimat-ed economic losses in a 1,000-head feedlot from BRD infection due to lower gains and treatment costs to be approximately $13.90 per animal. Demand for higher quality products and increased value-based marketing have heightened beef produc-ers’ awareness of health management practices with potential to increase profitability and beef product quality. Feedlot producers able to purchase calves more likely to remain healthy during the feeding pe-riod could potentially increase profits through reduced costs and higher revenues. Previous studies document the economic impact from BRD in either background-ing or finishing programs. The majority of those stud-ies are from animal scientists and veterinarians. Cur-rent research relating to animal disease in agricultural economics journals deals with major outbreaks of in-fectious diseases (e.g. bovine spongiform encepha-lopathy or bovine brucellosis), tracking systems, and eradication programs (Amosson et al., 1981; Elbakid-ze, 2007; Hennessy, Rossen, and Jensen, 2005; Kuchler and Hamm, 2000). Limited research on BRD in feed-lot cattle is reported in agricultural economic journals. Nyamusika et al. (1994) however, using a stochastic simulation model of BRD, found significant returns to vaccination of cattle. The simulation found vaccination
programs, combined with treatment of BRD, increase net revenues by $44. Further analysis on the economic effects of BRD in the backgrounding phase is warrant-ed along with the effects in the finishing phase and the phases combined. Knowing the economic impact of BRD on both backgrounding and finishing phases is important. A tool enabling producers to determine whether animals will remain healthy could potentially increase produc-ers’ profits. Serum haptoglobin (Hp) concentration has been suggested as a tool for making management deci-sions based on data that shows cattle requiring treat-ment for BRD had a higher Hp concentration upon ar-rival than calves that remained healthy throughout the preconditioning phase (Berry et al., 2005; Step et al., 2008). Hp is an acute-phase protein produced by the liver in response to cellular injury. Based upon Hp con-centration upon arrival producers could potentially determine animals that would remain healthy. The overall objective of this research was to deter-mine the economic effects of BRD on backgrounding and finishing phases individually, as well as the two phases combined for the same cattle. In addition, this research measures the effectiveness of using serum Hp concentration to predict BRD occurrence and the impact of multiple treatments for BRD in background-ing on both backgrounding and cattle feeding perfor-mance.
Conceptual Framework
Cattle producers are assumed to maximize expect-ed profits. The question is whether the use of serum Hp concentration to predict BRD occurrence has an effect on those expected profits and whether multiple treatments for BRD affect the returns on infected cattle. Producers’ objective function can be expressed as:
(1) maxxE(NR) = P´Y(x) – r´x
where E(NR) is the expected net revenue per head from their operation, P is the vector of output prices, r is the vector of input prices, Y(x) is the final weight of cattle produced, and x is the vector of inputs. Equation (1) does not consider the Hp risk group. Cattle producers would want to maximize expected net returns subject to costs and the Hp risk group. Pro-ducers could test serum Hp prior to purchasing calves to estimate their Hp risk group, considered to be low, medium, and high risk in this research. Equation (1) then becomes:
(2) maxx,vE(NR) = max{Pv´Yv(x) – r´xv |v = 1, 2, 3}
where E(NR) is expected net returns per head from the operation, is the vector of expected prices for risk group v (v=1, 2, 3), r is the vector of input prices, Yv(x)
1

is the final weight or number of cattle produced in risk group v, and x is the vector of inputs for risk group v. The producer would then be maximizing net returns per head.
Data
Backgrounding phase For this study, 337 cross-bred heifers were pur-chased by Eastern Livestock order buyers and assem-bled at the West Kentucky Livestock Market at Marion, KY in September 2007. Heifers were processed after arrival to Stillwater, OK on September 12 and 14 (day 0) and assigned pens according to Haptoglobin (Hp) concentration: Low (serum Hp<1.0 mg/dL), Medium (1.0 mg/dL <serum Hp<3.0 mg/dL), and High (serum Hp>3.0 mg/dL). Of the 337 heifers, 86 (25.52 percent) were in the low-risk group, 98 (29.08 percent) were in the medium-risk group, and 153 (45.40 percent) were in the high-risk group. Heifers were fed twice daily, ad libitum, a 65 percent concentrate receiving/grow-ing ration during the 63-day backgrounding phase. Heifers were evaluated daily for signs of BRD ac-cording to standard facility protocol (Step et al., 2008) in which animals were assigned a clinical attitude score (CAS; 1 to 4) based on depression, appetite, and respiratory signs. Antimicrobial therapy was admin-istered when CAS was 1 (mild) or 2 (moderate) and rectal temperature was ≥ 40 C, or when CAS was 3 (se-vere) or 4 (moribund) regardless of temperature. The first treatment was 10 mg tilmicosin/kg body weight (Micotil 300, Elanco Animal Health, Greenfield, IN), second treatment was 10 mg enrofloxacin/kg BW (Baytril 100, Bayer Animal Health, Shawnee Mission, KS), and third treatment was two doses of 2.2 mg ceft-iofur/kg BW (Excenel, Pharmacia & UpJohn, New York, NY) administered 48 hours apart. Chronically ill animals were pulled on or after day 21. Conditions necessary to be considered a chronic were: received all
three antimicrobial therapies according to protocol, on feed more than 21 days, and experienced a net loss of body weight during the preceding 21 days on feed. Table 1 shows the number of BRD treatments giv-en to heifers across the risk groups. Of the 337 heifers, there were a total of 113 never treated (33.53 percent), 98 treated once (29.08 percent), 42 treated twice (12.46 percent), 43 treated three times (12.76 percent), 12 clas-sified as chronics (3.56 percent), and 29 that died (8.61 percent) during the backgrounding phase. High mor-tality may be attributed to the use of high-risk cattle. The heifers in the study were most likely weaned im-mediately prior to transporting to the auction market, where they were commingled, then shipped to the Oklahoma State University feedlot where they ap-peared stressed. Heifers were individually weighed on days 0, 7, 14, 21, 42, and 63. Production data included average daily gain (ADG) during the 63-day backgrounding phase, feed intake and costs, vaccination costs, feed conversion, Hp risk group, number of BRD treatments, and cost of BRD treatments. Feed intake could not be directly measured in the preconditioning phase. Intake was calculated based on gains and energy density of the diet according to the National Research Council equations (NRC, 1996). Feed intake for animals that died was calculated based on the average dry matter intake per day from animals that lived times the num-ber of days the dead animal was on the trial. Average daily gain for animals that died was the last recorded weight minus their initial weight divided by the num-ber of days they were on trial. The initial price and day 63 price were estimated using USDA Agricultural Mar-keting Services (AMS) feeder cattle weighted-average sale data. The sale data were for the same week of ar-rival and day 63 price as the price at the Oklahoma City market, with adjustments for weights (KO_LS795 for week of 9/12/2007 and 11/14/2007). An ordinary least squares regression for price as a function of the
Table 1. Health Outcome Category of Heifers across Haptoglobin Risk Groups1 in Backgrounding Phase.
Risk Number of Bovine Respiratory TreatmentsGroup Zero One Two Three Chronics2 Dead Total
Low 38 25 10 6 2 5 86 (25.52%)Medium 35 25 11 13 5 9 98 (29.08%)High 40 48 21 24 5 15 153 (45.40%)Total 113 98 42 43 12 29 337 (33.53%) (29.08%) (12.46%) (12.76%) (3.56%) (8.61%)
1 Heifers were assigned pens according to Haptoglobin (Hp) concentration: Low (serum Hp<1.0 mg/dL), Medium (1.0 mg/dL<serum Hp<3.0 mg/dL),and High (serum Hp>3.0 mg/DL).
2 Conditions necessary to be considered a chronic were: received all three antimicrobial therapies according to protocol, on feed more than 21 days, and experienced a net loss of body weight over the preceding 21 days on feed.
2

number of head sold per pen, average weight per pen, weight squared, and grade was estimated for both ar-rival price and day 63 price using the AMS data.
Finishing phase After the backgrounding phase (63 days), heifers were allocated to finishing pens based on the number of times they were treated for BRD. There were six heifers per pen except three pens of calves treated three times had seven heifers per pen. Initial classification based on arrival serum Hp was disregarded in the finishing phase. Due to pen space and number of antimicrobial treatments, only 193 heifers from the backgrounding phase were also in the finishing phase. Of the 193 heif-ers, 54 (27.98 percent) had zero treatments, 54 (27.98 percent) had one treatment, 34 (17.62 percent) had two treatments, 39 (20.21 percent) had three treatments, and 12 (6.22 percent) were classified as chronics. Ani-mals were considered chronically ill if they had been assigned a BRD severity of ≥3, had a net weight loss during at least 21 days in the backgrounding phase, and had been given all eligible treatments with anti-microbials according to protocol. Severity scores were based on signs of BRD (listed above) and were on a scale from 1 to 4. Cattle were fed according to standard procedure at the facility and weighed every 28 days. Finishing phase production data included ADG, feed intake and cost, vaccination costs, feed conver-sion, and total days on feed. Feed intake in the finishing phase per animal was calculated using as fed pounds per day per pen divided by the number of head in the pen. Heifers were harvested in three groups at the end of the feedlot phase on April 21, May 13, or May 28, 2008 (152, 174, or 189 days on feed, respectively). Harvest dates were based on live weight and estimat-ed carcass backfat of 0.4 inches using ultrasound. All chronics were harvested on the final date (189 days on feed). Carcass data included marbling, yield grade, hot carcass weight (HCW), and back fat measurement. Heifers were priced on a commonly used industry grid from the commercial packing plant where they were slaughtered. Estimated prices were also calculated us-ing alternative grid premiums and discounts based on AMS data (LM_CT155) but were not found to be sig-nificantly different from the packing plant’s grid prices (National Weekly Direct Slaughter Cattle-Premiums and Discounts for the week of: 4/21/2008, 5/12/2008, and 5/26/2008). During the finishing phase, two heifers were treat-ed for signs of BRD. One heifer was from the twice-treated group and remained in her home pen through-out the duration of the finishing phase. The other heifer was in the chronic group and died. Three more animals died due to digestive causes, one each from the zero treatment group, the three treatment group, and the chronic group. Four additional heifers were not included in final statistics because of incomplete
carcass data, two heifers each from the two and three treatment groups. Data were used to determine the effects of Hp risk groups for BRD, treatment of sick animals, and the risk-treatment interaction on net returns, costs, and animal performance for the backgrounding phase, the finishing phase, and the backgrounding and finishing phases combined.1
Procedure
The performance and net return differences across risk groups and number of BRD treatments were ana-lyzed using Least Squares Means (LS Means) and the following model:
(3) Ζ = α0 + ∑2 = 1αiRGi + ∑3 = 1βjCj + ∑2 = 1αijRGiCj
where Ζ is the independent performance measure, RGi is the risk group i (i=1, 2), and is the number of BRD treatments j (j=0, 1, 2, 3). Significant differences across means were tested using t-tests. Performance measures included ADG, feed-to-gain conversion, feed costs, day 63 weight, and number of BRD treatments for the backgrounding, finishing, and the phases com-bined. Carcass measures included hot carcass weight (HCW), marbling score, and yield grade. Net returns for the backgrounding, finishing, and the two phases combined were also analyzed. Feed conversion is the amount of feed consumed per pound of gain. Feed conversion was calculated by dividing total amount of feed intake (as fed) per animal by total pounds gained per animal. Final live weights for cattle were taken at the feedyard on day 63 prior to slaughter and were used for finishing phase gain calculations. The most important factors affecting net returns were also determined. Of interest are the relative ef-fects of each regressor on net returns.
(4) E(NRji) = βj0 + βj1x1 + βj2x2 + … + βjnxn + εji
where E(NRji) is the net returns per head to be esti-mated, β’s are the estimated standardized betas, and the xi are the variables used for the standardized betas, where i represents the individual heifer, j represents ei-ther the backgrounding phase, the finishing phase, or the total, and, εji is the residual error term. The units of the variables in equation (4) are dif-ferent; therefore the magnitudes of the individual regression coefficients cannot be directly compared. Variables were normalized to have a mean of zero and a variance of one to compare relative importance of in-dependent variables. Regressing these variables on the normalized net returns yields standardized beta coef-
1 Complete summary statistics on data collected can be obtained from the author.
i i
3
j

ficients (SBC). SBCs were calculated from a regression model to determine the influence of the each variable on net returns. Standardized beta coefficients were cal-culated for net returns using the following model:
(5) = ∑i βi + ∈
where NR is the net revenue, σ is the standard devia-tion, βi is the ith independent variable of interest, and is the SBC for the ith independent variable. The new coefficients are calculated:
(6) βi = βi
The SBCs are proportions and the absolute value there-fore can be used to rank the relative importance of the independent variables. Coefficients are interpreted such that if xi increases by one standard deviation, then Y changes by βi standard deviations (Wooldridge, 2006). The variables for the backgrounding phase in-cluded initial body weight (IBW), average daily gain (ADG), feed conversion, BRD treatment costs, feed costs on as fed basis, Hp risk group, and the number of BRD treatments. Variables for the finishing phase included initial finishing phase body weight, ADG in the finishing phase, feed conversion, feed costs on as fed basis, hot carcass weight, marbling score, yield grade, Hp risk group, and number of BRD treatments. The combined phase included IBW, ADG for the en-
tire trial, feed conversion, BRD treatment costs, total feed costs on as fed basis, hot carcass weight, marbling score, yield grade, Hp risk group, and number of BRD treatments. Net returns were calculated for the backgrounding phase by subtracting the purchase cost of the calves, BRD treatment costs, vaccination costs, and feed costs from the transfer revenue/cost in the backgrounding phase. Transfer revenue/cost is the 63-day price that is used as the revenue for the backgrounding phase and the initial cost in the finishing phase. Vaccination costs varied, depending on the initial body weight of the animals. Of all BRD treatment costs, 99.7 percent were incurred during the 63-day backgrounding phase and a chute charge of $0.50 for the first treatment was added to the respiratory treatment costs to account for processing the animals. Average net returns for the backgrounding, fin-ishing, and combined phases can be found in Table 2. The net returns for the finishing phase were calcu-lated by subtracting transfer revenue/cost, vaccination costs, and feed costs for the finishing phase from end-ing revenue. The total net returns were calculated by subtracting placement cost, all vaccination costs, feed costs, and BRD treatment costs from ending revenue. Ending revenue is $/head based on grid prices. All net revenues were calculated independent of market conditions. Average net returns per head attributed to dead animals in the backgrounding phase and the combined
NR – NRσγ
* xi – xσxi
*
*σxσY
i
*
Table 2. Average Net Returns for Backgrounding1, Finishing2, and Combined Phases across Haptoglobin Risk Group3 and Number of Bovine Respiratory Disease Treatments. Number of Bovine Respiratory Disease Treatments Haptoglobin Grand Risk Group Data 0 1 2 3 Chronics4 Dead Total
Low Backgrounding Phase 8.33 -8.45 -51.97 -77.82 -89.05 -677.75 -51.73 Finishing Phase -115.23 -68.87 -62.50 -192.88 -5.69 -92.45 Combined Phase -100.54 -80.92 -106.70 -267.42 -94.75 -111.89 Medium Backgrounding Phase 10.88 -8.75 -37.67 -86.21 -117.57 -631.07 -77.96 Finishing Phase -107.46 -53.76 -118.32 -45.50 -210.32 -92.86 Combined Phase -89.37 -64.60 -152.20 -124.00 -327.88 -92.86 High Backgrounding Phase 6.60 -12.74 -37.90 -81.56 -100.84 -675.96 -89.83 Finishing Phase -108.90 -98.56 -39.64 -39.73 -201.57 -80.00 Combined Phase -105.29 -119.31 -69.53 -119.82 -302.41 -117.04Total Average Backgrounding Net Returns 8.51 -10.63 -41.19 -82.44 -105.85 -662.34 -76.66Total Average Finishing Net Returns -110.15 -77.60 -64.20 -60.99 -172.57 -86.90Total Average Combined Net Returns -98.37 -93.04 -98.82 -139.92 -278.41 -116.55
1 Backgrounding phase consisted of 337 heifers of which 29 died.2 Finishing phase and combined phase consisted of 193 heifers.3 Heifers were assigned pens according to Haptoglobin (Hp) concentration: Low (serum Hp<1.0 mg/dL), Medium (1.0 mg/dL<serum Hp<3.0
mg/dL),and High (serum Hp>3.0 mg/DL).4 Conditions necessary to be considered a chronic were: received all three antimicrobial therapies according to protocol, on feed more than 21
days, and experienced a net loss of body weight over the preceding 21 days on feed.
4

phases were calculated as follows: average net returns per head for that phase times 337 or 222 heifers for the backgrounding and combined phase, respectively, mi-nus the average net returns for dead animals times the 29 head that died. The differences were divided by 308 or 193 for the backgrounding and overall, respectively, to estimate the average net returns per head attributed to dead animals.
Results
Least squares means Risk Group. Least squares means by Hp risk group are in Table 3. No significant differences were found across risk group for any of the net returns. Howev-er, Hp risk group one was significantly different (P ≤ 0.05) than risk group three for marbling score. Risk groups one and three were significantly different than risk group two for background feed:gain conversion and backgrounding cost of gain (P ≤ 0.05). Four heif-ers in risk group two had negative ADG in the back-grounding phase, i.e., lost weight, that led to negative
feed:gain conversion and negative cost of gain. When these heifers were removed from the analysis, no sig-nificant differences were found across risk groups. Wittum and Perino (1995) and Step et al. (2008) also found Hp concentration upon arrival unrelated to se-verity of the case or the need for treatment in feedlot cattle. However, Hp has been found to have some val-ue in assessing treatment efficacy (Carter et al., 2002; Wittum et al., 1996). BRD Treatment Groups. Least squares means by the number of BRD treatments are in Table 4. Begin-ning weight was not statistically significant (P ≤ 0.05) across BRD treatments; however, weights at the end of backgrounding and the start of finishing were sig-nificantly different across all treatment groups. Heif-ers classified as chronics in the backgrounding phase gained 2.16 lbs/day, 1.83 lbs/day, and 1.23 lbs/day less than heifers never treated, treated once, or twice, respectively (P ≤ 0.05). Buhman et al. (2000) also re-ported heifer calves had a lower mean daily gain when sick calves were compared with those not sick or not removed for treatment. Gardner et al. (1999) showed similar results of increased average daily gain for
Table 3. Least Squares Means for Production Characteristics by Haptoglobin Risk Group1,2
Risk Group Description Low Medium High
IBW3 Beginning Weight (lbs) 532.95 521.28 529.72IBW4 533.35 527.18 526.88Precadg ADG-Backgrounding (lbs/day) 2.14 2.06 2.08Preconv Background Feed:Gain Conversion 12.74a 5.39b 11.48a
Rtreatcost BRD Treatments Drugs ($/head) 22.06 21.80 22.26Pcostasfed Cost of Feed Backgrounding ($/Head) 59.41 59.04 58.86Preccog Background Cost of Gain ($/lb of gain) 1.20a 0.32b 1.14a
avgFO* End Background Start Finishing Weight (lbs) 666.03 656.66 660.15avgFO** 672.44 663.49 656.28Pnetret Net Returns-Backgrounding ($/head) -149.43 -145.05 -150.40fadg ADG - Finishing (lbs/day) 3.19 3.21 3.20finconv Finishing Feed:Gain Conversion 9.15 8.78 8.75fcostasfed Cost of Feed finishing ($/head) 498.70 493.35 478.71fincog Finishing Cost of Gain ($/lb of gain) 0.98 0.94 0.94fulladg Overall ADG (lbs) 2.95 2.96 2.91totalcon Total Feed:Gain Conversion 8.99 8.69 8.65totalcog Overall Cost of Gain ($/lb of gain) 0.91 0.88 0.88HCW HCW (lbs) 744.17 736.45 731.44Marbscore MARBSCORE 479.82a 450.63a,b 433.49b
YG Yield Grade 3.22 3.18 3.10Fnetret Net Returns Finishing ($/head) -89.04 -107.07 -97.68Netret Net Returns ($/head) -130.07 -151.61 -143.27
a,b Indicate means in the same row with a different superscript letter differ (P<0.05).1 Deads are included in net return calculations but not in physical performance measures (average daily gain, cost of gain, or conversion).2 Heifers were assigned pens according to Haptoglobin (Hp) concentration: Low (serum Hp<1.0 mg/dL), Medium (1.0 mg/dL<serum Hp<3.0
mg/dL),and High (serum Hp>3.0 mg/DL).3 Indicates 337 heifers in backgrounding phase.4 Indicates 193 heifers in finishing phase and overall.
5

steers never treated compared to those treated once or more than once (Gardner et al., 1999; Wittum and Perino, 1995). During the finishing phase, no signifi-cant differences were found across the risk groups for average daily gain. When combining the background-ing and finishing phases, chronics had significantly lower gains compared to those never treated or those treated only once or twice. The majority of the BRD incidence occurred during the backgrounding phase. Early detection and proper treatment could contribute to the calf’s recovery and compensatory gain during the finishing phase. Similar research found that com-pensatory gain was evident in the feedlot after proper treatment for BRD (Snowder et al., 2006). Cost of gain increased as the number of BRD treat-ments increased during the preconditioning phase with those treated more than twice having the high-est. During the finishing phase cost of gain per head for the zero-treatment group was significantly higher (P ≤ 0.05) than the cost of gain for those classified as chronics ($1.02/lb of gain versus $0.89/lb of gain, re-
Background Finishing CombinedPhases
1.4
1.2
1
0.8
0.6
0.4
0.2
$/po
und
of g
ain
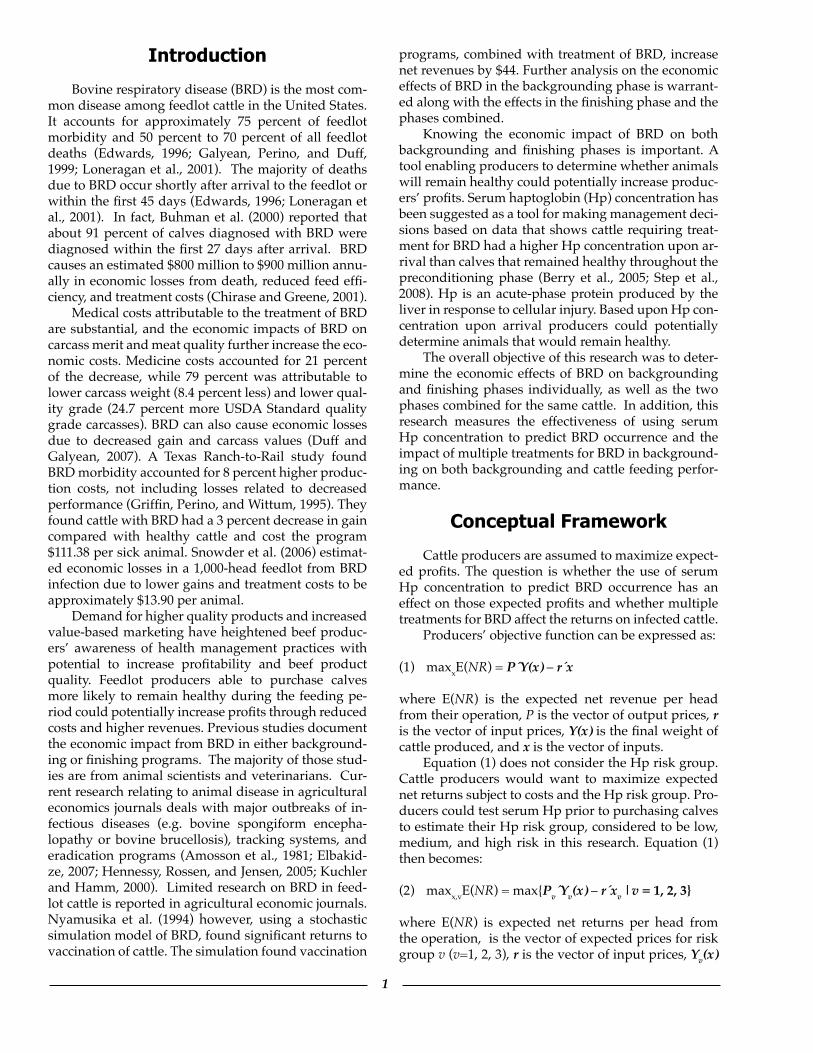
0123Chronics
Figure 1. Differences in Cost of Gain ($/lb of gain) by Number of Bovine Respiratory Dis-ease Treatments for the Background, Finishing, and Combined Phases.
Table 4. Least Squares Means for Production Characteristics by Number of Bovine Respiratory Disease Treat-ments1
Number of Treatments Description 0 1 2 3 Chronics Dead
IBW3 Beginning Weight (lbs) 535.38 530.15 528.35 532.06 519.52 522.44IBW4 533.50 536.06 524.36 532.25 519.52 Precadg ADG-Backgrounding (lbs/day) 3.11a 2.78b 2.18c 1.45d 0.95d
Preconv Background Feed:Gain Conversion 7.84a 7.99 a 13.87 b 9.03 a 10.62 a,b Rtreatcost BRD Treatments Drugs ($/head) 0.00a 9.63b 23.62c 35.71d 35.34d 27.93e
Pcostasfed Cost of Feed Backgrounding ($/Head) 85.05a 76.93b 63.47c 50.53d 44.12d,e 34.54e
Preccog Background Cost of Gain ($/lb of gain) 0.47 a 0.54 a,c 1.32 b 0.94 b,c 1.16 a,b,c avgFO3 End Background Start Finishing Weight (lbs) 731.19a 705.13b 665.51c 623.44d 579.47e
avgFO4 734.92a 703.95b 672.22c 629.77d 579.47e
Pnetret Net Returns-Backgrounding ($/head) 8.63a -9.98b -42.51c -81.87d -102.49e -661.56f
fadg ADG - Finishing (lbs/day) 3.10 3.20 3.26 3.31 3.13finconv Finishing Feed:Gain Conversion 9.47a 9.21a,b 8.75a,b 8.72a,b 8.30b
fcostasfed Cost of Feed Finishing ($/head) 486.18a 494.20a,b 484.11a 516.81b 469.97a
fincog Finishing Cost of Gain ($/lb of gain) 1.02 a 0.99 a,b 0.94 a,b 0.93 a,b 0.89 b
fulladg Overall ADG (lbs) 3.13a 3.06a,b 3.01a,b 2.88b,c 2.62c
totalcon Total Feed:Gain Conversion 8.92 8.84 8.61 8.82 8.67totalcog Overall Cost of Gain ($/lb of gain) 0.85a 0.87a 0.88a,b 0.93b 0.93a,b
HCW HCW (lbs) 756.70a 743.75a,b 733.69a,b 747.63a,b 705.00b
Marbscore MARBSCORE 480.43 465.33 444.75 453.56 429.17YG Yield Grade 3.35a 3.25a,b 3.10a,b 2.94b 3.19a,b
Fnetret Net Returns Finishing ($/head) -110.53 -73.73 -73.49 -92.71 -139.19Netret Net Returns ($/head) -98.40a -88.28a -109.48a,b -170.41b,c -241.68c
a,b,c,d,e Indicate means in the same row with a different superscript letter differ (P<0.05).1 Deads are included in net return calculations but not in physical performance measures (average daily gain, cost of gain, or conversion)2 Conditions necessary to be considered a chronic were: received all three antimicrobial therapies according to protocol, on feed more than
21 days, and experienced a net loss of body weight over the preceding 21 days on feed.3 Indicates 337 heifers in backgrounding phase.4 Indicates 193 heifers in finishing phase and overall.
6

spectively). Figure 1 shows the cost of gain across the number of BRD treatments for all three phases. From the figure, the wide differences in cost of gain during the backgrounding phase are shown, however in the finishing phase and subsequently overall the cost of gain is not as widely spread out between the treatment groups. As the number of BRD treatments increased, the cost of BRD treatment increased significantly (P ≤ 0.05). The zero-treatment group were significantly different (P ≤ 0.05) than those treated at least once. Those treated once averaged $9.63 per head in BRD treatment costs while those treated three times or considered chronic had more than $35 per head in BRD treatment costs. Those treated three times or considered chronic were not significantly different. BRD treatment costs have been found to range from zero to $21.70 per head (Ed-wards, 1996; Fulton et al., 2002). As the number of BRD treatments increased, backgrounding net returns decreased significantly. On average heifers with zero treatments had $111.12 higher net returns compared to heifers classified as chronics. Heifers treated once, twice, or three times had $92.51, $59.98, and $20.62, respectively, higher backgrounding net returns than chronics (P ≤ 0.05). There was an average economic cost associated with death loss of $661.56 in the back-grounding phase per dead heifer. No significant differences were found in finishing phase net returns across BRD treatments. This may be attributed to the fact that heifers were slaughtered based on live weight and estimated carcass backfat of 0.4 inches using ultrasound and that heifers classified as chronics tended to improve in efficiency during
the finishing phase. Figure 2 shows net returns across the number of BRD treatments for all three phases. Overall, heifers classified as chronics had significantly lower net returns compared to those with zero, one, or two treatments. Chronic heifers lost significantly more ($143.28) than those with zero treatments and $153.40 and $132.20 more than those treated once or twice, re-spectively. Overall net returns for chronics and heifers treated three times were not significantly different (P ≤ 0.05). Similar findings have shown calves never treat-ed for BRD had significantly higher returns than calves treated once or more than once (Fulton et al., 2002). If producers can find a way to determine if the animals will remain healthy throughout the overall phase, then they could cut losses during the backgrounding phase with animals treated three times or classified as chron-ics.
Standardized beta coefficients Risk Groups. The purpose of calculating standard-ized beta coefficients was to determine the most im-portant factors affecting net returns. Tables 5, 6, and 7 report the standardized beta coefficients for the back-grounding, finishing, and combined phases, respec-tively. ADG was the most significant factor attributed to backgrounding net returns followed by cost as fed and then the amount of BRD treatments given to the heifer. Recall from the least squares means, those nev-er treated had significantly higher ADG compared to those treated at least once. The number of times treated for BRD could have caused the ADG to be affecting net returns. BRD Treatment Groups. During the finishing phase, physical characteristics, hot carcass weight, fin-ishing phase start weight, and cost of feed, attributed the most to net returns. When the two phases are com-bined, hot carcass weight had the greatest impact on net returns. This is similar to research by Ward and Johnson (2005), where weight was the strongest mar-ket signal compared to carcass quality characteristics when using grid pricing systems. Those never treated for BRD or only treated once significantly impacted net returns compared to chronics based on the least squares means. Performance characteristics, initial body weight, ADG, and feed-to-gain conversion, also significantly affected net returns. BRD treatments tend to affect other performance characteristics. As BRD treatments increase, animal performance decreases, es-pecially in the backgrounding phase.
Summary and Conclusions
The overall objective of this research was to de-termine the economic effects of bovine respiratory disease (BRD) on both backgrounding and finishing phases and on the two phases combined. In addition,
Background Finishing CombinedPhases
250
-25-50-75
-100-125-150-175-200-225-250
Net
Ret
urns
($/H
ead
0123Chronics
Figure 2. Differences in Net Return ($/Head) by Number of Bovine Respiratory Disease Treatments for the Background, Finishing, and Combined Phases.
7
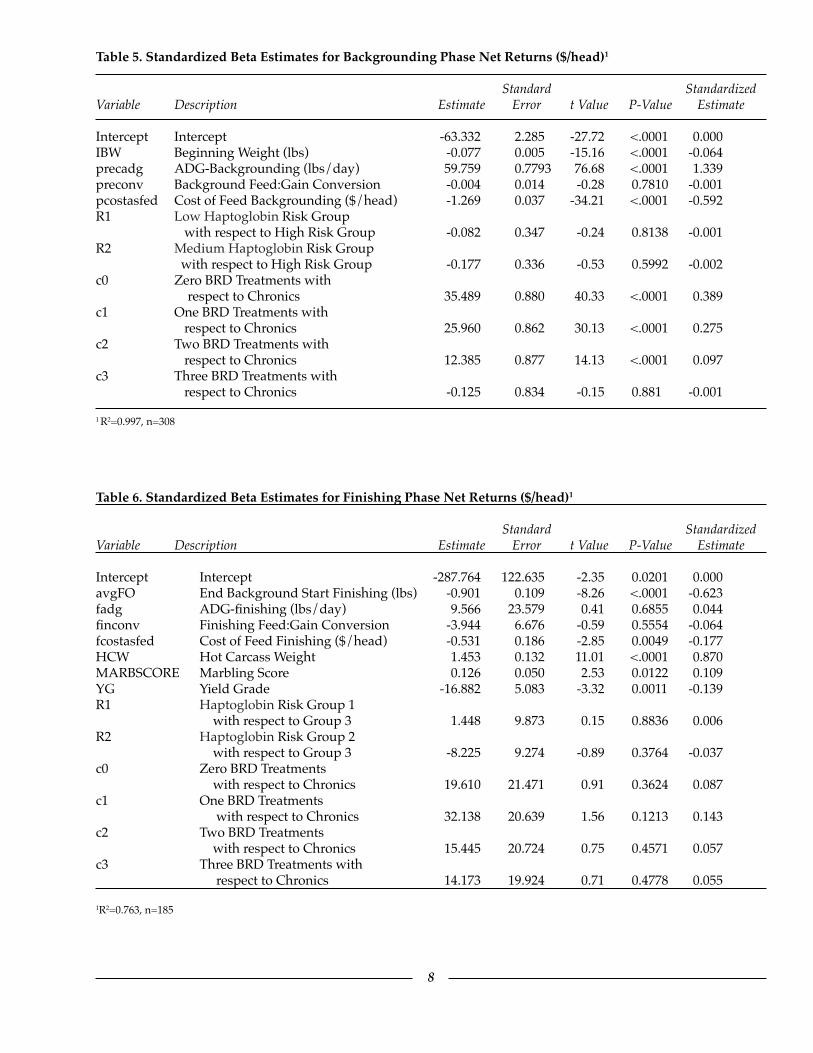
Table 5. Standardized Beta Estimates for Backgrounding Phase Net Returns ($/head)1
Standard Standardized Variable Description Estimate Error t Value P-Value Estimate
Intercept Intercept -63.332 2.285 -27.72 <.0001 0.000IBW Beginning Weight (lbs) -0.077 0.005 -15.16 <.0001 -0.064precadg ADG-Backgrounding (lbs/day) 59.759 0.7793 76.68 <.0001 1.339preconv Background Feed:Gain Conversion -0.004 0.014 -0.28 0.7810 -0.001pcostasfed Cost of Feed Backgrounding ($/head) -1.269 0.037 -34.21 <.0001 -0.592R1 Low Haptoglobin Risk Group with respect to High Risk Group -0.082 0.347 -0.24 0.8138 -0.001R2 Medium Haptoglobin Risk Group with respect to High Risk Group -0.177 0.336 -0.53 0.5992 -0.002c0 Zero BRD Treatments with respect to Chronics 35.489 0.880 40.33 <.0001 0.389c1 One BRD Treatments with respect to Chronics 25.960 0.862 30.13 <.0001 0.275c2 Two BRD Treatments with respect to Chronics 12.385 0.877 14.13 <.0001 0.097c3 Three BRD Treatments with respect to Chronics -0.125 0.834 -0.15 0.881 -0.001
1 R2=0.997, n=308
Table 6. Standardized Beta Estimates for Finishing Phase Net Returns ($/head)1
Standard Standardized Variable Description Estimate Error t Value P-Value Estimate Intercept Intercept -287.764 122.635 -2.35 0.0201 0.000avgFO End Background Start Finishing (lbs) -0.901 0.109 -8.26 <.0001 -0.623fadg ADG-finishing (lbs/day) 9.566 23.579 0.41 0.6855 0.044finconv Finishing Feed:Gain Conversion -3.944 6.676 -0.59 0.5554 -0.064fcostasfed Cost of Feed Finishing ($/head) -0.531 0.186 -2.85 0.0049 -0.177HCW Hot Carcass Weight 1.453 0.132 11.01 <.0001 0.870MARBSCORE Marbling Score 0.126 0.050 2.53 0.0122 0.109YG Yield Grade -16.882 5.083 -3.32 0.0011 -0.139R1 Haptoglobin Risk Group 1 with respect to Group 3 1.448 9.873 0.15 0.8836 0.006R2 Haptoglobin Risk Group 2 with respect to Group 3 -8.225 9.274 -0.89 0.3764 -0.037c0 Zero BRD Treatments with respect to Chronics 19.610 21.471 0.91 0.3624 0.087c1 One BRD Treatments with respect to Chronics 32.138 20.639 1.56 0.1213 0.143c2 Two BRD Treatments with respect to Chronics 15.445 20.724 0.75 0.4571 0.057c3 Three BRD Treatments with respect to Chronics 14.173 19.924 0.71 0.4778 0.055
1R2=0.763, n=185
8

this research measured the effectiveness of using se-rum haptoglobin (Hp) concentration to predict BRD occurrence and the impact of multiple treatments for BRD on cattle performance and net returns. BRD treatment costs were significantly higher for chronic heifers compared with those receiving two or fewer treatments. Net returns decreased per head, as the number of BRD treatments increased in the back-grounding phase and the combined phases. Previous research found similar results (Fulton et al., 2002). In the finishing phase, net returns were not significantly different as the number of BRD treatments increased. Heifers classified as chronics tended to catch up to those receiving three or fewer treatments. Dead ani-mals in the backgrounding phase reduce overall net returns by approximately $22 per head and $163 per head in the combined phases. Backgrounding phase cost of gain was signifi-cantly different between heifers in risk group three compared with risk groups one and two treatments. The current study found no significant relationship between heifer risk group based on Hp concentration and the number of BRD treatments. It also found no relationship between risk group and net returns. Previ-ous research has found similar results in steers where arrival Hp concentration was a poor predictor of the number of antimicrobial treatments (Step et al., 2008). Further studies need to be conducted to further exam-
ine the economic efficiency given the cost of using Hp concentration to predict the number of BRD. Standardized beta coefficients determine the influ-ence of each independent variable on net returns. In the backgrounding phase, ADG had the highest influ-ence on net returns followed by cost of feed. However in the finishing phase, the beta coefficients show that HCW had the highest influence on finishing net returns followed by initial weight in the finishing phase and cost of feed. Overall, HCW and feed-to-gain conver-sion had the highest influence on overall net returns, followed by number of BRD treatments compared to chronics. Knowing the potential number of BRD treatments required in a backgrounding feedlot phase for heifers could potentially increase net revenues for stocker op-erations and feedlot managers. The ability to choose animals remaining healthy throughout the phase would decrease cost of treatment. Producers could also pay less for high risk cattle; precondition them, and then potentially resale at higher prices. Step et al. (2008) found weaning steers on the ranch for 45 days prior to shipping to feedlots resulted in healthier cattle. A high percentage of calves (91 percent) are diagnosed with BRD within the first 27 days after arrival at the feedlot (Buhman et al. 2000) and the majority of deaths due to BRD occur shortly after arrival to the feedlot or within the first 45 days (Loneragan et al., 2001; Ed-
Table 7. Standardized Beta Estimates for Total Net Returns ($/head)1
Standard Standardized Variable Description Estimate Error t Value P-Value Estimate
Intercept Intercept -89.922 120.111 -0.75 0.4551 0.000IBW Beginning Weight (lbs) -0.814 0.133 -6.12 <.0001 -0.282fulladg Overall ADG (lbs/day) -64.821 21.440 -3.02 0.0029 -0.264totalcon Total Feed:Gain Conversion -32.858 7.765 -4.23 <.0001 -0.370totalcostasfed Cost of Feed Backgrounding ($/head) -0.269 0.194 -1.39 0.1668 -0.078HCW Hot Carcass Weight 1.362 0.133 10.24 <.0001 0.780MARBSCORE Marble Score 0.109 0.049 2.23 0.0268 0.089YG Yield Grade -18.079 5.001 -3.61 0.0004 -0.142R1 Haptoglobin Risk Group 1 with respect to Group 3 5.072 9.714 0.52 0.6023 0.020R2 Haptoglobin Risk Group 2 with respect to Group 3 -9.155 9.101 -1.01 0.3159 -0.039c0 Zero BRD Treatments with respect to Chronics 68.948 21.147 3.26 0.0013 0.291c1 One BRD Treatments with respect to Chronics 74.451 20.279 3.67 0.0003 0.316c2 Two BRD Treatments with respect to Chronics 46.313 20.873 2.22 0.0278 0.164c3 Three BRD Treatments with respect to Chronics 25.831 19.326 1.34 0.1831 0.095
1R2=0.7912, n=185
9

wards, 1996). Potential decreases in BRD outbreaks and increased net revenues for stocker operations and feedlot managers could be seen if cattle were in a 45-day backgrounding phase prior to shipment to the feedlot. The research presented here was conducted on heifers only. Further research should address the economics of other alternative indicators of risk and whether differences exist in the impact of BRD treat-ments between heifers and steers in the background-ing, finishing, and combined system. Further research is also needed to determine differences in Hp concen-tration on predicting BRD treatments in both steers and heifers.
References
Amosson, S. H.; R. A. Dietrich, H. Talpaz, and J. A. Hopkin. “Economic and Epidemiologic Policy Implications of Alternative Bovine Brucellosis Programs.” Western Jour-nal of Agricultural Economics 6(July 1981):43-56.
Berry, B.A., A. W. Confer, C.R. Krehbiel, D.R. Gill, R.A. Smith, and M. Montelongo. “Effects of Dietary Energy and Starch Concentrations for Newly Received Feedlot Calves: II. Acute-Phase Protein Response.” Journal of Animal Science 82(2004): 845-850.
Buhman, M.J.; L.J. Perino, M.L. Galyean, T.E. Wittum, T.H. Montgomery, and R.S. Swingle. “Association Between Changes in Eating and Drinking Behaviors and Respira-tory Tract Disease in Newly Arrived Calves at a Feedlot.” American Journal of Veterinary Research 61(2000):1163-1168.
Carter, J. N.; G. L. Meredith, M. Montelongo, D. R. Gill, C. R. Krehbiel, M. E. Payton, A. W. Confer. “Relation-ship of Vitamin E Supplementation and Antimicro-bial Treatment with Acute-Phase Protein Responses in Cattle Affected By Naturally Acquired Respiratory Tract Disease.” American Journal of Veterinarian Resources 63(2002):1111-1117.
Chirase, N.K. and L.W. Greene. “Dietary Zinc and Manga-nese Sources Administered from the Fetal Stage On-wards Affect Immune Response of Transit Stressed and Virus Infected Offspring Steer Calves.” Animal Feed Sci-ence and Technology 93(2001):217-228.
Duff, G.C. and M.L. Galyean. “Board-Invited Review: Recent Advances in Management of Highly Stressed, New-ly Received Feedlot Cattle.” Journal of Animal Science 85(2007):823-840.
Edwards, A.J. “Respiratory Diseases of Feedlot Cattle in the Central USA.” Bovine Practitioner 30(1996):5-7.
Elbakidze, L. “Economic Benefits of Animal Tracing in the Cattle Production Sector.” Journal of Agricultural and Re-source Economics 32(April 2007):169-180.
Fulton, R.W.; B.J. Cook, D.L. Step, A.W. Confer, J.T. Saliki, M.E. Payton, L.J. Burge, R.D. Welsh, K.S. Blood. “Evalu-ation of Health Status of Calves and the Impact on Feed-lot Performance: Assessment of a Retained Ownership Program for Postweaning Calves.” The Canadian Journal of Veterinary Research 66(2002):173-180.
Galyean, M.L.; L.J. Perino, and G.C. Duff. “Interaction of Cat-tle Health/Immunity and Nutrition.” Journal of Animal Science 77(1999):1120-1134.
Gardner, B.A.; H.G. Dolezal, L.K. Bryant, F.N. Owens, and R.A. Smith. “Health of Finishing Steers: Effects on Per-formance, Carcass Traits, and Meat Tenderness.” Journal of Animal Science 77(1999):3168-3175.
Griffin, D.; L. Perino, and T. Wittum. “Feedlot Respiratory Disease: Cost, Value of Preventives and Intervention.” Proceedings of the American Association of Bovine Practitio-ner 27(1995):157-160.
Hennessy, D. A.; J. Roosen, and H. H. Jensen. “Infectious Disease, Productivity, and Scale in Open and Closed Animal Production Systems.” American Journal of Agri-cultural Economics. 87(November 2005): 900-917.
Johnson, H. C. and C. E. Ward. “Market Signals Transmitted by Grid Pricing.” Journal of Agricultural and Resource Eco-nomics 30(December 2005):561-579.
Kuchler, F. and S. Hamm. “Animal Disease Incidence and In-demnity Eradication Programs.” Agricultural Economics 22(2000):299-308.
Loneragan, G.H.; D.A. Dargatz, P.S. Morley, and M.A. Smith. “Trends in Mortality Ratios Among Cattle in US Feed-lots.” Journal of the American Veterinary Medical Associa-tion 219(2001):1122-1127.
Nyamusika, N.; T. H. Spreen, O. Rae, and C. Moss. “A Bio-economic Analysis of Bovine Respiratory Disease Complex.” Review of Agricultural Economics 16(January 1994):39-53.
Snowder, G.D.; L.D. Van Vleck, L.V. Cundiff, G.L. Bennett. “Bovine Respiratory Disease in Feedlot Cattle: Environ-mental, genetic, and economic factors.” Journal of Animal Science 84(2006):1999-2008.
Step, D. L.; C. R. Krehbiel, H. A. DePra, J. J. Cranston, R. W. Fulton, J. G. Kirkpatrick, D. R. Gill, M.E. Payton, M. A. Montelongo, and A. W. Confer. “Effects of commingling beef calves from different sources and weaning proto-cols during a forty-two-day receiving period on perfor-mance and bovine respiratory disease.” Journal of Animal Science 86(2008):3146-3158.
Wittum, T.E. and L.J. Perino. “Passive Immune Status at Postpartum Hour 24 and Long-Term Health and Perfor-mance of Calves.” American Journal of Veterinary Research 56(1995):1149-1154.
Wooldridge, J. M. Introductory Econometrics: A Modern Ap-proach, 3rd ed. Ohio: Thomson South-Western, 2006.
10