Embed Size (px)
Citation preview

Economic Development Strategy and
Implementation Plan
April 2013


Hudson Howells | January 2013
City of Charles Sturt – Economic Development Strategy
TABLE OF CONTENTS
EXECUTIVE SUMMARY ...........................................................................................1
1. INTRODUCTION AND PROJECT OBJECTIVES ...................................................11
2. REGIONAL ECONOMIC AUDIT .......................................................................13
2.1 BACKGROUND ..............................................................................................................................13
2.2 LOCAL GOVERNMENT AND ECONOMIC DEVELOPMENT .........................................................................13
2.3 THE ROLE OF LOCAL GOVERNMENT ..................................................................................................16
2.4 THE ECONOMIC PROFILE OF CHARLES STURT ......................................................................................19
2.5 COMMUNITY PLAN CONSULTATION ..................................................................................................24
2.6 OVERVIEW OF PREVIOUS RESEARCH..................................................................................................25
2.7 STRATEGY DEVELOPMENT CHALLENGES .............................................................................................31
3. STAKEHOLDER CONSULTATION.....................................................................36
3.1 RECREATION AND SPORT ................................................................................................................37
3.2 TOURISM, HOSPITALITY AND ENTERTAINMENT....................................................................................39
3.3 MANUFACTURING .........................................................................................................................41
3.4 HEALTH .......................................................................................................................................42
3.5 EDUCATION AND TRAINING .............................................................................................................43
3.6 URBAN DEVELOPMENT...................................................................................................................44
3.7 GENERAL .....................................................................................................................................44
4. CITY ECONOMIC DEVELOPMENT STRATEGY ..................................................45
4.1 COUNCILS ROLE IN ECONOMIC DEVELOPMENT....................................................................................45
4.2 COMPETITIVE ADVANTAGE..............................................................................................................46
4.3 ECONOMIC DEVELOPMENT VISION AND PILLARS .................................................................................48
4.4 ECONOMIC DEVELOPMENT STRATEGIES AND IMPLEMENTATION .............................................................49

Hudson Howells | January 2013
City of Charles Sturt – Economic Development Strategy
5. FUTURE ECONOMIC SCENARIOS AND KPI’S ...................................................57
5.1 PURPOSE OF THE ANALYSIS .............................................................................................................57
5.2 METHODOLOGY ............................................................................................................................57
5.3 MODELLING THE BASE CASE ............................................................................................................60
5.4 ECONOMIC ACTIVITY BY INDUSTRY FORECAST .....................................................................................61
5.5 MODELLING OF MEDIUM TARGETS ..................................................................................................64
5.6 MODELLING OF HIGH TARGETS ........................................................................................................65
5.7 CONCLUSIONS ..............................................................................................................................67
6. INVESTMENT PROSPECTUS ...........................................................................71

Hudson Howells | January 2013 Page 1
City of Charles Sturt – Economic Development Strategy
EXECUTIVE SUMMARY
Introduction
This Economic Development Strategy for the City of Charles Sturt is a key corporate
document supporting the goals and actions identified in the City of Charles Sturt Community
Plan which outlines a 20‐year community vision for the City with a key objective of ensuring
Charles Sturt is an economically prosperous, attractive and functional City.
The traditional driver of economic activity and employment in Charles Sturt has traditionally
been manufacturing. This is no longer the case and represents a significant challenge for
policy makers in shifting to a new economic development framework based on service
industry development.
Growth in the number of businesses and increasing the economic output of local businesses
will be one of the most effective strategies to expand and secure the rate base of the City. It
will also provide residents with a greater number and diversity of jobs and opportunities for
education and training.
This Economic Development Strategy is being prepared at a time of significant economic
stress and uncertainty. The last three years have seen substantially lower economic activity
growth than over the preceding decade for Australia, and globally.
The current environment, including the price that must be paid for the 2007‐08 financial
crisis, the continuing troubles in the Euro zone and a slowing of growth in China, has seen
consumers react cautiously, with increases in savings rates, and with low levels of residential
construction. Tradable goods production has seen significant losses in competitiveness as
the exchange rate has moved against Australia (buoyed by commodity prices and high
interest rates) and Australia is now, while one of the safest destinations for investment
capital (politically), one of the expensive regions in which to do business.
Charles Sturt has traditionally been known as a manufacturing location with automotive and
other industries having grown around the now closed GMH car manufacturing facility at
Woodville. This resulted in a vibrant automotive components manufacturing sector which

Hudson Howells | January 2013 Page 2
City of Charles Sturt – Economic Development Strategy
today however is suffering declining fortunes along with Australia’s declining car
manufacturing industry. Opportunities to diversify production along with exploration of
export and offshore investment opportunities represent the best prospects for these firms
to survive and prosper.
Stakeholder Consultation
Stakeholder consultation was correctly viewed by Council as essential input to formulation
of the economic development strategy and to securing buy‐in and ongoing contribution from
the business community.
A Consultation Template was prepared and approved by Council to guide all meetings which
specifically sought input from stakeholders on:
• Council’s role in economic and industry development in the region.
• Major economic and industry development opportunities and threats for the region.
• Suggested actions for Charles Sturt Council to promote regional economic
development.
Over 40 organisations and individuals (Appendix 1) were consulted across the region
covering the following industry sectors:
• Health
• Education & Workforce Training
• Automotive
• General Manufacturing
• Tourism
• Sport and Recreation
• Entertainment
• Hospitality.
The consultation strongly supported Council’s involvement in economic development but
the vast majority of organisations saw Council’s role as one of providing the best

Hudson Howells | January 2013 Page 3
City of Charles Sturt – Economic Development Strategy
environment for economic development along with value adding to State and
Commonwealth Government initiatives. Risk taking through involvement or investment in
commercial activities was generally viewed as not appropriate for Council involvement at
this stage.
Councils Role in Economic Development
One of the challenges for Council is to define its role in economic development so that it can
decide how it should address the many strengths, weaknesses, opportunities and threats
(key issues) identified in the strategy research.
The primary constraints on Council are resources (human and financial) and exposure to risk
in economic development transactions. Council administration has expressed a preference
that during the life of this Economic Development Strategy that it will minimise resource
demands and its risk exposure by:
• Focussing on improving the physical and business environment for economic
development.
• Adding value to and participating in regional, State and Commonwealth Government
economic development initiatives in collaboration with the private sector.
• Collaborating with contiguous economic development regions.
In adopting this role, administration believes that the pursuit of commercial economic
development initiatives, either individually or in joint venture with the private sector (e.g.
sole or partnership participation in residential, commercial or industrial developments)
should be minimised, unless Council has expressed a desired outcome that aligns with the
Community Plan.
It is recognised here that Council has extensive demands on its financial and human
resources through the development and implementation of other Council strategies
including, for example:
• The City Strategic/Community Plan; and

Hudson Howells | January 2013 Page 4
City of Charles Sturt – Economic Development Strategy
• The Digital Economy Strategy.
Based on the region’s competitive advantage (or unique selling proposition), the Economic
Development Strategy must complement these and add value without exposing Council to
unreasonable resource demands and financial risk. The Economic Development Vision,
Objectives and Strategies that follow are therefore deliberately conservative in approach
and seek to transition Council over time to a greater role in economic development.
Competitive Advantage
The research and consultation for this project clearly identified that the Council region has,
over time, developed a major strength and competitive advantage in the provision of
sporting and entertainment facilities and services. The City can no longer claim to, or be
recognised as, the traditional manufacturing stronghold that underpinned its social and
economic development throughout the 20th Century. As demonstrated by 2011 Census data
in Section 2 of this report:
• Manufacturing employment declined from 10,238 to 5,541 between 1996 and 2011.
• Machinery and Equipment manufacturing employment declined from 4,481 to
1,393 between 1996 and 2011.
• Entertainment, Recreation, Personal Services and Hospitality employment increased
from 2,503 to 4,944 between 1996 and 2011, reflecting the gathering strength of
this sector in the regional economy despite the Global Economic Crisis.
• Education and Health (Other Community Services) were also strong performers
between 1996 and 2011 increasing from 5,817 to 8,513 employees.
Clearly the City is in transition from a manufacturing to a services based economy and
Council’s Economic Development Strategy must now reflect this transition and focus on
building on its competitive strengths.
Charles Sturt’s proximity to the City, Airport and the beach underscore the strength of its
sporting and entertainment facilities and services which are further complemented by

Hudson Howells | January 2013 Page 5
City of Charles Sturt – Economic Development Strategy
facilities in contiguous Council regions (e.g. Kooyonga and Adelaide Shores, which is in both
West Torrens and Charles Sturt) making this a potential Western Region of Adelaide
competitive advantage.
As a major competitive advantage, sporting and entertainment facilities and services offer
Charles Sturt outstanding potential to further develop associated industries that have high
job and income prospects including:
• Tourism and hospitality.
• Education.
• Health.
• Advanced (high value added) manufacturing.
The key to working this competitive advantage is acceptance by Council, industry and other
stakeholders that the Council region (and possibly the broader Western region) is in
economic transition from a manufacturing base to a services base (as evidenced by the 2011
census data) and that its competitive advantage in the services sector should be the driver of
future economic strategy and industry development initiatives. Manufacturing should not be
ignored in this context, but the focus should be on high value added manufacturing where
companies compete on technology, service, etc and not on price underpinned by low cost
land and labour.
Economic Development Vision and Pillars
Supported by the research and consultation undertaken for this project, the following
Economic Development Vision is recommended for the City of Charles Sturt:
By 2018, the City of Charles Sturt will be recognised as Adelaide’s sport, recreation
and entertainment hub supporting the development of value added tourism,
education, health and advanced manufacturing industries.
Council will facilitate this vision through the following four key pillars:
• Pillar #1 - Promotion ‐ Development and promotion of an economic brand and
associated imagery.
Hudson Howells | January 2013 Page 6
City of Charles Sturt – Economic Development Strategy
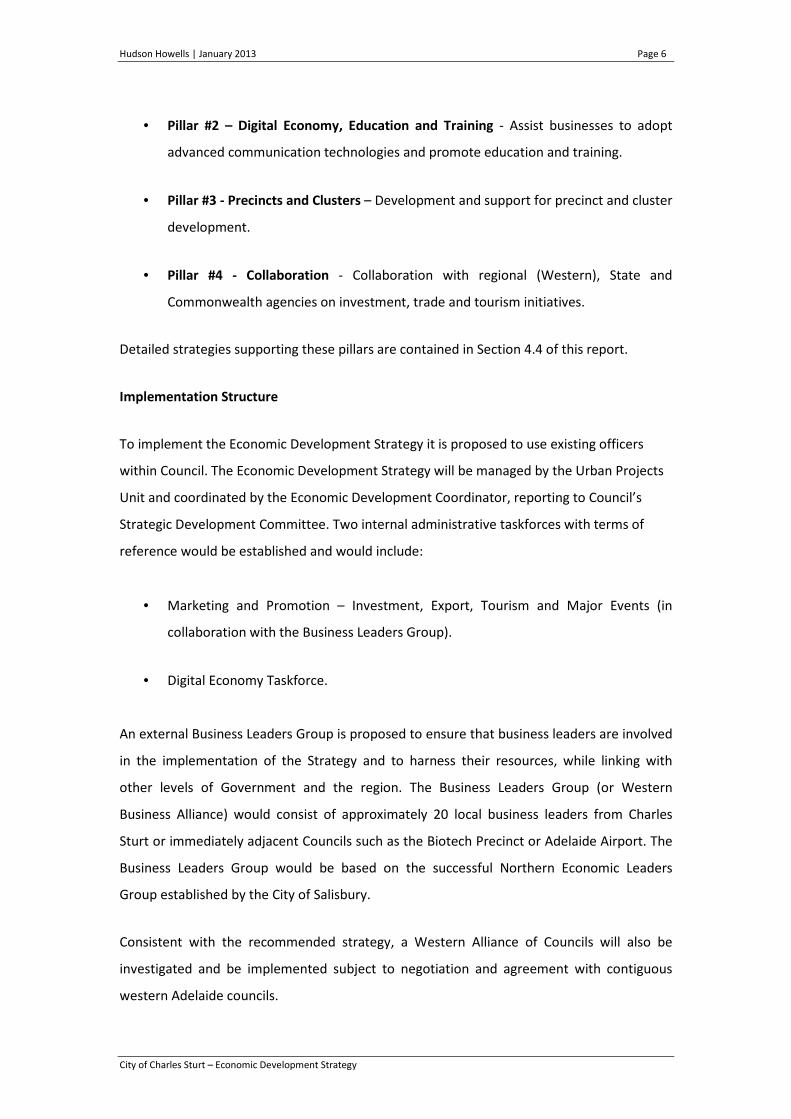
• Pillar #2 – Digital Economy, Education and Training ‐ Assist businesses to adopt
advanced communication technologies and promote education and training.
• Pillar #3 - Precincts and Clusters – Development and support for precinct and cluster
development.
• Pillar #4 - Collaboration ‐ Collaboration with regional (Western), State and
Commonwealth agencies on investment, trade and tourism initiatives.
Detailed strategies supporting these pillars are contained in Section 4.4 of this report.
Implementation Structure
To implement the Economic Development Strategy it is proposed to use existing officers
within Council. The Economic Development Strategy will be managed by the Urban Projects
Unit and coordinated by the Economic Development Coordinator, reporting to Council’s
Strategic Development Committee. Two internal administrative taskforces with terms of
reference would be established and would include:
• Marketing and Promotion – Investment, Export, Tourism and Major Events (in
collaboration with the Business Leaders Group).
• Digital Economy Taskforce.
An external Business Leaders Group is proposed to ensure that business leaders are involved
in the implementation of the Strategy and to harness their resources, while linking with
other levels of Government and the region. The Business Leaders Group (or Western
Business Alliance) would consist of approximately 20 local business leaders from Charles
Sturt or immediately adjacent Councils such as the Biotech Precinct or Adelaide Airport. The
Business Leaders Group would be based on the successful Northern Economic Leaders
Group established by the City of Salisbury.
Consistent with the recommended strategy, a Western Alliance of Councils will also be
investigated and be implemented subject to negotiation and agreement with contiguous
western Adelaide councils.

Hudson Howells | January 2013 Page 7
City of Charles Sturt – Economic Development Strategy
The proposed implementation structure is shown in the following diagram:
Strategic Development
Committee of Council
Economic Development Taskforce
• Collaboration
• Precincts & Clusters
• Promotion
Digital Economy Taskforce
Information Services
Community Services
Library Services
Urban Projects
Western Business Leaders
20 Key Business Leaders
Economic Impact of the Recommended Strategy
Section 5 of the report quantifies the expected impact that implementation of the
recommended Economic Development Strategy will have on the City of Charles Sturt
expressed as jobs and Gross Regional Product (or incomes). These forecast outcomes can be
used by the City as Key Performance Indicators to assess the effectiveness of the EDS
implementation over time.
Three scenarios (low, medium and high) have been produced to test the potential economic
impact of the strategy.
The following table provides a summary of the outcomes for the three scenarios for key
variables. Gross Regional Product (GRP) would fall by $0.2 billion in the low scenario,
increase by $0.8 billion in the medium, and increase by $2.6 in the high (in today’s dollars).
In the low scenario employment in the area remains static, with decreases in manufacturing
offset by some growth in services, driven mostly by demand from local population. In the
medium and high scenarios there is growth in employment overall, driven primarily by
demand for services in the areas emanating from populations outside the area. Under the

Hudson Howells | January 2013 Page 8
City of Charles Sturt – Economic Development Strategy
high scenario, these increases are even more significant, also supported by growth in high
value manufacturing.
Projections of Employment Outcomes for Alternative Scenarios – Projection for Change
Over 25 Years
Low Medium High
Increase in Gross Regional Product ($ M) ‐206 838 2659
Increase in Employment (Total) ‐108 9463 25864
Manufacturing ‐2431 ‐1256 632
Education 422 589 820
Other Community Services 905 1189 1550
Entertainment, recreation and personal services 599 2379 5618
The following figures illustrate the alternative projected outcomes for employment, Gross
Regional Product and population over the next 20 years for the City of Charles Sturt. These
projections illustrate the challenge facing economic development policy for the City –
brought about largely due to the challenges both long term and short term being faced by
the manufacturing sector, in terms of employment, and probably population decline. One
might argue the specific assumptions and therefore the detail of outcomes, but the general
context is clear.
The alternative scenarios show the magnitude of the targets that need to be met in the
areas identified within the strategy document. Such quantification enhances the strategic
approach by understanding how individual outcomes translate through a whole of economy
context.
In summary, the medium scenario targets are necessary to maintain the regional economy
at its current balance between local employment and population growth, while the high
scenario targets are necessary for the region to maintain its relative size to the
Australian/South Australian economies.

Hudson Howells | January 2013 Page 9
City of Charles Sturt – Economic Development Strategy
Projections of Employment Outcomes for City of Charles Sturt
Alternative Development Scenarios
0
10000
20000
30000
40000
50000
60000
70000
2011 2016 2021 2026 2031 2036
Estimated Employment Outcomes for
Charles Sturt
Low Scenario
Medium Scenario
High Scenario
Projections of GRP Outcomes for City of Charles Sturt
Alternative Development Scenarios
0
1000
2000
3000
4000
5000
6000
7000
2011 2016 2021 2026 2031 2036
Estimated GRP Outcomes for Charles
Sturt (2012 $m)
Low Scenario
Medium Scenario
High Scenario

Hudson Howells | January 2013 Page 10
City of Charles Sturt – Economic Development Strategy
Projections of Population Outcomes for City of Charles Sturt
Alternative Development Scenarios
0
20000
40000
60000
80000
100000
120000
140000
160000
2011 2016 2021 2026 2031 2036
Estimated Population Outcomes for
Charles Sturt
Low Scenario
Medium Scenario
High Scenario
Hudson Howells | January 2013 Page 11
City of Charles Sturt – Economic Development Strategy
1. INTRODUCTION AND PROJECT OBJECTIVES
Hudson Howells was engaged in 2012 to prepare an Economic Development Strategy and
Implementation Plan for the City of Charles Sturt. The strategy is to form a key corporate
document supporting the goals and actions identified in the City of Charles Sturt Community
Plan which outlines a 20‐year community vision for the City with a key objective of ensuring
Charles Sturt is an economically prosperous, attractive and functional City.
The purpose of this project is to help Council make economic development a stronger focus
in its deliberations and procedures and to position the City so that it has a clear economic
development vision and strategy, understands the role it will play and how it will deliver on
the strategy.
The key objectives of the project were to:
• Build on the strategic framework identified in the Blandy report “A Quantitative
Assessment of the Charles Sturt Economy and Models of Engagement” and deliver a
concise economic development strategy, implementation and resource plan.
• The preparation of the economic development strategy that brings the Elected
Member body along a journey and integrates with the Community Plan review
process and the key theme of ‘Economy’ underpinning this project.
• An economic development strategy that clearly identifies issues and areas of focus
including but not limited to employment, infrastructure, land use/regulatory issues
and targeted sector opportunities.
• An economic development strategy that engages key stakeholders in its
development and provides for ongoing community and industry engagement
opportunities over the strategy’s implementation.

Hudson Howells | January 2013 Page 12
City of Charles Sturt – Economic Development Strategy
• An economic development strategy that identifies Council’s role while providing
realistic and prioritised actions and initiatives that respond to well documented
research, case studies and stakeholder feedback.
• Provide the basis for a defined and strategic approach to economic development
with preliminary work informing the 2012/13 business planning and budget process
and the final report informing a 5 year program.
• The Project is also expected to support key findings and strategic directions of the
Employment Revitalisation Plan.
• To identify key partnerships across boundaries, private and public to leverage
opportunities that would otherwise remain unfulfilled.

Hudson Howells | January 2013 Page 13
City of Charles Sturt – Economic Development Strategy
2. REGIONAL ECONOMIC AUDIT
2.1 Background
The City of Charles Sturt has set itself an objective of enhancing economic performance (i.e.
industry activity and employment) in its region and this project involves the formulation of
an economic development strategy to underpin the actions required to achieve that
objective.
The core driver for this project is that Charles Sturt has experienced a long term decline in
employment in manufacturing. This decline in employment presents an opportunity for
rethinking approaches provided from heavily under‐utilised industrial land in the region.
This section of the report summarises the first working paper prepared for the project and
distributed to Council. The objective of this paper was to ensure an understanding of the
political and economic environment in which the economic development strategy for
Charles Sturt is being developed.
2.2 Local Government and Economic Development
The development of this strategy is framed around some core propositions with respect to
the role of Local Government in economic development. These are as follows:
Proposition 1: Markets left alone will not lead to optimal economic outcomes from a
regional perspective
There are many varying opinions about the roles that government could and should take in
terms of economic development. The arguments for involvement are based on recognition
of market failures (imperfect competition, economies of scale, public goods, including
information). Many of these arguments focus on national level policy (e.g. infant industry
arguments, critical mass). At the regional level the core aspects1 include:
1 Timothy J. Bartik, The Market Failure Approach to Regional Economic Development Policy, Economic Development
Quarterly, November 1990

Hudson Howells | January 2013 Page 14
City of Charles Sturt – Economic Development Strategy
• Entrepreneurs and investors have incomplete access to and use of information
about the nature of a region in terms of opportunities that exist, or issues such as
regional planning constraints. Put bluntly – unless informed, many potential
investors will not even know a particular region exists as on option for establishing
their business.
• Individual entrepreneurs and investors ignore externalities in considering their
investment. While discussion around externalities often focuses on the ‘negatives’,
the benefits created by change processes within a region will not necessarily be
understood in the context of individual projects unless it has some controlling or
influencing factor. Clearly local government has systems in place (planning) to
effectively manage the ‘negatives’ but also such systems can create good outcomes.
Proposition 2: Local Government does not have a role in controlling macro-economic drivers
Core drivers of investment are to be found in the macro‐economic environment. Factors
such as exchange rates, interest rates, wage rates, cost structures and inflation determine
the competitiveness of a business and its ability to be profitable. These are clearly in the
main national arena – particularly the first two aspects. Local government can have an
impact on local costs (e.g. land costs, service costs, and even wage costs) but usually at a
minor level. Demand will be a local aspect in locally focussed businesses, but is also heavily
impacted by national factors.
Therefore, it is suggested that Local Government economic development roles will be about
influencing and informing other levels of government on the macro‐economic factors, but
focussing on the issues they can impact. It should be noted that in recent years, there has
been a tendency for regional and local projects to be driven by centralised processes –
national programs around school and community buildings, about other items of
infrastructure. There are many advantages of using the local knowledge and local influence
of local government in directing the investments being made.

Hudson Howells | January 2013 Page 15
City of Charles Sturt – Economic Development Strategy
Proposition 3: Local Government can/should influence local factors
The contention is that Local Government should pay attention to economic development in
the region, and take active steps to encourage development. At the short end, issues such as
the regional environment, planning regulation, and synergies between land uses are all
factors that need to be considered. The core question is what else can be influenced and
how far does a particular council go? There are those who argue against governments (at
any level) having any involvement in correcting market failures, based on a position that
government failures will be worse than market failures. This is certainly possible, and calls
for a balanced approach. It means actions need to be informed and set within an informed
strategy. It reinforces the importance of the process for formulation of this economic
development strategy.
It is noted that one of the arguments against, for example, state government’s active
involvement in economic development is that in the end it simply becomes a benefit to the
business rather than the creation of activity – as businesses play one region off against
another. This again points to the need to ensure that actions provide real benefits that will
increase the level of activity across all regions rather than just pull activity from one region
to another. Strategies to support regional development should be locally owned and
developed, with central government to provide overall national or state goals and funding
support.
Much of the literature on the role of Local Government focuses on Regional Economic
Development ‐ and usually emphasises non‐metropolitan regions. Rural areas do have
somewhat different issues (mainly that travel costs in journey to work tend to emphasise the
imperative of locally supplied employment, and less leakage in purchases of lower valued
goods). However many of the arguments about the positioning re economic development
remain similar for metropolitan regions. O’Neil and Walsh in ‘Rethinking the Approach to
Regional Development in South Australia’, SACES, University of Adelaide (2010) strongly
state that “South Australia’s economic progress, its social cohesion and the development of
its natural resources depend entirely on the economic performance , social vitality and
natural resource of all its regions” (p1). They argue that regions should develop aspirations
and plans for themselves in economic, social and environmental development, arguing that
this endogenous approach is that advocated by the OECD and employed commonly across
Hudson Howells | January 2013 Page 16
City of Charles Sturt – Economic Development Strategy
OECD countries ‐ that is that economic development opportunities are not something to be
imposed from outside, but to be developed from within.
Dr. Paul Collits of the Page Research Centre notes the difficulty in this proposition in a
discussion paper Regional Development: Future Policy Options that “Regional policy is
notoriously open to multiple and confused objectives and to claimed ownership by many
and varied players who include Ministers, Mayors, practitioners and ‘communities’. Regional
policy by its very nature lends itself to politically selective largesse. Moreover, any form of
regional policy intervention will necessarily be controversial, since:
• There is disagreement over what ultimately drives regional performance, hence
there will also be disagreement about the efficacy of any intervention;
• There is disagreement about which regions/projects should be assisted by
government;
• It is difficult to know whether (and to what extent) any intervention has ‘worked’;
• As governments know, and most have admitted, there is no ‘silver bullet’ solution to
regional growth and decline;
• It will always be hard to separate ‘regional policy’ from ‘policies that benefit
regions’; and
• There is disagreement over regional policy objectives.”
2.3 The Role of Local Government
The proposition above is that, despite the difficulties and controversy, Local Government
should take an active role in economic development. The arguments focus around the
benefits of active participation, though of course the benefits are dependent on results
rather than activities per se – effectiveness is paramount. The benefits from a regional
perspective of having stronger economic growth (and it needs to be considered whether this
growth be in employment or in income per employee or both) include:

Hudson Howells | January 2013 Page 17
City of Charles Sturt – Economic Development Strategy
• Providing local employment opportunities for residents reduces journey to work
times, and as such provides benefits in terms of access and travel time – with
associated environmental benefits.
• Local business failures bring significant community costs (underutilised resources,
falls in land value, etc.).
• The possibility of reducing access costs for local residents by having locally supplied
products and services – having more activity within the region gives local residents
the chance to buy locally, with less in the way of search costs.
• Economic growth generates rates revenue (in excess of costs) through an increase in
the number of commercial and industrial properties, and if industry profitability is
enhanced, increased value of properties – with such revenue increases underpinning
council operations2.
• Growth in the economic base provides potential sources of other revenue for the
council, improving financial sustainability including, for example, revenue from
customers and suppliers (parking fees, use of local facilities by business customers
and suppliers). The SA Local Government Association has recognised this by
including an economic development project in their Excellence Project.
• Local businesses will consider corporate sponsorships and supports as part of their
community contribution and as such potentially provide inputs for local social
infrastructure and initiatives.
• Additional activity provides critical mass for hard infrastructure that also benefits the
broader community (e.g. underlying market scope for transport improvements, for
broadband and other communications).
2 Deborah A. Carroll, Tax Increment Financing and Property Value, An Examination of Business Property Using Panel
Data, Urban Affairs Review, March 2008

Hudson Howells | January 2013 Page 18
City of Charles Sturt – Economic Development Strategy
The second question is with respect to focussing on what economic development factors
local government should concentrate on. In addressing this issue the literature focuses on
the following targets.
• The provision of locally oriented infrastructure (or working with other councils in
improving regional infrastructure). This includes transport (roads, rail),
communication (broadband), provision of quality residential facilities, social and
community services (for use by workforce).
• Local Government has particularly been focused on the importance of or need for
business operating and development skills, which are seen as key for the effective
development of small businesses in an area, and that local businesses have access to
skilled workers.
• The provision of information about the nature of the area, and of how to manage
the local planning regulatory system is (business advisory).
The third question that must be addressed by local government decision makers is about the
nature of the activities that Local Government should be involved in, which overlaps the
above question of focus, but with an emphasis on programs and activities.
One dimension in which this can be looked at here is by type of activity. Options include:
• Effective regulations and planning systems (ensure the negative impacts or planning
controls and regulations are effectively managed, and cost impacts minimised).
• Subsidies ‐ the provision of direct and indirect subsidies to businesses to improve
cost competitiveness – such as rate discounts.
• Service provision – providing direct input into business activity, not only in the
standard Local Governments services of rates, road and rubbish, but in services to
business such as information exchange, development project facilitation, etc.

Hudson Howells | January 2013 Page 19
City of Charles Sturt – Economic Development Strategy
A second dimension is to consider how far the Council is prepared to go in terms of the risk
involved.
• The lowest risk type of activities will be those that focus on local infrastructure
provision and the local business environment (i.e. regulations, local services).
• The second level of risk is to look at activities that complement or add value to
activities being undertaken by state and commonwealth government (examples
might include training programs or overseas trade missions).
• Lastly there are the higher risk activities of more innovative and directly impacting or
contributing to projects – this might include taking on commercial activities.
The third aspect around which the Council needs to decide is with respect to the
geographical reach of programs in which they get involved. They can focus on local
businesses and local activities or can reach outside to provide information on or get involved
in national and international activities – such as trade missions, targeting international
investors or national companies (e.g. investment attraction programs).
2.4 The Economic Profile of Charles Sturt
This economic development strategy is being prepared at a time of significant economic
stress and uncertainty. As indicated in Figure 2a the last three years have seen substantially
lower economic activity growth than over the preceding decade for Australia, and globally.
More particularly as indicated in Figure 2b, recent economic outcomes in national economic
activity has been focussed in the mining industry – and to a certain extent personal services
and transport. In March 2012 (light blue bars), industry conditions were 10%age points
higher for mining than for the underlying average between 1989 and present, while
manufacturing is 10% lower. The worsening economic conditions in 2012 are shown by
comparing the outcomes for September 2012 (dark blue bars) to those of March,

Hudson Howells | January 2013 Page 20
City of Charles Sturt – Economic Development Strategy
Figure 2a
Source: RBA Statement - Monetary Policy, November 2012
Figure 2b
Source: RBA Statement - Monetary Policy, November 2012.
The current environment, including the price that must be paid for the 2007‐08 financial
crisis, the continuing troubles in the Euro zone and a slowing of growth in China, has seen

Hudson Howells | January 2013 Page 21
City of Charles Sturt – Economic Development Strategy
consumers react cautiously, with increases in savings rates, and with low levels of residential
construction. Tradable goods production has seen significant losses in competitiveness as
the exchange rate has moved against Australia (buoyed by commodity prices and high
interest rates) and Australia is now, while one of the safest destinations for investment
capital (politically), one of the expensive regions in which to do business.
Table 1 is also taken from the RBA monetary policy papers and indicates that lower levels of
growth are expected for the next two years. It is not until 2014 that more normal economic
conditions are expected to resurface. But even as they do, with the shift in economic focus
from Europe and the US to China and Asia, there is an expectation $A exchange rates will
remain higher than in the 1990’s as commodity prices remain high driven by Chinese growth.
Table 1
Source: RBA Statement - Monetary Policy, November 2012
Table 2 shows the employment patterns by industry in Charles Sturt over the last 15 years.
The data indicate employment stagnation in the region. However, the employment base has
changed with substantial reductions in manufacturing employment, and in wholesale trade –
with the increase being generally across the board in services.

Hudson Howells | January 2013 Page 22
City of Charles Sturt – Economic Development Strategy
Table 2: Employment by industry sector in Charles Sturt – 1996, 2001, 2006 and 2011
%
Change %
Change
1996 2001 2006 2011 96-
2011 06-11
Agriculture 102 83 104 32 ‐69% ‐69%
Forestry and Fishing 41 48 25 19 ‐54% ‐24%
Mining 29 29 75 47 62% ‐37%
Food & beverage manuf 728 569 795 712 ‐2% ‐10%
Wood & paper manuf 1,205 1,253 1,175 862 ‐28% ‐27%
Machinery & Equipment 4,481 4,308 3,290 1,393 ‐69% ‐58%
Metals, metal products 923 758 608 538 ‐42% ‐12%
Non‐metallic minerals 559 580 517 606 8% 17%
Other manufacturing 2,342 2,792 1,936 1,430 ‐39% ‐26%
Total manufacturing 10,238 10,260 8,321 5,541 -46% -33%
Electricity Gas Water 248 181 201 121 ‐51% ‐40%
Wholesale trade 3,699 2,896 2,513 2,351 ‐36% ‐6%
Retail Trade 5,151 6,061 4,917 5,109 ‐1% 4%
Construction 1,966 2,069 2,738 3,480 77% 27%
Transport and storage 678 1,158 1,524 1,508 122% ‐1%
Communication 622 620 341 472 ‐24% 38%
Finance & business services 2,746 3,225 3,184 3,313 21% 4%
Public admin & defence 560 628 1,225 1,333 138% 9%
Education 1,248 1,834 2,361 2,627 110% 11%
Other Community Services 4,569 5,077 5,434 5,886 29% 8% Entertainment, recreation,
personal services, hospitality 2,503 3,531 4,532 4,944 98% 9%
Total 34,400 37,700 37,495 36,783 7% ‐2% Source: ABS 1996, 2001 2006 and 2011 Census Place of Employment – excludes unspecified
Table 3 indicates that in 2007 there were 7,700 registered businesses in the Council of
Charles Sturt. 61% of the businesses were non employing, and 21% employed less than 4
people. Many of these businesses would have been in the construction sector and in
property and business services. It should also be noted that while over the period up to 2007
the numbers of businesses was relatively stable, there was about a 13% turnover rate (i.e.
about 1,000 business started and exited each year). While somewhat out of date, as of
2007, these are the most recent publicly available figures on business numbers. Given the
declines in manufacturing employment numbers between 2006 and 2011 one would expect
there would have been some decline in the number of manufacturing entities as well since
this data was collated.

Hudson Howells | January 2013 Page 23
City of Charles Sturt – Economic Development Strategy
Table 3: Number of Business in Charles Sturt – June 2007
Non‐employing businesses 4 767
Employing businesses: 1 to 4 employees 1 671
Employing businesses: 5 or more employees 1 296
Total businesses 7 734
By Industry
Agriculture, forestry and fishing 195
Mining 18
Manufacturing 600
Electricity, gas and water supply 3
Construction 1 347
Wholesale trade 441
Retail trade 1 020
Accommodation, cafes and restaurants 165
Transport and storage 672
Communication services 105
Finance and insurance 417
Property and business services 1 926
Education 45
Health and community services 408
Cultural and recreational services 162
Personal and other services 210
Total businesses 7,734
Source: ABS Regional Profile
There is $1.9 billion value of commercially rated property in Charles Sturt Council and $0.35
billion of industrial rated property (Source: Local Government Grants Commission 2010
Annual Report).
Much of the discussion with respect to economic development in Charles Sturt focuses on
manufacturing and industrial employment. Over the longer term the decline in employment
has been significant with automotive and white goods manufacturing and heavy engineering
either declining in significance, or moving to areas further away from the CBD.
Manufacturing is still a large economic contributor to the employment base of the region
contributing one in five jobs.
However as can be seen from the Census data ‐ other sectors are also large contributors to
the economic base of the region, including retail, financial services, and other community
services (primarily health). Retail, banking and financial service are focussed at major

Hudson Howells | January 2013 Page 24
City of Charles Sturt – Economic Development Strategy
shopping centres such as West Lakes and Arndale ‐ but also at smaller centres, including
strip shopping along major roads and along the beach). Health is focussed at the Queen
Elizabeth Hospital. In addition, there are a large number of people employed in the
entertainment and recreation sectors. The region includes both the Entertainment Centre
and AAMI Stadium. Importantly the sectors such as community services (health and
education, and social services) and entertainment and recreation are also the sectors that
have grown, despite the overall long term stagnation in employment (thereby offsetting the
long term decline in manufacturing employment). The investment by the State Government
in the tram system opens up further opportunities around the Hindmarsh area ‐ while the
move of AFL to Adelaide Oval provides a driver for significant change in the AAMI Stadium
precinct, and is clearly a focus for the Council in its future direction.
2.5 Community Plan Consultation
This economic development strategy is being prepared concurrently with a Council
Community Plan. Economic development issues receive attention in the draft Community
Plan and the Employment Revitalisation Plan for Prime Industrial Precincts. The Digital
Economy Strategy, which will assist Council in positioning the City to maximise the benefits
of the National Broadband rollout, is also considered in the draft Community Plan.
The consultation for the Community Plan has identified support for an emphasis within the
City of working to support strong local business, particularly small to medium enterprises. A
number of respondents in the consultation process identified opportunities to promote
tourism, including an emphasis on heritage and culture tourism. The need for Council to
support and encourage local business by facilitating access to new technology and
advocating for high speed business‐to‐business connectivity was also highlighted, in
particular highlighting the potential of the NBN, supported by education and training for the
business and general community.
The consultation included comments on the possibility of incentives to attract new
businesses to the City, particularly emphasising sustainable green businesses.
The region was seen as having advantages in terms of proximity to the airport, mining
services and defence industries around Techport and the central business district.

Hudson Howells | January 2013 Page 25
City of Charles Sturt – Economic Development Strategy
2.6 Overview of Previous Research
The City of Charles Sturt has undertaken some effective studies that provide information to
inform the development of a strategic approach to economic development in the City.
Blandy, AustralAsia - Assessment of the Economy of Charles Sturt (2010)
The most focussed of these, in an economic development context, is the AustralAsia -
Assessment of the Economy of Charles Sturt (2010). This report concluded that the future
economic prospects of Charles Sturt over the next few decades is jobs growth in the range of
9,000 – 25,000, with the outcome that will be achieved depending on the success of Charles
Sturt’s economic development strategy. The conclusion is that there will be diversification
towards smaller scale production units and services, and that this will suit the pattern of
residents’ skills development.
The report recommends a proposed strategy that focuses on:
• Having a regional focus that incorporates a hybrid Charles Sturt/Salisbury/Prospect
strategy that builds on the skills and industrial diversity of Charles Sturt’s residents
and access to high‐capacity fast broadband, leveraged by newly created advisory
and collaborative arrangements.
• Supporting competitive, high quality, small businesses, facilitated by:
o reducing the costs of doing business in Charles Sturt.
o provision of on‐line government for businesses.
o provision of on‐line training in how to run a small business.
• Helping businesses to secure Air Warfare Destroyer and future Submarine Project
contracts – significant long term projects occurring in neighbouring Port Adelaide.
• Creating a significant health precinct based around the Queen Elizabeth Hospital and
the contiguous area.

Hudson Howells | January 2013 Page 26
City of Charles Sturt – Economic Development Strategy
A focus on maximising opportunities from defence projects is one of the recommendations
in the AustralAsia report. The desire of the Commonwealth Government to bring the budget
back to surplus brings into question as to whether these opportunities will be at some risk in
the short and long term. It is therefore critical that industry development opportunities that
extend off the opportunities provided by the larger defence projects are identified and
developed.
Similarly the AustralAsia report identifies opportunities for health related services to be built
around the Queen Elizabeth Hospital. It is suggested that health related services, and indeed
products are likely to be a growth area, but given the implications of state government
investment in the new RAH, and the nature of the health sector identifying opportunities in
this context are likely to need to be more broadly spread than just those around the Queen
Elizabeth.
In addition to the opportunities identified in the AustralAsia report, in more recent times
there have been opportunities associated with South Australia’s mining prospects. Despite
recently announced delays in the Olympic Dam project, there is a range of other projects still
in progress, and more evolving. The SA Government’s Major Developments SA Directory
2010 indicates that there are total development projects nearing approval of close to $80
billion. Minerals and energy resource projects make up $36 billion, of which over half is in
the Olympic Dam expansion. The directory identifies some 60 mining and energy projects
additional to Olympic Dam with a value over $270 million each in prospect which will create
of the order of 50,000 person years of employment over the project lives. While current
economic conditions may see some of that activity deferred, it could be recommended that
there is some attention given to identifying opportunities around SA mining projects that
could be serviced from the Charles Sturt area, and linking that to a national and international
focus. The Charles Sturt region has access to air, rail and road transport to northern South
Australia which should provide some advantages in this respect.
Employment Revitalisation Plan
The second major recent study of relevance is the Colliers – Employment Revitalisation Plan
(2011). The scope of this study was to identify a priority precinct from the nine Prime
Industrial Areas (PIAs) identified in the Industrial Land Strategy and to prepare a (replicable)

Hudson Howells | January 2013 Page 27
City of Charles Sturt – Economic Development Strategy
Employment Revitalisation Plan for that precinct. The City has of the order of 560 hectares
of industrial land scattered across 22 precincts. The analysis in the report concludes that
nine of the 22 precincts (Hindmarsh, Royal Park, Hendon, Port Rd/South Rd corner,
Woodville North, Athol Park, West Croydon/Kilkenny, Beverly and Arndale are prime
industrial precincts, nine serve a clear industrial purpose (Cheltenham, Albert Park, Tapleys
Hill Road, Allenby Gardens, Welland, Bowdon/Brompton, Kidman Park North, Kidman Park
South and East Terrace). The remaining 4 precincts it argues are best suited to an
alternative use (rezoning) and include Torrens Road, West Lakes, Seaton and Devon Park.
As noted earlier in this report, the opportunity is provided by under utilisation in some of
these existing precincts because of longer term employment declines, as manufacturing has
reduced share of activity in the state and as heavier industry moves to less intrusive
locations.
The report, using a multi‐criteria assessment approach, identified three precincts as the
most prospective for employment revitalisation, namely:
• Hendon ‐ reasonable scale, proximity to both the Grange rail line and the proposed
West Lakes tram line and the beachside suburbs’ workforce, moderate intensity of
existing enterprise and the second largest average assessment size of all PIAs.
• Athol Park, which is a large precinct with a lower level density of enterprise, an
average assessment size close to the mean, excellent (and recently much improved)
arterial road transport access but problematic local access, an often poor urban
character and a set of Development Plan policy settings that need review.
• Beverley, which has scale, both as to its size and as to the number of existing
enterprises, has a relatively high density of development, is on Port Road, close to
the rail line and central to the Council area, is highly accessible both for transport
and workforce but has potential upside for local access, has a relatively poor urban
character with great potential for improvement and is midway between Bowden
Village and St Clair/Woodville West, where residential infill and renewal is either
underway or pending.

Hudson Howells | January 2013 Page 28
City of Charles Sturt – Economic Development Strategy
The review assessed that Beverley presented the best option and warrants designation as
the Priority Precinct.
It is critical to note that the report concludes that providing the infrastructure will not be
sufficient to achieve the desired outcomes. It must be in conjunction with an economic
development strategy ‐ a perspective that provides strong support for this initiative. The
report suggests that the urban and economic development plans and programme must run
in parallel, with a focus on:
• Setting the task of revitalisation in its broader economic context.
• Using regional leverage to address higher order economic initiatives.
• Supplementing regional efforts with local industry programmes, including a high
level of engagement with local industry.
• Recognising and support the rising tide of SMEs, including through on‐ground
mentoring and support.
• Facilitating economic renewal and modernisation of Beverley through renewal and
modernisation of the Development Plan.
• Addressing infrastructure shortcomings so as to remove bottlenecks to success.
• Improving the local environment so as to make Beverley more attractive to
contemporary enterprises and its increasingly knowledge based workforce.
The report recommends a focus on what it calls “entrepreneurial precincts” which supports
small businesses rather than targets particular markets or products.
Hudson Howells | January 2013 Page 29
City of Charles Sturt – Economic Development Strategy
Hugo and Harris (University of Adelaide) - Charles Sturt Demographic and 30 Year Plan
Analysis Report.
The third major report was prepared by Hugo and Harris (University of Adelaide) - Charles
Sturt Demographic and 30 Year Plan Analysis Report. This report’s major conclusion was
that Charles Sturt has been subject to significant population decline, amounting to nearly
4,000 persons in the decade to 1996, and in next decade only 47% of this loss has been
recovered. Additionally, older age groups have increased in size, meaning that the
proportion and absolute numbers of younger groups has declined substantially. They
conclude that this pattern is expected to continue without significant intervention.
They note that intervention is expected under the auspices of the 30 Year Plan, which
includes ambitious population targets (aggregate and in a relative sense in Charles Sturt).
Hugo and Harris note that “For Charles Sturt, the employment and population growth goals
of the 30 Year Plan offer prospects that are exciting and which are worth seeking.
Principally, the Plan offers new blood for the area and the prospect of significant
replenishment at the younger levels of its age structure”. Local government is required to
facilitate the location of that growth within its boundaries.
Population Statistics Australian Bureau of Statistics 2011 Census
In 2011, the City of Charles Sturt had a total population of 104,981 and grew on average over
the last five years at a rate of 0.9% per annum . The Australian Bureau of Statistics 2011
statistics show the City of Charles Sturt had larger proportions of people aged between 35
and 54 years (28.1%). This group is more likely to purchase apartments in Bowden or other
redevelopment and infill areas.
One of the City’s greatest assets is its cultural diversity. The greatest representation of
people born overseas in Charles Sturt were the United Kingdom (4.8%), Italy (3.7%), India
(2.0%), Greece (1.9%), Viet Nam (1.8%), and China (1.0%). The largest increase was in India
born which rose to 1,557 people, and represented an increase of 266.2%. The City of
Charles Sturt was one of the areas of choice for people born in India.

Hudson Howells | January 2013 Page 30
City of Charles Sturt – Economic Development Strategy
People born in China also had a large proportion of people less than 25 years (34.5%) but
were more likely to be in the 15‐24 year age cohort than the 0‐14 year age cohort when
compared with people born in India. Of people born in China, 36.5% were aged between 25
and 44 years.
In 2011, 27.5% of the City’s population attended an educational establishment compared
with 29.4% of the population of Greater Adelaide, a slight decrease from 2006.
Attendance at a university has increased in both number and proportion from 2,175 people
(3.7% of the population) in 2006 to 4,645 people (4.4% of the population) in 2011, and is
slightly lower than the Greater Adelaide proportion of 5.0%.
Tourism Opportunities
The consulting team also reviewed the internal draft discussion paper Opportunities for
(Cultural) Tourism in Charles Sturt (2008-2011). Given the community feed back in the
consultation re the Community Plan, the economic development strategy needs to consider
the potential for tourism in the area. The Adelaide Regional Tourism Profile June 2010/12 3
show that in 2010/12 the Adelaide region received:
• 3.6 million domestic day trips (>50 km round trip).
• 2.4 million overnight visitors ‐ 54% of overnight visitors were interstate tourists and
30% intrastate tourists.
• Of the overnight tourists, 24% were business visitors, 33% were ‘Visiting Friends and
Relatives’ (VFR) and 32% were visiting for holiday/leisure purposes.
There are a number of sites to facilitate tourism within the Council region including sporting
facilities, entertainment facilities, general recreation areas and beach and coastal areas.
The region has 9 major accommodation providers as follows:
3 The Adelaide Regional Tourism Profile June 2010/12 , South Australian Tourism Commission
September 2012

Hudson Howells | January 2013 Page 31
City of Charles Sturt – Economic Development Strategy
Adelaide Luxury Beach House High‐end holiday rental accommodation,
Henley Beach
Lakes Resort Hotel 4.5 star, largest hotel accommodation
provider in Charles Sturt
Lake Shore apartment 2 bedroom, self contained holiday
accommodation, West Lakes
Beachside Holiday Units Self contained accommodation, Seaview Road,
West Beach
Esplanade Apartments Self contained apartments, Seaview Road,
West Beach
Discovery Holiday Park ‘Adelaide
Beachfront’
Semaphore Park, camping, villas, cabins
SeaVista Holiday Suites and
Apartments
15 self contained units, Seaview Road, West
Beach
Western Gulls Self contained accommodation, West Beach
Queen Street retail precinct in Croydon is highlighted as a shopping destination by the SA
Tourism Commission in its Magic in Your Own Back Yard campaign. Queen Street, Henley
Square and other precincts have the potential to develop as significant tourism attractions in
their own right.
2.7 Strategy Development Challenges
While the proposition has been made above that there is a need for Local Government to be
involved in facilitating economic development, there are some significant challenges present
to ensure that it is a wise use of scarce Council resources. The challenges include:
1. There is no right answer as to what is a good strategy
There are aspects of what will make a strategy a good strategy. These basic factors include:
• It will be well grounded – understanding the environment, the opportunities and the
challenges, and in this context will be region specific.

Hudson Howells | January 2013 Page 32
City of Charles Sturt – Economic Development Strategy
• It needs to be implementable – it needs to have actions that can be identified and
outcomes that are measurable.
• It needs to be targeted – to identify core actions that can deliver value.
• It needs to be flexible – to consider responses to the changing environment.
However, as noted above, there are many choices that must be made that will inform the
structure of the strategy, and different choices (which are not right or wrong) will lead to
different directions within the strategy. In short, it is impossible to look at other Councils
and say that strategy is a good one, and that strategy is a bad one. It must be region specific
and be based on the decisions the region is prepared to make. More aggressive strategies
have the potential to create greater outcomes, but at greater risk and cost – and so they
need to be well defined and well argued.
2. The strategy and commitment must be long-term, but this will be required in the face of
short term (and unprecedented) uncertainty
Even since the report of AustralAsia, there have been substantial changes in the economic
environment and uncertainty as to where policy would be best directed. Australia is faced
with a two speed economy that is certainly impacting on the City of Charles Sturt. With
current economic policy the high probability is for a high value of the $A dollar against the
$US – and despite some recent downward pressure it does not look like it will drop to the
levels of the 1990’s and 2000’s in the near future. It should also be noted that the increase
of the $A against the Euro and the Chinese RMB and Trade Weighted Index has been about
half that of the US dollar as shown in the following table (data up to November 2012)

Hudson Howells | January 2013 Page 33
City of Charles Sturt – Economic Development Strategy
Table 4: Index of A$ Exchange Rate
Source: RBA Web-Site Statistics Table F11, December 2012
Business development requires investment. AustralAsia notes in its report, as many have
before, that the engine of growth is likely to be small business. But as illustrated below –
attracting investment into small business at present is difficult with significant uncertainty,
limited sources of equity capital (profits are generally low) and tight credit availability. As
Tables 5 and 6 show below, small business in particular is facing high funding costs (up to the
end of 2012) with rates as high as the much stronger economic times of the mid 2000’s.
One of the opportunities linked to high interest rates and exchange rates is that it reinforces
an interest by investors in Asia with respect to opportunities in Australia. The political
stability and advantages in terms of property ownership (for example property ownership
rights in China are limited to 70 years) have seen strong interest from Asian investors.

Hudson Howells | January 2013 Page 34
City of Charles Sturt – Economic Development Strategy
Tables 5 and 6
Source: RBA Web-Site Statistics Table 5, December 2012.
So it is clear that the competitiveness of Australian manufacturing will be constrained by the
value of the dollar – and the capacity to invest will be constrained by interest rates and
borrowing capacity. Industry development opportunities will therefore depend heavily on
maintaining competiveness despite the interest and exchange rate pressures. In many ways
this supports that Council’s economic development strategy must include support to ensure
that business plans are well formulated, provide for good access to communication
networks, including broadband and transport options, and have access to a skilled labour
force to compete in high value added manufacturing.
3. The public sector is facing significant financial limitations and expenditure to support
economic development activities faces many competing needs
There are many activities challenging for the limited pool of public sector funds, and this is
especially difficult for local government due to limited funding sources (heavily dependent
on rate revenues and on commonwealth grants). Implementing anything other than a basic
economic development strategy will carry some costs, and as identified above will also carry
some risk. In this context, it is critical that the economic development strategy has
acknowledged targets and that the impact back on the financial sustainability of Council is
clearly understood.

Hudson Howells | January 2013 Page 35
City of Charles Sturt – Economic Development Strategy
Growth in the number of businesses and increasing the economic output of local businesses
will be one of the most effective strategies to expand and secure the rate base of the City. It
will also provide residents with a greater number and diversity of jobs and opportunities for
education and training.

Hudson Howells | January 2013 Page 36
City of Charles Sturt – Economic Development Strategy
3. STAKEHOLDER CONSULTATION
Stakeholder consultation was correctly viewed by Council as essential input to formulation
of the economic development strategy and to securing buy‐in and ongoing contribution from
the business community.
A Consultation Template was prepared and approved by Council to guide all meetings which
specifically sought input from stakeholders on:
• Council’s role in economic and industry development in the region.
• Major economic and industry development opportunities and threats for the region.
• Suggested actions for Charles Sturt Council to promote regional economic
development.
Over 40 organisations and individuals (Appendix 1) were consulted across the region
covering the following industry sectors:
• Health
• Education & Workforce Training
• Automotive
• General Manufacturing
• Tourism
• Sport and Recreation
• Entertainment
• Hospitality
The consultation strongly supported Council’s involvement in economic development but
the far majority of organisations saw Council’s role as one of providing the best environment
for economic development along with value adding to State and Commonwealth
Government initiatives. Risk taking through involvement or investment in commercial
activities was generally viewed as not appropriate for Council involvement.

Hudson Howells | January 2013 Page 37
City of Charles Sturt – Economic Development Strategy
This section describes the key issues, opportunities, threat and suggested actions identified
during the stakeholder consultation undertaken during the second half of 2012 and is
summarised below by industry sector. It is important to note that the issues and proposals
contained in this section represent stakeholder feedback and are not necessarily those of
the consultants and priorities for incorporation into the Economic Development Strategy.
3.1 Recreation and Sport
• The Charles Sturt Council region is host to some of the State’s major sporting and
event facilities and sports teams including:
o Entertainment Centre
o AAMI Stadium and the Adelaide Football Club
o Hindmarsh Stadium and Adelaide United
o Adelaide Arena (Findon) and the Adelaide 36ers
o West Lakes and Rowing facilities.
o Royal Adelaide and Grange Golf Courses.
In addition to these assets within the City, there are immediate/contiguous assets
that complement these assets including:
o Adelaide Shores sporting grounds and tourism accommodation (which is in
both West Torrens and Charles Sturt).
o Adelaide Airport.
o Kooyonga Golf Course.
These assets represent an economic strength and competitive advantage that no
other metropolitan Council can currently match, and could be leveraged for
economic development outcomes. The City could be recognised and promoted as
the ‘Sporting Hub’ of Adelaide. The extension of public transport facilities into the
region in coming years could strengthen this competitive advantage. The advantage
could be further strengthened by:
o Adding other assets such as sound shells and stage arenas.

Hudson Howells | January 2013 Page 38
City of Charles Sturt – Economic Development Strategy
o Improving the public realm around these assets (e.g. street scaping)
o Appealing to Adelaide tourists (day‐trippers) along with interstate and
overseas tourists.
o Partnering with other events (e.g. The Fringe) to attract events to the region.
o Attraction of new events to the region.
• An ‘Asset Register’ of City facilities, number of seats, locations, capabilities, etc.
could assist organisations with attracting and planning for major events.
• The relocation of AFL to Adelaide Oval will impact activities at AAMI Stadium.
However, the associated redevelopment of the site and contiguous areas will have
its own jobs and incomes impacts for the City. This should be considered in the
context of the Westfield’s West Lakes redevelopment and opportunities for a major
Precinct Master Plan.
• Hindmarsh Stadium (owned by the State Government) is an underutilised facility
with some very dated assets and there is an opportunity for a shared facilities
strategy across sports/events (e.g. soccer, football, training, etc.), including the
attraction of new events, that would enable/encourage the update and
maintenance of the regions assets.
• Golf Tourism was identified as a major regional opportunity given the three major
sand belt courses in the western suburbs, two of which are in the Charles Sturt
Council area – Royal Adelaide and Grange (the third is Kooyonga which is located in
the City of West Torrens). Could be promoted as the North West Adelaide Sand Belt.
The West lakes Golf Club, formerly the Riverside Golf Club, could also be considered
for inclusion. This initiative is currently being developed in association with Tourism
SA including branding and website strategies. There is an opportunity for the City of
Charles Sturt to work with the clubs to attract sponsorship for major events that
receive international television coverage, especially in Asia. For example, the US
Seniors Tour currently being pursued by the Grange Golf Club (and broadcast to 41
countries worldwide). The benefits to Charles Sturt from such a strategy would
include:

Hudson Howells | January 2013 Page 39
City of Charles Sturt – Economic Development Strategy
o Promotion of Charles Sturt as an economic destination for business,
investment and trade throughout Asia.
o Additional spend on goods and services by people attending events
generating gross regional product (incomes) and jobs.
o Use of golf and events for business networking events.
o Reinforcement of the region’s recreation and sporting strengths.
• There is an opportunity to develop export services in Sports Sciences given the
extensive sporting organisations and facilities in the region.
3.2 Tourism, Hospitality and Entertainment
• Adelaide Shores is a major tourism destination for a range of holiday and sporting
events. Adelaide Shores and Council recognise a major opportunity to
collaborate/partner on initiatives that will benefit both organisations. These include:
o Promotion of Charles Sturt tourism assets to visitors to Adelaide Shores
including, for example, directional signage to Henley Square for vehicles and
bike riders departing Adelaide Shores. A bike strategy could be implemented
for movement of visitors between Adelaide Shores and Henley Square.
o Adelaide Shores could partner with Charles Sturt private businesses for
complementary/cross promotions.
o Improvements to Military and West Beach Roads – image, signage, safety,
etc.
• Visitors to the region (e.g. to Hindmarsh Entertainment Precinct) should be
encouraged to stay longer and to sample other entertainment and hospitality
offerings at Hindmarsh. Some restrictions to outdoor dining exist along Port Road in
the entertainment precinct (e.g. the need for bollards) which, if addressed, could
assist develop a vibrant hospitality precinct to complement events at the
Entertainment Centre. Other issues, such as traffic access, public lighting,
landscaping, parking facilities and ventilation systems which, if improved, would also
contribute to improved vibrancy of the precinct. Port Road is Council’s ‘Gateway’
and should reflect an appropriate image.

Hudson Howells | January 2013 Page 40
City of Charles Sturt – Economic Development Strategy
• Connections between the Entertainment Precinct and the developing Riverbank
Precinct (adjacent Bowden Village,) including appropriate security and lighting,
would greatly enhance connectedness to the City of Adelaide and opportunities for
ongoing entertainment and hospitality development. The Adelaide Oval
redevelopment will then represent an opportunity for the Entertainment Precinct to
promote ‘park and eat’ facilities for major sporting events at the oval.
• Security and parking in the Entertainment Precinct, especially for female workers,
needs to be improved.
• ‘Branding’ and promotion of the Entertainment Precinct, including the attraction of
two or three more significant businesses, is a long term opportunity to attract
visitors, workers and residents for the new residential developments.
• Link the area physically and economically to the Thebarton Biotech Precinct.
• A need was identified for staff training to meet the needs and expectations of the
increasing Asian tourism in the region (especially for golf tourism).
• Concepts proposed to further develop tourism and tourism assets in the region
included:
o Interpretation of the Tennyson Sand Dunes
o Coast Park with beach access
o Improved public transport to Henley Beach
o Off road bike facilities
o Promotion of City Bikes e.g. Pick up fee bikes in the City and ride along the
River Torrens Linear Park to Henley Square. The Linear Park connects the
City to the sea.
o Research and development of a strategy for the attraction of major sporting
events – e.g. National Rowing Championships; Surf Lifesaving Events; etc.
There needs to be an integrated approach to maximise opportunities for
tourism, accommodation, hospitality, etc.
o Gulf cruises from Grange
o Strategy to attract cruise ship visitors
o Attract one or more iconic events.

Hudson Howells | January 2013 Page 41
City of Charles Sturt – Economic Development Strategy
• Accommodation facilities, while perceived as a weakness, represent an opportunity
for future investment.
• Henley Square could become an alternative to Glenelg in terms of attraction of SA,
interstate and overseas tourists.
3.3 Manufacturing
• Charles Sturt has traditionally been known as a manufacturing location with
automotive and other industries having grown around the now closed GMH’s car
manufacturing facility at Woodville. This resulted in a vibrant automotive
components manufacturing sector which today however is suffering declining
fortunes along with Australia’s declining car manufacturing industry. Opportunities
to diversify production along with exploration of export and offshore investment
opportunities represent the best prospects for these firms to survive and prosper.
• There is an opportunity to improve access to Council contracts for Australian made
cars (components made in the region) and other products manufactured in the
region.
• Options exist for the use of underutilised industrial land which should be considered
by Council.
• Significant potential exists for the consolidation and export of food product,
especially to China and SE Asia. Council support and/or collaboration with the State
Government on trade delegations and missions could assist relevant exporters in
this area.
• Sister City/Regional relationships could also assist international business to business
trade and investment opportunities.
• There is interest from some companies in the establishment of a Business Leaders
Group that would work with Council on major economic development initiatives.

Hudson Howells | January 2013 Page 42
City of Charles Sturt – Economic Development Strategy
• Several manufacturers would like Council to have a ‘buy local’ policy instead of
buying competitor products from companies outside the City. This could extend to
the G6 group of Councils.
• There is also an opportunity for inter‐regional trade which could be encouraged by
Council through business development functions.
• Council should be more pro‐active in visiting City businesses and understanding their
needs and concerns.
• Improved networking between manufacturers, schools and training providers,
including career nights, could lead to better employment opportunities for local
students.
• Work with the State and Commonwealth Governments to assist local Advanced
Manufacturing firms.
3.4 Health
• A Health Precinct has evolved around the Queen Elizabeth Hospital (Woodville and
Port Roads) and has significant potential for further industry development.
• Relocation of the RAH to the North West end of Adelaide, combined with the
Thebarton Biosciences Precinct, offers opportunities for further industry
development in the region for medical/health services and products.
• The regions ethnic diversity represents a strength in the attraction of health
professionals due to the diversity of health issues that need attention.
• Health products often incorporate advanced manufacturing processes and are
consistent with the State’s economic strategy.
• Preventative Health and Wellness are growth health services with significant cross
overs to health tourism and recreation and sport, and could be encouraged in the
region to complement the regions sporting assets. The benefits to the community, in
terms of lower costs and savings, could be significant.

Hudson Howells | January 2013 Page 43
City of Charles Sturt – Economic Development Strategy
• There are opportunities to pilot/introduce new technologies into health service
delivery including, for example, the use of e‐health and videoconferencing to deliver
services.
• There is potential for health tourism and health education including, for example,
the education of health professionals from overseas.
• The role of Council in the promotion of wellness and preventative health could focus
on the attraction of Commonwealth and State funding for major initiatives,
promoting the regions healthy image and the attraction of health businesses to
locate in the precinct to build on the existing strengths in this industry.
• Other key opportunities identified included:
o Development of preventative health strategy along with a longitudinal study
to assess its effectiveness.
o A pilot project utilising technology to improve aged health care services.
o Consistent with the region’s other strengths, the development and
promotion of the region for sports injuries prevention and treatment.
o The attraction to the region of skilled health care workers to build on the
existing strengths.
3.5 Education and Training
• The region is relatively safe and secure and represents an attractive environment for
students and student accommodation.
• Given the region’s sporting assets, there is an opportunity to develop sports and
sports injury training services for Australian and overseas teams, individuals and
governments.
• Young people at school in the region could be encourages, perhaps by Council, to
consider careers in major regional industries.
• South Australian Sports Institute (Office of Recreation and Sport).

Hudson Howells | January 2013 Page 44
City of Charles Sturt – Economic Development Strategy
3.6 Urban Development
• Residential land development opportunities in the regions could be improved by
Council identifying land surplus to requirements in other industry sectors (e.g.
underutilised industrial land north of St. Clair) and rezoning for appropriate housing
development.
• Council should be at the leading edge of developments in technology, water, safety,
parks, etc.
• Residential security is becoming a major issue in new developments and is an area
that Council can influence (lighting, activity, etc.) to improve the City’s attractiveness
for home buyers.
• Council could accelerate residential development by entering Joint Venture
arrangements with developers in priority areas such as affordable housing.
• A reduction in planning and development approval times could greatly assist
industry productivity and profitability.
3.7 General
• Port Road, as noted earlier, is the gateway/driveway to the City of Charles Sturt and
currently does not present the Council region in a manner acceptable to industry. It
should reflect an image and brand attributes that are consistent with the region’s
strengths and economic potential.
• The region needs to be marketed (along with suitable housing product) in a manner
that attracts young people (singles and young families) back into the region to
address the ageing profile of the City.
• Council should focus on facilitation of future economic growth with a particular
focus on infrastructure appropriate for development and improved transport
efficiency. This is particularly important around Adelaide Airport where there is
continued economic/business development and increasing traffic demand.
Hudson Howells | January 2013 Page 45
City of Charles Sturt – Economic Development Strategy
• There is an opportunity for collaborative marketing of the regions involving the
region’s major organisations – e.g. Council, Adelaide Airport, Adelaide shores,
Adelaide Football Club, Adelaide Entertainment centre, etc.
4. CITY ECONOMIC DEVELOPMENT STRATEGY
This section of the report details the recommended Economic Development Strategy for the
City of Charles Sturt. The strategy is based on the preceding research and consultation
including Council’s other strategies and plans and discussions with Council and its executive
on Council’s role in economic development.
4.1 Councils Role in Economic Development
One of the challenges for Council is to define its role in economic development so that it can
decide how it should address the many strengths, weaknesses, opportunities and threats
(key issues) identified in the research and consultation.
The primary constraints on Council are resources (human and financial) and exposure to risk
in economic development transactions. Council administration has expressed a preference
that during the life of this Economic Development Strategy that it will minimise resource
demands and its risk exposure by:
• Focussing on improving the physical and business environment for economic
development.
• Adding value to and participating in regional, State and Commonwealth Government
economic development initiatives.
• Collaborating with contiguous economic development regions.
In adopting this role, administration believes that:
• The pursuit of commercial economic development initiatives, either individually or in
joint venture with the private sector (e.g. sole or partnership participation in
Hudson Howells | January 2013 Page 46
City of Charles Sturt – Economic Development Strategy
residential, commercial or industrial developments) should be minimised, unless
Council has expressed a desired outcome that aligns with the Community Plan.
• National or international promotion of Charles Sturt and its economic development
opportunities other than by value adding to or collaborating with other regional,
State and Commonwealth Government initiatives.
• The provision of business advice and services.
It is recognised here that Council has extensive demands on its financial and human
resources through the development and implementation of other Council strategies
including, for example:
• The City Strategic/Community Plan; and
• The Digital Economy Strategy.
Based on the region’s competitive advantage (or unique selling proposition), the Economic
Development Strategy must complement these and add value without exposing Council to
unreasonable resource demands and financial risk. The Economic Development Vision,
Objectives and Strategies that follow are therefore deliberately conservative in approach
and seek to transition Council over time to a greater role in economic development.
4.2 Competitive Advantage
The research and consultation for this project clearly identified that the Council region has,
over time, developed a major strength and competitive advantage in the provision of
sporting and entertainment facilities and services. The City can no longer claim to, or be
recognised as, the traditional manufacturing stronghold that underpinned its social and
economic development throughout the 20th Century. As demonstrated by 2011 Census data
in Section 2:
• Manufacturing employment declined from 10,238 to 5,541 between 1996 and 2011.

Hudson Howells | January 2013 Page 47
City of Charles Sturt – Economic Development Strategy
• Machinery and Equipment manufacturing employment declined from 4,481 to
1,393 between 1996 and 2011.
• Entertainment, Recreation, Personal Services and Hospitality employment increased
from 2,503 to 4,944 between 1996 and 2011, reflecting the gathering strength of
this sector in the regional economy despite the Global Economic Crisis.
• Education and Health (Other Community Services) were also strong performers
between 1996 and 2011 increasing from 5,817 to 8,513 employees.
Clearly the City is in transition from a manufacturing to a services based economy and
Council’s Economic Development Strategy must now reflect this transition and focus on
building on its competitive strengths.
Charles Sturt’s proximity to the City, Airport and the beach underscore the strength of its
sporting and entertainment facilities and services which are further complemented by
facilities in contiguous Council regions (e.g. Kooyonga and Adelaide Shores, which is in both
West Torrens and Charles Sturt) making this a potential Western Region of Adelaide
competitive advantage.
As a major competitive advantage, sporting and entertainment facilities and services offer
Charles Sturt outstanding potential to further develop associated industries that have high
job and income prospects including:
• Tourism and hospitality.
• Education.
• Health.
• Advanced (high value added) manufacturing.
The key to working this competitive advantage is acceptance by Council, industry and other
stakeholders that the Council region (and possibly the broader Western region) is in
economic transition from a manufacturing base to a services base (as evidenced by the 2011
census data) and that its competitive advantage in the services sector should be the driver of
future economic strategy and industry development initiatives. Manufacturing should not be

Hudson Howells | January 2013 Page 48
City of Charles Sturt – Economic Development Strategy
ignored in this context, but the focus should be on high value added manufacturing where
companies compete on technology, service, etc and not on price underpinned by low cost
land and labour.
4.3 Economic Development Vision and Pillars
Supported by the research and consultation undertaken for this project, the following
Economic Development Vision is recommended for the City of Charles Sturt:
By 2018, the City of Charles Sturt will be recognised as Adelaide’s sport, recreation
and entertainment hub supporting the development of value added tourism,
education, health and advanced manufacturing industries.
Council will facilitate this vision through the following four key pillars:
• Pillar #1 - Promotion ‐ Development and promotion of an economic brand and
associated imagery.
• Pillar #2 – Digital Economy, Education and Training ‐ Assist businesses to adopt
advanced communication technologies and promote education and training.
• Pillar #3 - Precincts and Clusters – Development and support for precinct and cluster
development.
• Pillar #4 - Collaboration ‐ Collaboration with regional (Western), State and
Commonwealth agencies on investment, trade and tourism initiatives.
The Vision and Pillars are represented by the following proposed economic development
framework:

Hudson Howells | January 2013 Page 49
City of Charles Sturt – Economic Development Strategy
4.4 Economic Development Strategies and Implementation
The following Economic Development Strategies are recommended based on the preceding
Vision and Objectives:
Pillar #1 – Promotion
Development and promotion of an economic development brand and associated imagery
Recommended Strategies
• Build an economic development brand, marketing strategy and imagery around:
o Sport, recreation and entertainment.
o Sports sciences, training and education.
o Health and wellness.
o Entertainment and hospitality.
o Transition to a younger demographic.
o The Digital Economy Strategy.
• Build an Economic Development Portal on Council’s website for communicating the
Economic Development Strategy (trade, investment and tourism opportunities),
promoting major initiatives and receiving feedback from the community on the
strategy and its implementation.

Hudson Howells | January 2013 Page 50
City of Charles Sturt – Economic Development Strategy
• Promote investment, export and tourism opportunities in collaboration with State
and Commonwealth Government initiatives in priority markets including4:
o China
o India
o Indonesia
• Identify major State, national and international sporting events that could be
attracted to Charles Sturt and, in collaboration with the State Government where
appropriate (Events SA), market Charles Sturt to national and international event
organisers.
Pillar #2 – Digital Economy, Education and Training
Assist businesses to adopt advanced communication technologies and promote education
and training.
The City of Charles Sturt, Digital Economy Strategy, 2013 has 20 recommendations including
the establishment of an internal Digital Economy Taskforce to work through the
recommendations and develop an annual action plan. The Digital Economy Strategy has a
similar policy structure and is a subset of the Economic Development Strategy.
Recommended Strategies
• Implement the Digital Economy Strategy through the internal Digital Economy
Taskforce.
• The region’s changing demographic profile offers an opportunity to attract private
education facilities into the region.
• Upskill the local workforce through collaboration with education and training
providers.
4 The Australian Government’s Australia in the Asian Century White Paper has now been released. This document is a roadmap
to guide Australia to become a more prosperous and resilient nation, fully part of the Asian region and open to the world. It
notes Indonesia’s potential to become a global economic powerhouse and is included as a priority to complement the State
Government’s China and India Engagement Strategies.

Hudson Howells | January 2013 Page 51
City of Charles Sturt – Economic Development Strategy
• Advocate to State and Commonwealth Government to facilitate local employment
opportunities.
• Provide training models, standard contracts and links with local employment
agencies for large scale private sector and government developments.
• Initiate Career Nights at Council (subject to support from relevant State and
Commonwealth Agencies) in collaboration with major employers and regional
education and training institutions. The focus should include:
o Defence industry
o Mining industry
o Other advanced manufacturing especially health and automotive industries.
o Major urban development projects.
• Support initiatives that promote small business training. The majority of jobs growth
is expected to be in the Services Sector, and in primarily small to medium sized
businesses This sector will benefit from assistance in adapting to changes in the
broader business environment.
Pillar #3 - Precincts and Clusters
Development and support for precinct and cluster development
Recommended Strategies
• Consult with businesses in major precincts to develop cluster initiatives and identify
and initiate priorities for infrastructure upgrades that support the economic
development vision including:
o Develop a Health Cluster in Western Adelaide
o Support the Health Precinct around TQEH on Woodville Road
o Market the Digital Triangle (see Digital Economy Strategy).
o Entertainment and Hospitality – Hindmarsh/Bowden.

Hudson Howells | January 2013 Page 52
City of Charles Sturt – Economic Development Strategy
o Advanced (high value added) Manufacturing in Beverley, Findon, Hendon,
Athol Park and Royal Park – Focus on Automotive, Food, Defence and Mining
Industries.
o Establish and Promote Main Street Precincts – Woodville Road, Henley
Beach.
o Port Road to be established as a major entry statement to the region.
o Develop a Master Plan for Grange Road with residential and mixed uses.
• Work with the State Government to secure improved public transport infrastructure
to key event, tourism and employment nodes.
Pillar #4 - Collaboration
Collaboration with regional (Western), State and Commonwealth agencies on investment,
trade and tourism initiatives
Recommended Strategies
• Establish a Regional Business Leaders Group including, for example, organisations
consulted during formulation of this strategy. The Regional Business Leaders Group
to have responsibility for:
o Development, funding and implementation of a regional marketing strategy.
o Conduct of regular economic development and networking functions.
o Providing advice to Council on economic and industry development.
Industry consultation indicates that the leading target organisations should include
but limited to:
o Adelaide Airport
o Adelaide Entertainment Centre
o Adelaide Football Club
o Adelaide Shores
o Adelaide United
o Bio Innovation SA

Hudson Howells | January 2013 Page 53
City of Charles Sturt – Economic Development Strategy
o Channel 7
o Electrolux
o Festival City Wines and Festival Foods
o Healthfirst
o Hills Industries
o Precision Components
o ROH
o Royal Adelaide, Grange and Kooyonga Golf Clubs
o SA Health
o South Australian Sports Institute
o Toro Australia
o The Queen Elizabeth Hospital (TQEH).
• Investigate the potential for establishing a Western Alliance of Councils for Economic
Development incorporating the key elements of this Economic Development
Strategy. Priorities for collaboration in a Western Alliance should be those Councils
that can add value to the sporting, recreation and entertainment vision for the
region especially:
o The City of Adelaide
o The City of West Torrens
o City of Port Adelaide Enfield.
• Establish one Sister City/Region relationship with an international city/region
consistent with the City’s strengths/competitive advantages and State Government
priorities in China, India or Indonesia (reference the State Government’s China and
India Engagement Strategies 2012).
• Establish a partnership with Adelaide Shores for complementary/cross promotion of
tourism opportunities especially between Adelaide Shores and Henley Beach.
• Contribute funding and human resource support to major State and Commonwealth
Government investment attraction and export promotion initiatives.
• Promote and coordinate access to State and Commonwealth Government grant
funding for regional businesses. Particular attention should be given to coordinating
applications for regional funding and assistance from:

Hudson Howells | January 2013 Page 54
City of Charles Sturt – Economic Development Strategy
o The Commonwealth Government’s Asian Century Business Engagement
Plan.
o AusIndustry.
o Austrade (including promotion of the Export Market Development Grant
Scheme).
o TQUAL.
o Planned State Government initiatives in China, India and Indonesia.
Implementation Structure
To implement the Economic Development Strategy it is proposed to use existing officers
within Council. The Economic Development Strategy will be managed by the Urban Projects
Unit and coordinated by the Economic Development Coordinator, reporting to Council’s
Strategic Development Committee. Two internal administrative taskforces with terms of
reference would be established and would include:
• Marketing and Promotion – Investment, Export, Events, Tourism and Major Projects
(in collaboration with the Business Leaders Group).
• Digital Economy Taskforce.
An external Business Leaders Group is proposed to ensure that business leaders are involved
in the implementation of the Strategy and to harness their resources, while linking with
other levels of Government and the region. The Business Leaders Group (or Western
Business Alliance) would consist of approximately 20 local business leaders from Charles
Sturt or immediately adjacent Councils such as the Biotech Precinct or Adelaide Airport. The
Business Leaders Group would be based on the successful Northern Economic Leaders
Group established by the City of Salisbury. Consistent with the recommended strategy, a
Western Alliance of Councils will also be investigated and be implemented subject to
negotiation and agreement with contiguous western Adelaide councils. The proposed
implementation structure is shown on page 7 of this Strategy. The following maps indicate
the boundaries and key economic assets of the City of Charles Sturt and the Western Region
of Adelaide.

Hudson Howells | January 2013 Page 55
City of Charles Sturt – Economic Development Strategy

Hudson Howells | January 2013 Page 56
City of Charles Sturt – Economic Development Strategy

Hudson Howells | January 2013 Page 57
City of Charles Sturt – Economic Development Strategy
5. FUTURE ECONOMIC SCENARIOS AND KPI’s
This section of the report quantifies the expected impact that implementation of the
recommended Economic Development Strategy will have on the City of Charles Sturt
expressed as jobs and Gross Regional Product (or incomes). These forecast outcomes can be
used by the City as Key Performance Indicators to assess the effectiveness of the EDS
implementation.
5.1 Purpose of the Analysis
This analysis is undertaken to provide a context for alternative strategies for economic
development in the City of Charles Sturt by providing projections as to possible outcomes for
the economy as it moves forward. There is no such thing as a crystal ball, but by
understanding the relationships within an economy and the key drivers, it is possible to look
at future economic performance under given assumptions. Doing so enables policy makers
to understand what needs to be achieved. This has been undertaken in the past at the State
level in understanding the implications of the State Strategic Plan and is therefore an
appropriate approach at the local government level.
In the context of the City of Charles Sturt – as outlined in this report ‐ the traditional driver
of economic activity in employment terms has traditionally been manufacturing. This is no
longer the case and represents a significant challenge for policy makers in shifting to a new
economic development framework based on service industry development. This analysis
models a whole of economy scenario where those challenges remain in place, and then
considers the implications of various targets being achieved through policy intervention.
Appendix 2 details the economic modelling limitations of the methodology employed for the
analysis.
5.2 Methodology
The process employed in developing projections for the City of Charles Sturt economy
involves ‘shocking’ the underlying economic structure of the regional economy with the

Hudson Howells | January 2013 Page 58
City of Charles Sturt – Economic Development Strategy
exogenous factors that underpin the economy, acknowledging the trends in underlying
exports and other macroeconomic drivers, along with strategy targets.
The modelling framework used is an input‐output model, defined using 26 industry sectors.
This model has been developed by EconSearch, for the State Government (commonly known
as the RISE model) and is based on the 2007 period5, but has been forecast forward using
the 2011 Census data and the RISE model for the Western Suburbs has been used as the
base to develop a specific model for Charles Sturt Council.
This model depicts the economy at the current point in time. The model is shocked by the
‘forecasts’ of what might be considered ‘exogenous’ demand6 to trace the economy wide
outcomes consequent upon the interactions and to therefore determine employment by
industry outcomes. There are two levels of parameters involved in the projections:
• Parameters at an industry sector level – the key parameters defined by industry are
growth in the elements of final demand. These include:
o Exports out of the region – given recent and expected pressures in the
region and the description of the issues above , it is assumed for a base case
that:
§ Final demand for manufacturing product sold out of the region is
expected to decline.
§ It is assumed in the base or low case that the demand for services
out of the region grows at 1% per year – based around the median
population projects for the state (ABS Cat 3222, Sept 2008). This
presumes that the region maintains its relative role in terms of
service provision.
5 The RISE model has been developed by Econsearch, and is reported in “Economic and Environmental Indicators for
South Australia and its Regions, 2006/07” Report for DTED, March 2009 6 The elements of exogenous demand are “considered” to be based on items independent of what is happening
elsewhere in the regional economy – generally this includes exports, consumption from savings, and some government
expenditure.

Hudson Howells | January 2013 Page 59
City of Charles Sturt – Economic Development Strategy
Core trends - annual change in
"exports" 2012‐
2016 2017‐
2021 2022‐
2026 2027‐
2031 2032‐
2036
Manufacturing ‐5% ‐4% ‐3% ‐3% ‐3% Recreation and entertainment
services 1% 1% 1% 1% 1% Building and trade 0.5% 0.5% 0.5% 0.5% 0.5% Services 1% 1% 1% 1% 1%
o Labour productivity – It is assumed that there is an ongoing and underlying
improvement in labour productivity (value of production relative to
employment input) – and that this continued improvement will be necessary
to maintain regional competitiveness. This is assumed in the base case to be
0.5% per annum for secondary industries (manufacturing, agriculture) and
0.3% per annum for service industries.
• Parameters at an aggregate or macro level, including:
o Population – it is assumed the population will grow at 1.1% per annum in the
base case, with the over 65 component growing at 2%. Note that these
growth rates are supported through infill and are somewhat lower than the
Blandy report notes as required through the 30 Year Plan, in recognition of
the poor economic environment currently in play.
o Capital expenditure – the ratio of capital expenditure to exogenous final
demand in the City of Charles Sturt economy is 20% (from the City of Charles
Sturt input‐output table) and it is assumed that this ratio is maintained over
time.
o Government consumption – it is assumed that government consumption will
grow slightly behind the overall population levels for the city. This is
distributed over the sectors of consumption consistent with the 2011 tables.
o Import penetration – is assumed to increase at a similar rate to labour
productivity.
o Non salary incomes – this is the balance of spending linked to residents who
are employed outside the region, and to those inside the region.
The linkages in the model are summarised in the following diagram.

Hudson Howells | January 2013 Page 60
City of Charles Sturt – Economic Development Strategy
ABS Census employment data underpins the analysis, and the recent trends were outlined
earlier in the report.
5.3 Modelling the Base Case
Three models have been prepared to model the performance of the Charles Sturt Economy
over the next 25 years from 2011 to 2036. The three growth scenarios are all closely tied to
the rate of growth of the State. In all scenarios the share of jobs requiring no qualifications
continues to fall.
Table 7 below indicates the projections for exogenous demand based on the above
assumptions. These projections are used to shock the input output model of the Charles
Sturt economy (adjusted for import penetration and changing productivity – note that it is
assumed that increased labour productivity is reflected in increased real wages).
The core assumptions in the base case have been outlined above, and result in the following
estimates of exogenous final demand by industry. In short, the base case includes some
reduction in core activity in the period 2006‐2011, and then stabilising from that point.
Matrix of industry inter-relationships
Trend in Exports out of Region without Intervention
Policy Targets from Strategy
Projections of Value Added and Employment by Industry
Implications for Population and Wealth Outcomes
Labour productivity shifts
Import Penetration
Other Macro Economic Drivers (population not in
labour force)

Hudson Howells | January 2013 Page 61
City of Charles Sturt – Economic Development Strategy
Table 7: Projections of Exogenous Demand in City of Charles Sturt – Base Scenario
2011 2016 2021 2026 2031 2036
Ave Ann
growth (2011-
2036)
Agriculture 3.7 3.0 2.5 2.2 2.0 1.8 -2.8%
Forestry and Fishing 1.2 1.0 1.0 1.0 1.0 1.0 -0.8%
Mining 14.9 11.8 9.8 8.7 7.6 6.8 -3.1%
Food & beverage manuf 138.7 115.2 100.9 92.9 86.6 81.6 -2.1%
Wood & paper manuf 118.7 95.4 81.1 72.7 65.6 59.7 -2.7%
Machinery & Equipment 316.7 264.7 234.6 217.9 204.6 194.3 -1.9%
Metals, metal products 105.1 90.6 82.8 78.8 75.9 74.0 -1.4%
Non-metallic minerals 118.1 98.4 86.9 80.4 75.3 71.2 -2.0%
Other manufacturing 289.8 244.7 219.4 205.9 195.5 187.7 -1.7%
Electricity Gas Water 44.5 46.3 48.5 51.1 53.8 56.7 1.0%
Wholesale trade 315.0 325.5 340.1 356.9 375.0 394.4 0.9%
Retail Trade 284.6 298.7 317.4 337.6 359.2 382.2 1.2%
Accomodation, Cafes and Restaurants 262.2 275.5 291.0 307.3 324.4 342.4 1.1%
Building Construction 521.8 489.1 480.7 484.5 492.1 503.3 -0.1%
Construction trade services 155.1 155.9 160.6 166.9 174.0 181.9 0.6%
Transport 221.2 233.1 245.5 258.4 272.0 286.3 1.0%
Storage 86.2 88.8 93.6 98.6 104.0 109.6 1.0%
Communication 43.4 45.2 47.6 50.4 53.4 56.7 1.1%
Finance & business services 187.3 191.9 201.4 212.1 223.6 235.9 0.9%
Property Services 62.0 61.9 63.5 66.0 68.7 71.8 0.6%
Ownership of Dwellings 210.4 217.1 230.9 245.5 260.9 277.3 1.1%
Public admin & defence 141.7 143.7 151.8 160.3 169.3 178.9 0.9%
Education 190.8 194.2 205.5 217.4 230.0 243.3 1.0%
Other Community Services 442.5 450.7 477.0 504.8 534.2 565.3 1.0%
Cultural and recreational services 139.6 143.8 152.3 161.4 171.0 181.2 1.0%
Entertainment, recreation, personal services 130.7 134.7 143.0 151.8 161.1 170.9 1.1%
Total 4546.1 4421 4469 4592 4741 4916 0.3%
Annual Growth -0.6% 0.2% 0.5% 0.6% 0.7%
5.4 Economic Activity by Industry Forecast
Tables 8 and 9 indicate the results with respect to economic activity (GRP and employment)
as a result of shocking the model with the assumptions as outlined above.
As a general perspective, growth in employment comes in the personal and community
service areas, while there is limited growth (or decline) in manufacturing, agriculture etc.
The basic conclusion is that maintaining levels of final demand at the 2011 level will see an
ongoing shrinking of the economy, and this impact is likely to be spread across the economy
quite broadly. The basic link is that increasing productivity and increased import
penetrations require growth in final demand in order to see the economy grow. As
employment declines due to labour productivity increases, population decreases, and
therefore demand for non‐exported production (service industry particularly) decreases as
well.

Hudson Howells | January 2013 Page 62
City of Charles Sturt – Economic Development Strategy
Table 8: Projections of Gross Regional Product for City of Charles Sturt – Base Scenario
2011 2016 2021 2026 2031 2036 Annual
Change
2011-
2036
Agriculture 3.0 2.5 2.2 2.0 1.9 1.7 -1.8%
Forestry and Fishing 0.9 0.8 0.8 0.8 0.8 0.8 -0.3%
Mining 11.3 9.1 7.8 6.9 6.2 5.6 -2.4%
Food & beverage manuf 68.9 60.3 55.5 53.1 51.2 49.8 -1.0%
Wood & paper manuf 81.4 69.4 62.5 58.6 55.5 52.9 -1.3%
Machinery & Equipment 115.0 97.6 87.7 82.3 78.0 74.8 -1.3%
Metals, metal products 54.9 47.5 43.3 41.1 39.3 38.0 -1.1%
Non-metallic minerals 56.4 47.9 43.1 40.4 38.3 36.7 -1.3%
Other manufacturing 130.8 112.9 103.1 97.9 93.9 90.9 -1.1%
Electricity Gas Water 34.4 34.5 35.4 36.6 37.9 39.4 0.7%
Wholesale trade 205.4 204.4 208.1 214.2 221.2 229.1 0.6%
Retail Trade 230.4 235.1 245.1 256.9 269.7 283.5 0.9%
Accomodation, Cafes and Restaurants 134.5 139.3 145.9 153.1 160.8 168.9 1.0%
Building Construction 144.0 135.1 132.9 133.8 135.8 138.7 0.1%
Construction trade services 154.3 149.3 149.5 152.0 155.2 159.2 0.3%
Transport 125.0 128.2 132.7 138.0 143.7 149.9 0.8%
Storage 54.8 54.7 56.2 58.1 60.1 62.4 0.7%
Communication 68.2 67.5 68.6 70.4 72.5 74.7 0.5%
Finance & business services 269.6 263.2 265.7 271.2 277.8 285.4 0.4%
Property Services 98.5 95.6 95.7 96.9 98.5 100.3 0.2%
Ownership of Dwellings 232.2 237.1 250.0 264.2 279.4 295.6 1.1%
Public admin & defence 80.1 81.0 85.3 89.9 94.8 99.9 1.1%
Education 163.5 165.6 174.4 183.9 194.0 204.7 1.1%
Other Community Services 362.7 368.3 388.6 410.5 433.7 458.2 1.1%
Cultural and recreational services 74.3 75.4 78.8 82.6 86.7 91.1 1.0%
Personal Services 106 108 114 120 127 134 1.1%
Total 3061 2991 3033 3115 3214 3326 0.5%

Hudson Howells | January 2013 Page 63
City of Charles Sturt – Economic Development Strategy
Table 9: Projections of Employment Outcomes for City of Charles Sturt – Base Scenario
2011 2016 2021 2026 2031 2036 Annual
Change
2011-
2036
Agriculture 29.6 23.9 20 18 16 15 -3.4%
Forestry and Fishing 16 14 13 13 13 12 -1.3%
Mining 51 40 33 29 25 22 -4.0%
Food & beverage manuf 699 597 536 499 470 446 -2.2%
Wood & paper manuf 865 720 632 578 533 497 -2.7%
Machinery & Equipment 1497 1239 1086 994 919 859 -2.7%
Metals, metal products 582 491 437 404 377 356 -2.4%
Non-metallic minerals 312 258 227 207 192 179 -2.7%
Other manufacturing 2104 1772 1579 1462 1367 1291 -2.4%
Electricity Gas Water 130 128 128 129 130 132 0.1%
Wholesale trade 2421 2349 2334 2343 2360 2384 -0.1%
Retail Trade 4202 4183 4252 4347 4452 4565 0.4%
Accomodation, Cafes and Restaurants 1812 1831 1870 1914 1961 2009 0.5%
Building Construction 1203 1101 1056 1037 1027 1023 -0.8%
Construction trade services 2514 2403 2376 2386 2407 2437 -0.2%
Transport 1246 1262 1290 1325 1363 1403 0.6%
Storage 366 361 366 373 382 391 0.3%
Communication 482 471 473 479 487 496 0.1%
Finance & business services 2641 2547 2539 2559 2589 2626 0.0%
Property Services 475 455 450 450 452 455 -0.2%
Ownership of Dwellings 0 0 0 0 0 0
Public admin & defence 1246 1244 1294 1347 1402 1460 0.8%
Education 2398 2399 2495 2598 2706 2820 0.8%
Other Community Services 4839 4852 5057 5275 5504 5744 0.9%
Cultural and recreational services 626 627 648 671 695 721 0.7%
Personal Services 1685 1696 1761 1834 1911 1992 0.8%
Total 34444 33065 32953 33272 33739 34336 0.0%
These estimates of employment and Gross Regional Product outcomes also can be linked to
the implications for population, labour force participation and unemployment outcomes, the
projections of which are summarised below. The modelling reinforces that incomes per
employed person increase, but employment decreases. The population changes suggest that
unemployment rates increase and participation rates generally decline.

Hudson Howells | January 2013 Page 64
City of Charles Sturt – Economic Development Strategy
Table 10: Aggregate Employment/ Population Projection Outcomes – Base Scenario
2011 2016 2021 2026 2031 2036
Population
<15 16275 17014 17776 18562 19368 20196
15‐65 67120 70168 73312 76550 79877 83290
>65 18835 20795 22960 25349 27988 30901
Total 102230 107978 114049 120461 127233 134387
Employment (FTE's) 34444 33065 32953 33272 33739 34336
Ratio of local employment to local 15-65 population 51% 47% 45% 43% 42% 41%
Gross Regional Product (2012 $ million) 3532 2991 3033 3115 3214 3326
5.5 Modelling of Medium Targets
Given the projections in the do‐nothing or base scenario, the importance of an effective
strategy to create economic stimulus is clear. Table 12 provides quantified targets for the
items identified as a possible focus under the strategy discussion that will produce a change
in these outcomes, or targets under a medium scenario.
Table 11: Estimation of Policy Induced Outcomes under Medium Scenario
(Increment over Base)
2012‐
2016 2017‐
2021 2022‐
2026 2027‐
2031 2032‐
2036
Manufacturing 2% 2% 2% 2% 2% Recreation and entertainment
services 3% 3% 3% 3% 3% Building and trade 0.5% 0.5% 0.5% 0.5% 0.5% Other services 2.5% 2.5% 2.5% 2.5% 2.5%
Table 12: Aggregate Employment/ Population Projection Outcomes – Medium Scenario
2011 2016 2021 2026 2031 2036
Population
<15 16275 17171 27838 29346 30922 32568
15‐65 67120 70815 64955 68474 72152 75992
>65 18835 20795 22960 25349 27988 30901
Total 102230 108781 115752 123170 131063 139461
Employment (FTE's) 34444 34669 36268 38457 40991 43907
Ratio of local employment to local 15-65 population 51% 49% 49% 49% 49% 50%
Gross Regional Product (2012 $ million) 3532 3153 3374 3659 3989 4370
These projections indicate that achieving the medium targets would be sufficient to sustain
population growth with an increasing ratio of locally available employment and Gross
Regional Product increased over estimated levels.

Hudson Howells | January 2013 Page 65
City of Charles Sturt – Economic Development Strategy
Table 13 provides the industry distribution of employment related to these outcomes.
Strongest growth is in areas directly affected (hospitality, education) but it can further be
seen that the benefits are broadly spread, with employment outcomes better across all
sectors than in the base case.
Table 13: Projections of Employment Outcomes for City of Charles Sturt –
Medium Scenario
2011 2016 2021 2026 2031 2036 Annual
Change
2011-
2036
Agriculture 29.6 25.7 23 22 21 20 -1.8%
Forestry and Fishing 16 15 15 15 15 15 -0.5%
Mining 51 43 38 35 33 31 -2.5%
Food & beverage manuf 699 644 621 621 625 635 -0.5%
Wood & paper manuf 865 768 715 691 671 654 -1.4%
Machinery & Equipment 1497 1331 1246 1213 1190 1176 -1.2%
Metals, metal products 582 521 490 477 467 461 -1.2%
Non-metallic minerals 312 276 258 251 245 241 -1.3%
Other manufacturing 2104 1877 1761 1709 1667 1636 -1.3%
Electricity Gas Water 130 136 146 157 171 186 1.8%
Wholesale trade 2421 2519 2689 2907 3159 3451 1.8%
Retail Trade 4202 4374 4661 5001 5384 5815 1.6%
Accomodation, Cafes and Restaurants 1812 2013 2270 2571 2923 3333 3.1%
Building Construction 1203 1159 1166 1201 1245 1299 0.4%
Construction trade services 2514 2575 2731 2943 3191 3480 1.6%
Transport 1246 1413 1621 1870 2165 2513 3.6%
Storage 366 382 412 448 489 536 1.9%
Communication 482 498 529 568 611 661 1.6%
Finance & business services 2641 2681 2818 2997 3201 3432 1.3%
Property Services 475 484 510 543 581 623 1.4%
Ownership of Dwellings 0 0 0 0 0 0
Public admin & defence 1246 1250 1312 1379 1450 1524 1.0%
Education 2398 2418 2546 2684 2831 2988 1.1%
Other Community Services 4839 4881 5141 5420 5715 6028 1.1%
Cultural and recreational services 626 650 699 755 817 888 1.8%
Personal Services 1685 1735 1851 1981 2124 2281 1.5%
Total 34444 34669 36268 38457 40991 43907 1.2%
5.6 Modelling of High Targets
Table 14 provides quantified targets for the items identified as a possible focus under the
strategy discussion that will produce a change in these outcomes. Table 15 presents targets
under a high scenario.

Hudson Howells | January 2013 Page 66
City of Charles Sturt – Economic Development Strategy
Table 14: Estimation of Policy Induced Outcomes under High Scenario
(Increment over Base)
2012‐
2016 2017‐
2021 2022‐
2026 2027‐
2031 2032‐
2036
Manufacturing 4% 4% 4% 4% 4% Recreation and entertainment
services 6% 6% 6% 6% 6% Building and trade 0.5% 0.5% 0.5% 0.5% 0.5% Other services 5% 5% 5% 5% 5%
Table 15: Aggregate Employment/ Population Projection Outcomes – High Scenario
2011 2016 2021 2026 2031 2036
Population
<15 16275 17329 18446 19630 20884 22212
15‐65 67120 71465 76073 80956 86129 91606
>65 18835 20795 22960 25349 27988 30901
Total 102230 109589 117478 125935 135001 144720
Employment (FTE's) 34444 36414 40294 45502 52043 60308
Ratio of local employment to local 15-65 population 51% 51% 53% 56% 60% 66%
Gross Regional Product ( 2012 $ million) 3532 3330 3791 4405 5187 6191
The results can be summarised in that achieving the high targets would be sufficient to
achieve employment outcomes towards the middle of the Blandy expectations.
Table 16 provides the industry distribution of employment related to these outcomes.
Strongest growth is again in areas directly affected (hospitality, education) but it can further
be seen that the benefits are broadly spread, with employment outcomes again better
across all sectors than in the base case.

Hudson Howells | January 2013 Page 67
City of Charles Sturt – Economic Development Strategy
Table 16: Projections of Employment Outcomes for City of Charles Sturt – High Scenario
2011 2016 2021 2026 2031 2036 Annual
Change
2011-
2036
Agriculture 29.6 27.6 27 28 28 29 -0.1%
Forestry and Fishing 16 16 16 17 17 18 0.6%
Mining 51 46 44 44 43 43 -0.8%
Food & beverage manuf 699 694 722 782 855 948 1.5%
Wood & paper manuf 865 819 813 837 867 903 0.2%
Machinery & Equipment 1497 1429 1435 1500 1582 1685 0.6%
Metals, metal products 582 553 552 571 597 631 0.4%
Non-metallic minerals 312 296 295 307 321 339 0.4%
Other manufacturing 2104 1990 1975 2029 2098 2185 0.2%
Electricity Gas Water 130 145 167 196 232 277 3.8%
Wholesale trade 2421 2703 3119 3667 4363 5247 3.9%
Retail Trade 4202 4584 5163 5906 6839 8016 3.3%
Accomodation, Cafes and Restaurants 1812 2214 2773 3516 4501 5809 6.0%
Building Construction 1203 1221 1300 1422 1576 1769 1.9%
Construction trade services 2514 2764 3166 3710 4405 5296 3.8%
Transport 1246 1579 2034 2643 3455 4537 6.7%
Storage 366 405 468 550 654 786 3.9%
Communication 482 527 597 687 800 940 3.4%
Finance & business services 2641 2828 3157 3588 4125 4796 3.0%
Property Services 475 516 582 669 777 911 3.3%
Ownership of Dwellings 0 0 0 0 0 0
Public admin & defence 1246 1256 1332 1415 1505 1602 1.3%
Education 2398 2438 2603 2786 2990 3218 1.5%
Other Community Services 4839 4911 5233 5585 5969 6389 1.4%
Cultural and recreational services 626 675 762 872 1010 1186 3.2%
Personal Services 1685 1778 1958 2175 2433 2746 2.5%
Total 34444 36414 40294 45502 52043 60308 2.8%
5.7 Conclusions
Table 17 provides a summary of the outcomes for the three scenarios for the key variables.
Gross Regional Product (GRP) would fall by $0.2 billion in the low scenario increase by $0.8
billion in the medium, and increase by $2.6 in the high (in today’s dollars). In the low
scenario employment in the area remains static, with decreases in manufacturing offset by
some growth in services, driven mostly by demand from local population. In the medium and
high scenarios there is growth in employment overall, driven primarily by demand for
services in the areas emanating from populations outside the area. Under the high scenario,
these increases are even more significant, also supported by growh in high value
manufacturing.
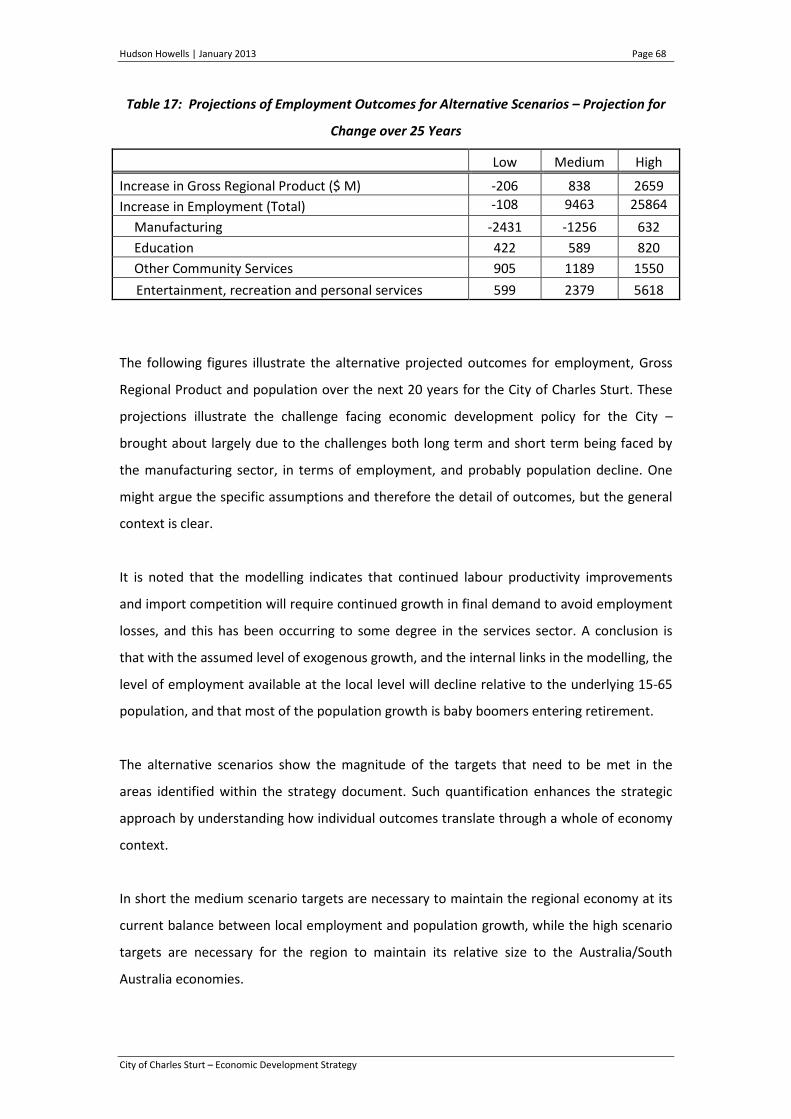
Hudson Howells | January 2013 Page 68
City of Charles Sturt – Economic Development Strategy
Table 17: Projections of Employment Outcomes for Alternative Scenarios – Projection for
Change over 25 Years
Low Medium High
Increase in Gross Regional Product ($ M) ‐206 838 2659
Increase in Employment (Total) ‐108 9463 25864
Manufacturing ‐2431 ‐1256 632
Education 422 589 820
Other Community Services 905 1189 1550
Entertainment, recreation and personal services 599 2379 5618
The following figures illustrate the alternative projected outcomes for employment, Gross
Regional Product and population over the next 20 years for the City of Charles Sturt. These
projections illustrate the challenge facing economic development policy for the City –
brought about largely due to the challenges both long term and short term being faced by
the manufacturing sector, in terms of employment, and probably population decline. One
might argue the specific assumptions and therefore the detail of outcomes, but the general
context is clear.
It is noted that the modelling indicates that continued labour productivity improvements
and import competition will require continued growth in final demand to avoid employment
losses, and this has been occurring to some degree in the services sector. A conclusion is
that with the assumed level of exogenous growth, and the internal links in the modelling, the
level of employment available at the local level will decline relative to the underlying 15‐65
population, and that most of the population growth is baby boomers entering retirement.
The alternative scenarios show the magnitude of the targets that need to be met in the
areas identified within the strategy document. Such quantification enhances the strategic
approach by understanding how individual outcomes translate through a whole of economy
context.
In short the medium scenario targets are necessary to maintain the regional economy at its
current balance between local employment and population growth, while the high scenario
targets are necessary for the region to maintain its relative size to the Australia/South
Australia economies.

Hudson Howells | January 2013 Page 69
City of Charles Sturt – Economic Development Strategy
Figure 5a: Projections of Employment Outcomes for City of Charles Sturt
Alternative Development Scenarios
0
10000
20000
30000
40000
50000
60000
70000
2011 2016 2021 2026 2031 2036
Estimated Employment Outcomes for
Charles Sturt
Low Scenario
Medium Scenario
High Scenario
Figure 5b: Projections of GRP Outcomes for City of Charles Sturt
Alternative Development Scenarios
0
1000
2000
3000
4000
5000
6000
7000
2011 2016 2021 2026 2031 2036
Estimated GRP Outcomes for Charles
Sturt (2012 $m)
Low Scenario
Medium Scenario
High Scenario

Hudson Howells | January 2013 Page 70
City of Charles Sturt – Economic Development Strategy
Figure 5c: Projections of Population Outcomes for City of Charles Sturt
Alternative Development Scenarios
0
20000
40000
60000
80000
100000
120000
140000
160000
2011 2016 2021 2026 2031 2036
Estimated Population Outcomes for
Charles Sturt
Low Scenario
Medium Scenario
High Scenario

Hudson Howells | January 2013 Page 71
City of Charles Sturt – Economic Development Strategy
6. INVESTMENT PROSPECTUS
It is important for the Charles Sturt region that this project goes beyond the economic
development strategy and extends to the first steps of implementation so that economic
momentum is maintained.
Communication with the broader stakeholder group is important to achieve commitment
and engagement in the strategy. This will be achieved via establishment of the external
Business Leaders Group (or Western Business Alliance).
The engagement of business leaders and other community/economic stakeholders will
require communication of the strategy as detailed in this report along with promoting the
investment, export and business opportunities associated with regions’ major economic
development assets. These include:
• Recreation and sporting facilities
• Tourism, hospitality and entertainment facilities
• Urban redevelopment zones
• Industrial and commercial zones
• Health precincts
• Education and training faculties
Recreation and Sport
• The Charles Sturt Council region is host to some of the State’s major sporting and
event facilities and sports teams including:
o Entertainment Centre
o AAMI Stadium and the Adelaide Football Club
o Hindmarsh Stadium and Adelaide United
o Adelaide Arena (Findon) and the Adelaide 36ers
o West Lakes and Rowing facilities.
o Royal Adelaide and Grange Golf Courses.

Hudson Howells | January 2013 Page 72
City of Charles Sturt – Economic Development Strategy
In addition to these assets within the City, there are immediate/contiguous assets
that complement these assets including:
o Adelaide Shores sporting grounds and tourism accommodation (which is in
both West Torrens and Charles Sturt).
o Adelaide Airport.
o Kooyonga Golf Course.
These assets represent an economic strength and competitive advantage that no
other metropolitan Council can currently match, and could be leveraged for
economic development outcomes. The City could be recognised and promoted as
the ‘Sporting Hub’ of Adelaide. The extension of public transport facilities into the
region in coming years could strengthen this competitive advantage. The advantage
could be further strengthened by:
o Adding other assets such as sound shells and stage arenas.
o Improving the public realm around these assets (e.g. street scaping)
o Appealing to Adelaide tourists (day‐trippers) along with interstate and
overseas tourists.
o Partnering with other events (e.g. The Fringe) to attract events to the region.
o Attraction of new events to the region.
Tourism, Hospitality and Entertainment
Adelaide Shores is a major tourism destination for a range of holiday and sporting events.
While not located within the Charles Sturt Council region (mainly contiguous), both Adelaide
Shores and Council recognise a major opportunity to collaborate/partner on initiatives that
will benefit both organisations.
Visitors to the region (e.g. to Hindmarsh Entertainment Precinct) should be encouraged to
stay longer and to sample other entertainment and hospitality offerings at Hindmarsh.
• Connections between the Entertainment Precinct and the developing Riverbank
Precinct (adjacent Bowden Village,) including appropriate security and lighting,

Hudson Howells | January 2013 Page 73
City of Charles Sturt – Economic Development Strategy
would greatly enhance connectedness to the City of Adelaide and opportunities for
ongoing entertainment and hospitality development. The Adelaide Oval
redevelopment will then represent an opportunity for the Entertainment Precinct to
promote ‘park and eat’ facilities for major sporting events at the oval.
• Concepts proposed to further develop tourism and tourism assets in the region
included:
o Interpretation of the Tennyson Sand Dunes
o Coast Park with beach access
o Improved public transport to Henley Beach
o Off road bike facilities
o Promotion of City Bikes e.g. Pick up fee bikes in the City and ride along the
River Torrens Linear Park to Henley Square. The Linear Park connects the
City to the sea.
o Research and development of a strategy for the attraction of major sporting
events – e.g. National Rowing Championships; Surf Lifesaving Events; etc.
There needs to be an integrated approach to maximise opportunities for
tourism, accommodation, hospitality, etc.
o Gulf cruises from Grange
o Strategy to attract cruise ship visitors
Urban Redevelopment
• Residential land development opportunities in the regions could be improved by
Council identifying land surplus to requirements in other industry sectors (e.g.
underutilised industrial land north of St. Clair) and rezoning for appropriate housing
development.
• Council should be at the leading edge of developments in technology, water, safety,
parks, etc.
Industrial and Commercial

Hudson Howells | January 2013 Page 74
City of Charles Sturt – Economic Development Strategy
• Options exist for the use of underutilised industrial land which should be considered
by Council.
• Significant potential exists for the consolidation and export of food product,
especially to China and SE Asia. Council support and/or collaboration with the State
Government on trade delegations and missions could assist relevant exporters in
this area.
Health
• A Health Precinct has evolved around the Queen Elizabeth Hospital (Woodville and
Port Roads) and has significant potential for further industry development.
• Relocation of the RAH to the North West end of Adelaide, combined with the
Thebarton Biosciences Precinct, offers opportunities for further industry
development in the region for medical/health services and products.
• Other key opportunities identified included:
o Development of preventative health strategy along with a longitudinal study
to assess its effectiveness.
o A pilot project utilising technology to improve aged health care services.
o Consistent with the region’s other strengths, the development and
promotion of the region for sports injuries prevention and treatment.
o The attraction to the region of skilled health care workers to build on the
existing strengths.
Education and Training
• The region is relatively safe and secure and represents an attractive environment for
students and student accommodation.
• The region’s changing demographic profile offers an opportunity to attract private
education facilities into the region.

Hudson Howells | January 2013 Page 75
City of Charles Sturt – Economic Development Strategy
• Given the region’s sporting assets, there is an opportunity to develop sports and
sports injury training services for Australian and overseas teams, individuals and
governments.
• South Australian Sports Institute (Office of Recreation and Sport).
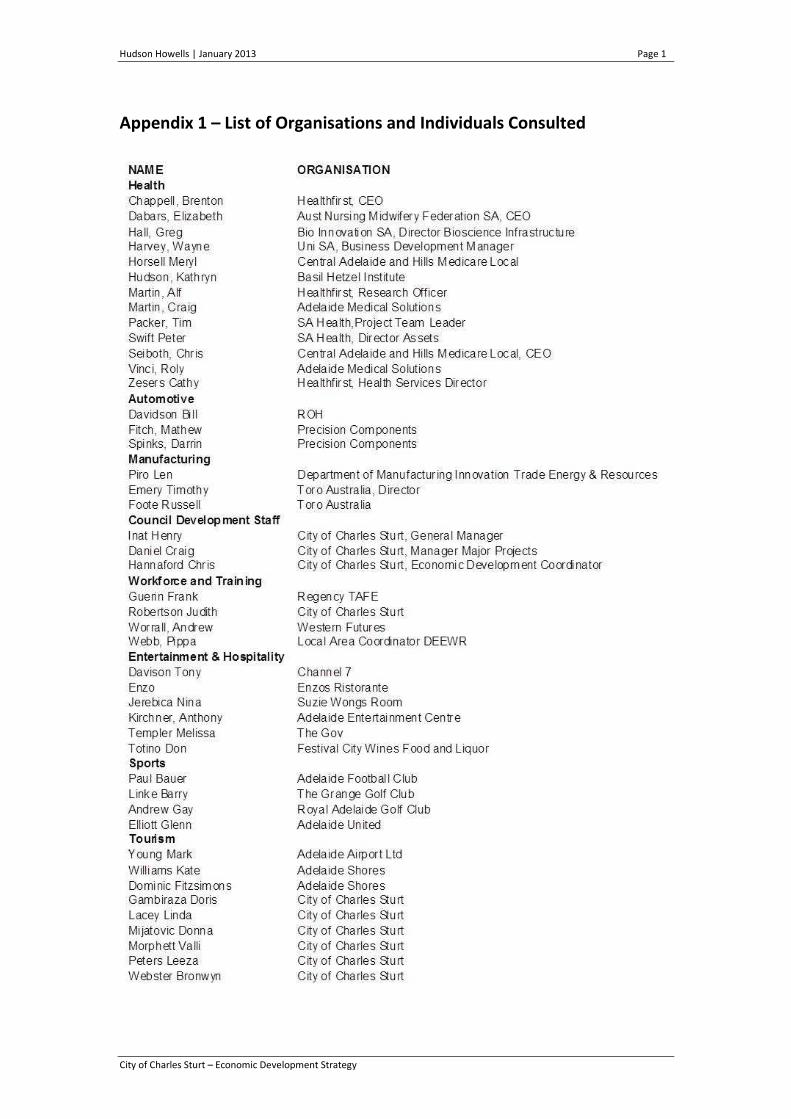
Hudson Howells | January 2013 Page 1
City of Charles Sturt – Economic Development Strategy
Appendix 1 – List of Organisations and Individuals Consulted

Hudson Howells | January 2013 Page 2
City of Charles Sturt – Economic Development Strategy
Appendix 2 - Charles Sturt Future Economic Scenarios Modelling
Limitations
Modelling and Projection Limitations
The economy wide modelling in this project is undertaken by shocking an input output table
with forecast demand shocks. The production function by industry in the underlying input
output table is adjusted across time to allow for increased labour productivity and increased
import penetration.
An input‐output table is a representation of the structure of an economy over a particular
period of time for a particular geographical extent. This can be at the local, City of Charles
Sturt or national geographic level. The economy is categorised into a number of industry
sectors and linkages between sectors are identified. The linkages between sectors are
specified as flows of goods and services between sectors, for example, some of the outputs
of the primary sector are used as inputs by the manufacturing sector.
While input output (IO) models have been widely applied, and the use of multipliers
widespread in estimating economic impact, it is generally accepted that it is a relatively
simple modelling framework, and there are potentially significant economic relationships
that it does not incorporate. In the main, the core assumption that is implicit in the use of
input‐output tables and multipliers is that output can be expanded indefinitely within an
economy without any capacity constraint. The IO framework is focused on demand shifts
rather than supply constraints. Given this, and other simplifying assumptions and limitations,
alternative frameworks have developed over time, in particular the Computable General
Equilibrium (CGE) framework.
Like IO models, CGE models are also economy‐wide models based on an underlying input‐
output framework. Though more advanced theoretically in many ways, the critical difference
is that CGE models incorporate supply side constraints (IO models assume perfectly elastic
supply curves) and a broader range of macro‐economic linkages (based on a general
equilibrium theory). Therefore CGE models are more theoretically robust than IO, but it
must be noted that they still have some limitations in term of their capacity to capture
complex implications of projects that increase economic activity (such the effects of

Hudson Howells | January 2013 Page 3
City of Charles Sturt – Economic Development Strategy
economies of scale, the extent of macro‐economic interactions and the fact that key
economic parameters such as elasticities must be estimated and are often based on limited
historical data). CGE models, like IO models or any other modelling framework, are also
highly dependent on the assumptions that are used (for example, what is an external input
into the model and what is determined from within the modelling framework).
Another extension of basic modelling approaches is multi‐region modelling. Multi‐region
models can assess the impact of a shock on a regional economy and simultaneously model
the impact at both a City of Charles Sturt and national level (including feed‐back effects).
There are also econometric‐linked models where time series and econometric based macro‐
economic relationships are distributed across industry sectors by use of an underlying IO
framework. All are based on underlying IO tables that are historic in nature and generally
assume constant returns to scale (i.e. doubling inputs lead to doubling of outputs). All
models ignore or simplify some linkages, such as the dynamic profits, investment linkage
(the way in which increased profits generates increased investment, changing the technical
structure of the economy).