Embed Size (px)
Citation preview
Profits, losses and the non-linear pricing of Internet stocks
Professor John R. M. Hand Tel: (919) 962-3173Kenan-Flagler Business School Fax: (919) 962-4727UNC Chapel Hill [email protected] Hill, NC 27599-3490
Abstract
This paper sheds light on the economics of Internet firms by extracting information on major value-drivers from their stock prices. Contrary to conventional Wall Street wisdom that there is little or no method in the pricing of Net stocks, I find that basic accounting data are highly value-relevant in a simple nonlinear manner. Using log-linear regression on quarterly data for 167 Net firms over the period 1997:Q1–1999:Q2, I show that Net firms’ market values are linear and increasing in book equity, but concave and increasing (decreasing) in positive (negative) net income. When Net firms’ earnings are decomposed into revenues and expenses, revenues are found to be weakly positively priced. In contrast, and consistent with the argument that very large marketing costs are intangible assets, not period expenses, Net firms’ market values are reliably positive and concave in selling and marketing expenses when net income is negative, particularly during the first two fiscal quarters after the IPO. R&D expenditures are priced in a similarly concave manner, although more durably beyond the IPO than are marketing costs. The concavity in the pricing of core net income, R&D costs, and selling and marketing expenses runs counter to the notion that Net firms are expected to benefit from extraordinary profitability stemming from large strategic operating options, or increasing returns-to-scale.
Key words: Internet stocks; non-linear valuation; profits; losses; intangible assets.JEL classifications: G12, G14, M41.
First draft: July 30, 1999 This draft: January 10, 2000
2000 John R. M. Hand. All rights reserved. This work is supported by a KPMG Research Fellowship. My thanks to Barbara Murray and Susie Schoeck for research assistance. The paper has benefited from comments by Professors Blacconiere, Bushman, Erickson, Landsman, Maines, Maydew, Myers, Salamon, Shackelford, Slezak, Smith and Wahlen, and feedback from seminar participants at UC Berkeley, the University of Chicago, Indiana University and UNC Chapel Hill.
1. Introduction
The purpose of this paper is to shed light on the economics of Internet companies, the total
market value of which now comfortably exceeds $1.3 trillion dollars versus $50 billion a mere three
years ago. I define a Net firm as one that would not exist if it were not for the Internet, and for
which 51% or more of its revenues come from or because of the Internet.
Due to its rapid and world-wide impact on business and communications, the Internet is
seen by many as a revolution akin to that triggered by earlier technological innovations such as
moveable type, radio, the telephone, and the computer. The enormous wealth created by Net firms
and their spectacular stock returns (see figure 1) have also come to epitomize the high-productivity,
high-technology-based nature of the United States’ so-called New Economy. At the same time,
however, the speed with which the Internet is changing the business landscape has preempted
structured description or economic analysis of Net firms. Perhaps because of this, many influential
but unsubstantiated claims exist about the links between the valuations of Net companies and
primitive economic forces. My research aims to separate fact from fiction by quantifying and
analyzing key economic characteristics of Net firms’ operations, and drivers of their stock market
valuations.
The prevailing view of the pricing of Internet stocks is well illustrated by a recent quote
from The Wall Street Journal: “Internet stocks, the conventional wisdom goes, are a chaotic
mishmash defying any rules of valuation” (Wall Street Journal, 12/27/99). Nevertheless, of course,
speculations abound. Some assert that conventional metrics such as earnings and book values are
irrelevant to the pricing of Net stocks, because non-financial metrics call all the shots. Others claim
that revenues are the key driver of Net stock prices. Many analysts and commentators advocate that
larger losses create higher market values because they reflect Net firms’ huge investments in
intangible marketing assets. Still others argue that Net stock prices reflect the unique profit
opportunities provided by “Internet space”, such as the increasing returns-to-scale arising from a
winner-takes-all business environment, and Net firms’ abnormally valuable strategic (real) options.
I provide evidence on these speculations by extracting information on the major value-
drivers of Net firms from their stock prices. Contrary to the conventional wisdom, I find that basic
accounting data are highly value-relevant, albeit in a nonlinear manner. Using quarterly data for
167 Net firms over the period 1997:Q1–1999:Q2, I show that Net firms’ log-transformed market
values are neatly linear in both log-transformed book equity and log-transformed net income.
Translating the log-log regression results back into their underlying dollar value metric indicates
2

that Net firms’ market values are linear and increasing in book equity, but concave and increasing
(decreasing) in positive (negative) net income. The tenor of the non-linear relations, and the
intriguing negative pricing of losses, is not unique to Net firms. I find similar results in two control
groups: a random sample of non-Net firms over the period 1997:Q1–1999:Q2, and non-Net firms
that went public at the same time as Net firms. I also demonstrate that log-linear regressions yield
lower pricing errors for Net stocks than do regressions using per-share or unscaled data. Lower
pricing errors are also generally obtained from log-linear regressions than from per-share or
unscaled regressions for non-Net firms.
When Net firms’ earnings are decomposed into revenues and expenses, revenues are found
to be positively priced, and in a concave manner. In contrast, and consistent with the argument that
large marketing costs are intangible assets, not period expenses, Net firms’ market values are
increasing and concave in selling and marketing expenses when net income is negative, particularly
during the first two fiscal quarters following the IPO. R&D expenditures are also positively priced
in a concave manner, although more durably beyond the IPO than are marketing costs. If
accounting data adequately proxy for true economic profitability, then the concavity in the pricing
of net income, R&D costs and selling and marketing expenses runs counter to the notion the Net
firms are expected to benefit from extraordinary profitability in large strategic options they hold, or
increasing returns-to-scale. Such factors would predict convex relations between Net firms’ market
values and their profit drivers. Overall, my findings lead me to conclude that there is a high degree
of method in the pricing of Internet stocks: Net firms’ market values are strongly correlated with
accounting data in the logarithmic scale.
The remainder of the paper proceeds as follows. Section 2 summarizes the emerging
research in accounting and finance about Internet firms. Section 3 details the sources used to obtain
the approximate population of publicly traded Net firms, as well as two groups of non-Net firms.
Section 4 compares Net and non-Net firms across a variety of past, present and forecasted economic
dimensions. Section 5 delineates and tests four common Wall Street conjectures about the links
between the market valuations of Net firms and primitive economic forces using an empirical
method that is almost entirely new to accounting-based valuation research, namely log-linear
regressions. Section 5 also reports the results of tests assessing the robustness of the log-linear
regression methods for both Net and non-Net firms. Section 6 concludes.
3
2. Existing research in accounting and finance on the economics of Internet firms
Given the speed with which e-business has arisen, academic accounting and finance research
into the economics of the Internet and Net firms has only recently begun to emerge. I briefly
discuss the work I am familiar with. Wysocki (1999a) examines the cross-sectional and time-series
determinants of message-posting volume on stock message boards on the Web. Wysocki (1999b)
uses pre-announcement and announcement period message-posting activity on The Motley Fool
stock chat boards to test Kim and Verrecchia’s (1997) predictions on the relation between trading
volume during an earnings announcement and the amount of investor private information prior to
and during the earnings announcement. Cooper, Dimitrov and Rau (1999) document a striking
mean abnormal stock return of 125% for the ten days surrounding the announcement by a firm that
it is changing its name to a Net related “.com” one.
Hand (2000a) examines the proposition that Net firms dramatically underprice their IPOs in
order to purchase favorable media exposure. He finds that while underpricing generates future
sales, it appears less effective in doing so than conventional selling and marketing expenditures.
Hand (2000b) describes the evolution of Net firms’ profitability and balance sheet ratios, both in
calendar time and in event-time relative to their IPOs. He finds that Net firms’ lack of profitability
has its roots in, but is not entirely explained by, their huge investments in intangible marketing
brand assets aimed at rapidly seizing a dominant market-share position. Net firms’ profitability
also only weakly improves as they mature beyond their IPO.
Hand (2000c) estimates that actual market values of Net stocks are on average several times
greater than standard residual income intrinsic valuations. Intrinsic and market values only equate
when long-run returns on equity approach 100%. Hand (2000d) uses the log-linear regression
method developed in this paper to compare the pricing of Net stocks with that of biotechnology
stocks during 1984-1993. He finds a high degree of similarity between the two groups.
Finally, Schill and Zhou (1999) compare investors’ valuations of Internet carve-outs with
those of the parent. They find several examples of parents whose value in holdings of carved-out
Net subs significantly violate the law-of-one-price by exceeding the market value of the entire
parent over an extended period of time.1
1 The Internet literature in law is larger than that in accounting or finance. It can be accessed by searching under “abstract & author” for “Internet” or “web” at www.wssrn.com.
4

3. Data and sample selection
3.1 Net firms
My approximation to the population of Net firms comes from www.internet.com. This
website provides comprehensive information on the Internet industry. The parent company that
owns www.internet.com, namely internet.com Corp., is itself publicly traded on the NASDAQ
under the ticker INTM. Among the data that www.internet.com does not charge a visitor to its
website to view is its InternetStockListTM. Billed by www.internet.com as “A Complete List of All
Publicly Traded Internet Stocks,” it consists of the 50 major Net firms that comprise the more
narrow Internet Stock Index (ISDEXTM) also put out by www.internet.com plus a large and steadily
increasing number of smaller Internet firms.2
The ISDEXTM is a widely recognized Internet stock index, being regularly quoted and
referred to in financial media such as The Wall Street Journal, Reuters, Dow Jones Newswire and
CNBC. For a firm to be included in the ISDEXTM, www.internet.com relies primarily on the so-
called 51% test, the goal of which is to distinguish firms that would not exist without the Internet.3
The 51% test requires that 51% or more of a firm’s revenues must come from or because of the
Internet. www.internet.com argues that this separates “pure play” Net companies from others who
may have Net products but which would and do exist without the Net generating a majority of their
revenue. Although no minimum market capitalization, trading volume or shares outstanding
restrictions are imposed, the Net firms included in the ISDEXTM are frequently the largest and most
widely recognized companies in the e-commerce sector. www.internet.com estimates that ISDEXTM
represents over 90% of the capitalization of the Internet stock universe on an ongoing basis.4
Given this background, I approximate the population of Net firms that were publicly traded
over the period 1997:Q1–1999:Q2 by the 271 firms reported on the InternetStockListTM of 11/1/99,
plus three firms on earlier listings that were no longer traded (Excite, Geocities and Netscape
Communications). Appendix A lists their names and ticker symbols. By defining the Net sector in
2 The current listing of firms in ISDEXTM can be found at http://sites.stockpoint.com/internet/isdex.asp. Frequently asked questions about the ISDEXTM, its selection criteria, etc. are at http://www.kcbt.com/isdexfaq.htm.3 Other items examined include “marketshare leadership (measured by revenues) and whether the firm represents the Internet diversity according to our seven subsections of the Internet industry enterprises.” These subsections are [1] e-tailers and e-commerce, [2] software, [3] enablers, [4] security, [5] content and portals, [6] high speed and infrastructure, and [7] ISPs and access.4 Net stocks tend to be put onto www.internet.com’s IPO Watch!TM list prior to their IPO, followed by the Internet IPO index (IPODEXTM) immediately after they go public. After a month or two of “seasoning”, they then seem to become eligible to be added to the InternetStockListTM. As of 12/27/99, there were 49 firms listed on IPO Watch!TM, 48 on the IPODEXTM, and 281 on the InternetStockListTM.
5
this way, I attempt to balance the fact that there is no agreed definition of a Net company with the
intuitively appealing criteria that www.internet.com applies to firms to be included in its ISDEXTM,
and to a lesser degree, to firms that are permitted into its broader InternetStockListTM. Since there
are less stringent definitions of a Net company that would lead to a larger data set, the resulting set
of 274 Net firms may underestimate the true number of Net firms over the period examined.5
3.2 Non-Net firms
I construct two groups of non-Net firms to compare in detail against the 274 Net firms: a
random sample of 274 publicly traded non-Net firms (“non-Net firms”), and a sample of 213 non-
Net firms that went public at the same time as Net firms (“IPO-matched non-Net firms”). The
former permits a contrast with the universe of publicly traded firms, while the latter provides a
control for time-dependent factors that may affect certain economic characteristics of Net firms.6
The random sample is chosen from the set of all firms publicly traded on the NYSE, AMEX and
NASDAQ at 12/31/98 according to the Center for Research in Security Prices (CRSP). The set of
IPO-matched non-Net firms was identified via CRSP, www.ipomaven.com and
www.ipocentral.com. To be included, the non-Net firm had to go public within a few trading days
of its Net firm counterpart. Since Net IPOs tend to bunch together, and a non-Net IPO could be
included only once in the non-Net IPO set, it was only possible to obtain a non-Net IPO match for
213 of the 274 Net firms. Appendices B and C list the names and ticker symbols of non-Net firms.
4. Economic comparisons between Net and non-Net firms
Tables 1 and 2 report summary statistics on a variety of economic characteristics computed
separately for Net and non-Net firms. In each table, statistics are reported for Net firms in panel A,
for randomly selected non-Net firms in panel B, and for IPO-matched non-Net firms in panel C.
Table 1 compares and contrasts general information, while table 2 focuses on earnings and
revenues. With the exception of 1st-day underpricing, data in tables 1 and 2 were recorded from
www.marketguide.com on 12/28/99 using Excel’s dynamic external Web Query tool.7
5 For example, www.marketguide.com reports that its database of Internet companies numbered 580 on 1/5/2000. However, they do not report how they define an Internet company. As a result, their list contains firms such as MCI/Worldcom and Microsoft that are arguably not true Net firms. The Excel file containing the www.marketguide.com list is freely available at www.marketguide.com/mgi/RESEARCH/jan2000/NETLROT.XLS.6 For example, characteristics such as institutional holdings, analyst ratings and analyst following are plausibly dependent on the length of time the firm has been publicly traded.7 This allows one to copy a web page into an Excel worksheet. Selected items can then be located and saved.
6

4.1 General characteristics
Table 1 indicates that Net firms are often strikingly different from non-Net firms. For
example, panels A and B reveals that as of 12/28/99, the median Net firm had ten times the market
capitalization yet employed only 40% the number of people as the median non-Net firm ($865
million vs. $87 million; 169 vs. 417 employees). Relative to the median non-Net firm, the median
Net firm also has more than three times the beta risk (2.55 vs. 0.78), one third as much of its stock
held by institutions (8% vs. 27%), half as much of its issued shares in public float (31% vs. 62%), a
public float turnover that is 6.5 times faster (once every 19 vs. 143 trading days), and five times as
much of its public float sold short (5% vs. 1%).
The tenor of many of these comparisons holds when Net firms are contrasted with IPO-
matched non-Net firms (see panels A vs. C). Notable exceptions are that median Net and IPO-
matched non-Net firms have the same analyst stock rating (1.6 vs. 1.6), and contrary to allegations
that Net companies deliberately keep their public float low in order to create excess demand,
similar percentages of their issued shares in public float (31% vs. 34%). Last but not least, the
median Net firm is four times as underpriced at its IPO as the median IPO-matched non-Net firm
(37% vs. 9%), with the mean underpricing for Net firms being a whopping 69%. This compares to
average underpricing for all U.S. IPOs over the period 1960-1996 of 16% (Ritter, 1998). A
marketing explanation for the size of Net firms’ underpricing is explored in Hand (2000a).
4.2 Earnings and revenues
The juxtaposition of the enormous market values of Net firms with their lack of profits has
been amply highlighted by the financial press. Table 2 quantifies and compares the profitability of
Net and non-Net firms. Table 2 reveals that the past, present and expected future profitability of
Net firms is dramatically less than both non-Net firms in general and IPO-matched non-Net firms.
Of Net firms, 87% reported a bottom line loss in fiscal 1998, as compared to 32% for non-Net
firms in general and 49% for IPO-matched non-Net firms. As of 12/28/99, analysts forecast that
Net firms are 4.6 (9.1) times as likely to report a loss in fiscal 1999 (2000) as are typical non-Net
firms, and 2.7 (3.2) times as likely to report a loss in fiscal 1999 (2000) as are IPO-matched non-
Net firms.
While the lack of profitability shown by Net firms is at odds with that of non-Net firms, it is
not unique historically. Amir and Lev (1996) report that for the 40 quarters beginning 1984:Q1 and
7
ending 1993:Q4, 69% of reported quarterly EPS of the 14 independent cellular telephone
companies they examine were negative. They also report that the corresponding figure for 44
biotechnology companies over the same period was 72%. This compares to 77% of Net firms over
the period 1997:Q1–1999:Q2 reporting negative EPS, suggesting that Net firms may be no more
unprofitable than have been other groups of firms in earlier technology-based, high-growth
industries.
Running partially counter to the dismal picture of Net firms’ current profitability are
analysts’ forecasts that the median Net firm will enjoy an earnings growth rate of 50% over the next
five years (“long-term growth rate in EPS”). This compares to 16% for non-Net firms and 30% for
IPO-matched non-Net firms.8 Such favorable expectations for the long-term profitability of Net
firms may stem in part from the dramatically higher revenue growth rates that Net firms have
experienced. The median Net firm’s most recent 1-year and 3-year annual revenue growth rates are
close to ten times those of non-Net firms in general, and two to three times those of IPO-matched
non-Net firms. However, there is also more uncertainty about Net firms’ long-term EPS growth
rates: the median standard deviation of analysts’ forecasts of Net firms’ long-term EPS growth rates
is 14% versus only 3% for non-Net firms in general and 5% for IPO-matched non-Net firms.
5. The value-drivers of Internet stock prices
Given the dramatic financial differences between Net and non-Net firms and the speed with
which the Internet has impacted business, it is perhaps not surprising that many influential yet
conflicting speculations (“hypotheses”) have arisen from analysts or the financial press about the
links, or lack thereof, between the stock market valuations of Net companies and economic
primitives. By subjecting four of the most prominent to empirical scrutiny, I aim to separate fact
from fiction regarding how the market does, and how the market does not, price Net stocks.
I begin by describing each hypothesis (sections 5.1 – 5.4) as well as illustrating it via a
quote from the financial press. I then develop one or more predictions that reasonably stem from
each hypothesis. The predictions are tested after providing a detailed explanation of the log-linear
regression method, given that it is almost entirely new to valuation-related capital markets research.
5.1 Hypothesis H1 – The value-irrelevance (relevance) of accounting (non-financial) data
8 A positive growth rate from a negative base figure (as is the case for most Net firms) is clearly problematic. Attempts to determine exactly what analysts mean when they forecast positive EPS growths for Net companies have proved unsuccessful.
8

The first hypothesis I examine is that conventional accounting-based measures of firm value
or performance, such as book value and earnings, are irrelevant in explaining the equity market
values of Net firms. The following quote illustrates this view, which from my reading of the
financial press is widely held on Wall Street:
The most important of the rules, the one from which all the other laws of this parallel universe spring [that of Internet stocks] is this: Internet stocks aren’t like other stocks...[F]or most companies there are at least some widely agreed upon yardsticks: book value, current earnings, projected earnings growth. Internet companies have no tangible assets…little or nothing in the way of earnings, and their future growth is impossible to predict reliably. So investors can’t use their customary yardsticks.
[Net stock rules: Masters of a parallel universe, Fortune, 6/7/99]
This perspective predicts that accounting data will explain at best a trivial fraction of the cross-
sectional variation in equity market values. While such impotence would be unsurprising to
financial professionals, it would run counter to almost all the academic theory and evidence
compiled in accounting-based equity valuation research over the past ten years.9
In contrast to skepticism about the value-relevance of accounting data, analysts place great
emphasis on the role of non-accounting information and/or unconventional metrics in setting and
moving Net stock prices, such as page views, click-through rates, or unique visitors. For example,
Steve Harmon, a leading Net analyst who now heads his own investment management firm www.e-
harmon.com, readily admits that:
(He) never had to capitulate on valuations. That’s because he had decided from the very beginning that using the valuation ‘metrics’ of the past for Internet stocks made no sense. So he decided to invent some metrics that he could apply ...
[Do you believe? How Yahoo! became a blue chip, Fortune, 6/7/99]
Evidence that non-financial information can explain stock prices better can accounting data,
but only in very special circumstance, is proposed by Amir and Lev (1996). Amir and Lev
examined the value-relevance of financial and non-financial information for independent cellular
telephone companies over period 1984–1993. They concluded that on a stand-alone basis, book
values, earnings and cash flows were largely irrelevant to cellular telephone companies’ stock
9 The key theory papers are Ohlson (1995) and Feltham and Ohlson (1995, 1996). Major examples of empirical work are Barth, Beaver and Landsman (1998), Dechow, Hutton and Sloan (1999), Frankel and Lee (1998), Hand and Landsman (1999), Harris and Kemsley (1999), Lee, Myers and Swaminathan (1999).
9

prices.10 Whether Net firms represent another special circumstance is an open empirical question.11
5.2 Hypothesis H2 – Revenues are the primary driver of Net stock prices
The second hypothesis that I test is the often-voiced conjecture that revenues drive the
pricing of New stocks. The following quotes illustrate this view:
What’s the best way to compare valuations of Internet stocks? One measure has gained more or less universal acceptance: the ratio of stock price to annualized sales, or revenue per share. The popularity of the price/sales ratio reflects investor belief that it’s more important for Internet companies to grow revenue than profit, and that revenue is proxy for marketplace acceptance and market share.
[Parsing the price-to-sales ratio, Herring Investor, 990310]
But with so many Internet stocks having achieved medium- and large-cap status despite heavy losses, it’s pretty clear that investors are now paying lots of attention to top line trends. After all, with net stocks, Price-to-Sales ratios are often the only readily obtainable quantitative valuation metrics one can examine.
[Sales growth leaders, Marketguide.com, 991116]
The use of revenues is typically justified by the observation that it “involves that rarest of
commodities in Internet valuation—hard numbers” (Wooley, 1999) and that most Net firms report
losses, not profits, making intrinsic valuation and the setting of price targets based on price-
earnings ratios “nonsensical.” At the same time, those who advocate the centrality of revenues
generally concede that “it doesn’t tell you if a stock is cheap or expensive by itself, but whether it’s
cheap or expensive compared to its peers” (e.g., Gerstein, 1999; Wooley, 1999).
If the view that revenues are the primary driver of a Net firm’s stock price is correct, then
revenues will be positively related to market value. Furthermore, revenues should dominate by
explaining more of the cross-sectional variation in the pricing of Net stocks than any other variable.
10 Amir and Lev find that earnings and book equity become value-relevant when non-financial data is controlled for.11 Ohlson (1999) demonstrates that accounting-based valuation models can capture the impact of information that is not yet in current financial statements (which could include, but not be limited to, page views, unique visitors etc.) via analyst forecasts of future earnings. I deliberately choose not to do this because I want to measure the value-relevance of accounting data for Net firms in a conservative manner.

5.3 Hypothesis H3 – Larger losses enhance, not reduce, Net firms’ market values
The third claim that is commonly made about the market’s pricing of Net stocks is that
larger losses translate into higher, not lower, stock prices. The following quote typifies this view:
Profits matter. Or do they? “The attitude is almost antiprofit,” marvels Mr. Borkowski of Industrial Microwave Systems, Inc. He says that his two-year old company originally planned to become profitable in the year 2000. “But our financial advisers told us not to be profitable too quickly,” he says....One of the sacred tenets of business—you have to make money—suddenly looks almost like a quaint artifact of an outdated era....Venture capitalists often think a company is wimpy if it turns a profit too quickly....In this marketplace, the more money you lose, the more valuable you are.
[Rethinking a quaint idea: Profits, The Wall Street Journal, 5/19/99]
Behind this view is the plausible economic argument that losses incurred by Internet companies
reflect strategic expenditures by management, not poor operating performance. In particular, it is
common knowledge that management of Net firms make huge investments in intangible marketing
assets in order to more quickly capture market share, because they believe that such investments will
yield large abnormally large profits sometime in the future. For example:
While Internet companies are using a variety of ploys to become the market leader, heavy spending on marketing seems to be the real key to achieving dominance.
[Who’s getting more bang for the marketing buck, Business Week, 5/31/99]
For five quarters running, CNET Inc. has done what few Internet companies have done: shown a profit. But now Chairman and Chief Executive Halsey M. Minor is chucking his conservative, money-making approach. On June 30, Minor announced that he will plunge into the red with a $100 million ad campaign aimed at making CNET’s name as synonymous with technology as ESPN is with sports. Says Minor: “This is a bold play for a dominant position. In putting growth ahead of profit, Minor hopes to emulate the success of other Web companies such as Amazon.com Inc. The online retailer is one of the top companies in cyberspace and the darling of investors – even though it won’t make a dime until 2001 at the earliest.”
[CNET goes for broke, Business Week, 7/12/99]
If this view is correct, then contrary to hypothesis H1, accounting data is somewhat value-relevant
since the market value of a Net firm depends on the sign of its net income. In the context of cross-
sectional regressions of the market values of Net firms’ equity on their accounting data, several
testable predictions arise. First, when net income is negative, it should be negatively priced. Since
prior research suggests that losses of non-Net firms are accorded a zero multiple in valuation
(Collins, Pincus and Xie, 1999), finding a negative multiple on losses for Net firms would be novel.
Second, loss-making Net firms will spend more on intangible assets such as selling and marketing,
and research and development, than will profitable Net firms. Third, if net income is broken into
revenue and expenses, the stock market’s pricing of selling and marketing expenses will be positive
when net income is negative. Prior research has not examined the pricing of selling and marketing
expenses (probably because unlike Net firms, non-Net firms rarely break selling and/or marketing
expenses separately out of SG&A in their income statements). It is known, however, that R&D
expenditures tend to be priced as assets, not period expenses (Lev and Sougiannis, 1996).
5.4 Hypothesis H4 – Net stock prices reflect abnormally high expected future profitability
Several authors have proposed that Net firms’ stock prices reflect expectations of two kinds
of special profit opportunities: strategic operating options and increasing-returns-to-scale.
Mauboussin (1999) and Yee (1999) argue that firms hold unusually valuable portfolios of strategic
(real) options that may account for the enormous differences between actual equity market values
and intrinsic values estimated from basic discounted cash flow models. Since real options induce
convexity in the relation between equity value and drivers of economic profits (Yee, 1999; Zhang,
1999), this view reasonably predicts that Net firms’ market values will be convex in accounting
proxies for the drivers of economic profits, such as book equity and net income. Moreover, Zhang
(1999) notes that convexity is most pronounced for high-growth firms. Table 2 indicates that Net
firms enjoy huge growth rates, leading to the expectation that it exists, convexity in the relation
between equity market values and accounting data will be particularly pronounced for Net firms.
The second special profit opportunity that may exist for Net firms is the increasing returns-
to-scale alleged to accrue from the “winner-takes-all” business model that many Net firms adhere to
(Ip, 1999). According to this view, the value of a Net-based business grows exponentially as a
function of the number of its customers because revenues grow disproportionately faster than
expenses or the underlying capital employed. Since the past and present costs of attracting
customers are reflected in the firm’s book equity and net income, these financial statement variables
are expected to be related to equity market value in a convex manner.12
12 To the extent that increasing-returns-to-scale imply increasing abnormal economic profits relative to capital employed, the winner-takes-all model in expectation violates a crucial tenet of competitive product and capital markets. This is that in expectation a firm’s long-run return on capital employed will equal its cost of equity capital. Alternatively stated, a firm cannot in expectation earn a positive abnormal return on equity in the long-run. See Hand (2000c) for further discussion of this issue in the context of Internet firms.
5.5 The log-linear OLS regression method
I test the predictions developed in sections 5.1 – 5.4 using pooled time-series cross-sectional
log-linear regressions, with calendar quarter fixed-effects dummies to control for secular trends in
Net firms’ average market values. Each dependent or independent variable Z is log-transformed
by:
LZ = loge[Z + 1] if Z 0, but –loge[–Z + 1] if Z < 0 (where Z is expressed in $ millions) (1)
This transformation is information-preserving in the sense of being monotone and one-to-one. The
addition of $1 million to Z ensures that LZ is defined when Z is at or close to zero. For illustrative
purposes, if X and Y are both non-negative, then the general non-stochastic linear relation between
the log-transformed values of X and Y is given by
loge(Y + 1) = + loge(X + 1) LY = + LX (2)
Equation (2) implies that the unscaled or anti-logged relation between X and Y is
Y = e (X + 1) – 1 (3)
An appealing feature of the log-transformed model is that the degree and type of non-
linearity in the relation between X and Y is captured by the parameter . For non-negative values of
X, the relation between X and Y in equation (3) is concave if 0 < < 1, linear if = 1, and convex if
> 1. When X is negative but log-transformed per equation (1), the relation between X and Y is
concave if –1 < < 0, linear if = –1, and convex if < –1. If = 0, then X and Y are unrelated
no matter what the sign of X. If loge(Y + 1) is a linear function of more than one logged
independent variable, say X and W, then reflects the marginal concavity, linearity or convexity of
X (that is, the concavity, linearity or convexity of X holding constant W).
The past ten years have seen a surge in the theoretical development and empirical testing of
accounting-based valuation models in which equity market value is a linear function of book equity
and current and/or expected future net income (see Ohlson 1995, 1999; Feltham and Ohlson 1995,
1996; Barth, Beaver and Landsman 1998; Dechow, Hutton and Sloan 1999; Frankel and Lee 1998;
Hand and Landsman 1999; Harris and Kemsley 1999; and Lee, Myers and Swaminathan 1999).
Estimation of these linear models has been through OLS applied either to undeflated dollar values;
13

deflated data where the most common deflators are the number of shares outstanding, book equity
and total assets; and in returns rather than in levels. The only studies that use log-linear regression
in an accounting-based valuation setting are Ye (1998) and Ye and Finn (1999).13
Ye and Finn (1999) motivate their log-linear model of firms’ equity market values, book
equity and net income in two major ways. First, they argue that the assumption made by Ohlson
(1995) that the dollar value of abnormal earnings follows an AR(1) decay process leads to the
unpalatable conclusion that the long-run abnormal return on equity is negative. Second, they
demonstrate that if instead the log of one plus the return on equity follows an AR(1) process, and
net dividends are zero, then equity market value emerges as a multiplicative function of book equity
and net income. Taking logs of all variables leads to a log-linear relation between equity market
value, book equity and net income. Ye and Finn’s model is summarized in Appendix D.
In addition to the motivation provided by Ye and Finn (1999) and the flexibility log-linear
models provide in accomodating concavity, linearity or convexity, I center my empirical analysis
on log-linear OLS regressions for two econometric reasons.14 First, log-linear regressions typically
reduce the influence of anomalous or outlier observations in financial data. Second, log-linear
regressions typically achieve greater homoscedasticity in regression residuals. These are significant
concerns for Net firms because of the high degree of skewness observed in Net firms’ equity
market values, net income, book equity, etc. (see table 2). To finesse the reasonable concern that a
minority of the data drives the magnitude and/or significance of parameter estimates, most
researchers who apply OLS regression to non-logged data first identify and then winsorize or delete
outliers. This potentially ad-hoc process is all but unnecessary with logged data because the log
transform dramatically dampens the values of previously extreme observations.
Figure 2 illustrates the specification benefits for Net firms of log-transformed data by scatter
plotting the univariate relations between Net firms’ equity market values, pre-income book equity
and core quarterly net income.15 Panels A and B plot raw, undeflated data; panels C and D plot per-
share data; and panels E and F plot logged data. Pre-income book equity is defined as book equity
at the end of the fiscal quarter less net income earned over the quarter. I use this definition instead
13 Log-linear models have been employed extensively in economics. Kaplan and Ruback (1995) and Berger, Ofek and Swary (1996) are two rare instances of the use of log-linear models in valuation contexts in finance.14 The results of running conventional regressions based on unscaled and per-share data are reported in section 5.6.2.15 The market value of equity is measured at the end of the fiscal quarter. This is typically three weeks before the firm confirms it’s net income to the market via a quarterly earnings press release. Based on other empirical work that estimates accounting-based valuation models, I do not expect the “look-ahead” bias that this may create in the upcoming regressions to be material.
14
of the more conventional book equity at the end of the quarter because it facilitates the computation
of the marginal impact of book equity and net income on equity market value in regressions where
book equity and net income are both included as independent variables.16 Core net income is
defined as net income less special items in order to filter out one-time distortions in profitability.
Inspection of panels A–D suggests that undeflated and per-share data are highly skewed and
heteroscedastic, making it difficult to determine if the relations between market value and pre-
income book equity and/or market value and core net income are linear or non-linear. In striking
contrast, panels E and F indicate that the relations between logged market value and logged pre-
income book equity and log-transformed core net income appear both linear and homoscedastic,
conditional on the sign of core net income. The log transform uncovers three empirical regularities
obscured in panels A–D. First, the relation between logged market value and logged pre-income
book equity is positive and strong. Second, the relation between logged market value and log-
transformed core net income is positive when core net income is positive, but negative when core
net income is negative. Third, the fact that the relations between equity market value and core net
income are linear when the underlying unscaled data are log-transformed suggests that the relations
between unscaled equity market value and unscaled core net income are not linear.17 Applying
OLS to unscaled data would therefore be likely to yield significant violations of the assumptions of
OLS; mis-estimation of the signs, magnitudes and significance of model parameters; and faulty
economic inferences based on them. Similar concerns exist for per-share regressions.
5.6 Descriptive statistics
Panel F of figure 2 points to asymmetry in the signs of the relations between Net firms’
market values and core net income. Table 4 therefore compares the means and medians of key
economic variables and ratios for the Net firms used in regressions across positive versus negative
quarterly core net income. To be included in the regressions, a Net firm had to be traded at the end
of one or more fiscal quarters during the period 2/1/97 and 7/30/99 (hereafter, 1997:Q1–1999:Q2),
and have positive pre-income book equity and non-zero core net income for that quarter. One
16 Clean surplus accounting under U.S. GAAP requires that book equity at the end of the quarter includes net income. As a result, if unadjusted book equity and net income are both included in a regression as independent variables, then the marginal impact of net income is a function of both the coefficients on net income and book equity. Replacing book equity with pre-income book equity finesses this complexity. Note that if under clean surplus accounting, pre-income book equity is book equity at the beginning of the quarter plus new equity issued less equity repurchased less dividends declared during the quarter.17 Linearity between log-transformed X and Y does not guarantee that the relation between X and Y is non-linear. Per equation (3), the relation between X and Y is non-linear when X 0 if 1. When X < 0, non-linearity –1.
15
hundred sixty-seven Net firms covering 729 firm-quarters of data satisfied these criteria.18 Of firm-
quarters, 77% were unprofitable and 23% were profitable. Full variable definitions are given in
table 3. All data except selling and marketing expenses were taken from quarterly Compustat.
Selling and marketing expenses were hand-collected by searching Net firms’ 10-Qs via
www.sec.gov.19
Table 4 indicates that relative to their profitable counterparts, loss-making Net firms have
reliably smaller mean and median dollar market values, book equity, revenues, spending on R&D,
and selling and marketing expenses. However, loss-making Net firms enjoy significantly larger
mean and median price-to-sales ratios, and spend a greater fraction of their revenues on R&D and
selling and marketing.
5.7 Regression results
The results of estimating log-linear OLS regression models testing the predictions from
hypotheses H1–H4 are reported in panel B of tables 5 and 6. Pearson correlations among the
dependent and independent variables are shown in panel A of each table. The correlations and
regressions in table 5 use only firm-quarters in which core net income is positive, while those in
table 6 use only firm-quarters in which core net income is negative.
The correlations and regressions reported in tables 5 and 6 include several noteworthy
results. First, when core net income is positive, the Pearson correlations between log-transformed
equity market values and log-transformed accounting data, and among different kinds of log-
transformed accounting data, are uniformly positive and large (panel A of table 5). This confirms
the visual indications provided in panels E and F of figure 2 of the value-relevance of accounting
data for Net firms. However, the high multi-collinearity among accounting data warn that it may
be difficult to reliably estimate partial correlations between market value and multiple accounting
variables. Correlations are also high when core net income is negative (panel A of table 6), but in
every case smaller in absolute magnitude than the correlations when core net income is positive.
Second, the regressions firmly reject hypothesis H1 that conventional accounting measures
of firm value or performance are irrelevant when explaining the equity market values of Net firms.
18 Few observations were lost by restricting pre-income book equity to be positive. Including such observations has an immaterial effect on results for Net firms, as well as the two control groups of non-Net firms examined in section 5.8.2.19 In some cases, selling and marketing expenses were not separately broken out of SG&A in the Net firm’s income statement. Where possible, such observations were “backfilled” by setting selling and marketing expenses to total revenues multiplied by the sample median value for firms’ ratio of selling and marketing expenses to revenues.
16

Incremental to the adjusted-R2 explained by the calendar quarter dummies, the log-transformed
values of pre-income book equity and core net income explain 76% (table 5) and 46% (table 6) of
the cross-sectional variation in the log-transformed market values of Net firms over the ten quarter
window 1997:Q1–1999:Q2. When net income is broken into revenues and four key expenses, the
cross-sectional variation explained by accounting data rises to 85% (= 83% + 2%, see table 5) and
64% (= 78% – 14%, see table 6).20 These percentages indicate that the cross-sectional variation in
log-transformed equity market values of Net firms that is available to be uniquely explained by
non-financial data is quite low—15% in table 5 and 36% in table 6. The strength of basic
accounting data and the lack of room it leaves for non-financial data thus runs opposite to the
claims of many analysts that non-financial information is the central factor in the pricing of Net
stocks.21
The third finding I highlight is that the regressions reject hypothesis H2 that revenues
dominate the pricing of Net stocks. While the univariate correlations between log-transformed
revenues and market values are hugely positive, the partial correlations after controlling for pre-
income book equity and total expenses are only marginally positive. The average t-statistic on
logged revenue after controlling for logged pre-income book equity is 2.2 in table 5 and 1.4 in table
6. In contrast, the partial correlations of pre-income book equity after controlling for core net
income or revenues and total expenses are much stronger, with the average t-statistic on logged pre-
income book equity being 7.8 in table 5 and 17.8 in table 6.
The fourth result of note is that the regressions strongly support hypothesis H3. For Net
firms, larger losses cross-sectionally correlate with higher, not lower, market values. Whereas the
estimated elasticity coefficient on log-transformed positive core net income after controlling for
pre-income book equity is a significantly positive 0.31 (t-statistic = 3.6, n = 165), the estimated
elasticity on log-transformed negative core net income is –0.29 (t-statistic = –5.4, n = 564). Slope
coefficients in log-linear models are elasticities, measuring the percentage change in the dependent
variable associated with a one percent change in the corresponding independent variable, holding
constant all other variables.22 Thus, the coefficient of 0.31 on positive core net income indicates
20 Although decomposition is not exact, residual expenses defined as EXP – COGS – GA – RD – MKTG are small.21 This is not to say that non-financial information is unconditionally or conditionally value-irrelevant. For example, suppose that the adjusted R2 statistic is 90% in table 5 when non-financial information is the only explanatory variable, and that the adjusted R2 increases to 91% when both financial and non-financial information are in the regression. What can be said in such a situation is that 84% of the cross-sectional variation in Net firms’ equity market values is explained by information common to the financial and non-financial variables; 1% is uniquely explained by financial information; and 6% is uniquely explained by non-financial information.22 The intercept is a scaling factor, and the multiplicative error term exhibits variation which is proportional to the
17
that for those firm-quarters, a one percent increase in net income cross-sectionally led to an 0.31%
percent increase in equity market value, all else held constant. In contrast, the coefficient of –0.29
on negative core net income indicates that for those firm-quarters, a one percent more negative net
income led in the cross-section to a 0.29% increase in equity market value, all else held constant.
Fifth, the negative pricing of losses is plausibly explained by the solid indications in tables
4, 5 and 6 that large marketing and R&D costs are viewed by the market as intangible assets, not
period expenses. The final regressions in panel B of tables 5 and 6 are based on replacing total
expenses with its four major components prior to being log-transformed: cost of goods sold, general
and administrative expenses, R&D costs, and selling and marketing expenses. Consistent with
hypothesis H3, the regressions reveal that when core net income is negative, the elasticity of selling
and marketing expenses is 0.29 (t-statistic = 3.2). When core net income is positive, the elasticity is
a mere 0.05 (t-statistic = 0.2). Since panels A versus B of table 4 show that selling and marketing
expenses are much larger as a fraction of revenues when core net income is negative than when
core net income is positive, these regression results indicate that when marketing costs are large
enough to lead to reported losses, they are viewed by the market as intangible assets, not period
expenses.23 Period expenses would be expected to be negatively priced. Similar results exist for
the elasticities on R&D costs. Contrary to their immediate expensing under GAAP, large R&D
costs are also priced by the market as if they are intangible assets, not period expenses. The
elasticity on R&D when core net income is negative is a reliably negative 0.23 (t-statistic = 4.3).
When core net income is positive, the elasticity on R&D is a tiny 0.01 (t-statistic < 0.1)
The sixth result of note is that the pricing of R&D costs and selling and marketing expenses
is increasing and concave when core net income is negative. Recall from section 5.5 that for non-
negative pre-logged values of an independent variable X, the relation between X and a dependent
variable Y is concave if 0 < < 1, linear if = 1, and convex if > 1. When X is negative but log-
transformed per equation (1), the relation between X and Y is concave if –1 < < 0, linear if = –1,
and convex if < –1. If = 0, then X and Y are unrelated no matter what the sign of X. The t-
statistic on the coefficient estimate of 0.23 on log-transformed R&D in panel B of table 6 with
respect to the null value of +1 required for linearity is –14.5. The t-statistic on the coefficient
estimate of 0.29 on log-transformed selling and marketing expenses with respect to +1 is –7.9.
magnitude of the dependent variable.23 Recall from table 4 that selling and marketing expenses are a mean (median) of 80% (54%) of revenues when core net income is negative, while when core net income is positive, selling and marketing expenses are a much lower mean (median) of 28% (25%) of revenues.
18

Determining whether pre-income book equity or core net income is concave, linear or
convex is trickier. Three of the four univariate coefficients on pre-income book equity and core net
income in tables 5 and 6 are reliably greater than +1, indicating convexity. However, when both
log-transformed pre-income book equity and core net income are independent variables, equity
market value is increasing and concave in positive core net income, but decreasing and concave in
negative core net income. The t-statistic on the coefficient estimate of 0.31 on log-transformed
positive core net income in panel B of table 5 with respect to the linearity null value of +1 is –8.0.
The t-statistic on the coefficient estimate of –0.29 on log-transformed negative core net income in
panel B of table 6 with respect to the null value of –1 required for linearity is 13.4.
Contrasting with the asymmetric sign in the relation between equity market value and core
net income, Net firms’ market values are always reliably positive in pre-income book equity.
When both pre-income book equity and core net income are independent variables, the relation is a
linear one; the t-statistics on pre-income book equity with respect to the null values required for
linearity are –0.8 and –1.2, respectively. However, the marginal relation between pre-income book
equity and market value becomes concave as net income is decomposed into revenues and key
expenses. The elasticities on pre-income book equity in the last regression in panel B of tables 5
and 6 are 0.74 and 0.66, respectively. While these are reliably positive (t-statistics are 5.6 and 14.8,
respectively), they are also reliably different from the null values of +1 required for linearity (t-
statistics are –2.0 and –7.7, respectively).
In general, therefore, the elasticities estimated on pre-income book equity, core net income,
R&D costs, and selling and marketing expenses are inconsistent with hypothesis H4, which predicts
that Net firms’ market values will be convex in accounting proxies for economic profit drivers.
Concavities are uniformly observed when the detail in net income is exploited, suggesting that Net
firms’ stock prices do not reflect expectations of large value from real (strategic) options or
increasing-returns-to-scale. This is despite the fact that Net firms enjoy huge growth rates, and
should therefore experience particularly pronounced convexity. It is particularly noteworthy that
table 6 points to intangible assets (R&D costs, and selling and marketing expenses) being sharply
concave, since Net firms’ R&D and selling and marketing expenses are the economic primitives
that would be most likely to generate large real operating options.
Finally, the intercepts in all regressions are reliably positive. From equation (3), the
intercept in the log-linear model is a scaling factor.24 A zero intercept translates into a neutral (unit)
24 Each intercept is the mean of the ten calendar quarter dummy coefficient estimates obtained when no unit vector is
19
scaling factor, while an intercept of 0 translates into a scaling factor of e. The intercept in the
final regression of panel B of table 5 equates to a scaling factor of e1.42 = 4.1, while that in the final
regression of panel B of table 6 equates to a scaling factor of e1.73 = 5.6. One interpretation of the
large positive intercepts is that the regressions are mis-specified in the sense that one or more valid
economic variables that explain Net firms’ stock prices have been omitted. Another interpretation
is that the implied scaling factors estimate the degree to which Net stocks are overpriced. Under
this interpretation, the intercept in the last regressions of panel B in tables 5 and 6 imply that on
average profitable Net stocks are overpriced by 318% (= e1.43 – 1, expressed as a percentage), while
loss-making Net stocks are overpriced by 464% (= e1.73 – 1, expressed as a percentage).25
5.8 Robustness tests
Tables 7, 8 and 9 conclude my empirical analysis by reporting the results of tests that
examine the robustness of the results in tables 5 and 6 as Net firms mature beyond their IPO, and
the robustness of the log-linear regression method across two groups of non-Net firms.
5.8.1 Determinants of Net firms’ equity values before, at and after their IPOs
Table 7 provides more refined evidence on the pricing of Net firms’ net income, revenues
and expenses by log-transformed equity market values on accounting data in event-time relative to
the quarter in which the Net firm had its IPO. I undertake such regressions to determine whether
the findings reported in tables 5 and 6 are pervasive as Net firms mature, or limited to particular
quarters before, at or after going public. The “land-grab” view of e-commerce would suggest that
intangible assets such as R&D and marketing expenses are most valuable at and immediately after
the firm goes public. For reasons of sample size, the analysis is limited to firm-quarters in which
core net income is negative. This is a subset of the observations used in table 6 because some Net
firms went public prior to 1997:Q1.
Table 7 restricts the independent variables to pre-income book equity and core net income.
Table 8 breaks core net income into similar revenue and expense components to tables 5 and 6,
included in the regression (/NOINT in PROC REG in SAS). The associated t-statistic is the mean of the ten calendar quarter dummy t-statistics, multiplied by the square root of ten to adjust for degrees of freedom. T-statistics of similar magnitudes are obtained if no calendar quarter dummies are included in the regressions.25 It should be noted that this approach relies on the assumption that a Net firm with zero book equity and zero income (or zero revenues and zero expenses) has a zero market value. This may be incorrect if accounting is biased in capturing economic events, as in the conservative accounting under GAAP for research and development and/or selling and marketing costs.
20

except that pre-logged cost of goods sold and general and administrative expenses are added
together into one variable for simplicity. I highlight five results.
First, table 7 indicates that at all but one point in time (Q+1), equity value is linear and
increasing in pre-income book equity. Second, despite the relatively low number of observations,
negative core net income is reliably negatively priced at the one-tailed level in eight out of eleven
regressions. Third, neither set of coefficients nor the intercept systematically increases or decreases
over event time. Fourth, table 8 indicates that revenues become reliably positively priced as the Net
firm gets further from its IPO. In contrast, however, selling and marketing expenses are reliably
positively priced before, at and during the first two quarters after the IPO, but not thereafter. Taken
together, the results on revenues and selling and marketing expenses suggest that they may act as
substitutes in the market’s assessment of the present value of future cash flows to the firm. Fifth,
R&D costs are robustly positively priced over virtually the entire event window in table 8.
5.8.2 Log-linear analysis of the equity market values of non-Net firms
The strong and robust results reported in tables 5 – 8 suggest that the log-linear model is
well-specified for Net firms over the period 1997:Q1–1999:Q2. In this section, I examine
competing specifications for the relation between equity market value for Net firms, as well as
subjecting non-Net firms to log-linear and conventional specification tests.
Table 9 compares and contrasts the results of estimating the relation between equity market
values and pre-income book equity and core net income across three groups of firms and three data
metrics, separately for positive and negative core net income. The results for Net firms are reported
in table A; for a random sample of non-Net firms over the period 1997:Q1–1999:Q2 in panel B;
and for non-Net firms that went public at the same time as Net firms in panel C.26 The data metrics
are the log-transformed approach described in detail in previous sections of this paper, per-share
data, and raw, unscaled data.
It is dangerous to compare adjusted R2 statistics across different data metrics (Brown, Lo
and Lys, 1999; Ye, 1998).27 To determine which data metric yields the best empirical fit, I
therefore use goodness-of-fit measures that are invariant across the data metric used in the
26 The number of IPO-matched non-Net firms in panel C of table 9 (n = 91) is less than the n = 213 reported in tables 1 and 2 because many Net firms (against which non-Net firms are matched) went public during the 2nd half of 1999.27 The adjusted R2 statistic depends on the variances of the independent variablse. As noted by Ye (1998), in general, given the same data generation mechanism, the higher the variances of the independent variables, the higher is the adjusted R2.
21

regressions. These are the mean and median absolute relative pricing error (RPE) and the mean and
median absolute symmetrized relative pricing error (SRPE). For a given firm, RPE and SRPE are
defined by:
, (4)
where Mi is the actual dollar equity market value of firm i, and is the equity market value fitted
from (predicted by) the regression. Both RPE and SRPE are relative measures, not contaminated
by scaling factors associated with measurement units.
I report statistics for both relative and symmetrized relative pricing errors because the
simple relative pricing error weights overpricing more than underpricing (implying that a model
that overprices stocks would appear to provide a better fit than one that underprices).28 The
symmetrized absolute relative pricing error corrects this concern in the sense that underpricing by
50% yields an SRPE of the same size as overpricing by 100%. Finally, for each regression I report
the percentage of fitted equity market values that are negative. A good data metric should not yield
negative predicted prices.
The regressions in table 9 include several noteworthy findings. First, panel A demonstrates
that the log-linear model yields superior goodness-of-fit measures for both positive and negative
core net income firm-quarters than either the per-share or unscaled data metrics. For Net firms, the
log-linear model has the lowest mean and median RPE, the lowest mean and median SRPE, and
never predicts negative equity market values. The per-share data metric comes in second, while the
unscaled data metric is a distant third. In terms of parameter inferences, the per-share metric yields
an insignificant coefficient on pre-income book equity when core net income is positive, and a
marginally negative coefficient on core net income when core net income is negative. One
interpretation of these differences is that per-share regressions can lead to faulty economic
inferences in the presence of significant non-linearities.
The second observation I note is that panel B shows that the log-linear model yields superior
goodness-of-fit measures than per-share or unscaled data metrics when the competing models are
estimated for a random sample of non-Net firms over 1997:Q1–1999:Q2. Panel C reveals that the
28 For example, suppose that M = $100 and that two predicted prices M1 = $150 and M2 = $50 are being evaluated. Each predicted price deviates from the actual price by $50, and yields an RPE of 0.5. However, M1 is overpriced by 33.3%, while M2 is underpriced by 100%. The symmetrized RPE corrects for this. The SRPE for M1 is 1, while the SRPE for M2 is 0.5.
22
only sample for which the log-linear model provides less than the best fit is for IPO-matched non-
Net firms when core net income is positive.
Third, focusing on the log-linear model across panels A – C, it can be seen that while pre-
income book equity and core net income are uniformly positively priced when core net income is
negative, core net income is always negatively priced when net income is negative.29 Moreover, the
elasticity of negative core net income appears remarkably stable (–0.29 in panel A, –0.35 in panel
B, and –0.34 in panel C). All else held equal, the losses of Net and non-Net firms are priced very
similarly. Fourth, like those on Net firms, the intercepts on the log-linear model for non-Net firms
are strongly positive and of similar magnitude to non-Net firms. Taken at face value, this may
imply that both Net and non-Net firms are overpriced, and by proportionately similar degrees.
Finally, the elasticity of pre-income book equity is always greatest for Net firms, regardless
of the sign of core net income. To the extent that real options exert a convex force on the relation
between pre-income book equity and equity market value, this finding may indicate that Net firms
are judged by the market to have more valuable real options than are non-Net firms.
6. Conclusions
This paper has attempted to separate Internet fact from fiction by quantifying and analyzing
key economic characteristics of Net firms’ operations, and drivers of their stock market valuations.
My method was to extract information on major value-drivers from Net firms’ stock prices.
Contrary to conventional Wall Street wisdom that there is little or no method in the pricing of Net
stocks, I found that basic accounting data are highly value-relevant in a simple nonlinear manner.
Using log-linear regression on quarterly data for 167 Net firms over the period 1997:Q1–1999:Q2, I
showed that Net firms’ market values are linear and increasing in book equity, but concave and
increasing (decreasing) in positive (negative) net income. I also show that the negative pricing of
losses is robust and of a similar elasticity across Net and non-Net firms.
When Net firms’ earnings are decomposed into revenues and expenses, revenues are found
to be weakly positively priced. In contrast, and consistent with the argument that very large
marketing costs are intangible assets, not period expenses, Net firms’ market values are reliably
positive and concave in selling and marketing expenses when net income is negative, particularly
during the first two fiscal quarters after the IPO. R&D expenditures are priced in a similarly
concave manner, although more durably beyond the IPO than are marketing costs. The concavity
29 Using annual data from 1963–1994, Ye (1998) finds a negative elasticity on log-transformed negative net income.
23
in the pricing of core net income, R&D costs, and selling and marketing expenses runs counter to
the notion the Net firms are expected to benefit from extraordinary profitability stemming from
large strategic operating options, or increasing returns-to-scale.
Finally, it must be stressed that a critical question that cannot be confidently answered by
cross-sectional regressions of equity market value on current accounting data is whether the
correlations extracted from Net firms’ stock prices are fully rational. Providing a rigorous answer
to that question – a burning one in the minds of millions of investors around the world – requires
constructing intrinsic value estimates that are independent of observed prices. I pursue such an
analysis in another paper (Hand 2000c). What can be said, however, is conventional wisdom that
asserts that the pricing of Net stocks is “a chaotic mishmash defying any rules of valuation” (Wall
Street Journal, 12/27/99) is false. As with Polonious’ comment on Hamlet’s strange behavior,
“Though this be madness, yet there is method in ‘t.”
24
Appendix A
List of names and tickers for the 274 Net firms used in this study
1 1-800-FLOWERS.COM FLWS2 @Home ATHM3 @plan.inc APLN4 24/7 Media TFSM5 About.com BOUT6 AboveNet Communications ABOV7 Accrue Software ACRU8 AdForce ADFC9 Agile Software AGIL
10 Allaire ALLR11 Alloy Online ALOY12 Alteon WebSystems ATON13 Amazon.com AMZN14 America Online AOL15 Ameritrade Holding AMTD16 AppliedTheory ATHY17 AppNet Systems APNT18 Ariba ARBA19 Art Technology Group ARTG20 Ashford.com ASFD21 Ask Jeeves ASKJ22 Audible ADBL23 audiohighway.com AHWY24 Autobytel.com ABTL25 Autoweb.com AWEB26 AXENT Technologies AXNT27 BackWeb Technologies BWEB28 bamboo.com BAMB29 barnesandnoble.com BNBN30 Beyond.com BYND31 BigStar Entertainment BGST32 BiznessOnline.com BIZZ33 Bluefly BFLY34 Bluestone Software BLSW35 Bottomline Technologies EPAY36 Braun Consulting BRNC37 Broadbase Software BBSW38 broadcast.com BCST39 Broadcom BRCM40 BroadVision BVSN41 C/NET CNET42 CAIS Internet CAIS43 CareerBuilder CBDR44 CDnow CDNW45 Cheap Tickets CTIX46 Checkpoint Software CHKP47 Chemdex Corporation CMDX48 China.com CHINA49 Cisco Systems CSCO50 Claimsnet.com CLAI51 Clarent CLRN52 CMGI CMGI53 The Cobalt Group CBLT54 Commerce One CMRC55 CommTouch Software CTCH56 COMPS.COM CDOT57 Concentric Network CNCX58 ConnectInc.com CNKT59 Convergent Communications CONV60 Covad Communications COVD61 Critical Path CPTH62 Crosswalk.Com AMEN63 CyberCash CYCH64 Cybergold CGLD65 Cyberian Outpost COOL66 Cyber Merchants Exchange CMEE67 CyberShop.com CYSP68 CyberSource.com CYBS69 Cylink CYLK
70 Digex DIGX71 Digital Insight DGIN72 Digital Island ISLD73 Digital Lava DGV74 Digital River DRIV75 DLJdirect DIR76 DoubleClick DCLK77 drkoop.com KOOP78 drugstore.com DSCM79 E*TRADE Group EGRP80 EarthLink Network ELNK81 EarthWeb EWBX82 eBay EBAY83 EDGAR Online EDGR84 eFax / jetfax EFAX85 eGain Communications EGAN86 Egghead.com EGGS87 E-Loan.com EELN88 Engage Technologies ENGA89 Entrust Technologies ENTU90 E.piphany EPNY91 eToys ETYS92 Excite XCIT93 Exodus Communications EXDS94 F5 Networks FFIV95 fashionmall.com FASH96 FatBrain.com FATB97 fine.com International FDOT98 FlashNet Communications FLAS99 Flycast Communications FCST
100 foreignTV.com FNTV101 Freeserve plc FREE102 FreeShop.com FSHP103 Frontline Communications FCCN104 ftd.com EFTD105 Fundtech FNDT106 FVC.COM FVCX107 Garden.com GDEN108 GenesisIntermedia.com GENI109 Geocities GCTY110 Go2Net GNET111 GoTo.com GOTO112 HeadHunter.NET HHNT113 Healtheon HLTH114 High Speed Access HSAC115 HomeCom Communications HCOM116 Homestore.com HOMS117 Hoover's Inc. HOOV118 HotJobs.com HOTJ119 Internet Capital Group ICGE120 IDT IDTC121 ImageX.com IMGX122 Infonautics INFO123 Infoseek SEEK124 InfoSpace.com INSP125 Inktomi INKT126 InsWeb INSW127 Intelligent Life ILIF128 Interactive Pictures IPIX129 Interliant INIT130 Internet America GEEK131 Internet Financial Services IFSX132 internet.com INTM133 Internet Initiative Japan IIJI134 InterVU ITVU135 InterWorld INTW136 Intraware ITRA137 ISS Group ISSX138 iTurf TURF
139 iVillage IVIL140 iXL Enterprises IIXL141 IXnet EXNT142 JFAX.com JFAX143 Juniper Networks JNPR144 Juno Online Services JWEB145 Kana Communications KANA146 Launch Media LAUN147 Liberate Technologies LBRT148 Lionbridge Technologies LIOX149 Liquid Audio LQID150 Litronic LTNX151 Log On America LOAX152 LookSmart LOOK153 Luminant Worldwide LUMT154 Lycos LCOS155 Mail.com MAIL156 MapQuest.com MQST157 Marimba MRBA158 MarketWatch.com MKTW159 Media Metrix MMXI160 MindSpring Enterprises MSPG161 Modem Media.Poppe Tyson MMPT162 Mortgage.com MDCM163 MP3.com MPPP164 Mpath Interactive MPTH165 Multex.com MLTX166 musicmaker.com HITS167 MyPoints.com MYPT168 NAVIDEC NVDC169 NEON Systems NESY170 Net Perceptions NETP171 NetB@nk NTBK172 NetGravity NETG173 Netivation.com NTVN174 NetObjects NETO175 Netscape NSCP176 NetScout Systems NTCT177 NetSpeak NSPK178 Net2Phone NTOP179 Network Associates NETA180 Network Solutions NSOL181 Network-1 Security Solutions NSSI182 NextCard NXCD183 nFront.com NFNT184 N2H2 NTWO185 OneMain.com ONEM186 OneSource Information Services ONES187 Online Resources & Communications ORCC188 onlinetradinginc.com LINE189 ONSALE ONSL190 Open Market OMKT191 Open Text OTEX192 Pacific Internet PCNTF193 Pacific Softworks PASW194 Packeteer PKTR195 pcOrder.com PCOR196 Peapod PPOD197 Perficient PRFT198 Persistence Software PRSW199 Phone.com PHCM200 Pilot Network Services PILT201 Portal Software PRSF202 Preview Travel PTVL203 priceline.com PCLN204 Primus Knowledge Solutions PKSI205 Prodigy Communications PRGY206 Proteam.com PRTM207 Proxicom PXCM
208 PSINet PSIX209 PurchasePro.com PPRO210 quepasa.com PASA211 Quest Software QSFT212 Quokka Sports QKKA213 Quotesmith QUOT214 Ramp Networks RAMP215 Razorfish RAZF216 RealNetworks RNWK217 Red Hat RHAT218 Rhythms NetConnections RTHM219 RMI.NET RMII220 Rogue Wave Software RWAV221 RoweCom ROWE222 RSA Security RSAS223 Sagent Technology SGNT224 Salon.com SALN225 Scient SCNT226 Security Dynamics SDTI227 Security First Technologies SONE228 Silknet Software SILK229 SilverStream Software SSSW230 Software.com SWCM231 Splitrock Services SPLT232 SportsLine USA SPLN233 Spyglass SPYG234 Stamps.com STMP235 StarMedia Network STRM236 Streamline.com SLNE237 Student Advantage STAD238 Talk City TCTY239 Tanning Technology TANN240 Terayon Communication Systems TERN241 theglobe.com TGLO242 TheStreet.com TSCM243 THINK New Ideas THNK244 TIBCO Software TIBX245 Ticketmaster Online-CitySearch TMCS246 Town Pages Net.com TPN247 Tumbleweed Communications TMWD248 Tut Systems TUTS249 uBid UBID250 U.S. Interactive USIT251 US SEARCH Corp.com SRCH252 USinternetworking USIX253 USWeb/CKS USWB254 Value America VUSA255 Verio VRIO256 VeriSign VRSN257 VerticalNet VERT258 Viant VIAN259 Vignette VIGN260 Visual Data VDAT261 VocalTec VOCL262 V-ONE VONE263 Voxware VOXW264 Voyager.net VOYN265 WebTrends WEBT266 White Pine Software WPNE267 Wink Communications WINK268 Wit Capital Group WITC269 WorldGate Communications WGAT270 Xoom.com XMCM271 yesmail.com YESM272 Yahoo! YHOO273 ZDNet Group ZDZ274 ZipLink ZIPL
25

26
Appendix B
List of names and tickers for the 274 randomly selected non-Net firms used in this study
1 F F L C BANCORP INC FFLC2 ANGELICA CORP AGL3 WATSCO INC WSO4 SCIOS INC SCIO5 WORLD AIRWAYS INC NEW WLDA6 SCIENTIFIC TECHNOLOGIES INC STIZ7 S E M X CORP SEMX8 O S I SYSTEMS INC OSIS9 E F C BANCORP INC EFC
10 WESTERBEKE CORP WTBK11 FOOD TECHNOLOGY SERVICE VIFL12 RAYTECH CORP DE RAY13 WESTERN BEEF INC BEEF14 SPARTAN MOTORS INC SPAR15 LUMISYS INC LUMI16 HOME DEPOT INC HD17 MOTOR CARGO INDUSTRIES INC CRGO18 J M A R TECHNOLOGIES INC JMAR19 PAMRAPO BANCORP INC PBCI20 GLATFELTER P H CO GLT21 PSYCHEMEDICS CORP PMD22 R H PHILLIPS INC RHPS23 HAIN FOOD GROUP INC HAIN24 WRIGLEY WILLIAM JR CO WWY25 THERMO TERRATECH INC TTT26 AIRTRAN HOLDINGS INC AAIR27 GENOME THERAPEUTICS CORP GENE28 COMMONWEALTH INDUSTRIES CMIN29 CELL THERAPEUTICS INC CTIC30 RIGHT START INC RTST31 DYNAMIC MATERIALS CORP BOOM32 MEDICAL ASSURANCE INC MAI33 ELECTROMAGNETIC SCIENCES ELMG34 TECH SYM CORP TSY35 L S I LOGIC CORP LSI36 HERLEY INDUSTRIES INC HRLY37 NEW MEXICO & ARIZ LD CO NZ38 P F CHANGS CHINA BISTRO INC PFCB39 PARLUX FRAGRANCES INC PARL40 ASTRO-MEDICAL INC NEW ALOT41 TRAILER BRIDGE INC TRBR42 MENTOR GRAPHICS CORP MENT43 HOWELL CORP HWL44 UNITED STATES LIME
MINERALS USLM
45 OMEGA FINANCIAL CORP OMEF46 CANYON RESOURCES CORP CAU47 TECHNICLONE CORP TCLN48 ANALOGY INC ANLG49 NATIONAL TECHTEAM INC TEAM50 PRAXAIR INC PX51 WASTE MANAGEMENT INC DEL WMI52 TODAYS MAN INC TMAN53 INHALE THERAPEUTIC
SYSTEMSINHL
54 CENTENNIAL CELLULAR CORP CYCL55 NETWORK CONNECTION INC TNCX56 GLIMCHER REALTY TRUST GRT57 TNETIX INC TNTX58 J B OXFORD HOLDINGS INC JBOH59 SCHWAB CHARLES CORP NEW SCH60 AIRBORNE FREIGHT CORP ABF61 AVENUE ENTERTAINMENT GRP PIX62 R S I SYSTEMS INC RSIS63 NEWPORT CORP NEWP64 TELEPHONE & DATA SYSTEMS TDS65 CORNERSTONE BANK CONN CBN66 OILGEAR COMPANY OLGR67 GRACO INC GGG68 ALABAMA NATIONAL BANCORP ALAB69 OMTOOL LTD OMTL

70 BURKE MILLS INC BMLS71 REDWOOD EMPIRE BANCORP REBC72 PENNICHUCK CORP PNNW73 VARI LITE INTERNATIONAL INC LITE74 CAVANAUGHS HOSPITALITY CP CVH75 UNITED RENTALS INC URI76 ESENJAY EXPLORATION INC ESNJ77 FIRSTFED FINANCIAL CORP FED78 FLEXSTEEL INDUSTRIES INC FLXS79 FAROUDJA INC FDJA80 PENN AMERICA GROUP INC PNG81 LA BARGE INC LB82 PUBLISHING CO NTH AMERICA PCNA83 MICROWAVE POWER DEVICES MPDI84 FACTORY 2 U INC FTUS85 VIDAMED INC VIDA86 KANKAKEE BANCORP INC KNK87 SONUS CORP SSN88 TRIMARK HOLDINGS INC TMRK89 COMFORT SYSTEMS USA INC FIX90 STARTEK INC SRT91 INGERSOLL RAND CO IR92 ATRIX LABORATORIES INC ATRX93 CAPITAL BANK NC CBKN94 ALUMINUM COMPANY AMER AA95 BORDEN CHEM & PLASTICS LP BCU96 SANTA FE FINANCIAL CORP SFEF97 JABIL CIRCUIT INC JBL98 CARRAMERICA REALTY CORP CRE99 TRANSMEDIA NETWORK INC TMN
100 INTERFACE SYSTEMS INC INTF101 MAXIM PHARMACEUTICALS INC MMP102 HA LO INDUSTRIES INC HMK103 AXENT TECHNOLOGIES INC AXNT104 HUGHES SUPPLY INC HUG105 CASCO INTERNATIONAL INC CASC106 S G V BANCORP INC SGVB107 C S S INDUSTRIES INC CSS108 N C H CORP NCH109 FINANCIAL INDUSTRIES CORP FNIN110 CONSOLIDATED PRODUCTS INC COP111 PHARMCHEM LABORATORIES PCHM112 C P S SYSTEMS INC SYS113 ENHANCE FINANCIAL SVCS GRP EFS114 A G L RESOURCES INC ATG115 ERIE INDEMNITY CO ERIE116 DRUG EMPORIUM INC DEMP117 MACDERMID INC MRD118 ATLANTIC FINANCIAL CORP AFIC119 MEDFORD BANCORP INC MDBK120 INDUS INTERNATIONAL INC IINT121 TAITRON COMPONENTS INC TAIT122 HALLMARK CAPITAL CORP HALL123 POINTE FINANCIAL CORP PNTE124 COULTER PHARMACEUTICAL CLTR125 MICREL INC MCRL126 WORLD ACCEPTANCE CORP WRLD127 SMITH A O CORP AOS128 DRYPERS CORP DYPR129 MOBIUS MANAGEMENT SYS MOBI130 ELLETT BROTHERS INC ELET131 ASHLAND INC ASH132 LIMITED INC LTD133 ALLTRISTA CORP ALC134 NATIONAL PRESTO INDS INC NPK135 UNIT CORP UNT136 NEOMAGIC CORPORATION NMGC137 DIALYSIS CORP AMERICA DCAI138 GUARDIAN TECHNOLS INTL INC GRDN139 MILLER HERMAN INC MLHR140 OSAGE SYSTEMS GROUP INC OSE141 METEOR INDUSTRIES INC METR142 KENAN TRANSPORT CO KTCO143 BESTFOODS BFO144 R B RUBBER PRODUCTS INC RBBR145 CHOICE HOTELS INTNL INC CHH146 OAK INDUSTRIES INC OAK147 WORLDWIDE ENT & SPTS INC WWES148 SUNBURST HOSPITALITY CORP SNB149 MULTI COLOR CORP LABL
150 PROGRESS SOFTWARE INC PRGS151 ANTHRACITE CAPITAL INC AHR152 HORMEL FOODS CORP HRL153 BAY STATE GAS CO BGC154 SURETY CAPITAL CORP SRY155 G A FINANCIAL INC GAF156 IMPERIAL CREDIT INDUSTRIES ICII157 CHICAGO RIVET & MACH CO CVR158 ONE VALLEY BANCORP INC OV159 A S A INTERNATIONAL LTD ASAA160 ROMAC INTERNATIONAL INC ROMC161 B F ENTERPRISES INC BFEN162 AVERT INC AVRT163 PERVASIVE SOFTWARE INC PVSW164 E R C INDUSTRIES INC NEW ERCI165 ARIZONA INSTRUMENT CORP AZIC166 CONSOLIDATED STORES CORP CNS167 GALLAGHER ARTHUR J & CO AJG168 NORDSON CORP NDSN169 BUCKLE INC BKE170 MICROSEMI CORP MSCC171 RANGE RESOURCES CORP RRC172 MODIS PROFESSIONAL SVCS INC MPS173 P L C SYSTEMS INC PLC174 ALLSTATE FINANCIAL CORP VA ASFN175 ENDOCARDIAL SOLUTIONS INC ECSI176 ARTIFICIAL LIFE ALIF177 LAZARE KAPLAN INTL INC LKI178 COMMERCIAL NET LEASE RLTY NNN179 CYLINK CORP CYLK180 CHICOS FAS INC CHCS181 TRIPLE S PLASTICS INC TSSS182 CARING PRODUCTS INTL INC BDRY183 OLYMPIC CASCADE FINANCIAL NATS184 REALNETWORKS INC RNWK185 BROWN & SHARPE MFG CO BNS186 LITTON INDUSTRIES INC LIT187 KRONOS INC KRON188 T I B FINANCIAL CORP TIBB189 FIRST SAVINGS BANCORP INC
NCSOPN
190 U T I ENERGY CORP UTI191 HEARTPORT INC HPRT192 F Y I INC FYII193 ABLE TELECOM HOLDING CORP ABTE194 WENDYS INTERNATIONAL INC WEN195 GREATER DELW. VLY SVGS BK ALLB196 GRAY COMMUNICATIONS SYS GCS197 AMWEST INSURANCE GROUP AMW198 STANLEY WORKS SWK199 ALPHANET SOLUTIONS INC ALPH200 CERPROBE CORP CRPB201 IPALCO ENTERPRISES INC IPL202 HARBOR FEDERAL BANCORP HRBF203 HONEYWELL INC HON204 FRANKLIN COVEY CO FC205 LEAP WIRELESS INTL INC LWIN206 V R B BANCORP VRBA207 CINCINNATI FINANCIAL CORP CINF208 ZEBRA TECHNOLOGIES CORP ZBRA209 FALCON PRODUCTS INC FCP210 CAPITAL TRUST CT211 CONGOLEUM CORP NEW CGM212 WELLSFORD REAL PROPERTIES WRP213 UNITED WISCONSIN SVCS INC UWZ214 DIASYS CORP DIYS215 AON CORP AOC216 MERIT MEDICAL SYSTEMS INC MMSI217 SECURITY CAPITAL GROUP INC SCZ218 E TEK DYNAMICS INC ETEK219 CLARK BARDES HOLDINGS INC CLKB220 BUTLER INTERNATIONAL INC BUTL221 UNIQUE MOBILITY INC UQM222 TRIDENT ROWAN GROUP INC TRGI223 M B I A INC MBI224 NORTHEAST IND BANC INC NEIB225 NVEST L P NEW226 DYNACQ INTERNATIONAL INC DYII227 METAMOR WORLDWIDE INC MMWW228 MICROSTRATEGY INC MSTR
229 DYNATRONICS CORP DYNT230 SIPEX CORP SIPX231 AQUA CARE SYSTEMS INC AQCR232 SCHWEITZER MAUDUIT INTL SWM233 TOYMAX INTERNATIONAL INC TMAX234 HEARTLAND TECHNOLOGY INC HTI235 OSHMANS SPORTING GOODS INC OSH236 S P X CORP SPW237 UNITED RETAIL GROUP INC URGI238 P A B BANKSHARES INC PAB239 DIEHL GRAPHSOFT INC DIEG240 OFFSHORE LOGISTICS INC OLOG241 HARBOR FLORIDA BANCORP INC HARB242 V ONE CORP VONE243 MEDTOX SCIENTIFIC INC TOX244 CIPRICO INC CPCI245 ENVIROGEN INC ENVG246 ECO SOIL SYSTEMS INC ESSI247 BURLINGTON COAT FACTORY BCF248 COMPARE GENERIKS INC COGE249 SOMANETICS CORP SMTS250 COMPETITIVE TECHNOLOGIES CTT251 ROCKY SHOES & BOOTS INC RCKY252 S 2 GOLF INC GOLF253 INTERSYSTEMS INC II254 UNION CARBIDE CORP UK255 BAKER J INC JBAK256 TELEVIDEO INC TELV257 METROWEST BANK MWBX258 MACNEAL SCHWENDLER CORP MNS259 AMETEK INC NEW AME260 SYMONS INTERNATIONAL CORP SIGC261 MEDIWARE INFORMATION SYS MEDW262 TRUSTMARK CORP TRMK263 P S GROUP HOLDINGS INC PSG264 QLOGIC CORP QLGC265 COMPUTER MOTION INC RBOT266 PRESTIGE BANCORP INC PRBC267 ARADIGM CORP ARDM268 UNITED TENNESSEE BKSHARES UTBI269 REHABILICARE INC REHB270 ACRODYNE COMMUNICATIONS ACRO271 SAFETY 1ST INC SAFT272 CHASE MANHATTAN CORP NEW CMB273 CHEMFAB CORP CFA274 ENRON CORP ENE

Appendix C
List of names and tickers for the 213 IPO-matched non-Net firms used in this study
1 1-800 CONTACTS INC CTAC2 ABN AMRO Holding N.V. AAN3 AccelGraphics Inc. ACCL4 Accredo Health Inc. ACDO5 Actuate Software Corporation ACTU6 Advantage Learning Systems ALSI7 Aerovox ARVX8 AirGate PCS Inc. PCSA9 Aironet Wireless Communs AIRO
10 Allscripts Inc. MDRX11 American Axle & Manufacturing AXL12 American Dental Partners Inc. ADPI13 American Home Mortgage Holdgs AHMH14 American Materials & Technol. AMTK15 American National Can Group I CAN16 American National Financial ANFI17 Antenna TV S.A. ANTV18 APACHE Medical Systems Inc. AMSI19 AremisSoft Corporation AREM20 Argosy Education Group Inc. ARGY21 Arterial Vascular Engineering AVEI22 Asymetrix Learning Systems ASYM23 AudioCodes Ltd. AUDC24 Azurix Corporation AZX25 Be Inc. BEOS26 Bell & Howell Company BHW27 Big Dog Holdings Inc. BDOG28 BioMarin Pharmaceutical Inc. BMRN29 BioMarin Pharmaceutical Inc. BMRN30 Biopure Corporation BPUR31 Biosite Diagnostics Inc. BSTE32 Blockbuster Inc. BBI33 Boyd's Collection FOB34 Brocade Communications Sys. BRCD35 Buca Inc. BUCA36 Capital Environmental Resource CERI37 CareInsite Inc. CARI38 Carrier Access Corp. CACS39 Catapult Communications CATT40 China Southern Airlines Co. Ltd. ZNH41 Clark/Bardes Holdings Inc. CLKB42 CombiChem Inc. CCHM43 Command Systems Inc. CMND44 Commonwealth Bancorp CMSB45 CompuCredit Corporation CCRT46 Computer Literacy Inc. CMPL47 Computer Motion Inc. RBOT48 Concur Technologies Inc. CNQR49 CONSOL Energy Inc. CNX50 Consolidated Cigar Holdings Inc. CIG51 Continuus Software Corp. CNSW52 Convergys Corporation CVG53 Corporate Executive Board Co. EXBD54 CPS Systems Inc. SYS55 Creo Products Inc. CREO56 CuraGen Corporation CRGN57 Data Race RACE58 Datalink Corporation DTLK59 David's Bridal Inc. DABR60 Denali Inc. DNLI61 DePuy Inc. DPU62 Descartes Systems Group DSGX63 Destia Communications Inc. DEST64 Ditech Corporation DITC65 Dunn Computer DNCC66 Efficient Networks Inc. EFNT67 Enamelon Inc. ENML68 Endovascular Technologies EVTI
69 Equity One Inc. EQY70 ESPS Inc. ESPS71 E-Tek Dynamics ETEK72 Evolving Systems Inc. EVOL73 Exchange Applications Inc. EXAP74 Extreme Networks Inc. EXTR75 Fairchild Semiconductor Intl. FCS76 FaxSav Incorporated FAXX77 Financial Institutions Inc. FISI78 FloridaFirst Bancorp FFBK79 Focal Communications Corp. FCOM80 Foundry Networks Inc. FDRY81 Fox Entertainment Group Inc. FOX82 Freds Inc FRED83 Gadzoox Networks Inc. ZOOX84 Gene Logic Inc. GLGC85 General Cable Corporation GCN86 Gerber Childrenswear Inc. GCW87 Global Direct Mail Corp. GML88 Global Imaging Systems Inc. GISX89 GlobeSpan Semiconductor Inc. GSPN90 Goldman Sachs Group Inc. GS91 Gradall Industruries Inc. GRDL92 Greater Atlantic Financial Corp. GAFC93 Heidrick & Struggles Int'l. Inc. HSII94 Hub Group Inc HUBG95 Informatica Corp. INFA96 Infosys Technologies INFY97 Interactive Intelligence Inc. ININ98 Invitrogen Corp. IVGN99 Jore Corporation JORE
100 KCS Group KCSG101 Keynote Systems Inc. KEYN102 Knoll Inc. KNL103 Korn/Ferry International KFY104 LaBranche & Co Inc. LAB105 Latitude Communications Inc. LATD106 Lennox International Inc. LII107 Maker Communications Inc. MAKR108 McLeod Inc. MCLD109 MCM Capital Group Inc. MCMC110 Medscape Inc. MSCP111 Mercury Computer Systems Inc. MRCY112 Merkert America MERK113 Metals USA Inc. MUI114 MetroCorp Bancshares Inc. MCBI115 MicroFinancial Inc. MFI116 Midway Airlines MDWY117 MIH Limited MIHL118 MIIX Group Inc. MHU119 Mission Critical Software Inc. MCSW120 MKS Instruments Inc. MKSI121 Mobius Management Systems MOBI122 MONY Group Inc. MNY123 National Information Consortium EGOV124 NationsRent Inc. NRI125 NCRIC Group Inc. NCRI126 Netia Holdings NTIA127 Netro Corporation NTRO128 Network Plus Corp. NPLS129 Neurocrine NBIX130 New American Healthcare Corp. NAH131 NewGen Results Corp. NWGN132 Nextera Enterprises Inc. NXRA133 NorthPoint Commcns Holdings NPNT134 NovaMed Eyecare Inc. NOVA135 Nutraceutical International Corp. NUTR136 Nvidia Corp. NVDA
137 Onix Systems Inc. ONX138 Onyx Software Corp. ONXS139 Optibase Ltd. OBAS140 Optical Sensors Inc. OPSI141 P.F. Chang's China Bistro Inc. PFCB142 Pantry Inc. (The) PTRY143 Paradyne Corp. PDYN144 Pepsi Bottling Group Inc. PBG145 PhyMatrix Corp. PHMX146 Pinnacle Holding Inc. BIGT147 Pivotal Corporation PVTL148 PLX Technology Inc. PLXT149 Polycom Inc. PLCM150 PrimaCom AG PCAG151 Prism Financial Corp. PRFN152 Prism Solutions Inc. PRZM153 Private Business Inc. PBIZ154 PrivateBancorp Inc. PVTB155 PrivateBancorp Inc. PVTB156 Prosperity Bancshares PRSP157 ProVantage Health Services Inc. PHS158 Radio One Inc. ROIA159 RAVISENT Technologies Inc. RVST160 RDO Eequipment Co. RDO161 Redback Networks Inc. RBAK162 Roadhouse Grill Inc. GRLL163 Rubio's Restaurants Inc. RUBO164 Rutherford-Moran Oil Corp. RMOC165 Salem Communications Corp. SALM166 SalesLogix Corporation SLGX167 Santa Fe International Corp. SDC168 Sapient Corp SAPE169 SBA Communications Corp. SBAC170 Scheid Vineyards Inc. SVIN171 Scientific Learning Corp. SCIL172 Scientific Learning Corp. SCIL173 Seminis Inc. SMNS174 ShowCase Corporation SHWC175 Skechers U.S.A. Inc. SKX176 Skylands Bank SKCB177 Software AG Systems Inc. AGS178 StanCorp Finacial Group SFG179 STAR Telecommunications Inc. STRX180 Statia Terminals Group N.V. STNV181 Steel Dynamics Inc. STLD182 Suburban Lodges of America SLAM183 Sun Community Bancorp Ltd, SCBL184 Swisscom AG SCM185 TC PipeLines LP TCLPZ186 TenFold Corporation TENF187 The Yankee Candle Co. Inc. YCC188 Time Warner Telecom Inc. TWTC189 Tower Financial Corp. TOFC190 Transition Systems Inc. TSIX191 Trex Co. Inc. TWP192 Troy Group Inc. TROY193 Troy Group Inc. TROY194 Tuesday Morning Corp. TUES195 U.S. Aggregates Inc. AGA196 Ultradata Corporation ULTD197 United Therapeutic Corp. UTHR198 United Therapeutic Corp. UTHR199 USA Detergents Inc. USAD200 Vail Banks VAIL201 VaxGen Inc. VXGN202 Vestcom International Inc. VESC203 VIALOG VLOG204 Vitria Technology Inc. VITR
205 Watchguard Technologies Inc. WGRD206 Wavecom S.A. WVCM207 WESCO International Inc. WCC208 Westfield America Inc. WEA209 Willbros Group Inc. WG210 Women First HealthCare Inc. WFHC211 Worldtalk Communications Corp WTLK212 Zany Brainy Inc. ZANY213 Zindart Limited ZNDTY

Appendix D
Summary derivation of Ye and Finn’s (1999) log-linear accounting based valuation model
This appendix summarizes the derivation detailed in Ye and Finn (1999, pp.10-12). Ye
and Finn replace Ohlson’s (1995) AR(1) assumption in abnormal earnings with an AR(1)
assumption in abnormal return on equity (ROE). Ye and Finn argue that the AR(1) assumption
in unnormalized abnormal earnings is reasonable only if a firm’s equity book value BV remains
constant over time. This requires the implausible condition that net dividends Dt are identical to
net income NIt (e.g., the firm neither repurchases nor issues stock, and pays cash dividends equal
to net income).30
The derivation of the log-linear model begins from the restated clean surplus relation:
(D.1)
where BVt is equity book value at the end of the period. Defining
permits (D.1) to be rewritten as:
(D.2)
In order to obtain a closed form valuation solution, Ye and Finn assume that the firm’s net
dividend Dt = 0. While this assumption is violated in real life, whether it is a more or less
accurate assumption than that underlying the Ohlson (1995) model is an empirical question.31
Given Dt = 0, assume that follows the AR(1) process
(D.3)
30 Net dividends are cash dividends plus repurchases of stock less issuances of stock.31 There is reason to believe that the extent to which the assumption that net dividends are zero may be small. For example, Hand and Landsman (1999) report that of the 6,330 firms in the Compustat population in fiscal 1996, only 31% paid cash dividends. No Net firms have ever paid cash dividends, and very few have repurchased stock. However, casual empiricism suggests that Net firms issue equity much more frequently than do non-Net firms.
28
where r is the equilibrium long-run ROE (equal to the cost of equity capital in competitive
markets), t are uncorrelated zero-mean random variables with bounded moments, and it reflects
the additional amount of information on rt available at time t = 0 but not reflected in r0.
Under these assumptions, Theorem 2 in Ye and Finn (1999) states that:
(D.4)
(D.5)
where Et[.] is the expectation operator at t; * is a linear combination of t, t = [1,T];
; and c may depend on T and .
Let the intrinsic value of the firm V0 be the terminal value at T discounted to t = 0, that
is:
(D.6)
where R is the cost of equity capital discount rate. Then by Theorem 2 expressed in equation
(D.5) above, V0 can be written as:
(D.7)
where may depend on r and T. Equation (D.7) provides the motivation for expressing the
market value of Net firms’ equity as a multiplicative, log-linear function of book equity and net
income.
29

References
Amir, E., and B. Lev, 1996, Value-relevance of nonfinancial information: The wireless communications industry, Journal of Accounting & Economics 22, 1-3, 3-30.
Barth, M.E., Beaver, W.H., and W.R. Landsman, 1998, Relative valuation roles of equity book value and net income as a function of financial health, Journal of Accounting & Economics 25; 1-34.
Berger, P.G., Ofek, E., and I. Swary, 1996, Investor valuation of the abandonment option, Journal of Financial Economics 42, 257-287.
Brown, S., Lo, K., and T. Lys, 1999, Use of R-squared in accounting research: measuring changes in value relevance over the last four decades, working paper, Northwestern Univ.
Collins, D.W., Pincus, M., and H. Xie, 1999, Equity valuation and negative earnings: The role of book value of equity, The Accounting Review 74, 29-61.
Cooper, M., Dimitrov, O., and P.R. Rau, 1999, A rose.com by any other name, working paper, Purdue University.
Dechow, P.M., Hutton, A.P., and R.G. Sloan, 1999, An empirical assessment of the residual income valuation model, Journal of Accounting & Economics 26, 1-34.
Feltham, G.A., and J.A. Ohlson, 1995, Valuation and clean surplus accounting for operating and financial activities, Contemporary Accounting Research 11, 689-732.
Feltham, G.A., and J.A. Ohlson, 1996, Uncertainty resolution and the theory of depreciation measurement, Journal of Accounting Research 34, 2, 209-234.
Frankel, R., and C.M.C. Lee, 1998, Accounting valuation, market expectation and cross-sectional stock returns, Journal of Accounting & Economics 25, 283-320.
Gerstein, M.H., 1999, Sales growth leaders, www.marketguide.com Research, 11/16/99.
Hand, J.R.M., and W.R. Landsman, 1999, The pricing of dividends in equity valuation, working paper, UNC Chapel Hill.
Hand, J.R.M., 2000a, Underpricing as marketing: the case of Internet IPOs, work-in-process, UNC Chapel Hill.
Hand, J.R.M., 2000b, The profitability of Internet firms, work-in-process, UNC Chapel Hill.
Hand, J.R.M., 2000c, The emperor’s new clothes? The (im)plausibility of long-run economic rents embedded in Internet stock prices, work-in-process, UNC Chapel Hill.
Hand, J.R.M., 2000d, Back to the future? Lessons from comparing the pricing of Internet and biotechnology stocks, work-in-process, UNC Chapel Hill.
Harris, T.S., and D. Kemsley, 1999, Dividend taxation in firm valuation, Journal of Accounting Research, forthcoming.
30

Ip, G., 1999, Analyst discovers the order in Internet stocks’ valuations, The Wall Street Journal, 12/27/99.
Kaplan, S.N., and R.S. Ruback, 1995, The valuation of cash flow forecasts: An empirical analysis, Journal of Finance 50, 1059-1093.
Kim, O., and R. Verrecchia, 1997, Pre-announcement and event-period information, Journal of Accounting & Economics 24, 395-419.
Lee, C.M.C., Myers, J., and B. Swaminathan, 1999, What is the intrinsic value of the Dow?, Journal of Finance 54, 1693-1742.
Lev, B., and T. Sougiannis, 1996, The capitalization, amortization, and value-relevance of R&D, Journal of Accounting and Economics 21, 107-138.
Mauboussin, M.J., 1999, Get real: using real options in security analysis, Credit Suisse First Boston Corp., http://www.capatcolumbia.com/frontiers/Fof10.pdf.
Ohlson, J.A., 1995, Earnings, equity book values, and dividends in equity valuation, Contemporary Accounting Research, 661-687.
Ohlson, J.A., 1999, Earnings, book values, and dividends in equity valuation: An empirical perspective, forthcoming in Contemporary Accounting Research.
Ritter, J.R., 1998, Initial public offerings, Warren Gorham & Lamont Handbook of Modern Finance, D.Logue and J. Seward, eds.
Schill, M.J., and C. Zhou, 1999, Pricing an emerging industry: Evidence from Internet subsidiary carve-outs, working paper, UC Riverside.
Wooley, S., 1999, Believe it or net, Virtual Investor, 1/27/99.
Wysocki, P.D., 1999a, Cheap talk on the web: The determinants of postings on stock message boards, working paper, University of Michigan Business School.
Wysocki, P.D., 1999b, Private information, earnings announcements and trading volume, or Stock chat on the Internet: A public debate about private information, working paper, University of Michigan Business School.
Ye, J., 1998, A statistical quest for equity valuation models, working paper, University of Chicago.
Ye, J., and Finn, M., 1999, Nonlinear and nonparametric accounting-based equity valuation models, working paper, Baruch College.
Yee, K.K., 1999, Residual income valuation of an optimally adaptive firm, forthcoming in Journal of Accounting, Auditing & Finance.
Zhang, G., 1999, Accounting information, capital investment decisions, and equity valuation: Theory and empirical implications, working paper, January.
31
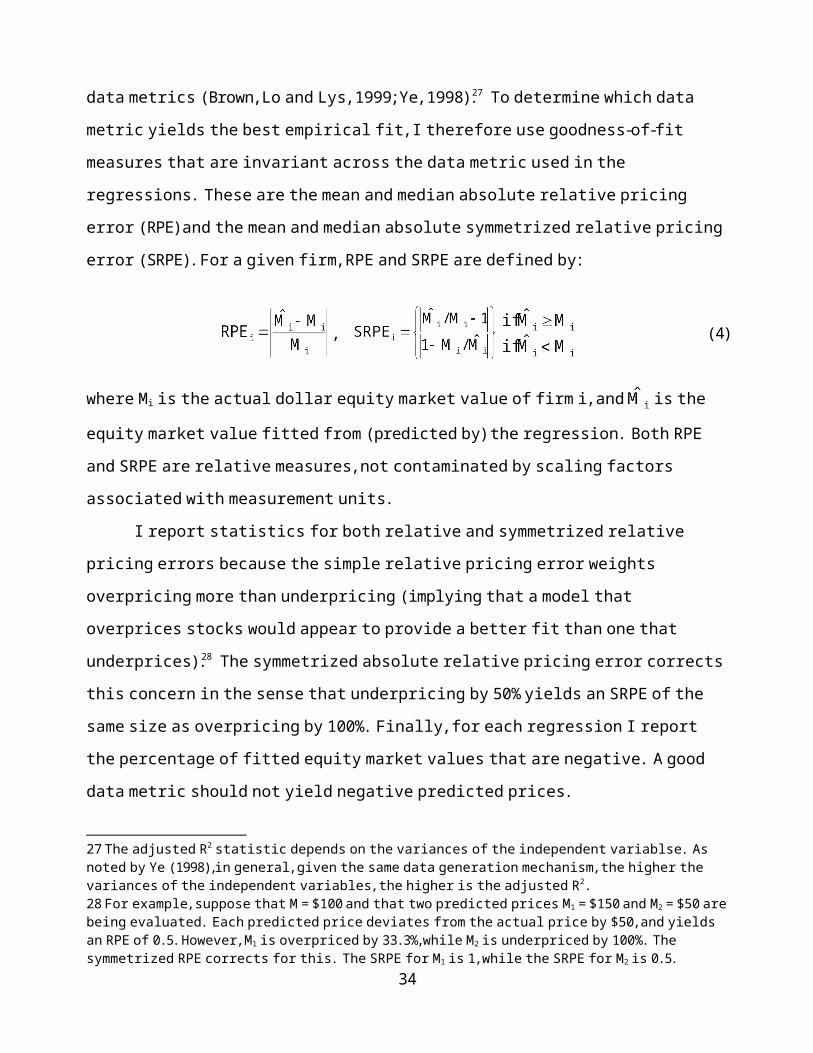
FIGURE 1
Performance of the Internet Stock Index (ISDEXTM) vs. NASDAQ Index ($COMPQ) over the period 1/1/97 to 12/27/99
32
FIGURE 2
Undeflated, per-share, and logged market value vs. pre-income book equity and core net income for 167 Net firms (1997:Q1–1999:Q2)
PANEL AUndeflated: market value vs. pre-net income book equityMarket value ($ millions) 200000 | A | | | | A180000 | | A | | |160000 | A | | | |140000 | | | | |120000 | A | | | |100000 | A A | | | | 80000 | | A | A | | A 60000 | | A | A | | A 40000 | | AA A | | A | B A 20000 | AA A A | ABAA | AA A | AEAAAAA | IZQIEBA 0 | ZZO A ---|----------|----------|----------|----------|----------|----------|----------|----------| 0 2000 4000 6000 8000 10000 12000 14000 16000
Pre-net income book equity ($ millions)
PANEL BUndeflated: market value vs. core net income
Market value ($ millions) 200000 | A | | | | A180000 | | A | | |160000 | A | | | |140000 | | | | |120000 | A | | | |100000 | AA | | | | 80000 | | A | A | | A 60000 | | A | A | | A 40000 | | A A A | | A | A AA 20000 | A A AA | A BA A | AA A | BADBA A |A A CEHXYIGA 0 | ADRZZJA -|-------------|-------------|-------------|-------------|-------------|-------------|-------------|
-200 0 200 400 600 800 1000 1200
Core net income ($ millions)
PANEL CPer-share: market value vs. pre-net income book equityStock price ($ per share) 350 | | | | | A | | 300 | | | | | | | A 250 | | A | A | | | | 200 | | | | A | A A A | | A A A A 150 | AA A | AA | AA A | AA AA B | A A A A A | A A A AA | A ABAAB 100 | A A A A AA | A AA AAA A | AA A A A A | AA B AAA A A A | BB DCB B A A | BABABACBB AA A | ABB A B B AC A A B A A A A 50 | A AADCA CBBB A CA A A A A | A BCDG EDBACB A B ACBA A | A AFEBHBCDDAC B A B AA A | ABACEEGDCFDDBBBBA AA A A | A CCDFKIAFGCCDCFDB BCAAB A A A | AAEDIOONHKLDGEGC D AA | ACGNRPMRRHIGCABCCA A 0 | GJFNHCGAA | --|-------------|-------------|-------------|-------------|-------------|-------------|-------------| 0 5 10 15 20 25 30 35
Pre-net income book equity ($ per share)
PANEL DPer-share: market value vs. core net income
Stock price ($ per share) 350 | | | | | A | | 300 | | | | | | | A 250 | | A | A | | | | 200 | | | | A | A A A | | A A AA 150 | B A | A A | A A A | AA A A A A | A A A A A | A A B A | AAAA A B A 100 | A A A AA A | A A A BA A | A CAA | A A AC A A AA | A A A A A A BA BBAB A | A A A AAAAA CAB AAB A | A A BB AA C CBA BB A 50 | B A A B AB CDB AC AAAA A A A | A A AAA CBBGECECAA D A AB | A A B BDCGDAAHDBCC AA | A A A CBABCBBBAHCBDEFD C A A
| AAAC BCCBCGCAEDEIHDFCFBDA A | B CA AAABDECFFIGIOIKIDDEDAABA A | A A A ABDGFNPXRWGJFD A 0 | AA BBABABCEMNED A | -|--------|--------|--------|--------|--------|--------|--------|--------|--------|--------| -3.0 -2.5 -2.0 -1.5 -1.0 -0.5 0.0 0.5 1.0 1.5 2.0
Core net income ($ per share)
PANEL ELog: market value vs. pre-net income book equity
loge{Market value + 1} (Market value in $ millions) 14 | | | | | | | A 12 | A B | A | B | A AA | AA | BA A | A 10 | AB A A A | A B AA A | A A A | A A A A A | AA BA A | A A A A AB AAAB BA | AAAA CCBCB AABA B A 8 | A A BDA BCAAACC A AA | A A B DABAAA BBA A | AABACEA AEBAB AC | CB DCC AE AAAA | A AADCEBABEBD BCE A | A AAA EFDEEEEC CBCBB | BAA BECIFFGAAADA BB A 6 | A A A ABBCBEIGBABD | A A A CBCDAGDHDABB | AB ACBCDDEBDBCCAB | A AACCDHHECCABA A | AABADBCBCDFDEABA | B BAAABBICCCAA | A AA CCDFC BCC A A 4 | A A B AAAABDAAC B | A B C AABCAB B | A ACB BACDB A | AAAAA AA A AA | AACAA AA A | A B ABBBCA AA A | A CBAA AA 2 | B AAA A | A BA | | | | | 0 | | --|-------------|-------------|-------------|-------------|-------------|-------------|-------------| 0 2 4 6 8 10 12 14
loge{pre-income book equity + 1} (pre-income book equity > 0 in $ millions)
PANEL FLog: market value vs. core net income
loge{Market value + 1} (Market value in $ millions) 14 | | | | | | | A 12 | A B | A | AA | A B | AA | A A A A | A 10 | A A A A B | A AA AA A | A A A | AA A A A | A AAA A A | B CB A A B A B A | AB BBABA D A A A A A B A AA 8 | A BAAAAC B AB A AA ADA B | A BCA CAB A A A AA AA | BB CBBAAADA A AA BA B B | A BC BAC B DAB B B | BBAAB CDCCADBB A A BACD | BBAB BABEGCCBD C A CAABBA C A | AAACAFAADDFEAB B CACA BC AAA 6 | ABBDEDFBCBA AA A ABA BA A | BDCGEDDBBDABA A B | BABCBHACBAABB A C ABABAA | ABBCDBCDDBE BD B C A A | ACCBFHECCAA BAAAA | AEDBBBBB A B CBAAA | A ABB IEEAAB AB 4 | ABAGBDB AA | BACAFCA A | AAABHC BAA | A BBBAB | AAAABABA | BDECBA
33
| B BCAAA 2 | B AA AA | A AAA | | | | | 0 | | --|---------|---------|---------|---------|---------|---------|---------|---------|---------| -6 -4 -2 0 2 4 6 8 10 12
loge{CNI+1} if CNI > 0; -loge{-CNI+1} if CNI < 0 (CNI in $ millions)
34

TABLE 1
Comparison of general information between Internet firms and non-Internet firmsa
Equity # of # of % of % of # trading % of1st day market employees institns. stock stock in days for public Mean
% under- value at end of last holding held by public float to float analyst pricing e ($ mil.) fiscal year Beta f stock g institns. h float i turns over j shorted k rating l
Panel A: Min. 24% $ 13 6 0.40 0 0% 6% 3 0% 1.0Median 37 865 169 2.55 29 8 31 19 5 1.6
N = 274 Mean 69 5175 418 2.85 79 13 37 24 9 1.6Internet firmsb Max. 606 357306 21000 7.74 2711 68 98 306 76 3.0
# obs. 272 261 254 78 259 261 261 251 258 242% < 0 10% 0 0 0 0 0 0 0 0 0
Panel B: Min. — m $ 1 2 1.52 0 0% 1% 4 0% 1.0N = 274 firms Median — 87 417 0.78 34 27 62 143 1 2.0randomly chosen Mean — 2029 4521 0.86 126 34 59 193 3 2.1from non-Net firms Max. — 149078 156700 3.77 2054 95 99 1450 49 4.0publicly-traded # obs. — 274 270 270 272 274 274 238 220 185on 12/31/98c % < 0 — 0% 0 7 0 0 0 0 0 0
Panel C: Min. 33% $ 2 6 0.82 0 0% 7% 4 0% 1.0Median 9 418 344 1.20 24 14 34 71 1 1.6
N = 213 firms Mean 27 1511 1733 1.20 45 19 39 129 4 1.7that went public Max. 525 35743 36900 3.17 364 84 99 3550 32 3.0at the same time # obs. 208 190 186 61 189 190 190 180 177 173as Net firmsd % < 0 14% 0 0 2 0 0 0 0 0 0
See next page for footnotes.

TABLE 1 (continued)
Comparison of general information between Internet firms and non-Internet firmsa
Footnotes:
a All data were taken from www.marketguide.com on 12/28/99 (where available) using a dynamic web data pull in Excel, unless otherwise noted. Details of data item definitions can be found at http://www.marketguide.com/mgi/HELP/glossary.html.b The n = 271 firms listed on www.internet.com’s InternetStockList (“Complete list of all publicly traded Internet stocks”) on 11/1/99 plus 3 firms on earlier listings that were no longer traded on 11/1/99 (Excite, Geocities, and Netscape).c Randomly selected from the set of all firms publicly traded at 12/31/98 per the Center for Research in Security Prices (CRSP).d Non-Net firms that went public within a few trading days of the Net firms per CRSP, www.ipomaven.com and www.ipocentral.com.e Underpricing data are taken from CRSP, www.ipocentral.com and www.sec.gov. Underpricing is defined as the difference between the closing price at the end of the 1st day of trading and the offer price, as a percentage of the offer price.f The slope of the 60 month regression line of the percentage price change of the stock relative to the percentage price change of the S&P 500. Not calculated if there is less than 24 months of data available. If unavailable from www.marketguide.com but available at www.stocksheet.com, then taken from www.stocksheet.com.g Number of institutions (pension funds, mutual funds, etc.) that report an investment position in the firm’s stock.h Shares held by institutions divided by total shares outstanding.i Public float divided by total shares outstanding. Public float is the number of freely traded shares in the hands of the public, defined as total shares outstanding less shares held by insiders, 5% owners, and Rule 144 shares.j Public float divided by average daily trading volume. Average daily trading volume is total trading volume over the prior 3 months divided by 66.k Number of shares sold short divided by total shares outstanding (as of 11/8/99).l Analyst ratings are coded as: Strong buy = 1, Buy = 2, Hold = 3, Underperform = 4, Sell = 5. Ratings are as of 12/23/99.m Data are not yet collected.

TABLE 2
Comparison of earnings and revenues between Internet firms and non-Internet firmsa
Mean Mean Forecast Actual Actual # of Std. dev. Std. dev. Std. dev.Actual forecast forecast long-term 1-year 3-year analysts $ EPS $ EPS long-term$ EPS $ EPS $ EPS EPS revenue revenue forecasting 1999 2000 EPS growth
1998 e 1999 f 2000 f growth g growth h growth h for 1999 i forecasts j forecasts j forecasts j
Panel A: Min. 113.34 8.95 6.76 15% 57% 66% 0 $ 0 $ 0.01 0%Median 1.04 0.87 0.76 50 119 115 4 0.04 0.08 14
N = 274 Mean 2.36 1.09 0.90 55 268 179 5.8 0.09 0.15 17Internet firmsb Max. 4.60 2.27 2.99 201 1000 1000 42 1.39 1.17 93
# obs. 244 239 235 198 234 125 261 218 215 122% < 0 87% 83 73 0 7 4 0 0 0 0
Panel B: Min. 12.79 12.54 1.75 0% 97% 61% 0 $ 0 $ 0 0%N = 274 firms Median 0.44 0.80 1.12 17 11 15 1 0.03 0.06 3randomly chosen Mean 0.41 0.88 1.31 20 29 30 3.9 0.06 0.10 5from non-Net firms Max. 8.32 5.54 6.04 88 877 897 29 0.86 0.67 53publicly-traded # obs. 268 187 165 140 269 262 274 133 118 100on 12/31/98c % < 0 32% 18 8 0 22 16 0 0 0 0
Panel C: Min. 94.95 3.71 5.79 8% 54% 45% 0 $ 0 $ 0 0%Median 0.04 0.40 0.58 30 45 36 3 0.02 0.04 5
N = 213 firms Mean 0.85 0.19 0.44 32 126 93 3.9 0.08 0.10 8that went public Max. 11.32 4.87 5.38 111 1000 1000 23 1.48 1.29 51at the same time # obs. 170 169 167 133 179 134 190 147 138 92as Net firmsd % < 0 49% 31 23 0 11 7 0 0 0 0
See next page for footnotes.

TABLE 2 (continued)
Comparison of earnings and revenues between Internet firms and non-Internet firms
Footnotes:
a All data were taken from www.marketguide.com on 12/28/99 (where available) using a dynamic web data pull in Excel, unless otherwise noted. Details of data item definitions can be found at http://www.marketguide.com/mgi/HELP/glossary.html.b The n = 271 firms listed on www.internet.com’s InternetStockList (“Complete list of all publicly traded Internet stocks”) on 11/1/99 plus 3 firms on earlier listings that were no longer traded on 11/1/99 (Excite, Geocities, and Netscape).c Randomly selected from the set of all firms publicly traded at 12/31/98 per the Center for Research in Security Prices (CRSP).d Non-Net firms that went public within a few trading days of the Net firms per CRSP, www.ipomaven.com and www.ipocentral.com.e Actual $ EPS 1998 data are taken from www.stocksheet.com and are for the firm’s most recently completed fiscal year (typically ending 12/31/98). EPS is defined as earnings per share from total operations (continuing plus discontinued operations) as taken from the 10-K, 10-Q, or preliminary statements. For firms that have gone public in 1999, actual $ EPS 1998 data reported by www.stocksheet.com are not on a pro-forma basis that would reflect the IPO. Further details on this definition can be found at http://www.stocksheet.com/definitions.html. This explains the huge negative outliers in panels A and C.f Forecasts are for diluted EPS excluding extraordinary items and discontinued operations.g Compound annual growth rate forecasted for EPS excluding extraordinary items and discontinued operations over the next 5 years.h Revenue growth rates greater than 1000% have been set to 1000%.i Only defined for those firms where equity market value is non-missing.j Only defined for those firms where there are 3 or more analyst forecasts of the item.

TABLE 3
Data definitions for variables used in historical descriptive statistics and regressions. All variables are in $ millions. Variable Label Compustat quarterly data item (description), and/or computation details
Equity market value MVE 14 (closing price at end of fiscal quarter) x 61 (common shares outstanding at end of fiscal quarter).
Income statement (for fiscal quarter)Special items SPEC 32 (special items).Net income NI 69 (net income or loss).Core net income CNI NI – SPEC. Revenues REV 2 (net sales).Expenses EXP REV – NI.Cost of sales COGS 30 (cost of goods sold).Selling, general + admin. expense SGA 1 (selling, general and administrative expense).Selling + marketing expense MKTG Hand-collected from 10-Qs. Not available on quarterly Compustat.Research + development costs RD 4 (research + development expense). Does not include writeoffs of purchased
in-process R&D since those are in special items.General + admin. expense GA SGA – MKTG – RD unless GA < 0 in which case GA = SGA – MKTG.Depreciation DEP 5 (depreciation and amortization).Balance sheet (at end of fiscal quarter)Cash + short-term investments CASH 36 (cash + short-term investments).Current assets CA 40 (total current assets).PP&E, net PPE 42 (total net property, plant and equipment).Total assets TA 44 (total assets).Current liabilities CL 49 (total current liabilities).Long-term debt LTD 51 (long-term debt).Total liabilities TL 54 (total liabilities).Equity book value BV 60 (total common equity at end of fiscal quarter).Book equity before quarter’s NI PIBV BV – NI {‘pre-income book equity’}Retained earnings RE 58 (retained earnings).Contributed capital CC BV – RE.

TABLE 4
Means and medians of key economic variables and ratios for 167 Net firms publiclytraded at the end of at least one fiscal quarter during the period 1997:Q1–1999:Q2
Contrasts across positive vs. negative quarterly core net income firm-quarter observations
Variable and ratio definitions (see table 3 for further details)
MVE = market value of equity at end of fiscal quarterPIBV = book value of equity at end of fiscal quarter before inclusion of quarter’s net incomeCNI = core net income for fiscal quarter (= net income less special items)REV = net sales for fiscal quarterRD = research and development expense for fiscal quarterMKTG = selling and marketing expense for fiscal quarterP–R = price-to-sales ratio (MVE REV)RD–R = RD as a percentage of sales (RD REV)M–R = selling and marketing expenses as a percentage of sales (MKTG REV)ROE = percentage core return on equity (CNI PIBV)B–M = book-to-market ratio (BV MVE)
Panel A: Means (in $ millions, unless % or ratios)
MVE PIBV CNI REV RD MKTG P – R RD – R M – R ROE B – M
CNI > 0a $ 9872 576 40.7 226 34.8 44.9 52 14% 28% 4.7% 0.17CNI < 0b 1444 113 –8.7 21 2.8 7.3 116 42% 80% –20.3% 0.21t-testc 3.5 3.5 4.9 4.3 3.7 4.1 –4.9 –4.2 –9.4 7.3 –2.5
Panel B: Medians (in $ millions, unless % or ratios)
MVE PIBV CNI REV RD MKTG P – R RD – R M – R ROE B – M
CNI > 0a $ 778 99 3.3 29 2.5 7.6 25 13% 25% 3.2% 0.12CNI < 0b 297 51 –4.2 7 1.0 4.0 39 15% 54% –8.9% 0.15Z-statisticd 6.9 7.0 19.6 11.1 5.9 6.6 –4.5 –2.6 –10.5 19.6 –2.3
a N = 165 firm-quarters where Net firms had positive quarterly core net income.b N = 564 firm-quarters where Net firms had negative quarterly core net income..c t-statistic testing for a difference in means (assuming unequal variances).d Z-statistic on Wilcoxon 2-sample rank sums test for a difference in medians (Normal approximation).
40

TABLE 5
Log-linear OLS multiple regressions of Internet firms’ end-of-fiscal-quarter equity marketvalue LMVE on accounting variables.a Data are restricted to firm-quarters in which pre-income
book equity PIBV > 0 and core net income CNI > 0. Regressions are pooled time-series cross-sectional with calendar quarter dummiesb
Panel A: Pearson correlationsc (n = 165)
LPIBV LCNI LREV LEXP LCOGS LGA LRD LMKTG LMVE 0.90 0.83 0.85 0.82 0.74 0.76 0.76 0.85LPIBV 0.87 0.89 0.87 0.79 0.78 0.83 0.91LCNI 0.89 0.87 0.79 0.81 0.84 0.86LREV 0.99 0.94 0.90 0.80 0.94LEXP 0.95 0.90 0.79 0.93LCOGS 0.85 0.66 0.81LGA 0.80 0.84LRD 0.89
Panel B: OLS multiple regressions where dependent variable = LMVE
Coefficient estimate on the following independent variables:
Intercept LPIBV LCNI LREV LEXP LCOGS LGA LRD LMKTG #obs. Adj.R 2
6.89d 165 –2% [13.7]e
1.03 1.22 165 82%[3.4] (26.6)f
4.90 1.08 165 72%[17.6] (20.3)
1.86 0.93 0.31 165 83%[4.9] (10.0) (3.6)
1.41 0.83 1.23 0.86 163 83%[4.5] (7.7) (2.3) (1.7)
1.42 0.74 0.62 0.31 0.16 0.01 0.05 153 83%[3.0] (5.6) (2.1) (2.1) (1.3) (0.0) (0.2)
a LZ = loge[Z + 1], where Z 0 is $ millions. See table 3 for definitions of data items Z prior to log transformations.b Sample is 167 Internet firms publicly traded at the end of one or more of their fiscal quarters 1997:Q1–1999:Q2.c All correlations are reliably non-zero with p-values of less than 0.001.d Mean coefficient on the ten quarter dummies 1997:Q1–1999:Q2 when no intercept is permitted.e Mean t-statistic on the ten quarter dummy coefficients when no intercept is permitted, multiplied by 10.0 1/2 = 3.16.f t-statistic relative to a null of zero.
41

TABLE 6
Log-linear OLS multiple regressions of Internet firms’ end-of-fiscal-quarter equity marketvalue LMVE on accounting variables.a Data are restricted to firm-quarters in which pre-income
book equity PIBV > 0 and core net income CNI < 0. Regressions are pooled time-series cross-sectional with calendar quarter dummiesb
Panel A: Pearson correlationsc (n = 564 or 530)
LPIBV LCNI LREV LEXP LCOGS LGA LRD LMKTG LMVE 0.84 –0.66 0.71 0.79 0.63 0.60 0.49 0.76LPIBV –0.69 0.66 0.76 0.60 0.60 0.44 0.73LCNI –0.61 –0.80 –0.66 –0.66 –0.33 –0.70LREV 0.95 0.88 0.78 0.42 0.82LEXP 0.88 0.81 0.44 0.87LCOGS 0.71 0.25 0.69LGA 0.29 0.67LRD 0.58
Panel B: OLS multiple regressions where dependent variable = LMVE
Coefficient estimate on the following independent variables:
Intercept LPIBV LCNI LREV LEXP LCOGS LGA LRD LMKTG #obs. Adj.R 2
5.34d 564 14% [24.9]e
1.34 1.09 564 73%[7.7] (34.4)f
3.52 –1.12 564 49%[17.9] (–19.7)
1.41 0.95 –0.29 564 74%[8.2] (22.8) (–5.4)
1.33 0.70 –0.01 0.57 564 78%[8.4] (15.8) (–0.0) (5.1)
1.73 0.66 0.24 0.03 0.03 0.23 0.29 530 78%[10.5] (14.8) (2.7) (0.5) (0.4) (4.3) (3.2)
a Each variable except LCNI is LZ = loge[Z + 1], where Z 0 is $ millions. LCNI = –loge[–CNI + 1] < 0. See table 3 for definitions of data items prior to log transformations.b Sample is 167 Internet firms publicly traded at the end of one or more of their fiscal quarters 1997:Q1–1999:Q2.c All correlations are reliably non-zero with p-values of less than 0.001.d Mean coefficient on the ten quarter dummies 1997:Q1–1999:Q2 when no intercept is permitted.e Mean t-statistic on the ten quarter dummy coefficients when no intercept is permitted, multiplied by 10.0 1/2 = 3.16.f t-statistic relative to a null of zero.
42
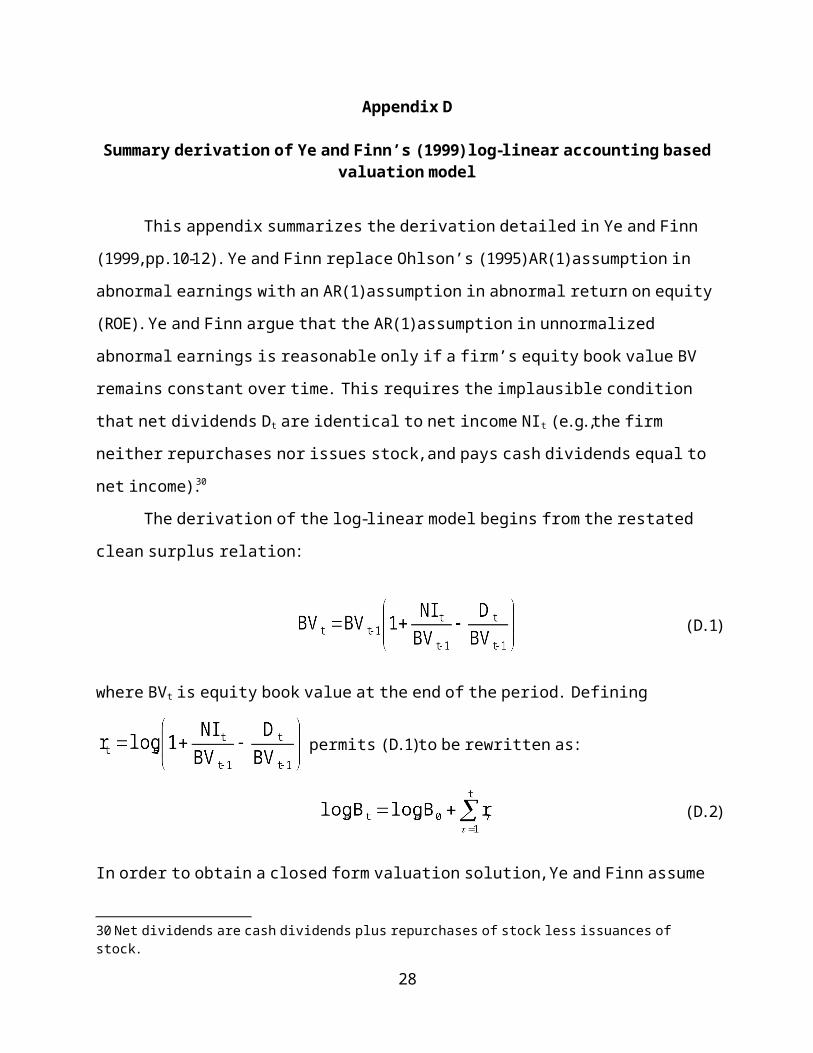
TABLE 7
Log-linear regressions of equity values of Internet firms before, at and after their IPO on accounting variables. Data are restricted to firm-quarters in which pre-income book equity
PIBV > 0 and core net income CNI < 0a
Each regression variable LZ {LMVE, LPIBV} is defined as LZ = loge[Z + 1], where Z 0 is $ millions. The variable LCNI is defined as loge[CNI + 1] if CNI 0, but as loge[CNI + 1] if CNI < 0. See table 3 for definitions of data items prior to log transformations.
End of event-quarteraccounting data
Dependent variable b is taken from c Intercept LPIBV LCNI #obs. Adj.R 2
LMVE{final offer price} Q0 1.78 0.79 –0.26 116 72%(7.3) (10.5) (–3.2)
LMVE{close of 1st trading day} Q0 1.41 0.99 –0.29 116 66%(4.1) (9.3) (–2.5)
LMVE{end of Q0} Q0 1.19 1.06 –0.27 116 64%(3.1) (9.0) (–2.2)
LMVE{end of Q+1} Q+1 0.58 1.34 –0.03 73 73%(1.4) (8.5) (–0.2)
LMVE{end of Q+2} Q+2 1.15 1.03 –0.28 56 72%(3.1) (7.1) (–1.4)
LMVE{end of Q+3} Q+3 1.19 0.96 –0.42 49 74%(3.1) (6.9) (–2.2)
LMVE{end of Q+4} Q+4 1.08 1.05 –0.33 46 69%(2.4) (6.9) (–1.6)
LMVE{end of Q+5} Q+5 1.23 1.00 –0.41 39 67%(2.5) (5.8) (–1.7)
LMVE{end of Q+6} Q+6 1.25 1.10 –0.21 34 80%(3.2) (8.1) (–1.1)
LMVE{end of Q+7} Q+7 1.94 0.74 –0.54 29 70%(3.9) (3.6) (–1.9)
LMVE{end of Q+8} Q+8 1.06 0.96 –0.42 27 80%(2.3) (6.3) (–1.9)
a The subset of the n = 274 Internet firms described in panel A of table 1 that went public between 1997:Q1 and 1999:Q2.b Equity values use the price denoted in {.} and shares outstanding at that time, with the exception of LMVE{final offer price} and LMVE{1st day close}. These are based on the number of shares outstanding immediately after the IPO.c Event time relative to IPO quarter = Q0. Thus Q–1 is the fiscal quarter ending immediately prior to the IPO date.
43
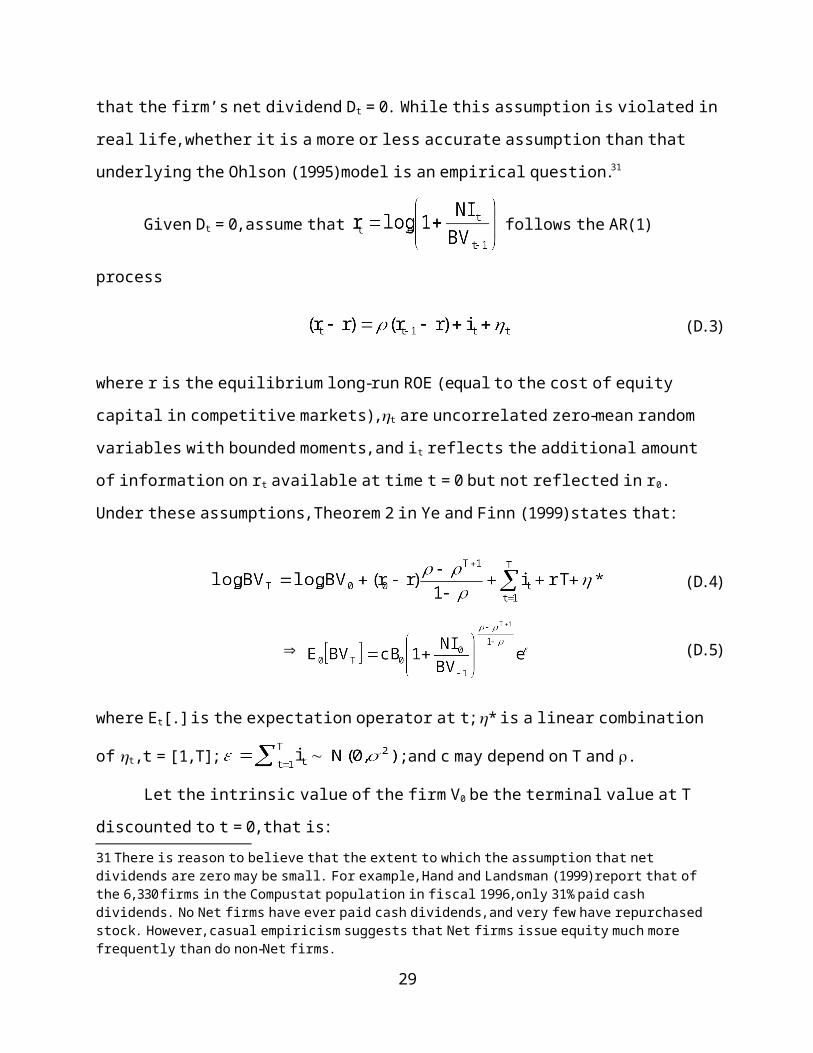
TABLE 8
Log-linear regressions of equity values of Internet firms before, at and after their IPO on accounting variables. Data are restricted to firm-quarters in which pre-income
book equity PIBV > 0 and core net income CNI < 0a
Each regression variable LZ {LMVE, LPIBV, LREV, LCOGSGA, LRD, LMKTG} is defined as LZ = loge[Z + 1], where Z 0 is $ millions. See table 3 for definitions of data items prior to log transformations.
End of event-quarterDependent accounting datavariable b is taken from Intercept LPIBV LREV LCOGSGA LRD LMKTG #obs. Adj.R 2
LMVE{final offer price} Q0c 1.88 0.63 0.05 0.17 0.26 0.34 107 77%(8.4)d (9.1) (0.6) (1.7) (3.0) (3.4)
LMVE{1st day close} Q0 1.62 0.74 –0.00 0.16 0.40 0.60 107 73%(5.1) (7.5) (–0.0) (1.1) (3.4) (4.2)
LMVE{end of Q0} Q0 1.34 0.82 –0.13 0.33 0.63 0.47 107 72%(3.8) (7.5) (–0.9) (2.1) (4.8) (3.0)
LMVE{end of Q+1} Q+1 1.02 0.77 0.10 0.25 0.21 0.67 68 80%(2.9) (5.6) (0.3) (0.8) (1.2) (3.1)
LMVE{end of Q+k} Q+k 1.45 0.64 0.46 0.02 0.36 0.22 263 82%for k = 2 to 8, pooled (10.4) (11.5) (3.5) (0.2) (4.6) (1.6)
a The subset of the n = 274 Internet firms described in panel A of table 1 that went public between 1997:Q1 and 1999:Q2.b Equity values use the price denoted in {.} and shares outstanding at that time, with the exception of LMVE{final offer price} and LMVE{1st day close}. These are based on the number of shares outstanding immediately after the IPO.c Event time relative to IPO quarter = Q0. Thus Q–1 is the fiscal quarter ending immediately prior to the IPO date.d t-statistic relative to a null of zero.
44

TABLE 9
Comparison of parameter estimates and measures of goodness-of-fit from log-linear, per-share and unscaled OLS regressions. Regressions are run separately for three groups of firms (Net firms, a random sample of non-Net firms, and IPO-matched
non-Net firms), and separately for quarters in which core net income is CNI positive vs. negative.
Market value of common equity = f{book equity, net income}. Data are restricted to firm-quarters where pre-income book equity PIBV > 0.
Panel A: Net firms, 1997:Q1–1999:Q2a
Quarterly core net income CNI > 0 Quarterly core net income CNI < 0 Data metric b Intcpt. PIBV CNI Adj.R 2 pM<0 c RPE d SRPE e #obs. Intcpt. PIBV CNI Adj.R 2 pM<0 RPE SRPE #obs.
Log-linear 1.9f 0.93 0.31 83% 0% 0.75 1.21 165 1.4 0.95 –0.29 74% 0% 0.84 1.47 564[4.9]g (10.0)h (3.6) {0.46} {0.63} [8.2] (22.8) (–5.4) {0.52} {0.70}
Per-share 35.7 –1.13 65.35 13% 0% 1.35 1.51 165 12.5 2.83 –7.22 20% 0% 1.62 1.84 564[9.8] (–0.7) (3.4) {0.56} {0.77} [9.2] (5.4) (–1.6) {0.62} {0.90}
Unscaled –647.2 30.0 –174.03 92% 27% 8.43 7.41 165 –14.5 6.39 –67.46 19% 18% 316.7 4.44 564[–0.6] (12.2) (–5.4) {2.07} {1.49} [–0.3] (6.4) (–2.9) {1.19} {1.38}
Panel B: Random sample of non-Net firms, 1997:Q1–1999:Q2i
Quarterly core net income CNI > 0 Quarterly core net income CNI < 0 Data metric Intcpt. PIBV CNI Adj.R 2 pM<0 RPE SRPE #obs. Intcpt. PIBV CNI Adj.R 2 pM<0 RPE SRPE #obs.
Log-linear 1.5 0.62 0.59 90% 0% 0.56 0.79 1838 1.3 0.72 –0.35 66% 0% 0.94 1.45 566[20.9] (32.0) (26.6) {0.36} {0.44} [8.9] (22.1) (–6.5) {0.54} {0.81}
Per-share 7.4 0.71 21.63 51% 0% 0.91 1.00 1838 5.1 0.85 0.84 22% 0% 1.46 1.64 566[20.6] (16.3) (21.8) {0.37} {0.46} [13.6] (12.5) (1.2) {0.59} {0.87}
Unscaled 268.9 1.52 32.47 75% 12% 4.94 5.27 1838 79.3 1.76 8.18 63% 1% 3.44 3.71 566[2.8] (12.9) (15.2) {1.08} {1.25} [4.4] (28.9) (4.4) {1.02} {1.51}
45

TABLE 9 (continued)
Comparison of parameter estimates and measures of goodness-of-fit from log-linear, per-share and unscaled OLS regressions. Regressions are run separately for three groups of firms (Net firms, a random sample of non-Net firms, and IPO-matched
non-Net firms), and separately for quarters in which core net income CNI is positive vs. negative.
Market value of common equity = f{book equity, net income}. Data are restricted to firm-quarters where pre-income book equity PIBV > 0.
Panel C: IPO-matched non-Net firms, 1997:Q1–1999:Q2j
Quarterly core net income CNI > 0 Quarterly core net income CNI < 0 Data metric Intcpt. PIBV CNI Adj.R 2 pM<0 RPE SRPE #obs. Intcpt. PIBV CNI Adj.R 2 pM<0 RPE SRPE #obs.
Log-linear 2.9 0.35 0.70 73% 0% 0.64 0.97 316 1.2 0.80 –0.34 71% 0% 0.60 0.88 161[13.4] (6.9) (12.4) {0.40} {0.52} [4.8] (12.6) (–4.0) {0.42} {0.54}
Per-share 14.4 –0.02 16.13 9% 0% 0.69 0.80 315 0.9 2.34 –5.51 34% 2% 0.83 1.24 161[19.3] (–0.1) (4.6) {0.34} {0.41} [1.3] (8.3) (–1.8) {0.50} {0.64}
Unscaled 132.7 2.51 3.12 97% < 1% 1.36 2.57 316 –27.2 3.04 –13.81 91% 14% 1.12 2.20 161[3.2] (54.0) (11.8) {1.36} {0.67} [–2.5] (14.0) (–3.4) {0.67} {0.81}
a 167 Internet firms publicly traded at the end of one or more of fiscal quarters 1997:Q1–1999:Q2.b The log-linear log-transposes each variable except LCNI according to LZ = loge[Z + 1], where Z 0 is $ millions. LCNI = –loge[–CNI + 1] < 0. See table 3 for definitions of data items prior to log transformations. The per-share metric deflates PIBV and CNI by the number of common shares outstanding at the end of the fiscal quarter. The unscaled metric is without deflation.c The percentage of predicted (fitted) equity market values that are negative.d RPE = absolute relative pricing error, defined in equation (4) of section 5.8.2 of the text. The mean RPE is given first, with the median RPE in {.}.e SRPE = absolute symmetrized relative pricing error, defined in equation (4) of section 5.8.2 of the text. The mean SRPE is given first, with the median SRPE in {.}.f Mean coefficient on the ten quarter dummies 1997:Q1–1999:Q2 when no intercept is permitted.g Mean t-statistic on the ten quarter dummy coefficients when no intercept is permitted, multiplied by 10.0 1/2 = 3.16.h t-statistic relative to a null of zero.i 91 non-Net firms that went public at the same time as the Net firms, and were publicly traded at the end of one or more of fiscal quarters 1997:Q1–1999:Q2.j 274 non-Net firms randomly selected from the set of NYSE+AMEX+NASDAQ firms reported by CRSP as being publicly traded at the end of 1998, and which were publicly traded at the end of one or more of fiscal quarters 1997:Q1–1999:Q2.
46