Embed Size (px)
Citation preview
Electronic copy available at: http://ssrn.com/abstract=2376997
1
After the Campaign: Outcomes of
Crowdfunding
January, 2014
Ethan Mollick
The Wharton School of the University of
Pennsylvania
Venkat Kuppuswamy
University of North Carolina
DRAFT
SUBJECT TO FUTURE REVISION
Note: This report is intended to be a summary of findings. Material from this paper may appear in other work
by the authors. We thank the Kauffman Foundation for its support of this work. All errors and omissions are
our own.
Electronic copy available at: http://ssrn.com/abstract=2376997
2
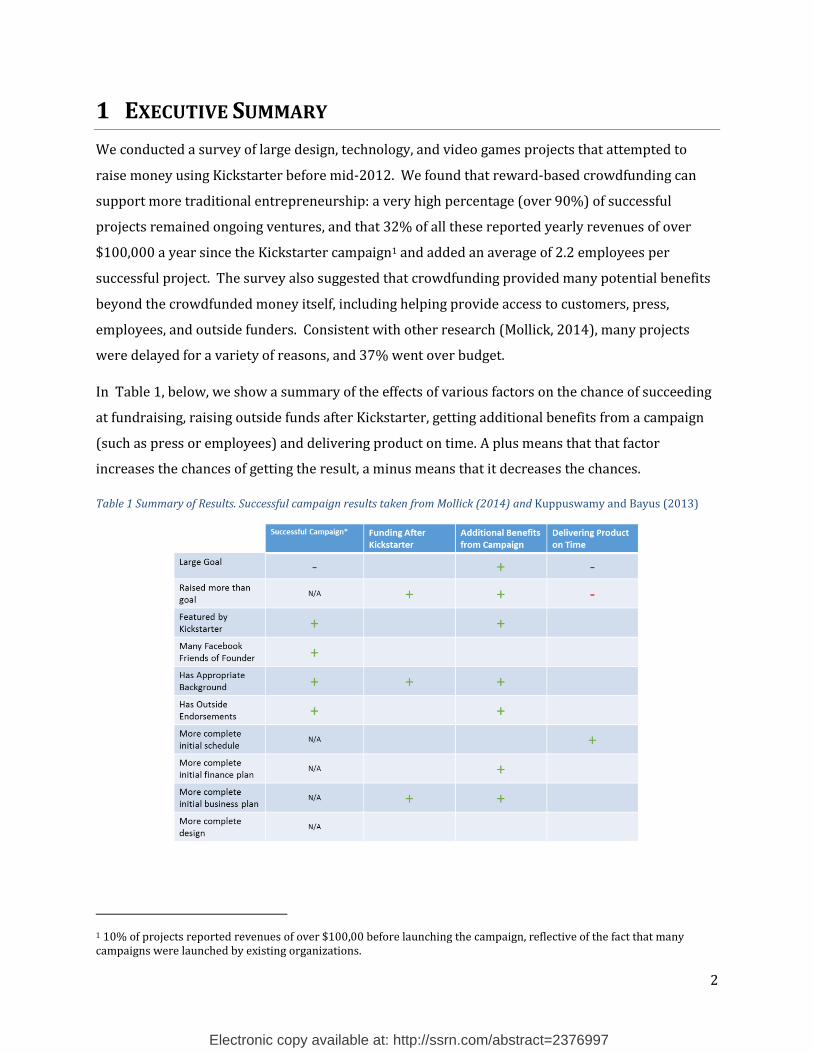
1 EXECUTIVE SUMMARY
We conducted a survey of large design, technology, and video games projects that attempted to
raise money using Kickstarter before mid-2012. We found that reward-based crowdfunding can
support more traditional entrepreneurship: a very high percentage (over 90%) of successful
projects remained ongoing ventures, and that 32% of all these reported yearly revenues of over
$100,000 a year since the Kickstarter campaign1 and added an average of 2.2 employees per
successful project. The survey also suggested that crowdfunding provided many potential benefits
beyond the crowdfunded money itself, including helping provide access to customers, press,
employees, and outside funders. Consistent with other research (Mollick, 2014), many projects
were delayed for a variety of reasons, and 37% went over budget.
In Table 1, below, we show a summary of the effects of various factors on the chance of succeeding
at fundraising, raising outside funds after Kickstarter, getting additional benefits from a campaign
(such as press or employees) and delivering product on time. A plus means that that factor
increases the chances of getting the result, a minus means that it decreases the chances.
Table 1 Summary of Results. Successful campaign results taken from Mollick (2014) and Kuppuswamy and Bayus (2013)
1 10% of projects reported revenues of over $100,00 before launching the campaign, reflective of the fact that many campaigns were launched by existing organizations.
3
2 INTRODUCTION TO CROWDFUNDING
Crowdfunding is a relatively new way of financing new ventures, though the underlying idea of
raising money from large groups of people over the internet has been the subject of continual
experimentation since the late 1990s. Crowdfunding draws inspiration from concepts like micro-
finance (Morduch, 1999) and crowdsourcing (Poetz & Schreier, 2012), but represents its own
unique category of fundraising, facilitated by a growing number of internet sites devoted to the
topic. As in any emergent field, the popular and academic conceptions of crowdfunding are in a
state of evolutionary flux that makes complete definitions arbitrarily limiting. Building on the
definition of Schwienbacher and Larralde (2010), Mollick (2014) define crowdfunding as follows:
“Crowdfunding refers to the efforts by entrepreneurial individuals and groups – cultural, social, and
for-profit – to fund their ventures by drawing on relatively small contributions from a relatively
large number of individuals using the internet, without standard financial intermediaries.”
There are four main models for crowdfunding. Some crowdfunding efforts, such as art or
humanitarian projects, follow a patronage model, placing funders in the position of philanthropists,
who expect no direct return for their donations. A second model, the lending model, is one in which
funds are offered as a loan, with the expectation of some rate of return on capital invested. In the
case of microfinanced loans, the lender may be more interested in the social good promoted by the
venture than any return generated by the loan, thus including patronage model elements as well.
A third approach, commonly called reward-based crowdfunding, is the most prevalent as of
the time of this writing. In this approach, funders receive a reward for backing a project. This can
include being credited in a movie, having creative input into a product under development, or being
given an opportunity to meet the creators of a project. Alternately, reward-based crowdfunding
treats funders as early customers, allowing them access to the products produced by funded
projects at an earlier date, better price, or with some other special benefit. The “pre-selling” of
products to early customers is a common feature of those crowdfunding projects that more
traditionally resemble entrepreneurial ventures, such as projects producing novel software,
hardware, or consumer products. This is the model in this report.
Finally, as broadly legalized in the US by the Jumpstart Our Business Startups Act, passed in
April 2012, and previously legalized in other countries, crowdfunding efforts may also treat funders
as investors, giving them equity stakes or similar consideration in return for their funding. As of
early 2014, equity crowdfunding is generally not permitted in the United States, and still relatively
4
rare worldwide, making up less than 5% of all crowdfunding investment (Massolution, 2013).
Equity crowdfunding is subject to high levels of regulation (Heminway & Hoffman, 2010), and the
eventual adoption of the approach relative to other forms of crowdfunding are uncertain. Even in
the absence of equity crowdfunding, investor model crowdfunding can take other forms. For
example, funders might receive including a shares of future profits or royalties; a portion of returns
for a future planned public offering or acquisition; or a share of a real estate investment, among
other options.
Given its novelty, why do we care about crowdfunding? A relatively small proportion of
individuals seeking crowdfunding are traditional entrepreneurs, as crowdfunding is increasingly
popular in the arts and other fields (in 2012, 10% of Sundance films were crowdfunded (Dvorkin,
2013)). However, crowdfunded entrepreneurs have proven to be extremely innovative. According
to industry experts, many of the most important projects in consumer electronics as of 2013 are
funded by crowdfunds, including novel 3-D printers, electronic watches, video game consoles, and
computer hardware (Jeffries, 2013). Further, some of the most successful crowdfunded projects
were turned down by venture capitalists, before successfully raising funding from sites such as
Kickstarter (Jeffries, 2013).
In this study, we are particularly interested in exactly these kinds of projects, where
crowdfunding serves as a potential source of funding for new ventures, as well as artistic projects.
To that end, we conducted a survey of projects that raised funding on Kickstarter to examine the
long-term implications of crowdfunding.
3 DATA AND METHODS
3.1 SAMPLE AND DATA COLLECTION
For this study, we sampled both successful and unsuccessful projects . In order to examine
projects that most closely approximated more conventional start-up companies, we limited our
sample to three categories: Technology, Product Design, and Video Games. We also examined only
larger projects, seeking over $5,000 in funding, and those that completed funding between 2009
and July, 2012. This resulted in a sample of 596 successful and 1,509 failed projects. Of the failed
projects, we randomly selected 550 for follow-up. For more information on this dataset, including
how it was constructed, and the factors that led to successful funding, see Mollick, (2014) available
for free here.

5
We used the Kickstarter’s internal messaging feature to request that project creators
complete on online survey. We followed up these initial messages with emails to creators, when
their email addresses were publically available. For successful projects, we received responses from
230 subjects (response rate of 39%) and after accounting for duplicate and incomplete entries, we
ended up complete response data from 158 projects (26.5% of the original sampling frame),
although many other responses were substantially complete. Our response rate is in line with
similar studies in the literature that have used web-based surveys (see Kriauciunas, Parmigiani, and
Rivera-Santos 2011, for a comprehensive review of response rates). Further, statistical testing
showed the successful respondents to be representative in terms of goals, funding, and other
factors. Response rates for unsuccessful projects was lower, with 128 total responses (23.3%) of
which 83 (15.1%) were complete. This subsample was on the lower bound of response rates
published in the literature. We report results for the full sample, and separately report data for both
successful and unsuccessful projects.
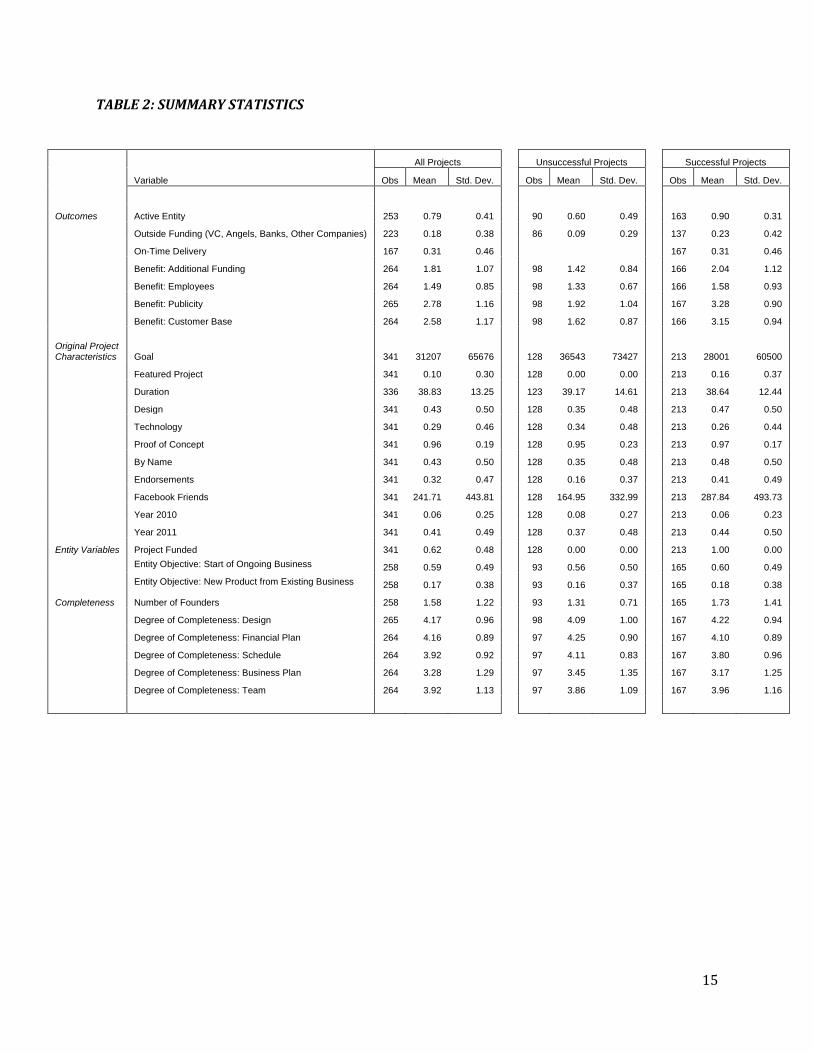
3.2 VARIABLES We collected a variety of variables, see Table 2 (at the back of the document) for a summary.
3.2.1 Outcomes
Active Entity If the organization was continuing to operate as of the end of December, 2013. Over
90% of projects were active at the time of the survey. A total of 38.5% of entities who successfully
raised funds reported yearly revenues of 0-$25,000, 24.5% reported $25,000-$100,000, and 32%
reported over $100,000. For the same group prior to the campaign, 44% of entities did not exist
and 31% reported yearly revenues of 0-$25,000, 13% reported $25,000-$100,000, and 11%
reported over $100,000.
Outside Funding This variable indicated if the project raised additional money from venture
capitalists, angel investors, or banks after the campaign concluded. Figure 1 shows sources of
outside funds beyond the crowdfunding campaign.
6
Figure 1 Outside funds raised
On-Time Delivery As found by Mollick (2014) we found that delivery delays were common, and a
few products had failed to deliver entirely to date, despite the fact that all project delivery deadlines
were in 2013 or earlier. This variable was 1 if the delivery was on-time. We also asked for self-
reported satisfaction levels for projects, which can be seen below.
Figure 2 Reported project outcomes
0.00% 5.00% 10.00% 15.00% 20.00% 25.00%
Myself/Other Creators
Relatives/Friends
Bank Loans (not including Lines of Credit)
Other companies
Angel investors
VCs
Others (grants, government, etc.)
Followup crowdfunding campaigns
Did You Raise Additional Funds For This Project from These Sources?
Unsuccesful Successful
0%
10%
20%
30%
40%
50%
Results were similar Results were better Backers happy with outcome
For Successful Projects: How Were the Outcomes?
Strongly Disagree Disagree Neither Agree nor Disagree Agree Strongly Agree
7
Ex-Post Benefits We have tracked four types of ex-post benefits, all of which were measured using a
7-point Likert scale ranging from 1 (‘Not at all’) to 7 (‘Very much’). Additional Funding, the extent to
which a project “Raise[d] additional funds from outside sources after the campaign.” Employees, the
degree to which the campaign helped organizations “find and/or hire employees.” Publicity,
whether the campaign helped “bring press attention to my project.” And Customer Base, where we
examined whether success helped “develop a customer base from those who contributed.”
3.2.2 Project Characteristics
Project goal: The amount founders seek to raise using crowdfunding. Kickstarter follows an “all or
nothing” model, so funders’ pledge money is only collected if the goal is reached. While other
crowdfunding efforts do not always follow this model, it is currently the dominant approach to
crowdfunding, and parallels the way that other funding efforts for new ventures work.
Funding level: The percentage of a project’s goal actually raised by founders. Projects that raise at
least their goal are considered successful or funded projects, and they are paid the total pledged to
them by the crowdfunding site. Projects can raise more than their goal.
Facebook friends of founders: The role of social networks in funding new ventures has long been
noted as important (Hsu, 2007; Shane & Cable, 2002). Since many accounts in Kickstarter are
linked to Facebook, it is possible to determine how many Facebook connections each founder has.
This provides a control for the size of a founder’s social network. Non-zero Facebook friends are
available for slightly under half of all observations.
Reward levels: Most projects offer rewards to funders, depending on the level of funds they pledge.
These can range from credits in film or art projects to large-scale rewards, such as the ability to
direct or influence projects. A common category of rewards are the products being developed by
the founders, in which case crowdfunding acts as a “pre-order” system. Rewards levels are the
number of reward tiers offered to funders, typically these would start relatively small, with an
acknowledgement or formal thanks, and escalate to larger rewards, including on-site visits or
special versions of products.
Category: Projects are categorized by Kickstarter into one of a number of categories, including Film,
Dance, Art, Design and Technology. Design and Technology projects are treated somewhat
differently by Kickstarter, since they usually deliver concrete products as rewards. These projects
need to produce a manufacturing plan when starting a Kickstarter project.

8
Duration: The number of days for which a project accepts funding. Although Kickstarter initially
allowed projects to raise funds for as many as 90 days, it now limits this time to 60 days, but
encourages 30 day funding windows.
By Name, Proof of Concept, Background, Two research assistants were used to code the degree to
which projects demonstrated outside endorsements (such as media quotes), provided evidence of
prototypes or early versions of projects, and invoked past successful projects or employers by
name. The raters agreed in the vast majority of cases (88% agreement on endorsement, 91% on
prototypes, and 81% on the use of past project names). Kappa was substantial with regards to
project names (ϰ=.57) and endorsements (ϰ=.52), and moderate on prototypes (ϰ=.45) (Munoz &
Bangdiwala, 1997). Though the models proved robust regardless of which RA ratings were used,
for the tables herein I used the union of the two ratings. That is, if one RA felt there was an
endorsement, and another RA did not, I coded that as an endorsement. This is because the signals
of quality in crowdfunding result from the perception of an untrained group of investors – if at least
part of the group of investors saw a signal as present, they would be expected to act as if the signal
was identified.
Degree of Completeness: We asked founders the degree to which they had completed product
design, a financial plan (budget), schedule, business plan, or had assembled a team prior to the
campaign.
Objective: We also asked whether the goal of the campaign involved starting a new business or
creating a new product from an existing business
SUMMARY DATA IN TABLE 2 AT BACK OF DOCUMENT
4 DESCRIPTIVE CHARACTERISTICS
Before providing a detailed analysis of the factors that lead to long-term success, it is worth giving
an overview of the demographics of crowdfunders, as well as their motivations for seeking funding.
4.1 WHO IS CROWDFUNDING? In the categories we examined, project creators were generally well-educated, with 95% having at
least some college. At the time they started their project, 42% were employed full time, and nearly
50% reported some form of self-employment (either founders of a company, independent
9
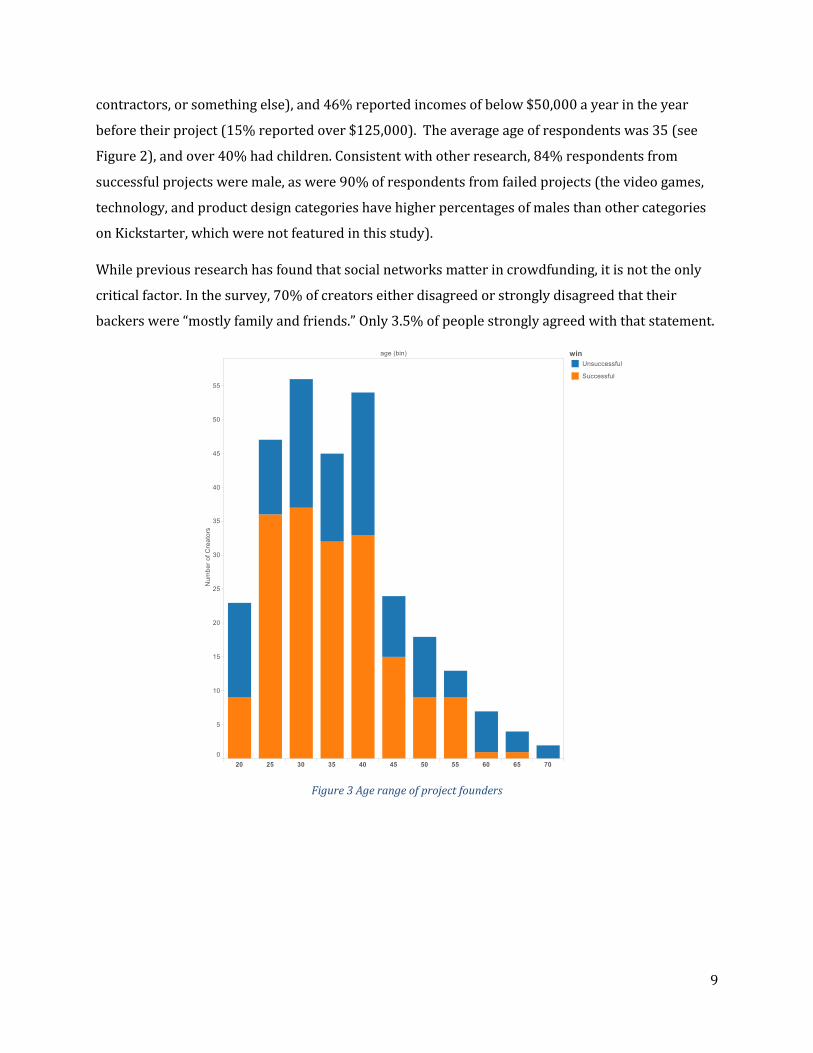
contractors, or something else), and 46% reported incomes of below $50,000 a year in the year
before their project (15% reported over $125,000). The average age of respondents was 35 (see
Figure 2), and over 40% had children. Consistent with other research, 84% respondents from
successful projects were male, as were 90% of respondents from failed projects (the video games,
technology, and product design categories have higher percentages of males than other categories
on Kickstarter, which were not featured in this study).
While previous research has found that social networks matter in crowdfunding, it is not the only
critical factor. In the survey, 70% of creators either disagreed or strongly disagreed that their
backers were “mostly family and friends.” Only 3.5% of people strongly agreed with that statement.
Figure 3 Age range of project founders
10
4.2 REASONS FOR SEEKING FUNDING
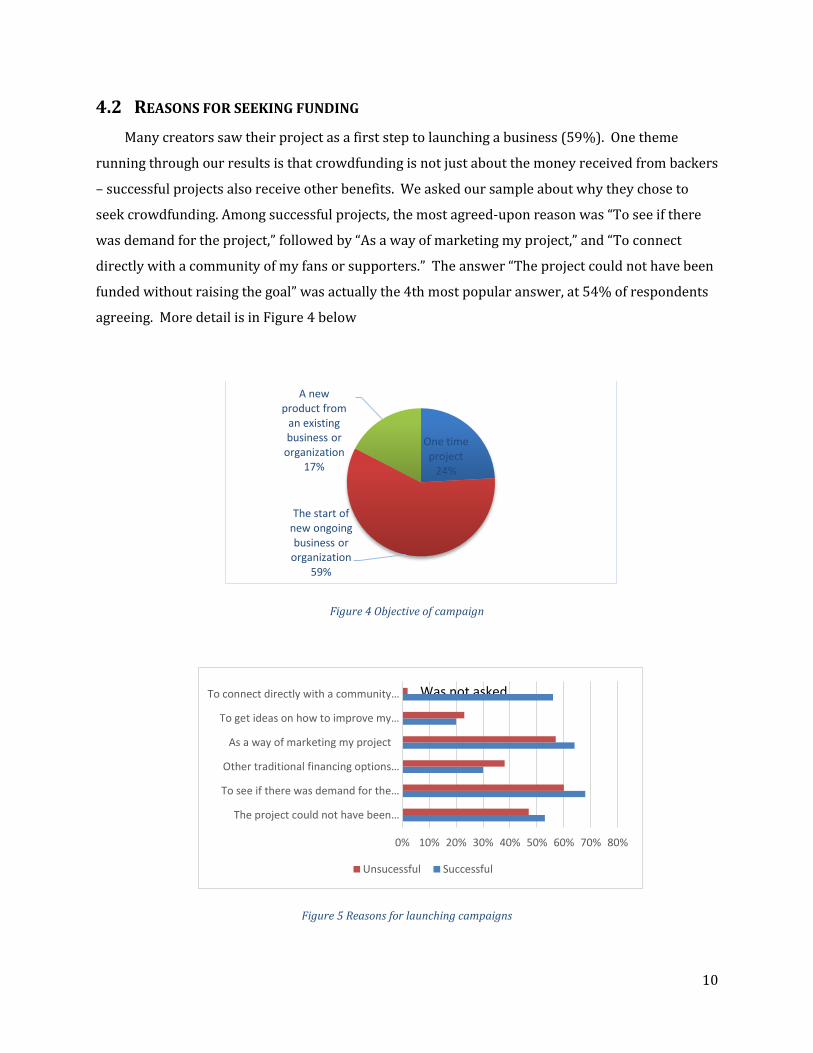
Many creators saw their project as a first step to launching a business (59%). One theme
running through our results is that crowdfunding is not just about the money received from backers
– successful projects also receive other benefits. We asked our sample about why they chose to
seek crowdfunding. Among successful projects, the most agreed-upon reason was “To see if there
was demand for the project,” followed by “As a way of marketing my project,” and “To connect
directly with a community of my fans or supporters.” The answer “The project could not have been
funded without raising the goal” was actually the 4th most popular answer, at 54% of respondents
agreeing. More detail is in Figure 4 below
Figure 4 Objective of campaign
Figure 5 Reasons for launching campaigns
One time project
24%
The start of new ongoing business or
organization59%
A new product from
an existing business or
organization17%
0% 10% 20% 30% 40% 50% 60% 70% 80%
The project could not have been…
To see if there was demand for the…
Other traditional financing options…
As a way of marketing my project
To get ideas on how to improve my…
To connect directly with a community…
Unsucessful Successful
Was not asked
11
4.3 SELF-REPORTED REASONS FOR FAILURE
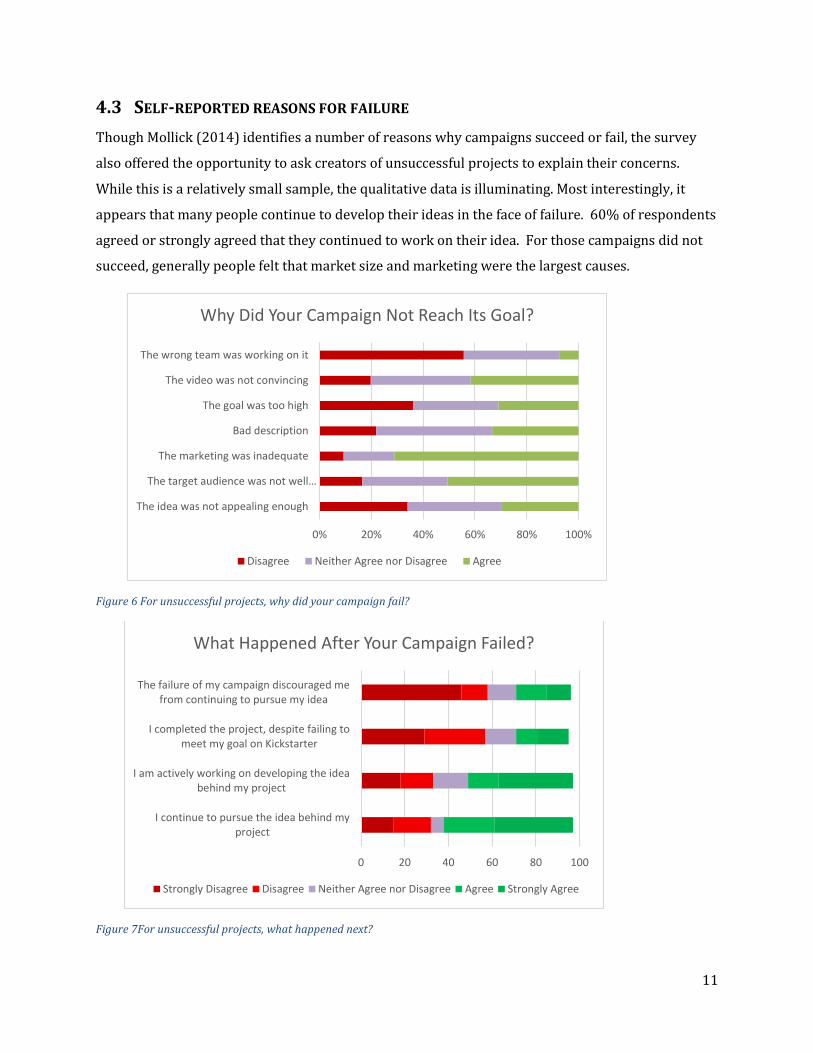
Though Mollick (2014) identifies a number of reasons why campaigns succeed or fail, the survey
also offered the opportunity to ask creators of unsuccessful projects to explain their concerns.
While this is a relatively small sample, the qualitative data is illuminating. Most interestingly, it
appears that many people continue to develop their ideas in the face of failure. 60% of respondents
agreed or strongly agreed that they continued to work on their idea. For those campaigns did not
succeed, generally people felt that market size and marketing were the largest causes.
Figure 6 For unsuccessful projects, why did your campaign fail?
Figure 7For unsuccessful projects, what happened next?
0% 20% 40% 60% 80% 100%
The idea was not appealing enough
The target audience was not well…
The marketing was inadequate
Bad description
The goal was too high
The video was not convincing
The wrong team was working on it
Why Did Your Campaign Not Reach Its Goal?
Disagree Neither Agree nor Disagree Agree
0 20 40 60 80 100
I continue to pursue the idea behind myproject
I am actively working on developing the ideabehind my project
I completed the project, despite failing tomeet my goal on Kickstarter
The failure of my campaign discouraged mefrom continuing to pursue my idea
What Happened After Your Campaign Failed?
Strongly Disagree Disagree Neither Agree nor Disagree Agree Strongly Agree
12
5 LONG-TERM OUTCOMES OF CROWDFUNDING
We examined a variety of factors to determine what might lead to crowdfunding success.
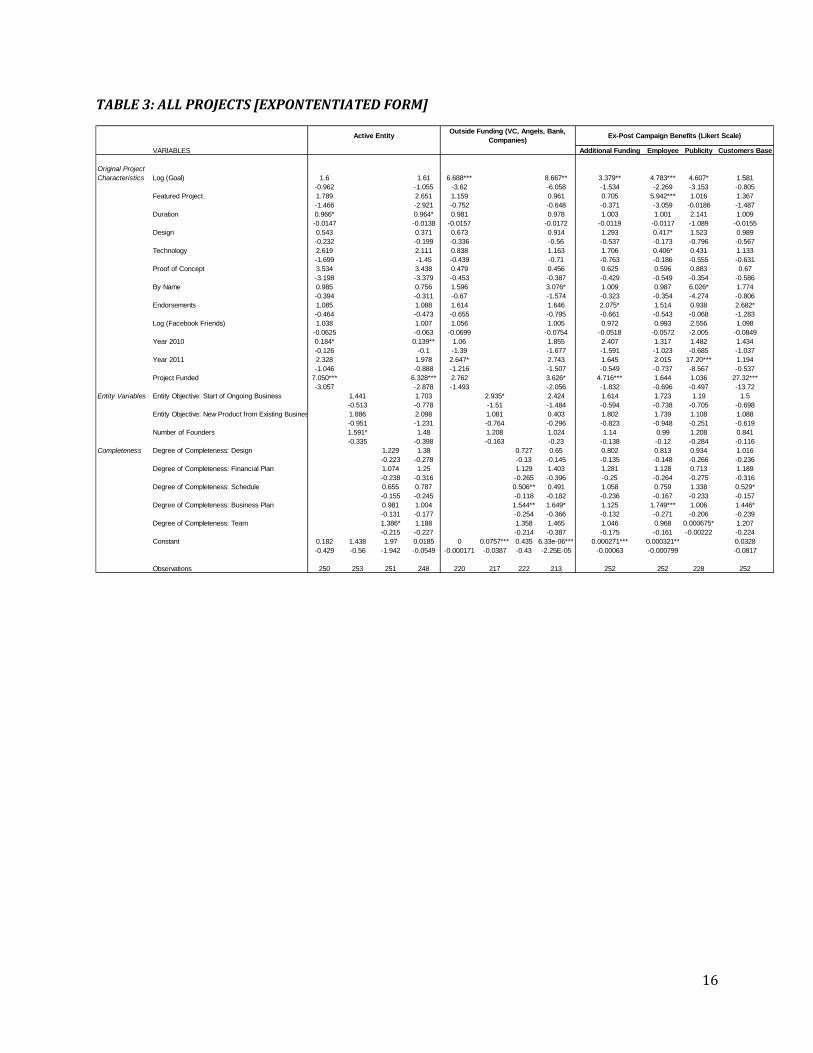
5.1 MODELS
Due to the ordinal nature of our ex-post outcomes of interest, we model External Financing,
Finding Employees, Press Attention, and Customer Base using an ordinal logit specification with
robust standard errors. To model project delivery, external fundraising, and continuing
organizational status, we similarly employ standard logit with robust standard errors. All results in
Table 3 is in expontentiated form, the other tables are not.
RESULTS BELOW ARE IN TABLES 3-5 AT END OF DOCUMENT
5.2 FACTORS LEADING TO ONGOING ORGANIZATIONS
Though the vast majority (over 90%) of successful projects turned into ongoing organizations,
few factors clearly predicted which projects would remain active. The exception was detailed pre-
campaign financial planning detailing how funds would be spent. Creators who engaged in this
activity were more likely to continue to operate, whether they were successful or unsuccessful in
raising funds. As we find in all cases, projects that succeed in their campaigns outperform those
that don’t.
5.3 FACTORS LEADING TO FURTHER OUTSIDE FUNDING
Some projects raised additional funds beyond crowdfunding. Most common was additional
self-funding (in over 20% of successful projects) or friends and family funding (in over 15% of
successful projects), but outside risk capital in the forms of loans, venture capital, or angel investing
occurred as well. Projects with larger goals that were funded, and projects that were overfunded
the most, were most likely to achieve outside funding. Additionally, having a substantially complete
business plan before fundraising also seemed to predict outside funding. Finally, projects where the
creators had specific industry experience were three times as likely to get outside funding as those
that did not have similar backgrounds. Again, projects that succeed in their campaigns are more
likely to gain outside funding than those that don’t.
13
5.4 FACTORS LEADING TO EX-POST BENEFITS
Many projects found that their campaign directly helped them get access to funding,
employees, press, or helped them build a robust customer base. A number of factors helped predict
these benefits, though different factors predicted different aspects. Tables 3-5 show these
relationships in detail. Generally, higher goals, more funding, and more developed business plans
were particularly helpful. Outside endorsements and appropriate backgrounds were also helpful in
gaining benefits from the campaign beyond money. Successful campaigns also had more benefits.
5.5 DELIVERY DELAYS
Most projects had delivery delays. As previously discussed by Mollick (2014), these delays are
predicted by project size (goal) and the degree to which it was overfunded. Having a complete
project schedule before the launch of the campaign helped reduce delays.
6 CONCLUSION
This survey, combined with other research on crowdfunding, suggests that reward-based
crowdfunding may be a useful path to creating ongoing businesses. The vast majority of projects in
our sample turned into ongoing business efforts. Successfully funded projects added, on average,
2.2 employees (SD 9.6) since their campaigns ended, with some growing much more quickly.
Additionally, though successful campaigns raised over $28M, that was not the only benefit that
crowdfunding provided. Many firms reported that their campaigns provided benefits in building
customer communities, learning about markets, and publicity. Many also were able to leverage
their campaigns to raise additional outside funds. At the same time, most projects were late in
delivering promised results.
For creators seeking funding, there is some clear advice from this study. Projects that are
better prepared in terms of business plans and schedules are more likely to gain benefits and
deliver on time. Outside endorsements and having appropriate backgrounds is also helpful. Bigger
projects are less likely to be funded, but have more benefits when they are. Additionally, some of
the factors found to lead to successful fundraising (having many Facebook friends, being featured
by Kickstarter), were less useful in getting long-term benefits from Kickstarter.
Future research is needed, but crowdfunding represents a potentially powerful way to create
and nurture new businesses, as well as creative projects.
14
REFERENCES
Burkett, E. (2011). Crowdfunding Exemption-Online Investment Crowdfunding and US Secrutiies
Regulation, A. Transactions: Tennessee Journal of Business Law, 63.
Dvorkin, E. (2013). Kickstarter-funded films headline Sundance. Kickstarter Blog. Retrieved
February 05, 2013, from http://www.kickstarter.com/blog/kickstarter-funded-films-
headline-sundance
Heminway, J., & Hoffman, S. (2010). Proceed at Your Peril: Crowdfunding and the Securities Act of
1933. Tenn. L. Rev.
Hsu, D. (2007). Experienced entrepreneurial founders, organizational capital, and venture capital
funding. Research Policy, 36(5).
Jeffries, A. (2013). How Kickstarter stole CES: the rise of the indie hardware developer. The Verge.
Retrieved January 12, 2013, from
http://www.theverge.com/2013/1/10/3861406/kickstarter-at-ces
Kuppuswamy, V., & Bayus, B. L. (2013). Crowdfunding Creative Ideas: The Dynamics of Project
Backers in Kickstarter. SSRN Electronic Journal. doi:10.2139/ssrn.2234765
Lin, M., & Viswanathan, S. (2013). Home Bias in Online Investments: An Empirical Study of an
Online Crowd Funding Market. papers.ssrn.com.
Massolution. (2013). 2013 Crowdfunding Report.
Mollick, E. (2014). The Dynamics of Crowdfunding: Determinants of Success and Failure. Journal of
Business Venturing. doi:10.2139/ssrn.2088298
Morduch, J. (1999). The Microfinance Promise. Journal of Economic Literature, 37(4), 1569.
Munoz, S., & Bangdiwala, S. (1997). Interpretation of Kappa and B statistics measures of agreement.
Journal of Applied Statistics.
Poetz, M., & Schreier, M. (2012). The value of crowdsourcing: can users really compete with
professionals in generating new product ideas? Journal of Product Innovation Managment,
29(2).
Schwienbacher, A., & Larralde, B. (2010). Crowdfunding of Small Entrepreneurial Ventures. SSRN
Electronic Journal. doi:10.2139/ssrn.1699183
Shane, S., & Cable, D. (2002). Network ties, reputation, and the financing of new ventures.
Management Science, 48(3), 364.
15
TABLE 2: SUMMARY STATISTICS
All Projects Unsuccessful Projects Successful Projects
Variable Obs Mean Std. Dev. Obs Mean Std. Dev. Obs Mean Std. Dev.
Outcomes Active Entity 253 0.79 0.41 90 0.60 0.49 163 0.90 0.31
Outside Funding (VC, Angels, Banks, Other Companies) 223 0.18 0.38 86 0.09 0.29 137 0.23 0.42
On-Time Delivery 167 0.31 0.46 167 0.31 0.46
Benefit: Additional Funding 264 1.81 1.07 98 1.42 0.84 166 2.04 1.12
Benefit: Employees 264 1.49 0.85 98 1.33 0.67 166 1.58 0.93
Benefit: Publicity 265 2.78 1.16 98 1.92 1.04 167 3.28 0.90
Benefit: Customer Base 264 2.58 1.17 98 1.62 0.87 166 3.15 0.94
Original Project Characteristics Goal 341 31207 65676 128 36543 73427 213 28001 60500
Featured Project 341 0.10 0.30 128 0.00 0.00 213 0.16 0.37
Duration 336 38.83 13.25 123 39.17 14.61 213 38.64 12.44
Design 341 0.43 0.50 128 0.35 0.48 213 0.47 0.50
Technology 341 0.29 0.46 128 0.34 0.48 213 0.26 0.44
Proof of Concept 341 0.96 0.19 128 0.95 0.23 213 0.97 0.17
By Name 341 0.43 0.50 128 0.35 0.48 213 0.48 0.50
Endorsements 341 0.32 0.47 128 0.16 0.37 213 0.41 0.49
Facebook Friends 341 241.71 443.81 128 164.95 332.99 213 287.84 493.73
Year 2010 341 0.06 0.25 128 0.08 0.27 213 0.06 0.23
Year 2011 341 0.41 0.49 128 0.37 0.48 213 0.44 0.50
Entity Variables Project Funded 341 0.62 0.48 128 0.00 0.00 213 1.00 0.00
Entity Objective: Start of Ongoing Business 258 0.59 0.49 93 0.56 0.50 165 0.60 0.49
Entity Objective: New Product from Existing Business 258 0.17 0.38 93 0.16 0.37 165 0.18 0.38
Completeness Number of Founders 258 1.58 1.22 93 1.31 0.71 165 1.73 1.41
Degree of Completeness: Design 265 4.17 0.96 98 4.09 1.00 167 4.22 0.94
Degree of Completeness: Financial Plan 264 4.16 0.89 97 4.25 0.90 167 4.10 0.89
Degree of Completeness: Schedule 264 3.92 0.92 97 4.11 0.83 167 3.80 0.96
Degree of Completeness: Business Plan 264 3.28 1.29 97 3.45 1.35 167 3.17 1.25
Degree of Completeness: Team 264 3.92 1.13 97 3.86 1.09 167 3.96 1.16
16
TABLE 3: ALL PROJECTS [EXPONTENTIATED FORM]
VARIABLES Additional Funding Employee Publicity Customers Base
Original Project
Characteristics Log (Goal) 1.6 1.61 6.688*** 8.667** 3.379** 4.783*** 4.607* 1.581
-0.962 -1.055 -3.62 -6.058 -1.534 -2.269 -3.153 -0.805
Featured Project 1.789 2.651 1.159 0.961 0.705 5.942*** 1.016 1.367
-1.466 -2.921 -0.752 -0.648 -0.371 -3.059 -0.0186 -1.487
Duration 0.966* 0.964* 0.981 0.978 1.003 1.001 2.141 1.009
-0.0147 -0.0138 -0.0157 -0.0172 -0.0119 -0.0117 -1.089 -0.0155
Design 0.543 0.371 0.673 0.914 1.293 0.417* 1.523 0.989
-0.232 -0.199 -0.336 -0.56 -0.537 -0.173 -0.796 -0.567
Technology 2.619 2.111 0.838 1.163 1.706 0.406* 0.431 1.133
-1.699 -1.45 -0.439 -0.71 -0.763 -0.186 -0.555 -0.631
Proof of Concept 3.534 3.438 0.479 0.456 0.625 0.596 0.883 0.67
-3.198 -3.379 -0.453 -0.387 -0.429 -0.549 -0.354 -0.586
By Name 0.985 0.756 1.596 3.076* 1.009 0.987 6.026* 1.774
-0.394 -0.311 -0.67 -1.574 -0.323 -0.354 -4.274 -0.806
Endorsements 1.085 1.088 1.614 1.646 2.075* 1.514 0.938 2.682*
-0.464 -0.473 -0.655 -0.795 -0.661 -0.543 -0.068 -1.283
Log (Facebook Friends) 1.038 1.007 1.056 1.005 0.972 0.993 2.556 1.098
-0.0625 -0.063 -0.0699 -0.0754 -0.0518 -0.0572 -2.005 -0.0849
Year 2010 0.184* 0.139** 1.06 1.855 2.407 1.317 1.482 1.434
-0.126 -0.1 -1.39 -1.677 -1.591 -1.023 -0.685 -1.037
Year 2011 2.328 1.978 2.647* 2.743 1.645 2.015 17.20*** 1.194
-1.046 -0.888 -1.216 -1.507 -0.549 -0.737 -8.567 -0.537
Project Funded 7.050*** 6.328*** 2.762 3.626* 4.716*** 1.644 1.036 27.32***
-3.057 -2.878 -1.493 -2.056 -1.832 -0.696 -0.497 -13.72
Entity Variables Entity Objective: Start of Ongoing Business 1.441 1.703 2.935* 2.424 1.614 1.723 1.19 1.5
-0.513 -0.778 -1.51 -1.484 -0.594 -0.738 -0.705 -0.698
Entity Objective: New Product from Existing Business 1.886 2.098 1.081 0.403 1.802 1.739 1.108 1.088
-0.951 -1.231 -0.764 -0.296 -0.823 -0.948 -0.251 -0.619
Number of Founders 1.591* 1.48 1.208 1.024 1.14 0.99 1.208 0.841
-0.335 -0.398 -0.163 -0.23 -0.138 -0.12 -0.284 -0.116
Completeness Degree of Completeness: Design 1.229 1.38 0.727 0.65 0.802 0.813 0.934 1.016
-0.223 -0.278 -0.13 -0.145 -0.135 -0.148 -0.266 -0.236
Degree of Completeness: Financial Plan 1.074 1.25 1.129 1.403 1.281 1.128 0.713 1.189
-0.238 -0.316 -0.265 -0.396 -0.25 -0.264 -0.275 -0.316
Degree of Completeness: Schedule 0.655 0.787 0.506** 0.491 1.058 0.759 1.338 0.529*
-0.155 -0.245 -0.118 -0.182 -0.236 -0.167 -0.233 -0.157
Degree of Completeness: Business Plan 0.981 1.004 1.544** 1.649* 1.125 1.749*** 1.006 1.446*
-0.131 -0.177 -0.254 -0.366 -0.132 -0.271 -0.206 -0.239
Degree of Completeness: Team 1.386* 1.188 1.358 1.465 1.046 0.968 0.000675* 1.207
-0.215 -0.227 -0.214 -0.387 -0.175 -0.161 -0.00222 -0.224
Constant 0.182 1.438 1.97 0.0185 0 0.0757*** 0.435 6.33e-06*** 0.000271*** 0.000321** 0.0328
-0.429 -0.56 -1.942 -0.0549 -0.000171 -0.0387 -0.43 -2.25E-05 -0.00063 -0.000799 -0.0817
Observations 250 253 251 248 220 217 222 213 252 252 228 252
Active EntityOutside Funding (VC, Angels, Bank,
Companies)Ex-Post Campaign Benefits (Likert Scale)
17
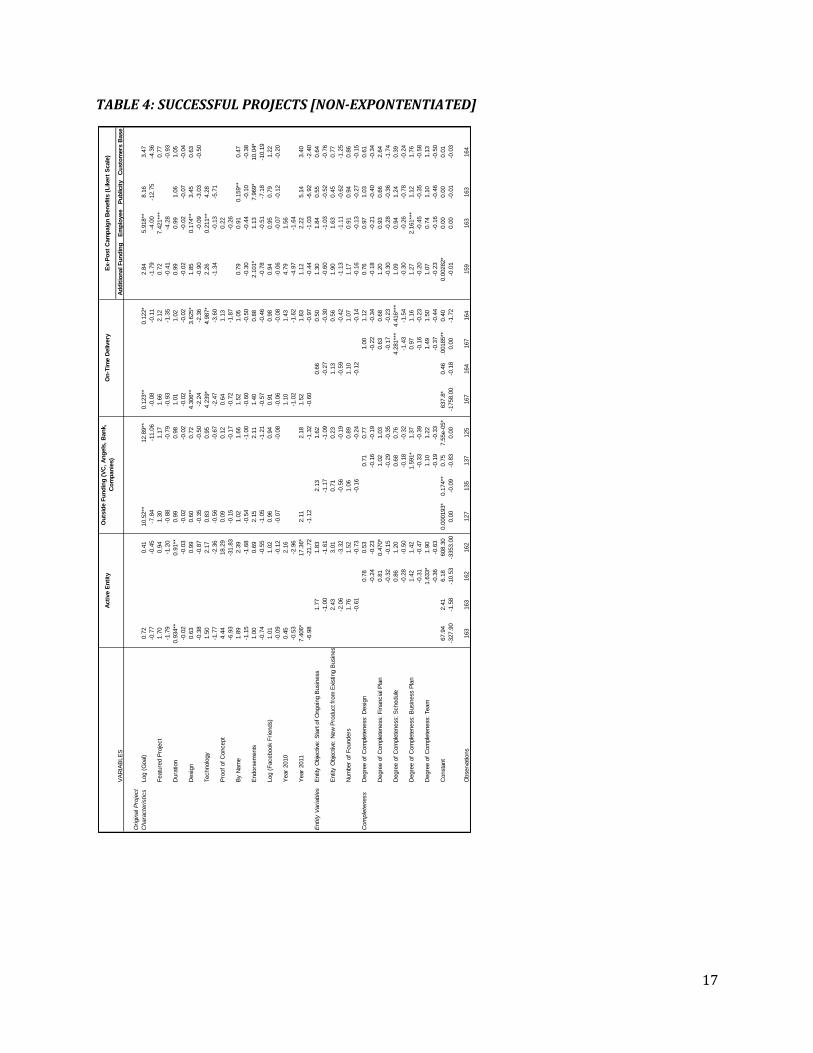
TABLE 4: SUCCESSFUL PROJECTS [NON-EXPONTENTIATED]
VA
RIA
BLE
SA
dd
itio
nal F
un
din
gE
mp
loyee
Pu
blicit
yC
usto
mers
Base
Ori
gin
al P
roje
ct
Chara
cte
ristics
Log (
Goal)
0.7
20.4
110.5
2**
12.8
9**
0.1
23**
0.1
22*
2.8
45.9
18**
8.1
63.4
7
-0.7
7-0
.45
-7.8
4-1
1.0
6-0
.08
-0.1
1-1
.79
-4.0
0-1
2.7
5-4
.36
Featu
red P
roje
ct
1.7
00.9
41.3
01.1
71.6
62.1
20.7
27.4
21**
*0.7
7
-1.7
9-1
.20
-0.8
8-0
.79
-0.9
3-1
.35
-0.4
1-4
.28
-0.9
3
Dura
tion
0.9
34**
0.9
1**
0.9
90.9
81.0
11.0
20.9
90.9
91.0
61.0
5
-0.0
2-0
.03
-0.0
2-0
.02
-0.0
2-0
.02
-0.0
2-0
.02
-0.0
7-0
.04
Desig
n0.6
30.9
90.6
00.7
24.3
06**
3.6
25*
1.8
50.1
74**
3.4
50.6
3
-0.3
8-0
.87
-0.3
5-0
.50
-2.2
4-2
.36
-0.9
0-0
.09
-3.0
3-0
.50
Technolo
gy
1.5
02.1
70.8
30.9
54.2
39*
4.9
87*
2.2
60.2
11**
4.2
8
-1.7
7-2
.36
-0.5
6-0
.67
-2.4
7-3
.60
-1.3
4-0
.13
-5.7
1
Pro
of
of
Concept
4.4
418.2
90.0
90.1
20.6
41.1
30.2
2
-6.9
3-3
1.8
3-0
.15
-0.1
7-0
.72
-1.8
7-0
.26
By N
am
e1.8
92.3
91.0
21.6
61.5
21.0
50.7
90.9
10.1
59**
0.4
7
-1.1
5-1
.68
-0.5
4-1
.00
-0.6
0-0
.50
-0.3
0-0
.44
-0.1
0-0
.38
Endors
em
ents
1.0
00.6
92.1
52.1
11.4
00.8
82.1
01*
1.1
37.9
69*
10.0
4*
-0.7
4-0
.55
-1.0
5-1
.21
-0.5
7-0
.46
-0.7
8-0
.51
-7.1
8-1
0.1
9
Log (
Facebook F
riends)
1.0
11.0
20.9
60.9
40.9
10.9
80.9
40.9
50.7
91.2
2
-0.0
9-0
.12
-0.0
7-0
.08
-0.0
6-0
.08
-0.0
6-0
.07
-0.1
2-0
.20
Year
2010
0.4
52.1
61.1
01.4
34.7
91.5
6
-0.5
3-2
.96
-1.0
2-1
.62
-4.9
7-1
.64
Year
2011
7.4
06*
17.3
6*
2.1
12.1
81.5
21.8
31.1
22.2
25.1
43.4
0
-6.9
8-2
1.7
2-1
.12
-1.3
2-0
.60
-0.9
7-0
.44
-1.0
3-6
.92
-2.4
0
Entity
Vari
able
sE
ntity
Obje
ctive
: S
tart
of
Ongoin
g B
usin
ess
1.7
71.8
32.1
31.6
20.6
60.5
01.3
01.8
40.5
50.6
4
-1.0
0-1
.61
-1.1
7-1
.09
-0.2
7-0
.30
-0.6
0-1
.03
-0.5
2-0
.76
Entity
Obje
ctive
: N
ew
Pro
duct fr
om
Exi
sting B
usin
ess
2.4
33.0
10.7
10.2
31.1
30.5
61.9
01.6
30.4
50.7
7
-2.0
6-3
.32
-0.5
6-0
.19
-0.5
9-0
.42
-1.1
3-1
.11
-0.6
2-1
.25
Num
ber
of
Founders
1.7
61.5
21.0
60.8
91.1
01.0
71.1
70.9
10.9
40.8
6
-0.6
1-0
.73
-0.1
6-0
.24
-0.1
2-0
.14
-0.1
6-0
.13
-0.2
7-0
.15
Com
ple
teness
Degre
e o
f C
om
ple
teness:
Desig
n0.7
80.5
30.7
10.7
71.0
01.1
20.7
60.9
71.0
30.6
1
-0.2
4-0
.23
-0.1
6-0
.19
-0.2
2-0
.34
-0.1
8-0
.21
-0.4
0-0
.34
Degre
e o
f C
om
ple
teness:
Fin
ancia
l P
lan
0.8
10.4
70*
1.0
21.0
30.6
30.6
81.2
00.9
30.6
62.6
4
-0.3
2-0
.15
-0.2
9-0
.35
-0.1
7-0
.23
-0.3
0-0
.28
-0.3
6-1
.74
Degre
e o
f C
om
ple
teness:
Schedule
0.8
61.2
00.6
80.7
64.2
81**
*4.4
16**
*1.0
90.9
41.2
40.3
9
-0.2
8-0
.50
-0.1
8-0
.32
-1.4
3-1
.54
-0.3
0-0
.26
-0.7
8-0
.24
Degre
e o
f C
om
ple
teness:
Busin
ess P
lan
1.4
21.4
21.5
91*
1.3
70.9
71.1
61.2
72.1
61**
*1.1
21.7
6
-0.3
1-0
.47
-0.3
3-0
.39
-0.1
6-0
.23
-0.2
0-0
.45
-0.3
5-0
.58
Degre
e o
f C
om
ple
teness:
Team
1.6
33*
1.9
01.1
01.2
21.4
91.5
01.0
70.7
41.1
01.1
3
-0.3
6-0
.63
-0.1
9-0
.33
-0.3
7-0
.44
-0.2
3-0
.16
-0.4
6-0
.50
Consta
nt
67.9
42.4
16.1
8608.3
00.0
00193*
0.1
74**
0.7
57.5
5e-0
5*
637.8
*0.4
60.0
0185**
*0.4
00.0
0282*
0.0
00.0
00.0
1
-327.9
0-1
.58
-10.5
3-3
353.0
00.0
0-0
.09
-0.8
30.0
0-1
758.0
0-0
.18
0.0
0-1
.72
-0.0
10.0
0-0
.01
-0.0
3
Observ
ations
163
163
162
162
127
135
137
125
167
164
167
164
159
163
163
164
Acti
ve E
nti
tyO
n-T
ime D
elivery
Ex-P
ost
Cam
paig
n B
en
efits
(L
ikert
Scale
)O
uts
ide F
un
din
g (
VC
, A
ng
els
, B
an
k,
Co
mp
an
ies)
18
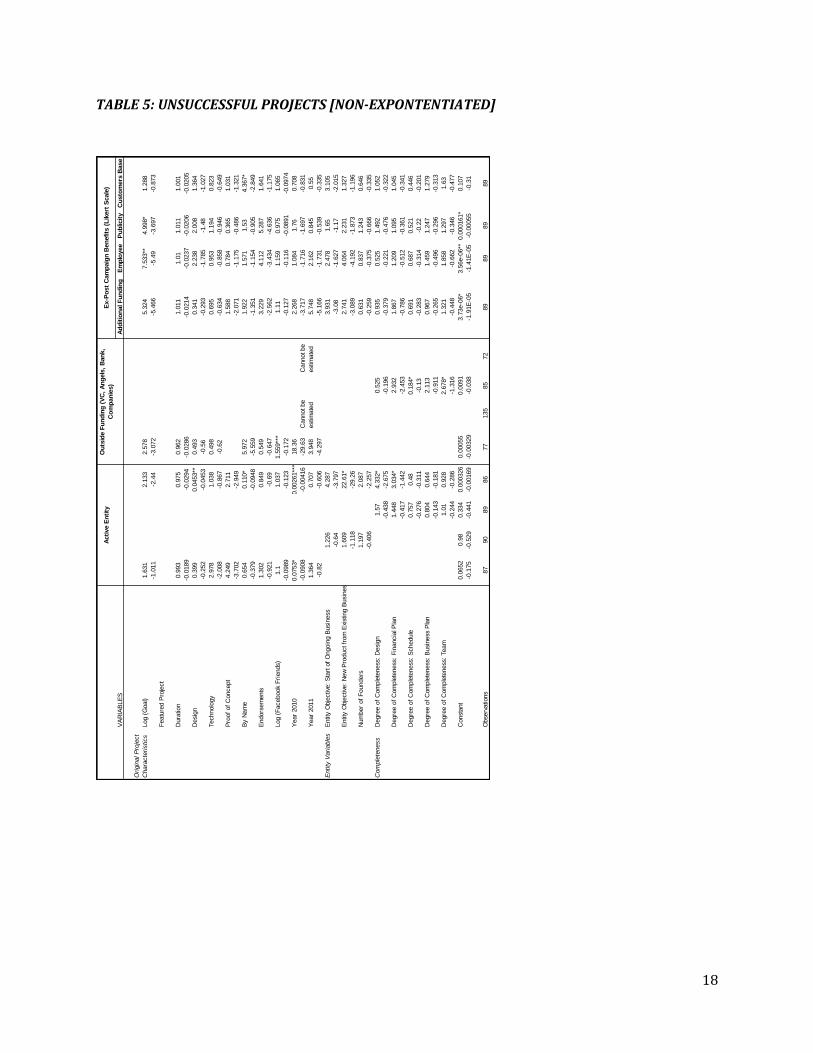
TABLE 5: UNSUCCESSFUL PROJECTS [NON-EXPONTENTIATED]
VA
RIA
BLE
SA
dd
itio
nal F
un
din
gE
mp
loyee
Pu
blicit
yC
usto
mers
Base
Ori
gin
al P
roje
ct
Chara
cte
ristics
Log (
Goal)
1.6
31
2.1
33
2.5
78
5.3
24
7.5
33**
4.9
98*
1.2
88
-1.0
11
-2.4
4-3
.072
-5.4
66
-5.4
9-3
.697
-0.8
73
Featu
red P
roje
ct
Dura
tion
0.9
93
0.9
75
0.9
62
1.0
11
1.0
11.0
11
1.0
01
-0.0
189
-0.0
294
-0.0
286
-0.0
214
-0.0
237
-0.0
206
-0.0
205
Desig
n0.3
99
0.0
453**
0.4
93
0.3
41
2.2
38
2.0
08
1.3
64
-0.2
52
-0.0
453
-0.5
6-0
.293
-1.7
85
-1.4
8-1
.027
Technolo
gy
2.9
78
1.0
38
0.4
98
0.6
95
0.9
53
1.1
94
0.8
23
-2.0
08
-0.8
67
-0.6
2-0
.634
-0.8
58
-0.9
46
-0.6
49
Pro
of
of
Concept
4.2
49
2.7
11
1.5
88
0.7
84
0.3
65
1.0
31
-3.7
02
-2.9
49
-2.0
71
-1.1
75
-0.4
86
-1.3
21
By N
am
e0.6
54
0.1
10*
5.9
72
1.9
22
1.5
71
1.5
34.3
67*
-0.3
79
-0.0
948
-5.5
59
-1.3
51
-1.1
54
-0.9
05
-2.8
49
Endors
em
ents
1.3
02
0.8
49
0.5
49
3.2
29
4.1
12
5.2
87
1.6
41
-0.9
21
-0.6
9-0
.647
-2.5
62
-3.4
34
-4.6
36
-1.1
75
Log (
Facebook F
riends)
1.1
1.0
37
1.5
59**
*1.1
11.1
59
0.9
75
1.0
65
-0.0
989
-0.1
23
-0.1
72
-0.1
27
-0.1
16
-0.0
891
-0.0
974
Year
2010
0.0
753*
0.0
0261**
*18.3
62.2
68
1.0
84
1.7
60.7
08
-0.0
908
-0.0
0416
-29.6
3-3
.717
-1.7
16
-1.6
97
-0.8
31
Year
2011
1.3
64
0.7
07
3.9
48
5.7
48
2.1
62
0.8
45
0.5
5
-0.8
2-0
.606
-4.2
97
-5.1
66
-1.7
31
-0.5
39
-0.3
35
Entity
Vari
able
sE
ntity
Obje
ctive
: S
tart
of
Ongoin
g B
usin
ess
1.2
26
4.2
87
3.9
31
2.4
78
1.6
53.1
05
-0.6
4-3
.797
-3.0
8-1
.627
-1.1
7-2
.015
Entity
Obje
ctive
: N
ew
Pro
duct fr
om
Exi
sting B
usin
ess
1.6
09
22.6
1*
2.7
41
4.0
64
2.2
31
1.3
27
-1.1
18
-29.2
6-3
.089
-4.1
92
-1.8
73
-1.1
96
Num
ber
of
Founders
1.1
97
2.0
87
0.6
31
0.8
37
1.2
43
0.6
46
-0.4
06
-2.2
57
-0.2
59
-0.3
75
-0.6
66
-0.3
35
Com
ple
teness
Degre
e o
f C
om
ple
teness:
Desig
n1.5
74.3
32*
0.5
25
0.9
35
0.5
25
1.4
92
1.0
52
-0.4
38
-2.6
75
-0.1
96
-0.3
79
-0.2
21
-0.4
76
-0.3
22
Degre
e o
f C
om
ple
teness:
Fin
ancia
l P
lan
1.4
48
3.0
34*
2.9
32
1.8
67
1.2
09
1.0
95
1.0
45
-0.4
17
-1.4
42
-2.4
53
-0.7
86
-0.5
12
-0.3
61
-0.3
41
Degre
e o
f C
om
ple
teness:
Schedule
0.7
57
0.4
80.1
84*
0.6
91
0.6
87
0.5
21
0.4
46
-0.2
76
-0.3
11
-0.1
3-0
.283
-0.3
14
-0.2
2-0
.201
Degre
e o
f C
om
ple
teness:
Busin
ess P
lan
0.8
04
0.6
44
2.1
13
0.9
67
1.4
59
1.2
47
1.2
79
-0.1
43
-0.1
81
-0.9
11
-0.2
65
-0.4
96
-0.2
96
-0.3
13
Degre
e o
f C
om
ple
teness:
Team
1.0
10.9
28
2.6
78*
1.3
21
1.8
58
1.2
97
1.6
3
-0.2
44
-0.2
86
-1.3
16
-0.4
48
-0.6
62
-0.3
46
-0.4
77
Consta
nt
0.0
652
0.9
80.3
34
0.0
00326
0.0
0055
0.0
091
3.7
3e-0
6*
3.5
6e-0
6**
0.0
00161*
0.1
07
-0.1
75
-0.5
29
-0.4
41
-0.0
0169
-0.0
0329
-0.0
38
-1.9
1E
-05
-1.4
1E
-05
-0.0
0055
-0.3
1
Observ
ations
87
90
89
86
77
135
85
72
89
89
89
89
Cannot be
estim
ate
d
Cannot be
estim
ate
d
Acti
ve E
nti
tyO
uts
ide F
un
din
g (
VC
, A
ng
els
, B
an
k,
Co
mp
an
ies)
Ex-P
ost
Cam
paig
n B
en
efits
(L
ikert
Scale
)