Embed Size (px)
Citation preview
Economic Database in Support of ASHRAE 90.2 (Energy-Efficient Design of Low-Rise
Residential Buildings)
1481 RP
Prepared for
ASHRAE 1791 Tullie Circle, NE Atlanta, GA 30329
Prepared by
NAHB Research Center
400 Prince George’s Boulevard
Upper Marlboro, MD 20774-8731
www.nahbrc.org
May 2009
Report #3296_051409
Economic Database in Support of ASHRAE 90.2 1481-RP
NAHB Research Center March 2009 2
Disclaimer
Neither the NAHB Research Center, Inc., nor any person acting on its behalf, makes any
warranty, express or implied, with respect to the use of any information, apparatus,
method, or process disclosed in this publication or that such use may not infringe privately
owned rights, or assumes any liabilities with respect to the use of, or for damages resulting
from the use of, any information, apparatus, method or process disclosed in this publication,
or is responsible for statements made or opinions expressed by individual authors.
Economic Database in Support of ASHRAE 90.2 1481-RP
NAHB Research Center March 2009 3
Table of Contents
ABSTRACT .................................................................................................................... 6 INTRODUCTION ............................................................................................................. 6
Cost Methodology ........................................................................................................... 7
Cost Matrix Results ......................................................................................................... 9
SECTION 1: SINGLE-FAMILY DETACHED COST ESTIMATES ............................... 10 A. Ceiling Assembly ..................................................................................................... 10
B. Wood Exterior Walls ................................................................................................ 11
Steel Exterior Walls .................................................................................................. 15
C. Wood Framed Floors ............................................................................................... 17
D. Foundation Insulation .............................................................................................. 18
F. Windows .................................................................................................................. 20
G. Sliding Glass Doors ................................................................................................. 24
H. Entry Doors ............................................................................................................... 26
I. Skylights .................................................................................................................. 26
J. Air Infiltration Sealing ................................................................................................ 27
K., L., M. Heating Air Conditioning and Ventilation Systems (HVAC) ........................... 27
SECTION 2: ATTACHED AND MULTIFAMILY CONSTRUCTION COSTS ............... 33 Discussion of Results .................................................................................................... 51 Economic Database ...................................................................................................... 51
REFERENCES .............................................................................................................. 52
Economic Database in Support of ASHRAE 90.2 1481-RP
NAHB Research Center March 2009 4
List of Matrices
Matrix A1: Ceiling Assembly ......................................................................................... 10
Matrix B1: Wood Exterior Wall with Fiberglass Cavity Insulation ................................. 12
Matrix B2: Wood Exterior Wall with Sprayed Cellulose Cavity Insulation ...................... 13
Matrix B3: Wood Exterior Wall with ............................................................................... 14
Matrix B4: Cold-Formed Steel Exterior Wall with Fiberglass Cavity Insulation .............. 15
Matrix B5: Cold-Formed Steel Exterior Walls with ......................................................... 16
Matrix B6: Cold-Formed Steel Exterior Wall with .......................................................... 17
Matrix C1. Wood Framed Floor with Fiberglass Batt Cavity Insulation .......................... 18
Matrix D1: Foundation Insulation – ................................................................................ 19
Matrix D2: Foundation Insulation - Interior Applications ................................................ 19
Matrix D3: Foundation Insulation Slab - Exterior Applications ...................................... 20
Matrix H1: Entry Doors ................................................................................................. 26
Matrix I1: Skylights ........................................................................................................ 26
Matrix J1: Air Infiltration Sealing .................................................................................... 27
Matrix K1: Gas Furnaces ............................................................................................... 30
Matrix L1: Air Conditioner .............................................................................................. 31
Matrix M1. Heat Pump ................................................................................................... 32
Matrix Multi-A1: Ceiling Assembly ................................................................................. 34
Matrix Multi-B1: Wood Exterior Walls with Fiberglass Insulation .................................. 35
Matrix Multi-B2. Wood Exterior Walls with Sprayed Cellulose Insulation ...................... 36
Matrix Multi-B3: Wood Exterior Walls with Sprayed Foam Insulation ........................... 37
Matrix Multi-B4: Steel Exterior Walls with Fiberglass Insulation .................................... 38
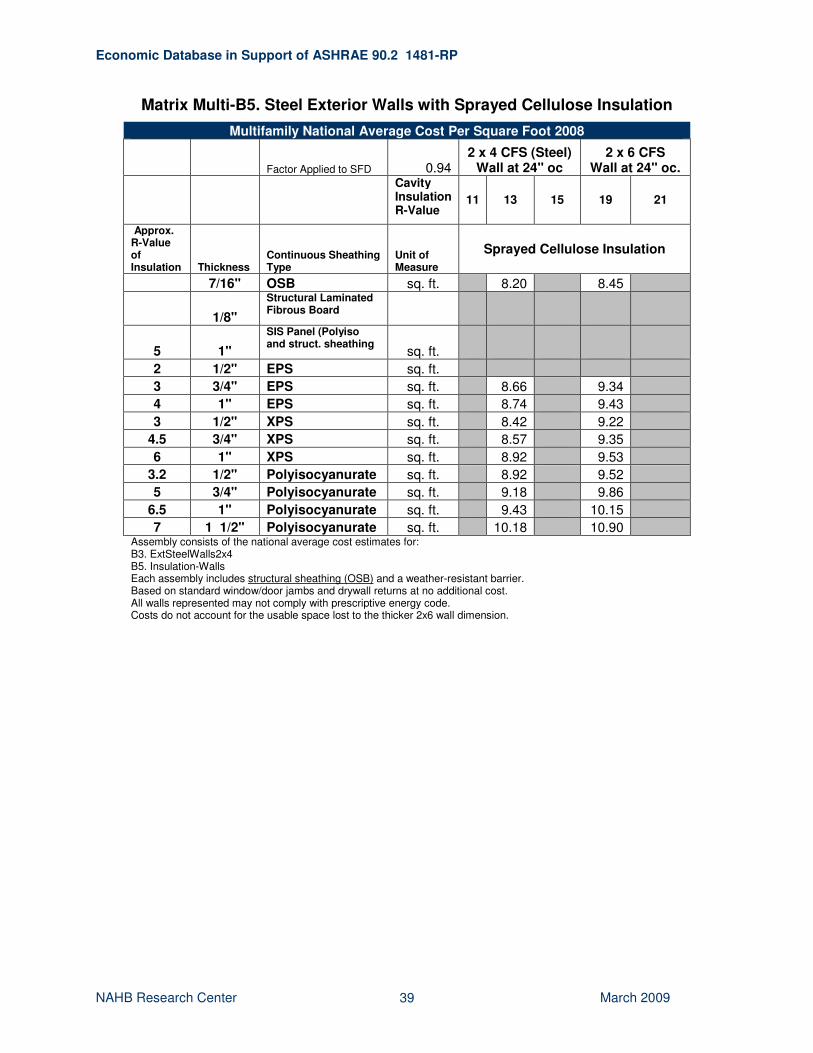
Matrix Multi-B5. Steel Exterior Walls with Sprayed Cellulose Insulation........................ 39
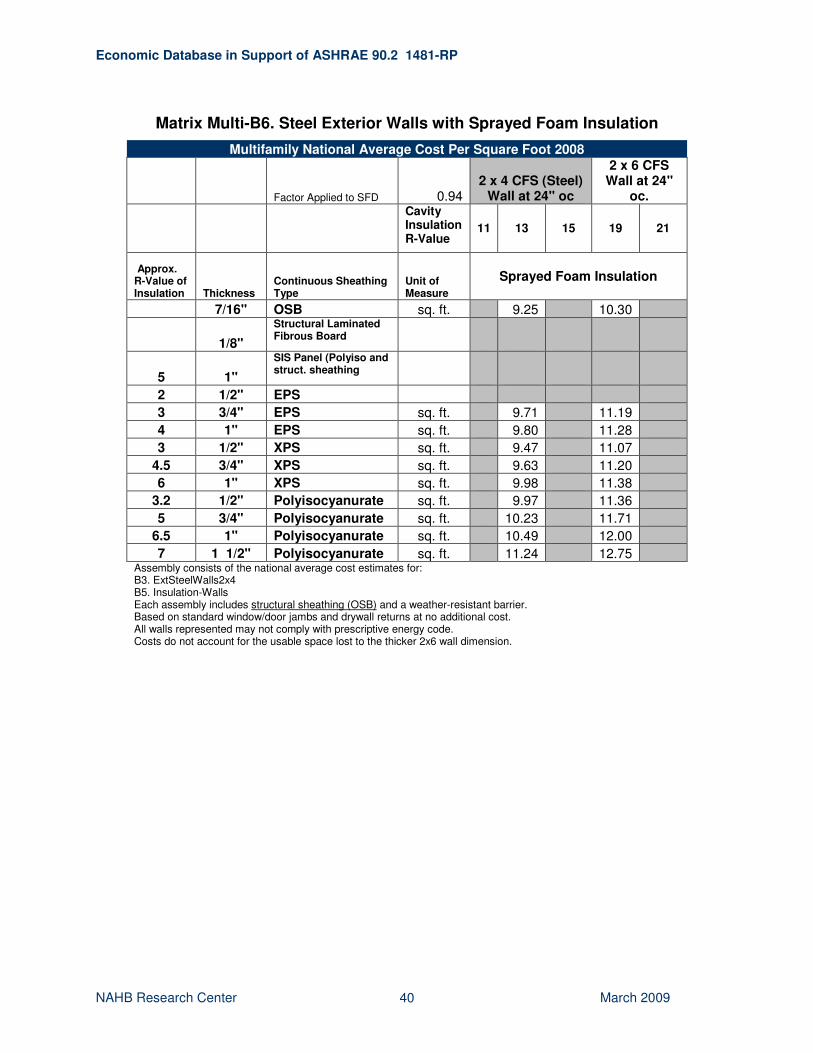
Matrix Multi-B6. Steel Exterior Walls with Sprayed Foam Insulation ............................. 40
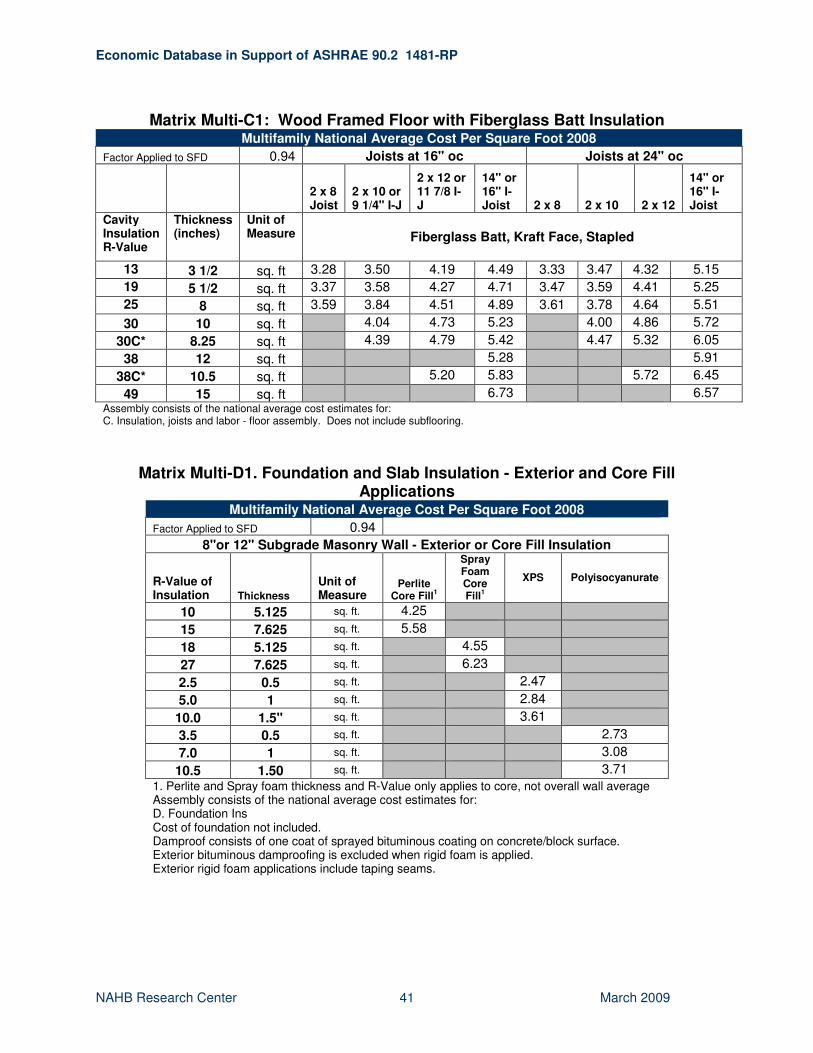
Matrix Multi-C1: Wood Framed Floor with Fiberglass Batt Insulation ........................... 41
Matrix Multi-D1. Foundation and Slab Insulation - Exterior and Core Fill Applications .. 41
Matrix Multi-D2: Foundation Insulation - Interior Applications ....................................... 42
Matrix Multi-D3: Foundation Insulation Slab - Exterior Applications .............................. 42
Matrix Multi-H1: Entry Doors ......................................................................................... 46
Matrix Multi-I1. Skylights ............................................................................................... 47
Matrix Multi-J1. Air Infiltration Sealing ........................................................................... 47
Matrix Multi-K1. Gas Furnace ........................................................................................ 48
Matrix Multi-L1: Air Conditioner ..................................................................................... 49

Economic Database in Support of ASHRAE 90.2 1481-RP
NAHB Research Center March 2009 5
Matrix Multi-M 1. Heat Pump ......................................................................................... 50
List of Figures
Figure 1. Window Cost per Square Foot vs. U-value ................................................... 21
Figure 2. Window Cost per Square Foot vs. SHGC ..................................................... 22
Figure 3. Window SHGC vs U-valueG. Sliding Glass Doors ..................................... 22
Figure 4. Sliding Glass Doors – Cost vs U-Value ......................................................... 25
Figure 5: Gas Furnace Cost Comparison ..................................................................... 28
Figure 6: A/C Cost ........................................................................................................ 28
Figure 7: Heat Pump Cost Comparion - HSPF ............................................................. 29
Figure 8: Heat Pump Cost comparison - SEER ........................................................... 29
Figure 9. Matrix F1: Window Cost Vs. U-Value ............................................................ 43
Figure 10. Matrix F2: Window Cost Vs SHGC .............................................................. 44
Figure 11. Matrix F3: Window SHGC vs U-value ......................................................... 45
Figure 12. Matrix G. Sliding Glass Doors ..................................................................... 46
List of Tables
Table 1. Cost Data Origin ............................................................................................... 7 Table 2. Commodity Benchmarks at Beginning and End of Estimation Period .............. 8 Table 3: Window Installed Cost Table ........................................................................... 24
List of Appendices*
1. ASHRAE Cost Book 2008 2a. Unit Prices with Market Adjustment SFD 2b. Unit Prices with Market Adjustment MFU 3. TX Climate Zone 3 4. OK Climate Zone 3 5. MD Climate Zone 4 6. OH Climate Zone 4 7. Workbook RSMeans 8a. Matrices (SFD) 8b. Matrices MFU *NOTE: Appendices are in the form of electronic Excel spreadsheets.

Economic Database in Support of ASHRAE 90.2 1481-RP
NAHB Research Center March 2009 6
ABSTRACT
The objective of ASHRAE1 1481-RP was to obtain an economic database in support of Standing Standards Project Committee 90.2 (SSPC 90.2) because a collection of reliable construction cost data is requisite, yet periphery to, the principal goals of the committee. Cost data has been difficult to obtain in the past. In order for the committee to provide timely technical review of standard updates and meet future ASHRAE goals of increasing building energy efficiency, a library of costs to calculate the economic impact of proposed amendments is required.
To accommodate ASHRAE’s requirements as outlined in 1481-RP, the NAHB Research Center worked with four active home builders to produce the database. The Research Center identified builders from different regions with the specific knowledge and expertise to develop costs related to energy-efficiency upgrades, and engaged them as subcontractors on the project. This paper presents the economic database that was compiled for this effort and an overview of the data collection and normalization process.
INTRODUCTION
Following the format outlined by ASHRAE 1481-RFP – Economic Data Base in Support of Standard 90.2, the NAHB Research Center teamed with four builders of varying sizes and locations to produce this report. Data has been generated and formatted as matrices titled by principal building systems or assemblies common to the construction of a single-family detached (SFD) house. Each of the matrices presented as Section 1 of this report contains an estimate of the aggregate cost to the consumer for the new construction of the stated, defined assembly. Generally, costs in this economic database are reported per square feet of area so that application may be made to similarly-constructed buildings of varying size. An exception to the reporting unit of square feet was made with 10-inch tubular skylights and HVAC equipment which are reported as cost per unit. Results are meant to capture only the variable subcomponents of the assembly; e.g., foundation wall insulation does not include the foundation wall itself, as the foundation cost remains constant regardless of the location and type of insulation applied.
In addition to this paper, the data that supports the national average costs contained in the matrices are included in eight electronic (Microsoft™ Excel) Appendices – ASHRAE Cost Book 2008 (Appendix 1); Unit Prices with Market Adjustment (Appendices 2a and 2b); TX Climate zone 3 (Appendix 3); OK Climate zone 3 (Appendix 4); MD Climate zone 4 (Appendix 5); and OH Climate zone 5 (Appendix 6). Appendices 3 through 6 are the workbooks compiled by the builders who participated in this study. Appendix 7 contains the workbook that was compiled with R.S. Means costs. Appendices 8a and 8b contain the matrices that provide the costs for assemblies presented in this report.
Data provided in the builder workbooks was adjusted by location with profit and overhead added. When necessary, data was supplemented by additional costs acquired directly by the NAHB Research Center. The normalized estimates provided in the builder workbooks have been tallied and averaged in Appendix 1, ASHRAE Cost Book 2008. Each page in the workbook represents an assembly or component identified by ASHRAE for inclusion in this economic database and deemed commercially viable by the NAHB Research Center. Section 1
1 American Society of Heating, Refrigerating, and Air-Conditioning Engineers, Inc.
Economic Database in Support of ASHRAE 90.2 1481-RP
NAHB Research Center March 2009 7
of this report covers the data and methodology that was used in the development of aggregated cost of the assemblies at the national level. Appendix 2a, titled Unit Prices with Market Adjustment SFD, contains the table of R.S. Means market adjustment factors that provided the method for normalizing costs to a national (or, conversely, a local) marketplace in this study. As the title suggests, Appendix 2a also contains a spreadsheet of the unit prices that were estimated for this study factored for the 43 cities of significance to ASHRAE and the two additional markets selected by the NAHB Research Center.
Section 2 of the report contains factors for extension of the SFD estimates to attached single- family and low-rise multifamily unit (MFU)2 cost and the matrices that represent the resultant imputed costs. Appendix 2b, Unit Prices with Market Adjustment MFU, covers the unit costs of components adjusted by the MFU factor.
Cost Methodology
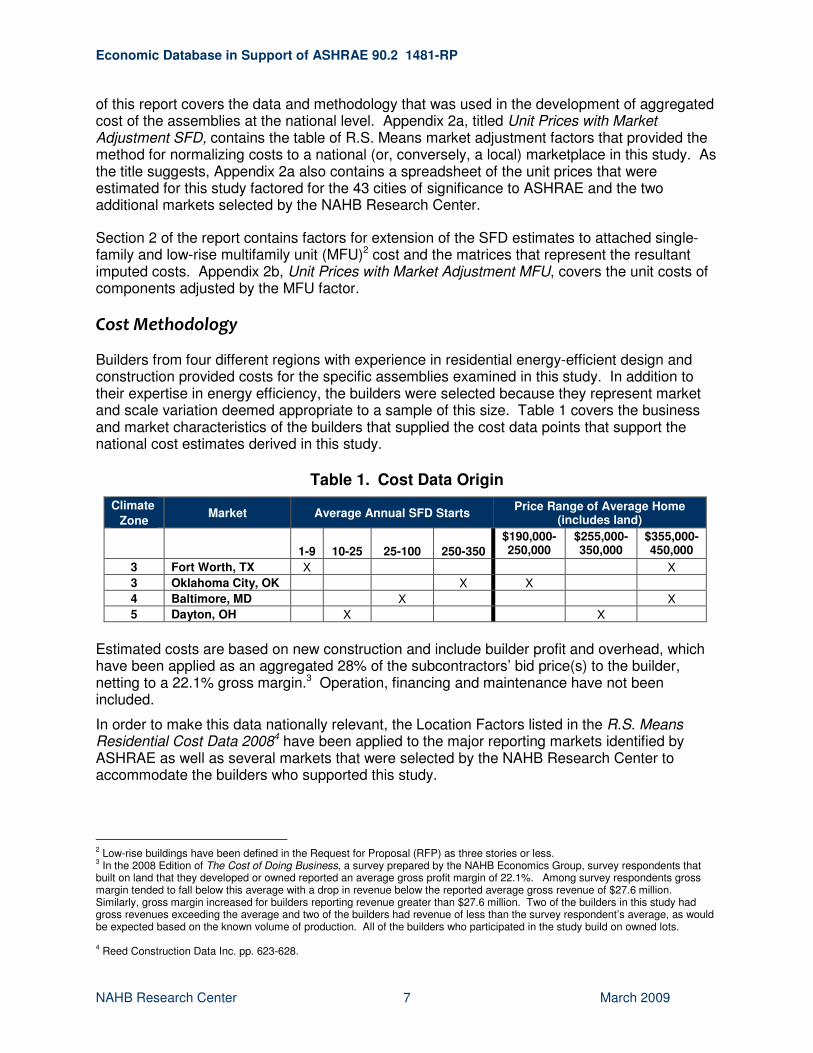
Builders from four different regions with experience in residential energy-efficient design and construction provided costs for the specific assemblies examined in this study. In addition to their expertise in energy efficiency, the builders were selected because they represent market and scale variation deemed appropriate to a sample of this size. Table 1 covers the business and market characteristics of the builders that supplied the cost data points that support the national cost estimates derived in this study.
Table 1. Cost Data Origin
Climate
Zone Market Average Annual SFD Starts
Price Range of Average Home (includes land)
1-9
10-25
25-100
250-350
$190,000-250,000
$255,000-350,000
$355,000-450,000
3 Fort Worth, TX X X
3 Oklahoma City, OK X X
4 Baltimore, MD X X
5 Dayton, OH X X
Estimated costs are based on new construction and include builder profit and overhead, which have been applied as an aggregated 28% of the subcontractors’ bid price(s) to the builder, netting to a 22.1% gross margin.3 Operation, financing and maintenance have not been included.
In order to make this data nationally relevant, the Location Factors listed in the R.S. Means Residential Cost Data 20084 have been applied to the major reporting markets identified by ASHRAE as well as several markets that were selected by the NAHB Research Center to accommodate the builders who supported this study.
2 Low-rise buildings have been defined in the Request for Proposal (RFP) as three stories or less. 3 In the 2008 Edition of The Cost of Doing Business, a survey prepared by the NAHB Economics Group, survey respondents that built on land that they developed or owned reported an average gross profit margin of 22.1%. Among survey respondents gross margin tended to fall below this average with a drop in revenue below the reported average gross revenue of $27.6 million. Similarly, gross margin increased for builders reporting revenue greater than $27.6 million. Two of the builders in this study had gross revenues exceeding the average and two of the builders had revenue of less than the survey respondent’s average, as would be expected based on the known volume of production. All of the builders who participated in the study build on owned lots. 4 Reed Construction Data Inc. pp. 623-628.
Economic Database in Support of ASHRAE 90.2 1481-RP
NAHB Research Center March 2009 8
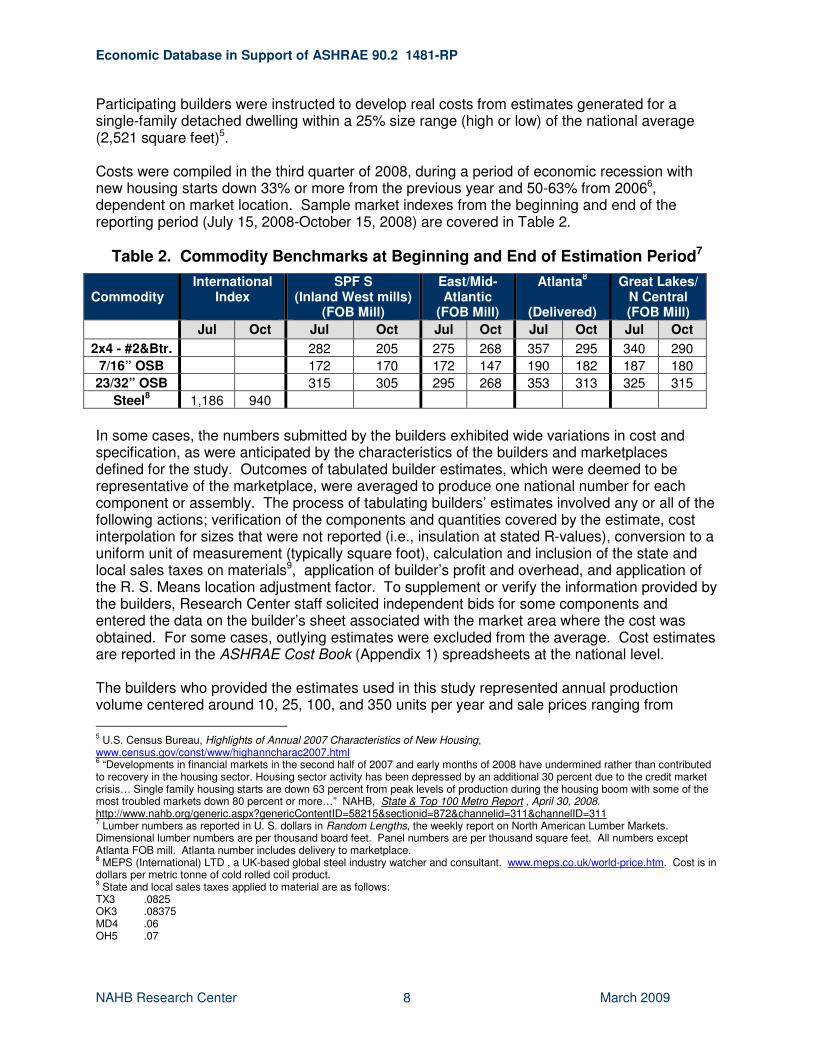
Participating builders were instructed to develop real costs from estimates generated for a single-family detached dwelling within a 25% size range (high or low) of the national average (2,521 square feet)5. Costs were compiled in the third quarter of 2008, during a period of economic recession with new housing starts down 33% or more from the previous year and 50-63% from 20066, dependent on market location. Sample market indexes from the beginning and end of the reporting period (July 15, 2008-October 15, 2008) are covered in Table 2.
Table 2. Commodity Benchmarks at Beginning and End of Estimation Period7
Commodity International
Index
SPF S (Inland West mills)
(FOB Mill)
East/Mid-Atlantic
(FOB Mill)
Atlanta8
(Delivered)
Great Lakes/ N Central (FOB Mill)
Jul Oct Jul Oct Jul Oct Jul Oct Jul Oct
2x4 - #2&Btr. 282 205 275 268 357 295 340 290
7/16” OSB 172 170 172 147 190 182 187 180
23/32” OSB 315 305 295 268 353 313 325 315
Steel8 1,186 940
In some cases, the numbers submitted by the builders exhibited wide variations in cost and specification, as were anticipated by the characteristics of the builders and marketplaces defined for the study. Outcomes of tabulated builder estimates, which were deemed to be representative of the marketplace, were averaged to produce one national number for each component or assembly. The process of tabulating builders’ estimates involved any or all of the following actions; verification of the components and quantities covered by the estimate, cost interpolation for sizes that were not reported (i.e., insulation at stated R-values), conversion to a uniform unit of measurement (typically square foot), calculation and inclusion of the state and local sales taxes on materials9, application of builder’s profit and overhead, and application of the R. S. Means location adjustment factor. To supplement or verify the information provided by the builders, Research Center staff solicited independent bids for some components and entered the data on the builder’s sheet associated with the market area where the cost was obtained. For some cases, outlying estimates were excluded from the average. Cost estimates are reported in the ASHRAE Cost Book (Appendix 1) spreadsheets at the national level. The builders who provided the estimates used in this study represented annual production volume centered around 10, 25, 100, and 350 units per year and sale prices ranging from
5 U.S. Census Bureau, Highlights of Annual 2007 Characteristics of New Housing, www.census.gov/const/www/highanncharac2007.html 6 “Developments in financial markets in the second half of 2007 and early months of 2008 have undermined rather than contributed to recovery in the housing sector. Housing sector activity has been depressed by an additional 30 percent due to the credit market crisis… Single family housing starts are down 63 percent from peak levels of production during the housing boom with some of the most troubled markets down 80 percent or more…” NAHB, State & Top 100 Metro Report , April 30, 2008. http://www.nahb.org/generic.aspx?genericContentID=58215§ionid=872&channelid=311&channelID=311 7 Lumber numbers as reported in U. S. dollars in Random Lengths, the weekly report on North American Lumber Markets. Dimensional lumber numbers are per thousand board feet. Panel numbers are per thousand square feet. All numbers except Atlanta FOB mill. Atlanta number includes delivery to marketplace. 8 MEPS (International) LTD , a UK-based global steel industry watcher and consultant. www.meps.co.uk/world-price.htm. Cost is in dollars per metric tonne of cold rolled coil product. 9 State and local sales taxes applied to material are as follows: TX3 .0825 OK3 .08375 MD4 .06 OH5 .07
Economic Database in Support of ASHRAE 90.2 1481-RP
NAHB Research Center March 2009 9
$190,000 to $450,000 (Table 1), but there was no consistent indication that the high volume builders were reporting lower cost estimates, with the exception of HVAC equipment costs. Due to a lack of evidence that volume discounts might underlie some of the larger builders’ estimates, no builder annual volume adjustment was applied to the builders’ cost estimates. There were several instances of only one builder reporting a cost for a component. These were adjusted by builder profit and overhead and location factor and compared to another source. Where the comparison indicated that the one cost was reasonably representative, the single cost is reported as an average cost. Similarly, for cases where only one cost estimate was received for a component of an assembly, the average cost of the assembly with the component is reported as the average of a similar assembly factored by the cost trend between levels of the component, and noted as such in the builders’ workbooks (Appendices 3 through 6). Costs developed using R.S. Means were adjusted with the same stated overhead and profit (O&P) factor of 28% to net the average gross margin of 22.1%. National average costs shown in the ASHRAE Cost Book (Appendix 1) comprise the average of the adjusted builders’ costs only and do not include the R.S. Means (RSM) cost. RSM numbers have been developed and represented for a reasonableness test only. Costs may be extended to attached dwellings and low-rise multifamily dwellings utilizing the adjustment factors covered in Section 2.
Cost Matrix Results
Numbers that are contained in the matrices represent the cost of each assembly, as defined below the matrix, in the aggregate. Cost estimates in each cell of a matrix represent the sum of the appropriate cells (or components of the assembly) in each of the ASHRAE Cost Book worksheets that are identified below the matrix.
Economic Database in Support of ASHRAE 90.2 1481-RP
NAHB Research Center March 2009 10
SECTION 1: SINGLE-FAMILY DETACHED COST ESTIMATES
A. Ceiling Assembly
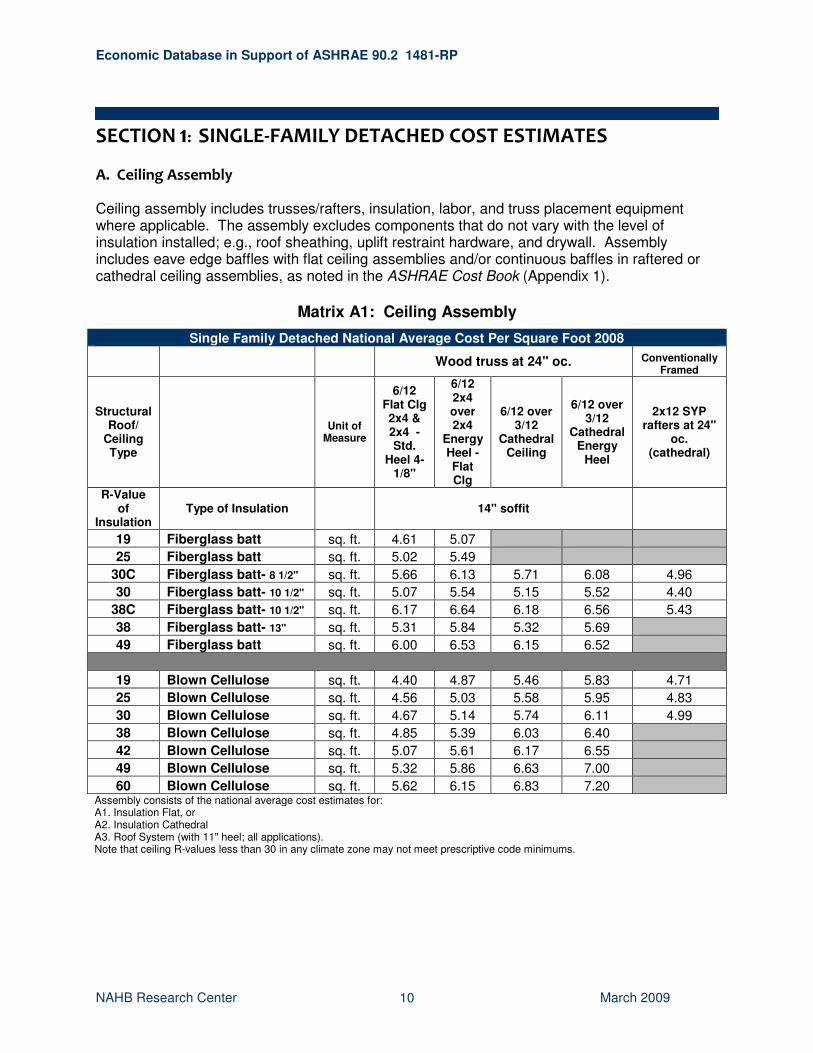
Ceiling assembly includes trusses/rafters, insulation, labor, and truss placement equipment where applicable. The assembly excludes components that do not vary with the level of insulation installed; e.g., roof sheathing, uplift restraint hardware, and drywall. Assembly includes eave edge baffles with flat ceiling assemblies and/or continuous baffles in raftered or cathedral ceiling assemblies, as noted in the ASHRAE Cost Book (Appendix 1).
Matrix A1: Ceiling Assembly
Single Family Detached National Average Cost Per Square Foot 2008
Wood truss at 24" oc. Conventionally
Framed
Structural Roof/
Ceiling Type
Unit of
Measure
6/12 Flat Clg 2x4 & 2x4 - Std.
Heel 4-1/8"
6/12 2x4 over 2x4
Energy Heel -Flat Clg
6/12 over 3/12
Cathedral Ceiling
6/12 over 3/12
Cathedral Energy
Heel
2x12 SYP rafters at 24"
oc. (cathedral)
R-Value of
Insulation Type of Insulation 14" soffit
19 Fiberglass batt sq. ft. 4.61 5.07
25 Fiberglass batt sq. ft. 5.02 5.49
30C Fiberglass batt- 8 1/2" sq. ft. 5.66 6.13 5.71 6.08 4.96
30 Fiberglass batt- 10 1/2" sq. ft. 5.07 5.54 5.15 5.52 4.40
38C Fiberglass batt- 10 1/2" sq. ft. 6.17 6.64 6.18 6.56 5.43
38 Fiberglass batt- 13" sq. ft. 5.31 5.84 5.32 5.69
49 Fiberglass batt sq. ft. 6.00 6.53 6.15 6.52
19 Blown Cellulose sq. ft. 4.40 4.87 5.46 5.83 4.71
25 Blown Cellulose sq. ft. 4.56 5.03 5.58 5.95 4.83
30 Blown Cellulose sq. ft. 4.67 5.14 5.74 6.11 4.99
38 Blown Cellulose sq. ft. 4.85 5.39 6.03 6.40
42 Blown Cellulose sq. ft. 5.07 5.61 6.17 6.55
49 Blown Cellulose sq. ft. 5.32 5.86 6.63 7.00
60 Blown Cellulose sq. ft. 5.62 6.15 6.83 7.20 Assembly consists of the national average cost estimates for: A1. Insulation Flat, or A2. Insulation Cathedral A3. Roof System (with 11" heel; all applications). Note that ceiling R-values less than 30 in any climate zone may not meet prescriptive code minimums.

Economic Database in Support of ASHRAE 90.2 1481-RP
NAHB Research Center March 2009 11
B. Wood Exterior Walls
Wood exterior walls include the complete assembly of structural frame, sheathing, insulation, and weather resistant barrier (WRB). Builders were instructed to include the cost of bracing the walls where non-structural sheathings were specified. Instructions to account for the added costs for jamb returns where sheathing thickness required these also were given. Three builders participating in this study indicated that drywall returns would finish the added wall depth and believed the cost of jamb extensions was not significant.10 The aggregate numbers reported in the matrix for the various sheathing choices for wood exterior walls include a WRB for all applications. While it may be possible for some of the foam sheathings to serve as a WRB, if taped, reported costs did not appear to include tape, and it was beyond the scope of this study to ascertain whether each of the alternate sheathings was in code compliance as an alternate weather barrier/drainage plane. Wall costs include any added expense to attach siding to foam sheathing. These prices cannot assume to be applicable in seismic or high wind zones, in addition to homes with multiple stories above grade. Because of its recent market introduction and cost competitiveness with traditional insulative sheathings, the cost of an additional sheathing – SIS (structural insulating sheathing) - was added to the list of component costs that were collected. All four of the builders reported installation costs for an open cell spray foam product. All builders contributing to this paper were unsuccessful in obtaining reliable bids for mineral or rock wool batts due to the material being unavailable in their marketplace or through their traditional distribution networks. The MD Climate Zone 4 workbook (Appendix 5) contains some costs for this material; however, it was only available in 2’ x 4’ batts of 2”, 3”, and 4” thicknesses, which were deemed impractical for exterior wall cavity application. Because of this, mineral wool insulation is not included in this study.
10
The fourth builder reported an added cost of $20 per wood window for jamb extensions required with sheathings of 1” or greater thickness. The cost is not reflected in any of the assemblies because vinyl windows are the assumed “base component”.

Economic Database in Support of ASHRAE 90.2 1481-RP
NAHB Research Center March 2009 12
Matrix B1: Wood Exterior Wall with Fiberglass Cavity Insulation
Single Family Detached National Average Cost Per Square Foot 2008
2 x 4 Wall at 16" oc
2 x 6 Wall at 16" oc.
2 x 4 Wall at 24" oc
2 x 6 Wall at 24" oc.
Cavity Insulation R-Value
11 13 15 19 21 11 13 15 19 21
Approx. R-Value
of Insulation
Thickness Continuous
Sheathing Type Unit of
Measure Fiberglass Batt, kraft face, stapled
7/16" OSB sq. ft. 5.64 5.72 5.97 6.72 6.90 5.37 5.45 5.71 6.40 6.58
1/8"
Structural Laminated Fibrous Board
sq. ft. 5.80 5.88 6.13 6.89 7.06 5.54 5.62 5.87 6.57 6.75
5 1"
SIS Panel (Polyiso and struct. sheathing
sq. ft. 6.49 6.57 6.82 8.52 8.69 6.05 6.13 6.39 8.09 8.27
2 1/2" EPS sq. ft. 5.96 6.04 6.29 7.05 7.22 5.68 5.76 6.01 6.70 6.88
3 3/4" EPS sq. ft. 6.15 6.23 6.48 7.24 7.42 5.86 5.94 6.19 6.89 7.06
4 1" EPS sq. ft. 6.23 6.31 6.56 7.32 7.50 5.94 6.02 6.27 6.97 7.14
2.5 1/2" XPS sq. ft. 6.52 6.60 6.85 7.54 7.71 6.20 6.28 6.53 7.18 7.36
4 3/4" XPS sq. ft. 6.59 6.67 6.92 7.68 7.85 6.30 6.38 6.63 7.32 7.50
5 1" XPS sq. ft. 6.87 6.95 7.20 7.89 8.07 6.54 6.62 6.87 7.52 7.69
3.2 1/2" Polyisocyanurate sq. ft. 6.51 6.59 6.84 7.85 8.02 6.17 6.25 6.50 7.45 7.62
5 3/4" Polyisocyanurate sq. ft. 7.14 7.22 7.47 8.50 8.67 6.69 6.77 7.02 8.02 8.19
6.5 1" Polyisocyanurate sq. ft. 7.41 7.49 7.74 8.77 8.94 6.96 7.04 7.29 8.29 8.46
10 1 1/2" Polyisocyanurate sq. ft. 8.07 8.15 8.40 9.42 9.60 7.62 7.70 7.95 8.95 9.12 Assembly consists of the national average cost estimates for: B1. ExtWoodWalls2x4 B5. Insulation-Walls B2.ExtWoodWalls2x6 Each assembly includes a WRB. Alternate sheathing includes labor and material for wall bracing in standard wind and non-seismic zones; no OSB. Based on standard window/door jambs and drywall returns at no cost.
Economic Database in Support of ASHRAE 90.2 1481-RP
NAHB Research Center March 2009 13
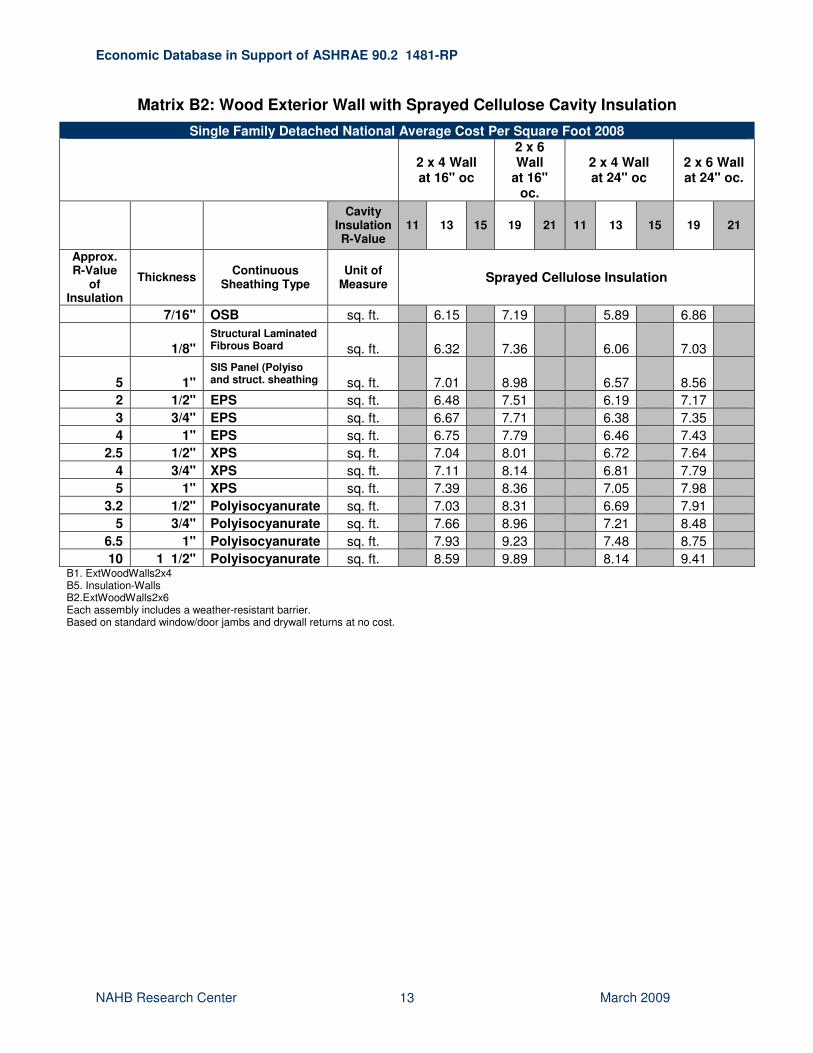
Matrix B2: Wood Exterior Wall with Sprayed Cellulose Cavity Insulation
Single Family Detached National Average Cost Per Square Foot 2008
2 x 4 Wall at 16" oc
2 x 6 Wall
at 16" oc.
2 x 4 Wall at 24" oc
2 x 6 Wall at 24" oc.
Cavity
Insulation R-Value
11 13 15 19 21 11 13 15 19 21
Approx. R-Value
of Insulation
Thickness Continuous
Sheathing Type Unit of
Measure Sprayed Cellulose Insulation
7/16" OSB sq. ft. 6.15 7.19 5.89 6.86
1/8" Structural Laminated Fibrous Board sq. ft. 6.32 7.36 6.06 7.03
5 1" SIS Panel (Polyiso and struct. sheathing sq. ft. 7.01 8.98 6.57 8.56
2 1/2" EPS sq. ft. 6.48 7.51 6.19 7.17
3 3/4" EPS sq. ft. 6.67 7.71 6.38 7.35
4 1" EPS sq. ft. 6.75 7.79 6.46 7.43
2.5 1/2" XPS sq. ft. 7.04 8.01 6.72 7.64
4 3/4" XPS sq. ft. 7.11 8.14 6.81 7.79
5 1" XPS sq. ft. 7.39 8.36 7.05 7.98
3.2 1/2" Polyisocyanurate sq. ft. 7.03 8.31 6.69 7.91
5 3/4" Polyisocyanurate sq. ft. 7.66 8.96 7.21 8.48
6.5 1" Polyisocyanurate sq. ft. 7.93 9.23 7.48 8.75
10 1 1/2" Polyisocyanurate sq. ft. 8.59 9.89 8.14 9.41 B1. ExtWoodWalls2x4 B5. Insulation-Walls B2.ExtWoodWalls2x6 Each assembly includes a weather-resistant barrier. Based on standard window/door jambs and drywall returns at no cost.
Economic Database in Support of ASHRAE 90.2 1481-RP
NAHB Research Center March 2009 14
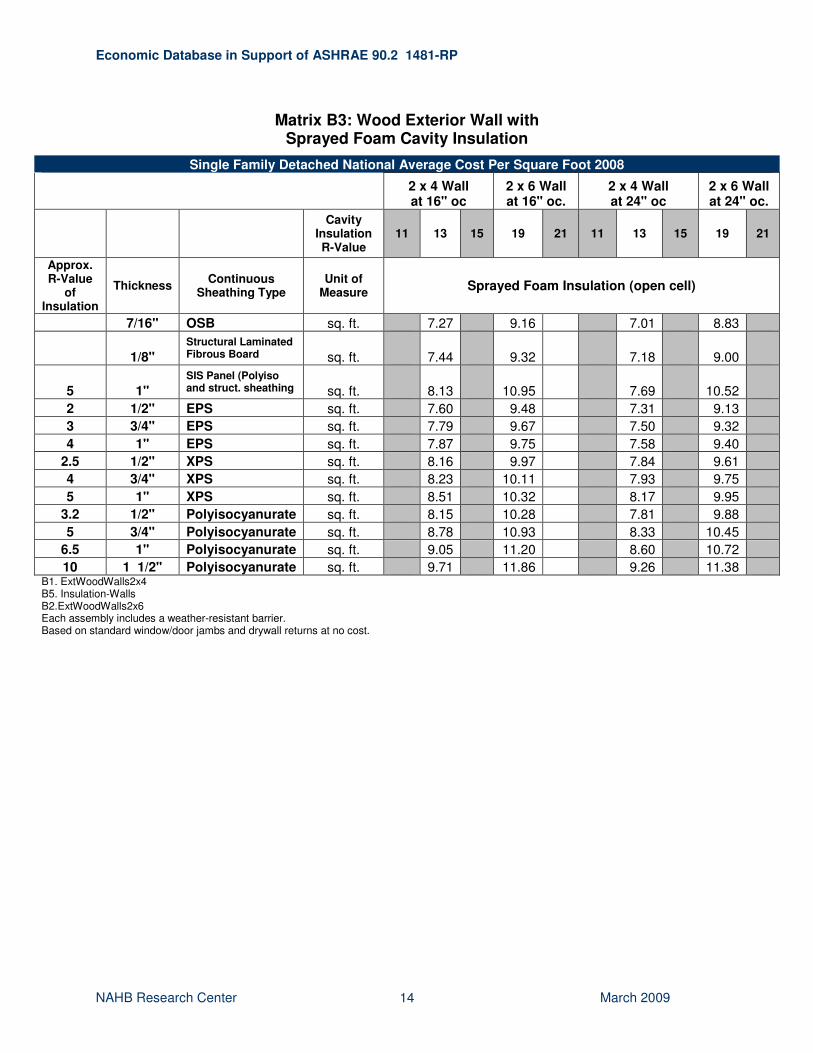
Matrix B3: Wood Exterior Wall with Sprayed Foam Cavity Insulation
Single Family Detached National Average Cost Per Square Foot 2008
2 x 4 Wall at 16" oc
2 x 6 Wall at 16" oc.
2 x 4 Wall at 24" oc
2 x 6 Wall at 24" oc.
Cavity
Insulation R-Value
11 13 15 19 21 11 13 15 19 21
Approx. R-Value
of Insulation
Thickness Continuous
Sheathing Type Unit of
Measure Sprayed Foam Insulation (open cell)
7/16" OSB sq. ft. 7.27 9.16 7.01 8.83
1/8" Structural Laminated Fibrous Board sq. ft. 7.44 9.32 7.18 9.00
5 1" SIS Panel (Polyiso and struct. sheathing sq. ft. 8.13 10.95 7.69 10.52
2 1/2" EPS sq. ft. 7.60 9.48 7.31 9.13
3 3/4" EPS sq. ft. 7.79 9.67 7.50 9.32
4 1" EPS sq. ft. 7.87 9.75 7.58 9.40
2.5 1/2" XPS sq. ft. 8.16 9.97 7.84 9.61
4 3/4" XPS sq. ft. 8.23 10.11 7.93 9.75
5 1" XPS sq. ft. 8.51 10.32 8.17 9.95
3.2 1/2" Polyisocyanurate sq. ft. 8.15 10.28 7.81 9.88
5 3/4" Polyisocyanurate sq. ft. 8.78 10.93 8.33 10.45
6.5 1" Polyisocyanurate sq. ft. 9.05 11.20 8.60 10.72
10 1 1/2" Polyisocyanurate sq. ft. 9.71 11.86 9.26 11.38 B1. ExtWoodWalls2x4 B5. Insulation-Walls B2.ExtWoodWalls2x6 Each assembly includes a weather-resistant barrier. Based on standard window/door jambs and drywall returns at no cost.
Economic Database in Support of ASHRAE 90.2 1481-RP
NAHB Research Center March 2009 15
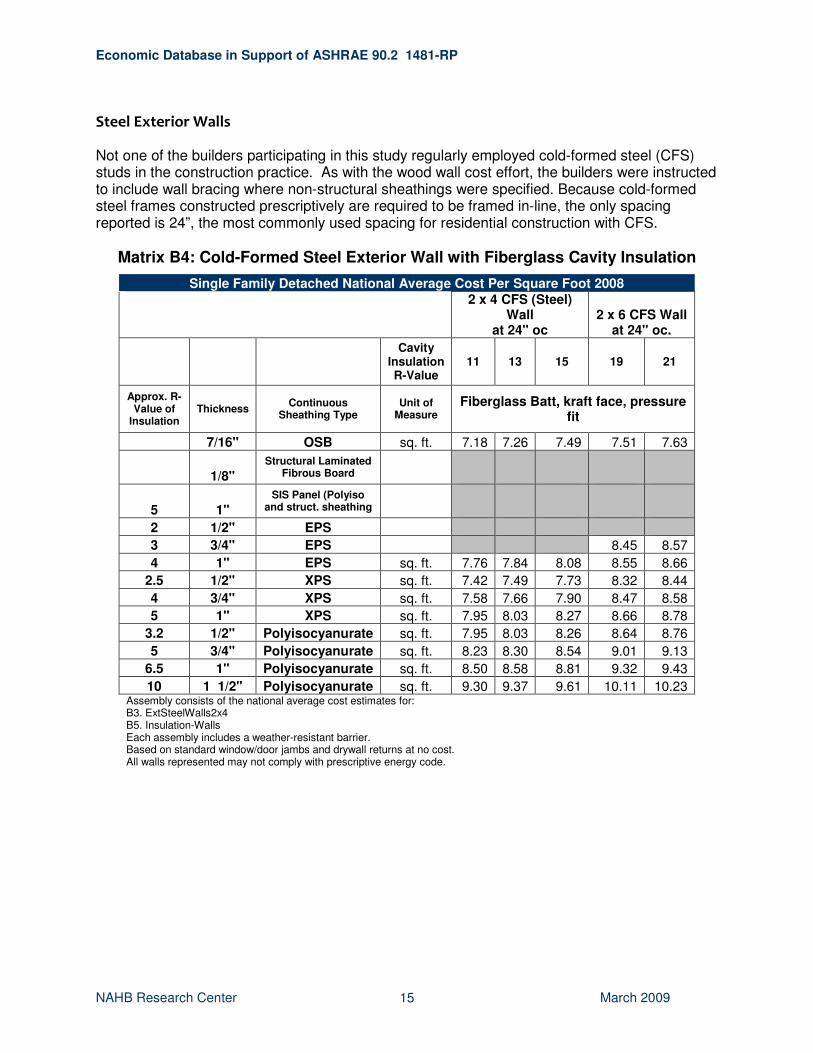
Steel Exterior Walls
Not one of the builders participating in this study regularly employed cold-formed steel (CFS) studs in the construction practice. As with the wood wall cost effort, the builders were instructed to include wall bracing where non-structural sheathings were specified. Because cold-formed steel frames constructed prescriptively are required to be framed in-line, the only spacing reported is 24”, the most commonly used spacing for residential construction with CFS.
Matrix B4: Cold-Formed Steel Exterior Wall with Fiberglass Cavity Insulation
Single Family Detached National Average Cost Per Square Foot 2008
2 x 4 CFS (Steel) Wall
at 24" oc 2 x 6 CFS Wall
at 24" oc.
Cavity
Insulation R-Value
11 13 15 19 21
Approx. R-Value of
Insulation Thickness
Continuous Sheathing Type
Unit of Measure
Fiberglass Batt, kraft face, pressure fit
7/16" OSB sq. ft. 7.18 7.26 7.49 7.51 7.63
1/8" Structural Laminated
Fibrous Board
5 1" SIS Panel (Polyiso
and struct. sheathing
2 1/2" EPS
3 3/4" EPS 8.45 8.57
4 1" EPS sq. ft. 7.76 7.84 8.08 8.55 8.66
2.5 1/2" XPS sq. ft. 7.42 7.49 7.73 8.32 8.44
4 3/4" XPS sq. ft. 7.58 7.66 7.90 8.47 8.58
5 1" XPS sq. ft. 7.95 8.03 8.27 8.66 8.78
3.2 1/2" Polyisocyanurate sq. ft. 7.95 8.03 8.26 8.64 8.76
5 3/4" Polyisocyanurate sq. ft. 8.23 8.30 8.54 9.01 9.13
6.5 1" Polyisocyanurate sq. ft. 8.50 8.58 8.81 9.32 9.43
10 1 1/2" Polyisocyanurate sq. ft. 9.30 9.37 9.61 10.11 10.23 Assembly consists of the national average cost estimates for: B3. ExtSteelWalls2x4 B5. Insulation-Walls Each assembly includes a weather-resistant barrier. Based on standard window/door jambs and drywall returns at no cost. All walls represented may not comply with prescriptive energy code.

Economic Database in Support of ASHRAE 90.2 1481-RP
NAHB Research Center March 2009 16
Matrix B5: Cold-Formed Steel Exterior Walls with Sprayed Cellulose Cavity Insulation
Single Family Detached National Average Cost Per Square Foot 2008
2 x 4 CFS
(Steel) Wall at 24" oc
2 x 6 CFS Wall at 24" oc.
Cavity
Insulation R-Value
11 13 15 19 21
Approx. R-Value of Insulation
Thickness Continuous Sheathing
Type Unit of
Measure Sprayed Cellulose Insulation
7/16" OSB sq. ft. 7.60 7.87
1/8"
Structural Laminated Fibrous Board
5 1"
SIS Panel (Polyiso and struct. sheathing
sq. ft.
2 1/2" EPS sq. ft. 8.03 8.76
3 3/4" EPS sq. ft. 8.09 8.81
4 1" EPS sq. ft. 8.18 8.91
2.5 1/2" XPS sq. ft. 7.83 8.68
4 3/4" XPS sq. ft. 8.00 8.83
5 1" XPS sq. ft. 8.37 9.02
3.2 1/2" Polyisocyanurate sq. ft. 8.37 9.00
5 3/4" Polyisocyanurate sq. ft. 8.64 9.37
6.5 1" Polyisocyanurate sq. ft. 8.91 9.68
10 1 1/2" Polyisocyanurate sq. ft. 9.71 10.47 Assembly consists of the national average cost estimates for: B3. ExtSteelWalls2x4 B5. Insulation-Walls Each assembly includes a weather-resistant barrier. Based on standard window/door jambs and drywall returns at no cost. All walls represented may not comply with prescriptive energy code.

Economic Database in Support of ASHRAE 90.2 1481-RP
NAHB Research Center March 2009 17
Matrix B6: Cold-Formed Steel Exterior Wall with Sprayed Foam Cavity Insulation
Single Family Detached National Average Cost Per Square Foot 2008
2 x 4 CFS (Steel)
Wall at 24" oc 2 x 6 CFS Wall
at 24" oc.
Cavity
Insulation R-Value
11 13 15 19 21
Approx. R-Value
of Insulation
Thickness Continuous Sheathing
Type Unit of
Measure Sprayed Foam Insulation
7/16" OSB sq. ft. 8.72 9.83
1/8" Structural Laminated Fibrous Board
5 1" SIS Panel (Polyiso and struct. sheathing
2 1/2" EPS 9.15 10.72
3 3/4" EPS sq. ft. 9.21 10.78
4 1" EPS sq. ft. 9.30 10.87
2.5 1/2" XPS sq. ft. 8.95 10.65
4 3/4" XPS sq. ft. 9.12 10.79
5 1" XPS sq. ft. 9.49 10.99
3.2 1/2" Polyisocyanurate sq. ft. 9.49 10.97
5 3/4" Polyisocyanurate sq. ft. 9.76 11.33
6.5 1" Polyisocyanurate sq. ft. 10.03 11.64
10 1 1/2" Polyisocyanurate sq. ft. 10.83 12.44 Assembly consists of the national average cost estimates for: B3. ExtSteelWalls2x4 B5. Insulation-Walls Each assembly includes a weather-resistant barrier. Based on standard window/door jambs and drywall returns at no cost. All walls represented may not comply with prescriptive energy code.
C. Wood Framed Floors
Based on the builders surveyed, Builder Practices Survey results11, and minimum requirements for insulation in floor assemblies above unconditioned spaces, 2x6 dimensional lumber floor systems were not included in the costs reported for this study.
Because of evidence from the same source that the practice of spacing joists at 19.2” on center is not the norm, as well as the lack of market availability of insulation batts sized for the spacing, only 16”- and 24”-spaced floor assemblies appear in the matrix.
11 NAHB Research Center, Builder Practices Survey, 2007. Survey results indicate that less than 8% of the new residential construction market report using 2x8, or smaller, lumber as floor joists. Survey results indicate that 18% of all first or second floor assemblies are spaced on 19.2” centerlines.

Economic Database in Support of ASHRAE 90.2 1481-RP
NAHB Research Center March 2009 18
Matrix C1. Wood Framed Floor with Fiberglass Batt Cavity Insulation Single Family Detached National Average Cost Per Square Foot 2008
Joists at 16" oc Joists at 24" oc
2 x 8 Joist
2 x 10 or 9
1/4" I-J
2 x 12 or 11 7/8 I-J
14" or 16" I-Joist
2 x 8 2 x 10 2 x 12 14" or 16" I-Joist
Cavity Insulation R-Value
Thickness (inches)
Unit of Measure
Fiberglass Batt, Kraft Face, secured in place
13 3 1/2 sq. ft 3.49 3.72 4.45 4.78 3.55 3.69 4.59 5.48
19 5 1/2 sq. ft 3.59 3.81 4.55 5.01 3.69 3.82 4.69 5.59
25 8 sq. ft 3.82 4.09 4.80 5.20 3.84 4.02 4.94 5.86
30 10 sq. ft 4.30 5.03 5.56 4.25 5.17 6.09
30C* 8.25 sq. ft 4.67 5.10 5.77 4.75 5.66 6.43
38 12 sq. ft 5.62 6.28
38C* 10.5 sq. ft 5.53 6.20 6.09 6.86
49 15 sq. ft 7.16 6.99 Assembly consists of the national average cost estimates for: C. Wood framed floor assembly - fiberglass batt insulation, joists, and labor. Does not include subfloor.
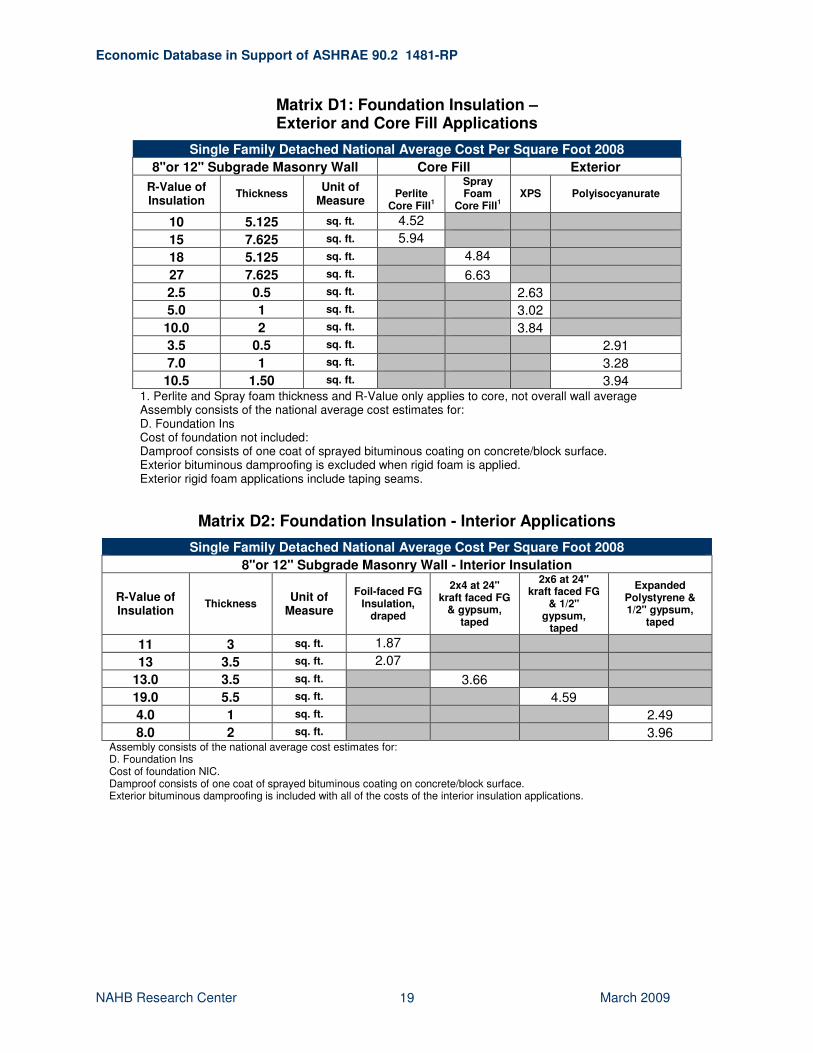
D. Foundation Insulation
The builders participating in this study did not find a source for R-4 foil-faced insulation, so that cost estimate is not reported. No costs were obtained for foil-faced (flamespread) insulation batts in excess of R-13.
Expanded polystyrene may not be suitable for sub-grade installations without a continuous protective covering; therefore, EPS is not reported as a slab exterior foundation insulation.
Economic Database in Support of ASHRAE 90.2 1481-RP
NAHB Research Center March 2009 19
Matrix D1: Foundation Insulation – Exterior and Core Fill Applications
Single Family Detached National Average Cost Per Square Foot 2008
8"or 12" Subgrade Masonry Wall Core Fill Exterior
R-Value of Insulation
Thickness Unit of
Measure Perlite
Core Fill1
Spray Foam
Core Fill1
XPS Polyisocyanurate
10 5.125 sq. ft. 4.52
15 7.625 sq. ft. 5.94
18 5.125 sq. ft. 4.84
27 7.625 sq. ft. 6.63
2.5 0.5 sq. ft. 2.63
5.0 1 sq. ft. 3.02
10.0 2 sq. ft. 3.84
3.5 0.5 sq. ft. 2.91
7.0 1 sq. ft. 3.28
10.5 1.50 sq. ft. 3.94 1. Perlite and Spray foam thickness and R-Value only applies to core, not overall wall average Assembly consists of the national average cost estimates for: D. Foundation Ins Cost of foundation not included: Damproof consists of one coat of sprayed bituminous coating on concrete/block surface. Exterior bituminous damproofing is excluded when rigid foam is applied. Exterior rigid foam applications include taping seams.
Matrix D2: Foundation Insulation - Interior Applications
Single Family Detached National Average Cost Per Square Foot 2008
8"or 12" Subgrade Masonry Wall - Interior Insulation
R-Value of Insulation
Thickness Unit of
Measure
Foil-faced FG Insulation,
draped
2x4 at 24" kraft faced FG
& gypsum, taped
2x6 at 24" kraft faced FG
& 1/2" gypsum,
taped
Expanded Polystyrene & 1/2" gypsum,
taped
11 3 sq. ft. 1.87
13 3.5 sq. ft. 2.07
13.0 3.5 sq. ft. 3.66
19.0 5.5 sq. ft. 4.59
4.0 1 sq. ft. 2.49
8.0 2 sq. ft. 3.96 Assembly consists of the national average cost estimates for: D. Foundation Ins Cost of foundation NIC. Damproof consists of one coat of sprayed bituminous coating on concrete/block surface. Exterior bituminous damproofing is included with all of the costs of the interior insulation applications.
Economic Database in Support of ASHRAE 90.2 1481-RP
NAHB Research Center March 2009 20
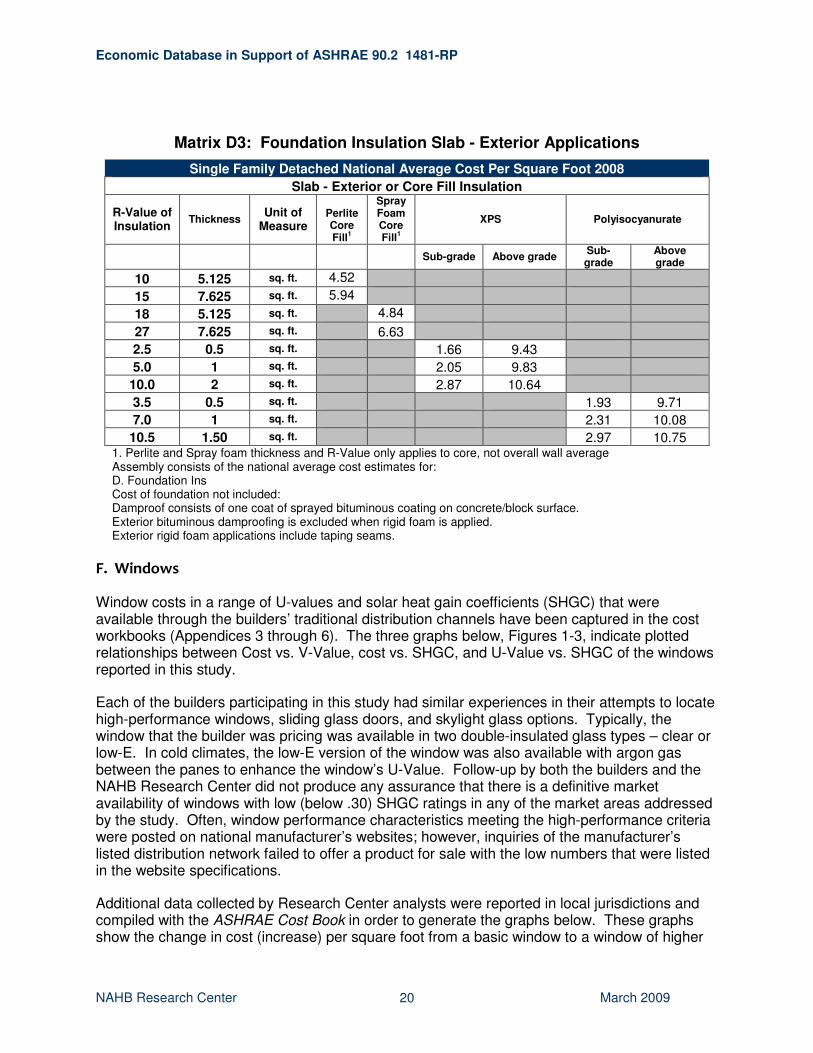
Matrix D3: Foundation Insulation Slab - Exterior Applications
Single Family Detached National Average Cost Per Square Foot 2008
Slab - Exterior or Core Fill Insulation
R-Value of Insulation
Thickness Unit of
Measure Perlite Core Fill
1
Spray Foam Core Fill
1
XPS Polyisocyanurate
Sub-grade Above grade
Sub-grade
Above grade
10 5.125 sq. ft. 4.52
15 7.625 sq. ft. 5.94
18 5.125 sq. ft. 4.84
27 7.625 sq. ft. 6.63
2.5 0.5 sq. ft. 1.66 9.43
5.0 1 sq. ft. 2.05 9.83
10.0 2 sq. ft. 2.87 10.64
3.5 0.5 sq. ft. 1.93 9.71
7.0 1 sq. ft. 2.31 10.08
10.5 1.50 sq. ft. 2.97 10.75 1. Perlite and Spray foam thickness and R-Value only applies to core, not overall wall average Assembly consists of the national average cost estimates for: D. Foundation Ins Cost of foundation not included: Damproof consists of one coat of sprayed bituminous coating on concrete/block surface. Exterior bituminous damproofing is excluded when rigid foam is applied. Exterior rigid foam applications include taping seams.
F. Windows
Window costs in a range of U-values and solar heat gain coefficients (SHGC) that were available through the builders’ traditional distribution channels have been captured in the cost workbooks (Appendices 3 through 6). The three graphs below, Figures 1-3, indicate plotted relationships between Cost vs. V-Value, cost vs. SHGC, and U-Value vs. SHGC of the windows reported in this study.
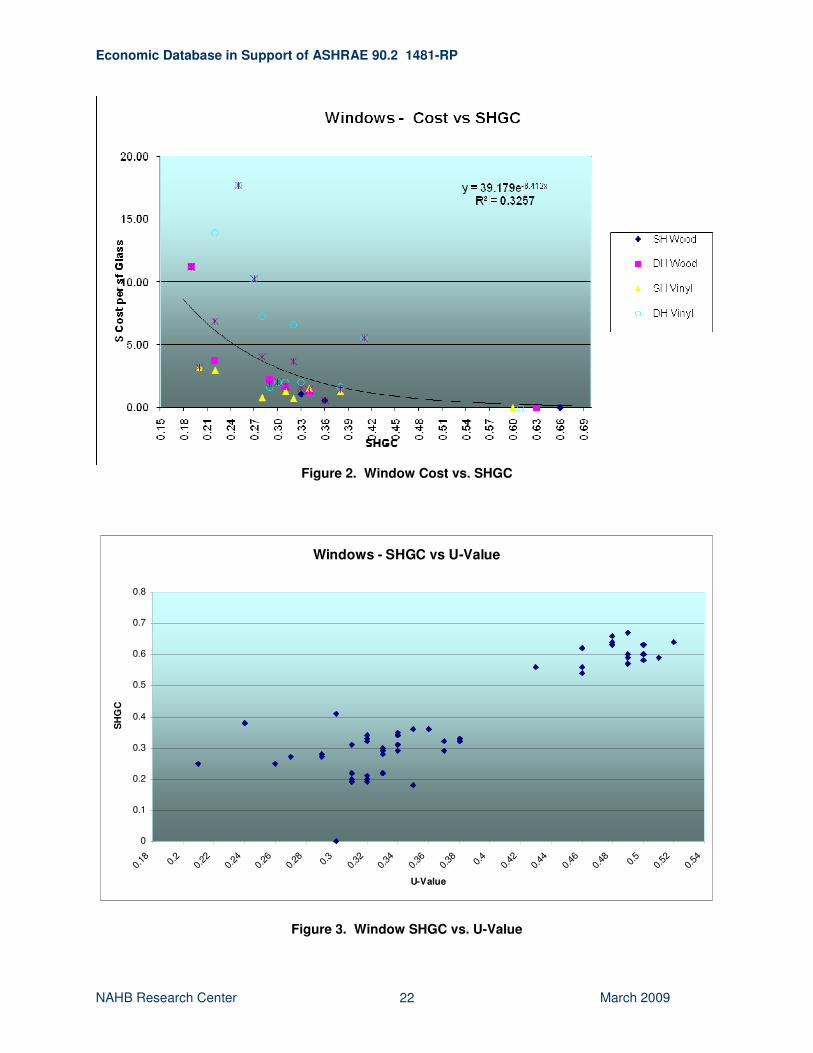
Each of the builders participating in this study had similar experiences in their attempts to locate high-performance windows, sliding glass doors, and skylight glass options. Typically, the window that the builder was pricing was available in two double-insulated glass types – clear or low-E. In cold climates, the low-E version of the window was also available with argon gas between the panes to enhance the window’s U-Value. Follow-up by both the builders and the NAHB Research Center did not produce any assurance that there is a definitive market availability of windows with low (below .30) SHGC ratings in any of the market areas addressed by the study. Often, window performance characteristics meeting the high-performance criteria were posted on national manufacturer’s websites; however, inquiries of the manufacturer’s listed distribution network failed to offer a product for sale with the low numbers that were listed in the website specifications.
Additional data collected by Research Center analysts were reported in local jurisdictions and compiled with the ASHRAE Cost Book in order to generate the graphs below. These graphs show the change in cost (increase) per square foot from a basic window to a window of higher

Economic Database in Support of ASHRAE 90.2 1481-RP
NAHB Research Center March 2009 21
thermal-resistive performance. Data points cover various window styles, manufacturers, frame types, and performance ratings.
Figures 1 and 2 used a similar approach in trying to capture the cost of obtaining lower U-factors and SHGC levels. The scatter plot in figure 1 was populated with the windows U-Value and additional cost per square foot to go beyond the base line of a double-glazed clear glass window. The equation for the trend line that best represents distribution can be used to determine the cost for windows within the data range. The additional cost is always referenced to a window within the same series in order to eliminate differences in window construction.
y = 1851.9e-19.29x
R² = 0.8622
0.00
5.00
10.00
15.00
20.00
25.00
0.18
0.23
0.28
0.33
0.38
0.43
0.48
0.53
0.58
$ Cost per SF Glass
U-Value
Windows - Cost vs U-Value
SH Wood
DH Wood
SH Vinyl
DH Vinyl
Average
Expon. (Average)
Figure 1. Window Cost vs. U-Value
From the window figures it can be seen that there is a relatively small variance in the cost per square foot of window relative to the U-Value resulting in an R-Squared or 0.86. This variance is significantly higher when looking at cost compared to U-Value. Meaning that U-Value is the determinate factor in window pricing with SHGC still being a factor, but much less predictable.
Economic Database in Support of ASHRAE 90.2 1481-RP
NAHB Research Center March 2009 22
Figure 2. Window Cost vs. SHGC
Windows - SHGC vs U-Value
0
0.1
0.2
0.3
0.4
0.5
0.6
0.7
0.8
0.18 0.
20.
220.
240.
260.
28 0.3
0.32
0.34
0.36
0.38 0.
40.
420.
440.
460.
48 0.5
0.52
0.54
U-Value
SH
GC
Figure 3. Window SHGC vs. U-Value
Economic Database in Support of ASHRAE 90.2 1481-RP
NAHB Research Center March 2009 23
Window Size and Type Grade Frame
Material Location U-
value SHGC VT Mfgr
Cost per
SqFt
3050 SH 7/16" glass Std Vinyl OH 0.51 0.59 0.62 #7 $13.76
3050 SH 7/16" glass Std Vinyl MD 0.49 0.57 0.59 #6 $14.17
3050 SH 7/16" glass Std Vinyl MD 0.49 0.57 0.60 #4 $14.47
3050 SH 7/16" glass, Low-E Std Vinyl OH 0.37 0.32 0.55 #7 $14.50
3050 SH 7/16" glass, Low-E Std Vinyl MD 0.33 0.28 0.51 #6 $14.98
3050 SH 7/16" glass, Low-E 272 Std Vinyl MD 0.34 0.31 0.52 #4 $15.78
3050 SH 7/16" glass Std Vinyl OK 0.48 0.63 0.66 #4 $15.85
3050 SH 7/16" glass Std Vinyl OK 0.50 0.58 0.59 #5 $17.22
3050 SH 7/16" glass, Low-E 272 Std Vinyl OK 0.34 0.34 0.58 #4 $17.38
3050 SH Std Wood OK 0.49 0.67 0.70 #4 $17.57
3050 SH 7/16" glass, Low-E Std Vinyl TX 0.34 0.35 0.54 #7 $17.67
3050 SH 7/16" glass, Low-E 272, argon Std Vinyl MD 0.32 0.20 0.47 #4 $17.69
3050 SH 7/16" glass, Low-E Std Vinyl OK 0.24 0.38 0.54 #5 $18.50
3050 SH 7/16", Low-E Std Wood OK 0.36 0.36 0.61 #4 $19.21
3050 SH 7/16" glass, Low-E 366 Std Vinyl OK 0.33 0.22 0.52 #4 $19.43
3050 DH 7/16" insulated glass Pre Vinyl MD 0.49 0.59 0.60 #6 $19.70
3050 SH Low-E 272 Std Vinyl TX 0.34 0.34 0.58 #4 $20.51
3050 DH Pre Vinyl MD 0.49 0.59 #3 $20.61
3050 DH, 7/16" ins. Glass Pre Vinyl MD 0.49 0.60 0.83 #2 $20.72
3050 DH 7/16" ins. glass, Low-E Pre Vinyl MD 0.37 0.29 0.53 #6 $21.31
3050 DH insulated glass Pre Vinyl TX 0.46 0.62 0.65 #7 $21.88
3050 DH 7/16" ins. glass, Low-E Pre Vinyl TX 0.33 0.22 0.50 #7 $22.27
3050 DH 7/16" ins. Glass Pre Vinyl MD 0.31 0.30 #3 $22.62
3050 DH, 7/16" ins. glass, Low-E, Argon Pre Vinyl MD 0.33 0.30 0.71 #2 $22.73
3050 SH Low-E 366 Std Vinyl TX 0.33 0.22 0.52 #4 $22.88
3050 DH 7/16" insulated glass Pre Vinyl OH 0.46 0.62 0.65 #7 $23.31
3050 DH 7/16" insulated glass Pre Vinyl OK 0.52 0.64 0.66 #5 $24.24
3050 DH 7/16" ins. glass, Low-E Pre Vinyl OH 0.32 0.33 0.57 #7 $25.32
3050 DH 7/16" ins. glass, Low-E Pre Vinyl OK 0.24 0.38 0.58 #5 $25.88
3050 DH 7/16" ins. glass, Titanium Low-E, Argon Pre Vinyl MD 0.30 0.41 0.72 #3 $26.13
3050 DH, insulated Low-E 240 Pre Vinyl TX 0.32 0.21 0.32 #7 $27.54
3050 DH, 3- 7/16" ins. glass, Low-E, Argon Pre Vinyl MD 0.29 0.28 0.65 #2 $28.01
3050 DH, insulated Low e-5 w/ Argon Pre Vinyl TX 0.32 0.32 0.54 #7 $28.48
3050 DH, 3- 7/16" ins. glass, Titanium Low-E, Argon Pre Vinyl MD 0.29 0.27 0.66 #3 $29.05
3050 DH 3- 7/16" ins. glass, Low-E, Krypton Pre Vinyl MD 0.26 0.25 0.55 #2 $31.65
3050 DH 7/16" insulated glass Pre Wood OH 0.46 0.56 0.59 #8 $32.30
3050 DH, 3- 7/16" ins. glass, Titanium Low-E, Krypton Pre Vinyl MD 0.27 0.27 #3 $32.67
3050 DH 7/16" ins. glass, Low-E Pre Wood OH 0.34 0.31 0.52 #8 $33.95
Economic Database in Support of ASHRAE 90.2 1481-RP
NAHB Research Center March 2009 24
Window Size and Type Grade Frame
Material Location U-
value SHGC VT Mfgr
Cost per
SqFt
3050 DH, insulated Low-e-6 w/ Argon Pre Vinyl TX 0.31 0.22 0.51 #7 $35.81
3050 DH 7/16" insulated glass Pre Wood OK 0.48 0.64 0.67 #4 $36.77
3050 DH 7/16" ins. glass, Low-E Pre Wood OK 0.34 0.34 0.58 #4 $37.00
3050 SH Pre Wood OH 0.50 0.63 0.65 #4 $39.27
3050 SH 7/16", Low-E Pre Wood OH 0.38 0.33 0.57 #4 $40.37
3050 SH 7/16", Low-E Pre Wood TX 0.36 0.36 0.50 #9 $40.54
3050 DH insulated glass Pre Wood TX 0.46 0.54 0.57 #9 $42.09
3050 DH 7/16" ins. glass, Low-E Pre Wood MD 0.33 0.29 0.48 #1 $43.02
3050 DH 3- 7/16" ins. glass, Low-E, Krypton Pre Vinyl MD 0.21 0.25 0.55 #2 $45.24
3050 DH 7/16" ins. glass, Low-E Pre Wood TX 0.35 0.18 0.28 #9 $45.96
3050 DH, insulated Low-E 240 Pre Wood TX 0.34 0.29 0.50 #9 $46.49
3050 DH 7/16" insulated glass Pre Wood OK 0.48 0.63 0.66 #4 $46.51
3050 DH 7/16" glass, Low-E, Argon Pre Wood OK 0.32 0.34 0.58 #4 $48.85
3050 DH 7/16" glass, Low-E 366, Argon Pre Wood OK 0.31 0.22 0.52 #4 $50.26
3050 DH, insulated Low-e-6 w/ Argon Pre Wood TX 0.32 0.19 0.44 #9 $51.56
3050 DH, insulated Low e-5 w/ Argon Pre Wood TX 0.31 0.19 0.45 #9 $62.30
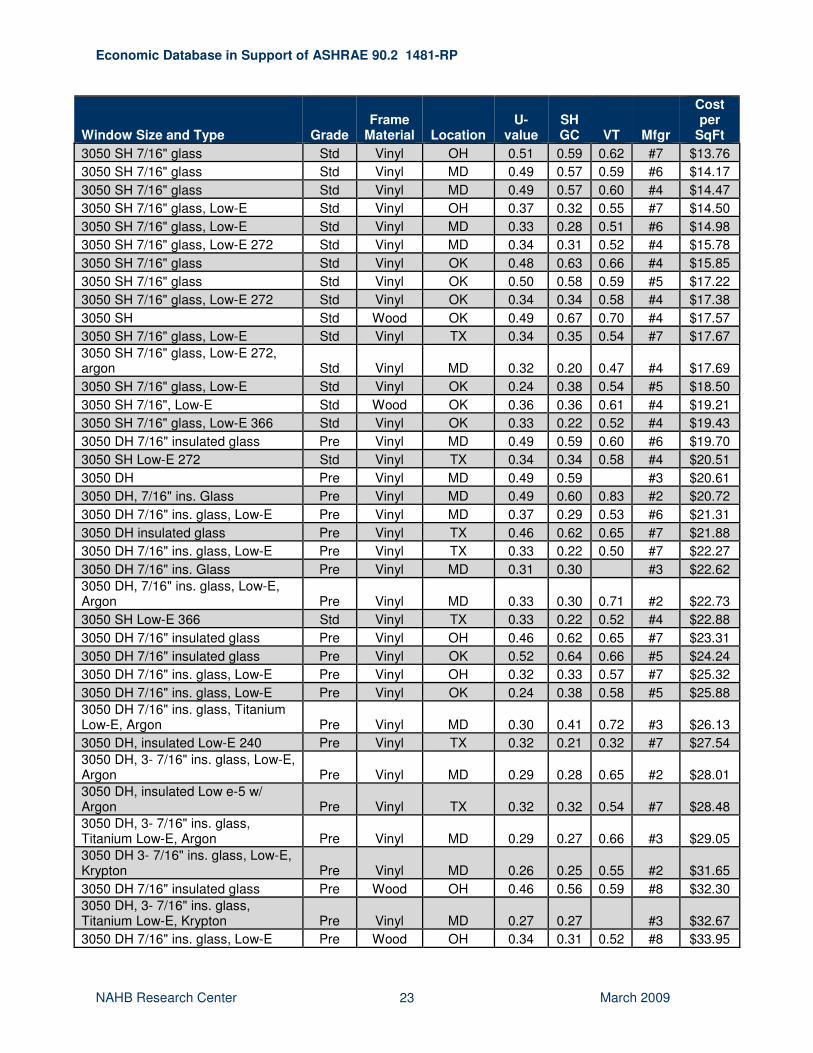
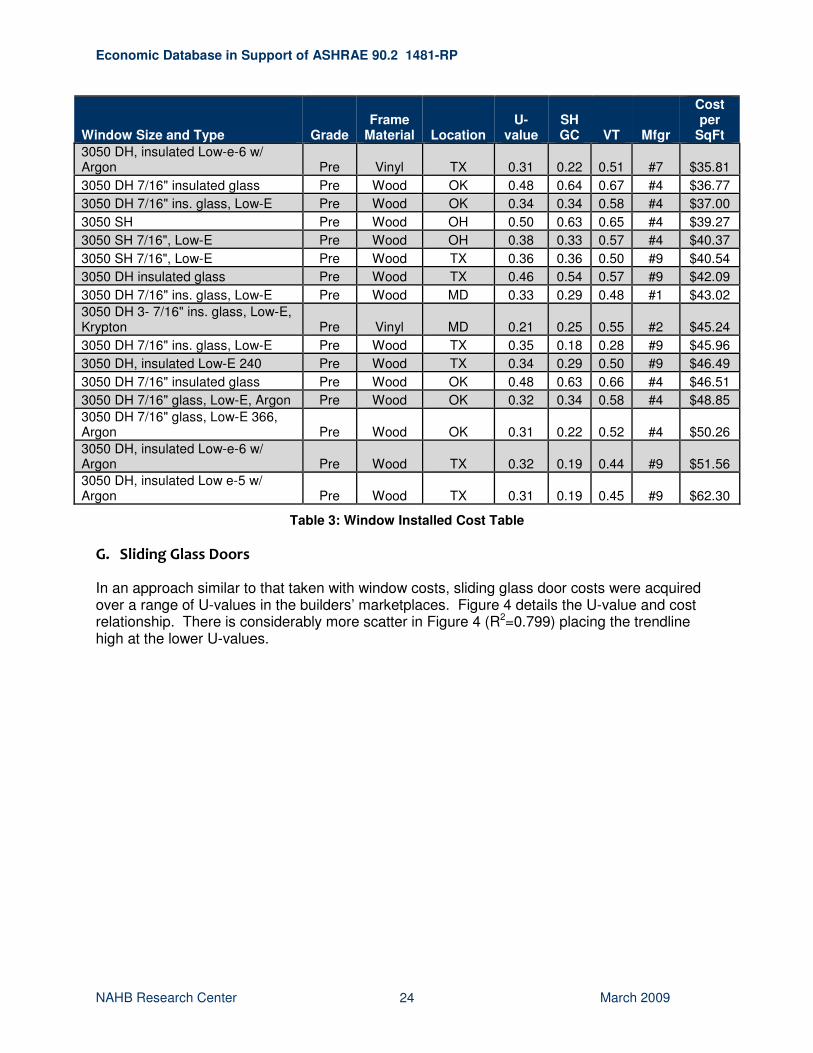
Table 3: Window Installed Cost Table
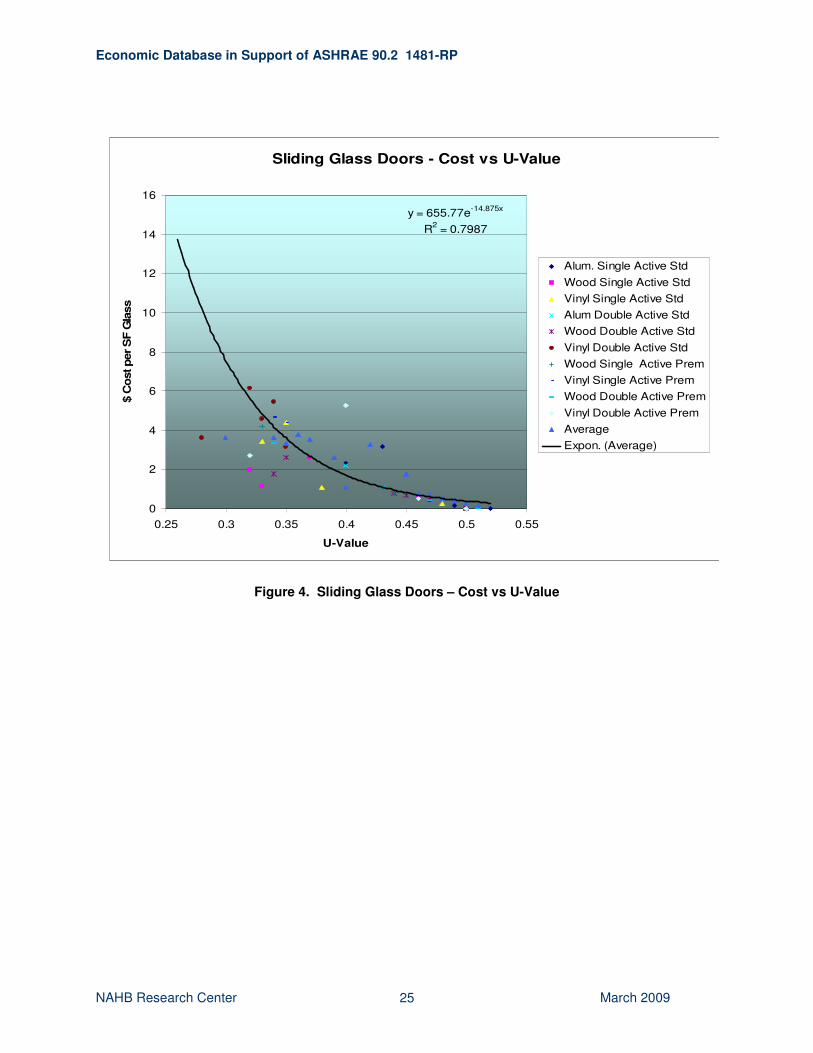
G. Sliding Glass Doors
In an approach similar to that taken with window costs, sliding glass door costs were acquired over a range of U-values in the builders’ marketplaces. Figure 4 details the U-value and cost relationship. There is considerably more scatter in Figure 4 (R2=0.799) placing the trendline high at the lower U-values.
Economic Database in Support of ASHRAE 90.2 1481-RP
NAHB Research Center March 2009 25
Figure 4. Sliding Glass Doors – Cost vs U-Value
Sliding Glass Doors - Cost vs U-Value
y = 655.77e-14.875x
R2 = 0.7987
0
2
4
6
8
10
12
14
16
0.25 0.3 0.35 0.4 0.45 0.5 0.55
U-Value
$ C
ost per S
F G
lass
Alum. Single Active Std
Wood Single Active Std
Vinyl Single Active Std
Alum Double Active Std
Wood Double Active Std
Vinyl Double Active Std
Wood Single Active Prem
Vinyl Single Active Prem
Wood Double Active Prem
Vinyl Double Active Prem
Average
Expon. (Average)
Economic Database in Support of ASHRAE 90.2 1481-RP
NAHB Research Center March 2009 26
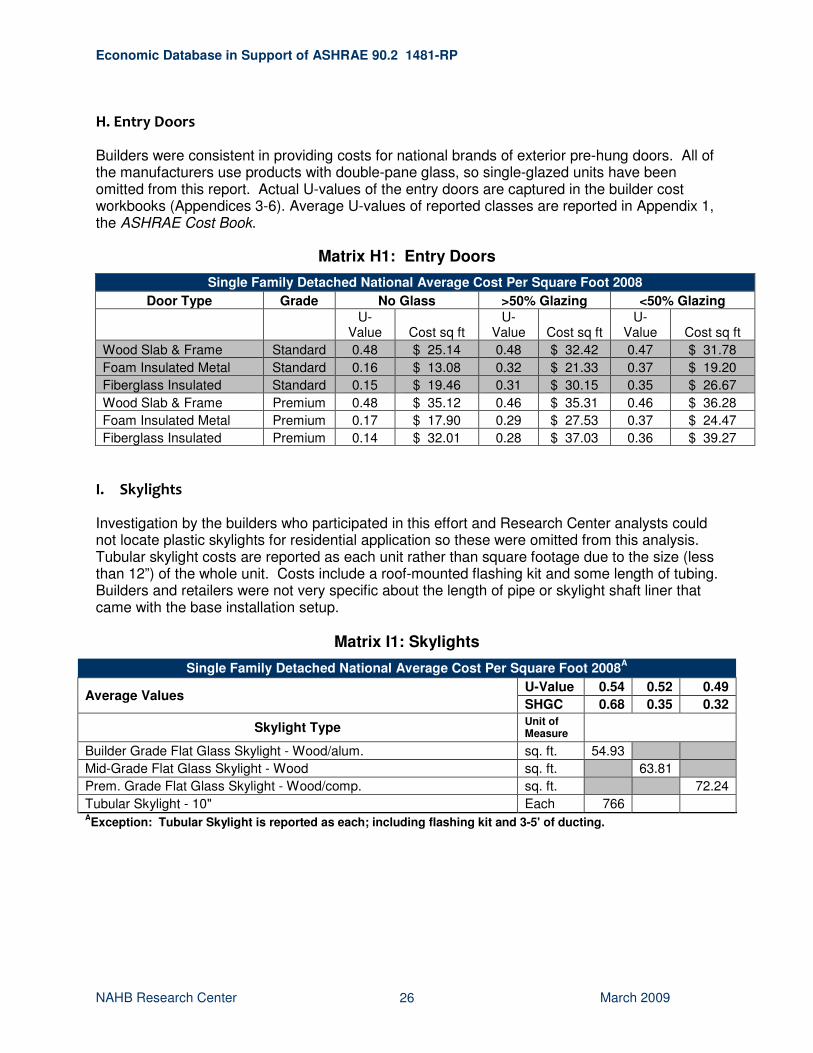
H. Entry Doors
Builders were consistent in providing costs for national brands of exterior pre-hung doors. All of the manufacturers use products with double-pane glass, so single-glazed units have been omitted from this report. Actual U-values of the entry doors are captured in the builder cost workbooks (Appendices 3-6). Average U-values of reported classes are reported in Appendix 1, the ASHRAE Cost Book.
Matrix H1: Entry Doors
Single Family Detached National Average Cost Per Square Foot 2008
Door Type Grade No Glass >50% Glazing <50% Glazing
U-
Value Cost sq ft U-
Value Cost sq ft U-
Value Cost sq ft
Wood Slab & Frame Standard 0.48 $ 25.14 0.48 $ 32.42 0.47 $ 31.78
Foam Insulated Metal Standard 0.16 $ 13.08 0.32 $ 21.33 0.37 $ 19.20
Fiberglass Insulated Standard 0.15 $ 19.46 0.31 $ 30.15 0.35 $ 26.67
Wood Slab & Frame Premium 0.48 $ 35.12 0.46 $ 35.31 0.46 $ 36.28
Foam Insulated Metal Premium 0.17 $ 17.90 0.29 $ 27.53 0.37 $ 24.47
Fiberglass Insulated Premium 0.14 $ 32.01 0.28 $ 37.03 0.36 $ 39.27
I. Skylights
Investigation by the builders who participated in this effort and Research Center analysts could not locate plastic skylights for residential application so these were omitted from this analysis. Tubular skylight costs are reported as each unit rather than square footage due to the size (less than 12”) of the whole unit. Costs include a roof-mounted flashing kit and some length of tubing. Builders and retailers were not very specific about the length of pipe or skylight shaft liner that came with the base installation setup.
Matrix I1: Skylights
Single Family Detached National Average Cost Per Square Foot 2008A
Average Values U-Value 0.54 0.52 0.49
SHGC 0.68 0.35 0.32
Skylight Type Unit of Measure
Builder Grade Flat Glass Skylight - Wood/alum. sq. ft. 54.93
Mid-Grade Flat Glass Skylight - Wood sq. ft. 63.81
Prem. Grade Flat Glass Skylight - Wood/comp. sq. ft. 72.24
Tubular Skylight - 10" Each 766 AException: Tubular Skylight is reported as each; including flashing kit and 3-5' of ducting.

Economic Database in Support of ASHRAE 90.2 1481-RP
NAHB Research Center March 2009 27
J. Air Infiltration Sealing
Air infiltration testing has been defined at three levels, measured as ACHN, – less than .35 (defined as code minimum), .16 -.25, and less than .15. It is expected that achievement of the two superior levels would also include compliance with the ENERGY STAR® thermal bypass checklist.
Matrix J1: Air Infiltration Sealing
Single Family Detached National Average Cost Per Square Foot 2008
Level of Performance Unit of Measure Cost
Basic, code minimum, ACHNAT approx. .35 sq. ft. 0.12
Better, ENERGYSTAR, ACHNAT .25 - .16 sq. ft. 0.23
Best, High Performance, ACHNAT less than .15 sq. ft. 0.36 Assembly consists of the national average cost estimates for: J. Air Infiltration Seal
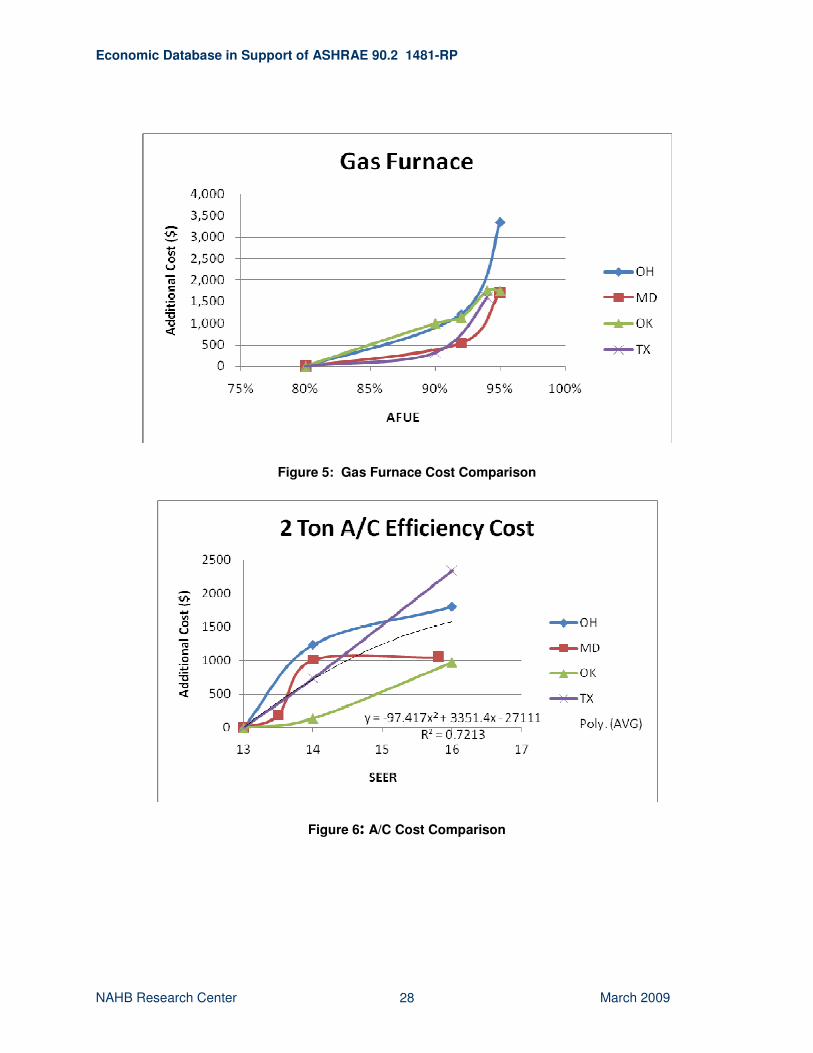
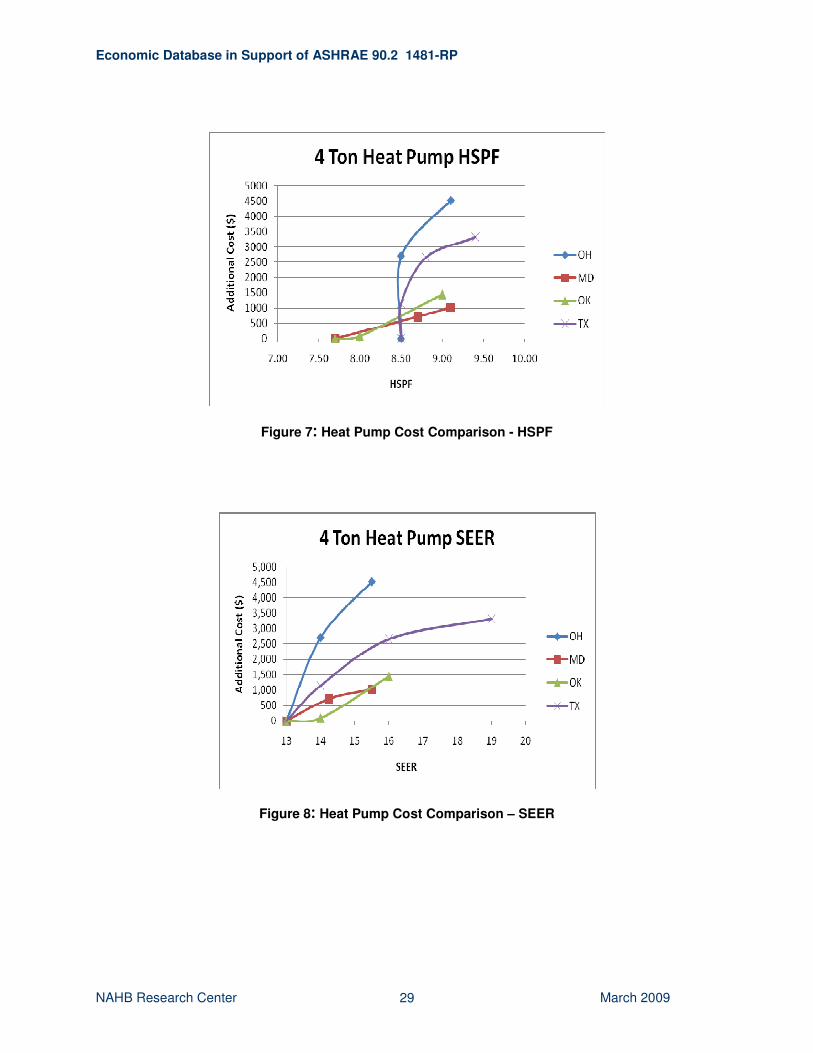
K., L., M. Heating Air Conditioning and Ventilation Systems (HVAC)
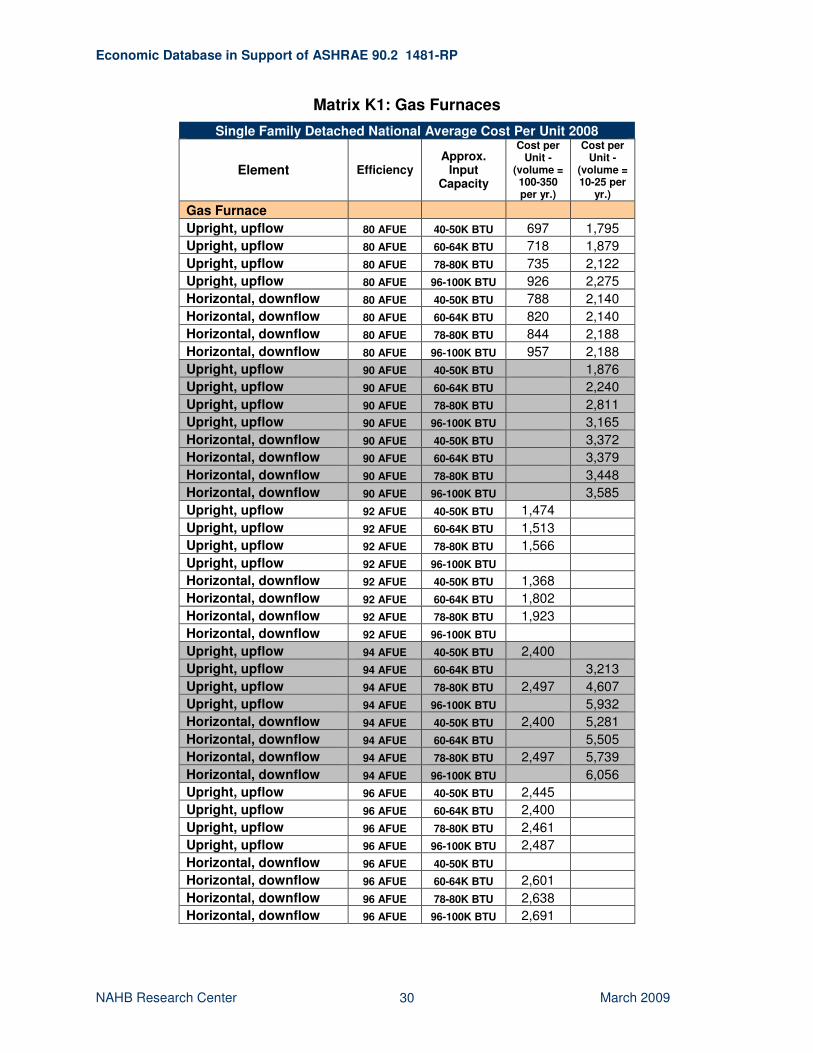
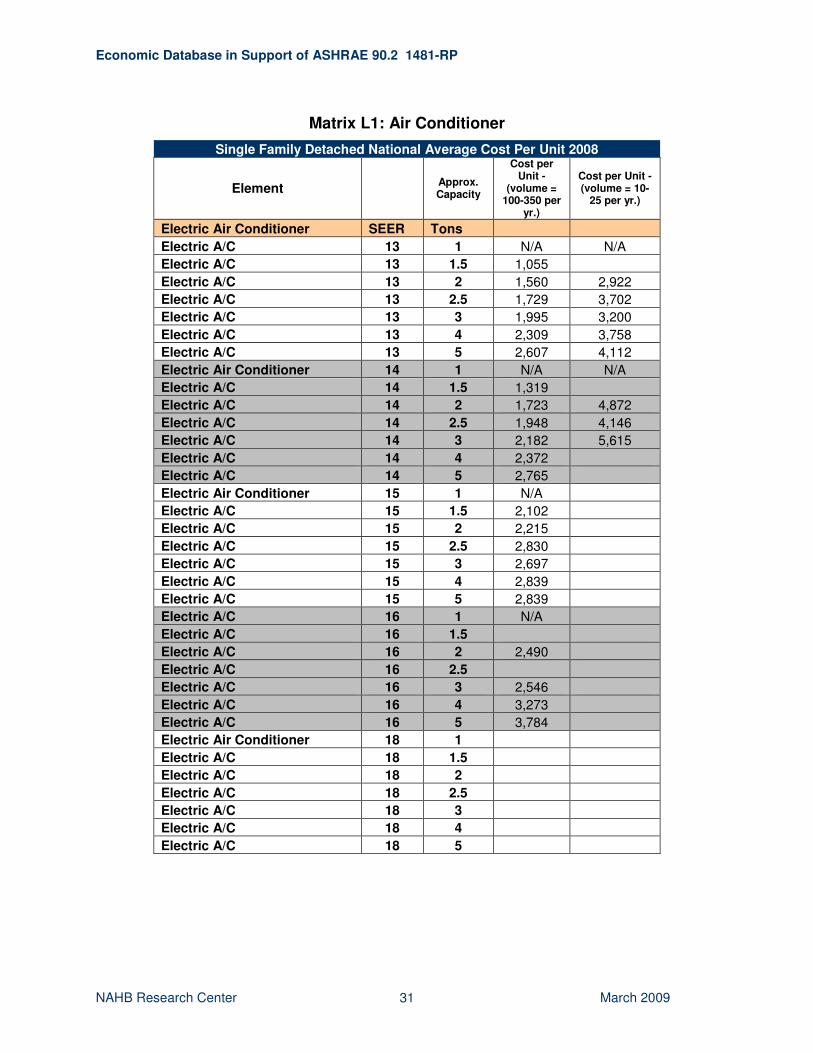
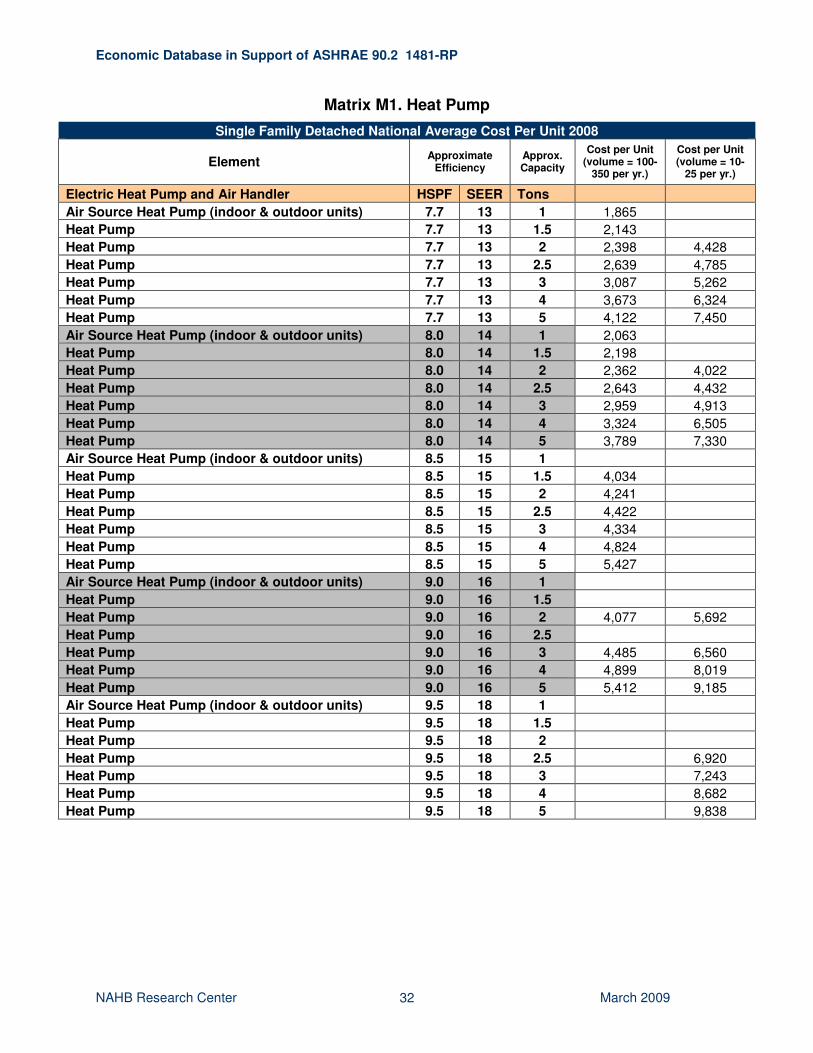
Worksheets denoted as K, L, M in the ASHRAE Cost Book and Matrices contain average cost estimates for HVAC equipment and performance upgrades. Builders reported these costs in many formats and were sometimes unable to isolate labor/controls/equipment/commissioning costs. Unlike the findings for other components in this study, results indicated a wide range of equipment costs and labor directly associated with the installation and/or commissioning of the equipment. The volume builders that participated in the study – located in Oklahoma and Maryland – reported similar and significantly lower costs for HVAC equipment than the other two builders, indicating that volume pricing is potentially a factor with mechanical equipment. This would explain why builders did not report similar trends in the incremental costs of increased efficiency; e.g., there was an approximate $1,000 dollar increase from 13 to 14 SEER in OH whereas that same cost to OK and MD (the high volume builders) was approximately $150. And, small builder HVAC cost estimates for similar equipment and efficiency were nearly two times that of the volume builder. Because of these observations, HVAC costs have been reported in two columns – national average for high annual volume builders and the national average for small builders (low volume), covered in Matrices K1, L1, and M1. Figures 5 through 8 graph the relationships between costs and equipment efficiency.
Economic Database in Support of ASHRAE 90.2 1481-RP
NAHB Research Center March 2009 28
Figure 5: Gas Furnace Cost Comparison
Figure 6: A/C Cost Comparison
Economic Database in Support of ASHRAE 90.2 1481-RP
NAHB Research Center March 2009 29
Figure 7: Heat Pump Cost Comparison - HSPF
Figure 8: Heat Pump Cost Comparison – SEER
Economic Database in Support of ASHRAE 90.2 1481-RP
NAHB Research Center March 2009 30
Matrix K1: Gas Furnaces
Single Family Detached National Average Cost Per Unit 2008
Element Efficiency Approx.
Input Capacity
Cost per Unit -
(volume = 100-350 per yr.)
Cost per Unit -
(volume = 10-25 per
yr.)
Gas Furnace
Upright, upflow 80 AFUE 40-50K BTU 697 1,795
Upright, upflow 80 AFUE 60-64K BTU 718 1,879
Upright, upflow 80 AFUE 78-80K BTU 735 2,122
Upright, upflow 80 AFUE 96-100K BTU 926 2,275
Horizontal, downflow 80 AFUE 40-50K BTU 788 2,140
Horizontal, downflow 80 AFUE 60-64K BTU 820 2,140
Horizontal, downflow 80 AFUE 78-80K BTU 844 2,188
Horizontal, downflow 80 AFUE 96-100K BTU 957 2,188
Upright, upflow 90 AFUE 40-50K BTU 1,876
Upright, upflow 90 AFUE 60-64K BTU 2,240
Upright, upflow 90 AFUE 78-80K BTU 2,811
Upright, upflow 90 AFUE 96-100K BTU 3,165
Horizontal, downflow 90 AFUE 40-50K BTU 3,372
Horizontal, downflow 90 AFUE 60-64K BTU 3,379
Horizontal, downflow 90 AFUE 78-80K BTU 3,448
Horizontal, downflow 90 AFUE 96-100K BTU 3,585
Upright, upflow 92 AFUE 40-50K BTU 1,474
Upright, upflow 92 AFUE 60-64K BTU 1,513
Upright, upflow 92 AFUE 78-80K BTU 1,566
Upright, upflow 92 AFUE 96-100K BTU
Horizontal, downflow 92 AFUE 40-50K BTU 1,368
Horizontal, downflow 92 AFUE 60-64K BTU 1,802
Horizontal, downflow 92 AFUE 78-80K BTU 1,923
Horizontal, downflow 92 AFUE 96-100K BTU
Upright, upflow 94 AFUE 40-50K BTU 2,400
Upright, upflow 94 AFUE 60-64K BTU 3,213
Upright, upflow 94 AFUE 78-80K BTU 2,497 4,607
Upright, upflow 94 AFUE 96-100K BTU 5,932
Horizontal, downflow 94 AFUE 40-50K BTU 2,400 5,281
Horizontal, downflow 94 AFUE 60-64K BTU 5,505
Horizontal, downflow 94 AFUE 78-80K BTU 2,497 5,739
Horizontal, downflow 94 AFUE 96-100K BTU 6,056
Upright, upflow 96 AFUE 40-50K BTU 2,445
Upright, upflow 96 AFUE 60-64K BTU 2,400
Upright, upflow 96 AFUE 78-80K BTU 2,461
Upright, upflow 96 AFUE 96-100K BTU 2,487
Horizontal, downflow 96 AFUE 40-50K BTU
Horizontal, downflow 96 AFUE 60-64K BTU 2,601
Horizontal, downflow 96 AFUE 78-80K BTU 2,638
Horizontal, downflow 96 AFUE 96-100K BTU 2,691
Economic Database in Support of ASHRAE 90.2 1481-RP
NAHB Research Center March 2009 31
Matrix L1: Air Conditioner
Single Family Detached National Average Cost Per Unit 2008
Element Approx. Capacity
Cost per Unit -
(volume = 100-350 per
yr.)
Cost per Unit - (volume = 10-
25 per yr.)
Electric Air Conditioner SEER Tons
Electric A/C 13 1 N/A N/A
Electric A/C 13 1.5 1,055
Electric A/C 13 2 1,560 2,922
Electric A/C 13 2.5 1,729 3,702
Electric A/C 13 3 1,995 3,200
Electric A/C 13 4 2,309 3,758
Electric A/C 13 5 2,607 4,112
Electric Air Conditioner 14 1 N/A N/A
Electric A/C 14 1.5 1,319
Electric A/C 14 2 1,723 4,872
Electric A/C 14 2.5 1,948 4,146
Electric A/C 14 3 2,182 5,615
Electric A/C 14 4 2,372
Electric A/C 14 5 2,765
Electric Air Conditioner 15 1 N/A
Electric A/C 15 1.5 2,102
Electric A/C 15 2 2,215
Electric A/C 15 2.5 2,830
Electric A/C 15 3 2,697
Electric A/C 15 4 2,839
Electric A/C 15 5 2,839
Electric A/C 16 1 N/A
Electric A/C 16 1.5
Electric A/C 16 2 2,490
Electric A/C 16 2.5
Electric A/C 16 3 2,546
Electric A/C 16 4 3,273
Electric A/C 16 5 3,784
Electric Air Conditioner 18 1
Electric A/C 18 1.5
Electric A/C 18 2
Electric A/C 18 2.5
Electric A/C 18 3
Electric A/C 18 4
Electric A/C 18 5
Economic Database in Support of ASHRAE 90.2 1481-RP
NAHB Research Center March 2009 32
Matrix M1. Heat Pump
Single Family Detached National Average Cost Per Unit 2008
Element Approximate
Efficiency Approx. Capacity
Cost per Unit (volume = 100-
350 per yr.)
Cost per Unit (volume = 10-
25 per yr.)
Electric Heat Pump and Air Handler HSPF SEER Tons
Air Source Heat Pump (indoor & outdoor units) 7.7 13 1 1,865
Heat Pump 7.7 13 1.5 2,143
Heat Pump 7.7 13 2 2,398 4,428
Heat Pump 7.7 13 2.5 2,639 4,785
Heat Pump 7.7 13 3 3,087 5,262
Heat Pump 7.7 13 4 3,673 6,324
Heat Pump 7.7 13 5 4,122 7,450
Air Source Heat Pump (indoor & outdoor units) 8.0 14 1 2,063
Heat Pump 8.0 14 1.5 2,198
Heat Pump 8.0 14 2 2,362 4,022
Heat Pump 8.0 14 2.5 2,643 4,432
Heat Pump 8.0 14 3 2,959 4,913
Heat Pump 8.0 14 4 3,324 6,505
Heat Pump 8.0 14 5 3,789 7,330
Air Source Heat Pump (indoor & outdoor units) 8.5 15 1
Heat Pump 8.5 15 1.5 4,034
Heat Pump 8.5 15 2 4,241
Heat Pump 8.5 15 2.5 4,422
Heat Pump 8.5 15 3 4,334
Heat Pump 8.5 15 4 4,824
Heat Pump 8.5 15 5 5,427
Air Source Heat Pump (indoor & outdoor units) 9.0 16 1
Heat Pump 9.0 16 1.5
Heat Pump 9.0 16 2 4,077 5,692
Heat Pump 9.0 16 2.5
Heat Pump 9.0 16 3 4,485 6,560
Heat Pump 9.0 16 4 4,899 8,019
Heat Pump 9.0 16 5 5,412 9,185
Air Source Heat Pump (indoor & outdoor units) 9.5 18 1
Heat Pump 9.5 18 1.5
Heat Pump 9.5 18 2
Heat Pump 9.5 18 2.5 6,920
Heat Pump 9.5 18 3 7,243
Heat Pump 9.5 18 4 8,682
Heat Pump 9.5 18 5 9,838
Economic Database in Support of ASHRAE 90.2 1481-RP
NAHB Research Center March 2009 33
SECTION 2: ATTACHED AND MULTIFAMILY CONSTRUCTION COSTS Cost-estimate adjustment factors to SFD costs are provided in R. S. Means Square Foot Costs 2008.12 These adjustment factors were informally reviewed with the National Multi Housing Council, and consensus was reached to use a commonly-applied factor of .94, which represents the high end of those compiled by R.S. Means for townhouses of average construction quality. The same factor has been deemed representative for low-rise multifamily construction. This factor has been applied to the national average costs aggregated in the matrices in Section 1 of this report to produce the Multifamily Unit (MFU) estimated cost matrices that follow. An exception to this standard application will be noted for Matrix Multi-B1 through Matrix Multi-B-6, wood and steel exterior walls. The assemblies in those matrices include foam sheathing over OSB wall sheathing, where noted.
12 Reed Construction Data, Inc. p. 32, inner unit .88 and end unit .94.

Economic Database in Support of ASHRAE 90.2 1481-RP
NAHB Research Center March 2009 34
Matrix Multi-A1: Ceiling Assembly
Multifamily National Average Cost Per Square Foot 2008
Factor applied to SFD 0.94 Wood truss at 24" oc. Conventionally
Framed
Structural Roof/ Ceiling Type
6/12 Flat Clg 2x4 & 2x4 - Std. Heel 4-1/8"
6/12 2x4 over 2x4 Energy Heel -Flat Clg
6/12 over 3/12 Cathedral Ceiling
6/12 over 3/12 Cathedral Energy Heel - 11"
2x12 SYP rafters at 24" oc. (cathedral)
R-Value of Insulation
Type of Insulation Unit of Measure
14" soffit
13 Fiberglass batt
19 Fiberglass batt sq. ft. 4.33 4.77
25 Fiberglass batt sq. ft. 4.72 5.16
30C Fiberglass batt - 8 1/2" sq. ft. 5.32 5.76 5.37 5.72 4.66
30 Fiberglass batt - 10 1/2" sq. ft. 4.77 5.21 4.84 5.19 4.13
38C Fiberglass batt- 10 1/2" sq. ft. 5.80 6.24 5.81 6.16 5.10
38 Fiberglass batt-13" sq. ft. 4.99 5.49 5.00 5.35
49 Fiberglass batt sq. ft. 5.64 6.14 5.78 6.13
13 Blown Cellulose
19 Blown Cellulose sq. ft. 4.14 4.58 5.13 5.48 4.42
25 Blown Cellulose sq. ft. 4.29 4.73 5.24 5.60 4.54
30 Blown Cellulose sq. ft. 4.39 4.83 5.40 5.75 4.69
38 Blown Cellulose sq. ft. 4.56 5.07 5.67 6.02
42 Blown Cellulose sq. ft. 4.77 5.27 5.80 6.15
49 Blown Cellulose sq. ft. 5.00 5.50 6.23 6.58
60 Blown Cellulose sq. ft. 5.28 5.79 6.42 6.77 Assembly consists of the national average cost estimates for: A1. Insulation Flat, or A2. Insulation Cathedral A3. Roof System (with 11" heel; all applications). Note that ceiling R-values less than 30 in any climate zone may not meet prescriptive code minimums.
Economic Database in Support of ASHRAE 90.2 1481-RP
NAHB Research Center March 2009 35
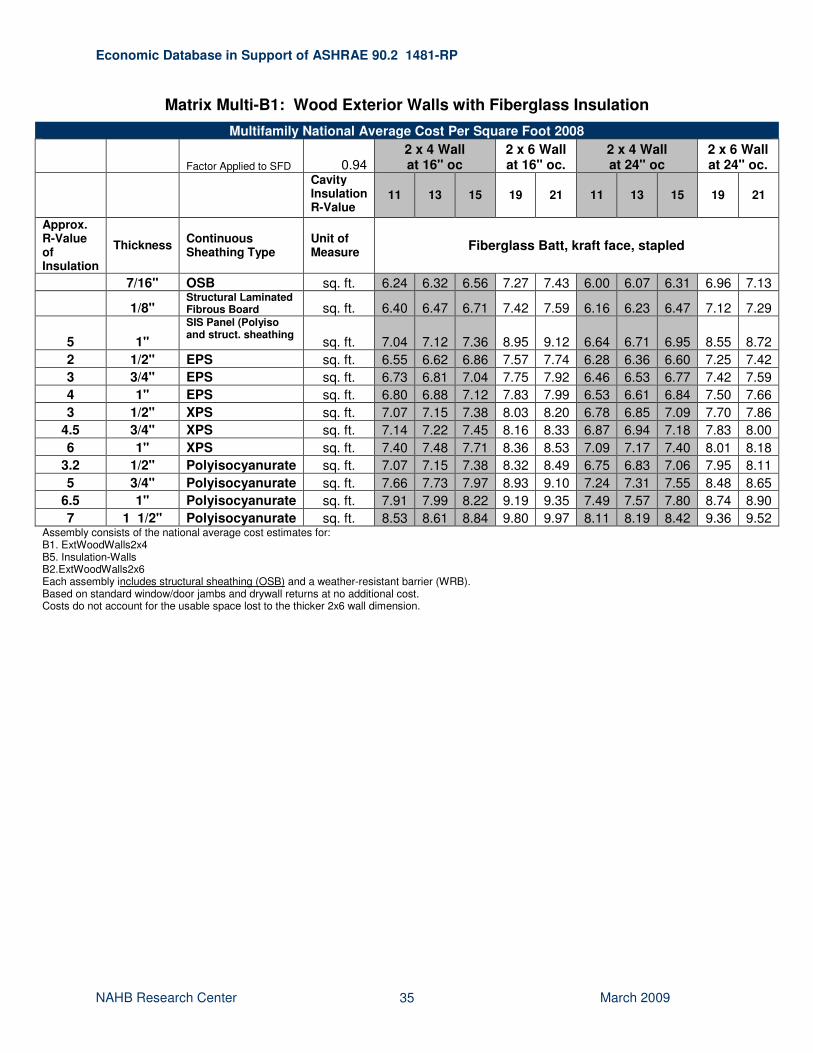
Matrix Multi-B1: Wood Exterior Walls with Fiberglass Insulation
Multifamily National Average Cost Per Square Foot 2008
Factor Applied to SFD 0.94 2 x 4 Wall at 16" oc
2 x 6 Wall at 16" oc.
2 x 4 Wall at 24" oc
2 x 6 Wall at 24" oc.
Cavity Insulation R-Value
11 13 15 19 21 11 13 15 19 21
Approx. R-Value of Insulation
Thickness Continuous Sheathing Type
Unit of Measure
Fiberglass Batt, kraft face, stapled
7/16" OSB sq. ft. 6.24 6.32 6.56 7.27 7.43 6.00 6.07 6.31 6.96 7.13
1/8" Structural Laminated Fibrous Board sq. ft. 6.40 6.47 6.71 7.42 7.59 6.16 6.23 6.47 7.12 7.29
5 1"
SIS Panel (Polyiso and struct. sheathing
sq. ft. 7.04 7.12 7.36 8.95 9.12 6.64 6.71 6.95 8.55 8.72
2 1/2" EPS sq. ft. 6.55 6.62 6.86 7.57 7.74 6.28 6.36 6.60 7.25 7.42
3 3/4" EPS sq. ft. 6.73 6.81 7.04 7.75 7.92 6.46 6.53 6.77 7.42 7.59
4 1" EPS sq. ft. 6.80 6.88 7.12 7.83 7.99 6.53 6.61 6.84 7.50 7.66
3 1/2" XPS sq. ft. 7.07 7.15 7.38 8.03 8.20 6.78 6.85 7.09 7.70 7.86
4.5 3/4" XPS sq. ft. 7.14 7.22 7.45 8.16 8.33 6.87 6.94 7.18 7.83 8.00
6 1" XPS sq. ft. 7.40 7.48 7.71 8.36 8.53 7.09 7.17 7.40 8.01 8.18
3.2 1/2" Polyisocyanurate sq. ft. 7.07 7.15 7.38 8.32 8.49 6.75 6.83 7.06 7.95 8.11
5 3/4" Polyisocyanurate sq. ft. 7.66 7.73 7.97 8.93 9.10 7.24 7.31 7.55 8.48 8.65
6.5 1" Polyisocyanurate sq. ft. 7.91 7.99 8.22 9.19 9.35 7.49 7.57 7.80 8.74 8.90
7 1 1/2" Polyisocyanurate sq. ft. 8.53 8.61 8.84 9.80 9.97 8.11 8.19 8.42 9.36 9.52 Assembly consists of the national average cost estimates for: B1. ExtWoodWalls2x4 B5. Insulation-Walls B2.ExtWoodWalls2x6 Each assembly includes structural sheathing (OSB) and a weather-resistant barrier (WRB). Based on standard window/door jambs and drywall returns at no additional cost. Costs do not account for the usable space lost to the thicker 2x6 wall dimension.
Economic Database in Support of ASHRAE 90.2 1481-RP
NAHB Research Center March 2009 36
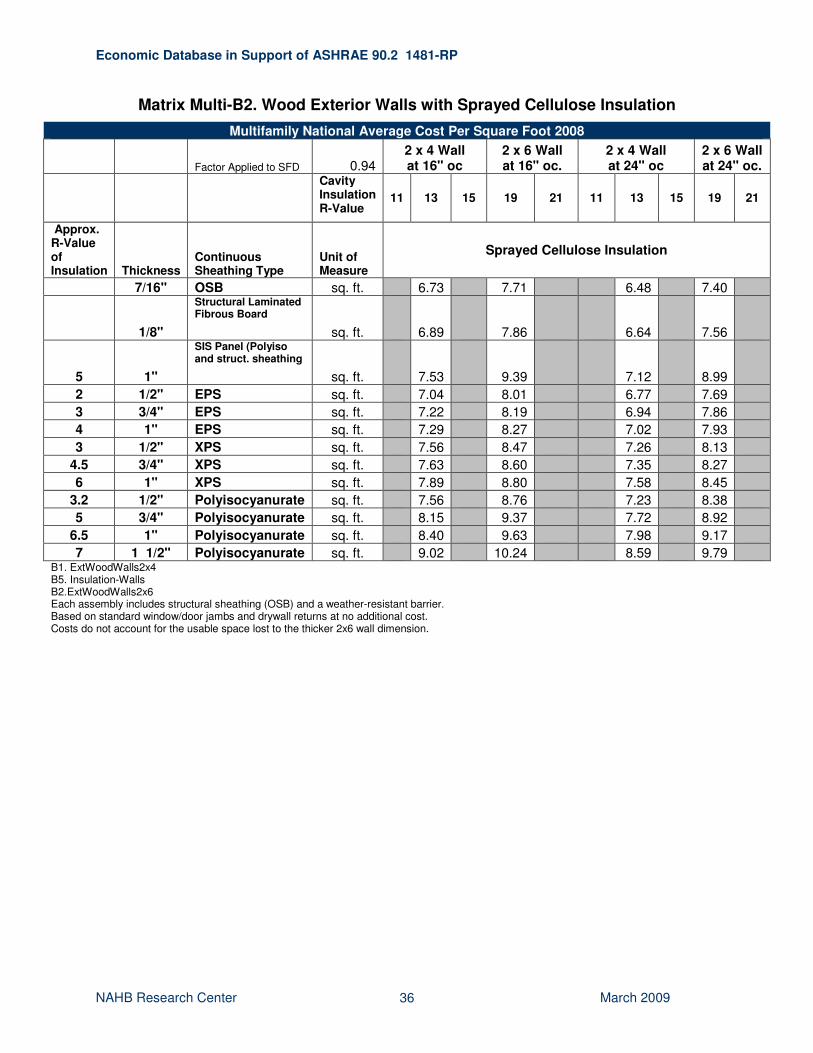
Matrix Multi-B2. Wood Exterior Walls with Sprayed Cellulose Insulation
Multifamily National Average Cost Per Square Foot 2008
Factor Applied to SFD 0.94 2 x 4 Wall at 16" oc
2 x 6 Wall at 16" oc.
2 x 4 Wall at 24" oc
2 x 6 Wall at 24" oc.
Cavity Insulation R-Value
11 13 15 19 21 11 13 15 19 21
Approx. R-Value of Insulation Thickness
Continuous Sheathing Type
Unit of Measure
Sprayed Cellulose Insulation
7/16" OSB sq. ft. 6.73 7.71 6.48 7.40
1/8"
Structural Laminated Fibrous Board
sq. ft. 6.89 7.86 6.64 7.56
5 1"
SIS Panel (Polyiso and struct. sheathing
sq. ft. 7.53 9.39 7.12 8.99
2 1/2" EPS sq. ft. 7.04 8.01 6.77 7.69
3 3/4" EPS sq. ft. 7.22 8.19 6.94 7.86
4 1" EPS sq. ft. 7.29 8.27 7.02 7.93
3 1/2" XPS sq. ft. 7.56 8.47 7.26 8.13
4.5 3/4" XPS sq. ft. 7.63 8.60 7.35 8.27
6 1" XPS sq. ft. 7.89 8.80 7.58 8.45
3.2 1/2" Polyisocyanurate sq. ft. 7.56 8.76 7.23 8.38
5 3/4" Polyisocyanurate sq. ft. 8.15 9.37 7.72 8.92
6.5 1" Polyisocyanurate sq. ft. 8.40 9.63 7.98 9.17
7 1 1/2" Polyisocyanurate sq. ft. 9.02 10.24 8.59 9.79 B1. ExtWoodWalls2x4 B5. Insulation-Walls B2.ExtWoodWalls2x6 Each assembly includes structural sheathing (OSB) and a weather-resistant barrier. Based on standard window/door jambs and drywall returns at no additional cost. Costs do not account for the usable space lost to the thicker 2x6 wall dimension.
Economic Database in Support of ASHRAE 90.2 1481-RP
NAHB Research Center March 2009 37
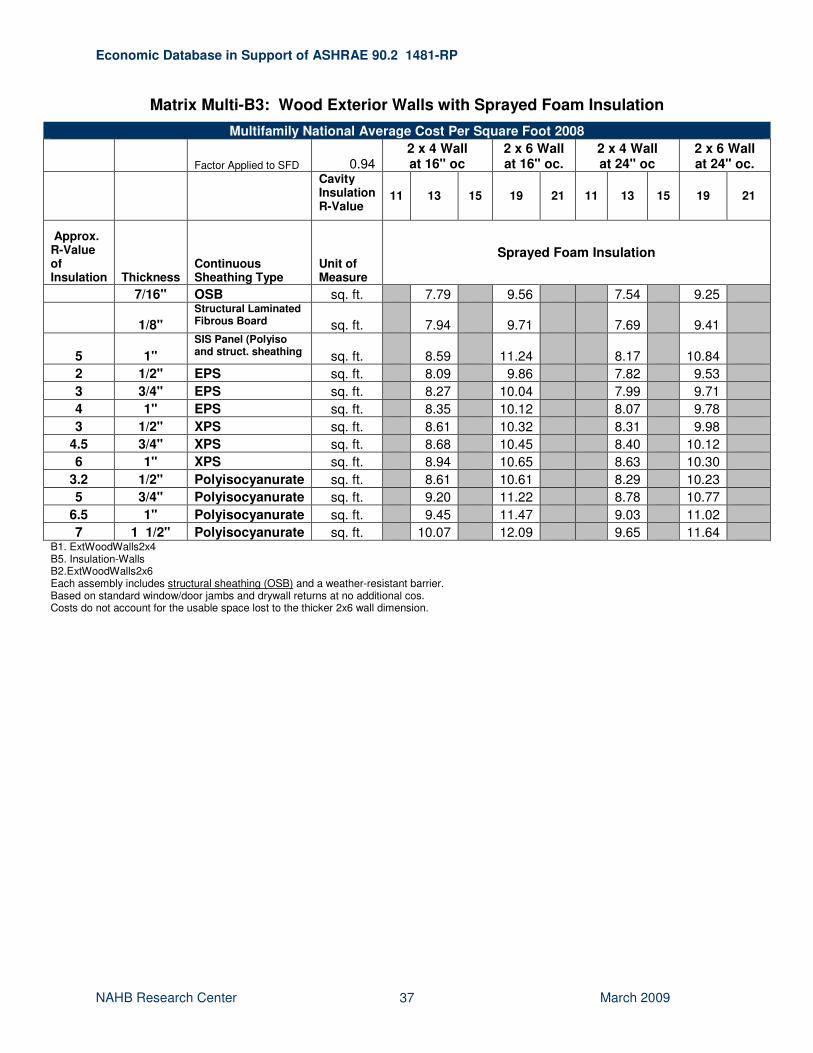
Matrix Multi-B3: Wood Exterior Walls with Sprayed Foam Insulation
Multifamily National Average Cost Per Square Foot 2008
Factor Applied to SFD 0.94 2 x 4 Wall at 16" oc
2 x 6 Wall at 16" oc.
2 x 4 Wall at 24" oc
2 x 6 Wall at 24" oc.
Cavity Insulation R-Value
11 13 15 19 21 11 13 15 19 21
Approx. R-Value of Insulation Thickness
Continuous Sheathing Type
Unit of Measure
Sprayed Foam Insulation
7/16" OSB sq. ft. 7.79 9.56 7.54 9.25
1/8"
Structural Laminated Fibrous Board sq. ft. 7.94 9.71 7.69 9.41
5 1"
SIS Panel (Polyiso and struct. sheathing sq. ft. 8.59 11.24 8.17 10.84
2 1/2" EPS sq. ft. 8.09 9.86 7.82 9.53
3 3/4" EPS sq. ft. 8.27 10.04 7.99 9.71
4 1" EPS sq. ft. 8.35 10.12 8.07 9.78
3 1/2" XPS sq. ft. 8.61 10.32 8.31 9.98
4.5 3/4" XPS sq. ft. 8.68 10.45 8.40 10.12
6 1" XPS sq. ft. 8.94 10.65 8.63 10.30
3.2 1/2" Polyisocyanurate sq. ft. 8.61 10.61 8.29 10.23
5 3/4" Polyisocyanurate sq. ft. 9.20 11.22 8.78 10.77
6.5 1" Polyisocyanurate sq. ft. 9.45 11.47 9.03 11.02
7 1 1/2" Polyisocyanurate sq. ft. 10.07 12.09 9.65 11.64 B1. ExtWoodWalls2x4 B5. Insulation-Walls B2.ExtWoodWalls2x6 Each assembly includes structural sheathing (OSB) and a weather-resistant barrier. Based on standard window/door jambs and drywall returns at no additional cos. Costs do not account for the usable space lost to the thicker 2x6 wall dimension.
Economic Database in Support of ASHRAE 90.2 1481-RP
NAHB Research Center March 2009 38
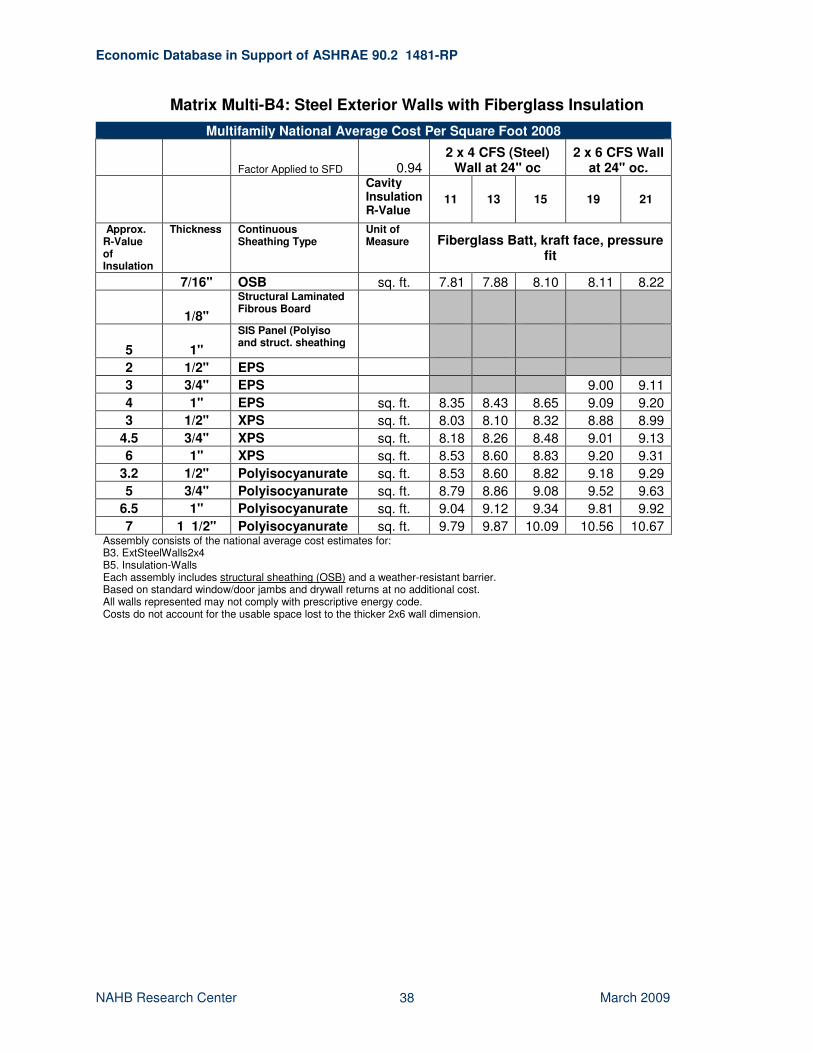
Matrix Multi-B4: Steel Exterior Walls with Fiberglass Insulation
Multifamily National Average Cost Per Square Foot 2008
Factor Applied to SFD 0.94 2 x 4 CFS (Steel)
Wall at 24" oc 2 x 6 CFS Wall
at 24" oc.
Cavity Insulation R-Value
11 13 15 19 21
Approx. R-Value of Insulation
Thickness Continuous Sheathing Type
Unit of Measure Fiberglass Batt, kraft face, pressure
fit
7/16" OSB sq. ft. 7.81 7.88 8.10 8.11 8.22
1/8"
Structural Laminated Fibrous Board
5 1"
SIS Panel (Polyiso and struct. sheathing
2 1/2" EPS
3 3/4" EPS 9.00 9.11
4 1" EPS sq. ft. 8.35 8.43 8.65 9.09 9.20
3 1/2" XPS sq. ft. 8.03 8.10 8.32 8.88 8.99
4.5 3/4" XPS sq. ft. 8.18 8.26 8.48 9.01 9.13
6 1" XPS sq. ft. 8.53 8.60 8.83 9.20 9.31
3.2 1/2" Polyisocyanurate sq. ft. 8.53 8.60 8.82 9.18 9.29
5 3/4" Polyisocyanurate sq. ft. 8.79 8.86 9.08 9.52 9.63
6.5 1" Polyisocyanurate sq. ft. 9.04 9.12 9.34 9.81 9.92
7 1 1/2" Polyisocyanurate sq. ft. 9.79 9.87 10.09 10.56 10.67 Assembly consists of the national average cost estimates for: B3. ExtSteelWalls2x4 B5. Insulation-Walls Each assembly includes structural sheathing (OSB) and a weather-resistant barrier. Based on standard window/door jambs and drywall returns at no additional cost. All walls represented may not comply with prescriptive energy code. Costs do not account for the usable space lost to the thicker 2x6 wall dimension.
Economic Database in Support of ASHRAE 90.2 1481-RP
NAHB Research Center March 2009 39
Matrix Multi-B5. Steel Exterior Walls with Sprayed Cellulose Insulation
Multifamily National Average Cost Per Square Foot 2008
Factor Applied to SFD 0.94 2 x 4 CFS (Steel)
Wall at 24" oc 2 x 6 CFS
Wall at 24" oc.
Cavity Insulation R-Value
11 13 15 19 21
Approx. R-Value of Insulation Thickness
Continuous Sheathing Type
Unit of Measure
Sprayed Cellulose Insulation
7/16" OSB sq. ft. 8.20 8.45
1/8"
Structural Laminated Fibrous Board
5 1"
SIS Panel (Polyiso and struct. sheathing
sq. ft.
2 1/2" EPS sq. ft.
3 3/4" EPS sq. ft. 8.66 9.34
4 1" EPS sq. ft. 8.74 9.43
3 1/2" XPS sq. ft. 8.42 9.22
4.5 3/4" XPS sq. ft. 8.57 9.35
6 1" XPS sq. ft. 8.92 9.53
3.2 1/2" Polyisocyanurate sq. ft. 8.92 9.52
5 3/4" Polyisocyanurate sq. ft. 9.18 9.86
6.5 1" Polyisocyanurate sq. ft. 9.43 10.15
7 1 1/2" Polyisocyanurate sq. ft. 10.18 10.90 Assembly consists of the national average cost estimates for: B3. ExtSteelWalls2x4 B5. Insulation-Walls Each assembly includes structural sheathing (OSB) and a weather-resistant barrier. Based on standard window/door jambs and drywall returns at no additional cost. All walls represented may not comply with prescriptive energy code. Costs do not account for the usable space lost to the thicker 2x6 wall dimension.
Economic Database in Support of ASHRAE 90.2 1481-RP
NAHB Research Center March 2009 40
Matrix Multi-B6. Steel Exterior Walls with Sprayed Foam Insulation
Multifamily National Average Cost Per Square Foot 2008
Factor Applied to SFD 0.94 2 x 4 CFS (Steel)
Wall at 24" oc
2 x 6 CFS Wall at 24"
oc.
Cavity Insulation R-Value
11 13 15 19 21
Approx. R-Value of Insulation Thickness
Continuous Sheathing Type
Unit of Measure
Sprayed Foam Insulation
7/16" OSB sq. ft. 9.25 10.30
1/8"
Structural Laminated Fibrous Board
5 1"
SIS Panel (Polyiso and struct. sheathing
2 1/2" EPS
3 3/4" EPS sq. ft. 9.71 11.19
4 1" EPS sq. ft. 9.80 11.28
3 1/2" XPS sq. ft. 9.47 11.07
4.5 3/4" XPS sq. ft. 9.63 11.20
6 1" XPS sq. ft. 9.98 11.38
3.2 1/2" Polyisocyanurate sq. ft. 9.97 11.36
5 3/4" Polyisocyanurate sq. ft. 10.23 11.71
6.5 1" Polyisocyanurate sq. ft. 10.49 12.00
7 1 1/2" Polyisocyanurate sq. ft. 11.24 12.75 Assembly consists of the national average cost estimates for: B3. ExtSteelWalls2x4 B5. Insulation-Walls Each assembly includes structural sheathing (OSB) and a weather-resistant barrier. Based on standard window/door jambs and drywall returns at no additional cost. All walls represented may not comply with prescriptive energy code. Costs do not account for the usable space lost to the thicker 2x6 wall dimension.
Economic Database in Support of ASHRAE 90.2 1481-RP
NAHB Research Center March 2009 41
Matrix Multi-C1: Wood Framed Floor with Fiberglass Batt Insulation Multifamily National Average Cost Per Square Foot 2008
Factor Applied to SFD 0.94 Joists at 16" oc Joists at 24" oc
2 x 8 Joist
2 x 10 or 9 1/4" I-J
2 x 12 or 11 7/8 I-J
14" or 16" I-Joist 2 x 8 2 x 10 2 x 12
14" or 16" I-Joist
Cavity Insulation R-Value
Thickness (inches)
Unit of Measure Fiberglass Batt, Kraft Face, Stapled
13 3 1/2 sq. ft 3.28 3.50 4.19 4.49 3.33 3.47 4.32 5.15
19 5 1/2 sq. ft 3.37 3.58 4.27 4.71 3.47 3.59 4.41 5.25
25 8 sq. ft 3.59 3.84 4.51 4.89 3.61 3.78 4.64 5.51
30 10 sq. ft 4.04 4.73 5.23 4.00 4.86 5.72
30C* 8.25 sq. ft 4.39 4.79 5.42 4.47 5.32 6.05
38 12 sq. ft 5.28 5.91
38C* 10.5 sq. ft 5.20 5.83 5.72 6.45
49 15 sq. ft 6.73 6.57 Assembly consists of the national average cost estimates for: C. Insulation, joists and labor - floor assembly. Does not include subflooring.
Matrix Multi-D1. Foundation and Slab Insulation - Exterior and Core Fill Applications
Multifamily National Average Cost Per Square Foot 2008
Factor Applied to SFD 0.94
8"or 12" Subgrade Masonry Wall - Exterior or Core Fill Insulation
R-Value of Insulation Thickness
Unit of Measure
Perlite Core Fill
1
Spray Foam Core Fill
1
XPS Polyisocyanurate
10 5.125 sq. ft. 4.25
15 7.625 sq. ft. 5.58
18 5.125 sq. ft. 4.55
27 7.625 sq. ft. 6.23
2.5 0.5 sq. ft. 2.47
5.0 1 sq. ft. 2.84
10.0 1.5" sq. ft. 3.61
3.5 0.5 sq. ft. 2.73
7.0 1 sq. ft. 3.08
10.5 1.50 sq. ft. 3.71
1. Perlite and Spray foam thickness and R-Value only applies to core, not overall wall average Assembly consists of the national average cost estimates for: D. Foundation Ins Cost of foundation not included. Damproof consists of one coat of sprayed bituminous coating on concrete/block surface. Exterior bituminous damproofing is excluded when rigid foam is applied. Exterior rigid foam applications include taping seams.

Economic Database in Support of ASHRAE 90.2 1481-RP
NAHB Research Center March 2009 42
Matrix Multi-D2: Foundation Insulation - Interior Applications
Multifamily National Average Cost Per Square Foot 2008
Factor Applied to SFD 0.94
8"or 12" Subgrade Masonry Wall - Interior Insulation
R-Value of Insulation Thickness
Unit of Measure
Foil-faced FG
Insulation, draped
2x4 at 24" kraft faced
FG & gypsum,
taped
2x6 at 24" kraft faced FG & 1/2" gypsum, taped
Expanded Polystyrene & 1/2" gypsum,
taped
11 3 sq. ft. 1.76
13 3.5 sq. ft. 1.95
13.0 3.5 sq. ft. 3.44
19.0 5.5 sq. ft. 4.32
4.0 1 sq. ft. 2.34
8.0 2 sq. ft. 3.72 Assembly consists of the national average cost estimates for: D. Foundation Ins Cost of foundation NIC. Damproof consists of one coat of sprayed bituminous coating on concrete/block surface. Exterior bituminous damproofing is included with all of the costs of the interior insulation applications. Foil-faced fiberglass was costed where it met the local interpretation of the building code.
Matrix Multi-D3: Foundation Insulation Slab - Exterior Applications
Multifamily National Average Cost Per Square Foot 2008
Factor Applied to SFD 0.94
Slab - Exterior or Core Fill Insulation
R-Value of Insulation Thickness
Unit of Measure
Perlite Core Fill
1
Spray Foam Core Fill
1
XPS Polyisocyanurate
Sub-grade Above grade
Sub-grade
Above grade
10 5.125 sq. ft. 4.25
15 7.625 sq. ft. 5.58
18 5.125 sq. ft. 4.55
27 7.625 sq. ft. 6.23
2.5 0.5 sq. ft. 1.56 8.87
5.0 1 sq. ft. 1.93 9.24
10.0 2 sq. ft. 2.70 10.00
3.5 0.5 sq. ft. 1.82 9.13
7.0 1 sq. ft. 2.17 9.48
10.5 1.50 sq. ft. 2.79 10.10
1. Perlite and Spray foam thickness and R-Value only applies to core, not overall wall average Assembly consists of the national average cost estimates for: D. Foundation Ins Cost of foundation not included. Damproof consists of one coat of sprayed bituminous coating on concrete/block surface. Exterior bituminous damproofing is excluded when rigid foam is applied. Exterior rigid foam applications include taping seams.

Economic Database in Support of ASHRAE 90.2 1481-RP
NAHB Research Center March 2009 43
Figure 9. Window Cost Vs. U-Value
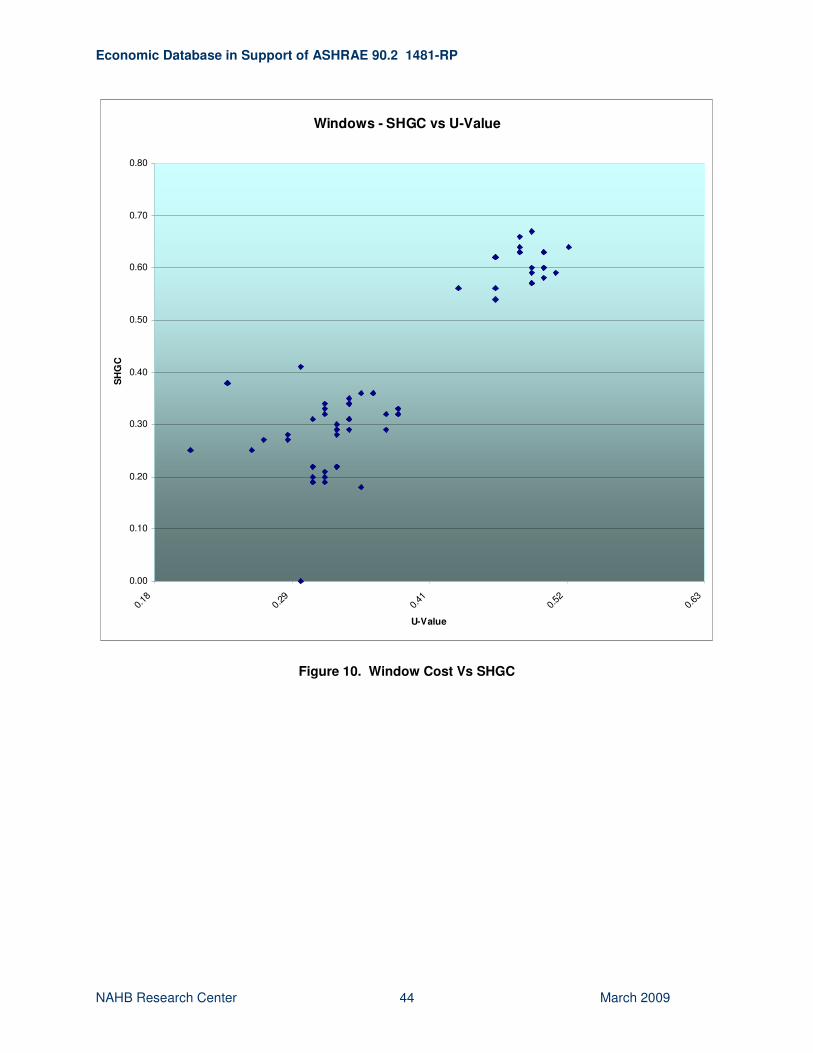
Economic Database in Support of ASHRAE 90.2 1481-RP
NAHB Research Center March 2009 44
Windows - SHGC vs U-Value
0.00
0.10
0.20
0.30
0.40
0.50
0.60
0.70
0.80
0.18
0.29
0.41
0.52
0.63
U-Value
SH
GC
Figure 10. Window Cost Vs SHGC
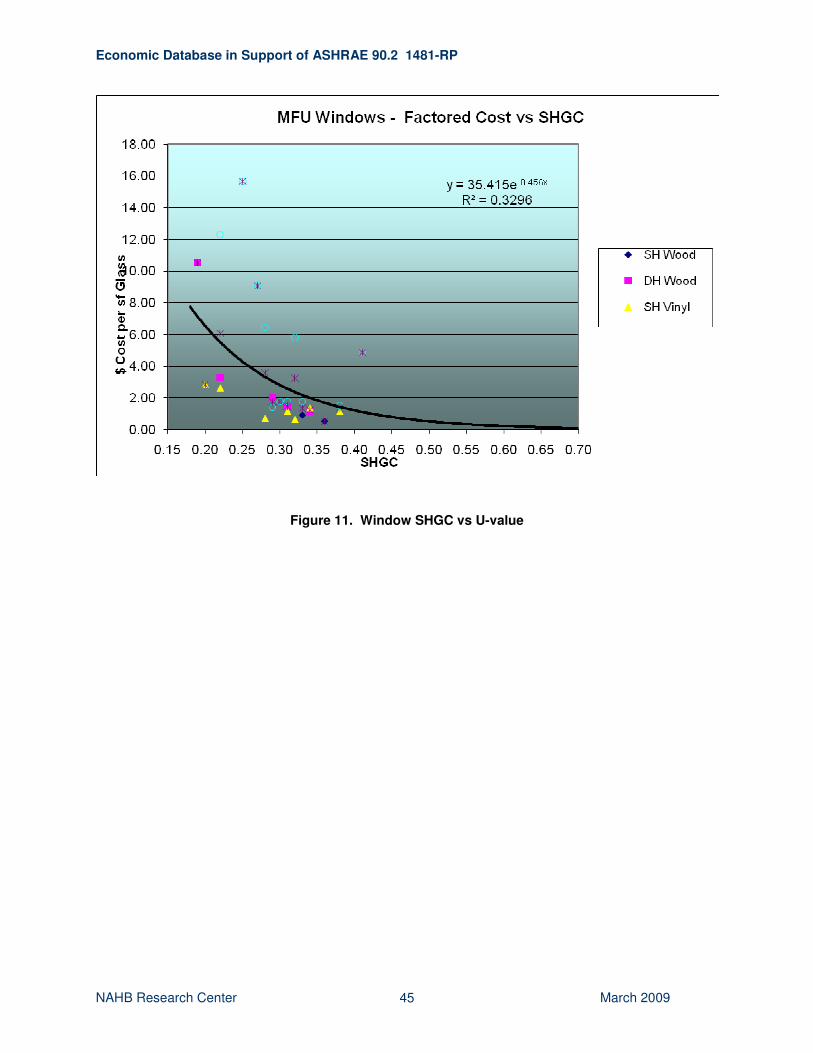
Economic Database in Support of ASHRAE 90.2 1481-RP
NAHB Research Center March 2009 45
Figure 11. Window SHGC vs U-value

Economic Database in Support of ASHRAE 90.2 1481-RP
NAHB Research Center March 2009 46
G. Sliding Glass Doors
Sliding Glass Doors - Cost vs U-Value
y = 457.8e-14.875x
R2 = 0.7987
0
2
4
6
8
10
12
0.25 0.30 0.35 0.40 0.45 0.50 0.55
U-Value
$ C
os
t p
er
SF
Gla
ss
single side active alum
single side active W/C
single side active Vinyl
double side active alum
double side active W/C
double side active Vinyl
single side active W/C
Figure 12. Sliding Glass Doors – Cost vs. SHGC
Matrix Multi-H1: Entry Doors
Multifamily National Average Cost Per Square Foot 2008
Factor Applied to SFD 0.94
Door Type Grade No Glass >50% Glazing <50% Glazing
U-
Value Cost sq ft U-
Value Cost sq
ft U-
Value Cost sq
ft
Wood Slab & Frame Standard 0.48 $ 23.63 0.48 $ 30.48 0.47 $ 29.87
Foam Insulated Metal Standard 0.16 $ 12.30 0.32 $ 20.05 0.37 $ 18.04
Fiberglass Insulated Standard 0.15 $ 18.30 0.31 $ 28.34 0.35 $ 25.07
Wood Slab & Frame Premium 0.48 $ 33.01 0.46 $ 33.19 0.46 $ 34.10
Foam Insulated Metal Premium 0.17 $ 16.82 0.29 $ 25.88 0.37 $ 23.00
Fiberglass Insulated Premium 0.14 $ 30.09 0.28 $ 34.80 0.36 $ 36.91
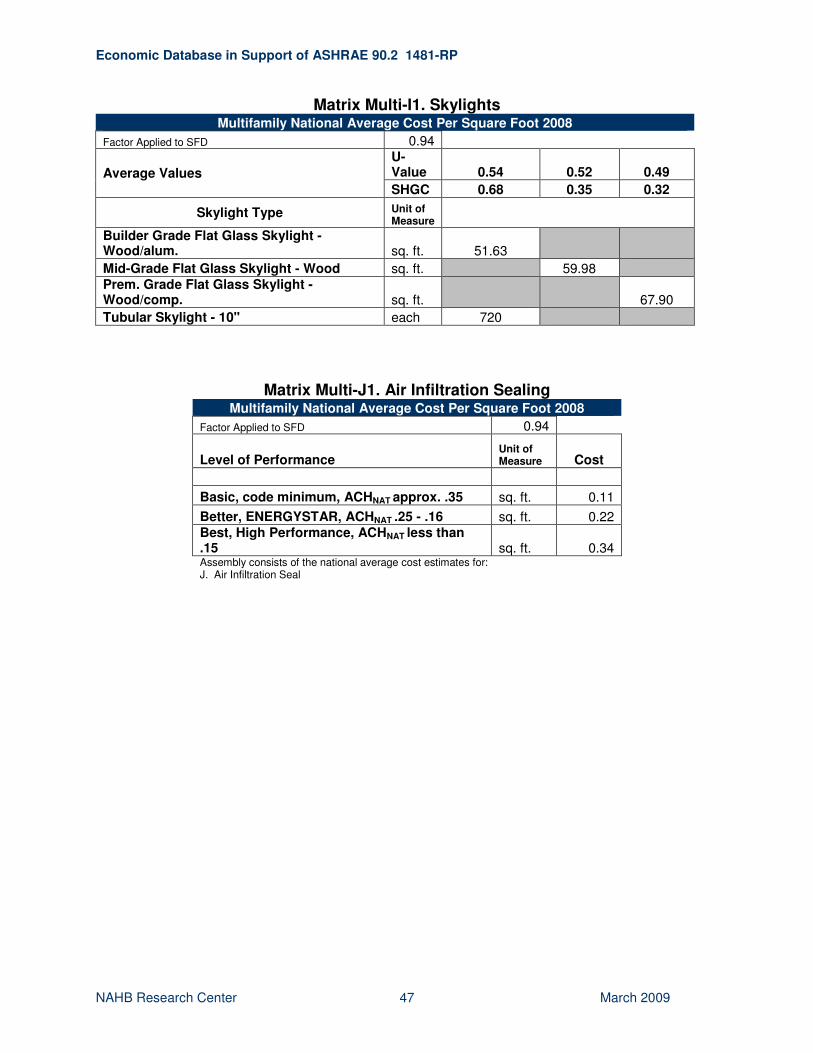
Economic Database in Support of ASHRAE 90.2 1481-RP
NAHB Research Center March 2009 47
Matrix Multi-I1. Skylights Multifamily National Average Cost Per Square Foot 2008
Factor Applied to SFD 0.94
Average Values
U-Value 0.54 0.52 0.49
SHGC 0.68 0.35 0.32
Skylight Type Unit of Measure
Builder Grade Flat Glass Skylight - Wood/alum. sq. ft. 51.63
Mid-Grade Flat Glass Skylight - Wood sq. ft. 59.98 Prem. Grade Flat Glass Skylight - Wood/comp. sq. ft. 67.90
Tubular Skylight - 10" each 720
Matrix Multi-J1. Air Infiltration Sealing Multifamily National Average Cost Per Square Foot 2008
Factor Applied to SFD 0.94
Level of Performance Unit of Measure Cost
Basic, code minimum, ACHNAT approx. .35 sq. ft. 0.11
Better, ENERGYSTAR, ACHNAT .25 - .16 sq. ft. 0.22 Best, High Performance, ACHNAT less than .15 sq. ft. 0.34 Assembly consists of the national average cost estimates for: J. Air Infiltration Seal

Economic Database in Support of ASHRAE 90.2 1481-RP
NAHB Research Center March 2009 48
Matrix Multi-K1. Gas Furnace
Multifamily National Average Cost Per Square Foot 2008
Factor Applied to SFD 0.94
Element Efficiency Input Capacity Cost per Unit
(volume = 100-350 per yr.)
Cost per Unit
(volume = 10-25 per
yr.)
Gas Furnace
Upright, upflow 80 AFUE 40-50K BTU 655 1,687
Upright, upflow 80 AFUE 60-64K BTU 675 1,766
Upright, upflow 80 AFUE 78-80K BTU 691 1,995
Upright, upflow 80 AFUE 96-100K BTU 871 2,138
Horizontal, downflow 80 AFUE 40-50K BTU 740 2,012
Horizontal, downflow 80 AFUE 60-64K BTU 771 2,012
Horizontal, downflow 80 AFUE 78-80K BTU 794 2,057
Horizontal, downflow 80 AFUE 96-100K BTU 900 2,057
Upright, upflow 90 AFUE 40-50K BTU 1,763
Upright, upflow 90 AFUE 60-64K BTU 2,106
Upright, upflow 90 AFUE 78-80K BTU 2,643
Upright, upflow 90 AFUE 96-100K BTU 2,976
Horizontal, downflow 90 AFUE 40-50K BTU 3,170
Horizontal, downflow 90 AFUE 60-64K BTU 3,176
Horizontal, downflow 90 AFUE 78-80K BTU 3,241
Horizontal, downflow 90 AFUE 96-100K BTU 3,370
Upright, upflow 92 AFUE 40-50K BTU 1,386
Upright, upflow 92 AFUE 60-64K BTU 1,422
Upright, upflow 92 AFUE 78-80K BTU 1,472
Upright, upflow 92 AFUE 96-100K BTU
Horizontal, downflow 92 AFUE 40-50K BTU 1,286
Horizontal, downflow 92 AFUE 60-64K BTU 1,694
Horizontal, downflow 92 AFUE 78-80K BTU 1,808
Horizontal, downflow 92 AFUE 96-100K BTU
Upright, upflow 94 AFUE 40-50K BTU 2,256
Upright, upflow 94 AFUE 60-64K BTU 3,021
Upright, upflow 94 AFUE 78-80K BTU 2,347 4,330
Upright, upflow 94 AFUE 96-100K BTU 5,576
Horizontal, downflow 94 AFUE 40-50K BTU 2,256 4,964
Horizontal, downflow 94 AFUE 60-64K BTU 5,175
Horizontal, downflow 94 AFUE 78-80K BTU 2,347 5,395
Horizontal, downflow 94 AFUE 96-100K BTU 5,693
Upright, upflow 96 AFUE 40-50K BTU 2,298
Upright, upflow 96 AFUE 60-64K BTU 2,256
Upright, upflow 96 AFUE 78-80K BTU 2,314
Upright, upflow 96 AFUE 96-100K BTU 2,338
Horizontal, downflow 96 AFUE 40-50K BTU
Horizontal, downflow 96 AFUE 60-64K BTU 2,445
Horizontal, downflow 96 AFUE 78-80K BTU 2,480
Horizontal, downflow 96 AFUE 96-100K BTU 2,530
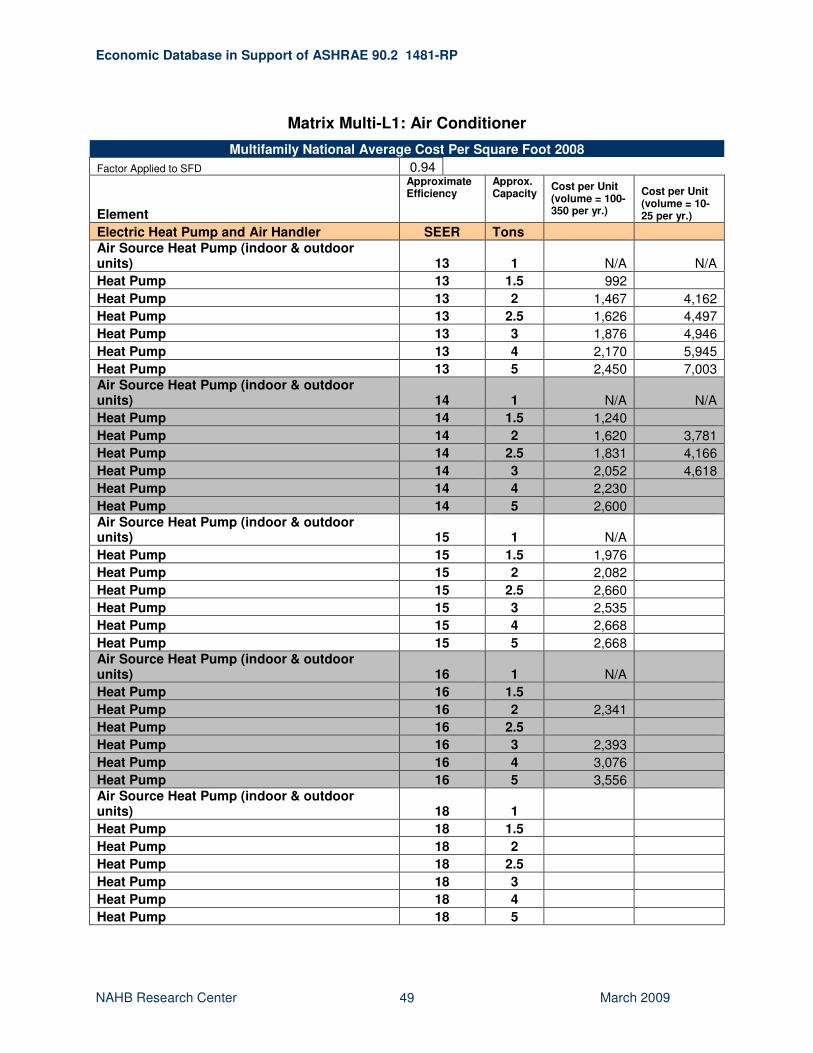
Economic Database in Support of ASHRAE 90.2 1481-RP
NAHB Research Center March 2009 49
Matrix Multi-L1: Air Conditioner
Multifamily National Average Cost Per Square Foot 2008
Factor Applied to SFD 0.94
Element
Approximate Efficiency
Approx. Capacity
Cost per Unit (volume = 100-350 per yr.)
Cost per Unit (volume = 10-25 per yr.)
Electric Heat Pump and Air Handler SEER Tons Air Source Heat Pump (indoor & outdoor units) 13 1 N/A N/A
Heat Pump 13 1.5 992
Heat Pump 13 2 1,467 4,162
Heat Pump 13 2.5 1,626 4,497
Heat Pump 13 3 1,876 4,946
Heat Pump 13 4 2,170 5,945
Heat Pump 13 5 2,450 7,003 Air Source Heat Pump (indoor & outdoor units) 14 1 N/A N/A
Heat Pump 14 1.5 1,240
Heat Pump 14 2 1,620 3,781
Heat Pump 14 2.5 1,831 4,166
Heat Pump 14 3 2,052 4,618
Heat Pump 14 4 2,230
Heat Pump 14 5 2,600 Air Source Heat Pump (indoor & outdoor units) 15 1 N/A
Heat Pump 15 1.5 1,976
Heat Pump 15 2 2,082
Heat Pump 15 2.5 2,660
Heat Pump 15 3 2,535
Heat Pump 15 4 2,668
Heat Pump 15 5 2,668 Air Source Heat Pump (indoor & outdoor units) 16 1 N/A
Heat Pump 16 1.5
Heat Pump 16 2 2,341
Heat Pump 16 2.5
Heat Pump 16 3 2,393
Heat Pump 16 4 3,076
Heat Pump 16 5 3,556 Air Source Heat Pump (indoor & outdoor units) 18 1
Heat Pump 18 1.5
Heat Pump 18 2
Heat Pump 18 2.5
Heat Pump 18 3
Heat Pump 18 4
Heat Pump 18 5
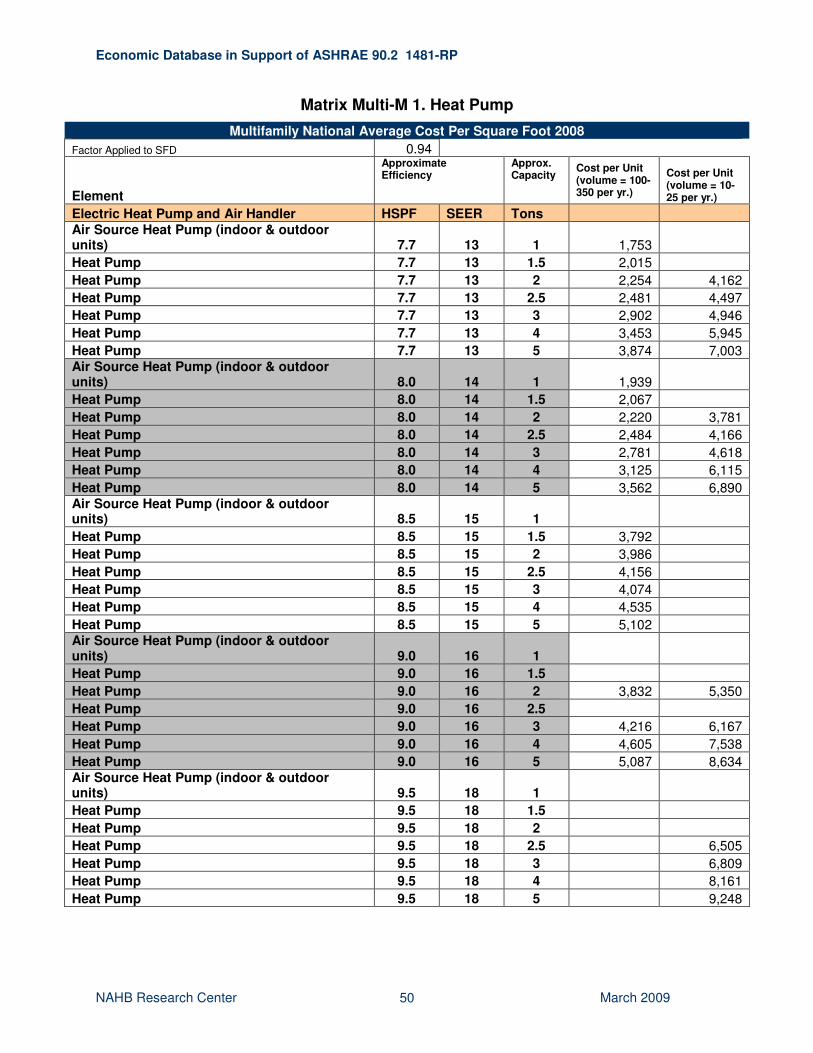
Economic Database in Support of ASHRAE 90.2 1481-RP
NAHB Research Center March 2009 50
Matrix Multi-M 1. Heat Pump
Multifamily National Average Cost Per Square Foot 2008
Factor Applied to SFD 0.94
Element
Approximate Efficiency
Approx. Capacity
Cost per Unit (volume = 100-350 per yr.)
Cost per Unit (volume = 10-25 per yr.)
Electric Heat Pump and Air Handler HSPF SEER Tons Air Source Heat Pump (indoor & outdoor units) 7.7 13 1 1,753
Heat Pump 7.7 13 1.5 2,015
Heat Pump 7.7 13 2 2,254 4,162
Heat Pump 7.7 13 2.5 2,481 4,497
Heat Pump 7.7 13 3 2,902 4,946
Heat Pump 7.7 13 4 3,453 5,945
Heat Pump 7.7 13 5 3,874 7,003 Air Source Heat Pump (indoor & outdoor units) 8.0 14 1 1,939
Heat Pump 8.0 14 1.5 2,067
Heat Pump 8.0 14 2 2,220 3,781
Heat Pump 8.0 14 2.5 2,484 4,166
Heat Pump 8.0 14 3 2,781 4,618
Heat Pump 8.0 14 4 3,125 6,115
Heat Pump 8.0 14 5 3,562 6,890 Air Source Heat Pump (indoor & outdoor units) 8.5 15 1
Heat Pump 8.5 15 1.5 3,792
Heat Pump 8.5 15 2 3,986
Heat Pump 8.5 15 2.5 4,156
Heat Pump 8.5 15 3 4,074
Heat Pump 8.5 15 4 4,535
Heat Pump 8.5 15 5 5,102 Air Source Heat Pump (indoor & outdoor units) 9.0 16 1
Heat Pump 9.0 16 1.5
Heat Pump 9.0 16 2 3,832 5,350
Heat Pump 9.0 16 2.5
Heat Pump 9.0 16 3 4,216 6,167
Heat Pump 9.0 16 4 4,605 7,538
Heat Pump 9.0 16 5 5,087 8,634 Air Source Heat Pump (indoor & outdoor units) 9.5 18 1
Heat Pump 9.5 18 1.5
Heat Pump 9.5 18 2
Heat Pump 9.5 18 2.5 6,505
Heat Pump 9.5 18 3 6,809
Heat Pump 9.5 18 4 8,161
Heat Pump 9.5 18 5 9,248
Economic Database in Support of ASHRAE 90.2 1481-RP
NAHB Research Center March 2009 51
DISCUSSION OF RESULTS
Economic Database
This work provides a sound basis on which the costs of energy efficient upgrades can be estimated. The pricing can be applied to construction techniques and products that are available in the market; however, there are some limitations to the contracted level of effort that became evident during the initial analysis. For example, four costs averaged for one assembly followed by two costs comprising the average of the next higher performing assembly can misstate the true price delta between these assemblies. This type of incongruity was particularly apparent for high-density fiberglass batts in floor and roof assemblies because only two of the four builders were able to locate a supply source for the products and provide costs. In such an instance, data points were dropped, narrowing the sample size while preserving the cost relationship between levels of upgraded performance. Larger data samples would be expected to decrease the variance of the data and increase the confidence in the relationship between cost and performance level reported. Costs were derived primarily by surveying builders from four different regions and, as necessary, supplemented by directly obtaining costs from suppliers. The data was compiled and analyzed, but some of the data points deviated significantly from the average. This can be a frequent problem with small data samples. The consistent approach taken was to eliminate obvious outlying data points when differences could not be reconciled. Builders participating were given the same set of instructions and templates. Notes included specific reference to often overlooked components that contribute to the upward creep of costs for specialty assemblies, such as window jamb extensions at thick wall/sheathing applications. The limited scope of this effort did not allow finite verification of the subcontractor bids that underlie these cost estimates.
Product Availability and Marketplace Limitations A specific list of energy efficient products was provided by the ASHRAE SSPC 90.2 Committee to be priced for this study. There were a few gaps in the responses from the builders due to a lack of local product availability with their established suppliers. These gaps included vermiculite core fill insulation used in foundation block, plastic skylights and very high efficiency air conditioning systems (17 SEER+). In addition some smaller subsets of data had little or no reporting from the responding builders such as 19.2” fiberglass batt products for floors over unconditioned space, mineral wool batts to fit typical exterior wall cavities and high density fiberglass batts (e.g., R-30C and R-38C). Windows are widely available with thermal performance levels down to a U-Value of about 0.30 and SHGC of 0.29. Below those levels, there are often many windows listed by the manufacturers, but very few of them could be priced by a supplier or ordered. Soliciting supplemental costs directly from suppliers was necessary to obtain a representative sample at the higher performing levels. HVAC equipment pricing varied widely among the builders. Higher costs were associated with the low-volume builders and lower costs with the high-volume builders. Because it is probable
Economic Database in Support of ASHRAE 90.2 1481-RP
NAHB Research Center March 2009 52
that the larger builders engage in contracts directly with product manufacturers who provide the opportunity for equipment cost advantages, HVAC equipment costs were averaged and displayed differently than other cost estimates in this report. HVAC costs and efficiencies are presented as reported by the builders without interpolation of intermediate sizes or efficiencies. It is known that one ton air conditioning units were unavailable in the marketplace, but inquiry into other voids in the spreadsheets did not produce definitive results as to product availability in certain sizes and efficiencies.
References
MEPS LTD, 2008. http://www.steelonthenet.com/prices.html NAHB Economics Group, 2008.The Cost of Doing Business. NAHB Research Center. Builder Practices Survey, 2007. Random Lengths Publications, Inc., 2008. Random Lengths, a weekly report on North American Lumber Markets. Reed Construction Data Inc., 2008. Building Construction Cost Data; 66th Annual Edition. Reed Construction Data Inc., 2008. Residential Cost Data; 27th Annual Edition. Reed Construction Data, Inc., 2008. Square Foot Costs, 29th Annual Edition. U.S. Census Bureau, 2008, Highlights of Annual 2007 Characteristics of New Housing.


![[XLS]upmsp.edu.in · Web view91.6 91.4 91 90.4 90.4 90.2 90.2 90.2 90 89.6 89 89 88.6 88.2 88.2 87.8 87.4 87.4 87.2 87 86.8 86.6 86.6 86.4 86.2 86.2 86 85.8 85.8 85.6 85.4 85.4 85.2](https://img.pdfslide.us/doc/110x75/5ac03a7f7f8b9a4e7c8ba3b5/xlsupmspeduin-view916-914-91-904-904-902-902-902-90-896-89-89-886-882.jpg)
![[XLS]upmsp.edu.in · Web view95.8 95 94.2 94 93.8 93.8 93.6 92.8 92.6 92.4 92.4 92.2 92.2 91.8 91.2 91 91 90.8 90.8 90.6 90.6 90.4 90.4 90.4 90.2 90.2 90.2 90 90 89.8 89.6 89.6 89.6](https://img.pdfslide.us/doc/110x75/5ace95d87f8b9a4e7a8b95ec/xlsupmspeduin-view958-95-942-94-938-938-936-928-926-924-924-922-922.jpg)


![[XLS]upmsp.edu.in · Web view95.8 93.6 93 92.6 92.6 92.6 92.2 92.2 92 91.4 91.4 91.4 91.2 91 91 90.8 90.6 90.6 90.6 90.4 90.4 90.4 90.4 90.2 90.2 90.2 90 90 90 90 90 89.8 89.8 89.8](https://img.pdfslide.us/doc/110x75/5ab61da57f8b9ab47e8d8a05/xlsupmspeduin-view958-936-93-926-926-926-922-922-92-914-914-914-912.jpg)