Embed Size (px)
Citation preview

Economic capital for life insurers
Prepared by Anton Kapel, Dan Antioch, Eric Tsui
Presented to the Actuaries Institute Actuaries Summit 20-21 May 2013
Sydney
This paper has been prepared for Act uaries Inst itut e 2013 Act uaries Summit. The Inst it ut e Council wishes it t o be underst ood t hat opinions put forward herein are not necessarily t hose of t he
Inst itute and the Council is not responsible for those opinions.
© 2013, Towers Watson. All rights reserved. A licence to publish is granted to the Institute of Actuaries of Australia.
The Institute will ensure that all reproductions of the paper acknowledge
the Author/s as the author/s, and include the above copyright statement.
Institute of Actuaries of Australia ABN 69 000 423 656
Level 7, 4 Martin Place, Sydney NSW Australia 2000 t +61 (0) 2 9233 3466 f +61 (0) 2 9233 3446
e [email protected] w www.actuaries.asn.au

Actuaries Summit 2013 i
© Towers Watson Australia Pty Ltd. All rights reserved
Table of Contents
Section 1 : Introduction ................................................................................................................1
1.1 Background and scope...........................................................................................................1 1.2 Definitions .....................................................................................................................................1
Section 2 : Why use EC? ..............................................................................................................4
2.1 ERM framework...........................................................................................................................4 2.2 Risk appetite ................................................................................................................................4
2.3 Determining EC ..........................................................................................................................5
2.4 Key elements of an EC basis ..................................................................................................5 Section 3 : Overarching methodology..........................................................................................7
3.1 Base balance sheet ..................................................................................................................7
3.2 Period of assessment ................................................................................................................9 3.3 Measures of risk........................................................................................................................ 12
3.4 Level of security ....................................................................................................................... 13 3.5 Risk coverage .......................................................................................................................... 13
3.6 Quantification methodology .............................................................................................. 18 3.7 Aggregation ............................................................................................................................. 18
Section 4 : Market practice ......................................................................................................... 22
4.1 Methodology ........................................................................................................................... 22 4.2 Asset-related risks .................................................................................................................... 23
4.3 Insurance risks .......................................................................................................................... 25 4.4 Operational risks ...................................................................................................................... 27
Section 5 : Uses of EC................................................................................................................ 29
5.1 Capital adequacy ................................................................................................................. 29 5.2 Risk monitoring and control ................................................................................................. 30
5.3 Performance measurement and management ........................................................... 30 5.4 Risk-based decision making ................................................................................................ 31
5.5 Business and strategic planning ......................................................................................... 31 Section 6 : Prevalence of EC in the Australian market ............................................................... 32
6.1 Regulatory capital .................................................................................................................. 32
6.2 Life company target surplus ................................................................................................ 34 6.3 Group capital requirements ................................................................................................ 34

Actuaries Summit 2013 ii
© Towers Watson Australia Pty Ltd. All rights reserved
Abstract
Key words: economic capital, risk-based capital, enterprise risk management
Purpose of paper: Globally, economic capital is increasing in importance within the financial services industry. While practice in some markets is converging due to regulatory requirements (e.g. Solvency II), there are still a range of approaches available for defining and calculating economic capital. For companies wishing to develop an economic capital basis, there is merit in considering all the alternative approaches. The aim of the paper is to act as a reference for discussions on economic capital.
Synopsis: The approaches underlying economic capital determinations vary considerably across (and in some cases within) geographic markets. While regulatory developments are encouraging convergence of approaches, differences in approaches amongst companies may remain valid due to differences in risk profile and risk appetite.
The paper sets out common approaches to economic capital, and includes a comprehensive analysis of the alternatives available.
We also discuss how economic capital fits within an enterprise risk management framework, and what the key challenges and benefits are from incorporating economic capital as a corner-stone risk metric.

Actuaries Summit 2013 1
© Towers Watson Australia Pty Ltd. All rights reserved.
Section 1: Introduction
1.1 Background and scope
Globally, economic capital (EC) is increasing in importance within the financial services industry. While practice in some markets is converging due to regulatory requirements (for example Solvency II), there are still a range of approaches available for defining and calculating EC. For companies wishing to develop an EC basis, there is merit in considering all the alternative approaches.
The aim of the paper is to act as a reference for discussions on EC. It sets out common approaches to calculating EC, and includes a comprehensive analysis of the alternatives available. We also discuss how EC fits within an enterprise risk management (ERM) framework, and what the key challenges and benefits are from incorporating EC as a corner-stone risk metric.
1.2 Definitions
1.2.1 What do we mean by “capital”?
The capital held by an insurer represents the excess of the value of its assets over the value of its l iabilities. Different definitions of capital will arise from different conventions for the measurement of assets and liabilities (e.g. fair value, GAAP, statutory, economic, etc.). The differences in conventions arise both from the inclusion or exclusion of different subsets of assets and liabilities (e.g. regulatory valuations typically exclude some or all intangible assets), and from different methodologies being applied to value the assets and liabilities (e.g. book vs. market value for assets, or the inclusion of prudent margins in liability values).
For any chosen “accounting” convention, we further need to distinguish between the capital that is available (i.e. the excess of assets over l iabilities under the chosen accounting convention) and the capital that is required to meet any set of criteria.
The term “economic capital” is typically used to refer to a measure of required capital under an economic accounting convention where assets and liabilities are determined using economic principles. It would perhaps be more clearly referred to as “required economic capital”.
As shown in the diagram below, available capital can be thought of as the sum of required capital and free capital.

Actuaries Summit 2013 2
© Towers Watson Australia Pty Ltd. All rights reserved.
Throughout the rest of this paper, the term “economic capital” (EC) refers to required economic capital.
1.2.2 What drives the level of capital held by an insurer?
The level of capital held by an insurer will ultimately be determined by its shareholders or by the Board and management team who represent their interests. It can therefore be expected to be set so as to maximise the value of the shareholders’ interest in the company. Shareholder value is, however, critically dependent on the attraction and retention of policyholders, so in practice policyholder perspectives have a significant influence on the level of capital held. Rating agencies and the prudential regulator are also key stakeholders, whose views will influence the level of capital held.
The key ways in which capital influences shareholder value are as follows:
• Holding more capital (other things being equal) will lead to greater financial strength and, as a consequence, enable the company to attract more risk averse policyholders, thus potentially increasing its franchise value.
• Additional capital also reduces the costs of financial distress, incurred when the company nears insolvency, including potentially very significant losses in franchise value.
• However, holding additional capital attracts frictional costs, relating to tax, investment costs and potentially agency effects, thus reducing shareholder value.
Assets
Available capital Required
capital
Free capital
Liabilities

Actuaries Summit 2013 3
© Towers Watson Australia Pty Ltd. All rights reserved.
In summary, shareholders will seek to minimise the level of capital held, subject to being able to attract and retain an ongoing stream of policyholders.
Note that the discussion in this paper is framed in the context of shareholder-owned life insurance companies. However, it should be noted that most of the discussion and conclusions are usually as relevant for mutual insurers, albeit with a slightly different perspective.
1.2.3 Definition of EC
EC is an internal calculation of the capital required, based on the company’s view of risk, with calculations based on “economic principles”. Without trying to define at this stage exactly how assets and liabilities are measured, broadly speaking, EC is an amount of capital required, calculated to give a specified level of security to policyholders in relation to the payment of their policy benefits.
EC is measured by stressing the economic balance sheet:
• the asset side of the balance sheet is impacted by asset stresses including, for example, equity market declines, changes in interest rates and credit spreads, defaults; and
• the liability side of the balance sheet is impacted by many of the asset stresses mentioned above, as well as l iability-specific stresses such as claims experience, policy decrements, expenses, etc.
Under each stress scenario (whether positive or negative), the amount of available capital will change, with adverse scenarios producing a loss of available capital. EC is derived from the distribution of these shocks to capital (with the exact process dependent on the methodology being used to define EC, as discussed in Section 2).
1.2.4 Risk factors and loss functions
Throughout the paper, we use the term “risk factors” to refer to the underlying parameters (l ike market interest rates, or mortality levels) that may impact the balance sheet. A loss function defines how a given movement in a risk factor impacts net assets under the adopted base balance sheet.

Actuaries Summit 2013 4
© Towers Watson Australia Pty Ltd. All rights reserved.
Section 2: Why use EC?
2.1 ERM framework
Typically, EC would form part of wider ERM practices embedded throughout a business. The key components of a comprehensive risk management system would include, for example:
• a risk appetite statement and associated policies and procedures;
• risk management organisational structure, roles and responsibil ities;
• EC and other risk metric methodologies and tools; and
• monitoring, reporting and management information requirements.
The above components form part of a control cycle, whereby a risk appetite statement would define risk metrics that would be monitored by risk managers and ultimately used to refine its policies and procedures. EC without the context of a wider ERM framework is of l ittle use to risk managers.
Further discussion of how EC can be used within the business is set out in Section 5.
2.2 Risk appetite
The starting point for defining an EC basis is an articulation of the type and amount of risk an insurer is willing to accept. It is helpful to understand which risks are considered to be part of doing business and which risks are not. Even within the same industry these can differ significantly between companies depending on, for example, strategy, ownership and geography.
The articulation of an insurer’s risk appetite is the key mechanism for shareholders (via the Board) to qualitatively define the boundaries a company should operate within. The EC basis adopted by an insurer will typically be used to quantify at least some of these boundaries by setting risk l imits commensurate with the risk appetite statement. For example, a risk appetite statement may focus on one or more of the following objectives that should be met as part of the normal operation of the business:
• to meet policyholder payments as they come due;
• to remain solvent on an accounting and / or regulatory basis; and
• to be able to access funding as needed, for example by maintaining a certain credit rating to access debt markets.
The risk appetite statement would articulate the desired likelihood of achieving each of the insurer’s key objectives. In setting risk appetite, there are risk-reward trade-offs to be made, as reductions in risk will typically imply reductions in profit

Actuaries Summit 2013 5
© Towers Watson Australia Pty Ltd. All rights reserved.
(and vice versa). Consequently, risk appetite is a key consideration in formulating business strategy and setting business plans.
2.3 Determining EC
EC is an internal calculation of the capital required, based on the company’s view of risk, with calculations based on economic principles. Broadly speaking, EC is an amount of capital that gives a specified level of security to policyholders in relation to the payment of their policy benefits. Various approaches can be taken to EC, with a wide range of economic principles being adopted in the market.
It is critical that each company develops a clear understanding of its risk appetite (how it views risk), and ensures that its EC basis aligns with this view.
2.4 Key elements of an EC basis
As noted above, various approaches can be taken when defining an EC basis and determining calculation approaches. In the table below, we have set out seven key issues that need to be addressed.
Four of these represent basic methodological decisions that define the conceptual basis for the EC calculation (the choice of base balance sheet, the period for assessment, the measure of risk and the confidence level). For a given EC basis, a single decision must be taken in these areas (although a company may choose to consider multiple EC measures, e.g. at different confidence levels).
The other three issues relate to aspects of implementation: the range of risks to include, the quantification methodology for each risk type and the approach to aggregation. These issues should be addressed considering the specifics of the business, and different approaches can be taken to address specific sub-components of the calculations (for example, the risks to include may vary across products, and the approach to quantification can be considered separately for each risk type).
In the following section, we look at each of these issues in turn.

Actuaries Summit 2013 6
© Towers Watson Australia Pty Ltd. All rights reserved.
Table 2.1
Key issues in defining the EC basis
Issue Options
1: Base balance sheet GAAP Regulatory Economic
2: Period for assessment One year n years Run off of portfolio
3: Measure of risk Value at Risk Tail VaR / Conditional Tail Expectation Economic Cost of Ruin / Expected Policyholder Deficit
4: Confidence level e.g. 99%
5: Risks to include Market (equity / property / interest rate / credit spread) Counterparty Insurance Operational Liquidity
6: Quantification methodology
Factor based Stress testing Stochastic modelling
7: Aggregation Additive Variance/covariance Stochastic modelling

Actuaries Summit 2013 7
© Towers Watson Australia Pty Ltd. All rights reserved.
Section 3: Overarching methodology
There are various approaches to defining an EC basis and a range of calculation techniques to reflect any chosen EC basis. Although market practice remains somewhat varied, there has been some convergence in recent years with respect to EC methodologies, largely due to regulatory pressures.
As noted above, there are seven key components that define the conceptual basis for the EC calculation:
1. the choice of base balance sheet;
2. the period for assessment;
3. the measure(s) of risk to use;
4. the level of security to target;
5. the range of risks to include;
6. the quantification methodology for each risk type; and
7. the approach to aggregation.
3.1 Base balance sheet
The base balance sheet is the starting position from which stresses are applied to the assets and liabilities.
It is common in banking for the base balance sheet for EC purposes to be a GAAP balance sheet. In Australia in recent times, capital levels for l ife insurers have generally been driven by “target surplus”, which is a form of EC assessed against a regulatory capital balance sheet (where required regulatory capital is considered a liability).
In its purest sense, an EC basis should adopt an “economic” (rather than accounting or regulatory) balance sheet as the base balance sheet. There is a wide spectrum of approaches that would qualify as “economic”, but generally, all would involve assets at market or fair value, and liabilities at some form of economic value. The benefits of such an approach include:
• consistency with shareholder focus on economic value creation;
• incentives for risk management actions to reflect the economic position of the business;
• the ability to apply the basis consistently across all l ines of business within an insurer (and entities with a group); and
• it is familiar to most stakeholder groups (investors, analysts, rating agencies).
Actuaries Summit 2013 8
© Towers Watson Australia Pty Ltd. All rights reserved.
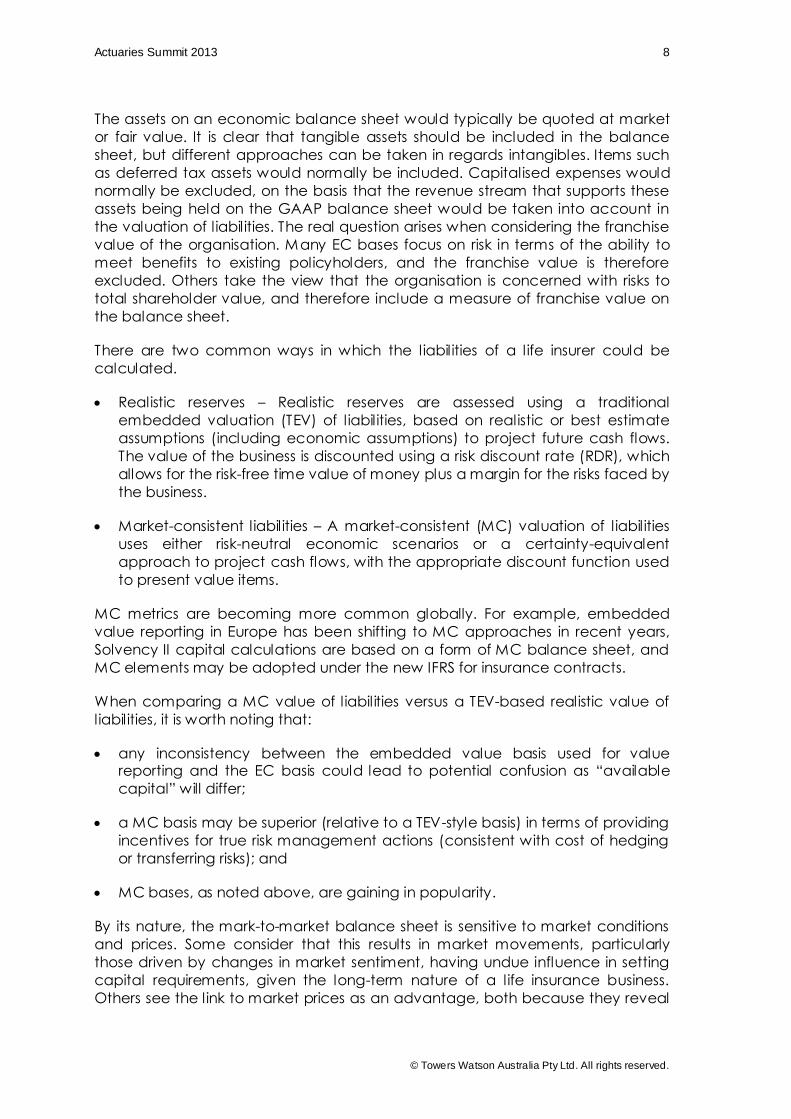
The assets on an economic balance sheet would typically be quoted at market or fair value. It is clear that tangible assets should be included in the balance sheet, but different approaches can be taken in regards intangibles. Items such as deferred tax assets would normally be included. Capitalised expenses would normally be excluded, on the basis that the revenue stream that supports these assets being held on the GAAP balance sheet would be taken into account in the valuation of l iabilities. The real question arises when considering the franchise value of the organisation. Many EC bases focus on risk in terms of the ability to meet benefits to existing policyholders, and the franchise value is therefore excluded. Others take the view that the organisation is concerned with risks to total shareholder value, and therefore include a measure of franchise value on the balance sheet.
There are two common ways in which the liabilities of a life insurer could be calculated.
• Realistic reserves – Realistic reserves are assessed using a traditional embedded valuation (TEV) of l iabilities, based on realistic or best estimate assumptions (including economic assumptions) to project future cash flows. The value of the business is discounted using a risk discount rate (RDR), which allows for the risk-free time value of money plus a margin for the risks faced by the business.
• Market-consistent l iabilities – A market-consistent (MC) valuation of l iabilities uses either risk-neutral economic scenarios or a certainty-equivalent approach to project cash flows, with the appropriate discount function used to present value items.
MC metrics are becoming more common globally. For example, embedded value reporting in Europe has been shifting to MC approaches in recent years, Solvency II capital calculations are based on a form of MC balance sheet, and MC elements may be adopted under the new IFRS for insurance contracts.
When comparing a MC value of l iabilities versus a TEV-based realistic value of l iabilities, it is worth noting that:
• any inconsistency between the embedded value basis used for value reporting and the EC basis could lead to potential confusion as “available capital” will differ;
• a MC basis may be superior (relative to a TEV-style basis) in terms of providing incentives for true risk management actions (consistent with cost of hedging or transferring risks); and
• MC bases, as noted above, are gaining in popularity.
By its nature, the mark-to-market balance sheet is sensitive to market conditions and prices. Some consider that this results in market movements, particularly those driven by changes in market sentiment, having undue influence in setting capital requirements, given the long-term nature of a life insurance business. Others see the link to market prices as an advantage, both because they reveal

Actuaries Summit 2013 9
© Towers Watson Australia Pty Ltd. All rights reserved.
the true market volatil ity of the balance sheet and because these prices may be very relevant when assessing risk management options available in adverse scenarios.
We note that the use of a GAAP balance sheet for l ife insurers can be problematic, primarily due to the long-term nature of insurance liabilities and the differences in the level of conservatism (relative to a true economic value) inherent in different blocks of business.
3.2 Period of assessment
There are two most commonly seen approaches adopted globally: a liability run-off approach and a one-year approach. Most insurers calculating EC today adopt one or sometimes both of these approaches. Although there may be minor differences in the definition and application, the two approaches can broadly be defined as follows:
• Under the one-year approach, EC represents the change in the net balance position (value of assets less value of l iabilities) over one year at the specified security level.
• Under the liability run-off approach, EC represents the current value of assets required to pay all future policyholder benefits, and associated expenses as they arise (at the chosen security level), less the current value of the liabilities.
In some cases, insurers will adopt a fixed time period longer than a single year (say 3 or 5 years), but this is becoming less common.
3.2.1 The one-year approach
The one-year approach is based on the following main steps:
• An economic balance sheet is developed as at the valuation date, with assets usually at market value and liabilities usually quoted on a MC basis. The difference between the value of assets and the value of l iabilities gives the economic value of net assets, i.e., the available capital at the valuation date measured on an economic basis.
• A number of scenarios reflecting changes in risk factors that might occur over a year are considered. Assets and liabilities are revalued under each of these scenarios and an economic balance sheet is produced reflecting the movement in risk factors. Note that it is common for l ife insurers to adopt an “instantaneous shock approach” when applying a one-year time horizon, rather than projecting the evolution in the economic value of net assets over the year and then discounting using the projected investment return for the year.
• The initial net asset value is then subtracted from each shocked (discounted) values of net assets to produce a change in net assets for each scenario. A
Actuaries Summit 2013 10
© Towers Watson Australia Pty Ltd. All rights reserved.
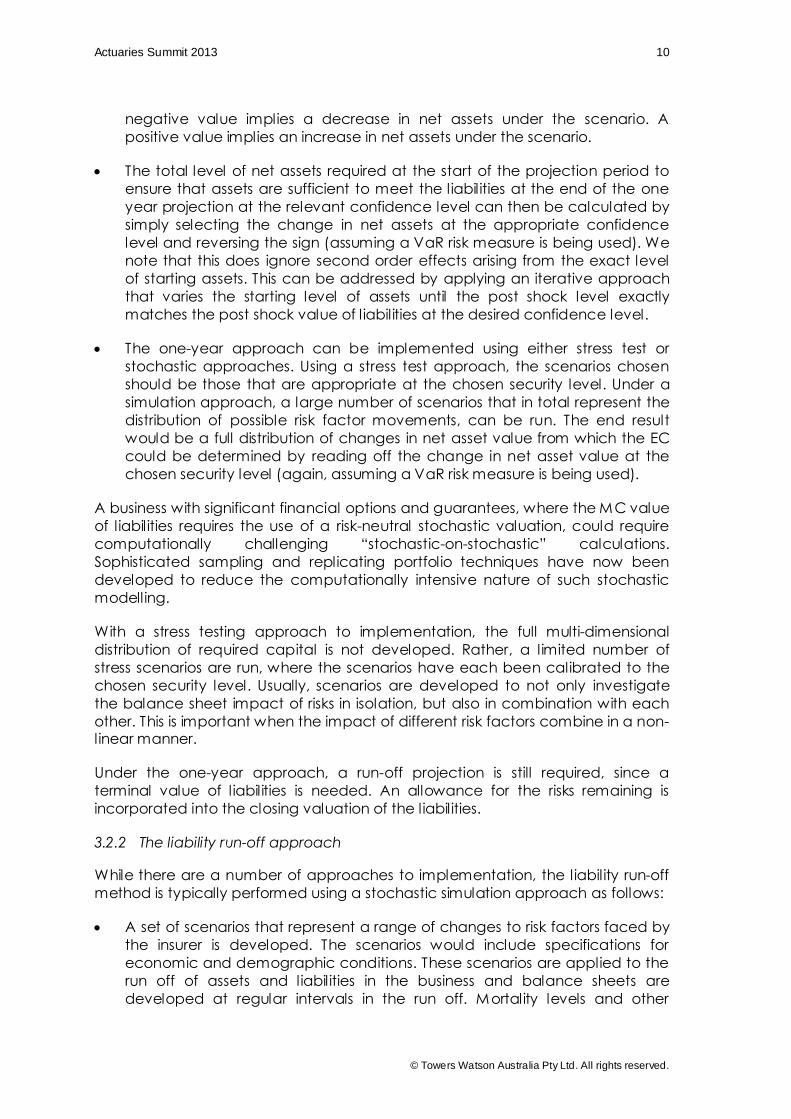
negative value implies a decrease in net assets under the scenario. A positive value implies an increase in net assets under the scenario.
• The total level of net assets required at the start of the projection period to ensure that assets are sufficient to meet the liabilities at the end of the one year projection at the relevant confidence level can then be calculated by simply selecting the change in net assets at the appropriate confidence level and reversing the sign (assuming a VaR risk measure is being used). We note that this does ignore second order effects arising from the exact level of starting assets. This can be addressed by applying an iterative approach that varies the starting level of assets until the post shock level exactly matches the post shock value of l iabilities at the desired confidence level.
• The one-year approach can be implemented using either stress test or stochastic approaches. Using a stress test approach, the scenarios chosen should be those that are appropriate at the chosen security level. Under a simulation approach, a large number of scenarios that in total represent the distribution of possible risk factor movements, can be run. The end result would be a full distribution of changes in net asset value from which the EC could be determined by reading off the change in net asset value at the chosen security level (again, assuming a VaR risk measure is being used).
A business with significant financial options and guarantees, where the MC value of l iabilities requires the use of a risk-neutral stochastic valuation, could require computationally challenging “stochastic-on-stochastic” calculations. Sophisticated sampling and replicating portfolio techniques have now been developed to reduce the computationally intensive nature of such stochastic modelling.
With a stress testing approach to implementation, the full multi-dimensional distribution of required capital is not developed. Rather, a limited number of stress scenarios are run, where the scenarios have each been calibrated to the chosen security level. Usually, scenarios are developed to not only investigate the balance sheet impact of risks in isolation, but also in combination with each other. This is important when the impact of different risk factors combine in a non-linear manner.
Under the one-year approach, a run-off projection is still required, since a terminal value of l iabilities is needed. An allowance for the risks remaining is incorporated into the closing valuation of the liabilities.
3.2.2 The liability run-off approach
While there are a number of approaches to implementation, the liability run-off method is typically performed using a stochastic simulation approach as follows:
• A set of scenarios that represent a range of changes to risk factors faced by the insurer is developed. The scenarios would include specifications for economic and demographic conditions. These scenarios are applied to the run off of assets and liabilities in the business and balance sheets are developed at regular intervals in the run off. Mortality levels and other
Actuaries Summit 2013 11
© Towers Watson Australia Pty Ltd. All rights reserved.
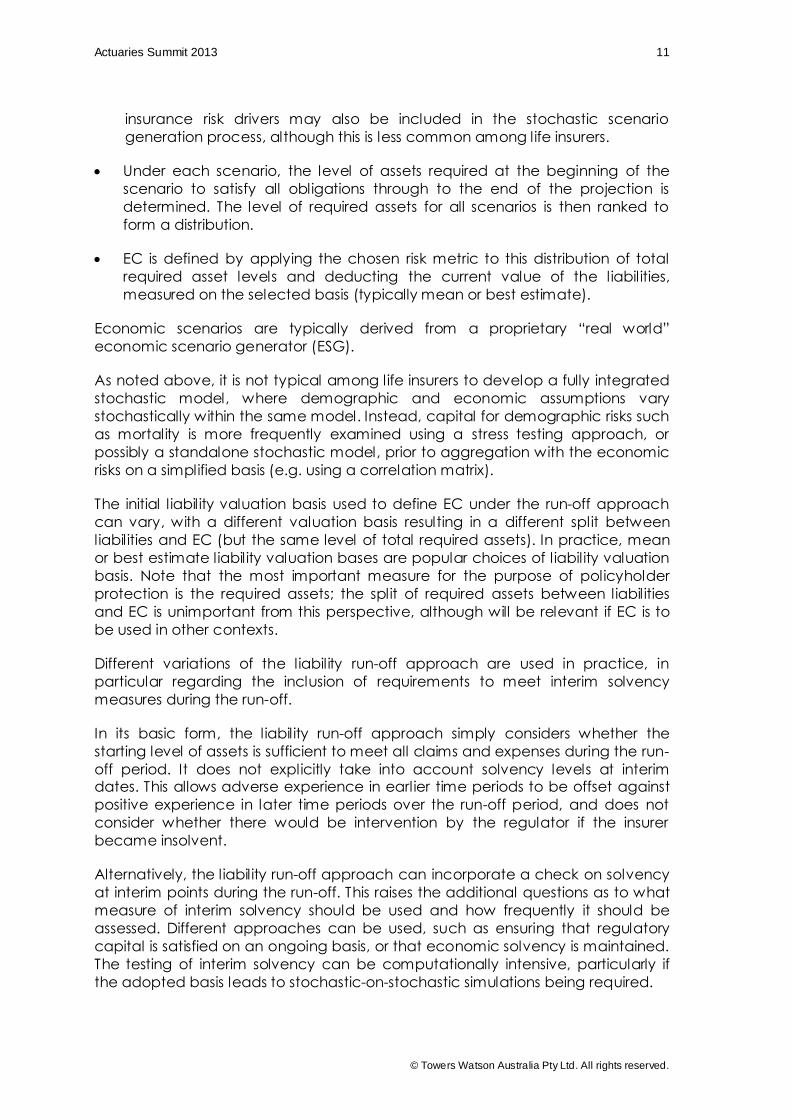
insurance risk drivers may also be included in the stochastic scenario generation process, although this is less common among life insurers.
• Under each scenario, the level of assets required at the beginning of the scenario to satisfy all obligations through to the end of the projection is determined. The level of required assets for all scenarios is then ranked to form a distribution.
• EC is defined by applying the chosen risk metric to this distribution of total required asset levels and deducting the current value of the liabilities, measured on the selected basis (typically mean or best estimate).
Economic scenarios are typically derived from a proprietary “real world” economic scenario generator (ESG).
As noted above, it is not typical among life insurers to develop a fully integrated stochastic model, where demographic and economic assumptions vary stochastically within the same model. Instead, capital for demographic risks such as mortality is more frequently examined using a stress testing approach, or possibly a standalone stochastic model, prior to aggregation with the economic risks on a simplified basis (e.g. using a correlation matrix).
The initial l iability valuation basis used to define EC under the run-off approach can vary, with a different valuation basis resulting in a different split between liabilities and EC (but the same level of total required assets). In practice, mean or best estimate liability valuation bases are popular choices of l iability valuation basis. Note that the most important measure for the purpose of policyholder protection is the required assets; the split of required assets between liabilities and EC is unimportant from this perspective, although will be relevant if EC is to be used in other contexts.
Different variations of the liability run-off approach are used in practice, in particular regarding the inclusion of requirements to meet interim solvency measures during the run-off.
In its basic form, the liability run-off approach simply considers whether the starting level of assets is sufficient to meet all claims and expenses during the run-off period. It does not explicitly take into account solvency levels at interim dates. This allows adverse experience in earlier time periods to be offset against positive experience in later time periods over the run-off period, and does not consider whether there would be intervention by the regulator if the insurer became insolvent.
Alternatively, the liability run-off approach can incorporate a check on solvency at interim points during the run-off. This raises the additional questions as to what measure of interim solvency should be used and how frequently it should be assessed. Different approaches can be used, such as ensuring that regulatory capital is satisfied on an ongoing basis, or that economic solvency is maintained. The testing of interim solvency can be computationally intensive, particularly if the adopted basis leads to stochastic-on-stochastic simulations being required.

Actuaries Summit 2013 12
© Towers Watson Australia Pty Ltd. All rights reserved.
3.3 Measures of risk
While a number of different measures of risk can be used within an EC calculation, in practice most can be categorised into one of two groups. These reflect the two aspects of downside risk faced by policyholders, namely the probability that they suffer a loss compared to their expectations (“probability of ruin” measures), and the extent of that loss (“cost of ruin” measures). Commonly used probability of ruin and cost of ruin measures include:
• value at risk (VaR); and
• tail value at risk (TVaR), also known as conditional tail expectation (CTE).
Both types of risk measure can be used with either of the two main approaches to calculating EC.
A variant on TVaR (which has a shareholder focus), is Expected Cost of Ruin (ECoR), commonly referred to as Expected Policyholder Deficit (EPD) when used by insurers. Under this measure, the shortfall in benefits to policyholders is measured, allowing this to be compared against the value of benefits paid (to put the amount of loss in context). Despite the conceptual attractiveness of EPD, this measure is not widely used as the primary measure that defines an EC basis amongst l ife insurers. Nevertheless, it remains a useful metric for describing the impact of the residual risk remaining for a given level of available capital.
3.3.1 VaR
VaR measure of risk is quoted at a specified level of probability and time horizon. Given the distribution of profits and losses possible for a portfolio over the time horizon, the VaR is the result (typically a loss) at the specified level of probability.
Conceptually, VaR is relatively simple to understand and use. It is widely known and used, especially in the banking industry, and is the approach being adopted in Europe under Solvency II and in Australia under the new life insurance capital standards. VaR is also generally consistent with the majority of the calibration data available from rating agencies.
VaR also has the benefit of not requiring highly accurate modelling of extreme tail scenarios, and requires fewer scenarios to achieve a stable result. However, it can result in inadequate, possibly even zero, levels of capitalisation for low probability, high-loss l ines of business or risk factors – for example, stop-loss exposures or certain operational risks. Consequently, where VaR is used, it would usually be worthwhile undertaking some investigation of the tail of outcomes beyond the adopted probability of sufficiency.
One aspect of VaR to note is that it is not a coherent risk measure. A risk measure is considered coherent if it satisfies a number of statistical principles. One such principle is sub-additivity; where the risk measure of a combined portfolio A+B should not exceed the sum of the risk measures of portfolio A and portfolio B in isolation. In theory, if a measure is not coherent is can lead to inconsistent results when aggregating/allocating capital. In practice, however, this does not

Actuaries Summit 2013 13
© Towers Watson Australia Pty Ltd. All rights reserved.
present an issue for most risk distributions encountered within the life industry. General insurers often face more skewed distributions, and the coherence of the measure is therefore a more important factor.
3.3.2 TVaR
Like VaR, TVaR (or CTE) is also quoted at a specified level of probability and time horizon. Given the distribution of all possible profits and losses faced by the portfolio, the TVaR is the weighted average value of results (typically losses) at probabilities beyond the specified threshold.
Computationally, TVaR is generally more demanding to calculate accurately than VaR and can be more difficult to select sensible thresholds (as the metric is less intuitive and there are fewer comparatives). To achieve an accurate TVaR result requires assumptions as to the shape of loss distribution in the extreme tail, where data is usually scarce or non-existent.
TVaR (and most other cost of ruin approaches) is a coherent risk measure, thus ensuring reasonable results when aggregating capital across risks/businesses or alternatively when allocating capital among risks/businesses.
3.4 Level of security
The probability of sufficiency is designed to provide a target level of confidence that the business will remain “solvent” (on whatever base balance sheet basis has been adopted). This target security level should be driven by the company’s risk appetite. It also needs to be determined in such a way that this target can be communicated meaningfully to all the relevant stakeholders (including regulators and rating agencies).
There is no prescribed way in which the target security level should be expressed, although it is often broadly aligned with other measures of financial strength, such as rating agency assessments of the company’s corporate debt (if any) and its insurance financial strength rating.
It is important to consider the measure of risk being used when deciding on the level of security. In particular, the required capital using a TVaR measure would far exceed the required capital using a VaR measure if the same level of security was applied.
Similarly, the choice of period of assessment will impact the level of security adopted. Generally, as the period of assessment increases, a given level of capital will generate reducing levels of security.
3.5 Risk coverage
All key risks impacting the adopted balance sheet should be included in the assessment of EC. These risks can generally be classified into the following categories:
Actuaries Summit 2013 14
© Towers Watson Australia Pty Ltd. All rights reserved.
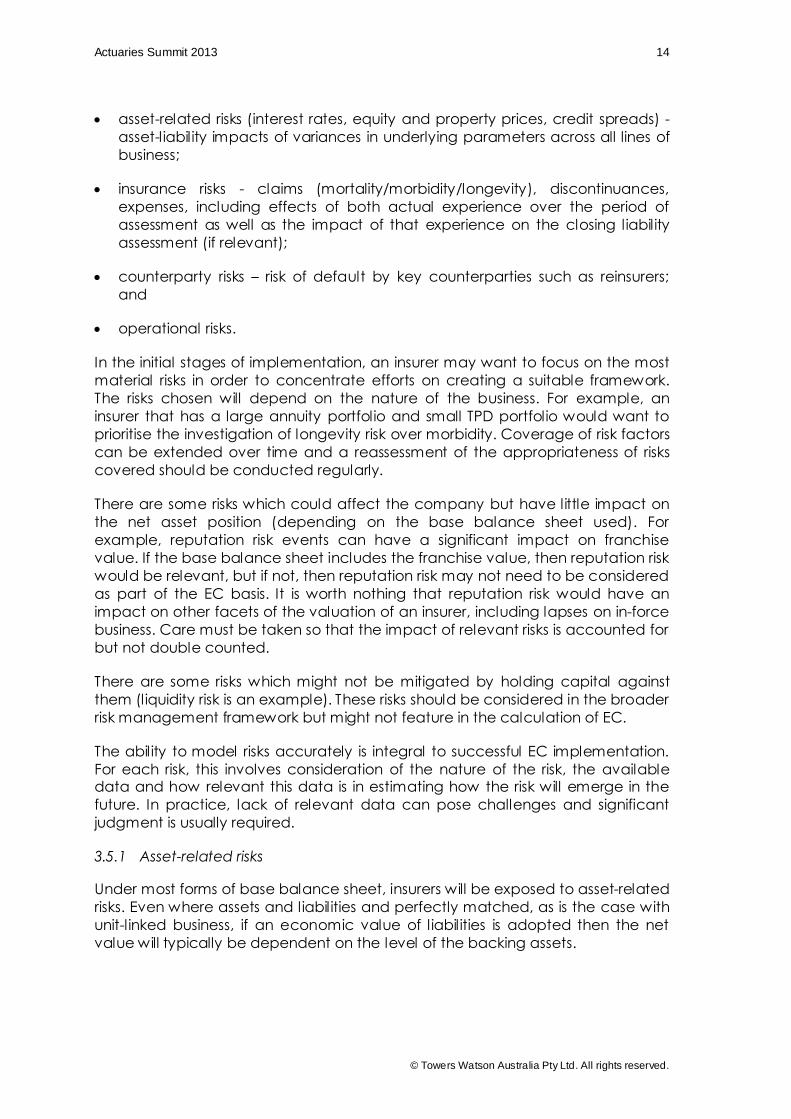
• asset-related risks (interest rates, equity and property prices, credit spreads) - asset-liability impacts of variances in underlying parameters across all lines of business;
• insurance risks - claims (mortality/morbidity/longevity), discontinuances, expenses, including effects of both actual experience over the period of assessment as well as the impact of that experience on the closing liability assessment (if relevant);
• counterparty risks – risk of default by key counterparties such as reinsurers; and
• operational risks.
In the initial stages of implementation, an insurer may want to focus on the most material risks in order to concentrate efforts on creating a suitable framework. The risks chosen will depend on the nature of the business. For example, an insurer that has a large annuity portfolio and small TPD portfolio would want to prioritise the investigation of longevity risk over morbidity. Coverage of risk factors can be extended over time and a reassessment of the appropriateness of risks covered should be conducted regularly.
There are some risks which could affect the company but have little impact on the net asset position (depending on the base balance sheet used). For example, reputation risk events can have a significant impact on franchise value. If the base balance sheet includes the franchise value, then reputation risk would be relevant, but if not, then reputation risk may not need to be considered as part of the EC basis. It is worth nothing that reputation risk would have an impact on other facets of the valuation of an insurer, including lapses on in-force business. Care must be taken so that the impact of relevant risks is accounted for but not double counted.
There are some risks which might not be mitigated by holding capital against them (liquidity risk is an example). These risks should be considered in the broader risk management framework but might not feature in the calculation of EC.
The ability to model risks accurately is integral to successful EC implementation. For each risk, this involves consideration of the nature of the risk, the available data and how relevant this data is in estimating how the risk will emerge in the future. In practice, lack of relevant data can pose challenges and significant judgment is usually required.
3.5.1 Asset-related risks
Under most forms of base balance sheet, insurers will be exposed to asset-related risks. Even where assets and liabilities and perfectly matched, as is the case with unit-l inked business, if an economic value of l iabilities is adopted then the net value will typically be dependent on the level of the backing assets.

Actuaries Summit 2013 15
© Towers Watson Australia Pty Ltd. All rights reserved.
Interest rate risk:
Fluctuations in interest rates can have significant impacts on the economic position of l ife insurers. Depending on the choice of base balance sheet, all product types can be affected. Where the policy liability is positive and assets and liabilities are matched to some degree, changes in asset values will at least partially offset changes in liability values. Where policy liabilities are negative (with effectively zero backing assets), as can be the case with yearly renewable risk products, the net position can be very sensitive to interest rate movements. The EC related to interest rate risk is therefore often significant.
Under interest rate risk, it is possible to consider parallel shifts in yields across the full yield curve, twists and other changes in shape. While the bulk of interest rate risk typically arises from first order parallel shifts, the nature of an individual portfolio may mean that more complex shocks to interest rates should be considered.
Insurance company balance sheets, and therefore EC, can also be sensitive to changes in the level of interest rate volatil ities.
Equity and property risks:
Companies are subject to equity and property market risk from holding these investment assets. As with interest rates, the relative size of the risk depends on the extent to which the insurer’s assets and liabilities are matched. This l ink between assets and liabilities needs to be reflected in the modelling of equity and property risk. Unlike interest rate risk, equity/property risk does not have the added dimension of a term structure and so its impact on an insurer’s assets and liabilities is usually clearer to understand, which can make it easier to model. As with interest rates, results can also be sensitive to the level of equity volatil ity as well as expected return.
Credit spread risk:
Credit spread risk relates to the possibil ity of loss of market value of investment assets due to changes in the level of credit spreads, changes in credit rating or default.
3.5.2 Insurance risks
Claims risks (mortality, morbidity, longevity):
Typically, claims risk relates to the possibil ity that the actual level of claims will differ from a “best estimate” level. There are a number of sources of such variation:
• Mis-estimation of the mean: This is the risk that the best estimate is mis-stated and is not a true representation of the expected level of claims.

Actuaries Summit 2013 16
© Towers Watson Australia Pty Ltd. All rights reserved.
• Trend and systemic risk: This relates to the fact that the current best estimate may not remain static over the projection period, due to trends in experience or systemic shocks to experience.
• Random fluctuations: Even if the underlying probability of claims occurring was known with certainty, actual claims experience could vary due to random fluctuations. Random fluctuations arise both in terms of the number of claims, and the size of the claims that occur.
• Catastrophe risk: Pandemics or concentrations of exposures can give rise to catastrophic losses.
Discontinuances:
Variation in persistency can be driven by a number of factors. For some product types (such as unit-l inked business with guarantees), a key driver of the variation in persistency will be economic performance. Therefore, “dynamic lapses” can be modelled linked to economic conditions.
For many Australian products, these economic effects are less pronounced, and variation in persistency can be considered in a similar manner to claims risks.
Expenses:
Variation in expense levels should be considered, but care is needed to avoid any double count in respect of operational risk allowances.
3.5.3 Counterparty risk
Counterparty risk refers to the risk of default by specific counterparties (as opposed to credit risk arising from investment in credit risky assets). For insurers, typical material counterparty exposures include reinsurers and, if material over-the-counter derivative contracts are held, derivative counterparties.
3.5.4 Operational risk
Operational risks are those arising in relation to people, processes, distribution channels, internal systems and external events (such as regulatory and political risks). The nature of operational risks is such that the more material risks are those that tend to have a low probability of occurrence and a substantial impact if an event does occur. The implication of this is that companies typically do not have sufficient information upon which to base a statistical analysis or against which to calibrate a stress basis.
We note that reputation risk and strategic risk, which may be considered operational risks, are not typically considered explicitly in EC calculations. While there is a risk of loss of shareholder value associated with these risks, holding capital does not mitigate these risks. Further, these risks tend to have more impact on the franchise value of an insurer rather than the in-force book which is typically the focus of EC calculations.

Actuaries Summit 2013 17
© Towers Watson Australia Pty Ltd. All rights reserved.
Allowances for operational risks should cover both direct losses related to the actual costs in solving operational risk events, and any indirect costs.
3.5.5 Liquidity risk
Liquidity risk refers to the possibil ity that an insurer will face uncertain cash flow requirements in the future arising from its day-to-day activities. Liquidity risk takes on many forms and can arise from both the liability and asset sides of the insurer’s operations.
Some aspects of l iquidity risk (such as the impact of a market liquidity crisis on the market value of assets), should be reflected elsewhere in the EC basis (in this example, within the asset-related risk allowances).
While it is crucial for l ife insurers to measure and manage liquidity, and to ensure that they are able to meet cash flow needs as they arise, holding capital is not an effective mitigant against l iquidity risk. Therefore, it is not unusual to see no explicit l iquidity risk allowance in a life insurer’s EC basis.
3.5.6 Covered business
Typically, all business l ines would be included.
For an entity that holds insurance subsidiaries, whether wholly or partly owned, then consideration needs to be given to how the required capital in respect of subsidiaries should be calculated. Where material, the subsidiary can be allowed for on a look-through basis, which means that the subsidiary should be subject to the same considerations as the primary entity; alternatively, the subsidiary could be valued as an equity investment.
3.5.7 Options and guarantees
There are various options and guarantees, both on the assets and liabilities, that may impact insurers. Some of the common ones that are usually modelled by major insurers include:
• policyholder participation in profits;
• guaranteed cash surrender value;
• asset optionality such as callable bonds, derivatives, swaps, etc.;
• voluntary decrements including surrenders/lapses and partial withdrawals;
• minimum interest rate guarantees;
• guaranteed benefit features on unit-l inked products; and
• annuitisation options.
Generally, the value of these options and guarantees should be considered (as appropriate) in deriving the value of assets and liabilities on the base balance

Actuaries Summit 2013 18
© Towers Watson Australia Pty Ltd. All rights reserved.
sheet, and allowance should be made for the change in value of these options and guarantees under the EC shocks.
3.6 Quantification methodology
3.6.1 Considerations
The approach to quantifying risks will vary by risk type and potentially within each risk type.
For each risk type, considerations will include:
• which components of the risk are modelled;
• how the distribution of the risk is represented; and
• how the appropriate value of the risk at the level of security required is determined.
Another modelling consideration is whether the required capital resulting from a risk factor is modelled separately from the distribution of the risk factor outcome itself.
3.6.2 Approaches
The broad approaches to quantification include:
• factor-based methods, where a factor is applied to a driver to approximate the impact of a risk;
• stress testing, where a specific shock is defined and the impact of that shock on the balance sheet is determined; and
• stochastic modelling, where a full distribution of shocks are modelled, producing a full distribution of EC outcomes.
Whatever the chosen approach is for each risk type, it is important that the approach is consistent across the entire business so that the aggregation remains valid.
3.7 Aggregation
Aggregation involves combining the EC that has been calculated separately at a certain level of detail (e.g., by risk type and/or by product or l ine of business) to arrive at the aggregate EC for the insurer. When constructing an EC model, it is also one of the first items that need to be considered. The form of the output required should determine what available aggregation approaches are suitable. The aggregation approach will then determine the structure of the model and the form that the component inputs need to take. This may be an iterative process. For example, it may be found that data required for certain outputs

Actuaries Summit 2013 19
© Towers Watson Australia Pty Ltd. All rights reserved.
cannot be produced or management may find that a change in output would aid them in decision making.
Below is a sample list of a range of considerations that could drive modelling decisions during the design and construction phases.
• What are the capital reporting requirements for statutory purposes, internal management purposes and external reporting purposes?
• What are the risk metrics that will be used by management both at group and business unit level?
• What is the insurance company’s structure by legal entity and management lines?
• How is risk in the business currently managed and how will it be managed in the future? For example, will required capital be allocated across geography, business unit, product groups, risk type or a combination of these?
• What information is available from current systems? Can the type and granularity of data available support the production of the output required?
• How often will EC need to be calculated and in what timeframe? Apart from the regular reporting cycle, will ad-hoc calculations also be required?
• How will EC results feed into the general reporting systems of the business?
3.7.1 Aggregation approaches
The most appropriate aggregation approach in a particular situation will depend on the level of detail at which the component EC has been calculated, which is very closely linked to the quantification methodology used.
The required capital for all risks together will typically be less than the sum of the required capital for each individual risk. Insurance involves diversification, spreading risks and the law of large numbers. The worst case outcome for all individual risks does not occur at the same time. Determining the aggregate EC while allowing for diversification requires assumptions to be made about the relationship between different risks for different products and lines of business.
In stochastic modelling, depending on the level of sophistication of the model, capital requirements can be directly determined for groups of risks. Under this approach, much of the aggregation by risk has already taken place within the scenario generator and is embedded within the scenarios themselves. Consequently, most aggregation reduces to a simple addition of EC by product or l ine of business (depending on the level of detail at which the models were run).
An alternative to directly simulating capital requirements is to stochastically simulate risk factor outcomes. The balance sheet impact of these risk factor

Actuaries Summit 2013 20
© Towers Watson Australia Pty Ltd. All rights reserved.
outcomes on different parts of the insurer can then be represented, typically in functional form, by replicating portfolios or non-parametric form. The advantage of this approach over simulating losses is that the separation of risk factor modelling and balance sheet impact allows for a better understanding of how the two components move and interact with each other. In terms of modelling and calibration, this approach allows for incorporation of more complex interactions between risk types. It also facilitates allocation of EC and diversification benefits.
Initially, a simplified aggregation approach is l ikely to be appropriate, with enhancements over time, e.g. simplified correlations could be used initially, with more advanced copula functions developed over time.
Under a stress testing approach, EC is calculated by risk type, so in order to arrive at an aggregate level of EC, assumptions are required about the dependencies between different risks. A variance-covariance matrix (or similarly, a correlation matrix) describes the dependency among the individual risks and can be applied to the amounts determined for the individual risks. Where stress testing calculations have been done at a very granular level, the size of the variance-covariance matrix can become very large, and this can pose a challenge to parameterise.
If a factor-based quantification methodology has been used, the approach to aggregation will depend on how the factors have been calibrated. It could be a simple addition, or require some explicit correlation assumptions with a similar technique as for stress testing.
3.7.2 Dependencies between risks
Significantly, irrespective of whether a stochastic or stress testing approach has been used, correlation assumptions are required. What differs is where in the process the correlations are applied and whether they are applied implicitly or explicitly.
In the determination of the correlation parameters, it is important to realise that dependencies may behave differently in extreme scenarios than scenarios that are closer to the mean of the risk distribution. For example, a small change to expected mortality is unlikely to have any strong link with the economy (and related market and credit risks), but extreme mortality events may exhibit an increased correlation with market risks.
Determining the correlation assumptions can be a subjective process. Lack of available data may make techniques for determining parameters impractical. For risks related to market risk or credit risk, it is possible to find historical data that can be analysed and used to quantify correlations. However, even then, there may be insufficient historical data to determine the tail correlations with a large degree of confidence.
For insurance risks such as mortality or lapses, available information is generally a lot more limited. Therefore, correlations among these risks and with other risks often need to be made subjectively. In these instances, the results need to be

Actuaries Summit 2013 21
© Towers Watson Australia Pty Ltd. All rights reserved.
interpreted bearing this in mind; sensitivity testing can also be important to gain comfort with the results.
A copula is a useful statistical function to model and describe such interrelationships between different risks. There exists a range of copula types that exhibit different levels of dependency at the tails. Copulas that are typically used would exhibit a higher level of dependency at extreme values. Three common copulas are:
• Gaussian;
• Individuated Student’s t; and
• Gumbel.
The Gaussian copula is the functional equivalent of the correlation matrix and does not allow for the parameterisation of its weak tail dependency. Both the Individuated Student’s t and Gumbel copulas allow for the parameterisation of tail dependencies between pairs of risks. The Individuated Student’s t is symmetric while the Gumbel is one-sided.

Actuaries Summit 2013 22
© Towers Watson Australia Pty Ltd. All rights reserved.
Section 4: Market practice
In the 2012 Towers Watson Global ERM Survey, the question was asked “Does your organisation calculate economic capital?”. Out of the 539 responses to this question, 64% of insurers were calculating EC and a further 24% were considering it.
This section discusses commonly used practice for insurers that do calculate EC.
4.1 Methodology
The one-year MC approach is emerging as the most common approach, for a variety of reasons:
• An implicit assumption in the one-year MC approach is that, if the scenario defining EC were to occur, there would be sufficient assets at the end of the one-year period that the risk can be closed out by transactions at market prices, either by hedging risks, transferring risks (via reinsurance) or by selling the business (for nil consideration).
• A one-year approach is generally viewed as being easier to understand and explain, especially to non-technical audiences, and is consistent with similar measures used in other industries.
• It is easier to set a target confidence level over a one-year horizon, due to the existence of benchmarks (e.g. ratings are generally assessed based on a one-year horizon).
• A consistent one-year horizon assists aggregation, and facilitates the process of setting assumptions for correlations between risks (that drive diversification benefits).
54%
10%
24%
12%
No, but we are considering or planning this
Yes, but further development is planned within the next 12 months
No, and we are not planning or considering this
Yes, and there are no plans for further development over the next 12 months

Actuaries Summit 2013 23
© Towers Watson Australia Pty Ltd. All rights reserved.
The liability run-off approach is commonly used in some markets, particularly in North America where it forms a component of regulatory capital calculations and is therefore more familiar to stakeholders.
4.2 Asset-related risks
4.2.1 Modelling framework
Market practice with regard to the modelling framework for asset-related risks is to util ise an integrated EC model that allows for dynamic interactions between assets and liabilities under the EC shocks being considered. This implies that the model can:
• determine the impact on asset values of an EC shock;
• reflect changes in liability cash flows as a consequence of the asset value shock (e.g. for participating business); and
• revalue liabilities on a post-shock basis.
In order to produce a full distribution of EC results with an underlying MC balance sheet, stochastic-on-stochastic processing would be required, util ising a stochastic distribution of real world scenarios for the EC shocks (“outer stochastic loop”), and for each EC shock, determination of the post-shock MC value of l iabilities using a stochastic distribution of risk neutral scenarios (“inner stochastic loop”).
A traditional integrated asset-liability model (ALM) will be required for the inner stochastic loop, i.e. to produce the MC balance sheet (which underpins the mid-term and long-term EC basis). An ALM projects business over a run-off horizon, across a range of stochastic economic scenarios, allowing for application of dynamic management and policyholder actions (e.g. changes to bonus/crediting rates) resulting from changes in economic conditions implied by each scenario. Relatively minor extensions would be required to this traditional ALM functionality in order to be able to use the ALM to also calculate the impact of an EC shock.
The key advantage of using a fully integrated ALM to determine the base and post-shock MC balance sheets is that it allows for automation of the calculations. We do however recognise that developing a fully integrated ALM can be quite complex and can take time to implement.
It should also be noted that stochastic-on-stochastic EC solutions can be difficult to implement due to run time issues. However, a number of simplifications have been developed to address this (such as the use of replicating models whereby results of the inner stochastic loop are approximated using a replicating model at each point of the distribution represented by the outer stochastic loop, or via sophisticated aggregation methodologies that proxy full stochastic results).

Actuaries Summit 2013 24
© Towers Watson Australia Pty Ltd. All rights reserved.
4.2.2 Modelling of risk factors
Some insurers use a real world ESG to model asset risks. An ESG develops the dependency structure between risk factors using explicit known relationships within the structure of the ESG. For instance, exchange rates may be modelled using purchasing power parity and interest rate parity, therefore expressing exchange rates as a function of interest rate and inflation rate pairs. Given the relationships resulting from the ESG, it would be possible to derive relevant (simplified) correlations, over a one-year time horizon, if required.
Another commonly used method is to select statistical distributions to represent each of the asset risks modelled and to link them explicitly using a copula. Depending on the number of risk factors considered, this can result in a large number of dependencies to calibrate. One possible approach is that the first step could be to determine a priori dependency assumptions which will then be refined by investigation into data where possible. Those that are material should take a higher priority in investigations.
4.2.3 Asset risk factors
Table 4.1 below summarises the asset risks considered by APRA in the life insurance prudential standards (LPS) and the risks in the proposed Standard Formula under Solvency II. It is worth noting that the classification of some risks can differ between jurisdictions. For example, asset concentration risk is a separate module in Australia but included in asset risks under Solvency II proposals. For an EC model, the classification of risks will depend on factors such as what has historically been done and how the risks will be managed in the future.
Table 4.1
Asset risks considered by regulators
Australian LPS Solvency II Standard Formula (proposed)
Real interest rates Interest rates
Inflation Currency
Currency Equity
Equity Property
Property Credit spreads
Credit spreads Concentration
Default Illiquidity
While the risks considered by regulators can be used as a guide or starting point for determining the risk universe of the EC model, the insurer should tailor the set of risks to what is relevant and material. In keeping with the principle of EC as an
Actuaries Summit 2013 25
© Towers Watson Australia Pty Ltd. All rights reserved.
internal measure of risk, the definitions of each risk should also align with how the risks are reported and managed within the business.
Depending on the structure of the insurer and the materiality of each risk, a separate risk factor for each region may be appropriate (for example, Australian equities might be considered separately from Asian equities).
4.3 Insurance risks
As discussed in Section 3, four factors are commonly considered in relation to insurance risks:
• mis-estimation of the mean;
• trend and systemic risk;
• random fluctuations; and
• catastrophe (or event) risk.
Best practice in relation to insurance risks would be to consider all of the above elements of risk. Approaches may vary between these elements, and approaches may vary by type of risk (mortality, morbidity, longevity, lapse and expense).
Where the time horizon for the determination of EC is one year, random fluctuation and event risk would strictly apply for just the one year. The allowances for mis-estimation of the mean and trend and systemic risks also impact experience over the one-year horizon, but additionally, these components are commonly considered in calculating the post-shock balance sheet. Alternatively, total variation over a year can be considered in setting the assumptions underlying the post-shock balance sheet (on that basis that, in reality, it is not possible to disaggregate variation in experience into mis-estimation of the mean, trend and systemic risk and random fluctuation components).
In either case, there is a one-year impact, and the impact on the post-shock balance sheet. For example, higher than expected mortality claims will result in lower than expected profits. This translates into less assets being available at the end of the period. The second impact is that the experience that emerges will influence best estimate assumptions that would be set at the end of the period. It is these revised assumptions that would be util ised in the assessment of the end of period balance sheet.
The occurrence of an event risk would not necessarily influence the level of best estimate assumptions that would be adopted after the event has occurred. As such, the main concern for best estimate assumptions that would be set at the end of the period is in relation to the other three components (noting again that in practice these elements of variation would not be distinguishable).
Actuaries Summit 2013 26
© Towers Watson Australia Pty Ltd. All rights reserved.
Where a portfolio contains adjustable premium rates, it may be assumed that profitability will be restored over time. Consideration should be given to any limitations that may apply in practice (for example, if there are limitations to the amount by which premiums may be raised).
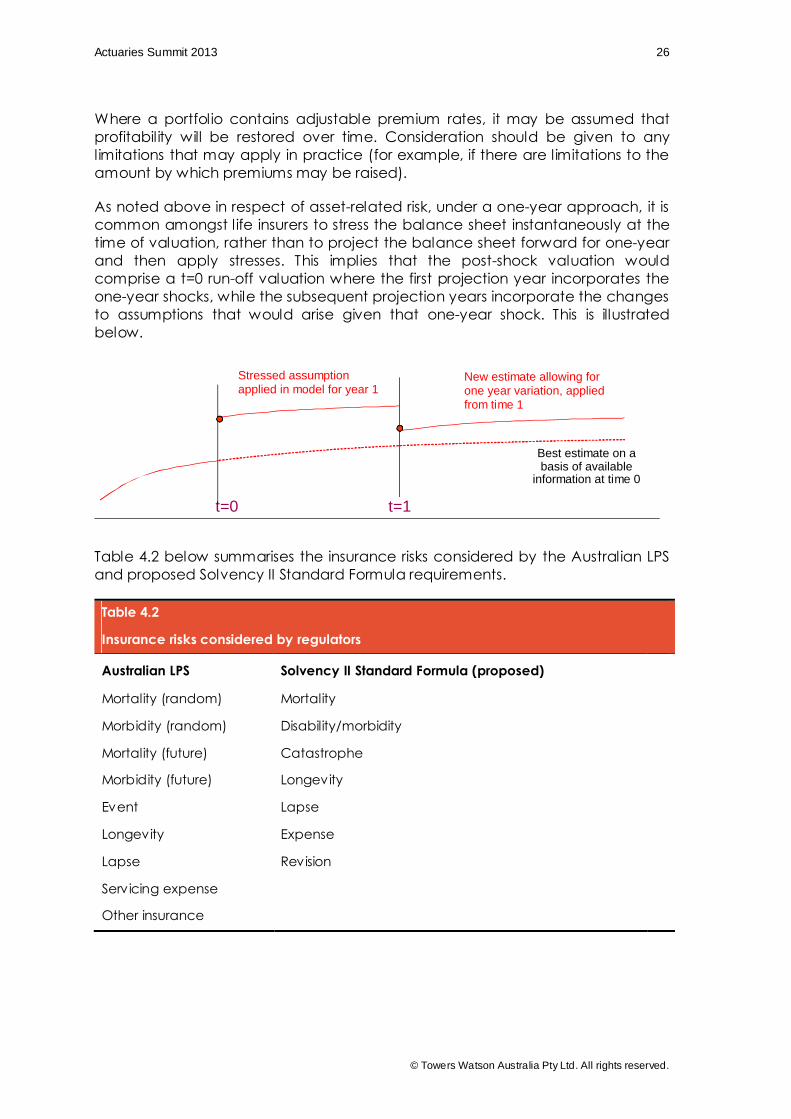
As noted above in respect of asset-related risk, under a one-year approach, it is common amongst l ife insurers to stress the balance sheet instantaneously at the time of valuation, rather than to project the balance sheet forward for one-year and then apply stresses. This implies that the post-shock valuation would comprise a t=0 run-off valuation where the first projection year incorporates the one-year shocks, while the subsequent projection years incorporate the changes to assumptions that would arise given that one-year shock. This is illustrated below.
Table 4.2 below summarises the insurance risks considered by the Australian LPS and proposed Solvency II Standard Formula requirements.
Table 4.2
Insurance risks considered by regulators
Australian LPS Solvency II Standard Formula (proposed)
Mortality (random) Mortality
Morbidity (random) Disability/morbidity
Mortality (future) Catastrophe
Morbidity (future) Longevity
Event Lapse
Longevity Expense
Lapse Revision
Servicing expense
Other insurance
Stressed assumption applied in model for year 1
New estimate allowing for one year variation, applied from time 1
t=0 t=1
Best estimate on a basis of available
information at time 0
Actuaries Summit 2013 27
© Towers Watson Australia Pty Ltd. All rights reserved.
4.4 Operational risks
As previously mentioned, companies typically do not have sufficient information upon which to base a statistical analysis or against which to calibrate a stress basis.
Factor-based approaches that are util ised are usually not complex. Typically, a limited number of factors (even as few as one or two) will be applied to broad business volume measures (such as premium or reserve levels). There may be qualitative aspects to the basis for operational risk, such as consideration of whether operational risk levels are at “normal” or “elevated” levels. Additional EC may be held if risk levels are assessed to be above normal level.
One useful source of information for EC purposes is a risk register. A risk register is typically maintained within the environment of an overarching risk management framework.
One possible approach to follow in developing a risk register is:
• develop risk maps and identify possible risks;
• screen possible risks to reduce the initial l ist to a manageable number of potentially significant risks;
• develop templates to capture information relating to the risks that are identified;
• conduct interviews with operational staff to gather data on processes and controls to develop “strawman” risk scenarios;
• review and discuss the scenarios in risk assessment workshops to quantify potential losses and identify potential risk mitigants/hedges; and
• summarise the results in a risk register, and document the methodology and analysis.
The risk register should be continually updated and refined, with a review of key risks and associated controls taking place at least annually. Most benefit will be derived if the risk register is used as a basis for understanding the risks faced and for monitoring and managing risk.
Risks that are higher in l ikelihood and lower in consequence may be reflected in other areas, such as the claim and expense experience, and thus already be reflected in the related assumptions. Therefore, it is important to ensure that there is no double counting of risks.
Regulatory capital requirements in relation to operational risk, where they exist, are often factor based. This is the case for the new prudential standards set out by the Australian Prudential Regulatory Authority (APRA) and the Standard

Actuaries Summit 2013 28
© Towers Watson Australia Pty Ltd. All rights reserved.
Formula under Solvency II. APRA considers elements based on premium and reserves. The Solvency II Standard Formula for operational risks takes into consideration elements based on premiums, reserves, expenses and the Basic Solvency Capital Requirement. Both the Australian LPS and Solvency II proposals may result in higher capital requirements when there have been large changes in business volumes in the year prior to the point of capital evaluation.

Actuaries Summit 2013 29
© Towers Watson Australia Pty Ltd. All rights reserved.
Section 5: Uses of EC
Implementation of EC will only add value if it is used effectively within the business operations of an insurer. As well as contributing to improved risk-based decision making, business util isation of EC is generally looked upon favourably by rating agencies and is required under a number of regulatory regimes (e.g., UK Individual Capital Adequacy Standards and Solvency II). The rationale for such business util isation is the expectation that regulators and rating agencies will recognise the EC results. So obtaining maximum benefit from EC requires both internal util isation and external recognition.
For Australian insurers without the ability to use internal models for regulatory capital purposes, there is still merit in adopting an internal measure as one element in a multi-peak target capital basis. However, given the strength of the Australian regulatory capital basis, and the general aversion to the risk of breaching regulatory capital, it would be unusual for a pure EC measure to dominate the target capital basis. The information gained from calculating EC can nevertheless provide a range of insights, from pointing out potentially unnecessary areas of conservatism in the regulatory capital basis, to assisting with decision-making in areas where other capital metrics may not provide a guide.
Having said that, target surplus (a target buffer above regulatory required capital to provide a level of confidence that regulatory capital will be met over a given time horizon) is a form of EC, albeit not a particularly “economic” form.
The principal areas in which EC can be used within an insurance business are considered below.
5.1 Capital adequacy
At the most basic level, the most common use of EC by insurers is as a measure of capital adequacy that provides a pure view of the risks faced by the insurer’s portfolio. EC removes distortions (such as undue conservatism) in regulatory capital basis and allows a consistent basis to be applied across l ines of business and across industries. This is particularly relevant in markets where the regulatory capital basis is relatively weak.
In order for EC to be effective as a measure of capital adequacy, it needs to be embedded into the capital management process, either as the primary driver of actual levels of capital, or as a capital metric used in business processes (such as pricing or performance measurement).
Typically, actual capital is targeted to remain within a band based on the EC calculation, with action being taken if EC falls outside this band; either to raise or refund capital or to modify the risk profile of the company to align it better with the available capital. The ERM framework documentation would specify the target bands and the remedial/reporting actions required should actual capital fall outside the band.

Actuaries Summit 2013 30
© Towers Watson Australia Pty Ltd. All rights reserved.
Even where EC does not ultimately define the level of capital that an insurer holds, it can still play a significant role in presentations to shareholders and investment analysts, typically as part of the insurer’s overall risk and financial management framework.
5.2 Risk monitoring and control
EC is a key measure of risk from a policyholder perspective and therefore frequently features as an important component of an insurer’s risk appetite framework and in the risk measurement and monitoring processes implemented to ensure the insurer remains within that risk appetite. Target bands for EC util isation should be established for each segment of interest such as geography, business unit and/or risk. Actual EC needs to be allocated down to these categories and monitored against these target ranges (for example using a risk dashboard). The setting of such ranges and limits needs to take into account the expected level of diversification between risks while bearing in mind the potential variation that can occur within segments due to business decisions that fall under the authority given to each of the segments.
So, for example, if business unit A is exposed primarily to equity market falls and business unit B to mortality risk, a reasonable level of diversification might be allowed in setting the EC limits for the two business units. If, however, the structure of the limits and controls allows business unit B to take on equity market risk, it would be prudent to allow for a lower level of diversification in setting the limits for the two businesses.
Util isation of EC for this purpose requires an ability to update EC (and available capital) on a frequent basis to reflect the changing risk profile of the organisation. This potentially implies daily updating for market risk movements, albeit with some level of approximation.
5.3 Performance measurement and management
Improved performance measurement is often one of the most commonly cited reasons given by companies for wanting to calculate EC. The Towers Watson Global ERM Survey in 2010 showed that 65% of respondents were either using EC in performance management or were planning to use in the next 24 months. In broad terms, a higher level of EC for one business unit compared to another signifies a higher level of risk and therefore suggests that a higher level of reward should be expected. At a more detailed level, however, insurers are exposed to risks of many types, with the balance varying significantly between business units, and it is generally accepted that the appropriate level of reward for risk varies by the nature of that risk. In particular, diversifiable risks attract lower returns than those that cannot be diversified (often referred to as systematic risks). There may also be strategic reasons to focus on or avoid particular risks.
The use of EC allows the quantification of the cost or benefits of business decisions. It is important to note that, by itself, EC does not represent a measure of business performance, but rather gives a measure of the risk related to the

Actuaries Summit 2013 31
© Towers Watson Australia Pty Ltd. All rights reserved.
business. In order to use EC to measure performance, it needs to be incorporated in, or combined with, some related measure of return. In practice, there are two broad approaches adopted by companies when using EC in performance measurement.
One approach involves calculating a return on capital, using EC as the (risk-adjusted) capital measure in the denominator of the calculation. This is a measure of Return on Risk-Adjusted Capital (RORAC). An appropriate measure of return to be used in the formula needs to be determined and whether this also needs to be risk adjusted (taking into account the nature of the risks in each business segment). The measure of return and types of adjustments used will have a critical impact on the results and on the relative perception of different business units. A true economic measure of performance requires an economic return to be used.
An alternative approach to measuring performance on a risk-adjusted basis involves using EC as the measure of required capital within a value-based measure, such as embedded value (EV).
The EC-based performance measures mentioned above are also starting to be used in incentive compensation schemes, although this has not been that common to date. The inclusion of these performance measures within executive compensation schemes could be a good indicator of whether EC, and ERM more generally, is fully embedded within the business.
5.4 Risk-based decision making
EC is frequently incorporated in key risk-based decision processes such as strategic asset allocation, more detailed asset/liability management, reinsurance strategy, pricing or merger and acquisition activities. Such decisions impact an insurer’s risk profile, and EC provides a consistent basis for assessing risk across risk types and lines of business to aid in decisions-making.
5.5 Business and strategic planning
If EC is adopted as the measure of capital that the business needs to hold, it is only natural that it should be included within strategic and business planning processes. In this way the economic impact on capital requirements of alternative strategies and business plans (including alternative product mixes and volumes) can be assessed. The assessment of alternative strategies and plans would include the impact of the change in risks faced as represented by the impact on EC, measured against the change in value or return. A clear expression of risk strategy and risk appetite is therefore important in guiding decisions around appropriate value creation.
In practice, projecting EC requirements, particularly for a large number of strategic or business plan options, can be demanding on system resources unless systems are designed specifically for the purpose. Consequently most insurers project EC only on an approximate basis for these purposes.

Actuaries Summit 2013 32
© Towers Watson Australia Pty Ltd. All rights reserved.
Section 6: Prevalence of EC in the Australian market
EC concepts are widely applied throughout the Australian life insurance industry for a variety of purposes and audiences. Methodologies and calculation techniques adopted vary depending on, amongst others things, ownership structure, size and business l ines written.
Australian life companies undertake a variety of capital calculations including regulatory capital, internal target surplus and group capital assessments.
6.1 Regulatory capital
The new Australian life insurance capital standards introduced in 2013 incorporate a number of key EC concepts in the determination of regulatory capital. The new capital standards also reinforce broad ERM requirements that position capital as part of an overarching ERM framework.
The insurance capital standards are based on a three-pillar supervisory framework.
Pillar 1: Quantitative requirements: required capital, available capital and the quality of the capital base
Pillar 2: Qualitative requirements and regulatory supervision: internal risk and capital assessment, supervisory review process and the potential for a supervisory adjustment
Pillar 3: Reporting requirements: supervisory reporting and public disclosure
6.1.1 Pillar 1
The new insurance capital standards have been written to allow required capital to be determined either by applying the Standard Method or by using an Internal Model-based Method or a combination of the two. However, there is no facility at present for l ife insurers to use an internal model (even though such a facility exists for general insurers and approved deposit-taking institutions).
The Standard Method set out in Prudential Standard LPS 110 – Capital Adequacy (LPS110) incorporates a number of EC concepts. The Standard Method is developed from an adjusted balance sheet, and is based on a one-year mark-to-market approach. The VaR at a 99.5% level of security is assessed under a number of deterministic stresses. Risks covered by the prescribed stresses include:
• asset risks - real interest rates, expected inflation, currency, equity, property, credit spread and default; and
• insurance risk - mortality, morbidity, longevity, persistency, servicing expenses and other insurance risks such as option take-ups.

Actuaries Summit 2013 33
© Towers Watson Australia Pty Ltd. All rights reserved.
Other risks covered by the Standard Method include operational risk and asset concentration risk. However, capital charges in respect of these risks are factor-based (in the case of operational risk) or are applied via admissibil ity l imits (in the case of asset concentration risk).
Aggregation of asset and insurance risk capital charges is done via a single combined scenario based on single risk stresses and prescribed diversification allowances.
6.1.2 Pillar 2
In addition to prescribing a level of regulatory capital, LPS110 also requires the life company to have in place an Internal Capital Adequacy Assessment Process (ICAAP) that considers each fund of the life company as well as the company as a whole. The ICAAP forms a core part of Pillar 2 of the supervisory framework.
As its name suggests, the ICAAP is the process by which the insurer ensures that it operates with an appropriate level of capital above the minimum level of regulatory capital. It consists of both quantitative aspects in terms of a target level of capital and qualitative aspects which cover items such as risk management policies and controls, board approval processes and alignment of the insurer’s risks with risk appetite.
APRA released Prudential Practice Guide CPG 110 – Internal Capital Adequacy Assessment Process and Supervisory Review (CPG 110) in March 2013 which sets out guidance to insurers for the development of the ICAAP. CPG 110 notes the following:
As the quote above states, capital targets should be set based on an insurer’s own assessments of its capital needs. Given that the ICAAP is fundamentally about how a company manages its risk exposures, it makes sense that the level of detail will vary depending on the nature, complexity and scale of the risks inherent in an individual business. While the basis of the capital target is not prescribed, this definition of capital prompts consideration of a true form of EC. The quote below from CPG 110 supports highlights the possibil ity of using an EC model to calculate target capital, especially for insurers that are more sophisticated.
“The capital standards require a regulated institution…to set capital targets based on its own assessments of its capital needs. Capital targets will have regard to, but not be set solely by reference to, regulatory capital requirements.”
CPG 110, paragraph 19
“… While APRA does not require an economic capital model to be used, a more sophisticated institution may choose to use such a model as well as stress testing.”
CPG 110, paragraph 22

Actuaries Summit 2013 34
© Towers Watson Australia Pty Ltd. All rights reserved.
On top of the ICAAP requirements, the use of EC could inform business decisions to aid in the selection of risks and optimisation of investments and product portfolios.
6.2 Life company target surplus
Internal target surplus calculations, as described above, have long been a part of l ife company prudential capital. There has been a degree of convergence of practice over the years, with target surplus commonly being a form of EC assessed against a regulatory capital base balance sheet.
6.3 Group capital requirements
Australian life companies that are part of a larger group (both the bank owned insurers and the subsidiaries of the multi-nationals) often calculate EC, although often the primary use of these results is for reporting to the parent entity. Further, it is expected that ICAAP requirements will extend to the group level from 1 January 2014. The use of EC could be applied at this level, which would bring about the benefits of managing the whole group in a consistent manner.