Embed Size (px)
Citation preview
MILLIMAN RESEARCH REPORT
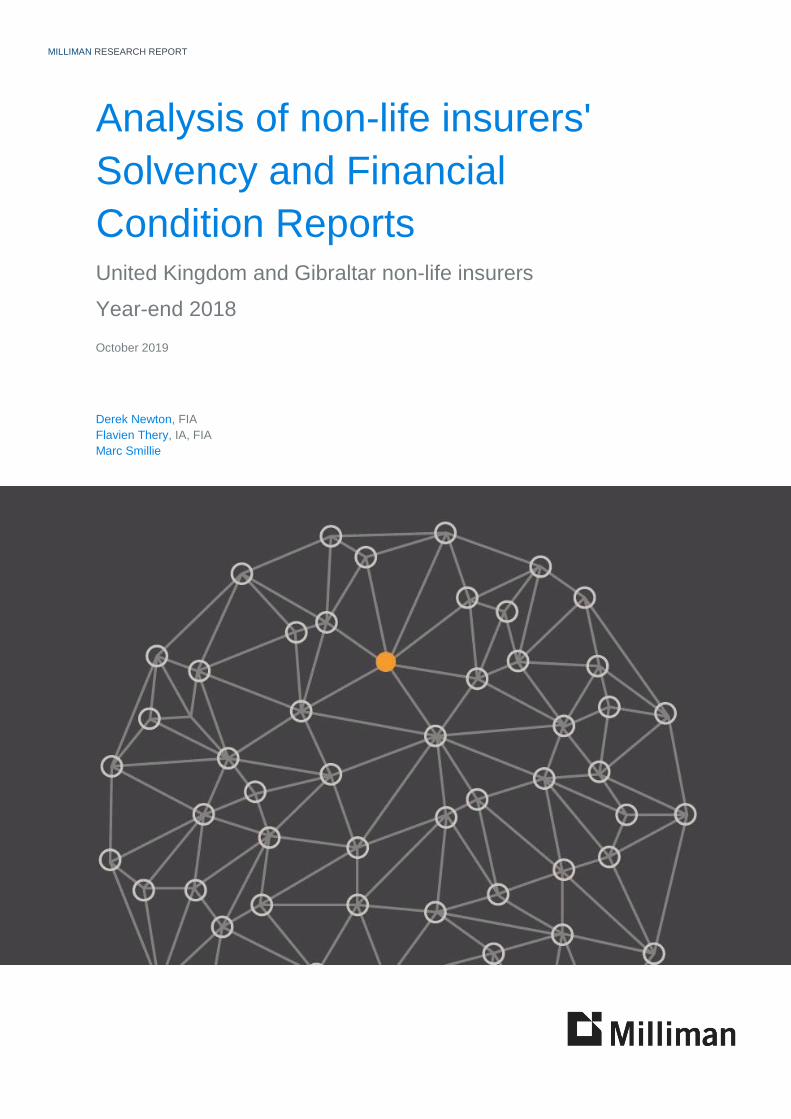
Analysis of non-life insurers'
Solvency and Financial
Condition Reports United Kingdom and Gibraltar non-life insurers
Year-end 2018
October 2019
Derek Newton, FIA
Flavien Thery, IA, FIA
Marc Smillie
MILLIMAN RESEARCH REPORT
Table of Contents
INTRODUCTION ..................................................................................................................................................... 6
UNITED KINGDOM MARKET COVERAGE ....................................................................................................... 6
UNITED KINGDOM (INCL. GIBRALTAR) NON-LIFE UNDERTAKINGS .............................................................. 7
SOLVENCY COVERAGE RATIOS: HOW DID THE MARKET DO? HOW SOLVENT IS THE MARKET? ........ 7
ANALYSIS OF SCR AND MCR: WHERE IS THE RISK? ................................................................................ 11
ANALYSIS OF OWN FUNDS ........................................................................................................................... 15
ANALYSIS OF MAIN BALANCE SHEET ITEMS ............................................................................................. 16
Assets ..................................................................................................................................................... 16
Technical provisions ............................................................................................................................... 17
ANALYSIS OF UNDERWRITING .................................................................................................................... 19
APPENDIX A: LIST OF ENTITIES WHOSE DATA WAS INCLUDED WITHIN THE ANALYSIS ........................ 25
MILLIMAN RESEARCH REPORT
Analysis of Non-Life Insurer's 6 September 2019
Solvency and Financial Condition Reports
Introduction
Three years have passed: Where are we?
In 2019, following initial publication in 2017, (re)insurance undertakings across the EU published their third set of
Solvency II public reports, the Solvency and Financial Condition Reports (SFCRs). In this report, we summarise
those SFCRs as they relate to non-life insurers regulated in the UK or in Gibraltar, and set out the results of our
analyses of the reports. This includes comparison of the 2018 year-end SFCRs with the 2017 and 2016 year-end
SFCRs.
The analyses underlying this report focus on the quantitative information contained in the Quantitative Reporting
Templates (QRTs) within the SFCRs, but we have also studied the text within the SFCRs in order to gain
additional insights into various companies, in particular those that displayed characteristics that differed materially
from the market average. Our focus is on solo entities rather than groups.
Our report is laid out as follows:
We first analyse the solvency position of the market as a whole, before taking a closer look at the top 30
players, by gross written premium (GWP).
We then look at the components of the Solvency Capital Requirement (SCR), for the market as a whole and
individually for the top 30, and the quality of the components of the own funds.
Our report continues with an analysis of the main Solvency II balance sheet items, including invested assets
and technical provisions.
Finally, we look at some underwriting key performance indicators, such as loss ratios and operating margins,
split by Solvency II line of business.
UNITED KINGDOM MARKET COVERAGE
Our analyses are based upon the SFCRs for 135 solo companies which are pursuing primarily non-life business
in the UK and which are regulated in either the UK or Gibraltar. In aggregate, these companies represent over
90% of the GWP of the UK non-life direct market.
The Society of Lloyd’s produces a single publicly available SFCR, covering in aggregate all of its syndicates. We
have excluded it from our study, because of its size compared with the rest of the market, because much of its
activities relate to insurance coverage outside of the UK, and because it contains significant reinsurance and
retrocessional business. The Society of Lloyd’s represents £37 billion of GWP and £55 billion of gross technical
provisions (compared with a total £66 billion of GWP and £99 billion of gross technical provisions for the 135 solo
companies that we analysed), and exhibits a solvency coverage ratio of 148% (made up of £26 billion of eligible
own funds and £18 billion of SCR).
Appendix A contains a list of all of the companies that were included in our analysis.
The data analysed in this report has been sourced from Solvency II Wire Data and companies’ disclosed SCFRs.
The data is available via subscription from: https://solvencyiiwiredata.com/about/.
MILLIMAN RESEARCH REPORT
Analysis of Non-Life Insurers’ Solvency and Financial Condition Reports 7 October 2019
United Kingdom and Gibraltar insurers
United Kingdom (incl. Gibraltar) non-life undertakings SOLVENCY COVERAGE RATIOS: HOW DID THE MARKET DO? HOW SOLVENT IS THE MARKET?
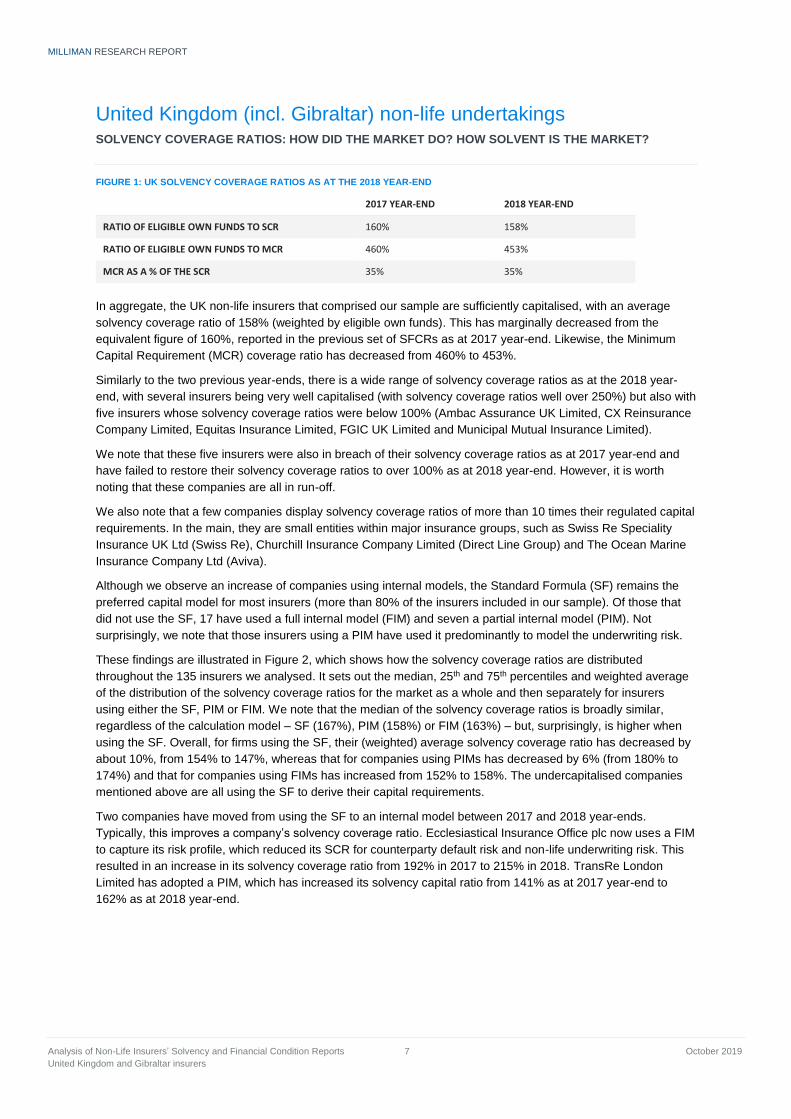
FIGURE 1: UK SOLVENCY COVERAGE RATIOS AS AT THE 2018 YEAR-END
2017 YEAR-END 2018 YEAR-END
RATIO OF ELIGIBLE OWN FUNDS TO SCR 160% 158%
RATIO OF ELIGIBLE OWN FUNDS TO MCR 460% 453%
MCR AS A % OF THE SCR 35% 35%
In aggregate, the UK non-life insurers that comprised our sample are sufficiently capitalised, with an average
solvency coverage ratio of 158% (weighted by eligible own funds). This has marginally decreased from the
equivalent figure of 160%, reported in the previous set of SFCRs as at 2017 year-end. Likewise, the Minimum
Capital Requirement (MCR) coverage ratio has decreased from 460% to 453%.
Similarly to the two previous year-ends, there is a wide range of solvency coverage ratios as at the 2018 year-
end, with several insurers being very well capitalised (with solvency coverage ratios well over 250%) but also with
five insurers whose solvency coverage ratios were below 100% (Ambac Assurance UK Limited, CX Reinsurance
Company Limited, Equitas Insurance Limited, FGIC UK Limited and Municipal Mutual Insurance Limited).
We note that these five insurers were also in breach of their solvency coverage ratios as at 2017 year-end and
have failed to restore their solvency coverage ratios to over 100% as at 2018 year-end. However, it is worth
noting that these companies are all in run-off.
We also note that a few companies display solvency coverage ratios of more than 10 times their regulated capital
requirements. In the main, they are small entities within major insurance groups, such as Swiss Re Speciality
Insurance UK Ltd (Swiss Re), Churchill Insurance Company Limited (Direct Line Group) and The Ocean Marine
Insurance Company Ltd (Aviva).
Although we observe an increase of companies using internal models, the Standard Formula (SF) remains the
preferred capital model for most insurers (more than 80% of the insurers included in our sample). Of those that
did not use the SF, 17 have used a full internal model (FIM) and seven a partial internal model (PIM). Not
surprisingly, we note that those insurers using a PIM have used it predominantly to model the underwriting risk.
These findings are illustrated in Figure 2, which shows how the solvency coverage ratios are distributed
throughout the 135 insurers we analysed. It sets out the median, 25th and 75th percentiles and weighted average
of the distribution of the solvency coverage ratios for the market as a whole and then separately for insurers
using either the SF, PIM or FIM. We note that the median of the solvency coverage ratios is broadly similar,
regardless of the calculation model – SF (167%), PIM (158%) or FIM (163%) – but, surprisingly, is higher when
using the SF. Overall, for firms using the SF, their (weighted) average solvency coverage ratio has decreased by
about 10%, from 154% to 147%, whereas that for companies using PIMs has decreased by 6% (from 180% to
174%) and that for companies using FIMs has increased from 152% to 158%. The undercapitalised companies
mentioned above are all using the SF to derive their capital requirements.
Two companies have moved from using the SF to an internal model between 2017 and 2018 year-ends.
Typically, this improves a company’s solvency coverage ratio. Ecclesiastical Insurance Office plc now uses a FIM
to capture its risk profile, which reduced its SCR for counterparty default risk and non-life underwriting risk. This
resulted in an increase in its solvency coverage ratio from 192% in 2017 to 215% in 2018. TransRe London
Limited has adopted a PIM, which has increased its solvency capital ratio from 141% as at 2017 year-end to
162% as at 2018 year-end.
MILLIMAN RESEARCH REPORT
Analysis of Non-Life Insurers’ Solvency and Financial Condition Reports 8 October 2019
United Kingdom and Gibraltar insurers
FIGURE 2: DISTRIBUTION OF SOLVENCY COVERAGE RATIOS AT 2018 YEAR-END
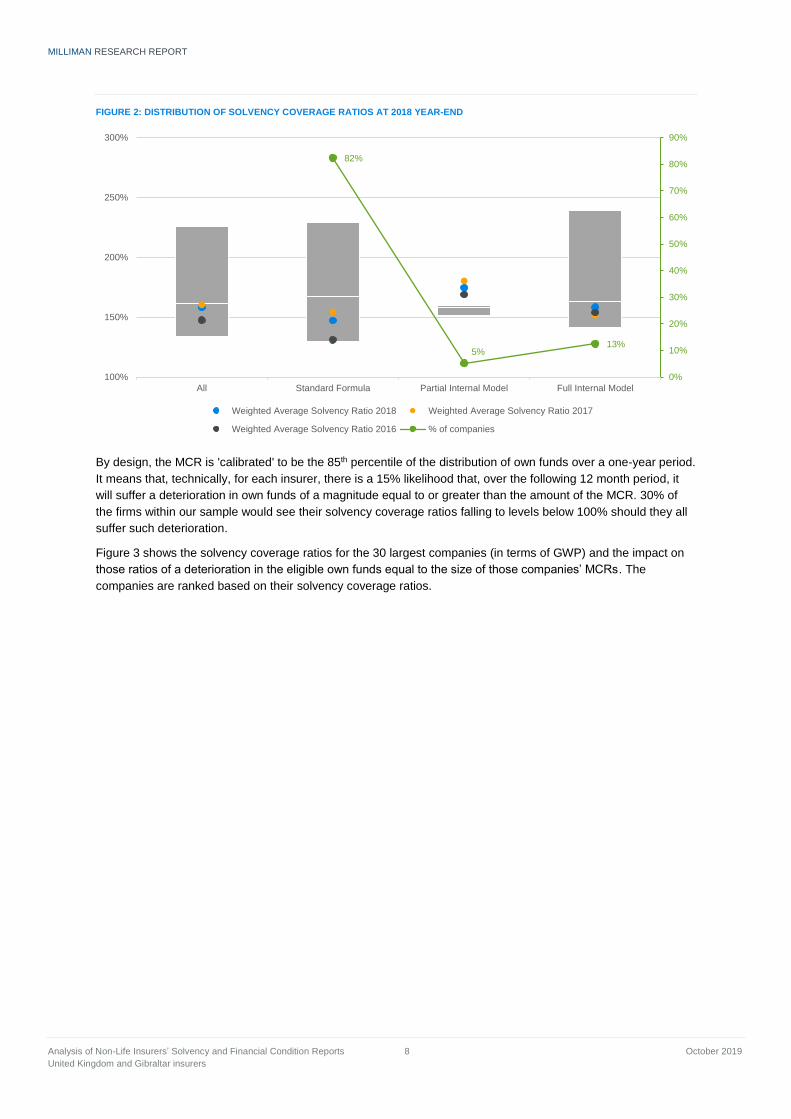
By design, the MCR is 'calibrated' to be the 85th percentile of the distribution of own funds over a one-year period.
It means that, technically, for each insurer, there is a 15% likelihood that, over the following 12 month period, it
will suffer a deterioration in own funds of a magnitude equal to or greater than the amount of the MCR. 30% of
the firms within our sample would see their solvency coverage ratios falling to levels below 100% should they all
suffer such deterioration.
Figure 3 shows the solvency coverage ratios for the 30 largest companies (in terms of GWP) and the impact on
those ratios of a deterioration in the eligible own funds equal to the size of those companies’ MCRs. The
companies are ranked based on their solvency coverage ratios.
82%
5%13%
0%
10%
20%
30%
40%
50%
60%
70%
80%
90%
100%
150%
200%
250%
300%
All Standard Formula Partial Internal Model Full Internal Model
Weighted Average Solvency Ratio 2018 Weighted Average Solvency Ratio 2017
Weighted Average Solvency Ratio 2016 % of companies
MILLIMAN RESEARCH REPORT
Analysis of Non-Life Insurers’ Solvency and Financial Condition Reports 9 October 2019
United Kingdom and Gibraltar insurers
FIGURE 3: SOLVENCY COVERAGE RATIOS BOTH BEFORE AND AFTER A LOSS EQUAL TO THE MCR, GWP TOP 30
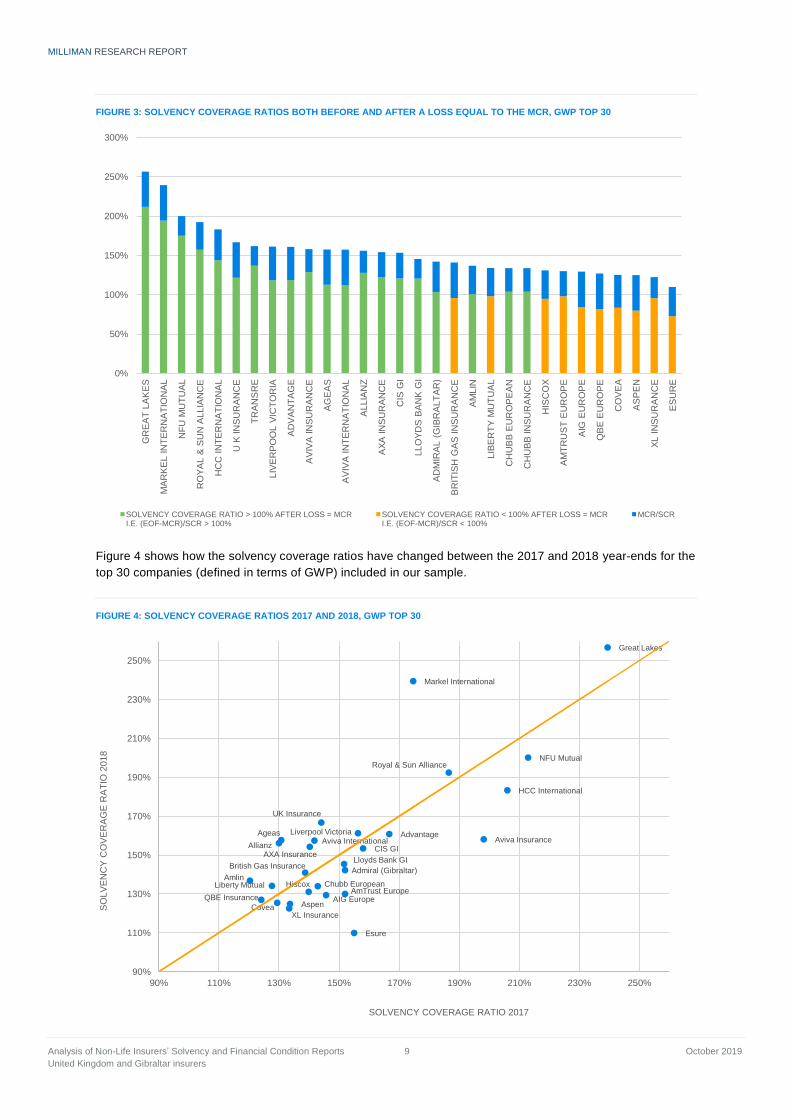
Figure 4 shows how the solvency coverage ratios have changed between the 2017 and 2018 year-ends for the
top 30 companies (defined in terms of GWP) included in our sample.
FIGURE 4: SOLVENCY COVERAGE RATIOS 2017 AND 2018, GWP TOP 30
0%
50%
100%
150%
200%
250%
300%G
RE
AT
LA
KE
S
MA
RK
EL I
NT
ER
NA
TIO
NA
L
NF
U M
UT
UA
L
RO
YA
L &
SU
N A
LLIA
NC
E
HC
C IN
TE
RN
AT
ION
AL
U K
IN
SU
RA
NC
E
TR
AN
SR
E
LIV
ER
PO
OL V
ICT
OR
IA
AD
VA
NT
AG
E
AV
IVA
IN
SU
RA
NC
E
AG
EA
S
AV
IVA
IN
TE
RN
AT
ION
AL
ALLIA
NZ
AX
A I
NS
UR
AN
CE
CIS
GI
LLO
YD
S B
AN
K G
I
AD
MIR
AL (
GIB
RA
LT
AR
)
BR
ITIS
H G
AS
IN
SU
RA
NC
E
AM
LIN
LIB
ER
TY
MU
TU
AL
CH
UB
B E
UR
OP
EA
N
CH
UB
B IN
SU
RA
NC
E
HIS
CO
X
AM
TR
US
T E
UR
OP
E
AIG
EU
RO
PE
QB
E E
UR
OP
E
CO
VE
A
AS
PE
N
XL I
NS
UR
AN
CE
ES
UR
E
SOLVENCY COVERAGE RATIO > 100% AFTER LOSS = MCRI.E. (EOF-MCR)/SCR > 100%
SOLVENCY COVERAGE RATIO < 100% AFTER LOSS = MCRI.E. (EOF-MCR)/SCR < 100%
MCR/SCR
Admiral (Gibraltar)
AdvantageAgeas
AIG Europe
Allianz
Amlin
AmTrust Europe
Aspen
Aviva InsuranceAviva International
AXA Insurance
British Gas Insurance
Chubb European
CIS GI
Covea
Esure
Great Lakes
HCC International
HiscoxLiberty Mutual
Liverpool Victoria
Lloyds Bank GI
Markel International
QBE Insurance
Royal & Sun AllianceNFU Mutual
UK Insurance
XL Insurance
90%
110%
130%
150%
170%
190%
210%
230%
250%
90% 110% 130% 150% 170% 190% 210% 230% 250%
SO
LV
EN
CY
CO
VE
RA
GE
RA
TIO
2018
SOLVENCY COVERAGE RATIO 2017
MILLIMAN RESEARCH REPORT
Analysis of Non-Life Insurers’ Solvency and Financial Condition Reports 10 October 2019
United Kingdom and Gibraltar insurers
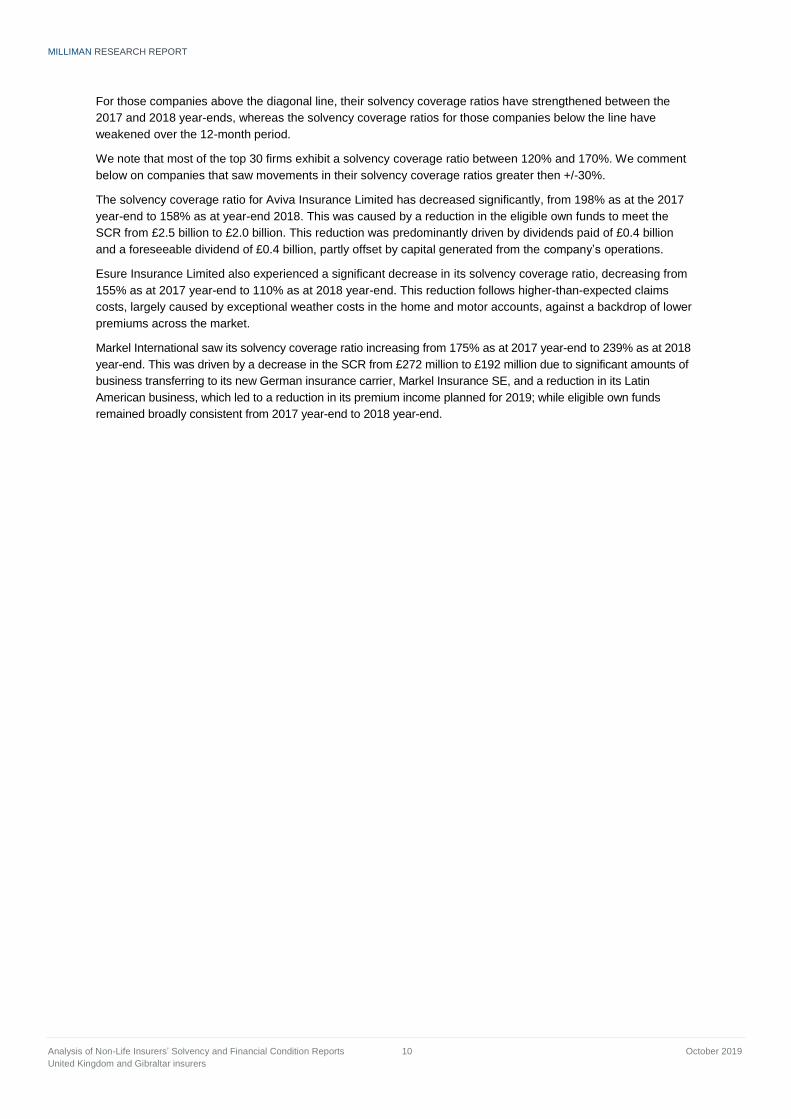
For those companies above the diagonal line, their solvency coverage ratios have strengthened between the
2017 and 2018 year-ends, whereas the solvency coverage ratios for those companies below the line have
weakened over the 12-month period.
We note that most of the top 30 firms exhibit a solvency coverage ratio between 120% and 170%. We comment
below on companies that saw movements in their solvency coverage ratios greater then +/-30%.
The solvency coverage ratio for Aviva Insurance Limited has decreased significantly, from 198% as at the 2017
year-end to 158% as at year-end 2018. This was caused by a reduction in the eligible own funds to meet the
SCR from £2.5 billion to £2.0 billion. This reduction was predominantly driven by dividends paid of £0.4 billion
and a foreseeable dividend of £0.4 billion, partly offset by capital generated from the company’s operations.
Esure Insurance Limited also experienced a significant decrease in its solvency coverage ratio, decreasing from
155% as at 2017 year-end to 110% as at 2018 year-end. This reduction follows higher-than-expected claims
costs, largely caused by exceptional weather costs in the home and motor accounts, against a backdrop of lower
premiums across the market.
Markel International saw its solvency coverage ratio increasing from 175% as at 2017 year-end to 239% as at 2018
year-end. This was driven by a decrease in the SCR from £272 million to £192 million due to significant amounts of
business transferring to its new German insurance carrier, Markel Insurance SE, and a reduction in its Latin
American business, which led to a reduction in its premium income planned for 2019; while eligible own funds
remained broadly consistent from 2017 year-end to 2018 year-end.
MILLIMAN RESEARCH REPORT
Analysis of Non-Life Insurers’ Solvency and Financial Condition Reports 11 October 2019
United Kingdom and Gibraltar insurers
ANALYSIS OF SCR AND MCR: WHERE IS THE RISK?
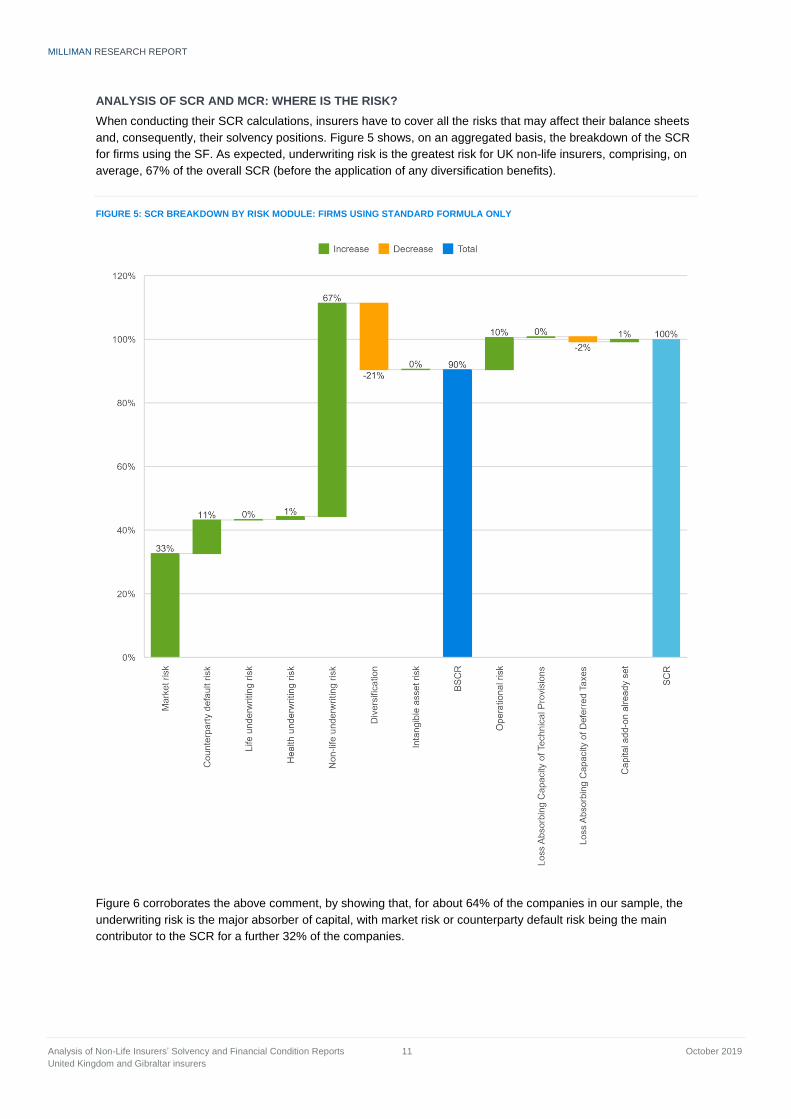
When conducting their SCR calculations, insurers have to cover all the risks that may affect their balance sheets
and, consequently, their solvency positions. Figure 5 shows, on an aggregated basis, the breakdown of the SCR
for firms using the SF. As expected, underwriting risk is the greatest risk for UK non-life insurers, comprising, on
average, 67% of the overall SCR (before the application of any diversification benefits).
FIGURE 5: SCR BREAKDOWN BY RISK MODULE: FIRMS USING STANDARD FORMULA ONLY
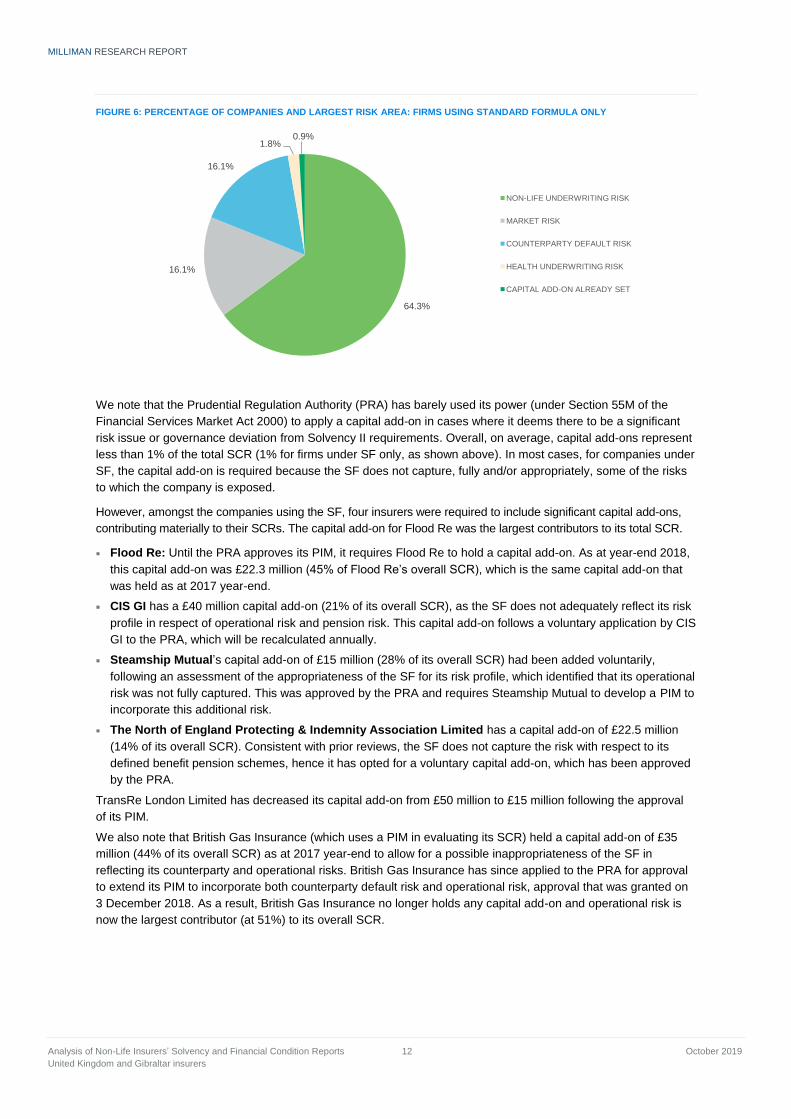
Figure 6 corroborates the above comment, by showing that, for about 64% of the companies in our sample, the
underwriting risk is the major absorber of capital, with market risk or counterparty default risk being the main
contributor to the SCR for a further 32% of the companies.
MILLIMAN RESEARCH REPORT
Analysis of Non-Life Insurers’ Solvency and Financial Condition Reports 12 October 2019
United Kingdom and Gibraltar insurers
FIGURE 6: PERCENTAGE OF COMPANIES AND LARGEST RISK AREA: FIRMS USING STANDARD FORMULA ONLY
We note that the Prudential Regulation Authority (PRA) has barely used its power (under Section 55M of the
Financial Services Market Act 2000) to apply a capital add-on in cases where it deems there to be a significant
risk issue or governance deviation from Solvency II requirements. Overall, on average, capital add-ons represent
less than 1% of the total SCR (1% for firms under SF only, as shown above). In most cases, for companies under
SF, the capital add-on is required because the SF does not capture, fully and/or appropriately, some of the risks
to which the company is exposed.
However, amongst the companies using the SF, four insurers were required to include significant capital add-ons,
contributing materially to their SCRs. The capital add-on for Flood Re was the largest contributors to its total SCR.
Flood Re: Until the PRA approves its PIM, it requires Flood Re to hold a capital add-on. As at year-end 2018,
this capital add-on was £22.3 million (45% of Flood Re’s overall SCR), which is the same capital add-on that
was held as at 2017 year-end.
CIS GI has a £40 million capital add-on (21% of its overall SCR), as the SF does not adequately reflect its risk
profile in respect of operational risk and pension risk. This capital add-on follows a voluntary application by CIS
GI to the PRA, which will be recalculated annually.
Steamship Mutual’s capital add-on of £15 million (28% of its overall SCR) had been added voluntarily,
following an assessment of the appropriateness of the SF for its risk profile, which identified that its operational
risk was not fully captured. This was approved by the PRA and requires Steamship Mutual to develop a PIM to
incorporate this additional risk.
The North of England Protecting & Indemnity Association Limited has a capital add-on of £22.5 million
(14% of its overall SCR). Consistent with prior reviews, the SF does not capture the risk with respect to its
defined benefit pension schemes, hence it has opted for a voluntary capital add-on, which has been approved
by the PRA.
TransRe London Limited has decreased its capital add-on from £50 million to £15 million following the approval
of its PIM.
We also note that British Gas Insurance (which uses a PIM in evaluating its SCR) held a capital add-on of £35
million (44% of its overall SCR) as at 2017 year-end to allow for a possible inappropriateness of the SF in
reflecting its counterparty and operational risks. British Gas Insurance has since applied to the PRA for approval
to extend its PIM to incorporate both counterparty default risk and operational risk, approval that was granted on
3 December 2018. As a result, British Gas Insurance no longer holds any capital add-on and operational risk is
now the largest contributor (at 51%) to its overall SCR.
64.3%
16.1%
16.1%
1.8%0.9%
NON-LIFE UNDERWRITING RISK
MARKET RISK
COUNTERPARTY DEFAULT RISK
HEALTH UNDERWRITING RISK
CAPITAL ADD-ON ALREADY SET
MILLIMAN RESEARCH REPORT
Analysis of Non-Life Insurers’ Solvency and Financial Condition Reports 13 October 2019
United Kingdom and Gibraltar insurers
From the above, we note that capital add-ons are generally set in agreement with the regulator. In addition, companies
that have a capital add-on requirement have disclosed their intentions to develop further their risk calculations in order
to reflect better their respective risk profiles and hence negate the need for any add-ons in the future. It also appears
that operational risk is often flagged in regards of the non-appropriateness of the SF and is therefore more likely to
attract capital add-ons than other risk modules. In addition, we believe that, with emerging risks like cyber or climate
change being increasingly scrutinised by the regulator, there will be a need in the future for more tailored calculations in
order to better reflect companies’ risk profiles.
We note in passing that greater transparency was expected regarding capital add-ons, as such information
should have been publicly available in the UK since 2018 year-end. However, we do not observe a significant
difference from last year’s trend in terms of the number of firms holding such additional capital, suggesting that
companies were already transparent in respect of their capital add-ons.
We also note that adjustments for the loss-absorbing capacity of deferred tax (LACDT), which reduce the SCRs,
totalled £864 million as at year-end 2018 (compared to £911 million as at year-end 2017), of which £198 million
relates to companies using the SF (£306 million as at year-end 2017). The Solvency II balance sheet indicates
that the net deferred tax liabilities1 for the whole market were £522 million, a decrease from £647 million as at
year-end 2017. Therefore, £342 million of the LACDT arose from either tax rules that allow companies to carry
back the 1-in-200-year instantaneous loss against taxable profit in the prior 12-month tax period or from expected
tax payable on future profits (following a 1-in-200-year instantaneous loss) over a reasonable timeframe. The
decrease observed in deferred tax benefits between year-ends 2017 and 2018 can be partially explained by the
entry into force of lower UK tax rates (19% as at April 2019 and 18% for the year starting in April 2020 onwards).
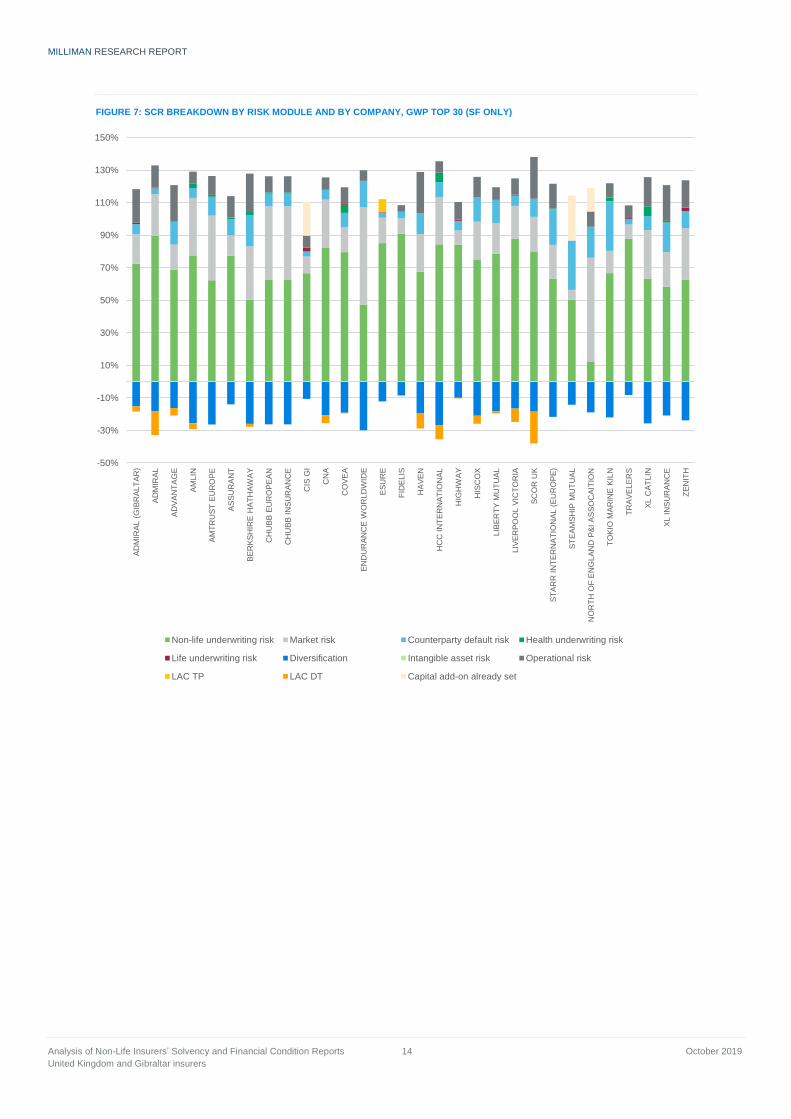
In Figure 7, we show the breakdown of SCRs for the 30 largest companies (in terms of GWP) within our sample
that use the SF. While underwriting risk is the predominant risk for most of the biggest firms, market risk seems to
attract a higher capital charge for a handful of insurers.
The counterparty default risk remains a low risk for UK non-life insurers, most of them having secured the bulk of
their outwards reinsurance from well-rated carriers and most having few bad debts.
1 We define net deferred tax liabilities as the maximum of zero and the deferred tax liabilities less the deferred tax assets.
MILLIMAN RESEARCH REPORT
Analysis of Non-Life Insurers’ Solvency and Financial Condition Reports 14 October 2019
United Kingdom and Gibraltar insurers
FIGURE 7: SCR BREAKDOWN BY RISK MODULE AND BY COMPANY, GWP TOP 30 (SF ONLY)
-50%
-30%
-10%
10%
30%
50%
70%
90%
110%
130%
150%A
DM
IRA
L (
GIB
RA
LT
AR
)
AD
MIR
AL
AD
VA
NT
AG
E
AM
LIN
AM
TR
US
T E
UR
OP
E
AS
SU
RA
NT
BE
RK
SH
IRE
HA
TH
AW
AY
CH
UB
B E
UR
OP
EA
N
CH
UB
B I
NS
UR
AN
CE
CIS
GI
CN
A
CO
VE
A
EN
DU
RA
NC
E W
OR
LD
WID
E
ES
UR
E
FID
EL
IS
HA
VE
N
HC
C IN
TE
RN
AT
ION
AL
HIG
HW
AY
HIS
CO
X
LIB
ER
TY
MU
TU
AL
LIV
ER
PO
OL
VIC
TO
RIA
SC
OR
UK
ST
AR
R I
NT
ER
NA
TIO
NA
L (
EU
RO
PE
)
ST
EA
MS
HIP
MU
TU
AL
NO
RT
H O
F E
NG
LA
ND
P&
I A
SS
OC
AIT
ION
TO
KIO
MA
RIN
E K
ILN
TR
AV
EL
ER
S
XL
CA
TL
IN
XL
IN
SU
RA
NC
E
ZE
NIT
H
Non-life underwriting risk Market risk Counterparty default risk Health underwriting risk
Life underwriting risk Diversification Intangible asset risk Operational risk
LAC TP LAC DT Capital add-on already set
MILLIMAN RESEARCH REPORT
Analysis of Non-Life Insurers’ Solvency and Financial Condition Reports 15 October 2019
United Kingdom and Gibraltar insurers
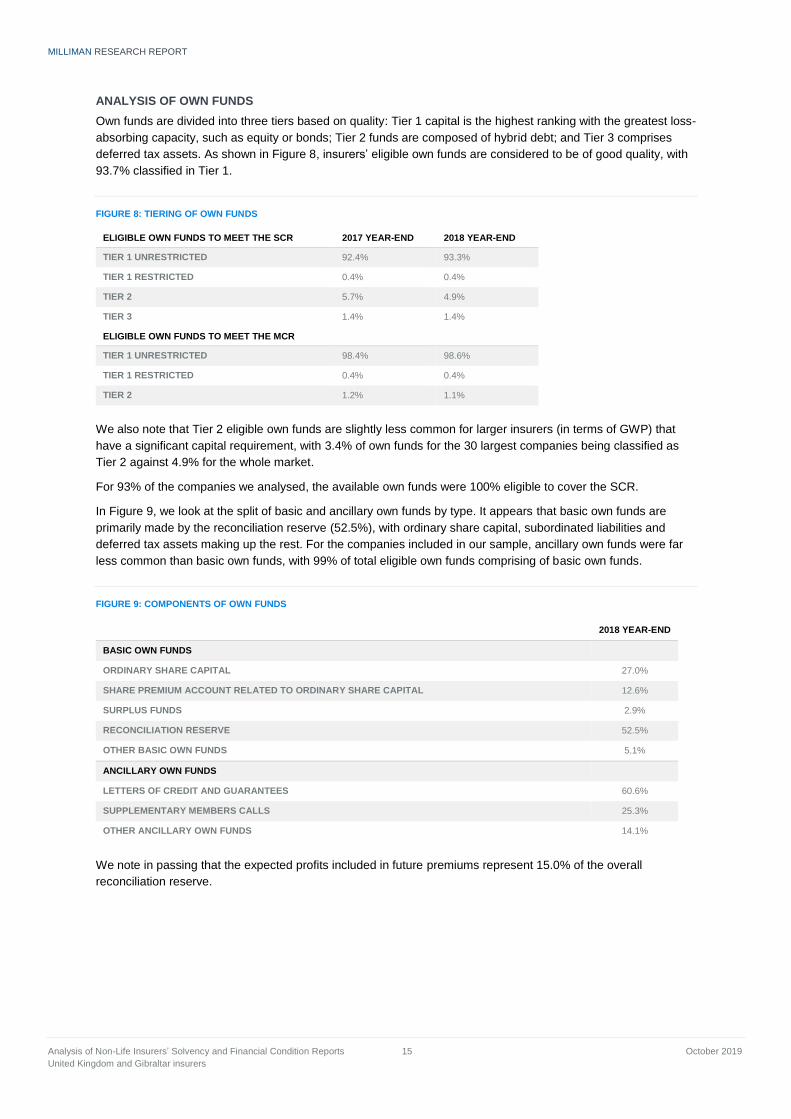
ANALYSIS OF OWN FUNDS
Own funds are divided into three tiers based on quality: Tier 1 capital is the highest ranking with the greatest loss-
absorbing capacity, such as equity or bonds; Tier 2 funds are composed of hybrid debt; and Tier 3 comprises
deferred tax assets. As shown in Figure 8, insurers’ eligible own funds are considered to be of good quality, with
93.7% classified in Tier 1.
FIGURE 8: TIERING OF OWN FUNDS
ELIGIBLE OWN FUNDS TO MEET THE SCR 2017 YEAR-END 2018 YEAR-END
TIER 1 UNRESTRICTED 92.4% 93.3%
TIER 1 RESTRICTED 0.4% 0.4%
TIER 2 5.7% 4.9%
TIER 3 1.4% 1.4%
ELIGIBLE OWN FUNDS TO MEET THE MCR
TIER 1 UNRESTRICTED 98.4% 98.6%
TIER 1 RESTRICTED 0.4% 0.4%
TIER 2 1.2% 1.1%
We also note that Tier 2 eligible own funds are slightly less common for larger insurers (in terms of GWP) that
have a significant capital requirement, with 3.4% of own funds for the 30 largest companies being classified as
Tier 2 against 4.9% for the whole market.
For 93% of the companies we analysed, the available own funds were 100% eligible to cover the SCR.
In Figure 9, we look at the split of basic and ancillary own funds by type. It appears that basic own funds are
primarily made by the reconciliation reserve (52.5%), with ordinary share capital, subordinated liabilities and
deferred tax assets making up the rest. For the companies included in our sample, ancillary own funds were far
less common than basic own funds, with 99% of total eligible own funds comprising of basic own funds.
FIGURE 9: COMPONENTS OF OWN FUNDS
2018 YEAR-END
BASIC OWN FUNDS
ORDINARY SHARE CAPITAL 27.0%
SHARE PREMIUM ACCOUNT RELATED TO ORDINARY SHARE CAPITAL 12.6%
SURPLUS FUNDS 2.9%
RECONCILIATION RESERVE 52.5%
OTHER BASIC OWN FUNDS 5.1%
ANCILLARY OWN FUNDS
LETTERS OF CREDIT AND GUARANTEES 60.6%
SUPPLEMENTARY MEMBERS CALLS 25.3%
OTHER ANCILLARY OWN FUNDS 14.1%
We note in passing that the expected profits included in future premiums represent 15.0% of the overall
reconciliation reserve.
MILLIMAN RESEARCH REPORT
Analysis of Non-Life Insurers’ Solvency and Financial Condition Reports 16 October 2019
United Kingdom and Gibraltar insurers
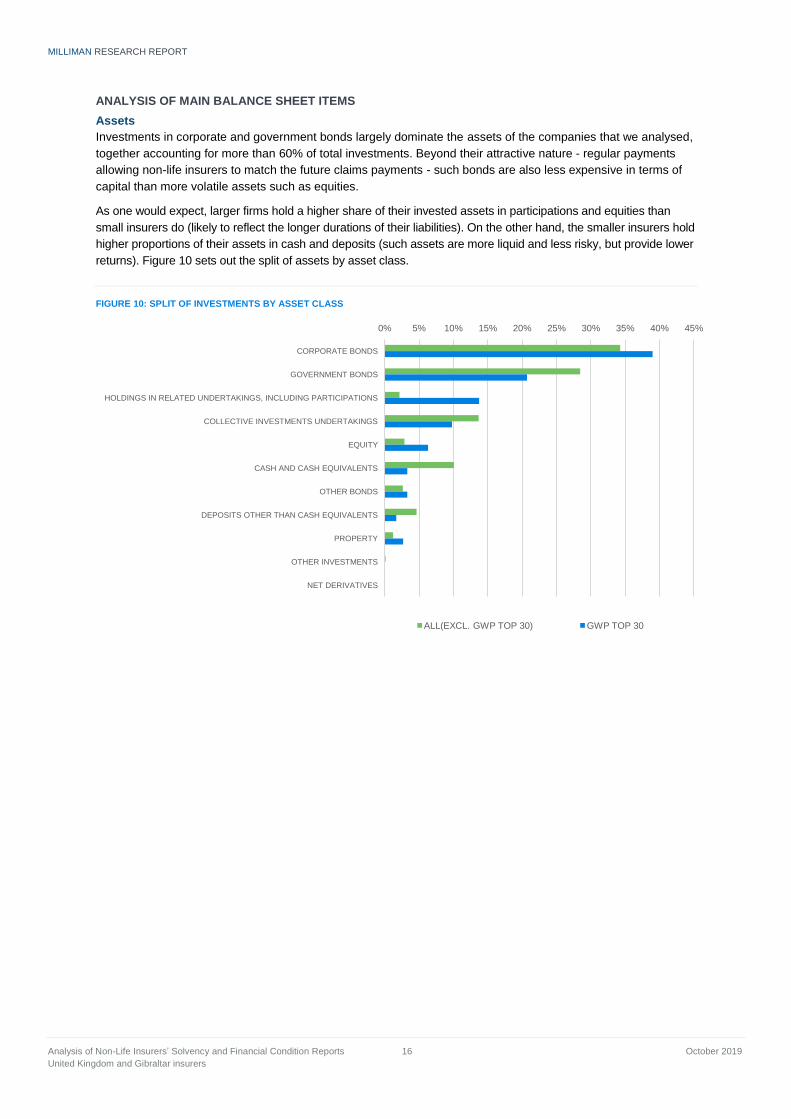
ANALYSIS OF MAIN BALANCE SHEET ITEMS
Assets
Investments in corporate and government bonds largely dominate the assets of the companies that we analysed,
together accounting for more than 60% of total investments. Beyond their attractive nature - regular payments
allowing non-life insurers to match the future claims payments - such bonds are also less expensive in terms of
capital than more volatile assets such as equities.
As one would expect, larger firms hold a higher share of their invested assets in participations and equities than
small insurers do (likely to reflect the longer durations of their liabilities). On the other hand, the smaller insurers hold
higher proportions of their assets in cash and deposits (such assets are more liquid and less risky, but provide lower
returns). Figure 10 sets out the split of assets by asset class.
FIGURE 10: SPLIT OF INVESTMENTS BY ASSET CLASS
0% 5% 10% 15% 20% 25% 30% 35% 40% 45%
CORPORATE BONDS
GOVERNMENT BONDS
HOLDINGS IN RELATED UNDERTAKINGS, INCLUDING PARTICIPATIONS
COLLECTIVE INVESTMENTS UNDERTAKINGS
EQUITY
CASH AND CASH EQUIVALENTS
OTHER BONDS
DEPOSITS OTHER THAN CASH EQUIVALENTS
PROPERTY
OTHER INVESTMENTS
NET DERIVATIVES
ALL(EXCL. GWP TOP 30) GWP TOP 30
MILLIMAN RESEARCH REPORT
Analysis of Non-Life Insurers’ Solvency and Financial Condition Reports 17 October 2019
United Kingdom and Gibraltar insurers
Technical provisions
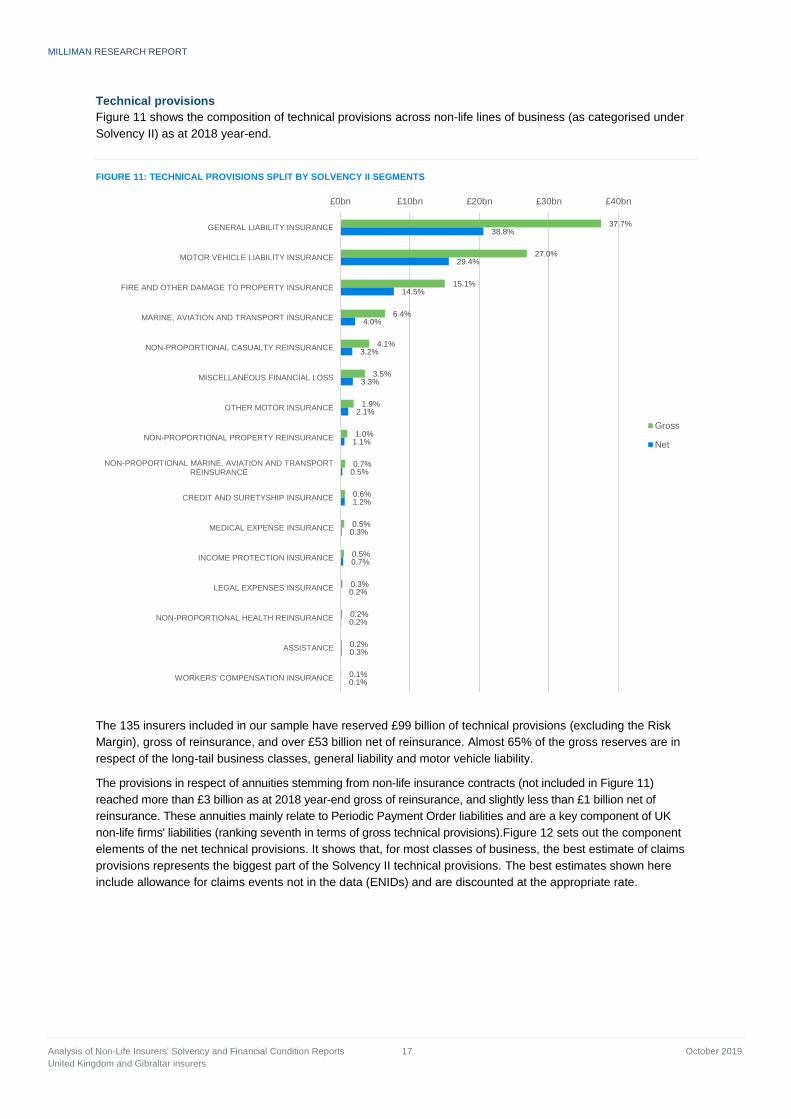
Figure 11 shows the composition of technical provisions across non-life lines of business (as categorised under
Solvency II) as at 2018 year-end.
FIGURE 11: TECHNICAL PROVISIONS SPLIT BY SOLVENCY II SEGMENTS
The 135 insurers included in our sample have reserved £99 billion of technical provisions (excluding the Risk
Margin), gross of reinsurance, and over £53 billion net of reinsurance. Almost 65% of the gross reserves are in
respect of the long-tail business classes, general liability and motor vehicle liability.
The provisions in respect of annuities stemming from non-life insurance contracts (not included in Figure 11)
reached more than £3 billion as at 2018 year-end gross of reinsurance, and slightly less than £1 billion net of
reinsurance. These annuities mainly relate to Periodic Payment Order liabilities and are a key component of UK
non-life firms' liabilities (ranking seventh in terms of gross technical provisions).Figure 12 sets out the component
elements of the net technical provisions. It shows that, for most classes of business, the best estimate of claims
provisions represents the biggest part of the Solvency II technical provisions. The best estimates shown here
include allowance for claims events not in the data (ENIDs) and are discounted at the appropriate rate.
37.7%
27.0%
15.1%
6.4%
4.1%
3.5%
1.9%
1.0%
0.7%
0.6%
0.5%
0.5%
0.3%
0.2%
0.2%
0.1%
38.8%
29.4%
14.5%
4.0%
3.2%
3.3%
2.1%
1.1%
0.5%
1.2%
0.3%
0.7%
0.2%
0.2%
0.3%
0.1%
£0bn £10bn £20bn £30bn £40bn
GENERAL LIABILITY INSURANCE
MOTOR VEHICLE LIABILITY INSURANCE
FIRE AND OTHER DAMAGE TO PROPERTY INSURANCE
MARINE, AVIATION AND TRANSPORT INSURANCE
NON-PROPORTIONAL CASUALTY REINSURANCE
MISCELLANEOUS FINANCIAL LOSS
OTHER MOTOR INSURANCE
NON-PROPORTIONAL PROPERTY REINSURANCE
NON-PROPORTIONAL MARINE, AVIATION AND TRANSPORT REINSURANCE
CREDIT AND SURETYSHIP INSURANCE
MEDICAL EXPENSE INSURANCE
INCOME PROTECTION INSURANCE
LEGAL EXPENSES INSURANCE
NON-PROPORTIONAL HEALTH REINSURANCE
ASSISTANCE
WORKERS' COMPENSATION INSURANCE
Gross
Net
MILLIMAN RESEARCH REPORT
Analysis of Non-Life Insurers’ Solvency and Financial Condition Reports 18 October 2019
United Kingdom and Gibraltar insurers
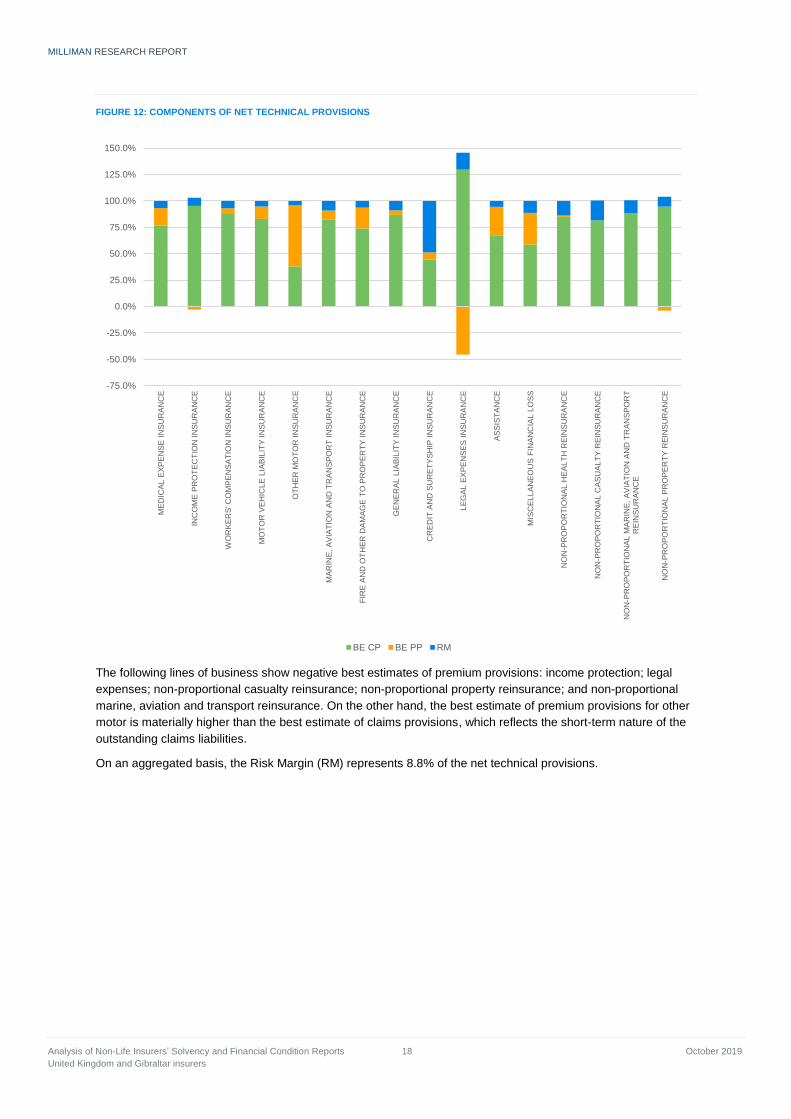
FIGURE 12: COMPONENTS OF NET TECHNICAL PROVISIONS
The following lines of business show negative best estimates of premium provisions: income protection; legal
expenses; non-proportional casualty reinsurance; non-proportional property reinsurance; and non-proportional
marine, aviation and transport reinsurance. On the other hand, the best estimate of premium provisions for other
motor is materially higher than the best estimate of claims provisions, which reflects the short-term nature of the
outstanding claims liabilities.
On an aggregated basis, the Risk Margin (RM) represents 8.8% of the net technical provisions.
-75.0%
-50.0%
-25.0%
0.0%
25.0%
50.0%
75.0%
100.0%
125.0%
150.0%M
ED
ICA
L E
XP
EN
SE
IN
SU
RA
NC
E
INC
OM
E P
RO
TE
CT
ION
IN
SU
RA
NC
E
WO
RK
ER
S' C
OM
PE
NS
AT
ION
IN
SU
RA
NC
E
MO
TO
R V
EH
ICLE
LIA
BIL
ITY
IN
SU
RA
NC
E
OT
HE
R M
OT
OR
IN
SU
RA
NC
E
MA
RIN
E,
AV
IAT
ION
AN
D T
RA
NS
PO
RT
IN
SU
RA
NC
E
FIR
E A
ND
OT
HE
R D
AM
AG
E T
O P
RO
PE
RT
Y I
NS
UR
AN
CE
GE
NE
RA
L L
IAB
ILIT
Y IN
SU
RA
NC
E
CR
ED
IT A
ND
SU
RE
TY
SH
IP I
NS
UR
AN
CE
LE
GA
L E
XP
EN
SE
S I
NS
UR
AN
CE
AS
SIS
TA
NC
E
MIS
CE
LL
AN
EO
US
FIN
AN
CIA
L L
OS
S
NO
N-P
RO
PO
RT
ION
AL
HE
AL
TH
RE
INS
UR
AN
CE
NO
N-P
RO
PO
RT
ION
AL
CA
SU
AL
TY
RE
INS
UR
AN
CE
NO
N-P
RO
PO
RT
ION
AL
MA
RIN
E,
AV
IAT
ION
AN
D T
RA
NS
PO
RT
R
EIN
SU
RA
NC
E
NO
N-P
RO
PO
RT
ION
AL
PR
OP
ER
TY
RE
INS
UR
AN
CE
BE CP BE PP RM
MILLIMAN RESEARCH REPORT
Analysis of Non-Life Insurers’ Solvency and Financial Condition Reports 19 October 2019
United Kingdom and Gibraltar insurers
ANALYSIS OF UNDERWRITING
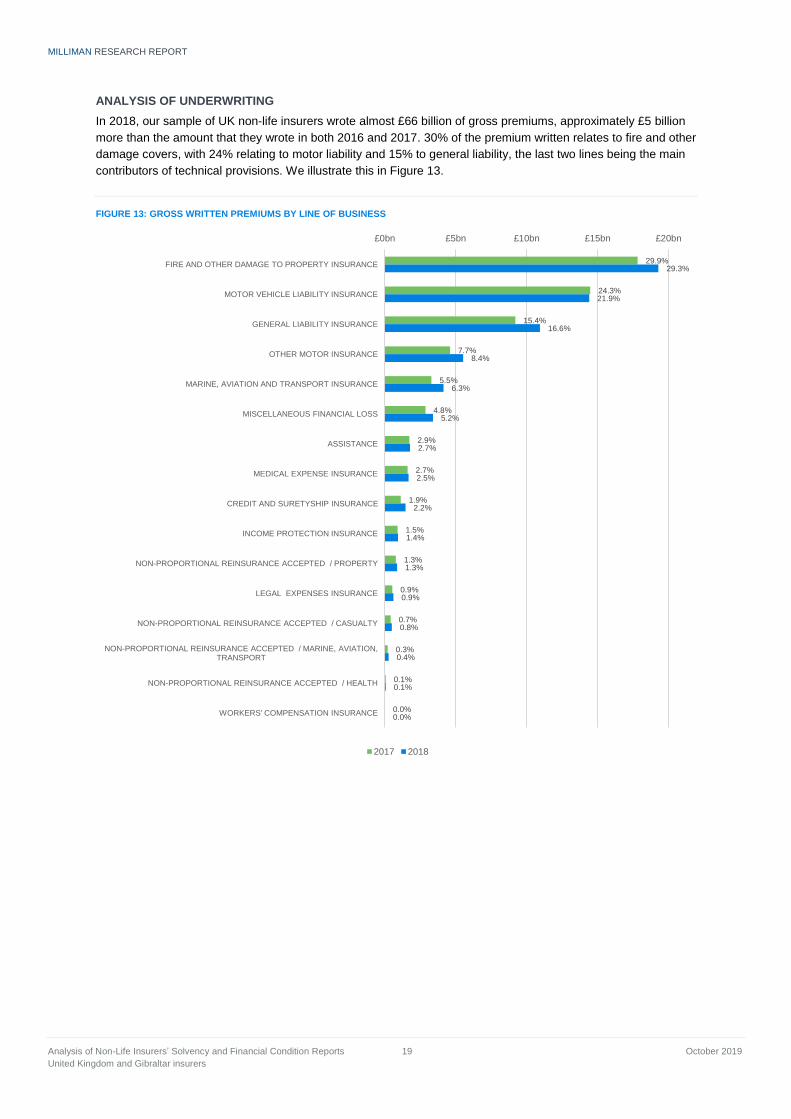
In 2018, our sample of UK non-life insurers wrote almost £66 billion of gross premiums, approximately £5 billion
more than the amount that they wrote in both 2016 and 2017. 30% of the premium written relates to fire and other
damage covers, with 24% relating to motor liability and 15% to general liability, the last two lines being the main
contributors of technical provisions. We illustrate this in Figure 13.
FIGURE 13: GROSS WRITTEN PREMIUMS BY LINE OF BUSINESS
29.9%
24.3%
15.4%
7.7%
5.5%
4.8%
2.9%
2.7%
1.9%
1.5%
1.3%
0.9%
0.7%
0.3%
0.1%
0.0%
29.3%
21.9%
16.6%
8.4%
6.3%
5.2%
2.7%
2.5%
2.2%
1.4%
1.3%
0.9%
0.8%
0.4%
0.1%
0.0%
£0bn £5bn £10bn £15bn £20bn
FIRE AND OTHER DAMAGE TO PROPERTY INSURANCE
MOTOR VEHICLE LIABILITY INSURANCE
GENERAL LIABILITY INSURANCE
OTHER MOTOR INSURANCE
MARINE, AVIATION AND TRANSPORT INSURANCE
MISCELLANEOUS FINANCIAL LOSS
ASSISTANCE
MEDICAL EXPENSE INSURANCE
CREDIT AND SURETYSHIP INSURANCE
INCOME PROTECTION INSURANCE
NON-PROPORTIONAL REINSURANCE ACCEPTED / PROPERTY
LEGAL EXPENSES INSURANCE
NON-PROPORTIONAL REINSURANCE ACCEPTED / CASUALTY
NON-PROPORTIONAL REINSURANCE ACCEPTED / MARINE, AVIATION, TRANSPORT
NON-PROPORTIONAL REINSURANCE ACCEPTED / HEALTH
WORKERS' COMPENSATION INSURANCE
2017 2018
MILLIMAN RESEARCH REPORT
Analysis of Non-Life Insurers’ Solvency and Financial Condition Reports 20 October 2019
United Kingdom and Gibraltar insurers
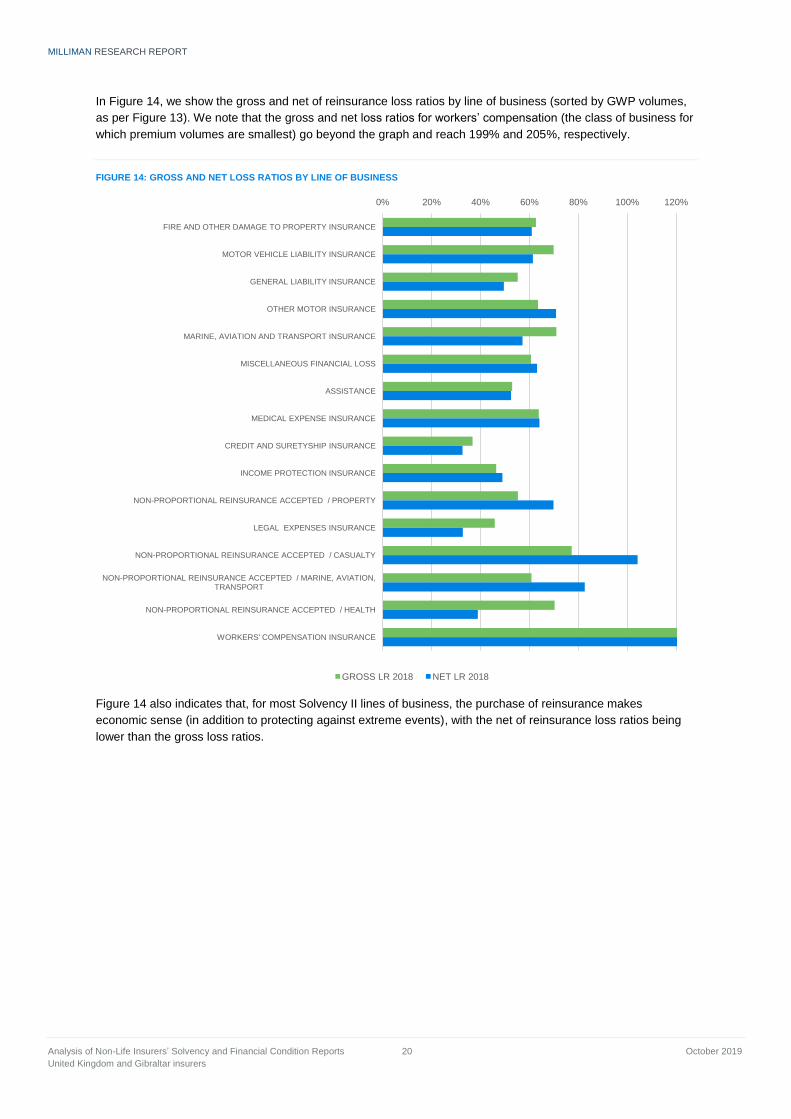
In Figure 14, we show the gross and net of reinsurance loss ratios by line of business (sorted by GWP volumes,
as per Figure 13). We note that the gross and net loss ratios for workers’ compensation (the class of business for
which premium volumes are smallest) go beyond the graph and reach 199% and 205%, respectively.
FIGURE 14: GROSS AND NET LOSS RATIOS BY LINE OF BUSINESS
Figure 14 also indicates that, for most Solvency II lines of business, the purchase of reinsurance makes
economic sense (in addition to protecting against extreme events), with the net of reinsurance loss ratios being
lower than the gross loss ratios.
0% 20% 40% 60% 80% 100% 120%
FIRE AND OTHER DAMAGE TO PROPERTY INSURANCE
MOTOR VEHICLE LIABILITY INSURANCE
GENERAL LIABILITY INSURANCE
OTHER MOTOR INSURANCE
MARINE, AVIATION AND TRANSPORT INSURANCE
MISCELLANEOUS FINANCIAL LOSS
ASSISTANCE
MEDICAL EXPENSE INSURANCE
CREDIT AND SURETYSHIP INSURANCE
INCOME PROTECTION INSURANCE
NON-PROPORTIONAL REINSURANCE ACCEPTED / PROPERTY
LEGAL EXPENSES INSURANCE
NON-PROPORTIONAL REINSURANCE ACCEPTED / CASUALTY
NON-PROPORTIONAL REINSURANCE ACCEPTED / MARINE, AVIATION, TRANSPORT
NON-PROPORTIONAL REINSURANCE ACCEPTED / HEALTH
WORKERS' COMPENSATION INSURANCE
GROSS LR 2018 NET LR 2018
MILLIMAN RESEARCH REPORT
Analysis of Non-Life Insurers’ Solvency and Financial Condition Reports 21 October 2019
United Kingdom and Gibraltar insurers
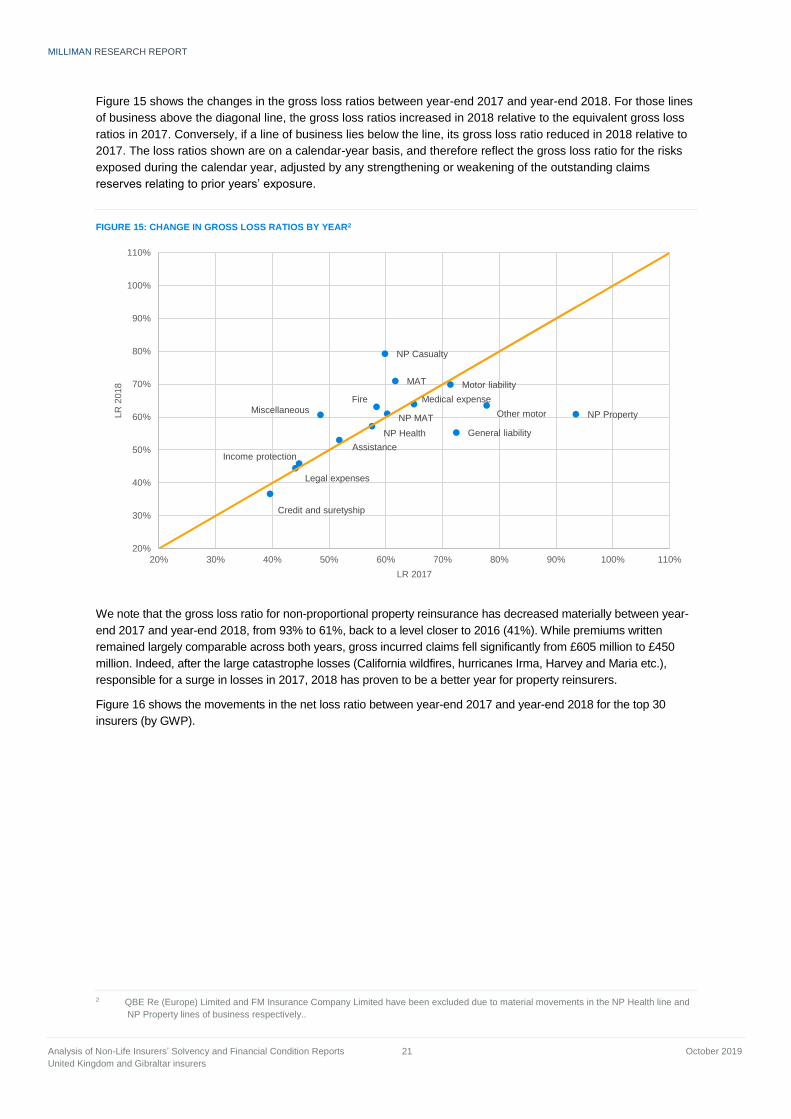
Figure 15 shows the changes in the gross loss ratios between year-end 2017 and year-end 2018. For those lines
of business above the diagonal line, the gross loss ratios increased in 2018 relative to the equivalent gross loss
ratios in 2017. Conversely, if a line of business lies below the line, its gross loss ratio reduced in 2018 relative to
2017. The loss ratios shown are on a calendar-year basis, and therefore reflect the gross loss ratio for the risks
exposed during the calendar year, adjusted by any strengthening or weakening of the outstanding claims
reserves relating to prior years’ exposure.
FIGURE 15: CHANGE IN GROSS LOSS RATIOS BY YEAR2
We note that the gross loss ratio for non-proportional property reinsurance has decreased materially between year-
end 2017 and year-end 2018, from 93% to 61%, back to a level closer to 2016 (41%). While premiums written
remained largely comparable across both years, gross incurred claims fell significantly from £605 million to £450
million. Indeed, after the large catastrophe losses (California wildfires, hurricanes Irma, Harvey and Maria etc.),
responsible for a surge in losses in 2017, 2018 has proven to be a better year for property reinsurers.
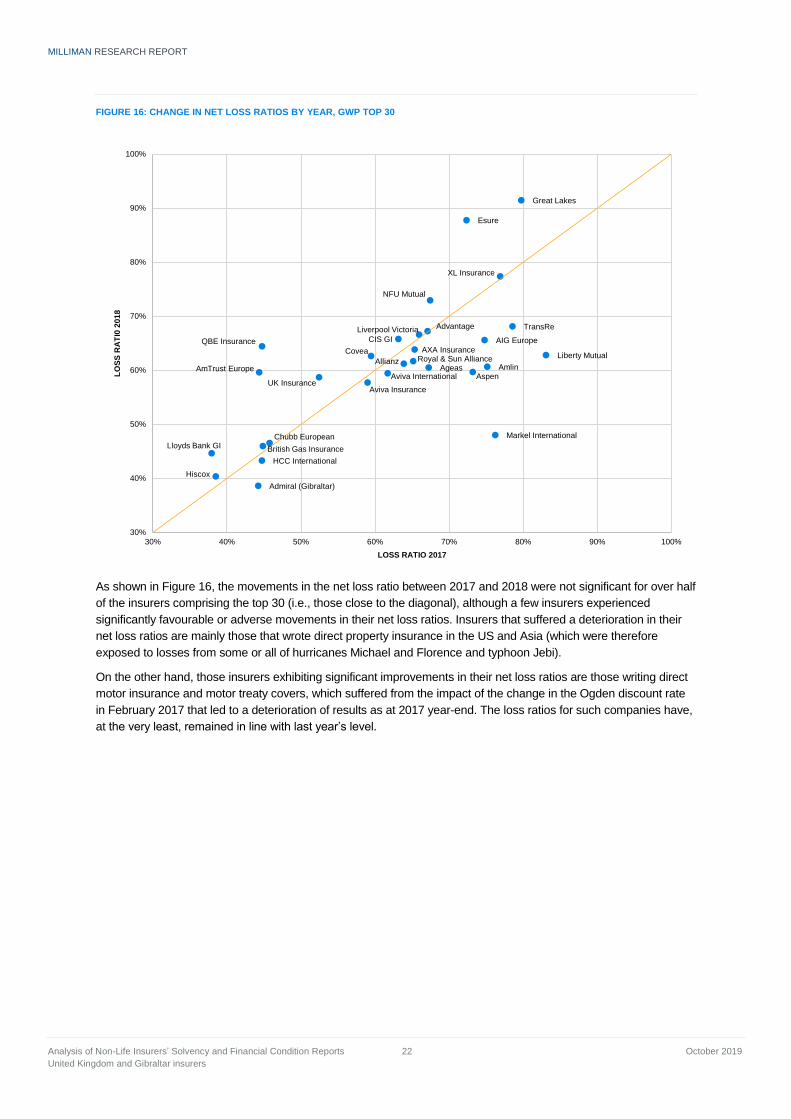
Figure 16 shows the movements in the net loss ratio between year-end 2017 and year-end 2018 for the top 30
insurers (by GWP).
2 QBE Re (Europe) Limited and FM Insurance Company Limited have been excluded due to material movements in the NP Health line and
NP Property lines of business respectively..
Fire
Motor liability
General liability
Other motor
MAT
Miscellaneous
Assistance
Medical expense
Credit and suretyship
Income protection
NP Property
Legal expenses
NP Casualty
NP MAT
NP Health
20%
30%
40%
50%
60%
70%
80%
90%
100%
110%
20% 30% 40% 50% 60% 70% 80% 90% 100% 110%
LR
2018
LR 2017
MILLIMAN RESEARCH REPORT
Analysis of Non-Life Insurers’ Solvency and Financial Condition Reports 22 October 2019
United Kingdom and Gibraltar insurers
FIGURE 16: CHANGE IN NET LOSS RATIOS BY YEAR, GWP TOP 30
As shown in Figure 16, the movements in the net loss ratio between 2017 and 2018 were not significant for over half
of the insurers comprising the top 30 (i.e., those close to the diagonal), although a few insurers experienced
significantly favourable or adverse movements in their net loss ratios. Insurers that suffered a deterioration in their
net loss ratios are mainly those that wrote direct property insurance in the US and Asia (which were therefore
exposed to losses from some or all of hurricanes Michael and Florence and typhoon Jebi).
On the other hand, those insurers exhibiting significant improvements in their net loss ratios are those writing direct
motor insurance and motor treaty covers, which suffered from the impact of the change in the Ogden discount rate
in February 2017 that led to a deterioration of results as at 2017 year-end. The loss ratios for such companies have,
at the very least, remained in line with last year’s level.
Admiral (Gibraltar)
Advantage
Ageas
AIG Europe
AllianzAmlinAmTrust Europe
Aspen
Aviva Insurance
Aviva International
AXA Insurance
British Gas Insurance
Chubb European
CIS GI
Covea
Esure
Great Lakes
HCC International
Hiscox
Liberty Mutual
Liverpool Victoria
Lloyds Bank GI
Markel International
QBE Insurance
Royal & Sun Alliance
NFU Mutual
TransRe
UK Insurance
XL Insurance
30%
40%
50%
60%
70%
80%
90%
100%
30% 40% 50% 60% 70% 80% 90% 100%
LO
SS
RA
TI0
20
18
LOSS RATIO 2017
MILLIMAN RESEARCH REPORT
Analysis of Non-Life Insurers’ Solvency and Financial Condition Reports 23 October 2019
United Kingdom and Gibraltar insurers
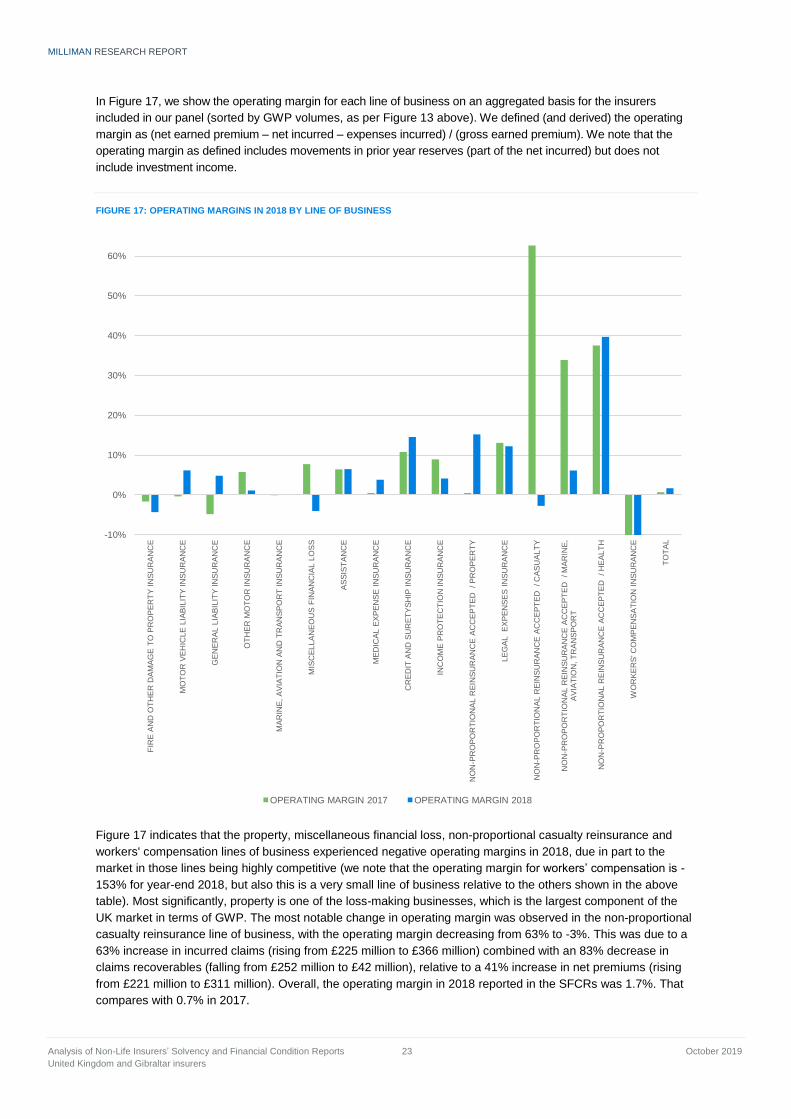
In Figure 17, we show the operating margin for each line of business on an aggregated basis for the insurers
included in our panel (sorted by GWP volumes, as per Figure 13 above). We defined (and derived) the operating
margin as (net earned premium – net incurred – expenses incurred) / (gross earned premium). We note that the
operating margin as defined includes movements in prior year reserves (part of the net incurred) but does not
include investment income.
FIGURE 17: OPERATING MARGINS IN 2018 BY LINE OF BUSINESS
Figure 17 indicates that the property, miscellaneous financial loss, non-proportional casualty reinsurance and
workers' compensation lines of business experienced negative operating margins in 2018, due in part to the
market in those lines being highly competitive (we note that the operating margin for workers’ compensation is -
153% for year-end 2018, but also this is a very small line of business relative to the others shown in the above
table). Most significantly, property is one of the loss-making businesses, which is the largest component of the
UK market in terms of GWP. The most notable change in operating margin was observed in the non-proportional
casualty reinsurance line of business, with the operating margin decreasing from 63% to -3%. This was due to a
63% increase in incurred claims (rising from £225 million to £366 million) combined with an 83% decrease in
claims recoverables (falling from £252 million to £42 million), relative to a 41% increase in net premiums (rising
from £221 million to £311 million). Overall, the operating margin in 2018 reported in the SFCRs was 1.7%. That
compares with 0.7% in 2017.
-10%
0%
10%
20%
30%
40%
50%
60%
FIR
E A
ND
OT
HE
R D
AM
AG
E T
O P
RO
PE
RT
Y I
NS
UR
AN
CE
MO
TO
R V
EH
ICLE
LIA
BIL
ITY
IN
SU
RA
NC
E
GE
NE
RA
L L
IAB
ILIT
Y IN
SU
RA
NC
E
OT
HE
R M
OT
OR
IN
SU
RA
NC
E
MA
RIN
E,
AV
IAT
ION
AN
D T
RA
NS
PO
RT
IN
SU
RA
NC
E
MIS
CE
LL
AN
EO
US
FIN
AN
CIA
L L
OS
S
AS
SIS
TA
NC
E
ME
DIC
AL
EX
PE
NS
E I
NS
UR
AN
CE
CR
ED
IT A
ND
SU
RE
TY
SH
IP I
NS
UR
AN
CE
INC
OM
E P
RO
TE
CT
ION
IN
SU
RA
NC
E
NO
N-P
RO
PO
RT
ION
AL
RE
INS
UR
AN
CE
AC
CE
PT
ED
/ P
RO
PE
RT
Y
LE
GA
L
EX
PE
NS
ES
IN
SU
RA
NC
E
NO
N-P
RO
PO
RT
ION
AL
RE
INS
UR
AN
CE
AC
CE
PT
ED
/ C
AS
UA
LT
Y
NO
N-P
RO
PO
RT
ION
AL
RE
INS
UR
AN
CE
AC
CE
PT
ED
/ M
AR
INE
, A
VIA
TIO
N, T
RA
NS
PO
RT
NO
N-P
RO
PO
RT
ION
AL
RE
INS
UR
AN
CE
AC
CE
PT
ED
/ H
EA
LT
H
WO
RK
ER
S' C
OM
PE
NS
AT
ION
IN
SU
RA
NC
E
TO
TA
L
OPERATING MARGIN 2017 OPERATING MARGIN 2018
MILLIMAN RESEARCH REPORT
Analysis of Non-Life Insurers’ Solvency and Financial Condition Reports 24 October 2019
United Kingdom and Gibraltar insurers
Figure 18 shows the change in operating margin between 2017 and 2018 for the top 30 insurers by GWP. As
opposed to Figure 17, the operating margin in Figure 18 includes ‘Other expenses’ which are not attributed to
administrative, investment management, claims management, acquisition or overhead expenses, as they are not
allocated by line of business.
FIGURE 18: CHANGE IN OPERATING MARGIN BY YEAR, GWP TOP 30
Movements in operating margin between 2017 and 2018, as exhibited in Figure 18, are broadly consistent with
the movements in the loss ratios indicated in Figure 16 above. This implies that changes in loss ratios are the
main drivers of changes in insurers’ operating margin movements. However, we note that some insurers, such as
Liberty Mutual, have seen a deterioration in their operating margins resulting from significant increases in their
expenses. The impact of unfavourable claims experience for some other insurers (e.g. Great Lakes) has been
dampened by lower expenses.
Ageas
AIG Europe
Allianz
Amlin
AmTrust Europe
Aspen
Aviva Insurance
Aviva International
AXA Insurance
British Gas Insurance
Chubb European
CIS GI
Covea
Esure
Great Lakes
HCC International
Hiscox
Liberty Mutual
Liverpool Victoria
Lloyds Bank GI
Markel International
QBE Insurance
Royal & Sun Alliance
NFU Mutual
TransRe
U K Insurance
XL Insurance
Admiral (Gibraltar)
Advantage
-20%
-15%
-10%
-5%
0%
5%
10%
15%
20%
-20% -15% -10% -5% 0% 5% 10% 15% 20%
OP
ER
AT
ING
MA
RG
IN 2
018
OPERATING MARGIN 2017
MILLIMAN RESEARCH REPORT
Analysis of Non-Life Insurers’ Solvency and Financial Condition Reports 25 October 2019
United Kingdom and Gibraltar insurers
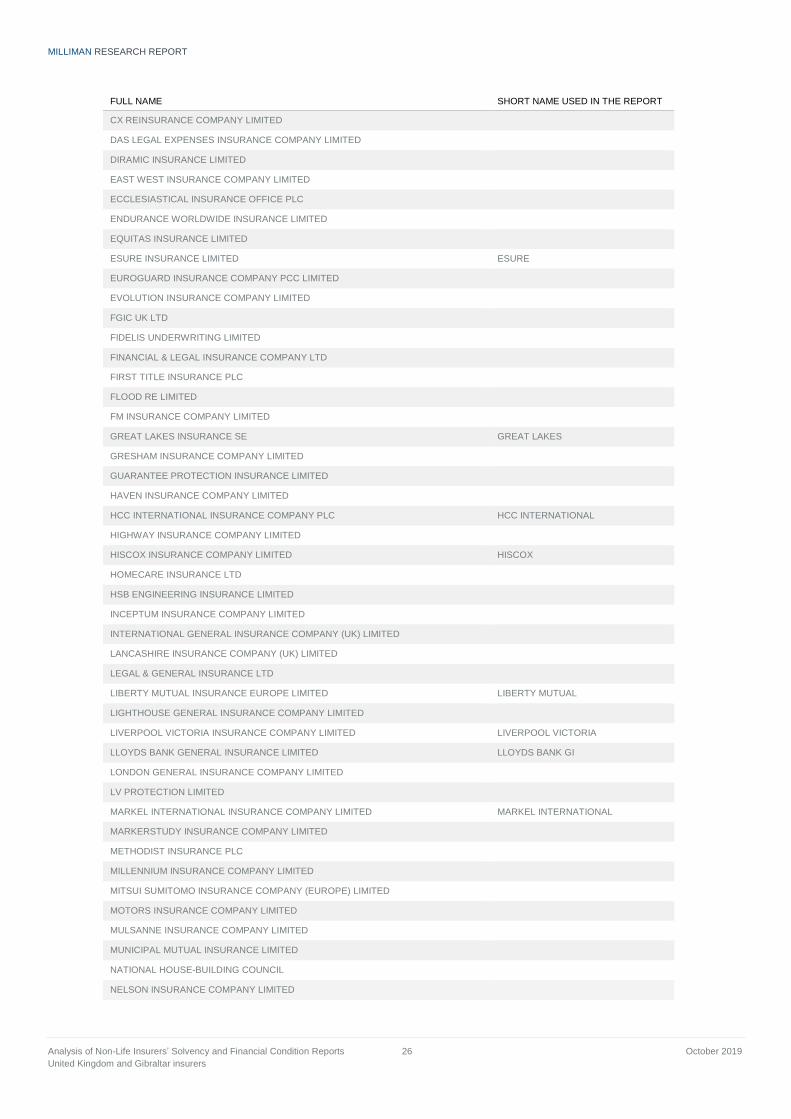
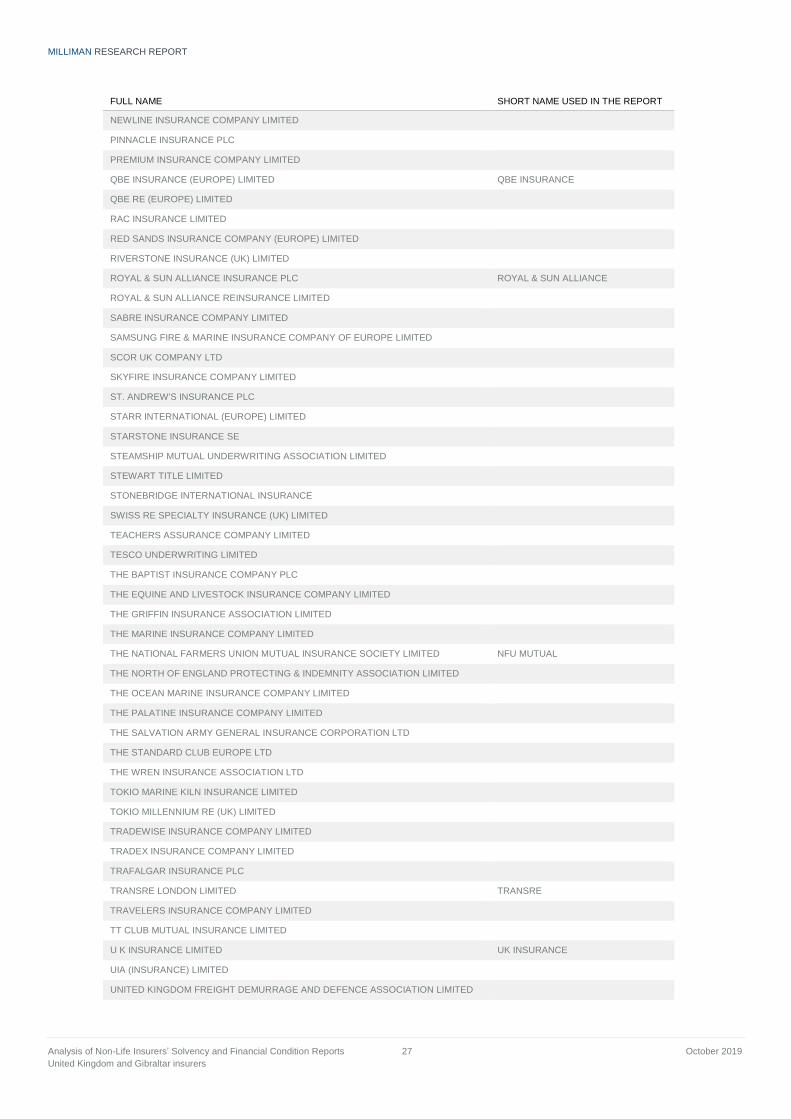
Appendix A:
List of entities whose data was included within the analysis FULL NAME SHORT NAME USED IN THE REPORT
AA UNDERWRITING INSURANCE COMPANY LIMITED
ACASTA EUROPEAN INSURANCE COMPANY LIMITED
ACROMAS INSURANCE COMPANY LIMITED
ADMIRAL INSURANCE (GIBRALTAR) LIMITED ADMIRAL (GIBRALTAR)
ADMIRAL INSURANCE COMPANY LIMITED
ADVANTAGE INSURANCE COMPANY LIMITED ADVANTAGE
AGEAS INSURANCE LIMITED AGEAS
AGF INSURANCE LIMITED
AIG EUROPE LIMITED AIG EUROPE
ALLIANZ INSURANCE PLC ALLIANZ
ALWYN INSURANCE COMPANY LIMITED
AMBAC ASSURANCE UK LIMITED
AMLIN INSURANCE S.E. AMLIN
AMT MORTGAGE INSURANCE LIMITED
AMTRUST EUROPE LIMITED AMTRUST EUROPE
ARCH INSURANCE COMPANY (EUROPE) LIMITED
ARGUS INSURANCE COMPANY (EUROPE) LIMITED
ASPEN INSURANCE UK LIMITED ASPEN
ASSURANT GENERAL INSURANCE LIMITED
ASSURED GUARANTY (EUROPE) PLC
AVIVA INSURANCE LIMITED AVIVA INSURANCE
AVIVA INTERNATIONAL INSURANCE LIMITED AVIVA INTERNATIONAL
AVON INSURANCE PLC
AXA INSURANCE UK PLC AXA INSURANCE
BAR MUTUAL INDEMNITY FUND LIMITED
BERKSHIRE HATHAWAY INTERNATIONAL INSURANCE LIMITED
BESTPARK INTERNATIONAL LIMITED
BRITISH GAS INSURANCE LIMITED BRITISH GAS INSURANCE
BRITISH RESERVE INSURANCE COMPANY LTD
CALPE INSURANCE COMPANY LIMITED
CASUALTY & GENERAL INSURANCE COMPANY (EUROPE) LIMITED
CATALINA LONDON LIMITED
CATALINA WORTHING INSURANCE LIMITED
CHINA TAIPING INSURANCE (UK) CO LTD
CHUBB EUROPEAN GROUP LIMITED CHUBB EUROPEAN
CHUBB INSURANCE COMPANY OF EUROPE SE CHUBB INSURANCE
CHURCHILL INSURANCE COMPANY LIMITED
CIS GENERAL INSURANCE LIMITED CIS GI
CNA INSURANCE COMPANY LIMITED
CORNISH MUTUAL ASSURANCE COMPANY LIMITED
COVEA INSURANCE PLC COVEA
MILLIMAN RESEARCH REPORT
Analysis of Non-Life Insurers’ Solvency and Financial Condition Reports 26 October 2019
United Kingdom and Gibraltar insurers
FULL NAME SHORT NAME USED IN THE REPORT
CX REINSURANCE COMPANY LIMITED
DAS LEGAL EXPENSES INSURANCE COMPANY LIMITED
DIRAMIC INSURANCE LIMITED
EAST WEST INSURANCE COMPANY LIMITED
ECCLESIASTICAL INSURANCE OFFICE PLC
ENDURANCE WORLDWIDE INSURANCE LIMITED
EQUITAS INSURANCE LIMITED
ESURE INSURANCE LIMITED ESURE
EUROGUARD INSURANCE COMPANY PCC LIMITED
EVOLUTION INSURANCE COMPANY LIMITED
FGIC UK LTD
FIDELIS UNDERWRITING LIMITED
FINANCIAL & LEGAL INSURANCE COMPANY LTD
FIRST TITLE INSURANCE PLC
FLOOD RE LIMITED
FM INSURANCE COMPANY LIMITED
GREAT LAKES INSURANCE SE GREAT LAKES
GRESHAM INSURANCE COMPANY LIMITED
GUARANTEE PROTECTION INSURANCE LIMITED
HAVEN INSURANCE COMPANY LIMITED
HCC INTERNATIONAL INSURANCE COMPANY PLC HCC INTERNATIONAL
HIGHWAY INSURANCE COMPANY LIMITED
HISCOX INSURANCE COMPANY LIMITED HISCOX
HOMECARE INSURANCE LTD
HSB ENGINEERING INSURANCE LIMITED
INCEPTUM INSURANCE COMPANY LIMITED
INTERNATIONAL GENERAL INSURANCE COMPANY (UK) LIMITED
LANCASHIRE INSURANCE COMPANY (UK) LIMITED
LEGAL & GENERAL INSURANCE LTD
LIBERTY MUTUAL INSURANCE EUROPE LIMITED LIBERTY MUTUAL
LIGHTHOUSE GENERAL INSURANCE COMPANY LIMITED
LIVERPOOL VICTORIA INSURANCE COMPANY LIMITED LIVERPOOL VICTORIA
LLOYDS BANK GENERAL INSURANCE LIMITED LLOYDS BANK GI
LONDON GENERAL INSURANCE COMPANY LIMITED
LV PROTECTION LIMITED
MARKEL INTERNATIONAL INSURANCE COMPANY LIMITED MARKEL INTERNATIONAL
MARKERSTUDY INSURANCE COMPANY LIMITED
METHODIST INSURANCE PLC
MILLENNIUM INSURANCE COMPANY LIMITED
MITSUI SUMITOMO INSURANCE COMPANY (EUROPE) LIMITED
MOTORS INSURANCE COMPANY LIMITED
MULSANNE INSURANCE COMPANY LIMITED
MUNICIPAL MUTUAL INSURANCE LIMITED
NATIONAL HOUSE-BUILDING COUNCIL
NELSON INSURANCE COMPANY LIMITED
MILLIMAN RESEARCH REPORT
Analysis of Non-Life Insurers’ Solvency and Financial Condition Reports 27 October 2019
United Kingdom and Gibraltar insurers
FULL NAME SHORT NAME USED IN THE REPORT
NEWLINE INSURANCE COMPANY LIMITED
PINNACLE INSURANCE PLC
PREMIUM INSURANCE COMPANY LIMITED
QBE INSURANCE (EUROPE) LIMITED QBE INSURANCE
QBE RE (EUROPE) LIMITED
RAC INSURANCE LIMITED
RED SANDS INSURANCE COMPANY (EUROPE) LIMITED
RIVERSTONE INSURANCE (UK) LIMITED
ROYAL & SUN ALLIANCE INSURANCE PLC ROYAL & SUN ALLIANCE
ROYAL & SUN ALLIANCE REINSURANCE LIMITED
SABRE INSURANCE COMPANY LIMITED
SAMSUNG FIRE & MARINE INSURANCE COMPANY OF EUROPE LIMITED
SCOR UK COMPANY LTD
SKYFIRE INSURANCE COMPANY LIMITED
ST. ANDREW'S INSURANCE PLC
STARR INTERNATIONAL (EUROPE) LIMITED
STARSTONE INSURANCE SE
STEAMSHIP MUTUAL UNDERWRITING ASSOCIATION LIMITED
STEWART TITLE LIMITED
STONEBRIDGE INTERNATIONAL INSURANCE
SWISS RE SPECIALTY INSURANCE (UK) LIMITED
TEACHERS ASSURANCE COMPANY LIMITED
TESCO UNDERWRITING LIMITED
THE BAPTIST INSURANCE COMPANY PLC
THE EQUINE AND LIVESTOCK INSURANCE COMPANY LIMITED
THE GRIFFIN INSURANCE ASSOCIATION LIMITED
THE MARINE INSURANCE COMPANY LIMITED
THE NATIONAL FARMERS UNION MUTUAL INSURANCE SOCIETY LIMITED NFU MUTUAL
THE NORTH OF ENGLAND PROTECTING & INDEMNITY ASSOCIATION LIMITED
THE OCEAN MARINE INSURANCE COMPANY LIMITED
THE PALATINE INSURANCE COMPANY LIMITED
THE SALVATION ARMY GENERAL INSURANCE CORPORATION LTD
THE STANDARD CLUB EUROPE LTD
THE WREN INSURANCE ASSOCIATION LTD
TOKIO MARINE KILN INSURANCE LIMITED
TOKIO MILLENNIUM RE (UK) LIMITED
TRADEWISE INSURANCE COMPANY LIMITED
TRADEX INSURANCE COMPANY LIMITED
TRAFALGAR INSURANCE PLC
TRANSRE LONDON LIMITED TRANSRE
TRAVELERS INSURANCE COMPANY LIMITED
TT CLUB MUTUAL INSURANCE LIMITED
U K INSURANCE LIMITED UK INSURANCE
UIA (INSURANCE) LIMITED
UNITED KINGDOM FREIGHT DEMURRAGE AND DEFENCE ASSOCIATION LIMITED

MILLIMAN RESEARCH REPORT
Analysis of Non-Life Insurers’ Solvency and Financial Condition Reports 28 October 2019
United Kingdom and Gibraltar insurers
FULL NAME SHORT NAME USED IN THE REPORT
UNITED KINGDOM MUTUAL WAR RISKS ASSOCIATION LTD
WATFORD INSURANCE COMPANY EUROPE LIMITED
XL CATLIN INSURANCE COMPANY (UK) LTD
XL INSURANCE COMPANY SE XL INSURANCE
ZENITH INSURANCE PLC
© 2019 Milliman, Inc. All Rights Reserved. The materials in this document represent the opinion of the authors and are not representative of the views of Milliman, Inc.
Milliman does not certify the information, nor does it guarantee the accuracy and completeness of such information. Use of such information is voluntary and should not be
relied upon unless an independent review of its accuracy and completeness has been performed. Materials may not be reproduced without the express consent of Milliman.
Milliman is among the world’s largest providers of actuarial and
related products and services. The firm has consulting practices in
life insurance and financial services, property & casualty insurance,
healthcare, and employee benefits. Founded in 1947, Milliman is an
independent firm with offices in major cities around the globe.
milliman.com
CONTACT
Derek Newton
Flavien Thery