Embed Size (px)
Citation preview


Economic and Real Estate Outlook
By Lawrence Yun, Ph.D.Chief Economist
National Association of REALTORS®

How’s the Economy?

GDP Quarterly Activity
2007 - Q1
2007 - Q3
2008 - Q1
2008 - Q3
2009 - Q1
2009 - Q3
2010 - Q1
2010 - Q3
2011 - Q1
2011 - Q3
2012 - Q1
2012 - Q3
2013 - Q1
2013 - Q3
2014 - Q1
2014 - Q3
2015 - Q1
-10
-8
-6
-4
-2
0
2
4
6
Annualized Growth Rate
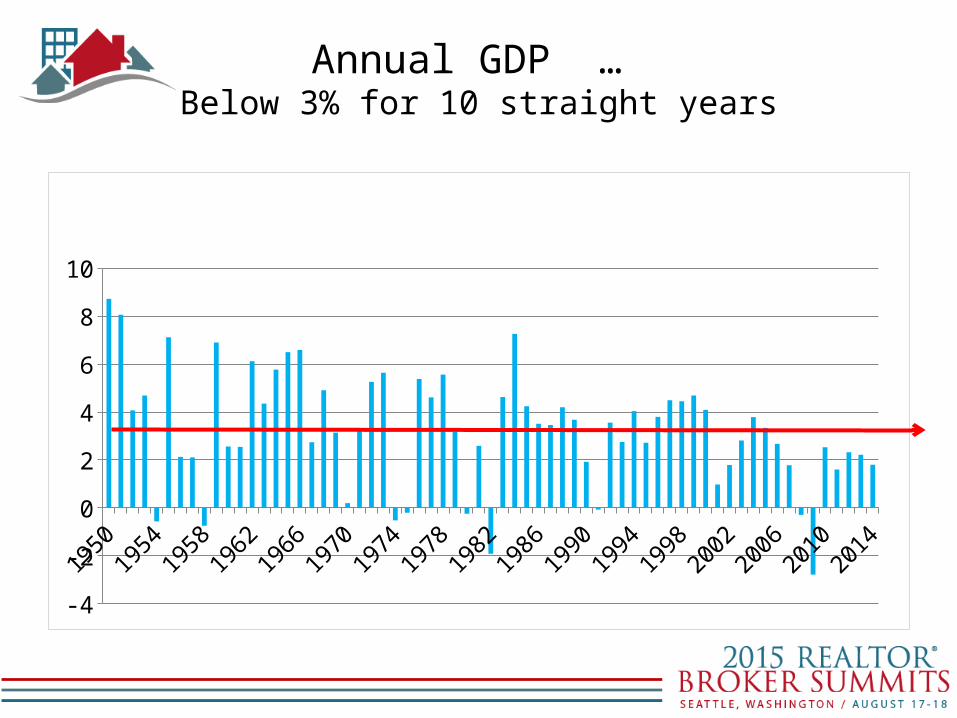
Annual GDP … Below 3% for 10 straight years
19501953
19561959
19621965
19681971
19741977
19801983
19861989
19921995
19982001
20042007
20102013
-4
-2
0
2
4
6
8
10
GDP Annual Growth Rate
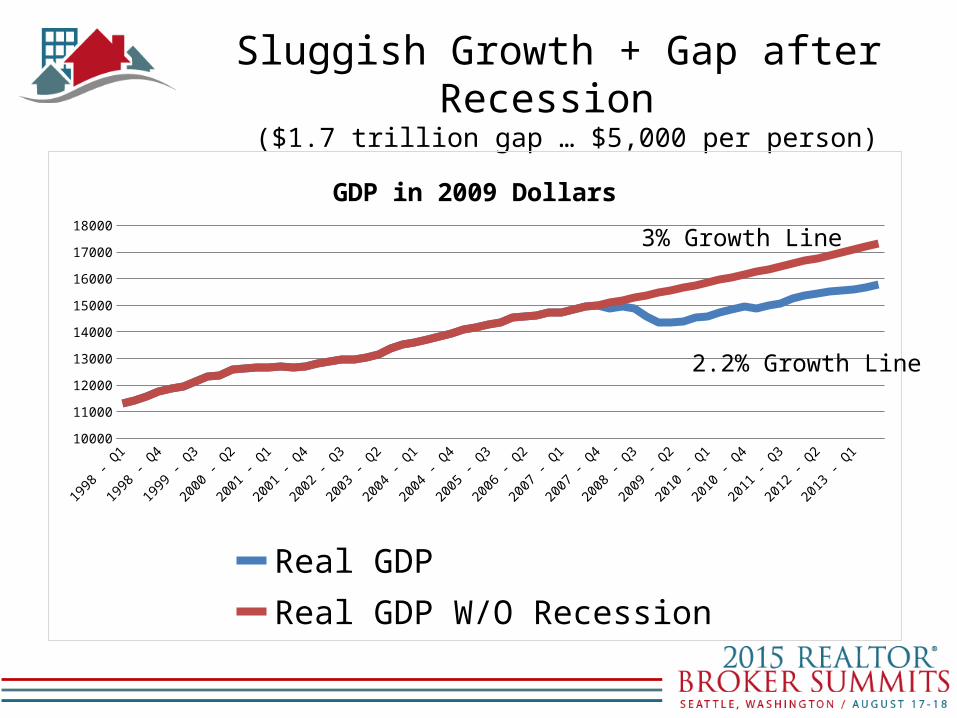
Sluggish Growth + Gap after Recession ($1.7 trillion gap … $5,000 per person)
1998 - Q1
1998 - Q3
1999 - Q1
1999 - Q3
2000 - Q1
2000 - Q3
2001 - Q1
2001 - Q3
2002 - Q1
2002 - Q3
2003 - Q1
2003 - Q3
2004 - Q1
2004 - Q3
2005 - Q1
2005 - Q3
2006 - Q1
2006 - Q3
2007 - Q1
2007 - Q3
2008 - Q1
2008 - Q3
2009 - Q1
2009 - Q3
2010 - Q1
2010 - Q3
2011 - Q1
2011 - Q3
2012 - Q1
2012 - Q3
2013 - Q1
2013 - Q3
10000
11000
12000
13000
14000
15000
16000
17000
18000
GDP in 2009 Dollars
Real GDP Real GDP W/O Recession
3% Growth Line
2.2% Growth Line
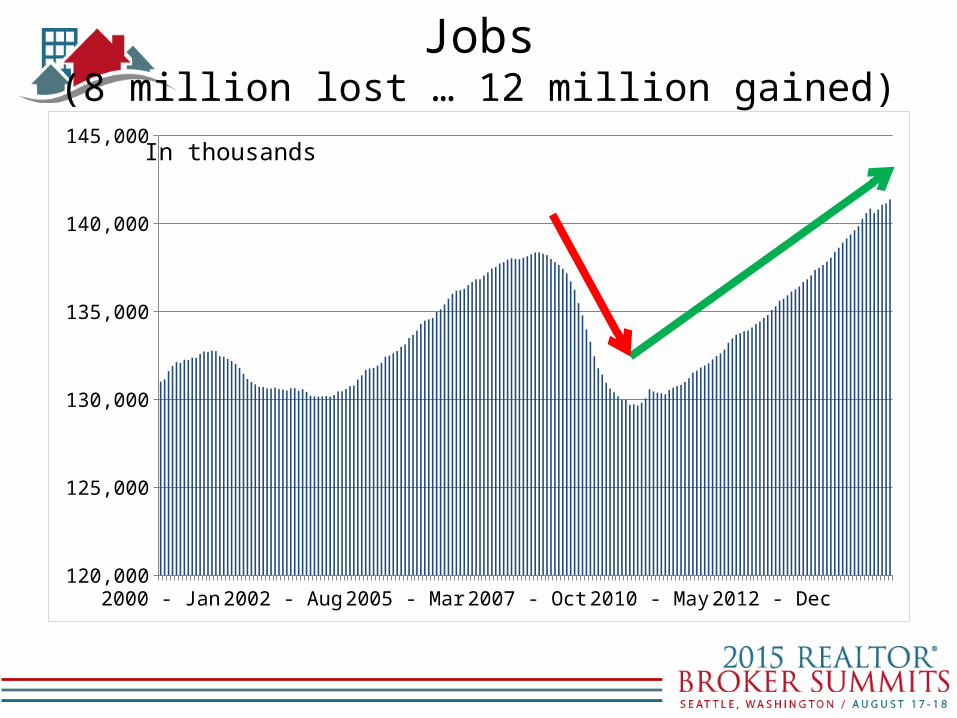
Jobs(8 million lost … 12 million gained)
2000 - Jan 2001 - Oct 2003 - Jul 2005 - Apr2007 - Jan 2008 - Oct 2010 - Jul 2012 - Apr2014 - Jan120,000
125,000
130,000
135,000
140,000
145,000In thousands

Fresh Unemployment Insurance Claims
2000 - Jan 2001 - Oct 2003 - Jul 2005 - Apr 2007 - Jan 2008 - Oct 2010 - Jul 2012 - Apr 2014 - Jan250
300
350
400
450
500
550
600In thousands
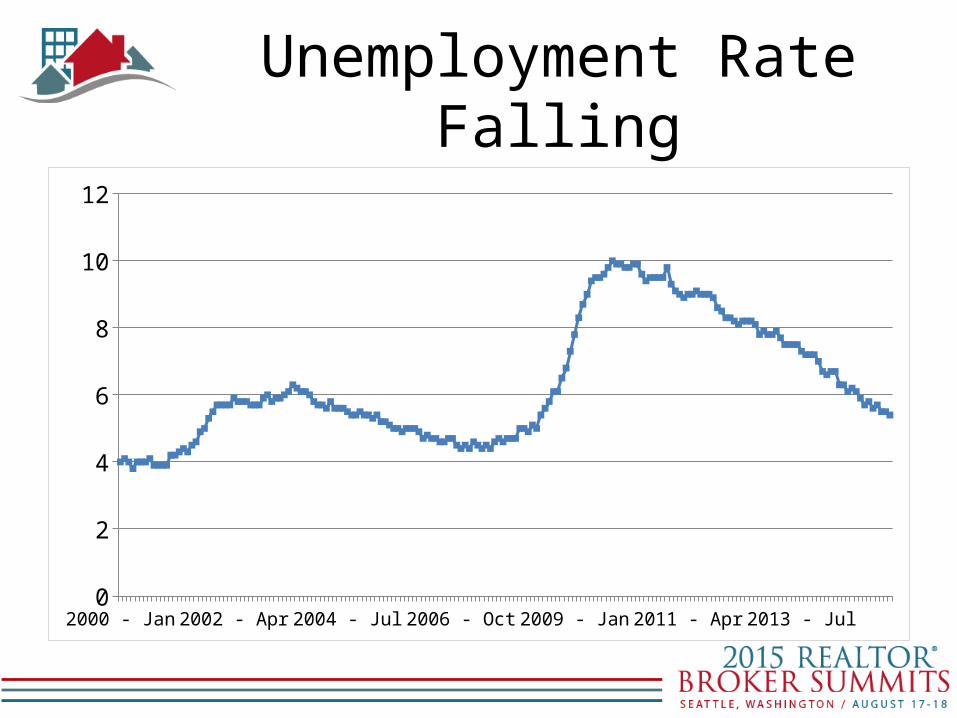
Unemployment Rate Falling
2000 - Jan 2001 - Oct 2003 - Jul 2005 - Apr 2007 - Jan 2008 - Oct 2010 - Jul 2012 - Apr 2014 - Jan0
2
4
6
8
10
12

But Employment Rate Not Rising
2000 - Jan 2001 - Oct 2003 - Jul 2005 - Apr 2007 - Jan 2008 - Oct 2010 - Jul 2012 - Apr 2014 - Jan54
56
58
60
62
64
66

Part-time Workers
2000 - Jan 2001 - Oct 2003 - Jul 2005 - Apr 2007 - Jan 2008 - Oct 2010 - Jul 2012 - Apr 2014 - Jan20000
21000
22000
23000
24000
25000
26000
27000
28000
29000In thousands

Wage Growth(% change from one year ago)
2000 - Jan 2001 - Oct 2003 - Jul 2005 - Apr 2007 - Jan 2008 - Oct 2010 - Jul 2012 - Apr 2014 - Jan0
0.5
1
1.5
2
2.5
3
3.5
4
4.5
5
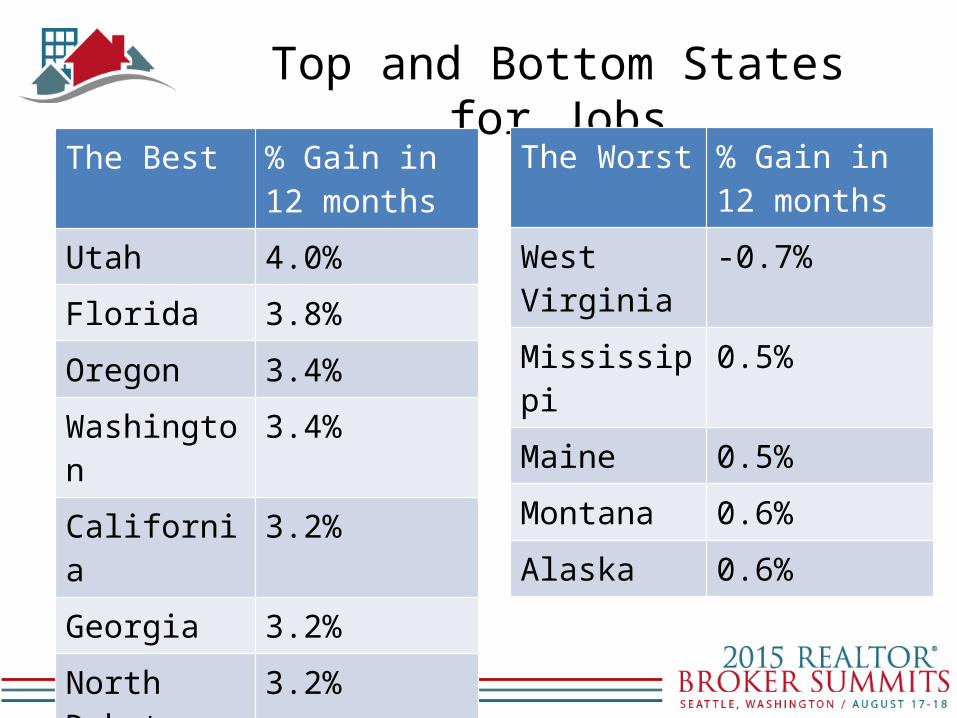
Top and Bottom States for JobsThe Best % Gain in 12
months
Utah 4.0%
Florida 3.8%
Oregon 3.4%
Washington 3.4%
California 3.2%
Georgia 3.2%
North Dakota 3.2%
Nevada 3.0%
Idaho 2.9%
The Worst % Gain in 12 months
West Virginia -0.7%
Mississippi 0.5%
Maine 0.5%
Montana 0.6%
Alaska 0.6%
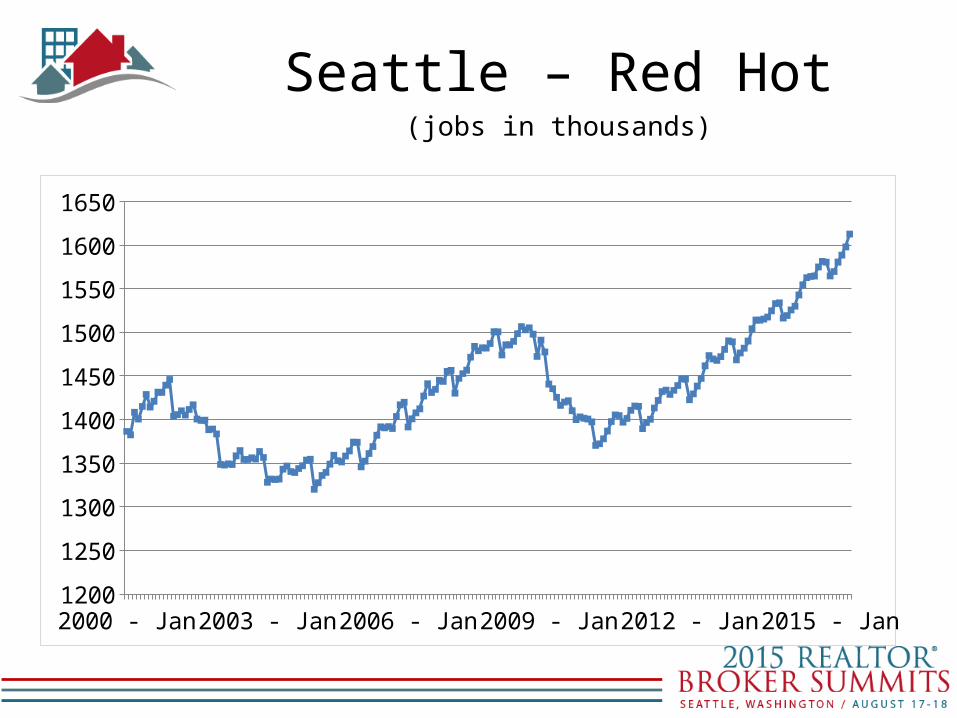
Seattle – Red Hot(jobs in thousands)
2000 - Jan 2002 - Jan 2004 - Jan 2006 - Jan 2008 - Jan 2010 - Jan 2012 - Jan 2014 - Jan1200
1250
1300
1350
1400
1450
1500
1550
1600
1650

Lake Erie Downfall and Resurgence
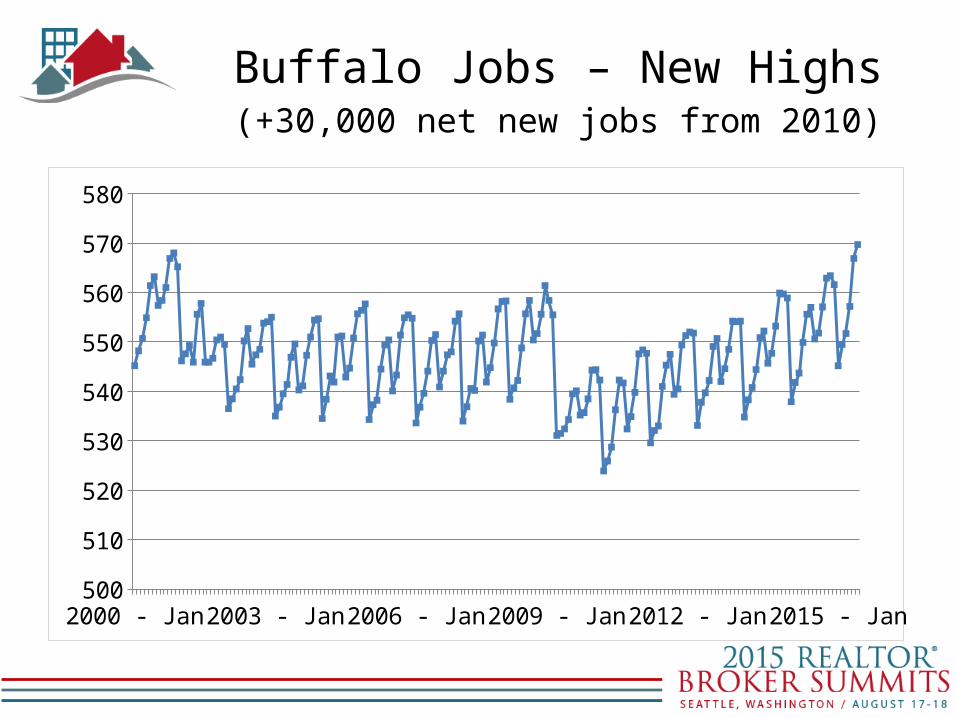
Buffalo Jobs – New Highs(+30,000 net new jobs from 2010)
2000 - Jan 2002 - Jan 2004 - Jan 2006 - Jan 2008 - Jan 2010 - Jan 2012 - Jan 2014 - Jan500
510
520
530
540
550
560
570
580

Detroit Jobs(+300,000 net new jobs from 2010)
2000 - Jan 2002 - Jan 2004 - Jan 2006 - Jan 2008 - Jan 2010 - Jan 2012 - Jan 2014 - Jan1500
1600
1700
1800
1900
2000
2100
2200
2300
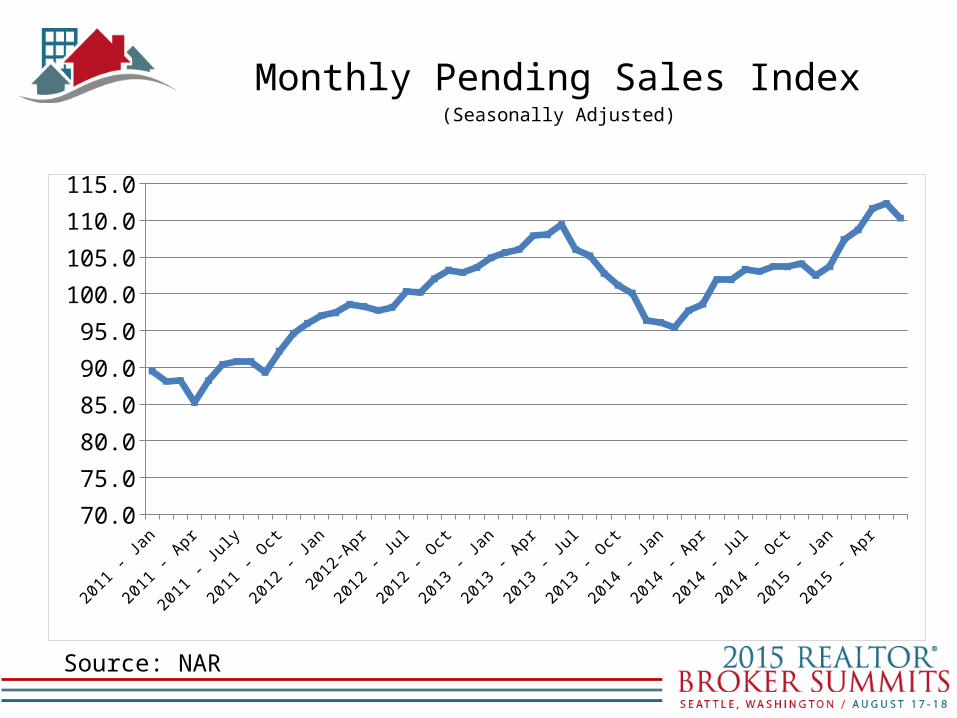
Monthly Pending Sales Index(Seasonally Adjusted)
2011 - Jan
2011 - Mar
2011 - May
2011 - July
2011 - Sep
2011 - Nov
2012 - Jan
2012- Mar
2012 - May
2012 - Jul
2012 - Sep
2012 - Nov
2013 - Jan
2013 - Mar
2013 - May
2013 - Jul
2013 - Sep
2013 - Nov
2014 - Jan
2014 - Mar
2014 - May
2014 - Jul
2014 - Sep
2014 - Nov
2015 - Jan
2015 - Mar
2015 - May
70.0
75.0
80.0
85.0
90.0
95.0
100.0
105.0
110.0
115.0
Source: NAR
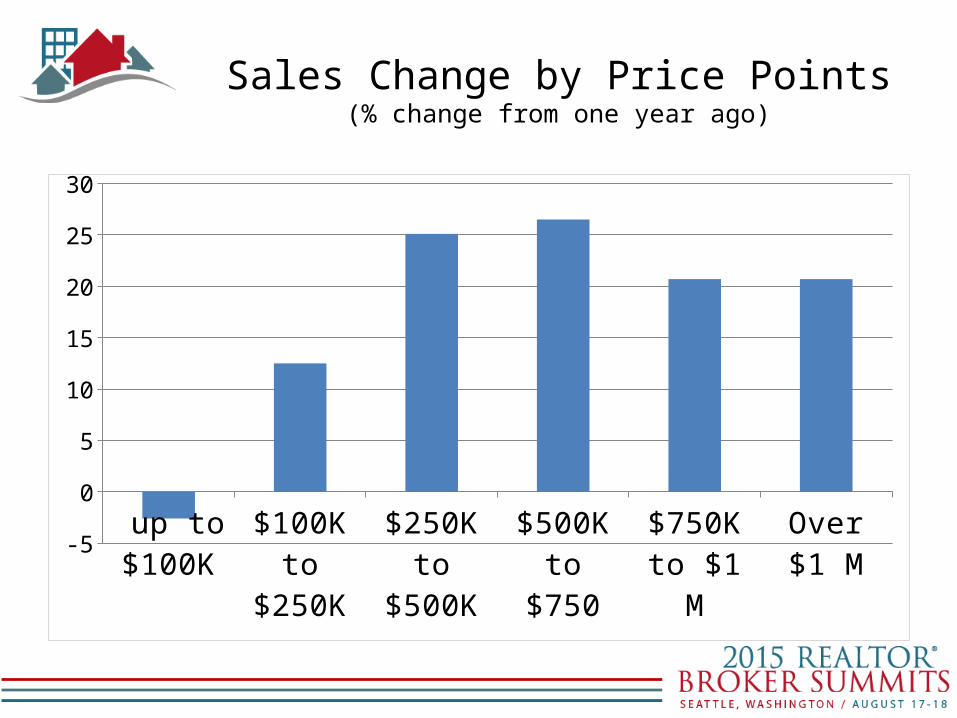
Sales Change by Price Points(% change from one year ago)
up to $100K
$100K to $250K
$250K to $500K
$500K to $750
$750K to $1 M
Over $1 M-5
0
5
10
15
20
25
30

Distressed Sales
2008 - Oct
2009 - Feb
2009 - Jun
2009 - Oct
2010 - Feb
2010 - Jun
2010 - Oct
2011 - Feb
2011 - Jun
2011 - Oct
2012 - Feb
2012 - Jun
2012 - Oct
2013 - Feb
2013 - Jun
2013 - Oct
2014 - Feb
2014 - Jun
2014 - Oct
2015 - Feb
2015 - Jun
0
10
20
30
40
50
60
Foreclosure Short-Sale
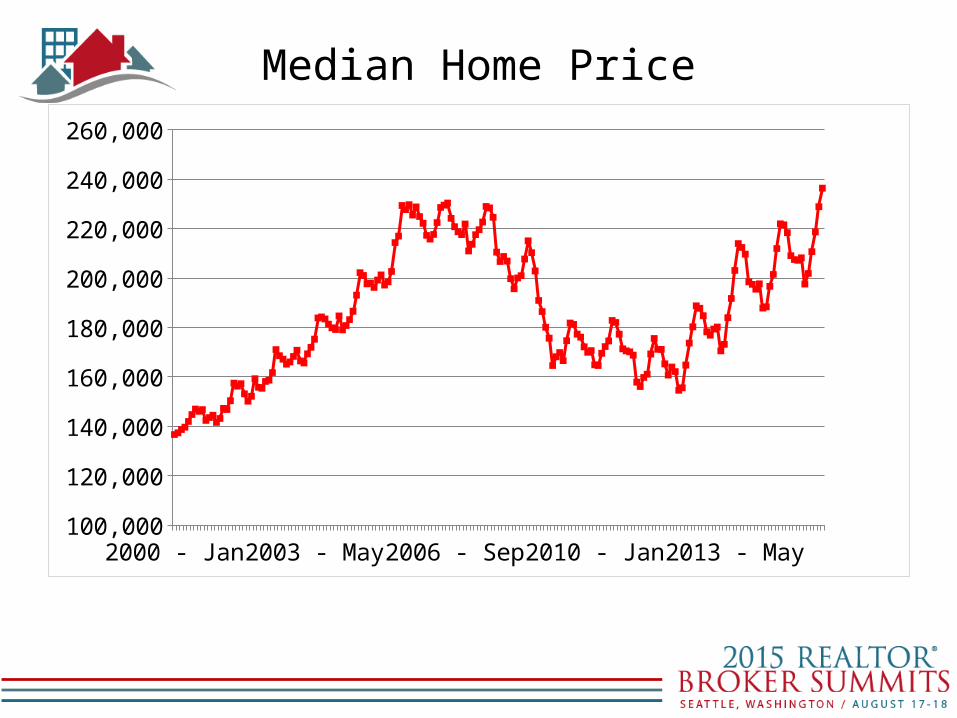
Median Home Price
2000 - Jan 2002 - Apr 2004 - Jul 2006 - Oct 2009 - Jan 2011 - Apr 2013 - Jul100,000
120,000
140,000
160,000
180,000
200,000
220,000
240,000
260,000
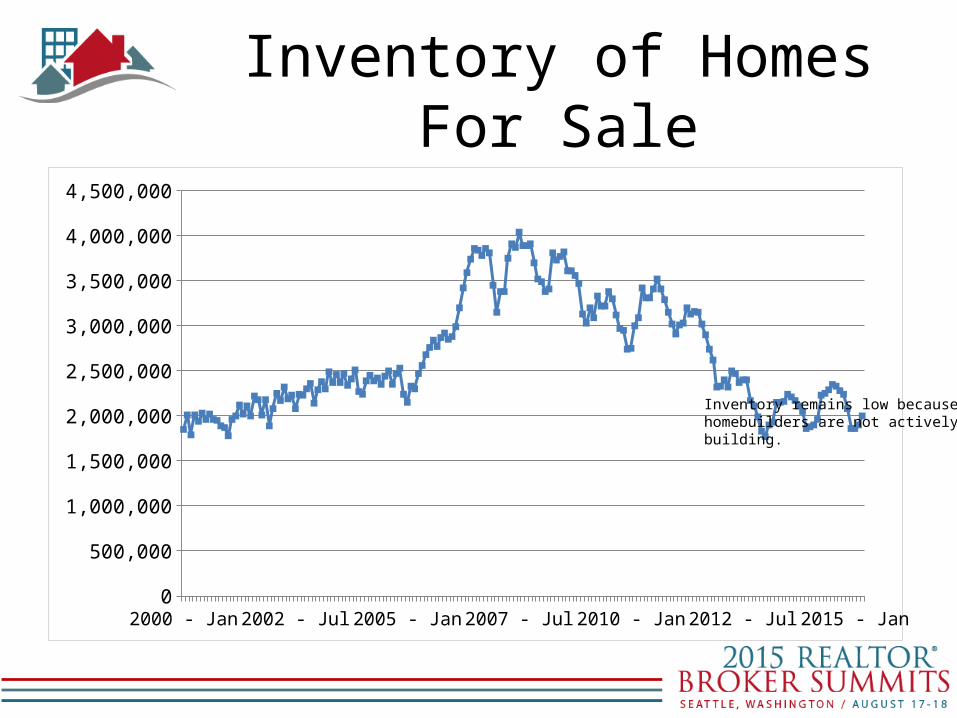
Inventory of Homes For Sale
2000 - Jan 2001 - Oct 2003 - Jul 2005 - Apr 2007 - Jan 2008 - Oct 2010 - Jul 2012 - Apr 2014 - Jan0
500,000
1,000,000
1,500,000
2,000,000
2,500,000
3,000,000
3,500,000
4,000,000
4,500,000
Inventory remains low becausehomebuilders are not activelybuilding.
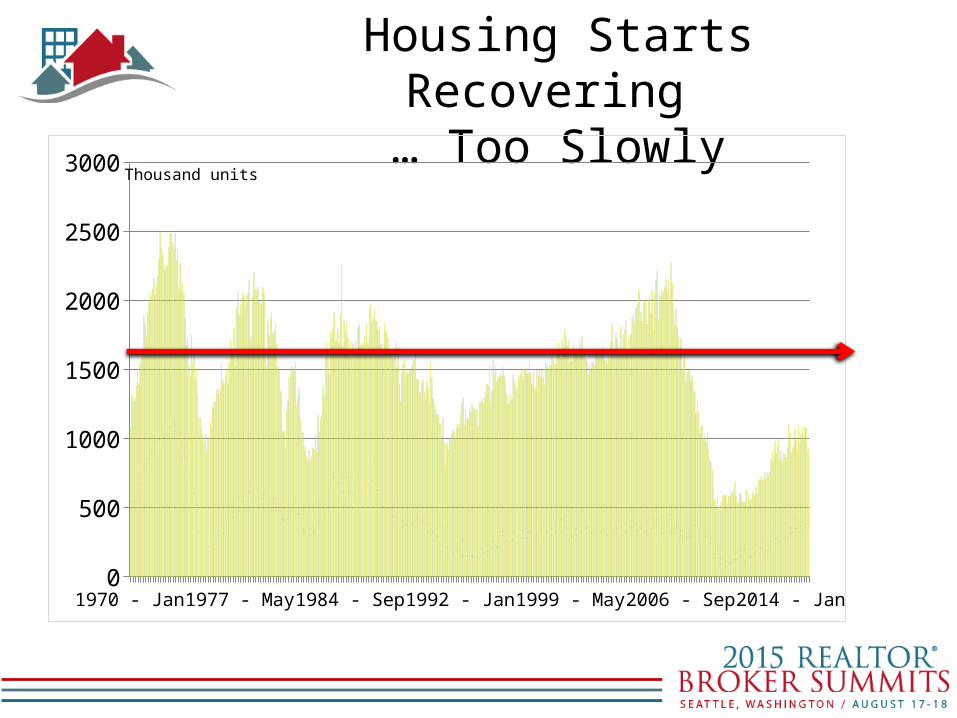
Housing Starts Recovering … Too Slowly
1970 - Jan 1975 - Jul 1981 - Jan 1986 - Jul 1992 - Jan 1997 - Jul 2003 - Jan 2008 - Jul 2014 - Jan0
500
1000
1500
2000
2500
3000Thousand units
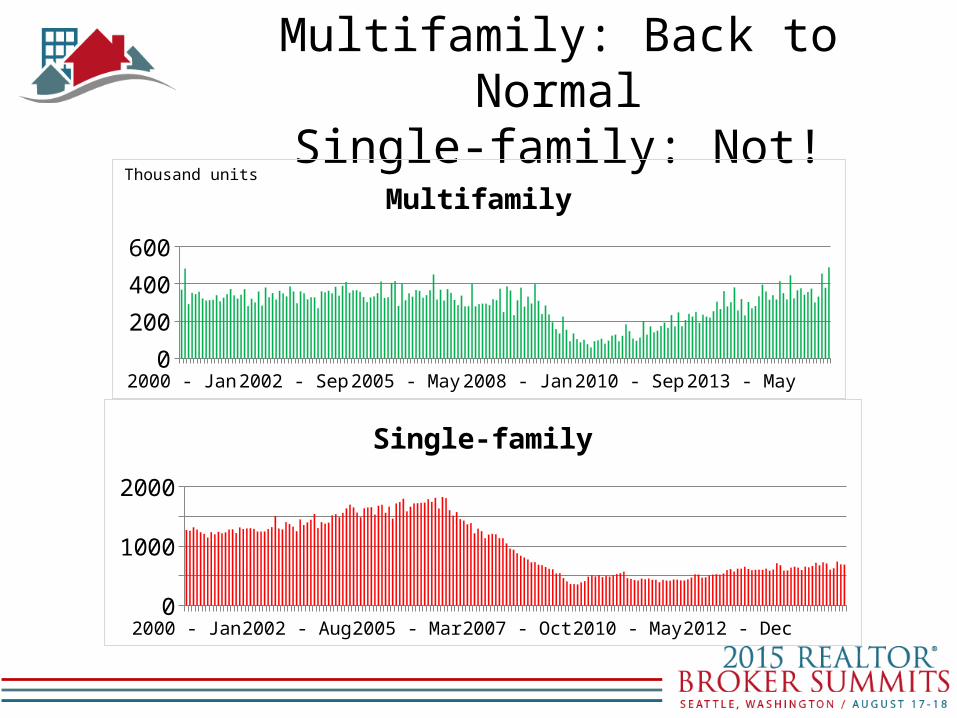
Multifamily: Back to NormalSingle-family: Not!
2000 - Jan 2002 - Jan 2004 - Jan 2006 - Jan 2008 - Jan 2010 - Jan 2012 - Jan 2014 - Jan0
200
400
600
MultifamilyThousand units
2000 - Jan 2002 - Jan 2004 - Jan 2006 - Jan 2008 - Jan 2010 - Jan 2012 - Jan 2014 - Jan0
500100015002000
Single-family
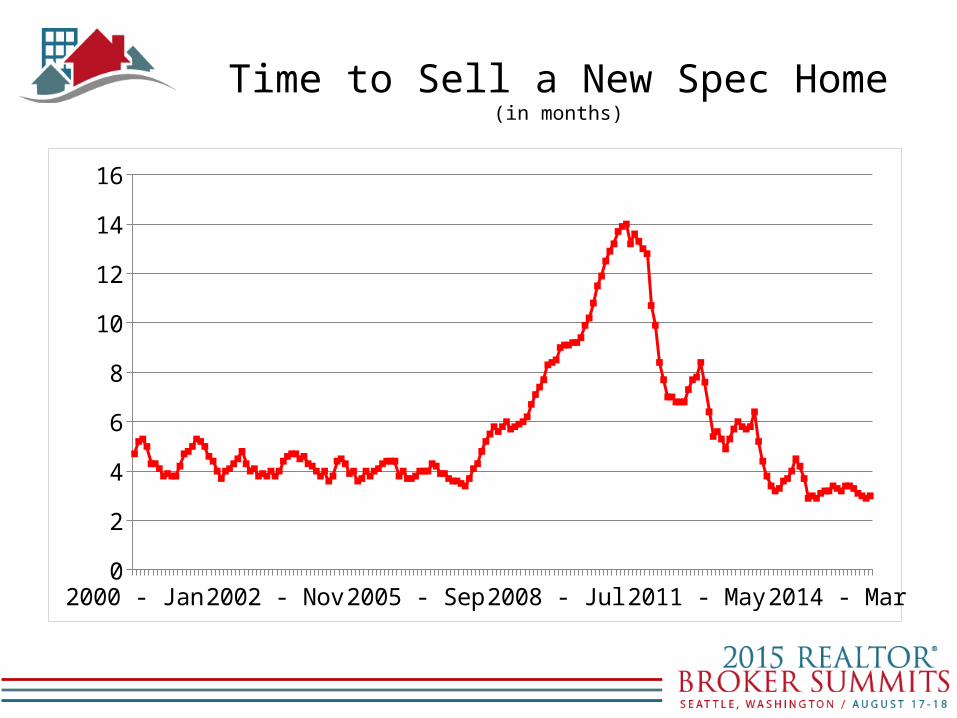
Time to Sell a New Spec Home(in months)
2000 - Jan 2002 - Jan 2004 - Jan 2006 - Jan 2008 - Jan 2010 - Jan 2012 - Jan 2014 - Jan0
2
4
6
8
10
12
14
16

Seattle Single-family Housing Permits
20002001
20022003
20042005
20062007
20082009
20102011
20122013
20142015
0
2000
4000
6000
8000
10000
12000
14000
16000
18000
20000

Buyer Traffic Conditions

New Consumer Survey

Trade-Up Opportunitiesfrom Housing Equity
2000 - Q1
2000 - Q4
2001 - Q3
2002 - Q2
2003 - Q1
2003 - Q4
2004 - Q3
2005 - Q2
2006 - Q1
2006 - Q4
2007 - Q3
2008 - Q2
2009 - Q1
2009 - Q4
2010 - Q3
2011 - Q2
2012 - Q1
2012 - Q4
2013 - Q3
2014 - Q2
2015 - Q1
0
5000
10000
15000
20000
25000
Real Estate Value Mortgage Debt
$ billion
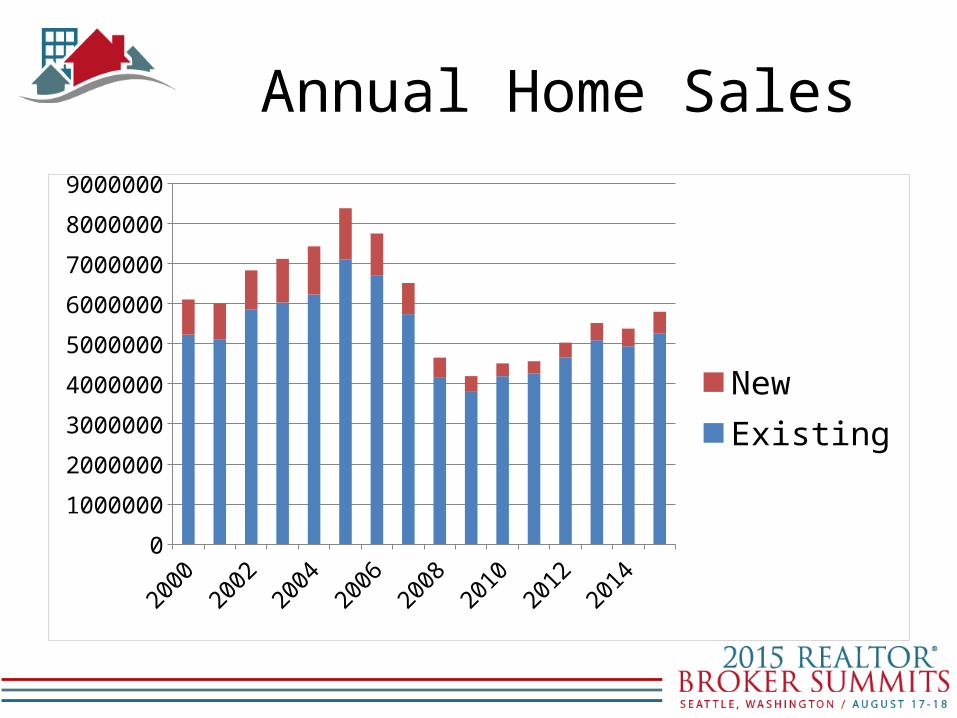
Annual Home Sales
20002001
20022003
20042005
20062007
20082009
20102011
20122013
20142015
0
1000000
2000000
3000000
4000000
5000000
6000000
7000000
8000000
9000000
NewExisting

New Price Bubble?
2005-2006 Bubble
• 7.2 m existing home sales
• 1.3 m new home sale
• Loose Credit
• 2.1 m housing starts
2015
• 5.3 m existing home sales
• 0.6 m new home sales
• Tight Credit and all-cash
• 1.1 m housing starts

Home Price Forecast for 2016 … 3% to 5%
First Scenario
• New construction slowly recover … housing shortage
• Prices initially rise fast
• Chokes demand and sales fall
• Home price grows 3% to 5%
• Not Desirable
Second Scenario
• New construction robustly recover … inventory relief
• Home price grows 3% to 5%
• Demand expands and sales rise
• Increase mobility and boost jobs
• Desirable

Monetary Policy andForecast

Fed Policy and Mortgage Rate
2000 - Jan 2002 - Jan 2004 - Jan 2006 - Jan 2008 - Jan 2010 - Jan 2012 - Jan 2014 - Jan0
1
2
3
4
5
6
7
8
9
Mortgage Rate Fed Funds Rate

What Determines Bond Yields?
• Federal Reserve’s short-term rate changes• Inflation and erosion of purchasing power• Foreign capital flow and demand for dollar• Savings rate• U.S. budget deficit• Printing of money• …
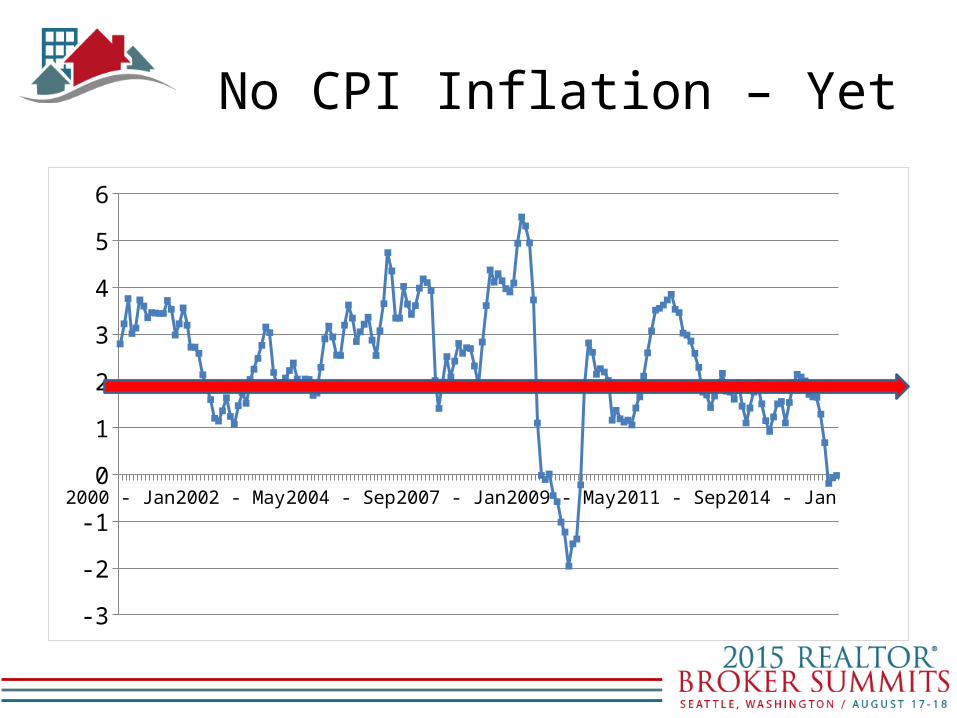
No CPI Inflation – Yet
2000 - Jan 2001 - Oct 2003 - Jul 2005 - Apr 2007 - Jan 2008 - Oct 2010 - Jul 2012 - Apr 2014 - Jan
-3
-2
-1
0
1
2
3
4
5
6
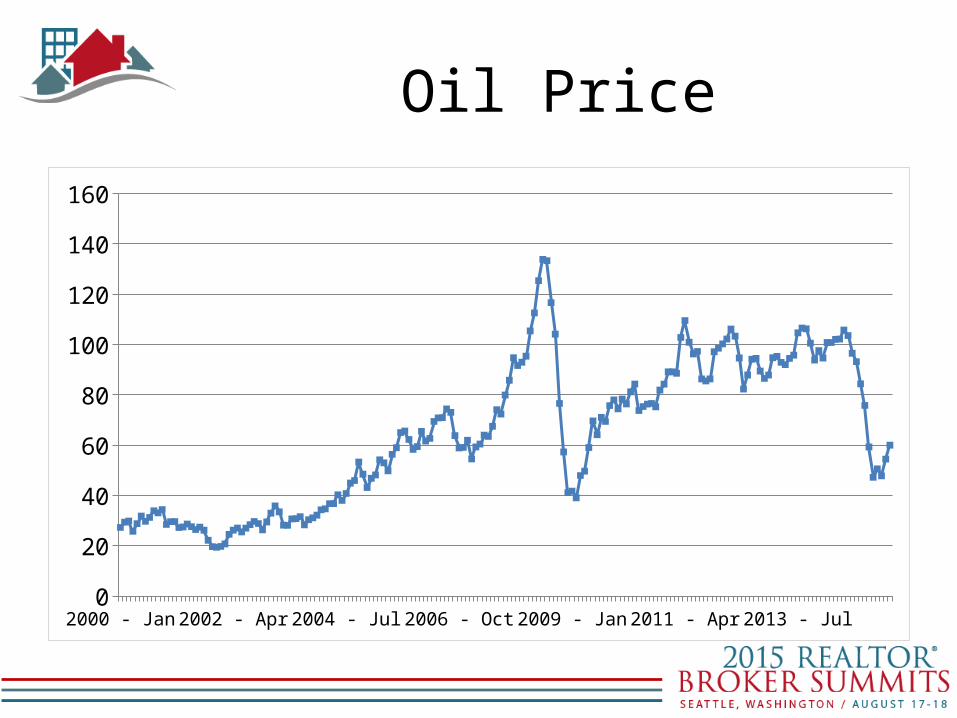
Oil Price
2000 - Jan 2001 - Oct 2003 - Jul 2005 - Apr 2007 - Jan 2008 - Oct 2010 - Jul 2012 - Apr 2014 - Jan0
20
40
60
80
100
120
140
160
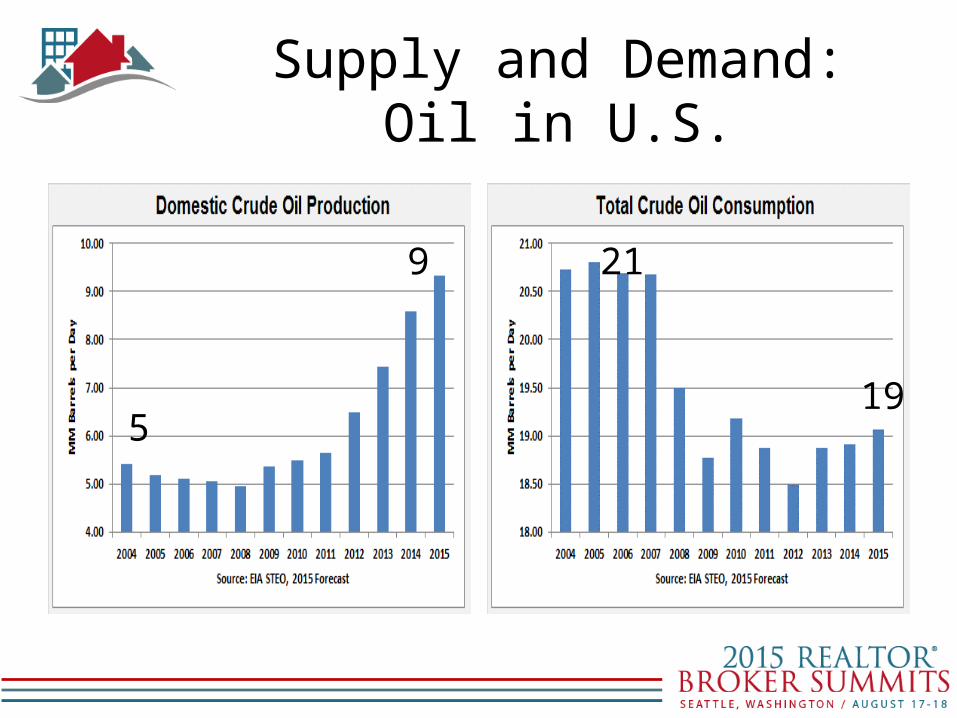
Supply and Demand: Oil in U.S.
19
21
5
9
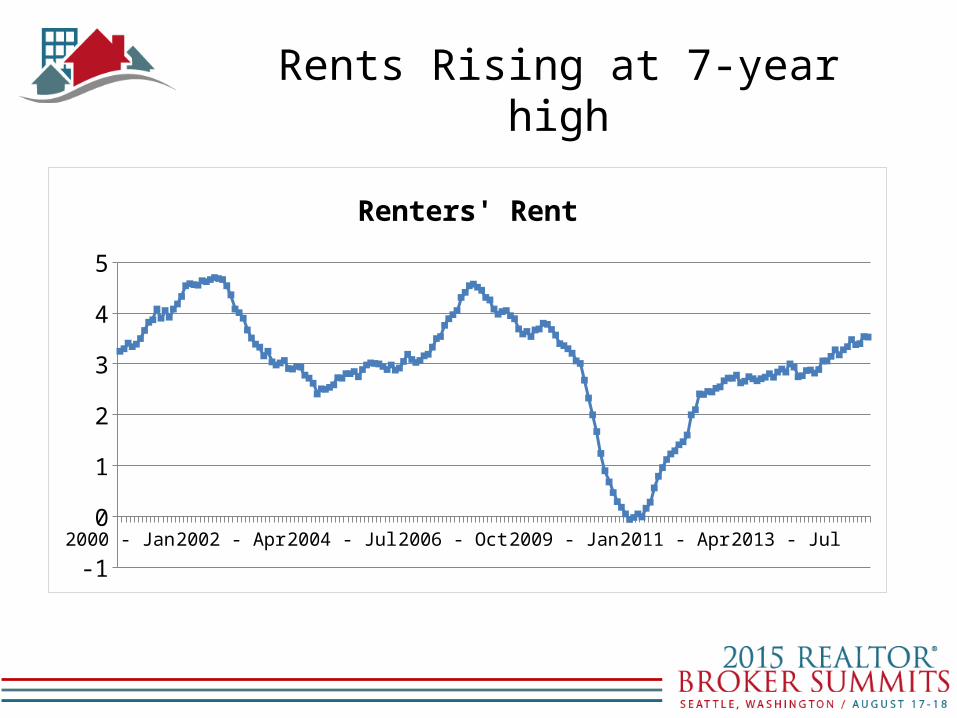
Rents Rising at 7-year high
2000 - Jan 2001 - Oct 2003 - Jul 2005 - Apr 2007 - Jan 2008 - Oct 2010 - Jul 2012 - Apr 2014 - Jan
-1
0
1
2
3
4
5
Renters' Rent

Rental Vacancy Rate(Census Measurement)
2000 - Q1
2000 - Q4
2001 - Q3
2002 - Q2
2003 - Q1
2003 - Q4
2004 - Q3
2005 - Q2
2006 - Q1
2006 - Q4
2007 - Q3
2008 - Q2
2009 - Q1
2009 - Q4
2010 - Q3
2011 - Q2
2012 - Q1
2012 - Q4
2013 - Q3
2014 - Q2
2015 - Q1
5
6
7
8
9
10
11
12
Rents will continue to rise because of historic low vacancy rate.

Monetary Policy
• Quantitative Easing … Finished
• Fed Funds Rate hike … September/October
• 10-year Treasury reaching – 2.5% by end of 2015 – 3.5% by end of 2016

Credit Box Opens?• FICO New Method• Fannie/Freddie
– Lower down payment products• FHA premiums … lowered • Portfolio Lending … historic low mortgage
default rates on recent vintages (2010-2014)

American Inequality?
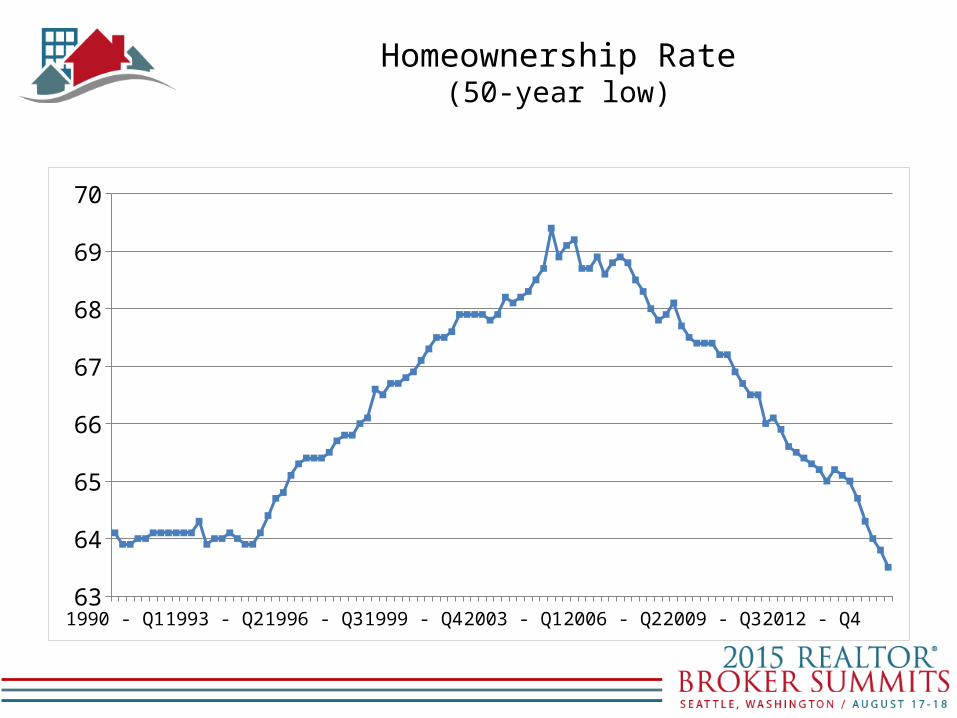
Homeownership Rate(50-year low)
1990 - Q1 1992 - Q4 1995 - Q3 1998 - Q2 2001 - Q1 2003 - Q4 2006 - Q3 2009 - Q2 2012 - Q1 2014 - Q463
64
65
66
67
68
69
70
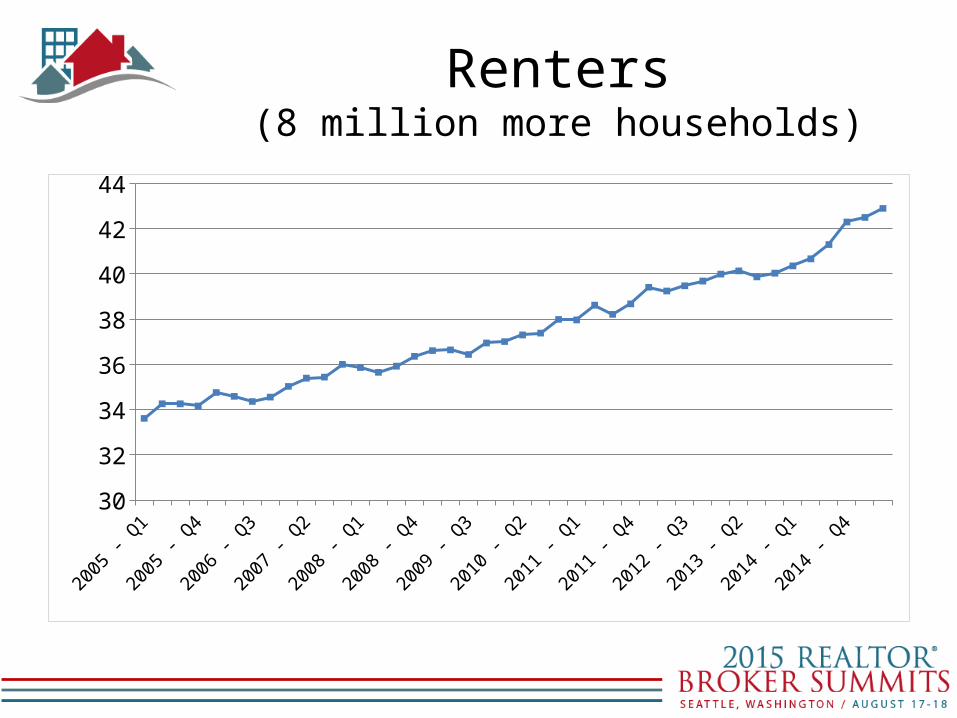
Renters(8 million more households)
2005 - Q1
2005 - Q3
2006 - Q1
2006 - Q3
2007 - Q1
2007 - Q3
2008 - Q1
2008 - Q3
2009 - Q1
2009 - Q3
2010 - Q1
2010 - Q3
2011 - Q1
2011 - Q3
2012 - Q1
2012 - Q3
2013 - Q1
2013 - Q3
2014 - Q1
2014 - Q3
2015 - Q1
30
32
34
36
38
40
42
44
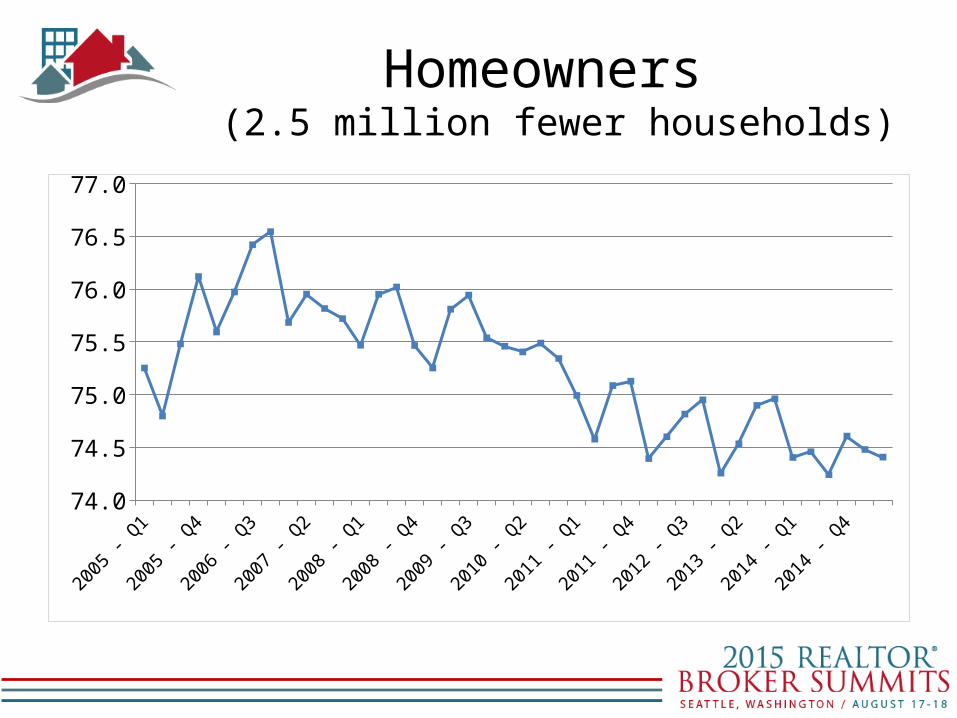
Homeowners (2.5 million fewer households)
2005 - Q1
2005 - Q3
2006 - Q1
2006 - Q3
2007 - Q1
2007 - Q3
2008 - Q1
2008 - Q3
2009 - Q1
2009 - Q3
2010 - Q1
2010 - Q3
2011 - Q1
2011 - Q3
2012 - Q1
2012 - Q3
2013 - Q1
2013 - Q3
2014 - Q1
2014 - Q3
2015 - Q1
74.0
74.5
75.0
75.5
76.0
76.5
77.0
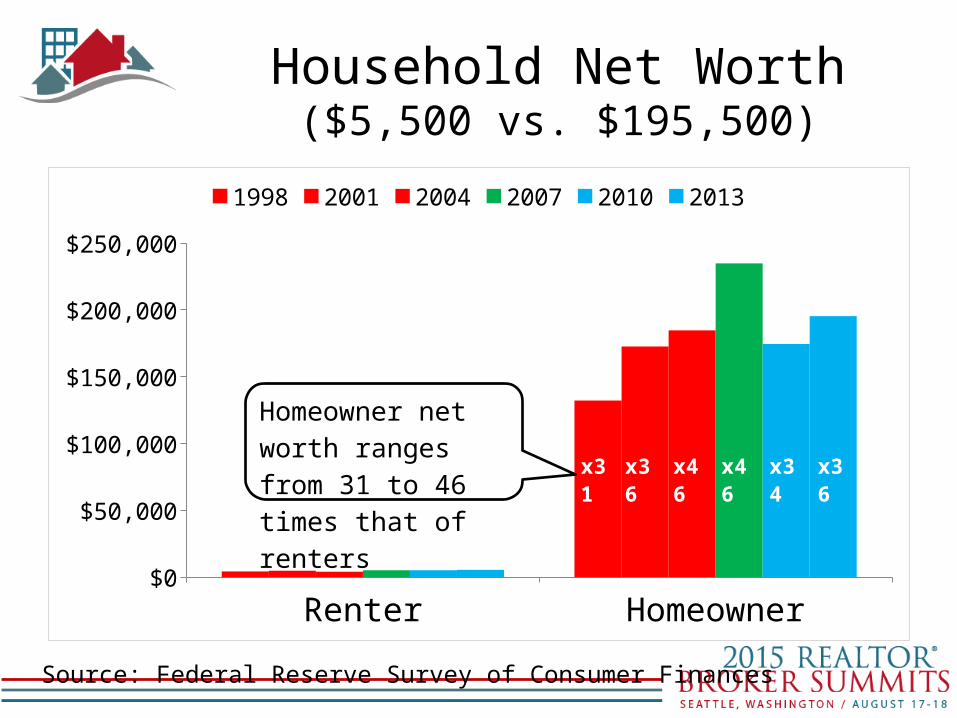
Household Net Worth($5,500 vs. $195,500)
Renter Homeowner$0
$50,000
$100,000
$150,000
$200,000
$250,000
1998 2001 2004 2007 2010 2013
x31 x46x36 x34x46
Homeowner net worth ranges from 31 to 46 times that of renters x36
Source: Federal Reserve Survey of Consumer Finances

Stock MarketS&P 500 Index
2000 - Jan 2002 - Jan 2004 - Jan 2006 - Jan 2008 - Jan 2010 - Jan 2012 - Jan 2014 - Jan700
900
1100
1300
1500
1700
1900
2100
2300
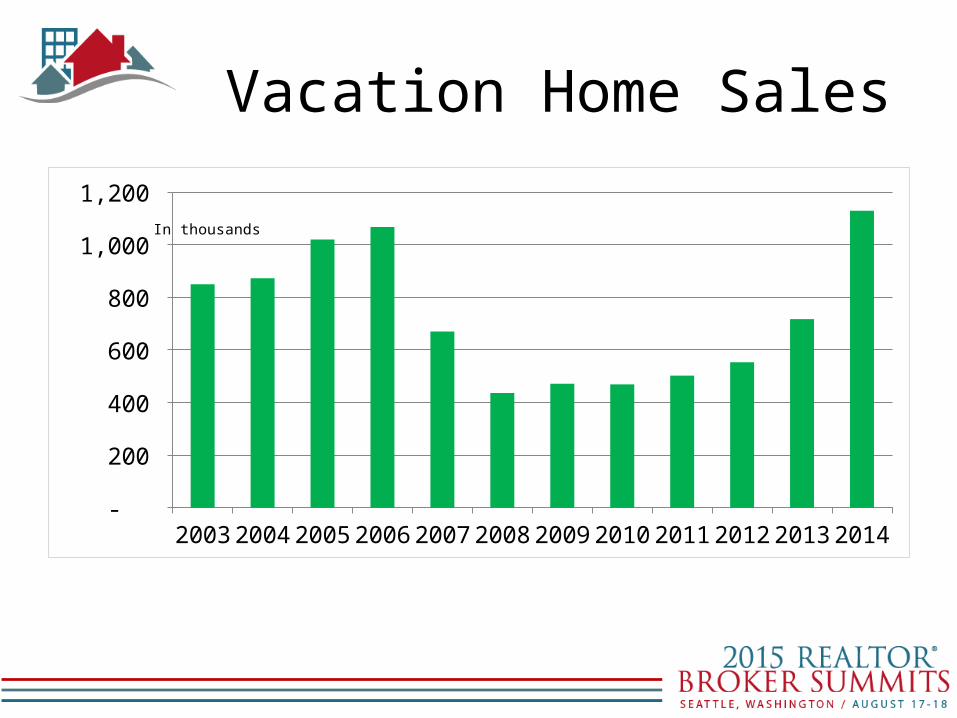
Vacation Home Sales
2003 2004 2005 2006 2007 2008 2009 2010 2011 2012 2013 2014 -
200
400
600
800
1,000
1,200
In thousands

Forecast and Risks
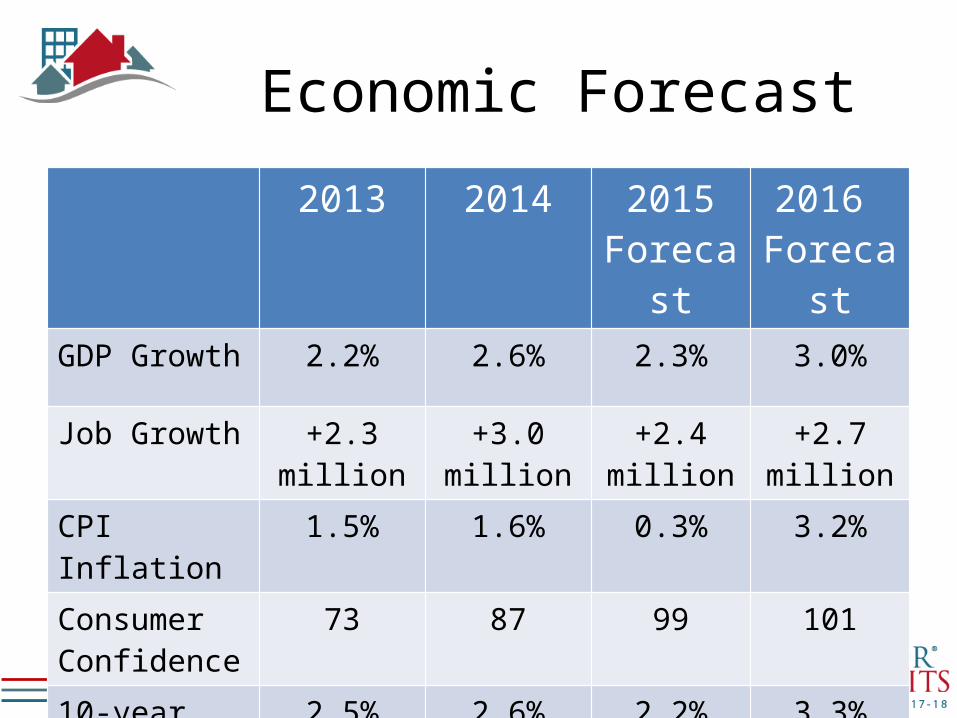
Economic Forecast2013 2014 2015
Forecast2016
ForecastGDP Growth 2.2% 2.6% 2.3% 3.0%
Job Growth +2.3 million +3.0 million +2.4 million
+2.7 million
CPI Inflation 1.5% 1.6% 0.3% 3.2%
Consumer Confidence
73 87 99 101
10-year Treasury
2.5% 2.6% 2.2% 3.3%

Housing Forecast
2013 2014 2015Forecast
2016 Forecast
Housing Starts 925,000 1 million 1.1 million 1.4 million
New Home Sales
430,000 437,000 570,000 720,000
Existing Home Sales
5.1 million 4.9 million 5.3 million 5.5 million
Median Price Growth
+ 11.5% + 5.7% + 6% + 4%
30-year Rate 4.0% 4.2% 4.0% 5.2%
Underwriting Standards
Strict Strict Transition Normal

Washington Risks
• TRID?• Mortgage Availability?• Tax Preference Changes?
State and Local Risks• Foreclosure rules?• Eminent Domain?• Tax Preference Changes?

Commercial Real Estate

Commercial Investment Sales of Large Properties(Properties valued at $2.5 million and over)
2003 2004 2005 2006 2007 2008 2009 2010 2011 2012 2013 2014 2015 2016
130
212
362
423
571
174
67
147
233
299355
424470
500
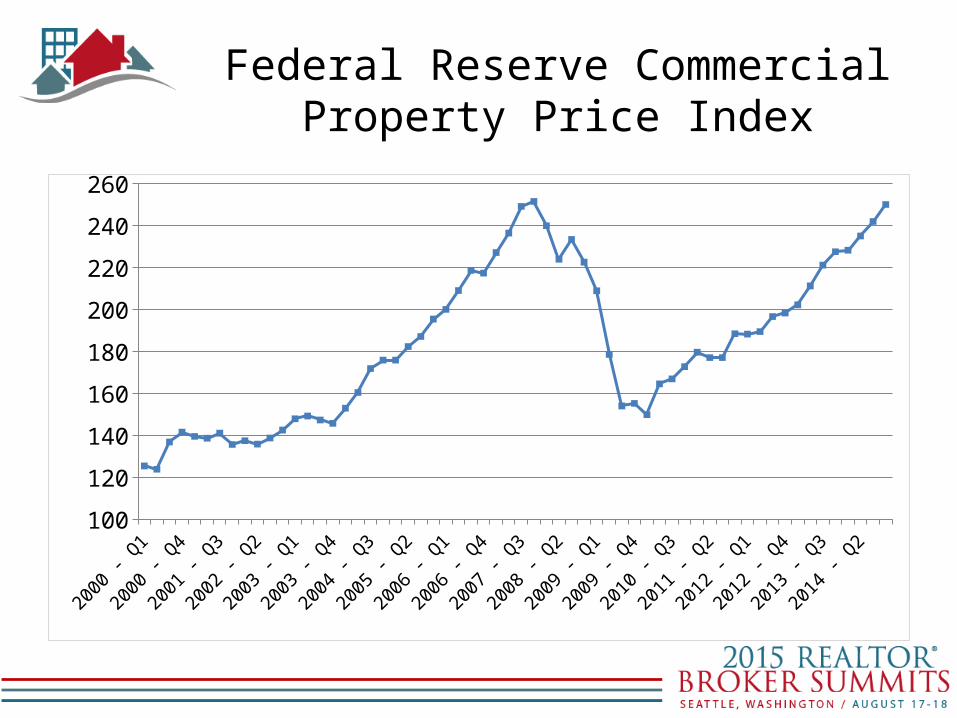
Federal Reserve Commercial Property Price Index
2000 - Q1
2000 - Q4
2001 - Q3
2002 - Q2
2003 - Q1
2003 - Q4
2004 - Q3
2005 - Q2
2006 - Q1
2006 - Q4
2007 - Q3
2008 - Q2
2009 - Q1
2009 - Q4
2010 - Q3
2011 - Q2
2012 - Q1
2012 - Q4
2013 - Q3
2014 - Q2
100
120
140
160
180
200
220
240
260
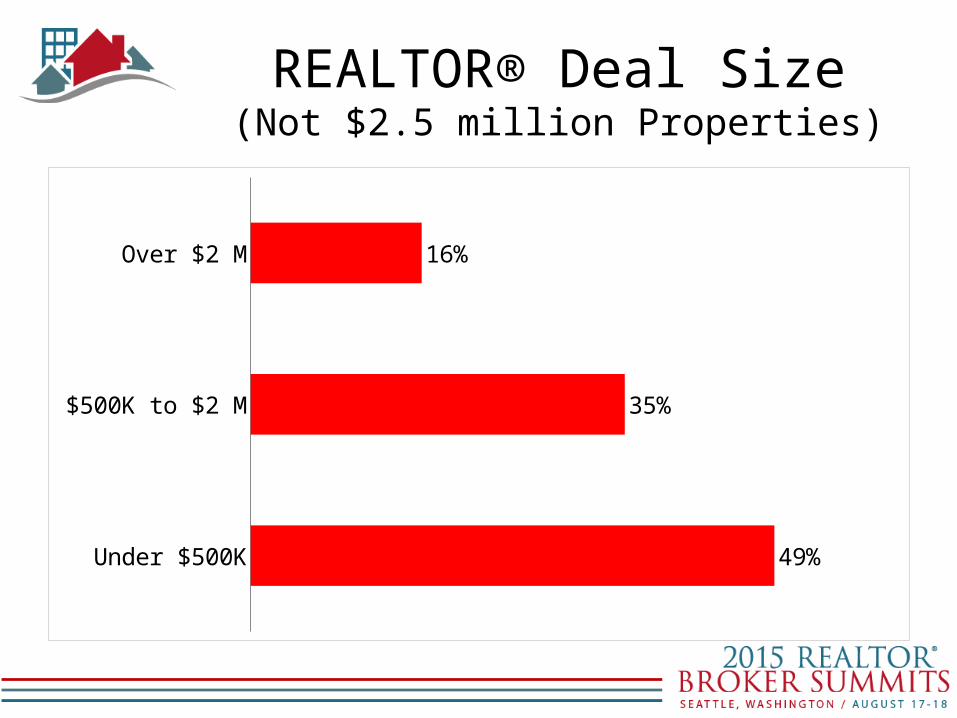
REALTOR® Deal Size(Not $2.5 million Properties)
Under $500K
$500K to $2 M
Over $2 M
49%
35%
16%

8%
17%
25%
7%
6%
4%
18%
1% 11%
3%National banks (“Big four”)
Regional banks
Local banks
Credit unions
Life insurance companies
REITs
Private investors
Public companies
Small Business Administration
Other, please specify
Source: NAR
Sources of Financing for Deals

Dodd-Frank?
• Big homebuilders in the game• Small homebuilders not really in the game
• Big commercial deals happening• Small commercial deals slowly happening
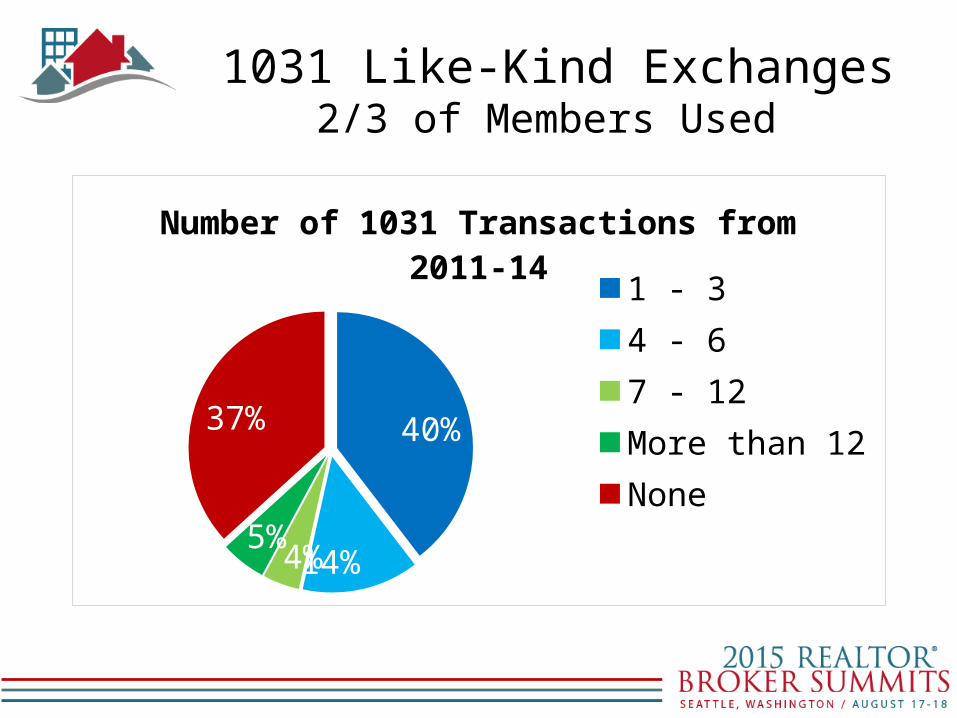
1031 Like-Kind Exchanges2/3 of Members Used
40%
14%4%5%
37%
Number of 1031 Transactions from 2011-14
1 - 34 - 67 - 12More than 12None