Embed Size (px)
Citation preview
Economic Analysis of TTIP
Gabriel Felbermayr
Ifo Working Paper No. 215
April 2016
An electronic version of the paper may be downloaded from the Ifo website www.cesifo-group.de.
Ifo Institute – Leibniz Institute for Economic Research at the University of Munich
Ifo Working Paper No. 215
Economic Analysis of TTIP
Abstract The sheer size of the EU and US economies combined suggests substantial economic
benefits from eliminating tariffs, reducing the costs of regulatory divergence, and
deepening cooperation. Estimating these gains is difficult: uncertainty concerning
modelling choices, data, and scenarios looms large. However, the economic potential of
a well-done agreement is substantial. Critics are wrong by dismissing the gains as
microscopic. By now, a large number of scholarly studies exist which demonstrate gains
on the level of GDP per capita from 0.5 to 4.0% for the EU and a similar span for the
US. Almost all of the gains arise from lower non-tariff barriers and in the form of lower
prices of final and intermediary goods, higher product variety, and higher productivity.
Virtually all EU member states benefit, while TTIP outsiders may lose. Estimates of job
gains are even more uncertain, long-run effects are likely to be small and positive. TTIP
could increase economic inequality, but the effects will be modest as the structure of
comparative advantage between the two partner regions is rather similar. All existing
studies rely on static models; neglecting effects on R&D, technology adoption, or
human capital formation, they represent lower bounds to the true benefits.
JEL Code: F10; F13.
Keywords: TTIP, non-tariff barriers.
Gabriel Felbermayr Ifo Institute – Leibniz Institute for
Economic Research at the University of Munich,
University of Munich, CESifo, GEP Nottingham
Poschingerstr. 5 81679 Munich, Germany
Phone: +49(0)89/9224-1428 [email protected]
2 Economic Analysis of TTIP
1. Introduction
The controversial public debate on the proposed Transatlantic Trade and Investment Partnership
(TTIP) has focused on many aspects, ranging from the infamous chlorinated chicken to issues
concerning constitutional law. It has also touched the economic modeling of such deep and
comprehensive international agreements. One line of attack of the anti-TTIP groups, forcefully
verbalized by Bode (2015), is that the risks of the agreement are potentially very large while the
economic advantages are negligible. The German trade unionist Detlef Wetzel argued that the
expected gains are so microscopic that the usual variation in weather conditions is more im-
portant for GDP growth1. Similar arguments are used in the US presidential campaign to dis-
credit the proposed Transpacific Partnership (TPP), once a matter for bipartisan support.
There has also been a substantial amount of misinterpretation of simulation results, both by
proponents and by antagonists. Estimations of potentials have been wrongly interpreted as pre-
dictions; level effects on flow variables (such as GDP) have been mistaken for growth rates
effects; and differences in results due to differences in scenarios have been taken as evidence for
the low predictive power of models. All this has prompted the German vice chancellor Sigmar
Gabriel to describe the TTIP models as “voodoo economics”2. What has once been the playing
ground of trade scholars and a few experts has become a hotly debated matter in party conven-
tions, parish councils, or family reunions. In the public communication of the EU Commission,
of member state administrations or of trade associations, estimates of economic gains play al-
most no role. This is a pity, because they do contain valuable information. This chapter aims at
clarifying what the estimates can teach and what they cannot.
The variance of results on the trade, welfare, wage and employment effects of TTIP can be be-
wildering at times and the differences hard to explain to non-experts. Therefore, it is no wonder
that the secondary literature on the quantitative studies is full of misunderstandings. This chap-
ter tries to explain why different studies come to different quantitative and qualitative conclu-
sions. The main reasons for divergence are the following:
(i) Studies differ with respect to the definition of the scenario, ie, the extent to which
researchers think that TTIP will reduce barriers to international trade.
(ii) Data related issues also loom large in explaining different results. Studies employ
different methods for pinning down non-tariff trade barriers (NTBs), they employ
different base years, and choose different parameterizations.
(iii) Finally, model structure turns out important, too. Single-sector models tend to de-
liver more optimistic outcomes for insiders to TTIP but more pessimistic ones for
outsiders, while multi-sector models focusing on international value chains predict a
stronger diffusion of effects around the globe.
Besides explaining differences, this chapter also tries to identify results which robustly emerge
across the large number of quantitative studies on TTIP that now exist. These are:
(i) Almost all studies agree that TTIP would increase real per capita income in the EU and the
US; these gains need time to ramp up but permanently increase the level of per capita in-
come.
1 www.fr-online.de/wirtschaft/freihandelsabkommen-eu-usa--freihandelsabkommen-sofort-stoppen-,1472780,26460308.html . 2 www.handelsblatt.com/politik/international/gabriel-zum-handelsabkommen-berechnungen-zu-ttip-sind-voodoo-
oekonomie/11621820.html .
3 Economic Analysis of TTIP
(ii) All studies agree that the mere elimination of tariffs would have only very small effects.
The positive effects almost exclusively come from lower non-tariff costs. On the one hand,
tariffs are already low across the Atlantic, on the other hand, the elimination of tariffs has
budgetary consequences which need to be taken into account.
(iii) When studies present country-level detail for the EU, they agree that virtually all member
states win. This is not a trivial prediction due to possible within-EU trade diversion (terms-
of-trade) effects.
(iv) Studies also tend to agree that gains are not huge, but that they are larger than what one
could obtain from other realistically pursuable trade agreements.
(v) All studies concur that the bulk of gains derives from measures in the area of non-tariff
barriers, ie, the simplification of bureaucratic procedures, regulatory convergence, and the
optimization of rules.
(vi) Almost all studies conclude that some third countries would lose from the initiative, unless
trade costs for outsiders go down as well due to what is called spillover effects, ie, by es-
tablishing world standards and thus lowering trade costs for outsiders, too. In this case,
both outsiders and insiders would see gains from the agreement go up. Moreover, TTIP is
not a zero-sum game: world GDP would increase.
(vii) All studies are static in the sense that they neglect effects on firms’ incentives to engage in
research and development, the adaptation of new technology, or investment in human capi-
tal. Therefore, they represent lower bounds of the true potential.
Hoping to improve the understanding of different approaches, of their relative merits and weak-
nesses, this chapter could lead to a more balanced and nuanced discussion on TTIP. It may also
inform a similar debate on the benefits of TPP. It is also applicable to other European trade
agreements being in the process of ratification, negotiation, or deliberation, such as CETA (the
EU-Canada Comprehensive Economic Trade Agreement), the deal currently negotiated with
Japan, or the proposed negotiations with Australia and New Zealand.
In the following, we explain how to read the results of quantitative studies, we go through sev-
eral reasons that lead to divergence in modeling results, and we touch on those sensitive issues
on which models can shed light (eg, effects on developing countries)3. We start with an over-
view of methods employed and results obtained in the most important studies.
3 We remain silent on elements of the public debate which have not yet been addressed using economic modeling, such as settlement of investment disputes.
4 Economic Analysis of TTIP
2. Overview of methods and results
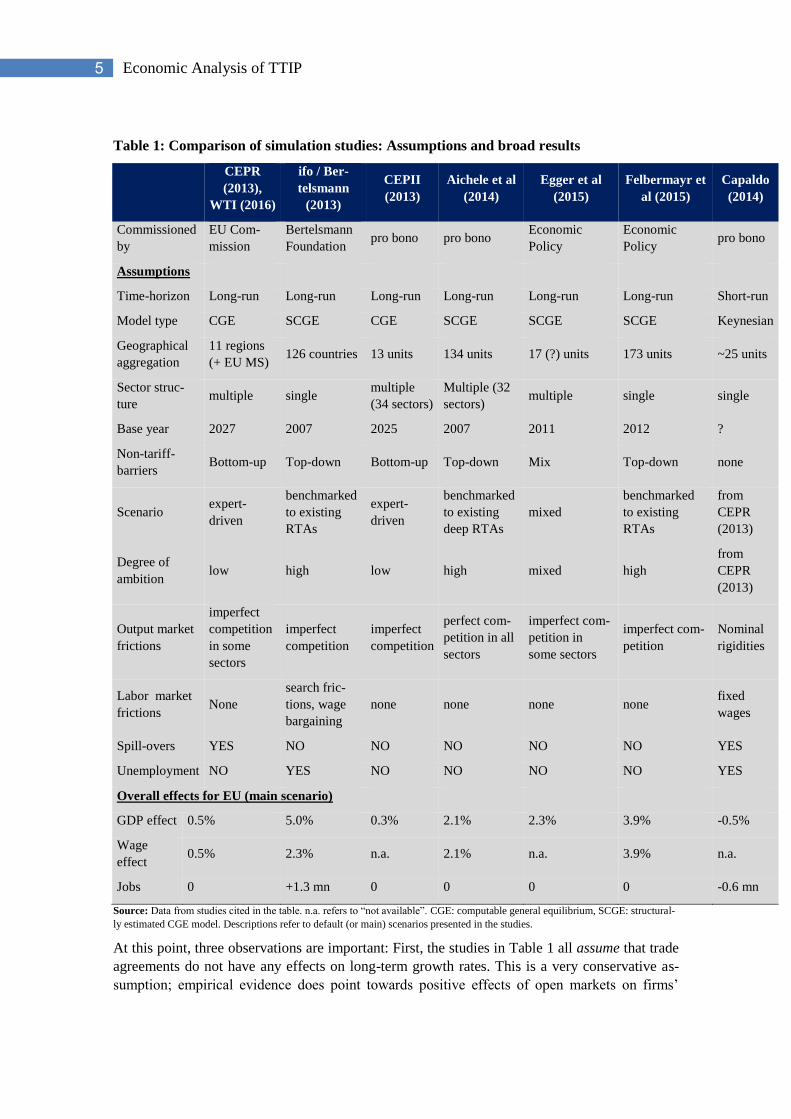
Table 1 shows how a number of studies on TTIP differ with respect to their employed method-
ologies and overall results4. Starting from the bottom of the table, it is obvious that the cited
studies have produced a wide range of estimates from very optimistic and positive to rather
depressing and negative.
The study commissioned by the EU Commission in 2013 and carried out by the London-based
research network CEPR (Center for Economic Policy Research) reports a long-run GDP effect
of 0.5% for the EU; the ifo-Bertelsmann study from the same year finds an (unweighted) aver-
age effect that is almost 10 times as big. The study with the smallest reported GDP effect is the
one conducted by the Paris think tank CEPII. It finds a GDP gain of 0.3%. More recent studies
update the earlier ones. For example, Egger et al (2015) uses the same model as CEPR (2013)
and has an overlapping team of authors, but it finds an average effect for the EU that is almost
five times as big. Felbermayr et al. (2015) update the earlier ifo-Bertelsmann model, using more
recent data and a larger country sample; they find an average effect on GDP of 3.9%. Both, the
Egger et al (2015) and the Felbermayr et al (2015) have been commissioned by Economic Poli-
cy, a scholarly journal devoted to the scientific analysis of economic policy. Aichele et al (2014)
find a GDP effect of 2.1%. The only study predicting a negative GDP effect is the one by Ca-
paldo (2014); it is structurally very different from the other cited works and cannot be easily
compared. Before we delve into a detailed discussion of methods and results, it is important to
understand the nature of the cited GDP effects.
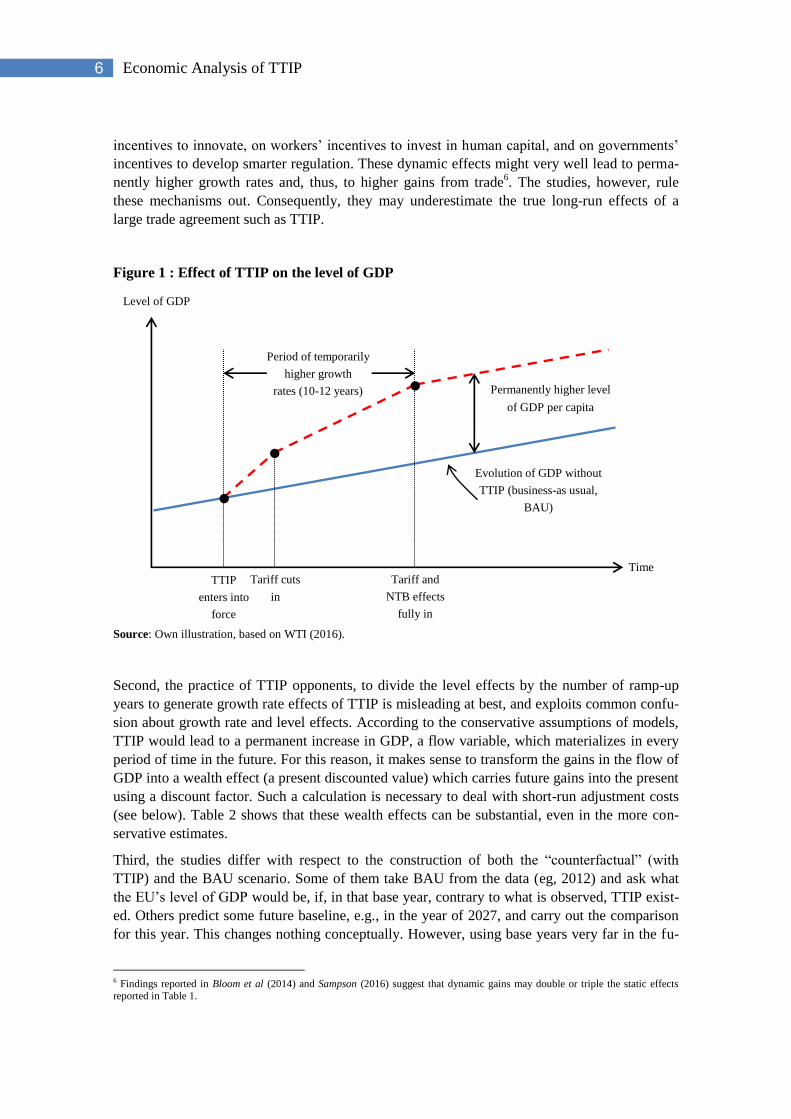
Figure 1 illustrates how the numbers reported in Table 1 have to be read5. They refer to the dif-
ference between a “TTIP-Scenario” (however defined) and a business-as-usual (BAU) baseline
scenario, which describes the situation without TTIP. A long-run gain of about 2% (as in
Aichele et al, 2014) means that the level of GDP “in some future” would be permanently 2%
higher with TTIP than without the agreement. The term “in some future” means that the agree-
ment would certainly not yield all its effects on the day of its ratification; rather, tariff reduc-
tions in sensitive industries will be gradual and regulatory cooperation will take time to bring
NTM-related costs down. The ramp-up period during which the agreement becomes effective
could take 10-12 years; in certain sectors even more. During that ramp-up period, the level of
GDP grows faster than it would without TTIP; in the long-run, the growth rate effects of TTIP
vanish, but the higher level of GDP remains.
4 The table shows only a subset of quantitative studies which have been written on TTIP in the last years. However, the sample is
meant to be representative. The reader is directed to Krebs and Pflüger (2015) for a study that bears resemblance to Aichele et al (2014), to Carrere et al (2015) which combines elements of ifo-Bertelsmann and Aichele et al (2014), and to numerous country-
level studies (eg, for Sweden, Austria, the United Kingdom) which draw on either the CEPR (2013) methods (or close cousins)
thereof, or on ifo-Bertelsmann (2013). 5 The Capaldo (2014) study has to be interpreted differently; see below.
5 Economic Analysis of TTIP
Table 1: Comparison of simulation studies: Assumptions and broad results
CEPR
(2013),
WTI (2016)
ifo / Ber-
telsmann
(2013)
CEPII
(2013)
Aichele et al
(2014)
Egger et al
(2015)
Felbermayr et
al (2015)
Capaldo
(2014)
Commissioned
by
EU Com-
mission
Bertelsmann
Foundation pro bono pro bono
Economic
Policy
Economic
Policy pro bono
Assumptions
Time-horizon Long-run Long-run Long-run Long-run Long-run Long-run Short-run
Model type CGE SCGE CGE SCGE SCGE SCGE Keynesian
Geographical
aggregation
11 regions
(+ EU MS) 126 countries 13 units 134 units 17 (?) units 173 units ~25 units
Sector struc-
ture multiple single
multiple
(34 sectors)
Multiple (32
sectors) multiple single single
Base year 2027 2007 2025 2007 2011 2012 ?
Non-tariff-
barriers Bottom-up Top-down Bottom-up Top-down Mix Top-down none
Scenario expert-
driven
benchmarked
to existing
RTAs
expert-
driven
benchmarked
to existing
deep RTAs
mixed
benchmarked
to existing
RTAs
from
CEPR
(2013)
Degree of
ambition low high low high mixed high
from
CEPR
(2013)
Output market
frictions
imperfect
competition
in some
sectors
imperfect
competition
imperfect
competition
perfect com-
petition in all
sectors
imperfect com-
petition in
some sectors
imperfect com-
petition
Nominal
rigidities
Labor market
frictions None
search fric-
tions, wage
bargaining
none none none none fixed
wages
Spill-overs YES NO NO NO NO NO YES
Unemployment NO YES NO NO NO NO YES
Overall effects for EU (main scenario)
GDP effect 0.5% 5.0% 0.3% 2.1% 2.3% 3.9% -0.5%
Wage
effect 0.5% 2.3% n.a. 2.1% n.a. 3.9% n.a.
Jobs 0 +1.3 mn 0 0 0 0 -0.6 mn
Source: Data from studies cited in the table. n.a. refers to “not available”. CGE: computable general equilibrium, SCGE: structural-
ly estimated CGE model. Descriptions refer to default (or main) scenarios presented in the studies.
At this point, three observations are important: First, the studies in Table 1 all assume that trade
agreements do not have any effects on long-term growth rates. This is a very conservative as-
sumption; empirical evidence does point towards positive effects of open markets on firms’
6 Economic Analysis of TTIP
incentives to innovate, on workers’ incentives to invest in human capital, and on governments’
incentives to develop smarter regulation. These dynamic effects might very well lead to perma-
nently higher growth rates and, thus, to higher gains from trade6. The studies, however, rule
these mechanisms out. Consequently, they may underestimate the true long-run effects of a
large trade agreement such as TTIP.
Figure 1 : Effect of TTIP on the level of GDP
Source: Own illustration, based on WTI (2016).
Second, the practice of TTIP opponents, to divide the level effects by the number of ramp-up
years to generate growth rate effects of TTIP is misleading at best, and exploits common confu-
sion about growth rate and level effects. According to the conservative assumptions of models,
TTIP would lead to a permanent increase in GDP, a flow variable, which materializes in every
period of time in the future. For this reason, it makes sense to transform the gains in the flow of
GDP into a wealth effect (a present discounted value) which carries future gains into the present
using a discount factor. Such a calculation is necessary to deal with short-run adjustment costs
(see below). Table 2 shows that these wealth effects can be substantial, even in the more con-
servative estimates.
Third, the studies differ with respect to the construction of both the “counterfactual” (with
TTIP) and the BAU scenario. Some of them take BAU from the data (eg, 2012) and ask what
the EU’s level of GDP would be, if, in that base year, contrary to what is observed, TTIP exist-
ed. Others predict some future baseline, e.g., in the year of 2027, and carry out the comparison
for this year. This changes nothing conceptually. However, using base years very far in the fu-
6 Findings reported in Bloom et al (2014) and Sampson (2016) suggest that dynamic gains may double or triple the static effects reported in Table 1.
Time
Level of GDP
Period of temporarily
higher growth
rates (10-12 years) Permanently higher level
of GDP per capita
TTIP
enters into
force
Tariff cuts
in
Tariff and
NTB effects
fully in
Evolution of GDP without
TTIP (business-as usual,
BAU)
7 Economic Analysis of TTIP
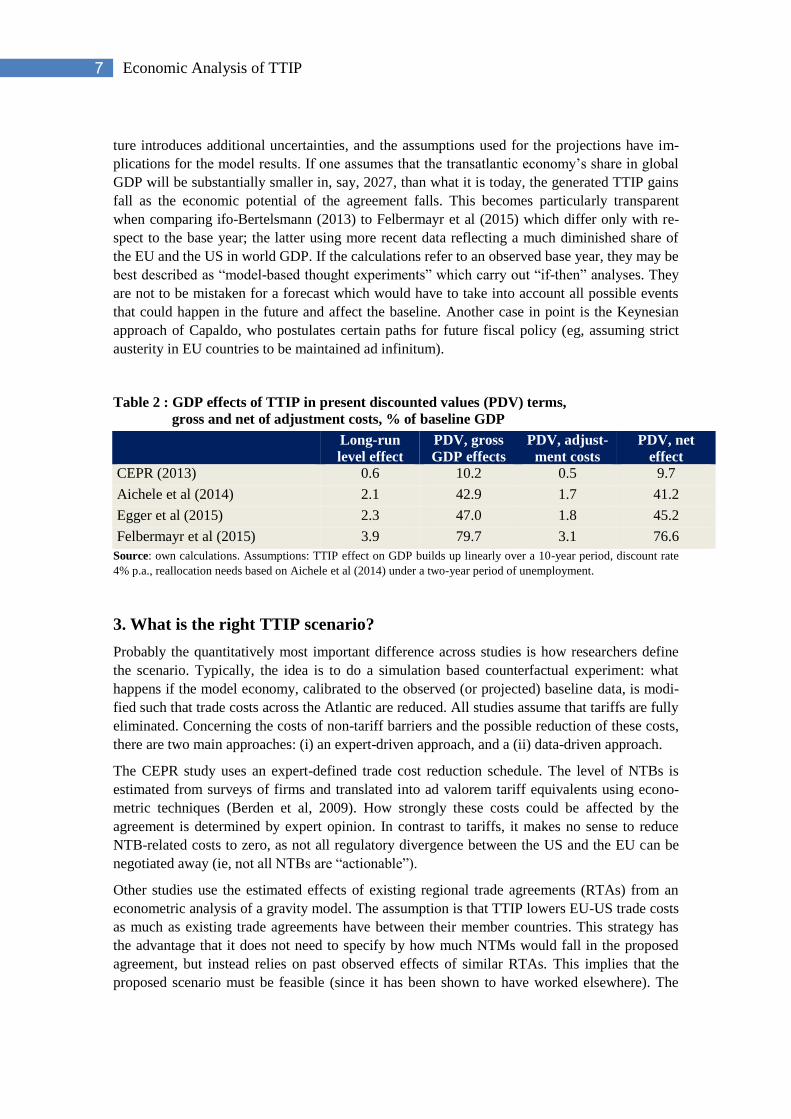
ture introduces additional uncertainties, and the assumptions used for the projections have im-
plications for the model results. If one assumes that the transatlantic economy’s share in global
GDP will be substantially smaller in, say, 2027, than what it is today, the generated TTIP gains
fall as the economic potential of the agreement falls. This becomes particularly transparent
when comparing ifo-Bertelsmann (2013) to Felbermayr et al (2015) which differ only with re-
spect to the base year; the latter using more recent data reflecting a much diminished share of
the EU and the US in world GDP. If the calculations refer to an observed base year, they may be
best described as “model-based thought experiments” which carry out “if-then” analyses. They
are not to be mistaken for a forecast which would have to take into account all possible events
that could happen in the future and affect the baseline. Another case in point is the Keynesian
approach of Capaldo, who postulates certain paths for future fiscal policy (eg, assuming strict
austerity in EU countries to be maintained ad infinitum).
Table 2 : GDP effects of TTIP in present discounted values (PDV) terms,
gross and net of adjustment costs, % of baseline GDP
Long-run
level effect
PDV, gross
GDP effects
PDV, adjust-
ment costs
PDV, net
effect
CEPR (2013) 0.6 10.2 0.5 9.7
Aichele et al (2014) 2.1 42.9 1.7 41.2
Egger et al (2015) 2.3 47.0 1.8 45.2
Felbermayr et al (2015) 3.9 79.7 3.1 76.6
Source: own calculations. Assumptions: TTIP effect on GDP builds up linearly over a 10-year period, discount rate
4% p.a., reallocation needs based on Aichele et al (2014) under a two-year period of unemployment.
3. What is the right TTIP scenario?
Probably the quantitatively most important difference across studies is how researchers define
the scenario. Typically, the idea is to do a simulation based counterfactual experiment: what
happens if the model economy, calibrated to the observed (or projected) baseline data, is modi-
fied such that trade costs across the Atlantic are reduced. All studies assume that tariffs are fully
eliminated. Concerning the costs of non-tariff barriers and the possible reduction of these costs,
there are two main approaches: (i) an expert-driven approach, and a (ii) data-driven approach.
The CEPR study uses an expert-defined trade cost reduction schedule. The level of NTBs is
estimated from surveys of firms and translated into ad valorem tariff equivalents using econo-
metric techniques (Berden et al, 2009). How strongly these costs could be affected by the
agreement is determined by expert opinion. In contrast to tariffs, it makes no sense to reduce
NTB-related costs to zero, as not all regulatory divergence between the US and the EU can be
negotiated away (ie, not all NTBs are “actionable”).
Other studies use the estimated effects of existing regional trade agreements (RTAs) from an
econometric analysis of a gravity model. The assumption is that TTIP lowers EU-US trade costs
as much as existing trade agreements have between their member countries. This strategy has
the advantage that it does not need to specify by how much NTMs would fall in the proposed
agreement, but instead relies on past observed effects of similar RTAs. This implies that the
proposed scenario must be feasible (since it has been shown to have worked elsewhere). The
8 Economic Analysis of TTIP
strategy also ensures a comprehensive treatment: not all NTBs will be reported by firms in sur-
veys; moreover, an RTA may lead to further public or private investment not mandated by the
agreement itself which brings down trade barriers (human capital, infrastructure, other areas of
institutional cooperation). This approach may lead to under- or overestimation. On the one hand,
the official ambition for TTIP is to go deeper than the average existing RTA, which will lead to
an underestimation of the potential trade and welfare effects of TTIP when relying on the aver-
age effect of RTAs in the past. On the other hand, it is possible that the easy barriers to trade
have long been removed across the Atlantic, which will then lead to an overestimation, because
many past RTAs substantially lowered tariffs and NTMs. Egger et al (2015) and Aichele et al
(2014) employ this strategy in a multi-sector setup; this requires the estimation of a large num-
ber of separate RTA coefficients, each for one sector. Studies differ in how to deal with the
endogeneity of RTAs, what type of RTA to use to inform the exercise (all available RTAs, as
ifo-Bertelsmann (2013) or Felbermayr et al (2015), or deep RTAs as Aichele et al, 2014), and
how to deal with parameter uncertainty.
The key advantage of the expert-driven approach is that it spells out the type, size, and possible
reductions of NTBs for different sectors; this is helpful information for negotiators. The key
advantage of the data-driven approach, in contrast, is that it might provide more accurate esti-
mations of potentials.
The data driven approach is the natural way of proceeding in so called structurally estimated
CGE (SCGE) models, also referred to as New Quantitative Trade Theory (Ottaviano, 2014).
These rather recent models (see Costinot and Rodriguez-Clare, 2015) try to tie the estimation of
key structural parameters and the definition of scenarios as closely to the baseline data as possi-
ble. In this sense, they make progress to older approaches, which borrow parameters from ex-
ternal sources, and rely on expert input. Unfortunately, the strategy has been frequently misun-
derstood. In a study for the EU Parliament in 2014, Pelkmans et al (2014) insist several times
that “comparing TTIP potential with that of the EU (or NAFTA) is clearly unrealistic”. This is
wrong; the scenario in ifo-Bertelsmann is based on an estimate of the average trade cost effect
measured for more than one hundred countries involved in more than one hundred different
trade agreements (including, amongst many others, EU and NAFTA). Pelkmans (2016) reiter-
ates the wrong assertion by stating that “authors (erroneously) assume a transatlantic market as
if it were similar to the EU Internal Market and NAFTA.”
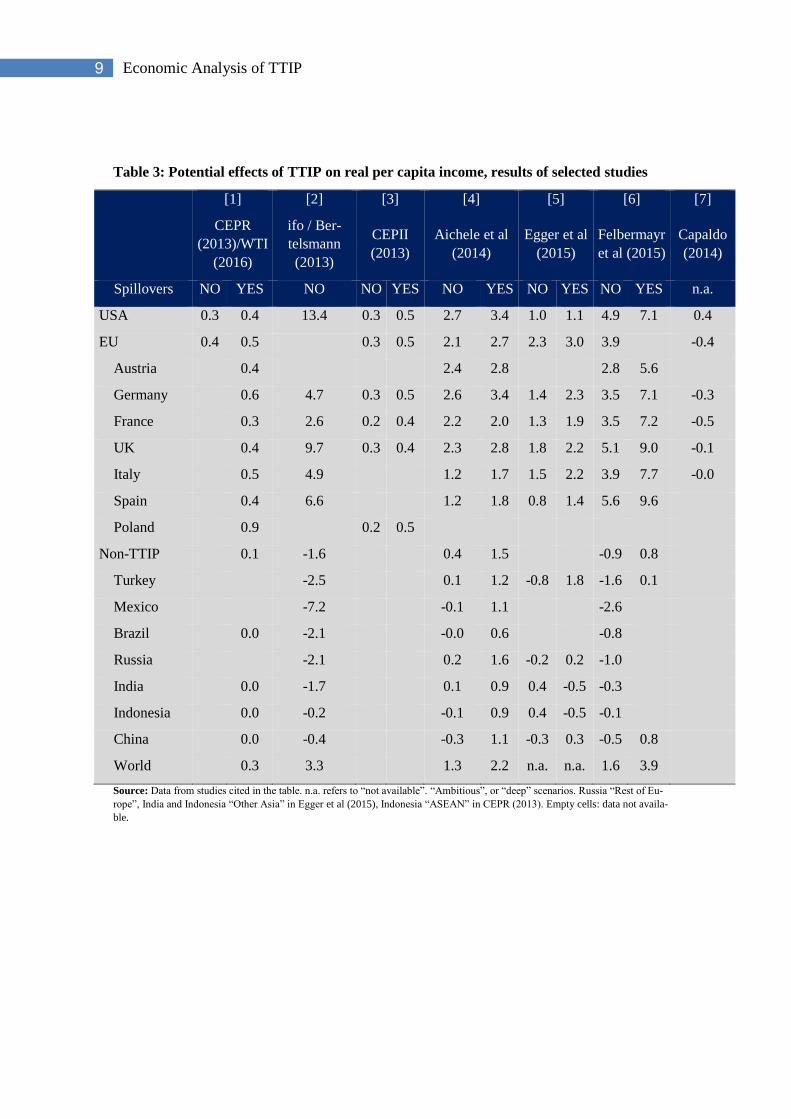
Finally, scenarios may differ regarding the assumption of spillovers. Essentially, spillovers refer
to the possibility that the bilateral reduction of trade costs between the EU and the US could
also benefit third countries (see below). This leads to a multilateralization of the agreement. In
their default specification, CEPR (2013) assume that 20% of the trade cost reduction assumed
for TTIP insiders is also available to outsiders. Spillovers increase the gains from TTIP: this is
very transparent in the model comparison offered in Table 3. Eg, the CEPII (2013) study as-
sumes no spillovers in its default specification. However, allowing for them drives up the gains
from TTIP from 0.3% to 0.5%, effectively explaining the entire difference in simulated out-
comes between the CEPR and the CEPII studies.
As a rule of thumb, across model with similar setups (eg, Egger et al (2015) and Aichele et al
(2014)), differences in quantitative results are almost entirely driven by differences in the im-
posed trade cost reductions.
9 Economic Analysis of TTIP
Table 3: Potential effects of TTIP on real per capita income, results of selected studies
[1] [2] [3] [4] [5] [6] [7]
CEPR
(2013)/WTI
(2016)
ifo / Ber-
telsmann
(2013)
CEPII
(2013)
Aichele et al
(2014)
Egger et al
(2015)
Felbermayr
et al (2015)
Capaldo
(2014)
Spillovers NO YES NO NO YES NO YES NO YES NO YES n.a.
USA 0.3 0.4 13.4 0.3 0.5 2.7 3.4 1.0 1.1 4.9 7.1 0.4
EU 0.4 0.5
0.3 0.5 2.1 2.7 2.3 3.0 3.9
-0.4
Austria 0.4 2.4 2.8 2.8 5.6
Germany 0.6 4.7 0.3 0.5 2.6 3.4 1.4 2.3 3.5 7.1 -0.3
France 0.3 2.6 0.2 0.4 2.2 2.0 1.3 1.9 3.5 7.2 -0.5
UK 0.4 9.7 0.3 0.4 2.3 2.8 1.8 2.2 5.1 9.0 -0.1
Italy 0.5 4.9 1.2 1.7 1.5 2.2 3.9 7.7 -0.0
Spain 0.4 6.6 1.2 1.8 0.8 1.4 5.6 9.6
Poland 0.9 0.2 0.5
Non-TTIP 0.1 -1.6 0.4 1.5 -0.9 0.8
Turkey -2.5 0.1 1.2 -0.8 1.8 -1.6 0.1
Mexico -7.2 -0.1 1.1 -2.6
Brazil 0.0 -2.1 -0.0 0.6 -0.8
Russia -2.1 0.2 1.6 -0.2 0.2 -1.0
India 0.0 -1.7 0.1 0.9 0.4 -0.5 -0.3
Indonesia 0.0 -0.2 -0.1 0.9 0.4 -0.5 -0.1
China 0.0 -0.4 -0.3 1.1 -0.3 0.3 -0.5 0.8
World 0.3 3.3 1.3 2.2 n.a. n.a. 1.6 3.9
Source: Data from studies cited in the table. n.a. refers to “not available”. “Ambitious”, or “deep” scenarios. Russia “Rest of Eu-
rope”, India and Indonesia “Other Asia” in Egger et al (2015), Indonesia “ASEAN” in CEPR (2013). Empty cells: data not availa-
ble.
10 Economic Analysis of TTIP
4. What is the right model structure?
All studies except the one by Capaldo (2014) have in common that they are based on computa-
ble general equilibrium (CGE) models and that they operate under the presumption of full em-
ployment (see discussion of the few exceptions below). CGE models simultaneously model
economic equilibrium outcomes in many sectors and in many countries, carefully taking feed-
back mechanisms and so called adding-up constraints into account. These models have been
useful in identifying vulnerable industries, mapping specific policies into outcomes, and in
providing assessments on aggregate variables.
The conventional models, however, have been criticized for underestimating the trade flow ef-
fects of agreements (Kehoe, 2005) and the gains from trade. The latter is due to the fact that the
standard CGE models do not allow for technological progress, technology adoption or human
capital formation, which are all likely to be fostered by better access to global markets and
stronger competition. Another element of criticism relates to a poor fit between models and
parameter estimation. This has led to the development of “new quantitative trade theory”
(NQQT, Ottaviano, 2014); see the seminal articles of Eaton and Kortum (2002) and Anderson
and van Wincoop (2003); Costinot and Rodriguez-Clare (2014) provide an overview. What
these new approaches have in common is (i) a simpler, and thus more tractable model structure,
(ii) the use of structural relationships generated by the model (such as the gravity equation) to
econometrically identify the key parameters (such as trade elasticities), and (iii) scenario defini-
tions for ex ante analysis that are based on the estimates of the treatment effects of comparable
existing policies.
CEPR (2013), Aichele et al (2014) and Egger et al (2015) have used a multiple-sector model
which is in the tradition of the older CGE literature. The ifo-Bertelsmann (2013) study and Fel-
bermayr et al (2015) have instead used a much simpler single-sector model, but applied the
methods used in NQTT. Multi-sector models have the advantage that they provide insights into
the sectoral effects of policy changes. Moreover, they capture differences in the structure of
comparative advantage of countries; this is important in assessing the strength of trade diversion
effects. If one is interested in long-run aggregate effects, the advantages of multi-sector models
are less obvious, as the structure of comparative advantage cannot be assumed to be fixed.
In NQTT, multi-sector models are still the exception; see for surveys Head and Mayer (2014),
and Costinot and Rodríguez-Clare (2014). With the usual assumption of perfect mobility be-
tween sectors, multi-sector models are comparable to one-sector models in terms of the em-
ployment of workers: they are always ideally allocated. Therefore, the single sector view corre-
sponds to the long-run where all structural adjustments have taken place. Additionally, it is con-
sistent with structural changes in the economy that may happen due to TTIP, both in TTIP-
member and non-member third countries. For this reason, the economic effects predicted in
single sector models are typically larger.
In contrast, market structure does not make much of a difference. Felbermayr et al (2015) use a
monopolist competition model, which is, in many respects, isomorphic to a model with perfect
competition; see Costinot and Rodriguez-Clare (2014). Also, the introduction of frictional un-
employment (ifo-Bertelsmann, 2013; Heid and Larch ((2014) does not fundamentally change
the properties of the model.
The Keynesian model of Capaldo (2014) differs dramatically from the standard approach in
trade modeling. It assumes that employment and production are determined by demand condi-
11 Economic Analysis of TTIP
tions only; therefore it takes a short-run perspective (even if results simulated under these prem-
ises play out only gradually over time). It is no trade model in the sense that it does not model
trade barriers (tariffs, NTMs), and does not per se generate any predictions on trade flows. Ca-
paldo (2014) uses trade flow changes simulated in CEPR (2013) and implements them into the
model. Since the results of the model depend entirely on the evolution of the trade balance, this
is an important and crucial assumption.
The ifo-Bertelsmann study has received criticism from several sides. The EU Commission
(2013) describes that study as an outlier compared to others. Looking at the size of welfare ef-
fects predicted this seems a valid conclusion. However, the “other studies” that the Commission
compares ifo-Bertelsmann with, all used variants of the same model, data, and methodology and
therefore cannot but generate similar results. It has been criticized that the effects are “unrea-
sonable” because existing exports of the US to Europe amount to about 3.5% of US GDP only.
Pelkmans et al (2014) claim, that this fact makes the simulated effects in ifo-Bertelsmann totally
implausible and unrealistic, in particular for the US. While the simulated effects for the US cer-
tainly appear high, the logic in the above argument is flawed. Classical trade theory does not at
all suggest that trade between two countries prior to liberalization is an indicator at all for the
size of possible welfare gains. Quite the opposite is true. Take the example of two countries in
autarky (that do not trade at all); opening up to international trade will be highly beneficial for
them even though there is no trade at all between the countries in the initial situation.
The fact that simulated effects are large has to do with the scenario, the way NTBs are intro-
duced, and with model structure. It also has to do with the fact that the ifo-Bertelsmann model is
a stochastic model (in the sense that the underlying parameters and the baseline equilibrium are
estimated and thus subject to uncertainty). Indeed, Felbermayr et al (2015) have used the same
framework as ifo-Bertelsmann (but updated to a more recent base year and to a larger country
sample); the structure of effects they find is similar to the earlier findings, but results look less
extreme. The EU Commission has also called the methods “untested”; this is an understandable
reaction, given that policy consulting has employed more or less the same type of model for
more or less all quantitative exercises that the Commission has ordered; not surprisingly, these
studies all tend to confirm each other. The academic literature, however, has developed alterna-
tive frameworks; ifo-Bertelsmann relies on the setup developed in a peer-refereed journal publi-
cation (Egger et al, 2011) which heavily builds on earlier scholarly work.
In a sense, the variance in results reported in Table 3 raises the question of what could plausibly
be expected. Two facts suggest that even the static welfare gains from closer transatlantic inte-
gration could be sizeable: first, the two economies combined each account for about a quarter of
world demand and world supply, but bilateral trade in goods and services between them
amounts to about 3% of GDP only7. Thus, trade appears low compared to the regions’ levels of
GDP and there should be room for a strong increase in bilateral commerce. Second, econometric
studies suggest that trade matters significantly for countries’ levels of income; see Felbermayr
and Gröschl (2013) and the references therein. This suggests that there is no reason to believe, a
priori, that the potential of transatlantic trade liberalization is small, even though tariffs are al-
ready low.
7 In 2014, EU exports of goods and services to the US amounted to 504.6 bn. Euro; imports amounted to 388.3 bn. This is 2.7% and 3.5% of EU GDP, respectively.
12 Economic Analysis of TTIP
Other differences in modeling approaches are less important. The CEPR model differs from the
others in that it allows for some NTBs to be not resource consuming but rent-creating (such as a
quota would). The other studies assume NTBs consume resources. Reducing such wasteful bar-
riers releases larger economic gains than rent-creating barriers, as there is a direct resource sav-
ing effect.
What the difference between the conventional methodology and the less orthodox approach of
ifo-Bertelsmann teach us is, thus, that standard analyses are probably less robust than what
many proponents would want to believe.
13 Economic Analysis of TTIP
5. How are third countries affected?
A long-standing tradition in the theory of international trade argues that trade agreements be-
tween a subset of countries (regional trade agreements, RTAs) are only second-best compared to
an agreement that spans the entire world. The reason is that RTAs are inherently discriminatory:
they grant preferences to insiders which they deny to outsiders. This is most blatant in the case
of tariffs, where rules of origin make sure that third country goods (or value added) do not bene-
fit from preferences. However, also in the area of regulatory cooperation, discriminatory ele-
ments may exist, e.g., when product tests are mutually recognized only if the product in ques-
tion originates from an insider, but not, when the producer comes from a third country.
These features lead to trade diversion: some of the trade boost between members comes at the
expense of outsiders, who see demand for their goods fall as a consequence of diminished rela-
tive price competitiveness. E.g., producers of leather shoes from Romania currently face tariffs
of up to 30% in the US. With TTIP, these tariffs would fall to zero, giving those producers a
cost advantage of 30%. Firms from Mexico or from Cambodia enjoy tariff-free access to the US
market already now: the former through NAFTA, the latter through the US system of trade pref-
erences for poor countries. TTIP would confront them with tough competition from EU shoe
producers and, possibly, lead to a loss of market share. These trade diversion effects operate
only when EU or US producers actually produce goods or services that compete with output of
third countries. E.g., cocoa producers from Cote d’Ivoire are insulated from relative price ef-
fects. Trade diversion effects materialize when strict rules of origin prohibit that value added
from third countries ends up enjoying preferential treatment.
On the other hand, if income and production levels rise in the US or the EU, outsiders may ben-
efit as demand for their products and services increase. Again, this effect will be most pro-
nounced in countries, which produce goods or services that the TTIP insiders do not produce
themselves. Moreover, the higher the income elasticity of demand, the stronger are the demand
effects. Chocolate or safari tours are examples for goods and services featuring over-
proportionate increases in demand when income goes up. Finally, countries strongly linked into
supply chains of EU/US producers will also benefit more than other countries.
The studies listed in Table 3 report very different effects for third countries. Single-sector mod-
els predict much stronger effects than multi-sector models. There are two main reasons for this.
First, single sector models implicitly assume the toughest possible rules of origin. This maxim-
izes trade diversion effects and makes losses in third countries likely. Second, by focusing on a
single sector, these models ignore that countries differ strongly with respect to the products that
they can competitively produce. Germany competes with Cote d’Ivoire in the area of tourism
but not in cocoa. Ignoring the details of comparative advantage, the models impose symmetry
between countries and goods, and this also tends to exaggerate third country effects. The multi-
sector models, in contrast, typically fail to model the discriminatory effects of rules of origin
and downplay the risks of trade diversion. Moreover, by fixing the structure of comparative
advantage to the base-year, they rule out that a mega regional agreement such as TTIP influ-
ences the technological possibilities of countries. This could mean that the models underesti-
mate the possibility that, in the absence of TTIP, Cote d’Ivoire develops a competitive chocolate
industry which exports cocoa products, while TTIP makes this less likely by creating a common
transatlantic chocolate market.
14 Economic Analysis of TTIP
These considerations suggest that single-sector models overplay the dangers of TTIP for third
countries while multi-sector models downplay them. Most likely, the truth lies in the middle.
For countries that produce goods that compete with output from the EU or US, and which are
not well integrated into the transatlantic value chains, TTIP could bring losses. Aichele et al
(2014) and Egger et al (2015) show that countries in east Asia – China, Cambodia – could be
negatively affected, while countries selling inputs for the EU or US industries – Morocco, Tur-
key – could actually benefit.
Generally, however, losses to third countries are typically small, in particular, in the case of
unambitious TTIP scenarios. Also, it needs to be acknowledged that many of the countries
which are negatively affected by TTIP are in the process of negotiating their own mega regional
trade agreements. Cambodia, for example, is part of the Regional Comprehensive Economic
Partnership (RCEP) agreement which should link ASEAN countries to big regional powers such
as China and India. RCEP could prove hugely beneficial for Cambodia while it is slightly harm-
ful for Europe. The combination of trade agreements generates a much wider range of winners
than when looking at one agreement in isolation.
Comparing the existing studies, the CEPR study is the only one which assumes regulatory spill-
overs in its default scenario. Hence, it effectively endows TTIP with a multilateral dimension:
outsiders to the agreement see their trade costs fall even though they do not participate at the
negotiations. This leads the study to the gross unrealistic conclusion that Indonesia benefits
more than twice (in percentage terms) from TTIP than the EU. There is very little empirical
evidence to support such spillovers, see the discussion in the WTO World Trade Report of 2012
and further discussion in Felbermayr et al (2014). At the same time, spillovers would be clearly
desirable. As shown in Table 3, they tend to make the gains of transatlantic integration larger for
the insiders, and for the outsiders (and, consequently, for the whole world).
Compared to CEPR (2013), ifo-Bertelsmann (2013) finds strongly negative third country effects
of TTIP. As explained, there are several explanations for this. However, the claim of Pelkmans,
(2016) that strong trade diversion was simply “assumed” in the model is plainly wrong. Trade
diversion is the endogenous outcome of a fully consistent general equilibrium model. The very
fact that a very standard – if stylized – trade model can generate substantial third country effects
in a TTIP scenario should stimulate a discussion about how to design mega-regionals in a de-
velopment friendly way. In ifo (2015) we have developed arguments to achieve this.
15 Economic Analysis of TTIP
6. Labor market outcomes: the short- versus the long-run
The bargaining mandate of the EU Commission from June 17 2013 states that a key objective
for TTIP is to “generate new economic opportunities for the creation of jobs”. This is echoed in
the EU Parliament’s resolution adopted on 8 July 2015 which posits that “TTIP ... should be
seen as an element in a broader European strategy to create jobs”. In stark contrast, amongst
the studies surveyed in Table 2, only ifo-Bertelsmann (2013) and Capaldo (2014) address the
capacity of TTIP to affect aggregate employment. The reason for this situation is that trade
economists traditionally think that “attempts to quantify the overall employment effect of trade
are largely an exercise in futility” (Irvine, 2015).
However, recently, search theoretic foundations for unemployment and wage bargaining have
been incorporated in structurally estimated CGE models of international trade; see Felbermayr
et al (2011) and Heid and Larch (2014). Ifo-Bertelsmann (2013) draws on this approach. It finds
that TTIP could lead to long-run employment gains as general productivity gains due to the
agreement making it easier for firms to overcome labor market frictions that hold down the
creation or jobs. While in models with perfect labor markets all productivity gains are soaked up
by higher wages, models with frictions imply that part of the gains go into the creation of addi-
tional jobs.
Capaldo (2014) uses a very different model. In his setup, regulatory cooperation frees up work-
ers who were earlier employed for now redundant conformity tests, unnecessary country-
specific configurations of products, etc., but they fail to be reemployed in other sectors. This
reduces aggregate demand and, via old-style Keynesian mechanisms, leads to a recession and
unemployment. Capaldo (2014) does not use a trade model – the change in trade flows is as-
sumed, not derived – and he ignores the overwhelming evidence that productivity gains do not
lead to mass unemployment; certainly not in the long-run. The merit of his paper lies in raising
awareness for short-term problems in the adjustment process following trade reform. Recent
empirical studies by Autor et al (2013) and Autor et al (2014), show that these concerns are to
be taken serious.
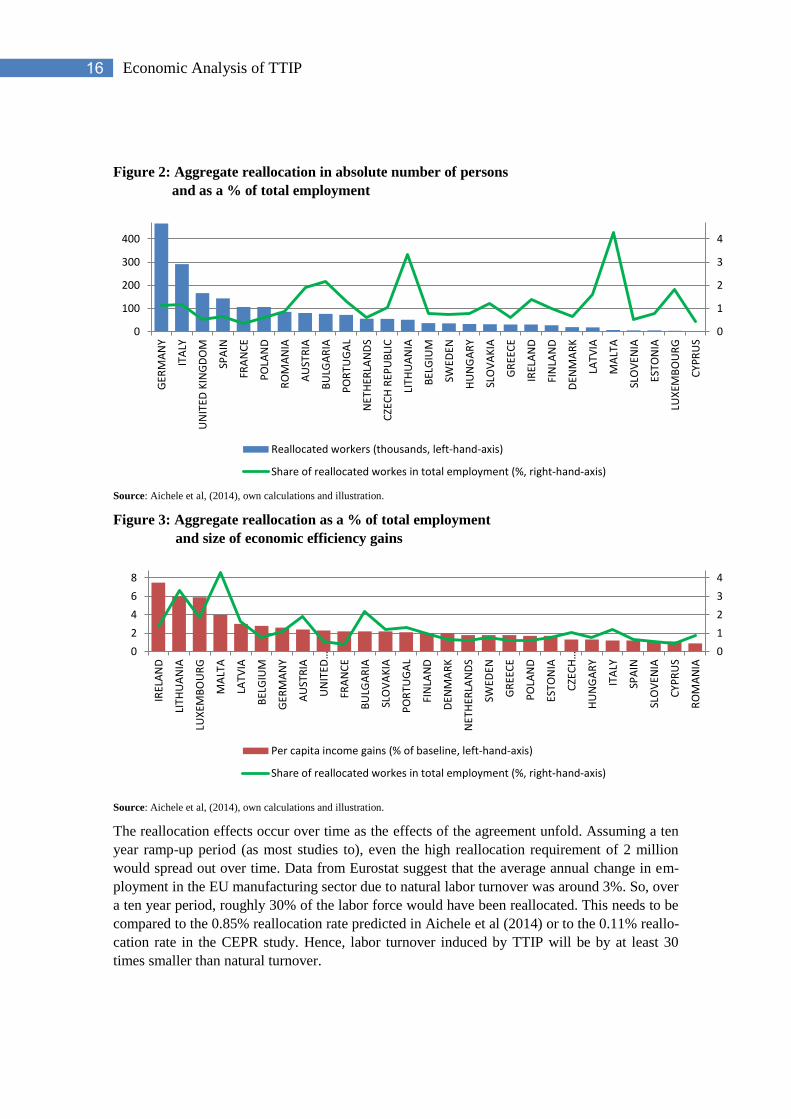
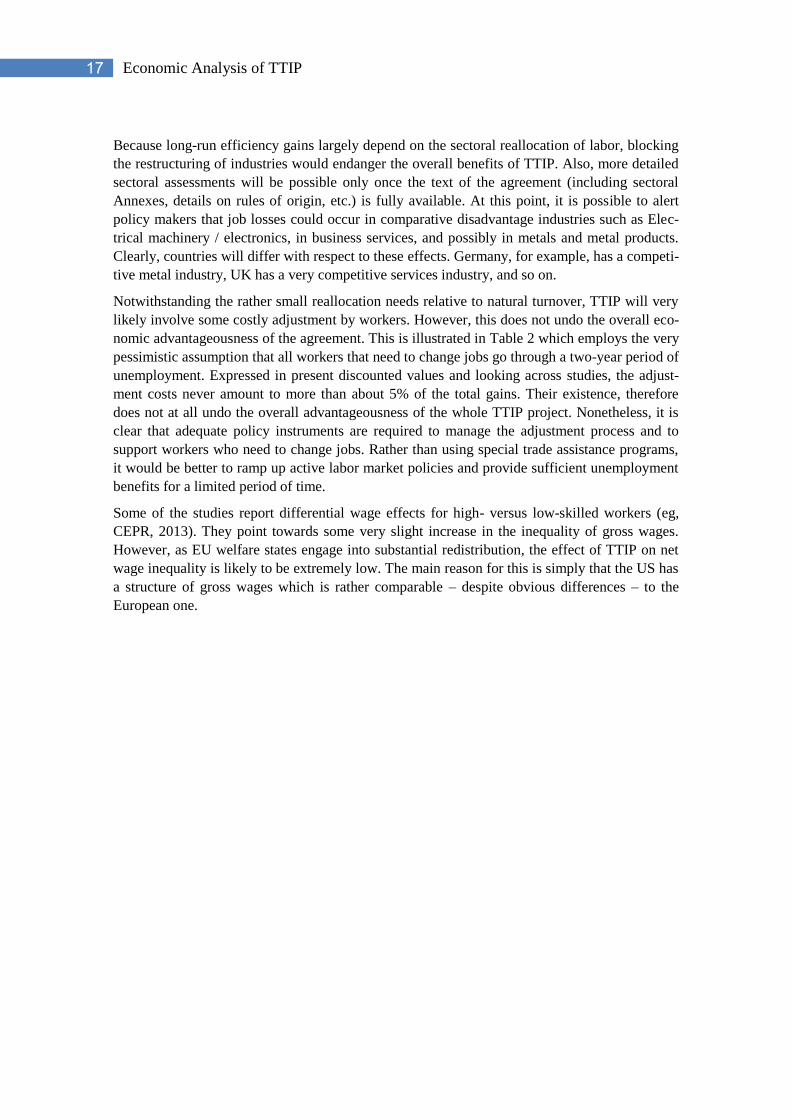
Figure 2 plots the share of workers who will have to move from one industry to another due to
TTIP and their absolute number as reported by Aichele et al (2014). Clearly, we are talking
about non-trivial numbers. However, reallocation needs remain below the 1% threshold in most
EU member states. Figure 3 plots the share against the income gains expected from the agree-
ment. It is apparent that higher gains require more reallocation. In that sense, the simulation
exercise of Aichele et al (2014) confirms the intuition that adjustment due to reallocation can be
seen as a necessary investment to unlock efficiency gains.
16 Economic Analysis of TTIP
Figure 2: Aggregate reallocation in absolute number of persons
and as a % of total employment
Source: Aichele et al, (2014), own calculations and illustration.
Figure 3: Aggregate reallocation as a % of total employment
and size of economic efficiency gains
Source: Aichele et al, (2014), own calculations and illustration.
The reallocation effects occur over time as the effects of the agreement unfold. Assuming a ten
year ramp-up period (as most studies to), even the high reallocation requirement of 2 million
would spread out over time. Data from Eurostat suggest that the average annual change in em-
ployment in the EU manufacturing sector due to natural labor turnover was around 3%. So, over
a ten year period, roughly 30% of the labor force would have been reallocated. This needs to be
compared to the 0.85% reallocation rate predicted in Aichele et al (2014) or to the 0.11% reallo-
cation rate in the CEPR study. Hence, labor turnover induced by TTIP will be by at least 30
times smaller than natural turnover.
0
1
2
3
4
0
100
200
300
400
GER
MA
NY
ITA
LY
UN
ITED
KIN
GD
OM
SPA
IN
FRA
NC
E
PO
LAN
D
RO
MA
NIA
AU
STR
IA
BU
LGA
RIA
PO
RTU
GA
L
NET
HER
LAN
DS
CZE
CH
REP
UB
LIC
LITH
UA
NIA
BEL
GIU
M
SWED
EN
HU
NG
AR
Y
SLO
VA
KIA
GR
EEC
E
IREL
AN
D
FIN
LAN
D
DEN
MA
RK
LATV
IA
MA
LTA
SLO
VEN
IA
ESTO
NIA
LUX
EMB
OU
RG
CYP
RU
S
Reallocated workers (thousands, left-hand-axis)
Share of reallocated workes in total employment (%, right-hand-axis)
0
1
2
3
4
0
2
4
6
8
IREL
AN
D
LITH
UA
NIA
LUX
EMB
OU
RG
MA
LTA
LATV
IA
BEL
GIU
M
GER
MA
NY
AU
STR
IA
UNITED
…
FRA
NC
E
BU
LGA
RIA
SLO
VA
KIA
PO
RTU
GA
L
FIN
LAN
D
DEN
MA
RK
NET
HER
LAN
DS
SWED
EN
GR
EEC
E
PO
LAN
D
ESTO
NIA
CZECH…
HU
NG
AR
Y
ITA
LY
SPA
IN
SLO
VEN
IA
CYP
RU
S
RO
MA
NIA
Per capita income gains (% of baseline, left-hand-axis)
Share of reallocated workes in total employment (%, right-hand-axis)
17 Economic Analysis of TTIP
Because long-run efficiency gains largely depend on the sectoral reallocation of labor, blocking
the restructuring of industries would endanger the overall benefits of TTIP. Also, more detailed
sectoral assessments will be possible only once the text of the agreement (including sectoral
Annexes, details on rules of origin, etc.) is fully available. At this point, it is possible to alert
policy makers that job losses could occur in comparative disadvantage industries such as Elec-
trical machinery / electronics, in business services, and possibly in metals and metal products.
Clearly, countries will differ with respect to these effects. Germany, for example, has a competi-
tive metal industry, UK has a very competitive services industry, and so on.
Notwithstanding the rather small reallocation needs relative to natural turnover, TTIP will very
likely involve some costly adjustment by workers. However, this does not undo the overall eco-
nomic advantageousness of the agreement. This is illustrated in Table 2 which employs the very
pessimistic assumption that all workers that need to change jobs go through a two-year period of
unemployment. Expressed in present discounted values and looking across studies, the adjust-
ment costs never amount to more than about 5% of the total gains. Their existence, therefore
does not at all undo the overall advantageousness of the whole TTIP project. Nonetheless, it is
clear that adequate policy instruments are required to manage the adjustment process and to
support workers who need to change jobs. Rather than using special trade assistance programs,
it would be better to ramp up active labor market policies and provide sufficient unemployment
benefits for a limited period of time.
Some of the studies report differential wage effects for high- versus low-skilled workers (eg,
CEPR, 2013). They point towards some very slight increase in the inequality of gross wages.
However, as EU welfare states engage into substantial redistribution, the effect of TTIP on net
wage inequality is likely to be extremely low. The main reason for this is simply that the US has
a structure of gross wages which is rather comparable – despite obvious differences – to the
European one.
18 Economic Analysis of TTIP
7. Conclusions
This chapter reviews the economic modeling of TTIP. It stresses commonalities across different
studies and explains differences. A robust conclusion from the existing numerous studies is that
TTIP promises long-run gains for the EU as a whole with the average estimate lying around 2%.
However, there is substantial uncertainty, as the precise magnitude of the effect depends strong-
ly on how ambitious the assumed scenario is. Also, while virtually all EU member states are
consistently predicted to gain, there is substantial heterogeneity. The existing studies agree that
TTIP can harm outsiders, in particular if there is a considerable overlap in exported products.
But also regarding third countries, TTIP is likely to have very heterogeneous effects. Only if
transatlantic cooperation also leads to lower trade costs elsewhere will TTIP yield substantial
benefits for outsiders. Labor market effects of TTIP are likely to be weak, both regarding long-
run employment effects and net wage inequality. However, the agreement is bound to trigger
reallocation of workers from shrinking firms and sectors to expanding ones. This transition can
be dealt with using existing labor market instruments. Taking adjustment costs into account,
TTIP still looks like a very promising investment for the EU.
This chapter has not provided sectoral details. Before details on the text are available, this is
probably a futile exercise. It has also avoided issues of public interest which cannot (yet) be
properly dealt with using economic models. This is the case with the controversial settlement of
investment disputers, concerns about consumer protection, and potential costs associated to the
loss of regulatory flexibility. There is no doubt that the robust debate on TTIP will trigger
scholarly research into these questions. There is also no doubt that these issues can be dealt with
provided that there is sufficient political will.
19 Economic Analysis of TTIP
References
Aichele, R., Felbermayr, G., et al (2014), Going Deep: The Trade and Welfare Effects of TTIP,
CESifo Working Paper No. 5150.
Anderson, J. E., and van Wincoop, E. (2003), Gravity with Gravitas: A Solution to the Border
Puzzle, American Economic Review, Vol 93(1), S. 170ff.
Autor, D. H., Dorn, D., et al (2013), The China syndrome: Local labor market effects of import
competition in the United States, American Economic Review, Vol 103(6): S. 2121ff.
Autor, D. H., Dorn, D., et al (2014), Trade adjustment: Worker level evidence, Quarterly Jour-
nal of Economics, Vol 129(4), S. 1799ff.
Berden, K., Francois, J., et al (2009), Non-Tariff Measures in EU-US Trade and Investment- An
Economic Analysis, Report OJ 2007/S 180-219493 for the European Commission: Directorate-
General for Trade, http://trade.ec.europa.eu/doclib/docs/2009/december/tradoc_145613.pdf
Bloom, N., Romer, P., et al (2014), A Trapped Factors Model of Innovation, CEP Discussion
Paper 1261.
Bode, T. (2015), Die Freihandelslüge: Warum TTIP nur den Konzernen nützt – und uns allen
schadet, DVA.
Caliendo, L. and Parro, F. (2015), Estimates of Trade and Welfare Effects of NAFTA, Review
of Economic Studies, Vol 82(1), S.1ff.
Capaldo, J. (2014), TTIP: European Disintegration, Unemployment and Instability, GDAE
Working Paper No. 14-03.
Carrère, C., Grujovic, A., et al (2015), Trade and frictional unemployment in the global econo-
my, CEPR Discussion Paper 10692.
CEPII (2013), Transatlantic Trade: Whither Partnership, Which Economic Consequences?,
CEPII Policy Brief 2013-01, www.cepii.fr/CEPII/fr/publications/pb/abstract.asp?NoDoc=6113 .
CEPR (2013), Reducing Transatlantic Barriers to Trade and Investment: An Economic Assess-
ment, Study for the EU Commission,
http://trade.ec.europa.eu/doclib/docs/2013/march/tradoc_150737.pdf .
Costinot, A. and Rodriguez-Clare, A. (2014), Trade Theory with Numbers: Quantifying the
Consequences of Globalization, Chapter 4 in Gopinath, Helpman and Rogoff, Elsevier (eds.),
The Handbook of International Economics, S.197ff.
Eaton, J., and Kortum, S. (2002), Technology, Geography, and Trade, Econometrica, Vol 70(5),
S. 1741ff.
Egger, P., Francois, J., et al (2015), Non-tariff Trade Barriers, Integration, and the Transatlantic
Economy, Economic Policy, Vol 30(83), S.539ff.
Egger, P., Larch, M., et al (2011), The Trade Effects of Endogenous Preferential Trade Agree-
ments, American Economic Journal: Economic Policy, Vol 3/2013, S. 113ff.
EU Commission (2013), Transatlantic Trade and Investment Partnership: The Economic Analy-
sis Explained, trade.ec.europa.eu/doclib/docs/2013/september/tradoc_151787.pdf#Explanatory
Felbermayr, G., Prat, J. et al (2011), Globalization and labor market outcomes: Wage bargain-
20 Economic Analysis of TTIP
ing, search frictions, and firm heterogeneity, Journal of Economic Theory, Vol 146(1), S.39ff.
Felbermayr, G., Heid, B., et al (2014), TTIP: Small Gains, High Risks?, CESifo Forum, Vol
4/2014, S.20ff.
Felbermayr, G., Heid, B., et al (2015), Macroeconomic Potentials of Transatlantic Free Trade: A
High Resolution Perspective for Europe and the World, Economic Policy, Vol 30(83), S. 491ff.
Felbermayr, G., and Gröschl, J. (2013), Natural Disasters and the Effect of Trade on Income: A
New Panel IV Approach, European Economic Review, Vol 58(2013), S.18ff.
Head, K. and Mayer, T. (2014), Gravity Equations: Workhorse, Toolkit, and Cookbook, Chapter
3 in Gopinath, Helpman and Rogoff, Elsevier (eds.), The Handbook of International Economics,
Vol. 4, S. 131ff.
Heid, B. and Larch, M. (2014), International Trade and Unemployment: A Quantitative Frame-
work, CESifo Working Paper 4013.
ifo-Bertelsmann (2013), Transatlantic Trade and Investment Partnership: Who benefits from a
free trade deal?, www.bfna.org/sites/default/files/TTIP-GED%20study%2017June%202013.pdf.
ifo (2013), Dimensionen und Auswirkungen eines Freihandelsabkommens zwischen der EU und
den USA, ifo Forschungsberichte 62,
www.cesifogroup.de/DocDL/ifo_Forschungsberichte_62.pdf .
ifo (2015), Mögliche Auswirkungen der Transatlantischen Handels- und Investitionspartner-
schaft (TTIP) auf Entwicklungs- und Schwellenländer, ifo Forschungsberichte 67, www.cesifo-
group.de/DocDL/ifo_Forschungsberichte_67.pdf .
Kehoe, T. J. (2005), An Evaluation of the Performance of Applied General Equilibrium Models
of the Impact of NAFTA, in: Timothy J. Kehoe, T.N. Srinivasan and John Whalley
(eds.) Frontiers in Applied General Equilibrium Modeling: Essays in Honor of Herbert Scarf,
Cambridge University Press, 2005, S. 341ff.
Krebs, O., and Pflüger, M. (2015), How Deep is Your Love? A Quantitative Spatial Analysis of
the Transatlantic Trade Partnership, IZA-Discussion Paper 9021.
Ottaviano, G. I. P. (2014), European Integration and the Gains from Trade, CEP Discussion
Paper No 1301.
Pelkmans, J., Lejour, A., et al (2014), The Impact of TTIP: The underlying economic model and
comparisons, CEPS Special Report No. 93 and EU Parliament Research Service,
www.europarl.europa.eu/RegData/etudes/etudes/join/2014/528798/IPOL-
JOIN_ET%282014%29528798_EN.pdf .
Pelkmans, J. (2016), An Overview and Comparison of TTIP Studies, in WTI (2016), TTIP and
the EU Member States, Bern: World Trade Institute, S. 45ff.
Sampson, T., (2016), Dynamic Selection: An Idea Flows Theory of Entry, Trade, and Growth,
Quarterly Journal of Economics, Vol 131(1), S.315ff.
WTI (2016), TTIP and the EU Member States, World Trade Institute, University of Bern, Bern,
January 2016, http://wti.org/media/filer_public/03/b8/03b803d4-e200-4841-9c58-
f6612f4a7316/ttip_report_def.pdf .

21 Economic Analysis of TTIP
WTO (2012), World Trade Report 2012 - Trade and Public Policies: A Close Look at Non-
Tariff Measures in the 21st Century, available at
www.wto.org/english/res_e/booksp_e/anrep_e/world_trade_report12_e.pdf .
Ifo Working Papers
No. 214 Karmann, A., F. Rösel und M. Schneider, Produktivitätsmotor Gesundheitswirtschaft:
Finanziert sich der medizinisch-technische Fortschritt selbst?, April 2016.
No. 213 Felbermayr, G., J. Gröschl and T. Steinwachs, The Trade Effects of Border Controls:
Evidence from the European Schengen Agreement, April 2016.
No. 212 Butz, A. und K. Wohlrabe, Die Ökonomen-Rankings 2015 von Handelsblatt, FAZ und
RePEc: Methodik, Ergebnisse, Kritik und Vergleich, März 2016.
No. 211 Qian, X. and A. Steiner, International Reserves, External Debt Maturity, and the Re-
inforcement Effect for Financial Stability, March 2016.
No. 210 Hristov, N., The Ifo DSGE Model for the German Economy, February 2016.
No. 209 Weber, M., The short-run and long-run effects of decentralizing public employment
services, January 2016.
No. 208 Felfe, C. and J. Saurer, Granting Birthright Citizenship – A Door Opener for Immigrant
Children’s Educational Participation and Success?, December 2015.
No. 207 Angerer, S., P. Lergetporer, D. Glätzle-Rützler and M. Sutter, How to measure time
preferences in children – A comparison of two methods, October 2015.
No. 206 Kluge, J., Sectoral Diversification as Insurance against Economic Instability, September
2015.
No. 205 Kluge, J. and M. Weber, Decomposing the German East-West wage gap, September 2015.
No. 204 Marz, W. and J. Pfeiffer, Carbon Taxes, Oil Monopoly and Petrodollar Recycling,
September 2015.
No. 203 Berg, T.O., Forecast Accuracy of a BVAR under Alternative Specifications of the Zero
Lower Bound, August 2015.
No. 202 Henderson, M.B., P. Lergetporer, P.E. Peterson, K. Werner, M.R. West and L. Woess-
mann, Is Seeing Believing? How Americans and Germans Think about their Schools,
August 2015.
No. 201 Reischmann, M., Creative Accounting and Electoral Motives: Evidence from OECD
Countries, July 2015.
No. 200 Angerer, S., D. Glätzle-Rützler, P. Lergetporer and M. Sutter, Cooperation and dis-
crimination within and across language borders: Evidence from children in a bilingual
city, May 2015.
No. 199 Schulz, B., Wage Rigidity and Labor Market Dynamics with Sorting, May 2015.
No. 198 Jochimsen, B. and R. Lehmann, On the political economy of national tax revenue fore-
casts – Evidence from OECD countries, March 2015.
No. 197 Marz, W. and J. Pfeiffer, Resource Market Power and Levels of Knowledge in General
Equilibrium, March 2015.
No. 196 Lehmann, R., Survey-based indicators vs. hard data: What improves export forecasts in
Europe?, March 2015.
No. 195 Fabritz, N., ICT as an Enabler of Innovation: Evidence from German Microdata, January 2015.
No. 194 Kauder, B. and N. Potrafke, Just hire your spouse! Evidence from a political scandal in
Bavaria, December 2014.
No. 193 Seiler, C., Mode Preferences in Business Surveys: Evidence from Germany, Novem-
ber 2014.
No. 192 Kleemann, M. and M. Wiegand, Are Real Effects of Credit Supply Overestimated? Bias
from Firms' Current Situation and Future Expectations, November 2014.
No. 191 Kauder, B, Spatial Administrative Structure and Intra-Metropolitan Tax Competition,
October 2014.
No. 190 Auer, W. and N. Danzer, Fixed-Term Employment and Fertility: Evidence from German
Micro Data, October 2014.