Embed Size (px)
Citation preview
Economic preferences of kids and adolescents
Martin Kocher University of Munich,
University of Gothenburg, and CESifo Munich
March 2012 Queensland University of Technology
(c) M. Kocher and M. Sutter 2
• Many trust games have confirmed the basic patterns first reported in Berg et al. (1995). See the survey in Camerer (2003).
• In the following we discuss one recently investigated aspect of trust:
– Do trust and reciprocity develop with age, and - if so – how?
Trust and age
(c) M. Kocher and M. Sutter 3
In order to study the development of trust and reciprocity with age they run an experimental trust game with subjects from 6 different age groups:
– 8-year olds (primary school)
– 12-year olds (secondary school)
– 16-year olds (secondary school)
– Students (avg. age 22; std.dev. 2.8)
– Working professionals (avg. age 32; std.dev. 6.3)
– Retired persons (avg. age 68; std.dev. 8.6)
Sutter and Kocher (2007) – Trust and age
(c) M. Kocher and M. Sutter 4
• The standard trust game was used, except that the
trustees did not receive an initial endowment (note that the
trustee‘s endowment could not be used for returns in the
original paper of Berg et al., 1995).
• Assuming payoff-maximization and applying backward-
induction one arrives at the prediction that x = 0 and y = 0,
i.e. no trust and no (opportunity for) reciprocity.
Sutter and Kocher (2007) – Design
(c) M. Kocher and M. Sutter 5
• The trustor‘s endowment E was worth between 2 and 8 Euro in the different age groups (see Appendix of paper for checks on stake size effects).
• The game was framed as a two-person interaction between „John/Joanna“ and „Michelle/Michael“.
• Subjects were always told that they would interact with a person from the same age group, which, however, was to be selected randomly from a different class or session.
Sutter and Kocher (2007) – Design
(c) M. Kocher and M. Sutter 6
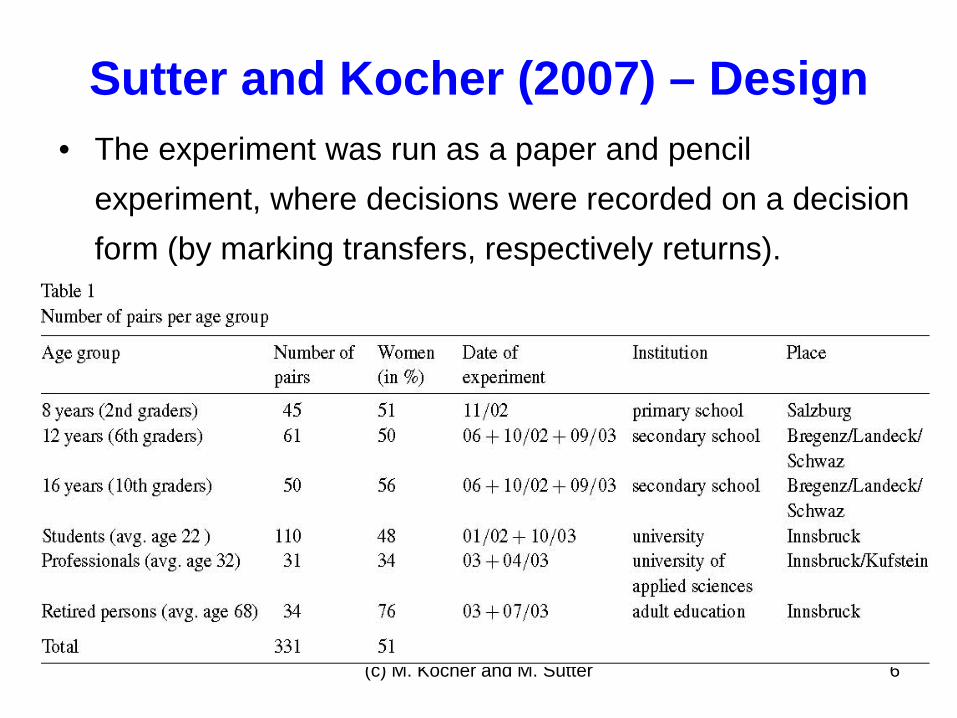
• The experiment was run as a paper and pencil experiment, where decisions were recorded on a decision form (by marking transfers, respectively returns).
Sutter and Kocher (2007) – Design
(c) M. Kocher and M. Sutter 7
• Piaget‘s and Kohlberg‘s research on the development of moral judgment have led to studies on the development of prosocial behavior (which is not purely self-interested and intends to benefit others at own costs).
• Moral reasoning as well as prosocial behavior advance with age (Eisenberg and Fabes, 1998).
Insights from developmental psychology
(c) M. Kocher and M. Sutter 8
• Trust in strangers develops gradually from childhood to early adulthood (Krebs and van Hesteren, 1994; Langford, 1997).
• Reciprocity (as a material tit-for-tat strategy) is typically established already at age 5-6 years (Youniss, 1980, 1986).
Developmental psychology on trust and reciprocity
(c) M. Kocher and M. Sutter 9
Hypothesis 1: Trust increases with age. The transfer x is expected to increase with age, at least until early adulthood.
Hypothesis 2: Reciprocity is established at an early age. The return y should depend significantly positive on the transfer x, irrespective of age.
Hypotheses from developmental psychology
(c) M. Kocher and M. Sutter 10
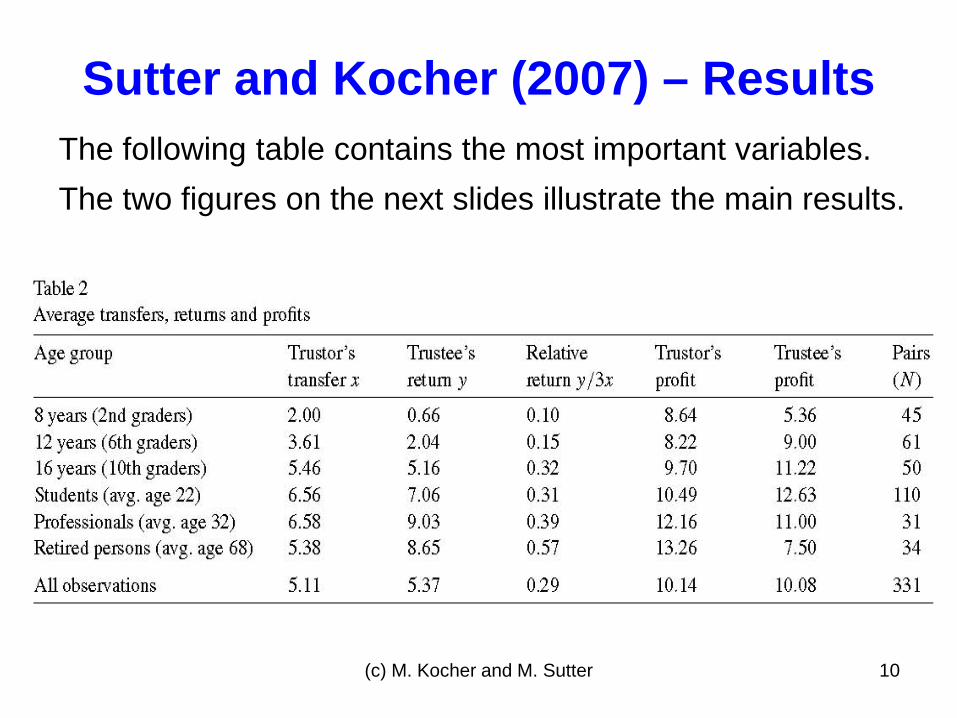
The following table contains the most important variables. The two figures on the next slides illustrate the main results.
Sutter and Kocher (2007) – Results
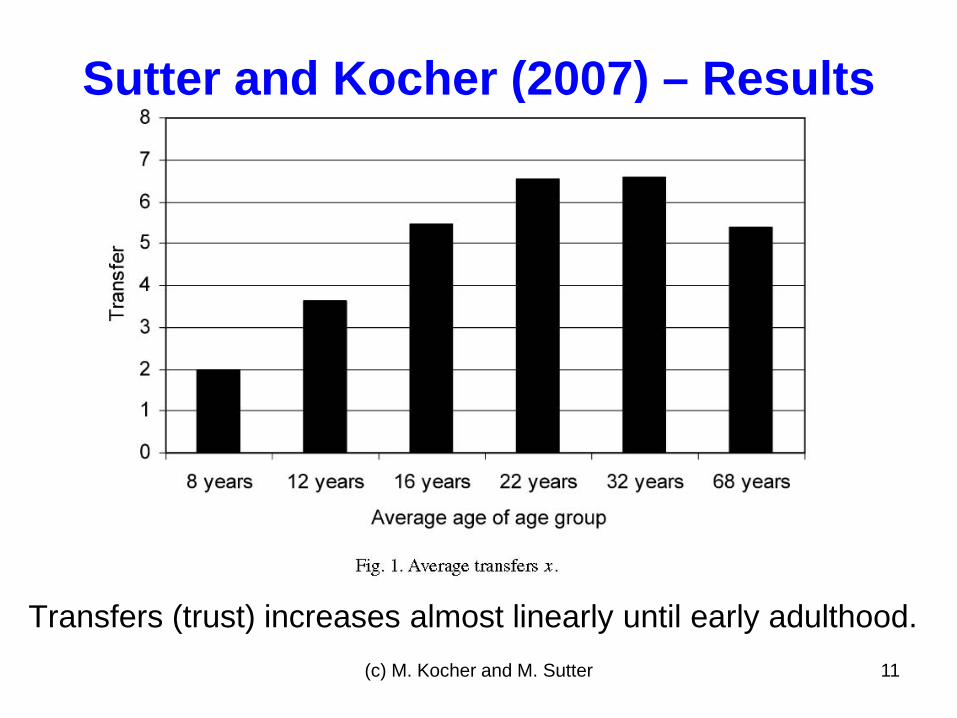
(c) M. Kocher and M. Sutter 11
Transfers (trust) increases almost linearly until early adulthood.
Sutter and Kocher (2007) – Results
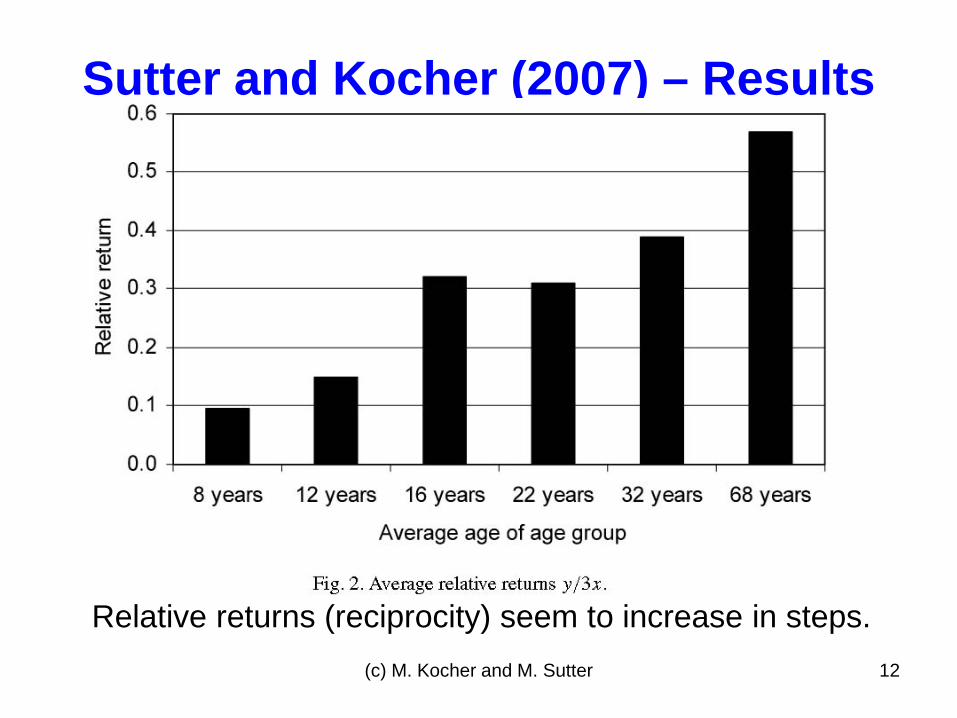
(c) M. Kocher and M. Sutter 12
Relative returns (reciprocity) seem to increase in steps.
Sutter and Kocher (2007) – Results
(c) M. Kocher and M. Sutter 13
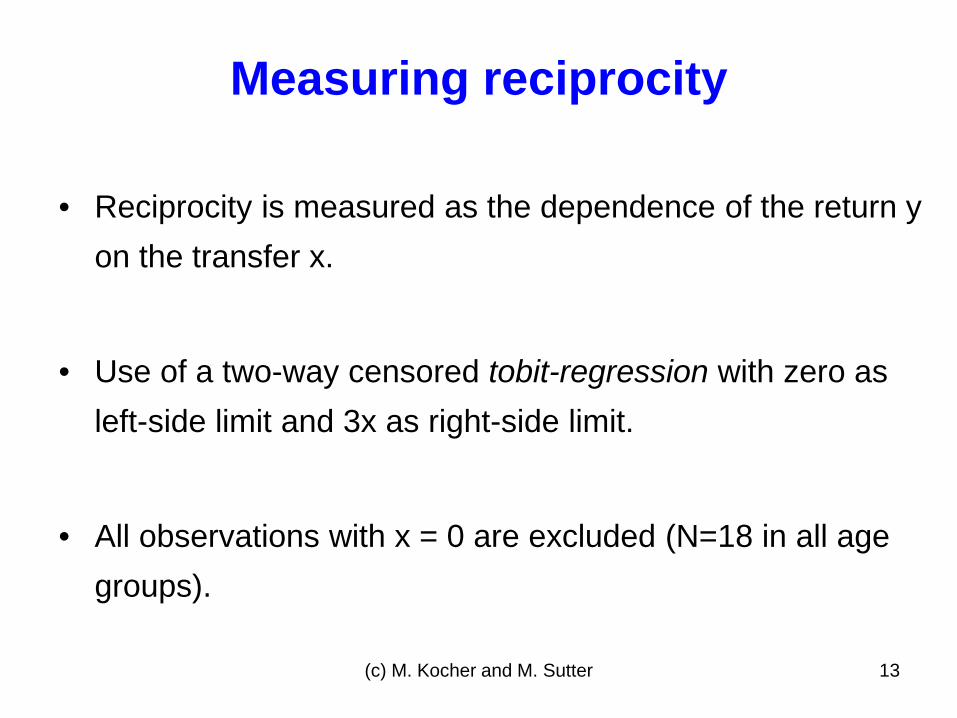
• Reciprocity is measured as the dependence of the return y on the transfer x.
• Use of a two-way censored tobit-regression with zero as left-side limit and 3x as right-side limit.
• All observations with x = 0 are excluded (N=18 in all age groups).
Measuring reciprocity
(c) M. Kocher and M. Sutter 14
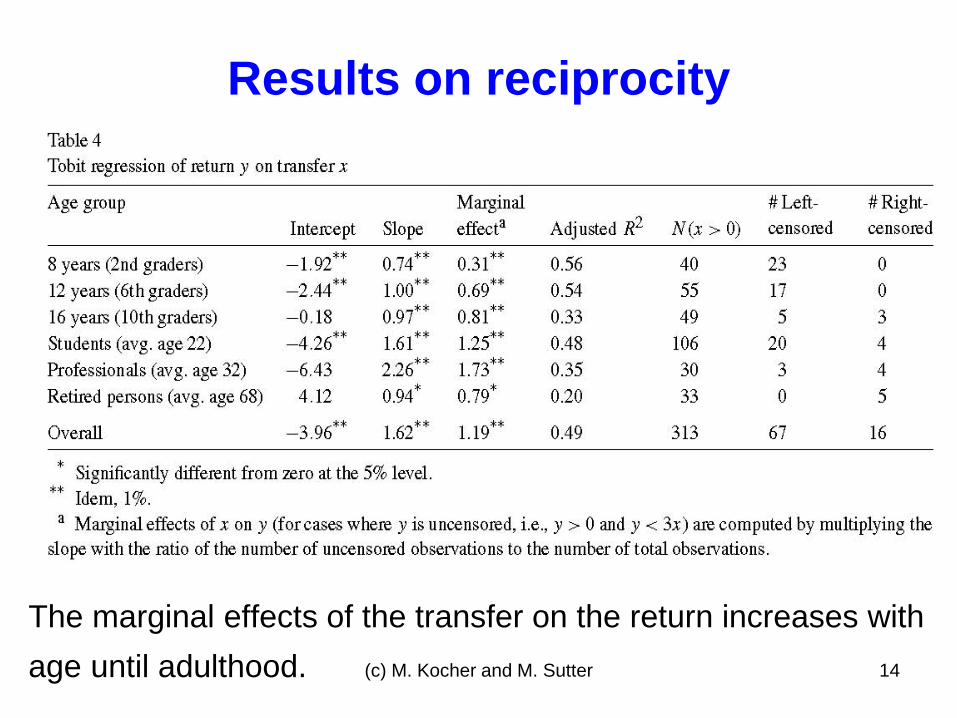
The marginal effects of the transfer on the return increases with age until adulthood.
Results on reciprocity
(c) M. Kocher and M. Sutter 15
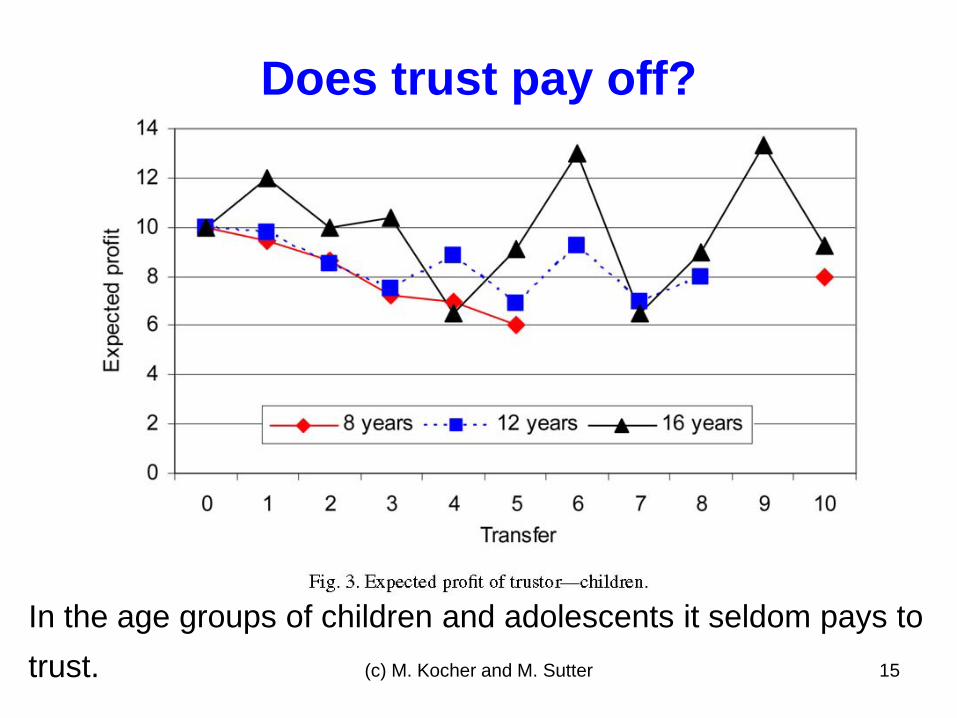
In the age groups of children and adolescents it seldom pays to trust.
Does trust pay off?
(c) M. Kocher and M. Sutter 16
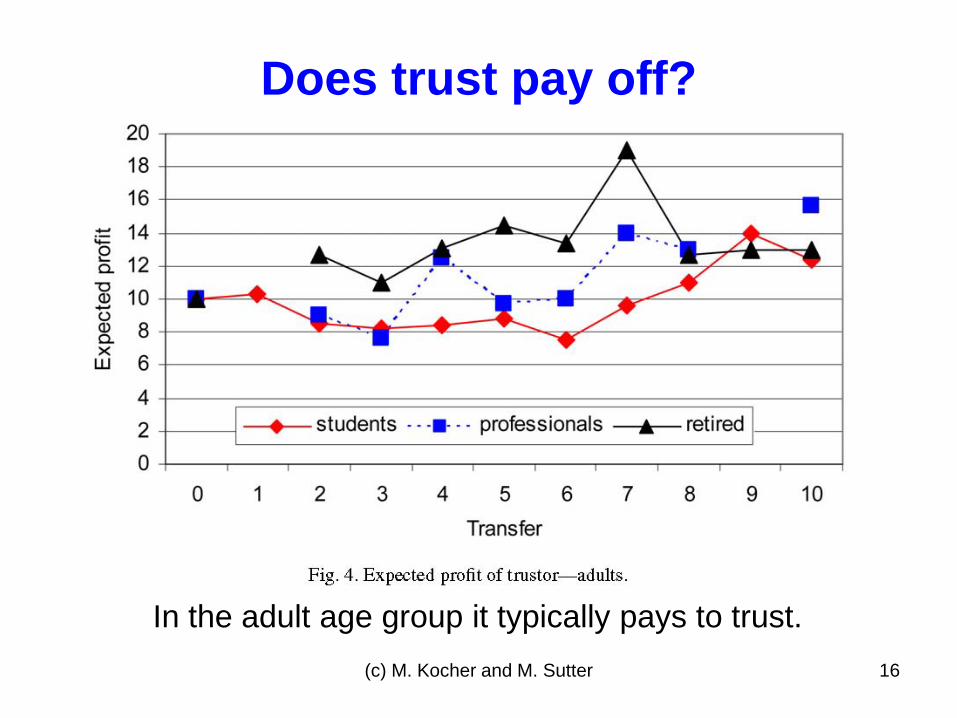
In the adult age group it typically pays to trust.
Does trust pay off?
(c) M. Kocher and M. Sutter 17
• Trust in strangers increases significantly from childhood to
early adulthood, and stays rather constant afterwards.
• Reciprocity is a prevailing pattern of behavior already at
age 8, but becomes less self-serving with age.
Sutter and Kocher (2007) – Summary
(c) M. Kocher and M. Sutter 18
• In the following we have a look at very recent studies on:
Study 1:
Uncertainty attitudes
Time preferences
Their relationship to real-world behavior
Study 2
More generally: Other-regarding preferences
What else?
Martin Kocher
Preferences, age, and predictability of behavior in the field Economic experiments with children and adolescents
14 March 2012 # 20 Martin Kocher
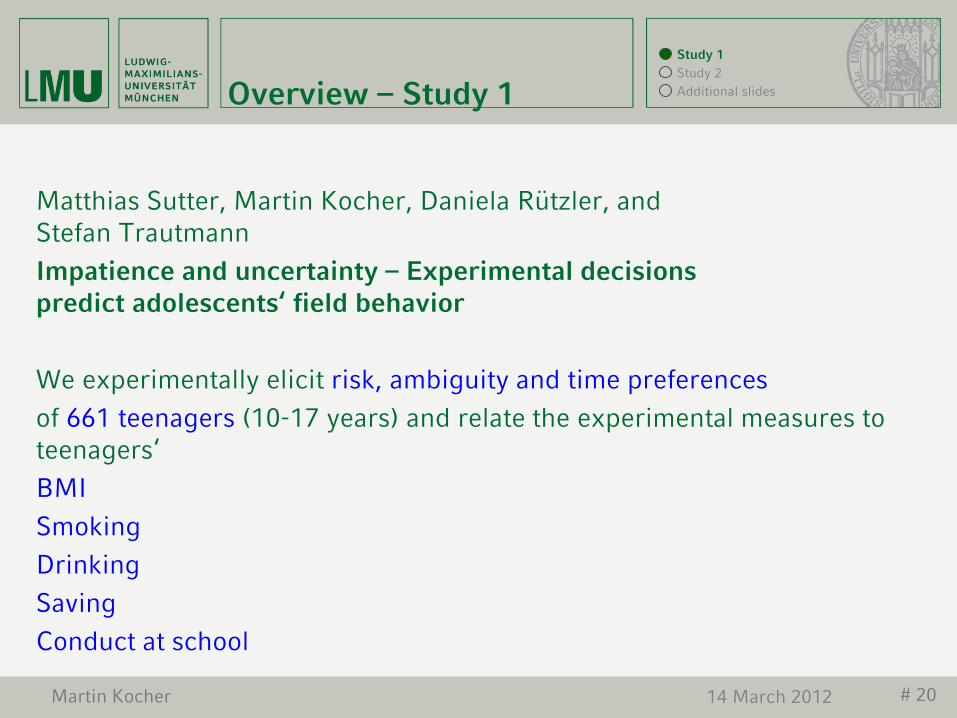
Matthias Sutter, Martin Kocher, Daniela Rützler, and Stefan Trautmann Impatience and uncertainty – Experimental decisions predict adolescents‘ field behavior We experimentally elicit risk, ambiguity and time preferences of 661 teenagers (10-17 years) and relate the experimental measures to teenagers‘ BMI Smoking Drinking Saving Conduct at school
Overview – Study 1 Study 1 Study 2 Additional slides
14 March 2012 # 21 Martin Kocher
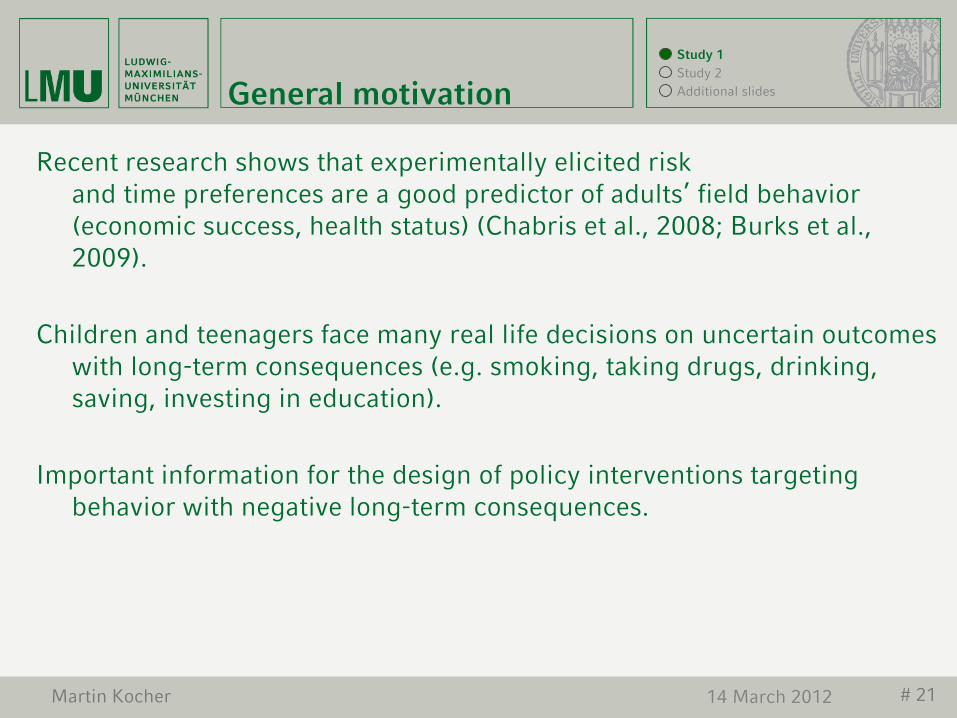
Recent research shows that experimentally elicited risk and time preferences are a good predictor of adults’ field behavior (economic success, health status) (Chabris et al., 2008; Burks et al., 2009).
Children and teenagers face many real life decisions on uncertain outcomes
with long-term consequences (e.g. smoking, taking drugs, drinking, saving, investing in education).
Important information for the design of policy interventions targeting
behavior with negative long-term consequences.
General motivation Study 1 Study 2 Additional slides
14 March 2012 # 22 Martin Kocher
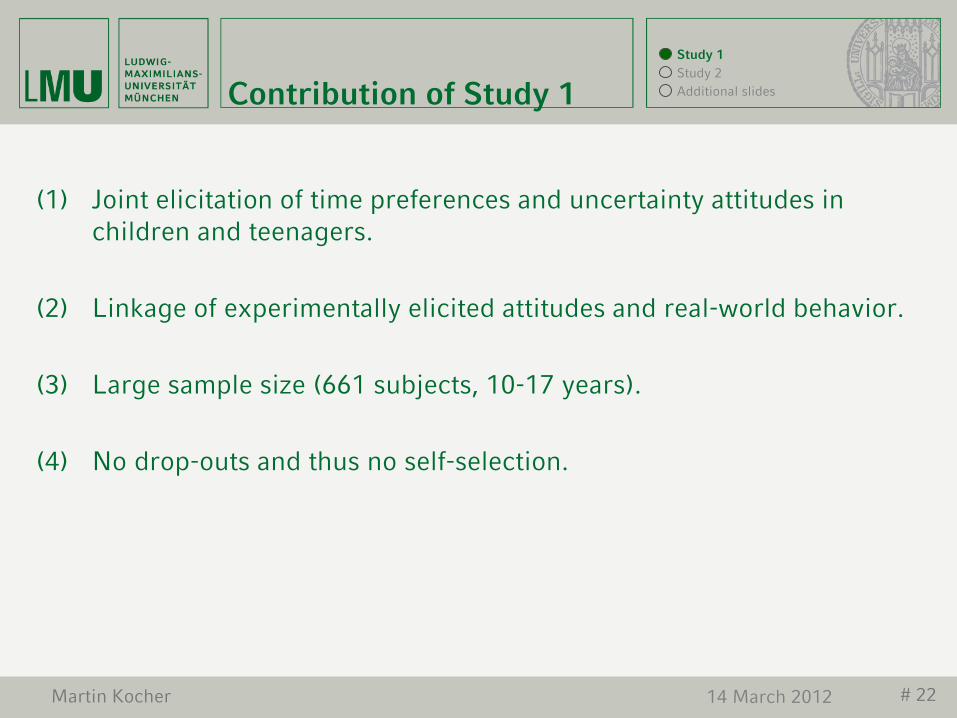
(1) Joint elicitation of time preferences and uncertainty attitudes in children and teenagers.
(2) Linkage of experimentally elicited attitudes and real-world behavior. (3) Large sample size (661 subjects, 10-17 years). (4) No drop-outs and thus no self-selection.
Contribution of Study 1 Study 1 Study 2 Additional slides
14 March 2012 # 23 Martin Kocher
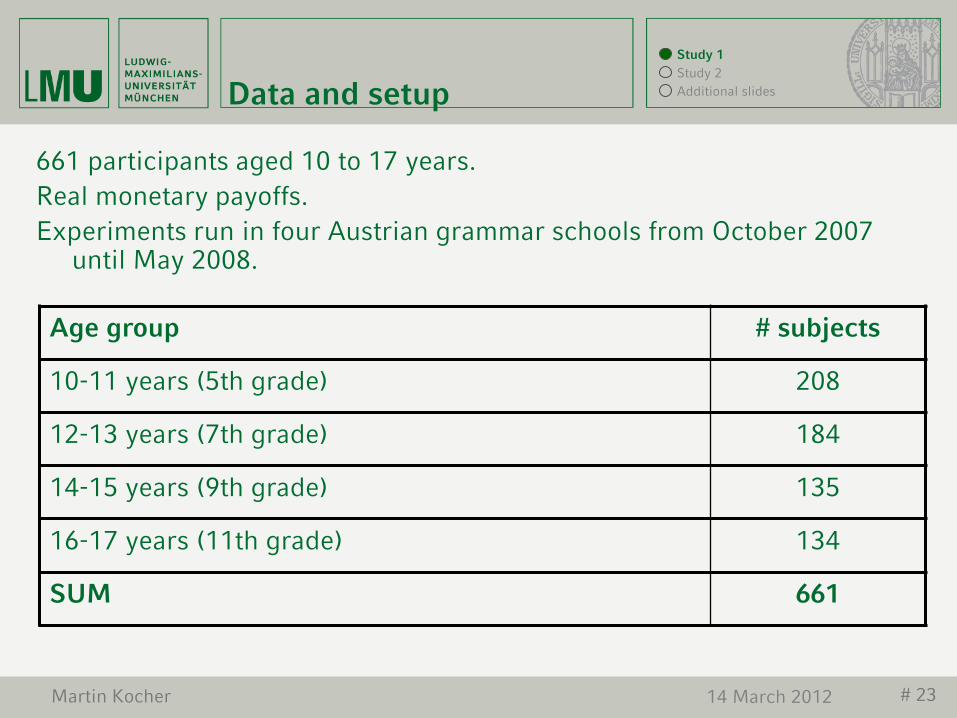
Data and setup
661 participants aged 10 to 17 years. Real monetary payoffs. Experiments run in four Austrian grammar schools from October 2007
until May 2008.
Age group # subjects
10-11 years (5th grade) 208
12-13 years (7th grade) 184
14-15 years (9th grade) 135
16-17 years (11th grade) 134
SUM 661
Study 1 Study 2 Additional slides
14 March 2012 # 24 Martin Kocher
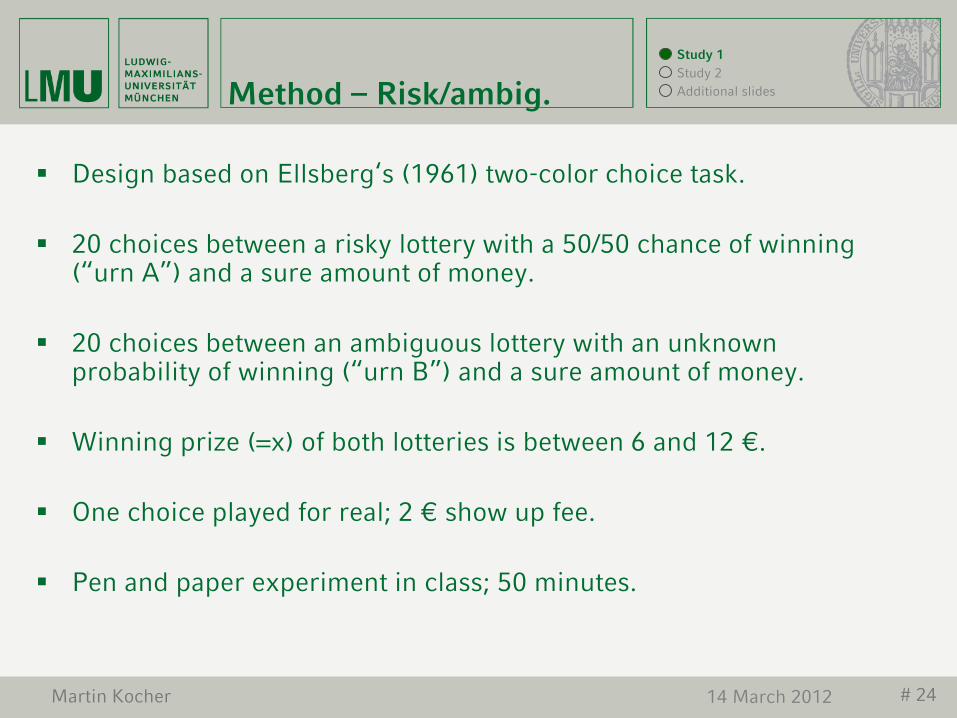
Method – Risk/ambig.
Design based on Ellsberg‘s (1961) two-color choice task. 20 choices between a risky lottery with a 50/50 chance of winning
(“urn A”) and a sure amount of money. 20 choices between an ambiguous lottery with an unknown
probability of winning (“urn B”) and a sure amount of money. Winning prize (=x) of both lotteries is between 6 and 12 €. One choice played for real; 2 € show up fee. Pen and paper experiment in class; 50 minutes.
Study 1 Study 2 Additional slides
14 March 2012 # 25 Martin Kocher
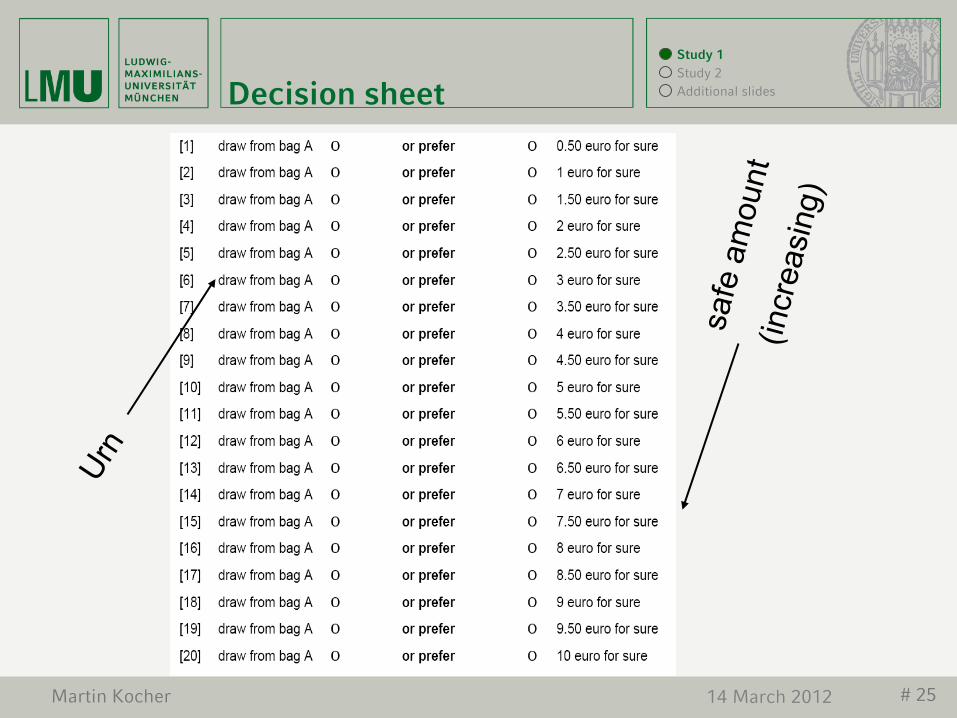
Decision sheet Study 1 Study 2 Additional slides
14 March 2012 # 26 Martin Kocher
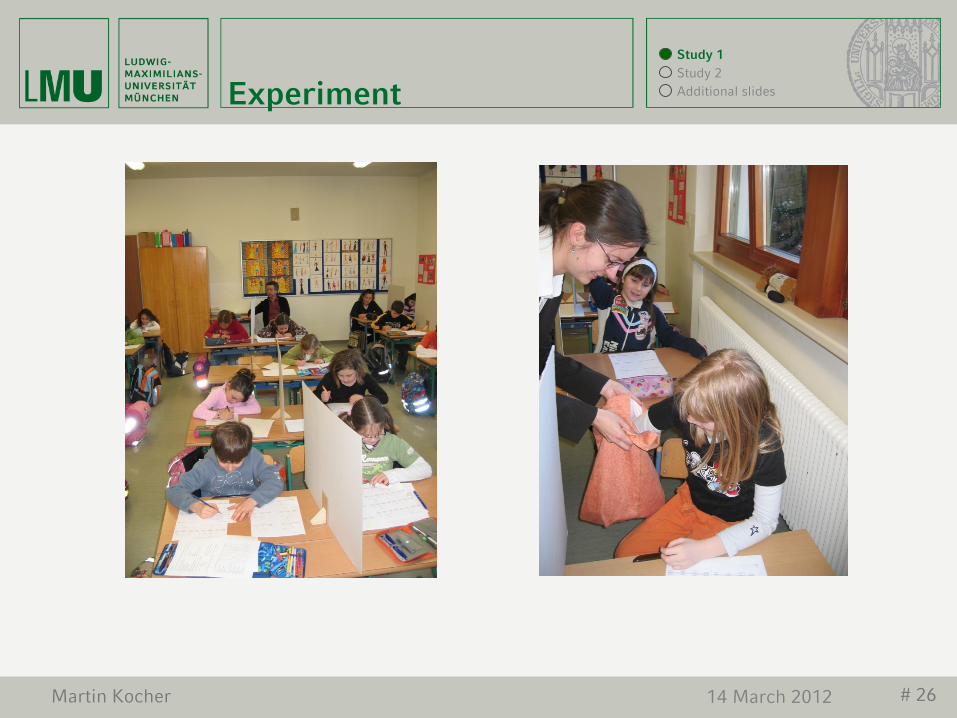
Experiment Study 1 Study 2 Additional slides
14 March 2012 # 27 Martin Kocher
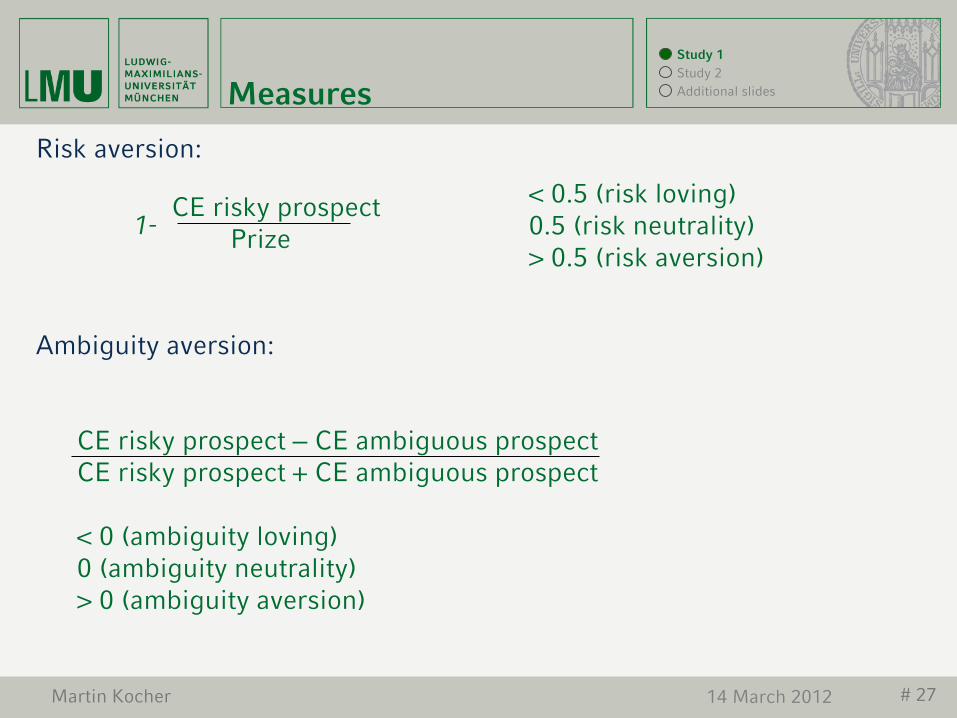
Measures
Risk aversion: 1-
Ambiguity aversion:
CE risky prospect Prize
CE risky prospect – CE ambiguous prospect CE risky prospect + CE ambiguous prospect < 0 (ambiguity loving) 0 (ambiguity neutrality) > 0 (ambiguity aversion)
< 0.5 (risk loving) 0.5 (risk neutrality) > 0.5 (risk aversion)
Study 1 Study 2 Additional slides
14 March 2012 # 28 Martin Kocher
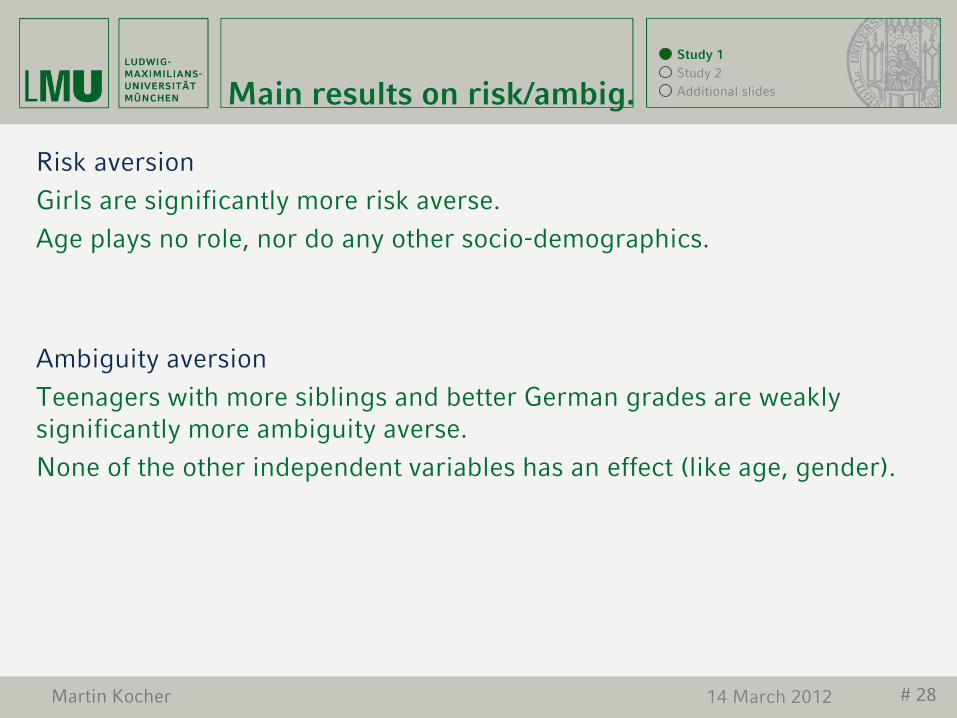
Main results on risk/ambig.
Risk aversion Girls are significantly more risk averse. Age plays no role, nor do any other socio-demographics.
Ambiguity aversion Teenagers with more siblings and better German grades are weakly significantly more ambiguity averse. None of the other independent variables has an effect (like age, gender).
Study 1 Study 2 Additional slides
14 March 2012 # 29 Martin Kocher
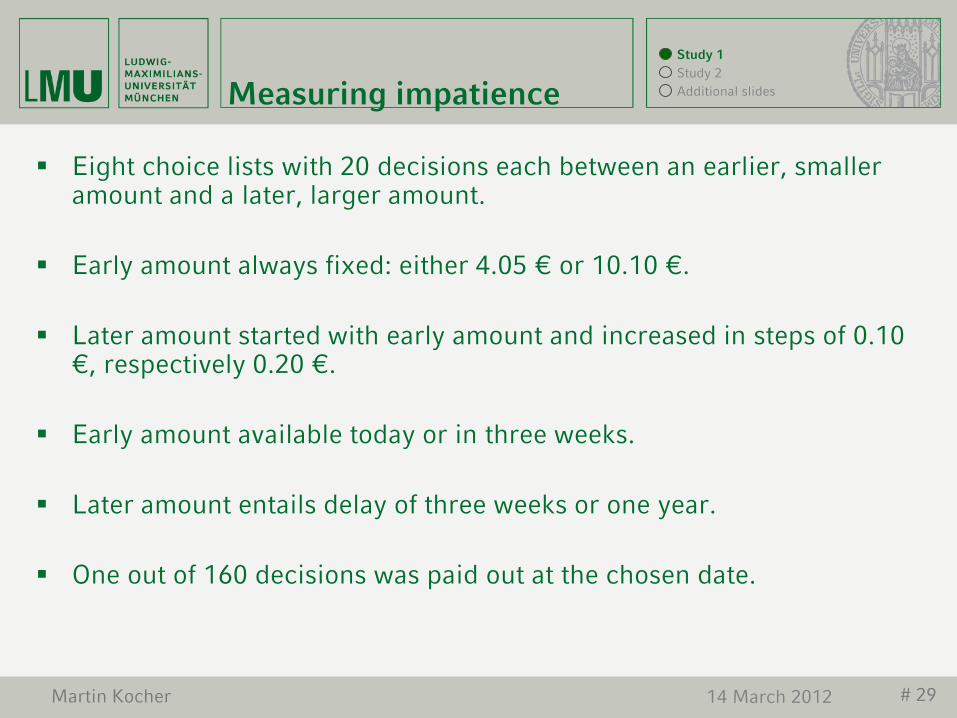
Measuring impatience
Eight choice lists with 20 decisions each between an earlier, smaller amount and a later, larger amount.
Early amount always fixed: either 4.05 € or 10.10 €. Later amount started with early amount and increased in steps of 0.10
€, respectively 0.20 €. Early amount available today or in three weeks. Later amount entails delay of three weeks or one year. One out of 160 decisions was paid out at the chosen date.
Study 1 Study 2 Additional slides

14 March 2012 # 30 Martin Kocher
One choice list example
[1] 10.10 euro today Ο or Ο 10.10 euro in 3 weeks [2] 10.10 euro today Ο or Ο 10.30 euro in 3 weeks [3] 10.10 euro today Ο or Ο 10.50 euro in 3 weeks [4] 10.10 euro today Ο or Ο 10.70 euro in 3 weeks [5] 10.10 euro today Ο or Ο 10.90 euro in 3 weeks [6] 10.10 euro today Ο or Ο 11.10 euro in 3 weeks [7] 10.10 euro today Ο or Ο 11.30 euro in 3 weeks [8] 10.10 euro today Ο or Ο 11.50 euro in 3 weeks [9] 10.10 euro today Ο or Ο 11.70 euro in 3 weeks [10] 10.10 euro today Ο or Ο 11.90 euro in 3 weeks [11] 10.10 euro today Ο or Ο 12.10 euro in 3 weeks [12] 10.10 euro today Ο or Ο 12.30 euro in 3 weeks [13] 10.10 euro today Ο or Ο 12.50 euro in 3 weeks [14] 10.10 euro today Ο or Ο 12.70 euro in 3 weeks [15] 10.10 euro today Ο or Ο 12.90 euro in 3 weeks [16] 10.10 euro today Ο or Ο 13.10 euro in 3 weeks [17] 10.10 euro today Ο or Ο 13.30 euro in 3 weeks [18] 10.10 euro today Ο or Ο 13.50 euro in 3 weeks [19] 10.10 euro today Ο or Ο 13.70 euro in 3 weeks [20] 10.10 euro today Ο or Ο 13.90 euro in 3 weeks
Study 1 Study 2 Additional slides
14 March 2012 # 31 Martin Kocher
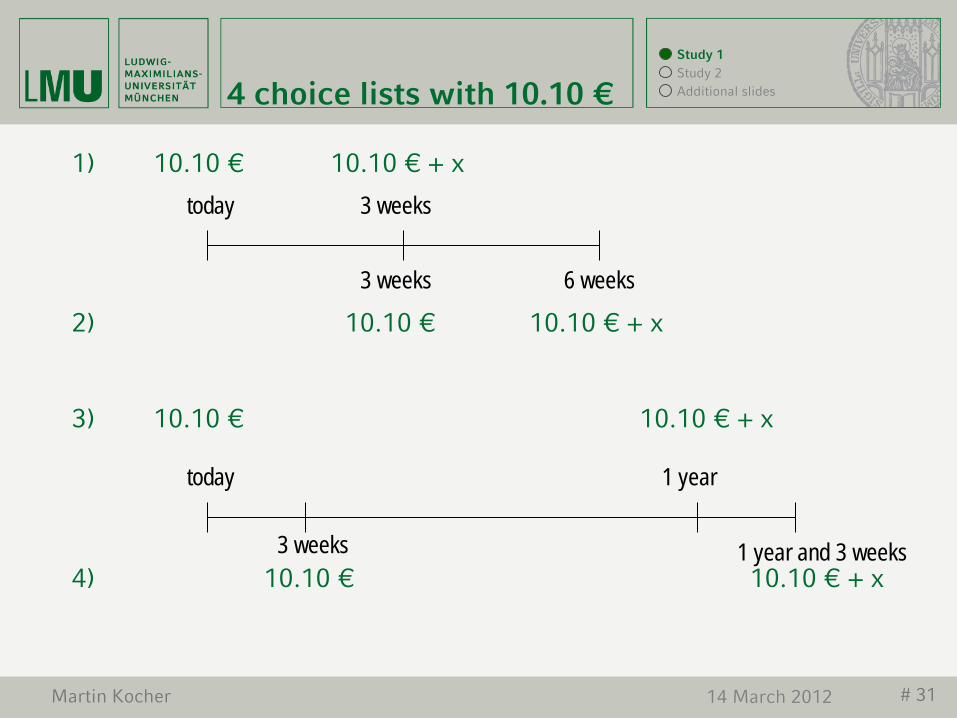
4 choice lists with 10.10 €
1) 10.10 € 10.10 € + x 2) 10.10 € 10.10 € + x 3) 10.10 € 10.10 € + x 4) 10.10 € 10.10 € + x
today
3 weeks 6 weeks
today 1 year
1 year and 3 weeks
3 weeks
3 weeks
Study 1 Study 2 Additional slides
14 March 2012 # 32 Martin Kocher
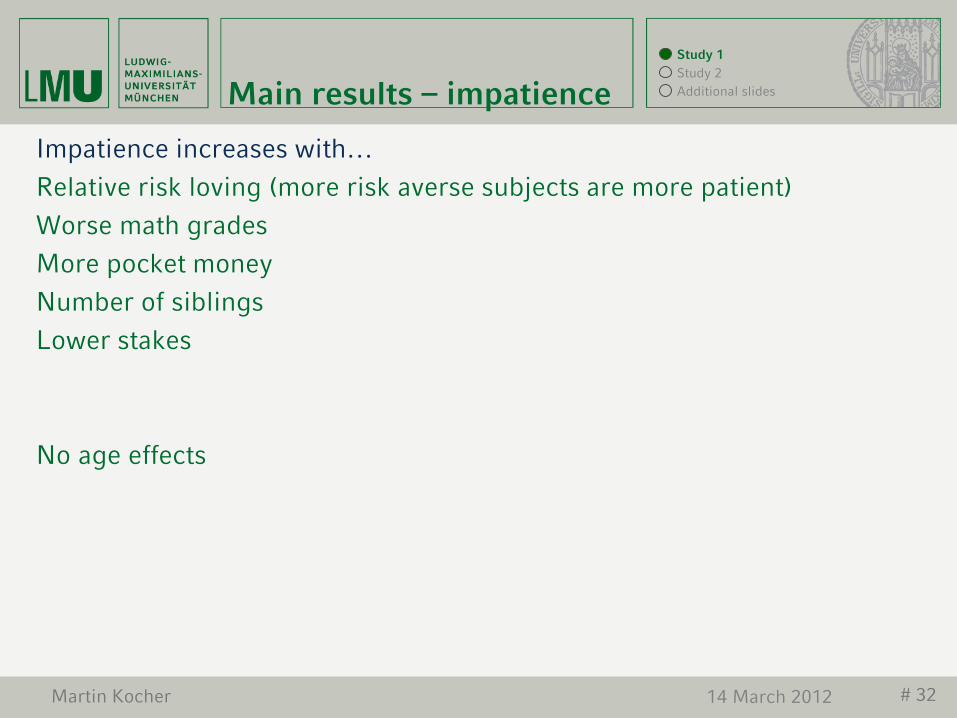
Main results – impatience
Impatience increases with… Relative risk loving (more risk averse subjects are more patient) Worse math grades More pocket money Number of siblings Lower stakes No age effects
Study 1 Study 2 Additional slides
14 March 2012 # 33 Martin Kocher
Field behavior
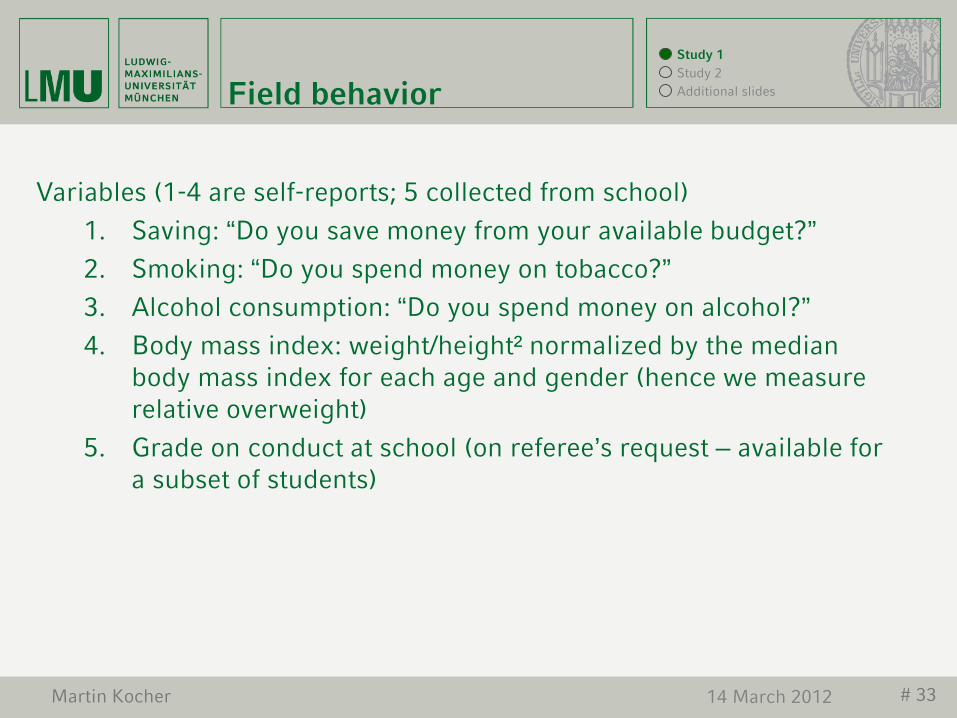
Variables (1-4 are self-reports; 5 collected from school)
1. Saving: “Do you save money from your available budget?” 2. Smoking: “Do you spend money on tobacco?” 3. Alcohol consumption: “Do you spend money on alcohol?” 4. Body mass index: weight/height² normalized by the median
body mass index for each age and gender (hence we measure relative overweight)
5. Grade on conduct at school (on referee’s request – available for a subset of students)
Study 1 Study 2 Additional slides
14 March 2012 # 34 Martin Kocher
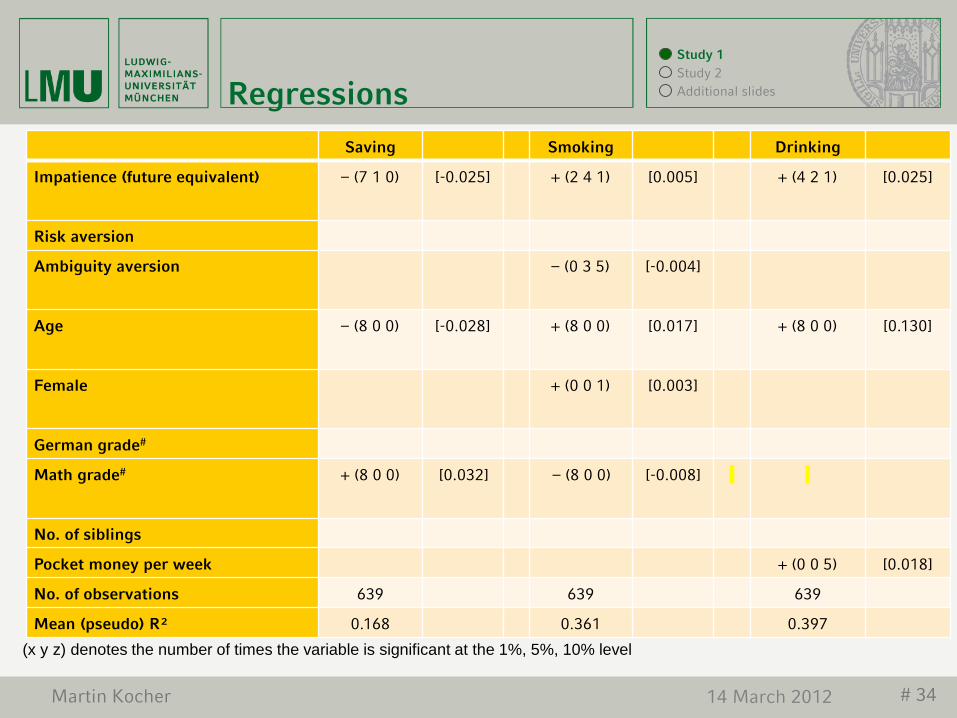
Regressions
Saving Smoking Drinking
Impatience (future equivalent) – (7 1 0) [-0.025] + (2 4 1) [0.005] + (4 2 1) [0.025]
Risk aversion
Ambiguity aversion – (0 3 5) [-0.004]
Age – (8 0 0) [-0.028] + (8 0 0) [0.017] + (8 0 0) [0.130]
Female + (0 0 1) [0.003]
German grade#
Math grade# + (8 0 0) [0.032] – (8 0 0) [-0.008]
No. of siblings
Pocket money per week + (0 0 5) [0.018]
No. of observations 639 639 639
Mean (pseudo) R² 0.168 0.361 0.397 (x y z) denotes the number of times the variable is significant at the 1%, 5%, 10% level
Study 1 Study 2 Additional slides
14 March 2012 # 35 Martin Kocher
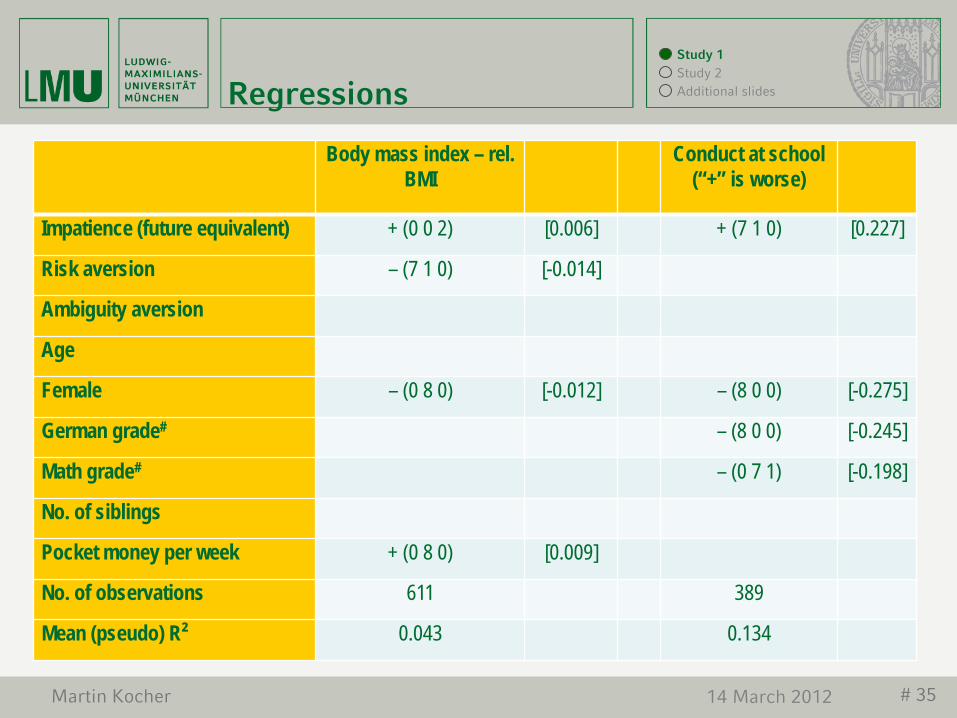
Regressions
Body mass index – rel. BMI
Conduct at school (“+” is worse)
Impatience (future equivalent) + (0 0 2) [0.006] + (7 1 0) [0.227]
Risk aversion – (7 1 0) [-0.014]
Ambiguity aversion
Age
Female – (0 8 0) [-0.012] – (8 0 0) [-0.275]
German grade# – (8 0 0) [-0.245]
Math grade# – (0 7 1) [-0.198]
No. of siblings
Pocket money per week + (0 8 0) [0.009]
No. of observations 611 389
Mean (pseudo) R² 0.043 0.134
Study 1 Study 2 Additional slides
14 March 2012 # 36 Martin Kocher
Field behavior (saving, smoking, drinking, body mass index, discipline in school) is predominantly influenced by impatience (delay aversion).
Risk and ambiguity attitudes are poor predictors of field behavior when controlling for impatience (consistent with the literature; see Dohmen et al., 2010).
Policy implications.
Summary – Study 1 Study 1 Study 2 Additional slides
14 March 2012 # 37 Martin Kocher
Matthias Sutter, Francesco Feri, Martin Kocher, Peter Martinsson, Katarina Nordblom, and Daniela Rützler Social preferences in childhood and adolescence. A large-scale experiment The study elicits social preferences of 883 teenagers (8-17 years) and classifies them according to five types Selfish Efficiency (Utilitarian) Maximin (Rawls) Inequality aversion (Fehr and Schmidt) Inequality aversion (Bolton and Ockenfels)
Overview – Study 2 Study 1 Study 2 Additional slides
14 March 2012 # 38 Martin Kocher
Why study social preferences of children and teenagers? Only recently social preferences of children and teenagers are studied
in the literature. Essential for assessment if models of economic decision making with
social preferences can claim general applicability. Decisions taken by children and adolescents in the real world. Economic/ethics education.
Important applications: cooperation, negotiations,…
Motivation Study 1 Study 2 Additional slides
14 March 2012 # 39 Martin Kocher
Literature
Harbaugh et al. (2003) find that young children make considerably
smaller dictator and ultimatum proposals than older children and adults. Boys and relatively tall children make smaller dictator proposals than girls and relatively small children. (310 children aged 7-18 years)
Benenson et al. (2007) find in a dictator game with 360 children aged 4 to 9 years, that older children and children from higher socioeconomic status environments behaved more altruistically.
Houser and Schunk (2007) study gender differences in young age (8-10 years) in dictator games, finding no difference. (151 children)
Study 1 Study 2 Additional slides
14 March 2012 # 40 Martin Kocher
Literature
Sutter (2007) examines the behavior of 200 children, teens and
university students in an ultimatum game and concludes that children and teens reject unequal offers much more often than university students.
Fehr et al. (2008) find that inequality aversion develops strongly between the ages of 3 and 8. Young children (at age 3-4) behave selfishly, whereas most children at age 7-8 prefer allocations that remove advantageous or disadvantageous inequality. (229 children)
Study 1 Study 2 Additional slides
14 March 2012 # 41 Martin Kocher
Types
Selfish Efficiency: If a subject maximizes the sum of payoffs, she is classified
as an Efficiency-type (following Utilitarian preferences) Maximin: If she maximizes the minimum payoff in her group of
subjects, she is denoted a Maximin-type (following Rawlsian preferences).
Fehr & Schmidt (1999, henceforth F&S): inequality is measured as difference of the own payoff to the other players’ payoffs
Bolton & Ockenfels (2000, henceforth ERC): inequality is understood as deviation of a subject’s payoff from the average payoff in a group
Study 1 Study 2 Additional slides
14 March 2012 # 42 Martin Kocher
The experiment – Design
Measurement of selfishness, inequality aversion, efficiency, and maximin preferences in eight simple one-shot distribution “games” taken from Engelmann & Strobel (2004).
Classification Taxation games, Envy games, Rich and poor games
3 possible allocations of money between 3 persons (person 1, 2 and 3) in a randomly formed group.
Only choice of person 2 relevant for final distribution of the payoffs. One of the “games” was randomly selected and paid out. Payoffs distributed in sealed envelopes several days after experiment. To give same incentives to all participants we doubled stake sizes for
students aged 14/15 (proportional to pocket money). Pen and paper experiments in class. 40 minutes (including post-experimental questionnaire)
Study 1 Study 2 Additional slides
14 March 2012 # 43 Martin Kocher
Participants
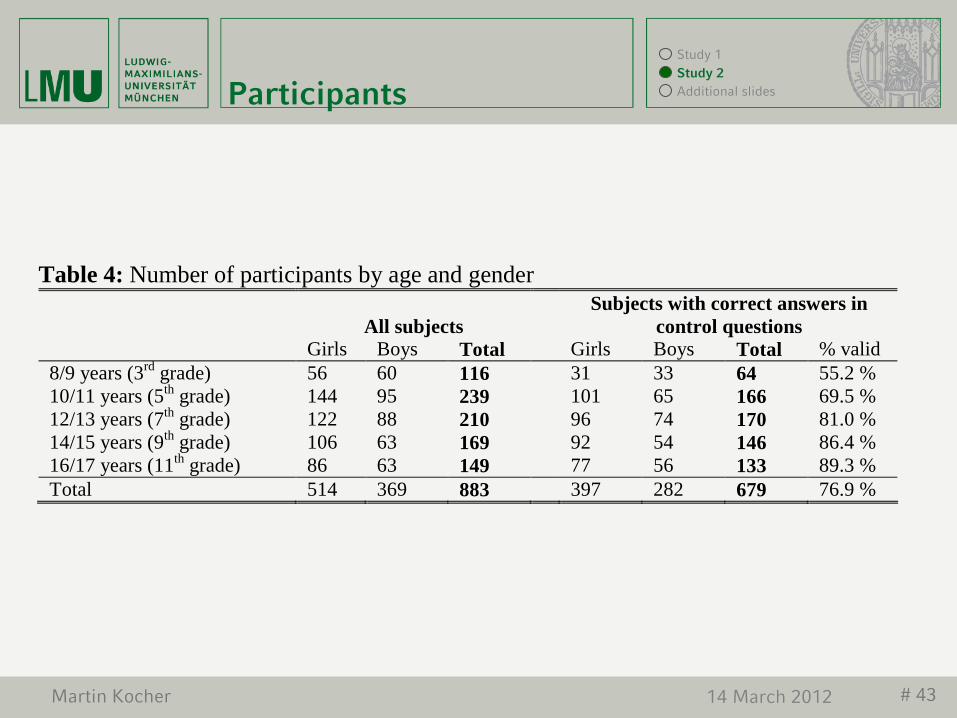
Table 4: Number of participants by age and gender
All subjects Subjects with correct answers in
control questions Girls Boys Total Girls Boys Total % valid 8/9 years (3rd grade) 56 60 116 31 33 64 55.2 % 10/11 years (5th grade) 144 95 239 101 65 166 69.5 % 12/13 years (7th grade) 122 88 210 96 74 170 81.0 % 14/15 years (9th grade) 106 63 169 92 54 146 86.4 % 16/17 years (11th grade) 86 63 149 77 56 133 89.3 % Total 514 369 883 397 282 679 76.9 %
Study 1 Study 2 Additional slides
14 March 2012 # 44 Martin Kocher
Estimations
We conduct a maximum likelihood error-rate analysis of subjects’
decisions following the general lines of the econometric model used in Costa-Gomes et al. (2001).
The econometric model is a mixture model in which each subject’s type is drawn from a common prior distribution over the five types considered in this paper: Selfishness, Efficiency, Maximin, F&S, and ERC.
A subject’s type is assumed to be the same in all eight games, but decision makers are allowed to make errors.
Study 1 Study 2 Additional slides
14 March 2012 # 45 Martin Kocher
Results - Girls Study 1 Study 2 Additional slides
14 March 2012 # 46 Martin Kocher
Results - Boys Study 1 Study 2 Additional slides
14 March 2012 # 47 Martin Kocher
Conclusion – Study 2
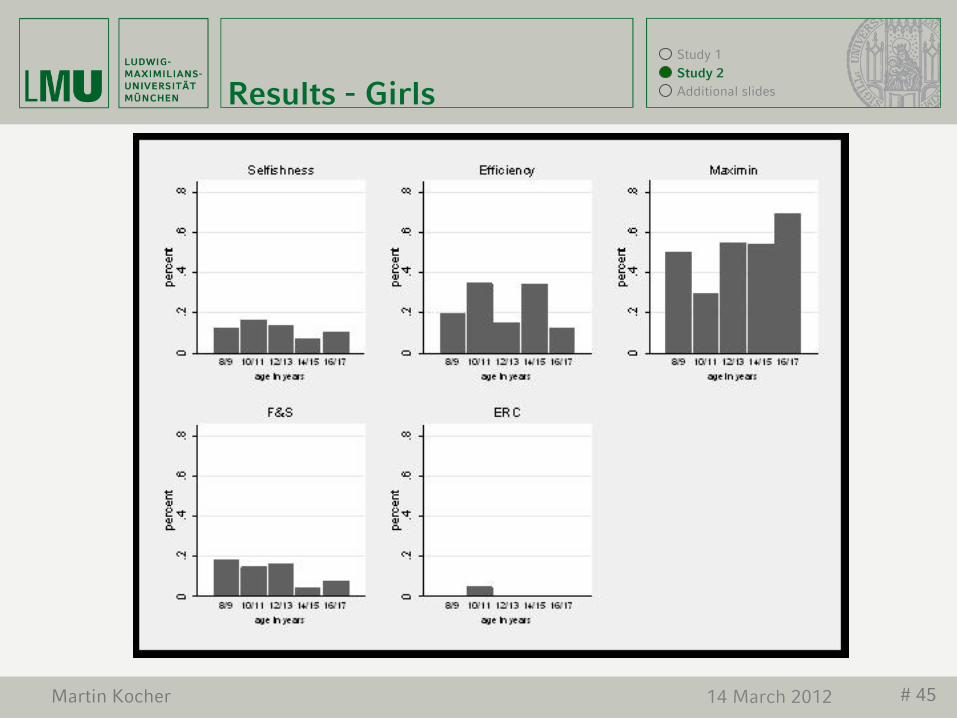
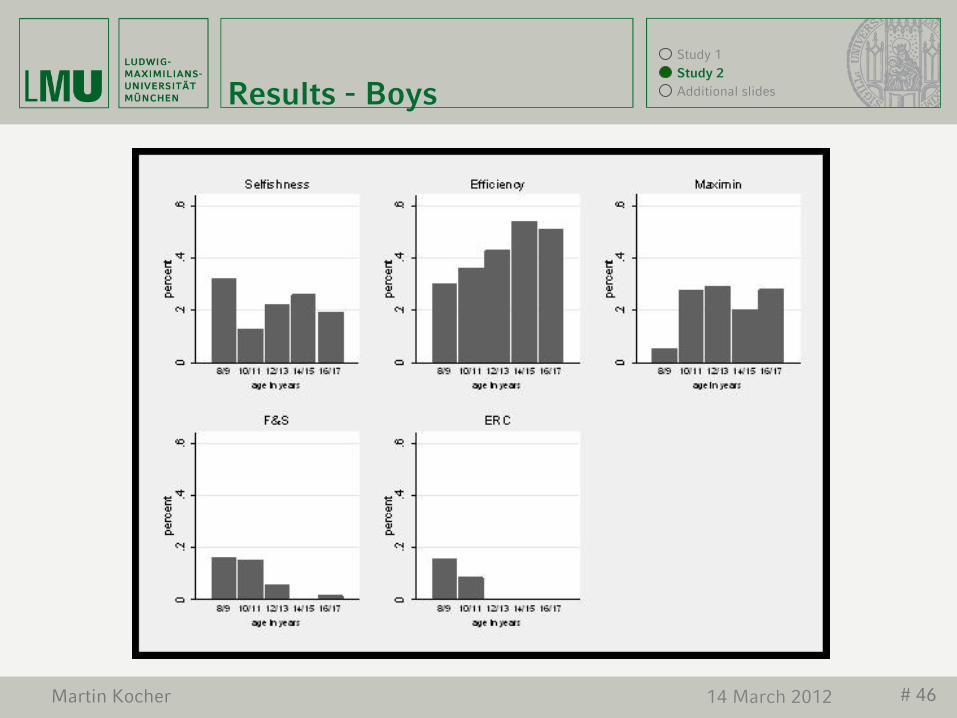
Already by the age of 10, children have well established social preferences.
Most of subjects can be classified as either selfish or having maximin-preferences.
Inequality aversion is less important overall. Girls tend to be motivated more and more by maximin-preference
when they grow older Boys tend to go for efficient allocations more and more when they
become older.
Study 1 Study 2 Additional slides
14 March 2012 # 48 Martin Kocher
Appendix: Results
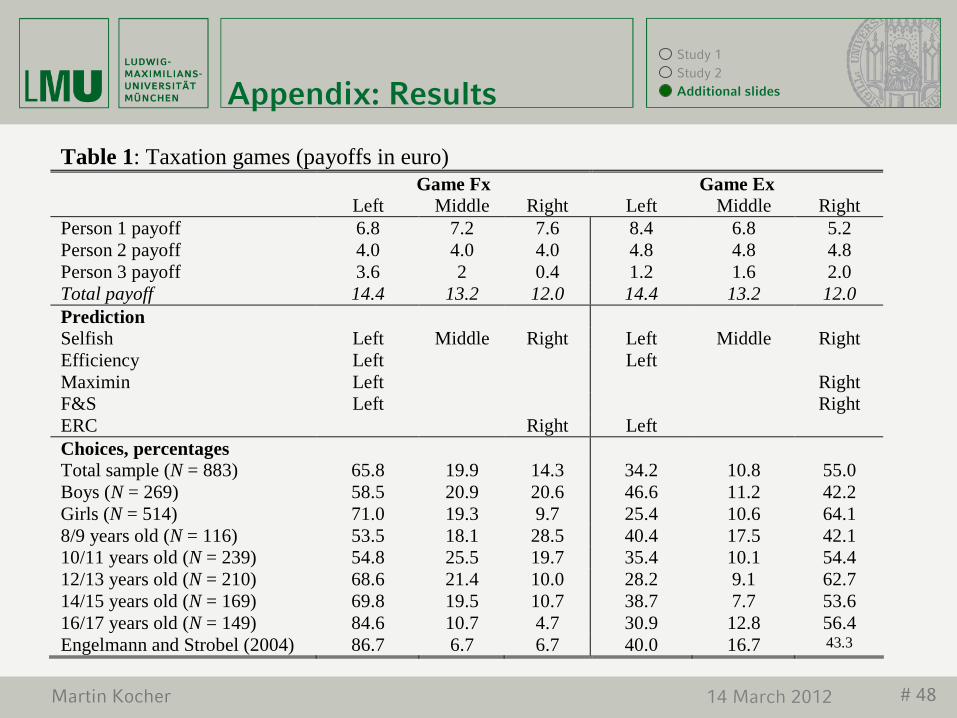
Table 1: Taxation games (payoffs in euro) Game Fx Game Ex Left Middle Right Left Middle Right Person 1 payoff 6.8 7.2 7.6 8.4 6.8 5.2 Person 2 payoff 4.0 4.0 4.0 4.8 4.8 4.8 Person 3 payoff 3.6 2 0.4 1.2 1.6 2.0 Total payoff 14.4 13.2 12.0 14.4 13.2 12.0 Prediction Selfish Left Middle Right Left Middle Right Efficiency Left Left Maximin Left Right F&S Left Right ERC Right Left Choices, percentages Total sample (N = 883) 65.8 19.9 14.3 34.2 10.8 55.0 Boys (N = 269) 58.5 20.9 20.6 46.6 11.2 42.2 Girls (N = 514) 71.0 19.3 9.7 25.4 10.6 64.1 8/9 years old (N = 116) 53.5 18.1 28.5 40.4 17.5 42.1 10/11 years old (N = 239) 54.8 25.5 19.7 35.4 10.1 54.4 12/13 years old (N = 210) 68.6 21.4 10.0 28.2 9.1 62.7 14/15 years old (N = 169) 69.8 19.5 10.7 38.7 7.7 53.6 16/17 years old (N = 149) 84.6 10.7 4.7 30.9 12.8 56.4 Engelmann and Strobel (2004) 86.7 6.7 6.7 40.0 16.7 43.3
Study 1 Study 2 Additional slides
14 March 2012 # 49 Martin Kocher
Appendix: Results
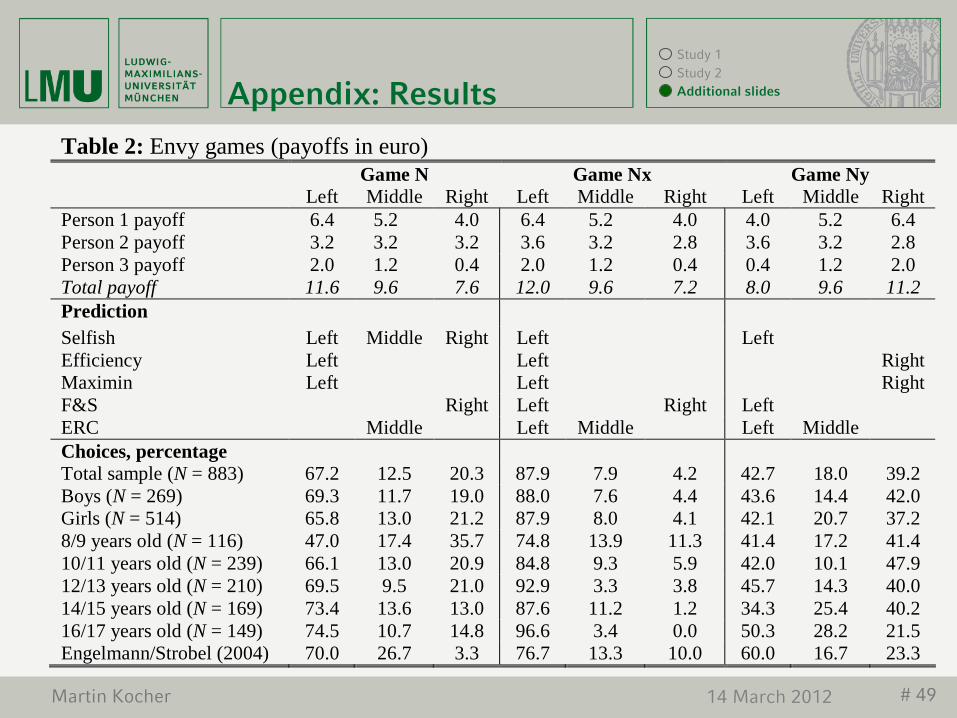
Table 2: Envy games (payoffs in euro) Game N Game Nx Game Ny Left Middle Right Left Middle Right Left Middle Right Person 1 payoff 6.4 5.2 4.0 6.4 5.2 4.0 4.0 5.2 6.4 Person 2 payoff 3.2 3.2 3.2 3.6 3.2 2.8 3.6 3.2 2.8 Person 3 payoff 2.0 1.2 0.4 2.0 1.2 0.4 0.4 1.2 2.0 Total payoff 11.6 9.6 7.6 12.0 9.6 7.2 8.0 9.6 11.2 Prediction Selfish Left Middle Right Left Left Efficiency Left Left Right Maximin Left Left Right F&S Right Left Right Left ERC Middle Left Middle Left Middle Choices, percentage Total sample (N = 883) 67.2 12.5 20.3 87.9 7.9 4.2 42.7 18.0 39.2 Boys (N = 269) 69.3 11.7 19.0 88.0 7.6 4.4 43.6 14.4 42.0 Girls (N = 514) 65.8 13.0 21.2 87.9 8.0 4.1 42.1 20.7 37.2 8/9 years old (N = 116) 47.0 17.4 35.7 74.8 13.9 11.3 41.4 17.2 41.4 10/11 years old (N = 239) 66.1 13.0 20.9 84.8 9.3 5.9 42.0 10.1 47.9 12/13 years old (N = 210) 69.5 9.5 21.0 92.9 3.3 3.8 45.7 14.3 40.0 14/15 years old (N = 169) 73.4 13.6 13.0 87.6 11.2 1.2 34.3 25.4 40.2 16/17 years old (N = 149) 74.5 10.7 14.8 96.6 3.4 0.0 50.3 28.2 21.5 Engelmann/Strobel (2004) 70.0 26.7 3.3 76.7 13.3 10.0 60.0 16.7 23.3
Study 1 Study 2 Additional slides
14 March 2012 # 50 Martin Kocher
Appendix: Results
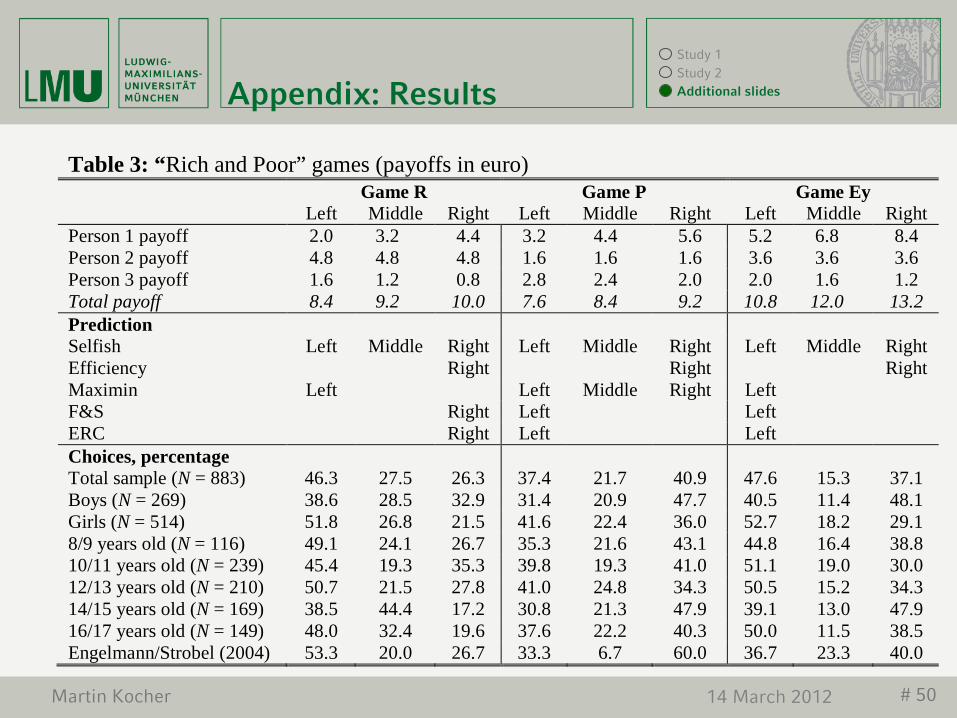
Table 3: “Rich and Poor” games (payoffs in euro) Game R Game P Game Ey Left Middle Right Left Middle Right Left Middle Right Person 1 payoff 2.0 3.2 4.4 3.2 4.4 5.6 5.2 6.8 8.4 Person 2 payoff 4.8 4.8 4.8 1.6 1.6 1.6 3.6 3.6 3.6 Person 3 payoff 1.6 1.2 0.8 2.8 2.4 2.0 2.0 1.6 1.2 Total payoff 8.4 9.2 10.0 7.6 8.4 9.2 10.8 12.0 13.2 Prediction Selfish Left Middle Right Left Middle Right Left Middle Right Efficiency Right Right Right Maximin Left Left Middle Right Left F&S Right Left Left ERC Right Left Left Choices, percentage Total sample (N = 883) 46.3 27.5 26.3 37.4 21.7 40.9 47.6 15.3 37.1 Boys (N = 269) 38.6 28.5 32.9 31.4 20.9 47.7 40.5 11.4 48.1 Girls (N = 514) 51.8 26.8 21.5 41.6 22.4 36.0 52.7 18.2 29.1 8/9 years old (N = 116) 49.1 24.1 26.7 35.3 21.6 43.1 44.8 16.4 38.8 10/11 years old (N = 239) 45.4 19.3 35.3 39.8 19.3 41.0 51.1 19.0 30.0 12/13 years old (N = 210) 50.7 21.5 27.8 41.0 24.8 34.3 50.5 15.2 34.3 14/15 years old (N = 169) 38.5 44.4 17.2 30.8 21.3 47.9 39.1 13.0 47.9 16/17 years old (N = 149) 48.0 32.4 19.6 37.6 22.2 40.3 50.0 11.5 38.5 Engelmann/Strobel (2004) 53.3 20.0 26.7 33.3 6.7 60.0 36.7 23.3 40.0
Study 1 Study 2 Additional slides