Embed Size (px)
Citation preview
1
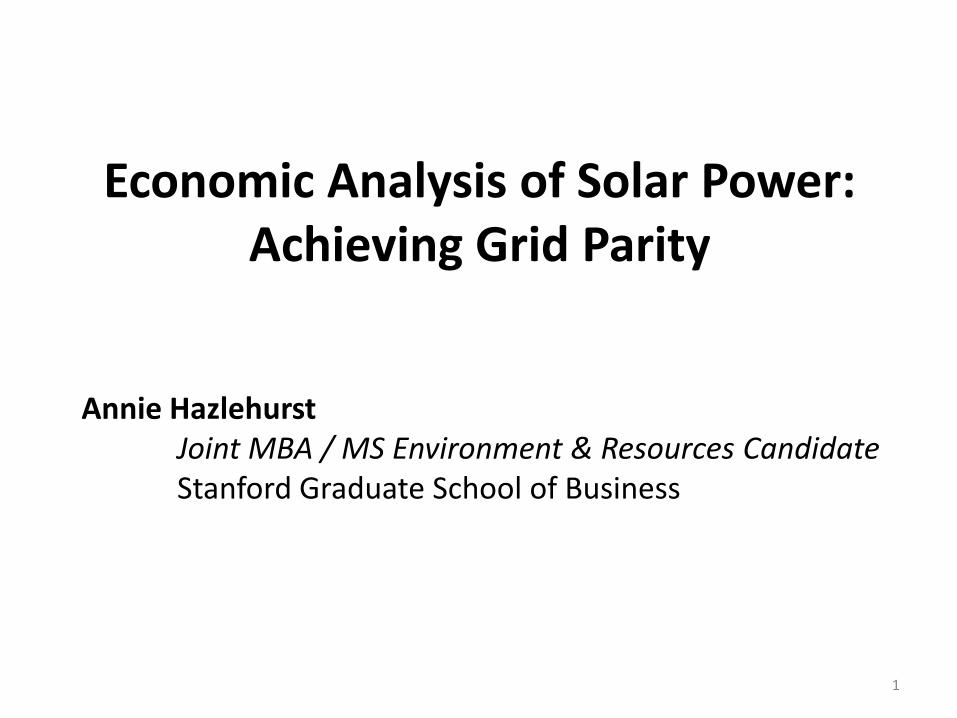
Economic Analysis of Solar Power: Achieving Grid Parity
Annie HazlehurstJoint MBA / MS Environment & Resources CandidateStanford Graduate School of Business
2
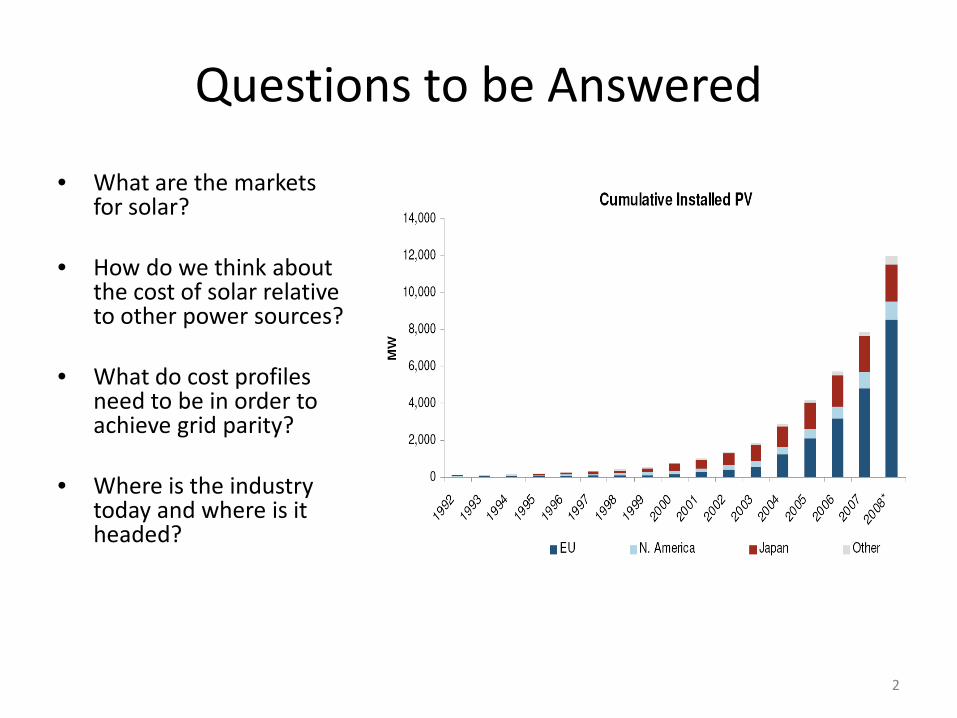
Questions to be Answered
• What are the markets for solar?
• How do we think about the cost of solar relative to other power sources?
• What do cost profiles need to be in order to achieve grid parity?
• Where is the industry today and where is it headed?

3
3 Primary Types of Solar Power
Photovoltaics (PV) Concentrating PV Solar Thermal
4
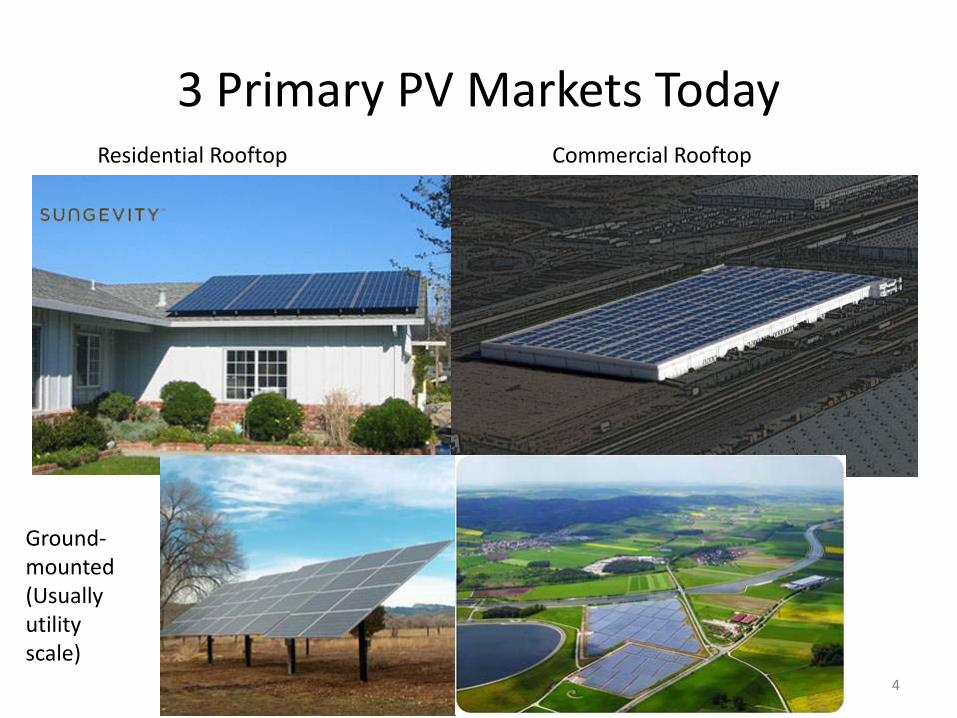
3 Primary PV Markets TodayResidential Rooftop Commercial Rooftop
Ground-mounted (Usually utility scale)
5
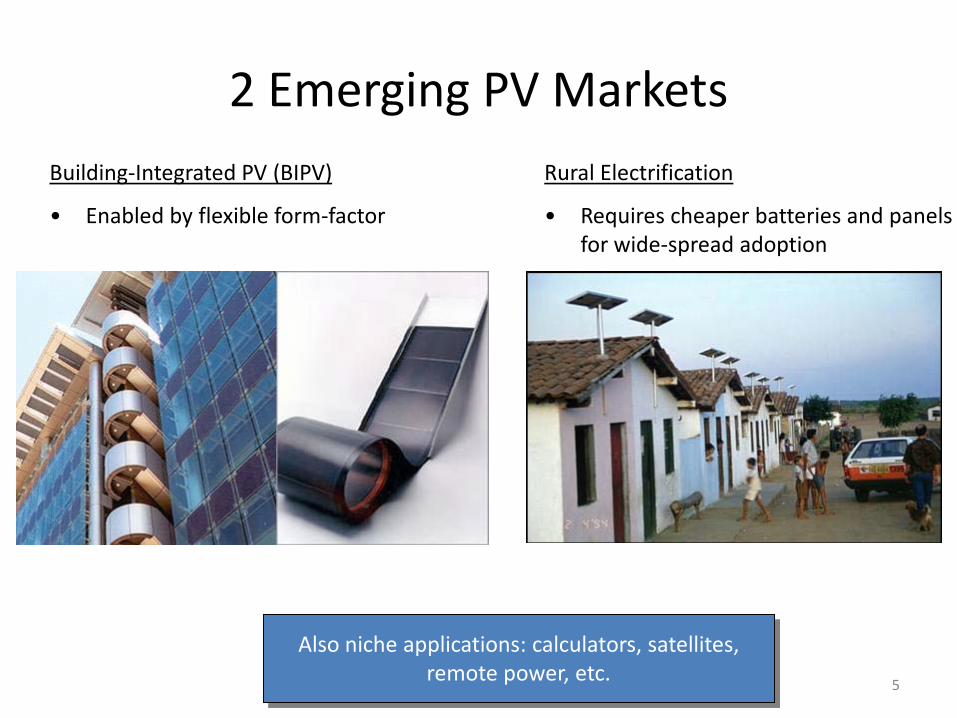
2 Emerging PV Markets
Also niche applications: calculators, satellites, remote power, etc.
Building-Integrated PV (BIPV)
• Enabled by flexible form-factor
Rural Electrification
• Requires cheaper batteries and panels for wide-spread adoption
66
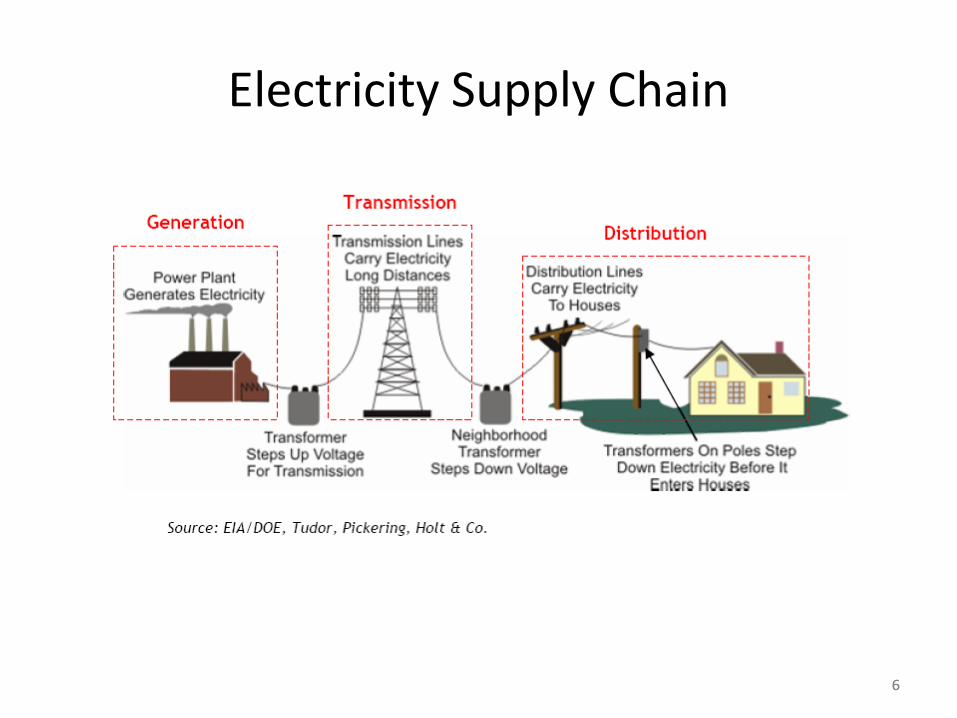
Electricity Supply Chain
7
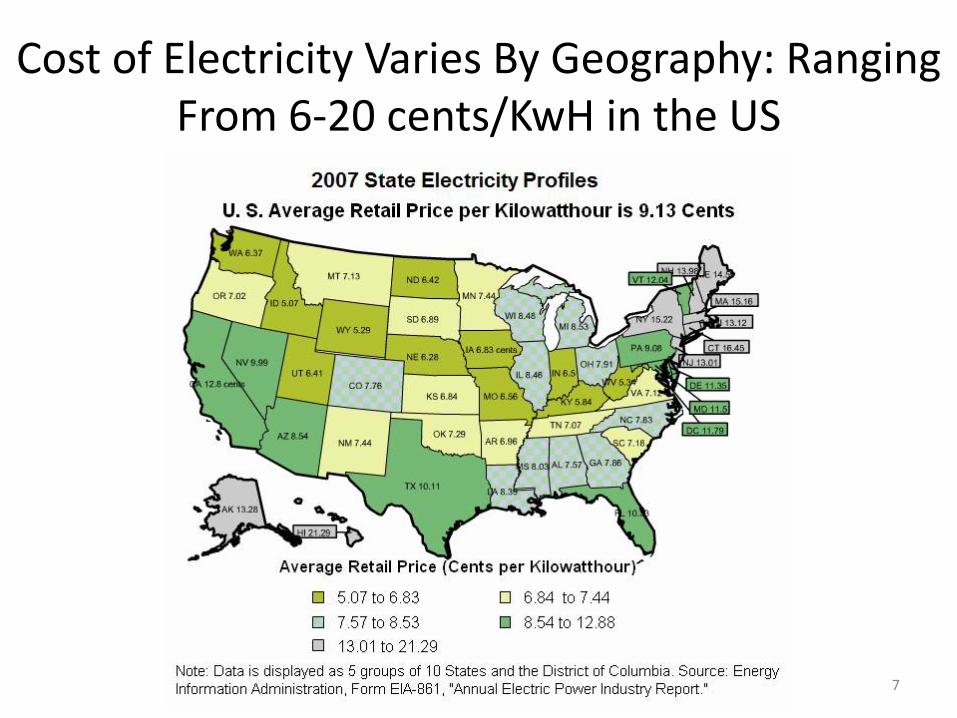
Cost of Electricity Varies By Geography: Ranging From 6-20 cents/KwH in the US

88
Incentives Driving Adoption
Source: www.dsireusa.org
Renewables Portfolio Standards
State renewable portfolio standard
State renewable portfolio goal
Solar water heating eligible *† Extra credit for solar or customer-sited renewables
Includes non-renewable alternative resources
WA: 15% by 2020*
CA: 33% by 2020
☼ NV: 25% by 2025*
☼ AZ: 15% by 2025
☼ NM: 20% by 2020 (IOUs)10% by 2020 (co-ops)
HI: 40% by 2030
☼ Minimum solar or customer-sited requirement
TX: 5,880 MW by 2015
UT: 20% by 2025*
☼ CO: 20% by 2020 (IOUs)10% by 2020 (co-ops & large munis)*
MT: 15% by 2015
ND: 10% by 2015
SD: 10% by 2015
IA: 105 MW
MN: 25% by 2025(Xcel: 30% by 2020)
☼ MO: 15% by 2021
WI: Varies by utility; 10% by 2015 goal
MI: 10% + 1,100 MW by 2015*
☼ OH: 25% by 2025†
ME: 30% by 2000New RE: 10% by 2017
☼ NH: 23.8% by 2025
☼ MA: 15% by 2020+ 1% annual increase(Class I Renewables)
RI: 16% by 2020
CT: 23% by 2020
☼ NY: 24% by 2013
☼ NJ: 22.5% by 2021
☼ PA: 18% by 2020†
☼ MD: 20% by 2022
☼ DE: 20% by 2019*
☼ DC: 20% by 2020
VA: 15% by 2025*
☼ NC: 12.5% by 2021 (IOUs)10% by 2018 (co-ops & munis)
VT: (1) RE meets any increase in retail sales by 2012;
(2) 20% RE & CHP by 2017
29 states & DChave an RPS
6 states have goals
KS: 20% by 2020
☼ OR: 25% by 2025 (large utilities)*5% - 10% by 2025 (smaller utilities)
☼ IL: 25% by 2025WV: 25% by 2025*†
99
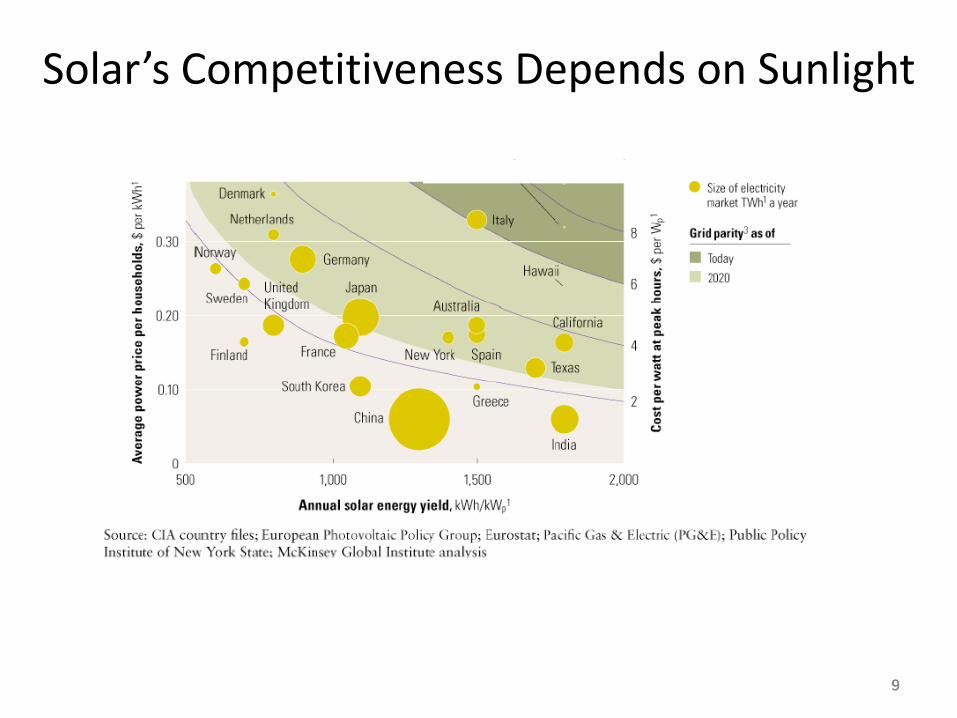
Solar’s Competitiveness Depends on Sunlight
10
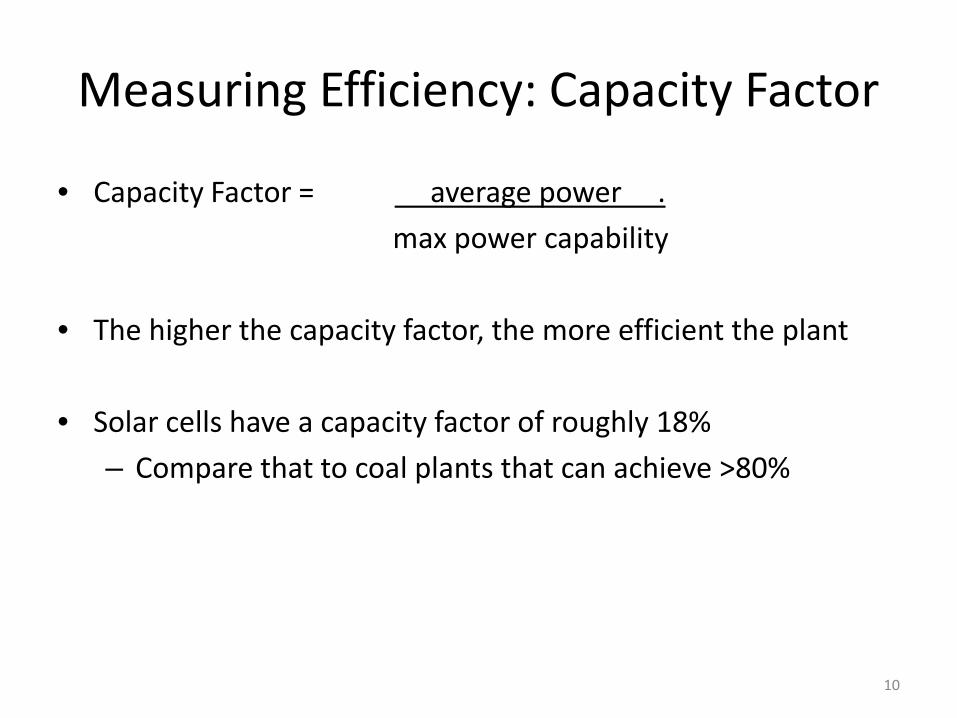
Measuring Efficiency: Capacity Factor
• Capacity Factor = average power .
max power capability
• The higher the capacity factor, the more efficient the plant
• Solar cells have a capacity factor of roughly 18%
– Compare that to coal plants that can achieve >80%
11
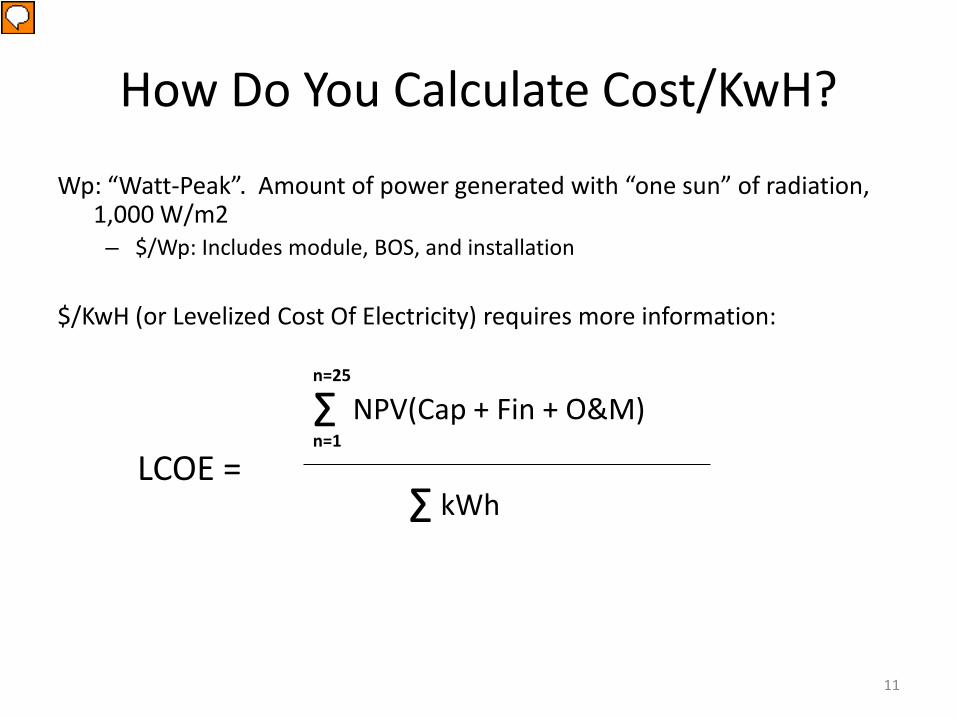
How Do You Calculate Cost/KwH?
Wp: “Watt-Peak”. Amount of power generated with “one sun” of radiation, 1,000 W/m2– $/Wp: Includes module, BOS, and installation
$/KwH (or Levelized Cost Of Electricity) requires more information:
LCOE =
Σ NPV(Cap + Fin + O&M)
kWhΣn=1
n=25
1212
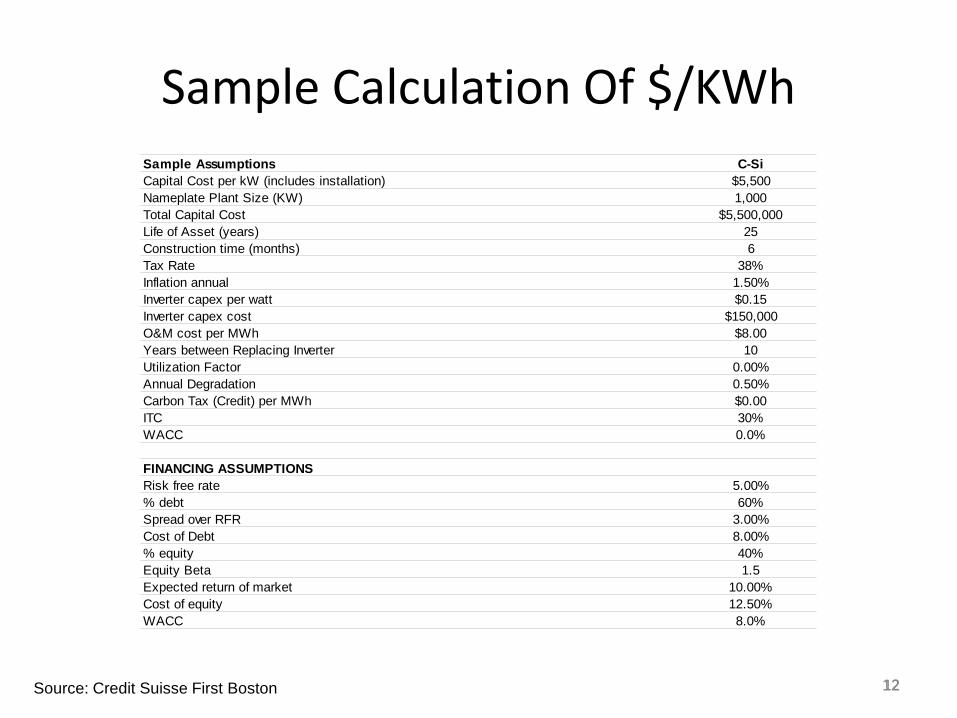
Sample Calculation Of $/KWh
Source: Credit Suisse First Boston
Sample Assumptions C-SiCapital Cost per kW (includes installation) $5,500Nameplate Plant Size (KW) 1,000Total Capital Cost $5,500,000Life of Asset (years) 25Construction time (months) 6Tax Rate 38%Inflation annual 1.50%Inverter capex per watt $0.15Inverter capex cost $150,000O&M cost per MWh $8.00Years between Replacing Inverter 10Utilization Factor 0.00%Annual Degradation 0.50%Carbon Tax (Credit) per MWh $0.00ITC 30%WACC 0.0%
FINANCING ASSUMPTIONSRisk free rate 5.00%% debt 60%Spread over RFR 3.00%Cost of Debt 8.00%% equity 40%Equity Beta 1.5Expected return of market 10.00%Cost of equity 12.50%WACC 8.0%
1313
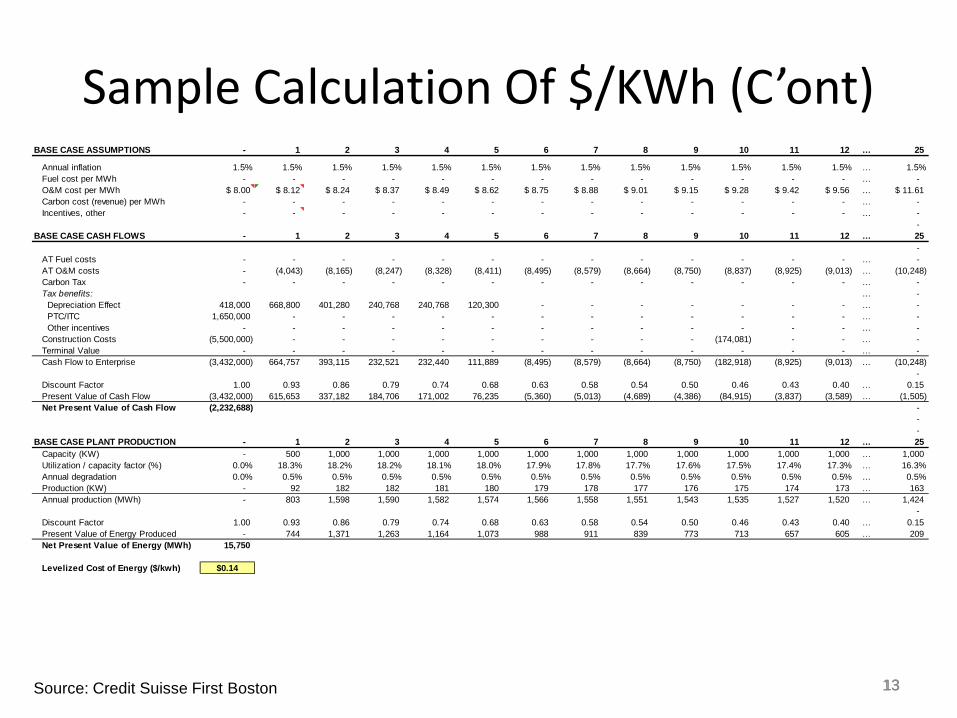
Sample Calculation Of $/KWh (C’ont)
Source: Credit Suisse First Boston
BASE CASE ASSUMPTIONS - 1 2 3 4 5 6 7 8 9 10 11 12 … 25
Annual inflation 1.5% 1.5% 1.5% 1.5% 1.5% 1.5% 1.5% 1.5% 1.5% 1.5% 1.5% 1.5% 1.5% … 1.5% Fuel cost per MWh - - - - - - - - - - - - - … - O&M cost per MWh $ 8.00 $ 8.12 $ 8.24 $ 8.37 $ 8.49 $ 8.62 $ 8.75 $ 8.88 $ 9.01 $ 9.15 $ 9.28 $ 9.42 $ 9.56 … $ 11.61 Carbon cost (revenue) per MWh - - - - - - - - - - - - - … - Incentives, other - - - - - - - - - - - - - … -
- BASE CASE CASH FLOWS - 1 2 3 4 5 6 7 8 9 10 11 12 … 25
- AT Fuel costs - - - - - - - - - - - - - … - AT O&M costs - (4,043) (8,165) (8,247) (8,328) (8,411) (8,495) (8,579) (8,664) (8,750) (8,837) (8,925) (9,013) … (10,248) Carbon Tax - - - - - - - - - - - - - … - Tax benefits: … - Depreciation Effect 418,000 668,800 401,280 240,768 240,768 120,300 - - - - - - - … - PTC/ITC 1,650,000 - - - - - - - - - - - - … - Other incentives - - - - - - - - - - - - - … - Construction Costs (5,500,000) - - - - - - - - - (174,081) - - … - Terminal Value - - - - - - - - - - - - - … - Cash Flow to Enterprise (3,432,000) 664,757 393,115 232,521 232,440 111,889 (8,495) (8,579) (8,664) (8,750) (182,918) (8,925) (9,013) … (10,248)
- Discount Factor 1.00 0.93 0.86 0.79 0.74 0.68 0.63 0.58 0.54 0.50 0.46 0.43 0.40 … 0.15 Present Value of Cash Flow (3,432,000) 615,653 337,182 184,706 171,002 76,235 (5,360) (5,013) (4,689) (4,386) (84,915) (3,837) (3,589) … (1,505) Net Present Value of Cash Flow (2,232,688) -
- -
BASE CASE PLANT PRODUCTION - 1 2 3 4 5 6 7 8 9 10 11 12 … 25 Capacity (KW) - 500 1,000 1,000 1,000 1,000 1,000 1,000 1,000 1,000 1,000 1,000 1,000 … 1,000 Utilization / capacity factor (%) 0.0% 18.3% 18.2% 18.2% 18.1% 18.0% 17.9% 17.8% 17.7% 17.6% 17.5% 17.4% 17.3% … 16.3% Annual degradation 0.0% 0.5% 0.5% 0.5% 0.5% 0.5% 0.5% 0.5% 0.5% 0.5% 0.5% 0.5% 0.5% … 0.5% Production (KW) - 92 182 182 181 180 179 178 177 176 175 174 173 … 163 Annual production (MWh) - 803 1,598 1,590 1,582 1,574 1,566 1,558 1,551 1,543 1,535 1,527 1,520 … 1,424
- Discount Factor 1.00 0.93 0.86 0.79 0.74 0.68 0.63 0.58 0.54 0.50 0.46 0.43 0.40 … 0.15 Present Value of Energy Produced - 744 1,371 1,263 1,164 1,073 988 911 839 773 713 657 605 … 209 Net Present Value of Energy (MWh) 15,750
Levelized Cost of Energy ($/kwh) $0.14
1414
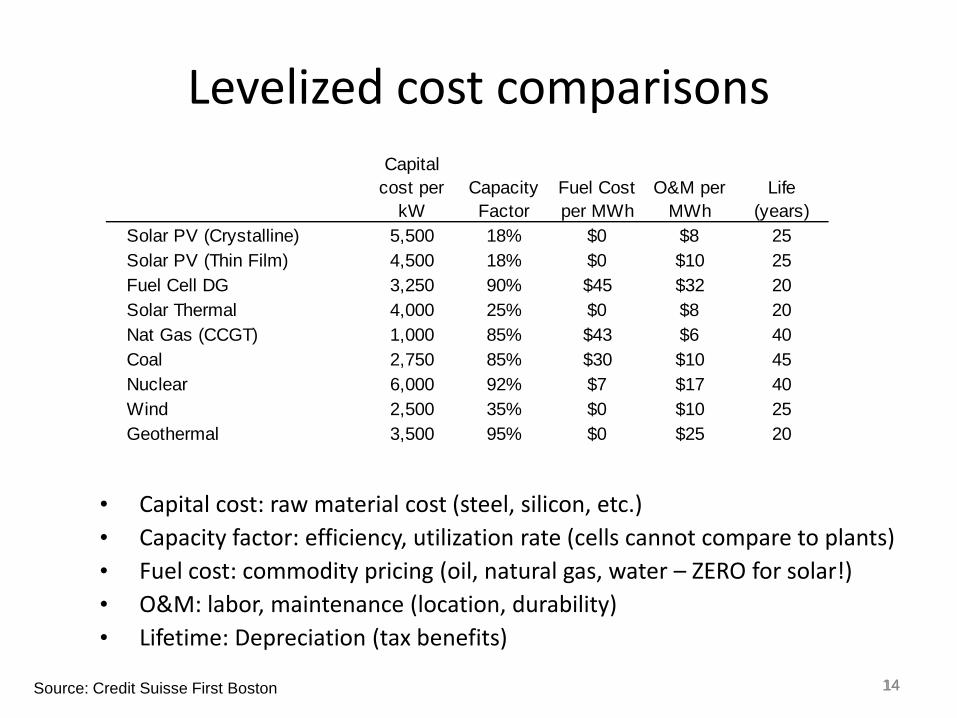
Levelized cost comparisons
• Capital cost: raw material cost (steel, silicon, etc.)• Capacity factor: efficiency, utilization rate (cells cannot compare to plants)• Fuel cost: commodity pricing (oil, natural gas, water – ZERO for solar!)• O&M: labor, maintenance (location, durability)• Lifetime: Depreciation (tax benefits)
Source: Credit Suisse First Boston
Capital cost per
kWCapacity Factor
Fuel Cost per MWh
O&M per MWh
Life (years)
Solar PV (Crystalline) 5,500 18% $0 $8 25Solar PV (Thin Film) 4,500 18% $0 $10 25Fuel Cell DG 3,250 90% $45 $32 20Solar Thermal 4,000 25% $0 $8 20Nat Gas (CCGT) 1,000 85% $43 $6 40Coal 2,750 85% $30 $10 45Nuclear 6,000 92% $7 $17 40Wind 2,500 35% $0 $10 25Geothermal 3,500 95% $0 $25 20
1515
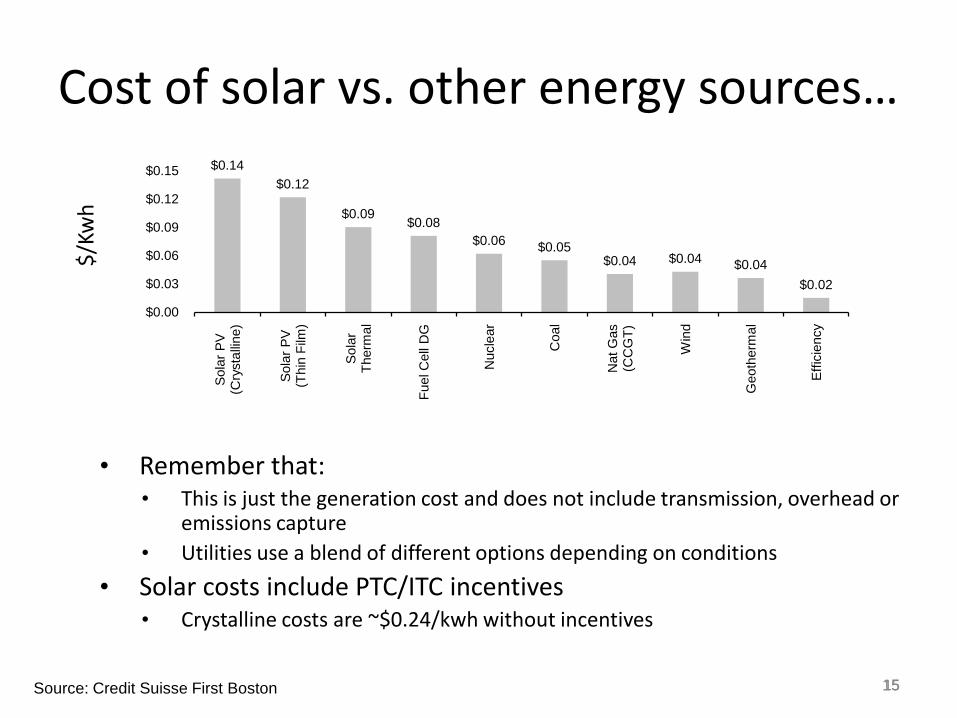
Cost of solar vs. other energy sources…
• Remember that: • This is just the generation cost and does not include transmission, overhead or
emissions capture• Utilities use a blend of different options depending on conditions
• Solar costs include PTC/ITC incentives• Crystalline costs are ~$0.24/kwh without incentives
Source: Credit Suisse First Boston
$/Kw
h
$0.14 $0.12
$0.09 $0.08
$0.06 $0.05 $0.04 $0.04 $0.04
$0.02
$0.00
$0.03
$0.06
$0.09
$0.12
$0.15
Sola
r PV
(Cry
stal
line)
Sola
r PV
(Thi
n Fi
lm)
Sola
r Th
erm
al
Fuel
Cel
l DG
Nuc
lear
Coa
l
Nat
Gas
(C
CG
T)
Win
d
Geo
ther
mal
Effic
ienc
y
1616
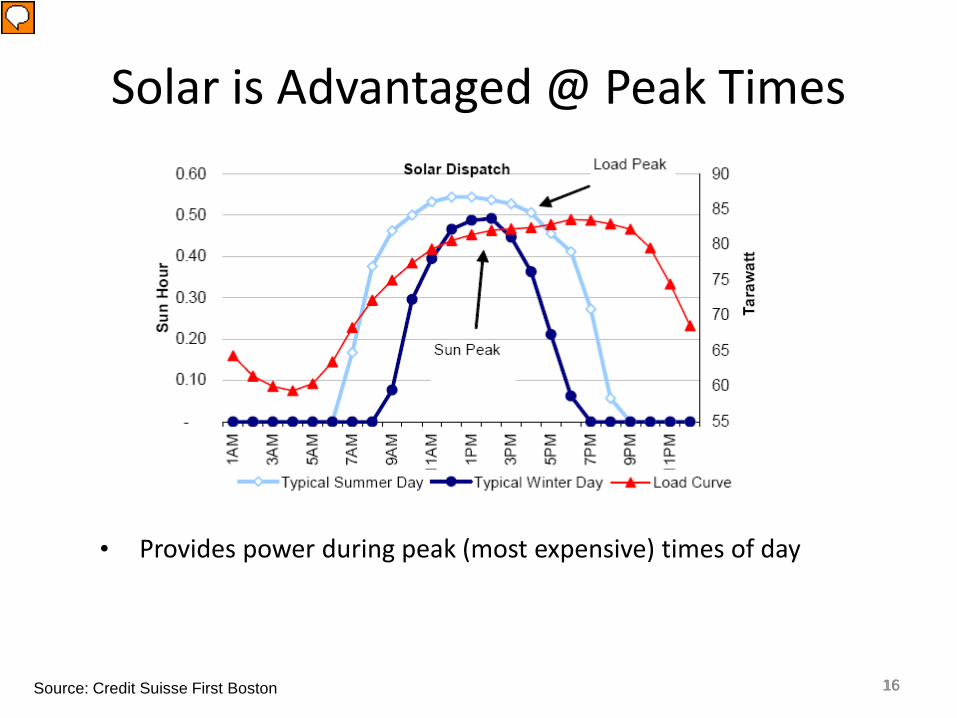
Solar is Advantaged @ Peak Times
• Provides power during peak (most expensive) times of day
Source: Credit Suisse First Boston
1717
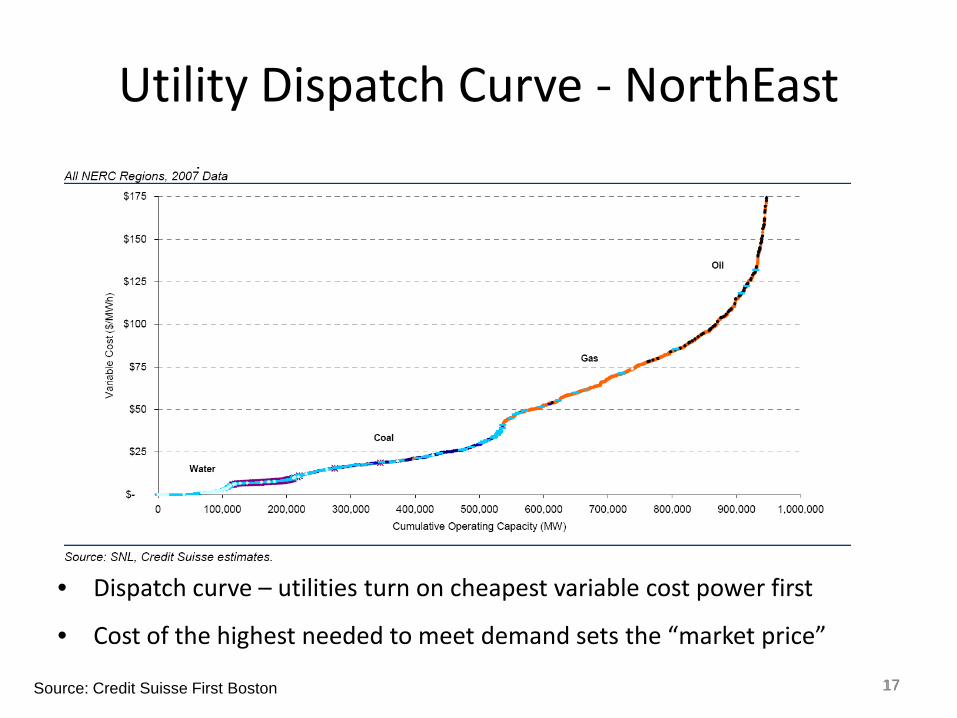
Utility Dispatch Curve - NorthEast
Source: Credit Suisse First Boston
• Dispatch curve – utilities turn on cheapest variable cost power first
• Cost of the highest needed to meet demand sets the “market price”
1818
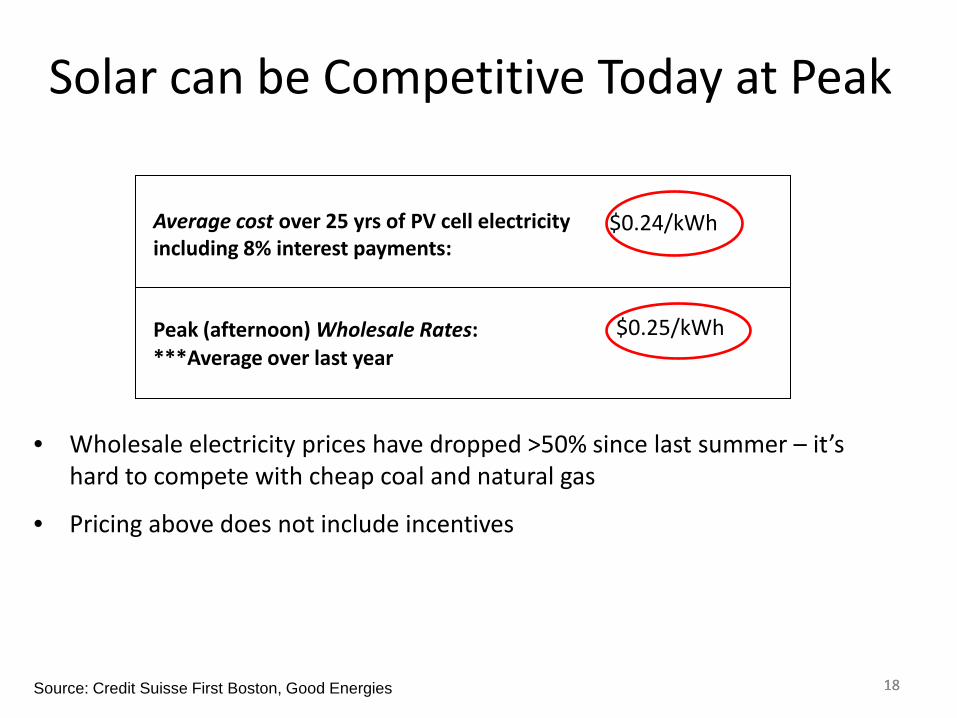
Solar can be Competitive Today at Peak
Average cost over 25 yrs of PV cell electricity including 8% interest payments:
Peak (afternoon) Wholesale Rates:***Average over last year
$0.24/kWh
$0.25/kWh
• Wholesale electricity prices have dropped >50% since last summer – it’s hard to compete with cheap coal and natural gas
• Pricing above does not include incentives
Source: Credit Suisse First Boston, Good Energies
1919
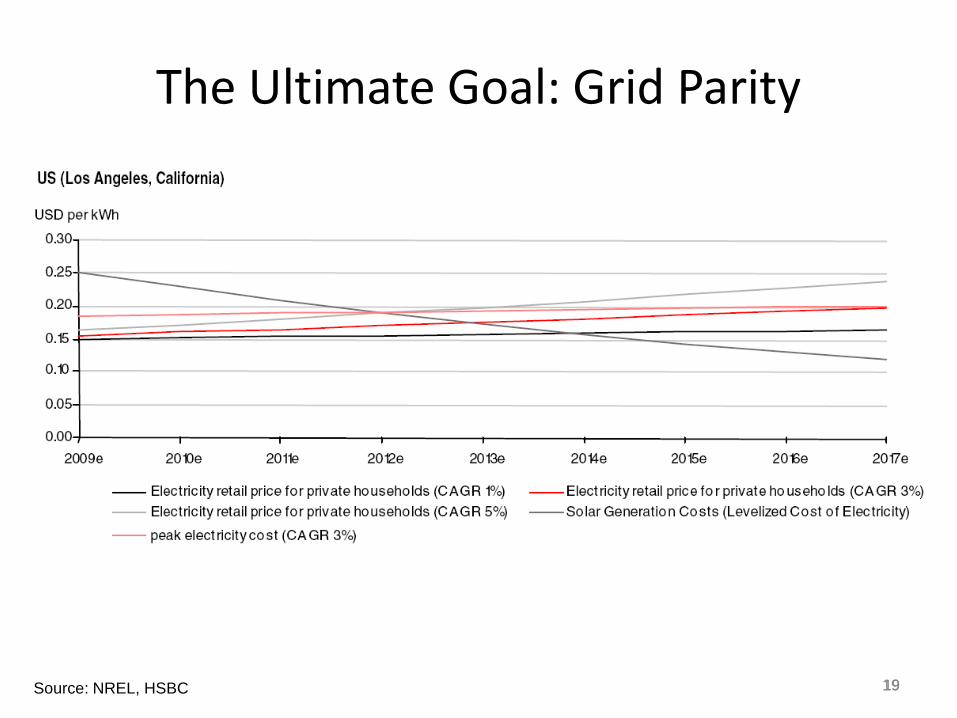
The Ultimate Goal: Grid Parity
Source: NREL, HSBC
2020
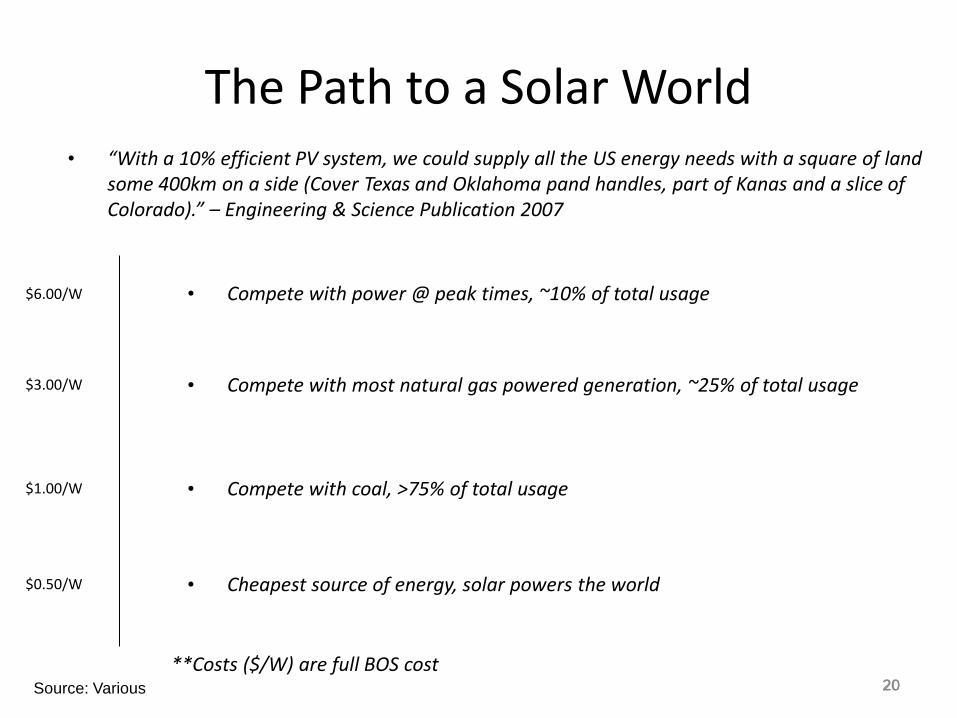
The Path to a Solar World
Source: Various
• “With a 10% efficient PV system, we could supply all the US energy needs with a square of land some 400km on a side (Cover Texas and Oklahoma pand handles, part of Kanas and a slice of Colorado).” – Engineering & Science Publication 2007
$6.00/W
$3.00/W
$1.00/W
$0.50/W
• Compete with power @ peak times, ~10% of total usage
• Compete with most natural gas powered generation, ~25% of total usage
• Compete with coal, >75% of total usage
• Cheapest source of energy, solar powers the world
**Costs ($/W) are full BOS cost

21
$/Wp Ranges From $4-9 Depending On Type Of Installation
Representative Costs, 2008
Source: SAM model, built by DOE and Sandia National Labs. Costs are representative of realistic figures, not average costs from sample installations. Does not include incentives.
Residential Commercial Utility
System size 3.8KW 210KW 10MW
$/Wp, in US $8.98 $6.68 $4.93
¢/kWh - Phoenix, AZ 31.78 22.91 26.09
¢/kWh - Boston, MA 41.89 30.44 36.49
• Costs for 2009 will be even lower, some installations are being done as low as $3 / watt
22
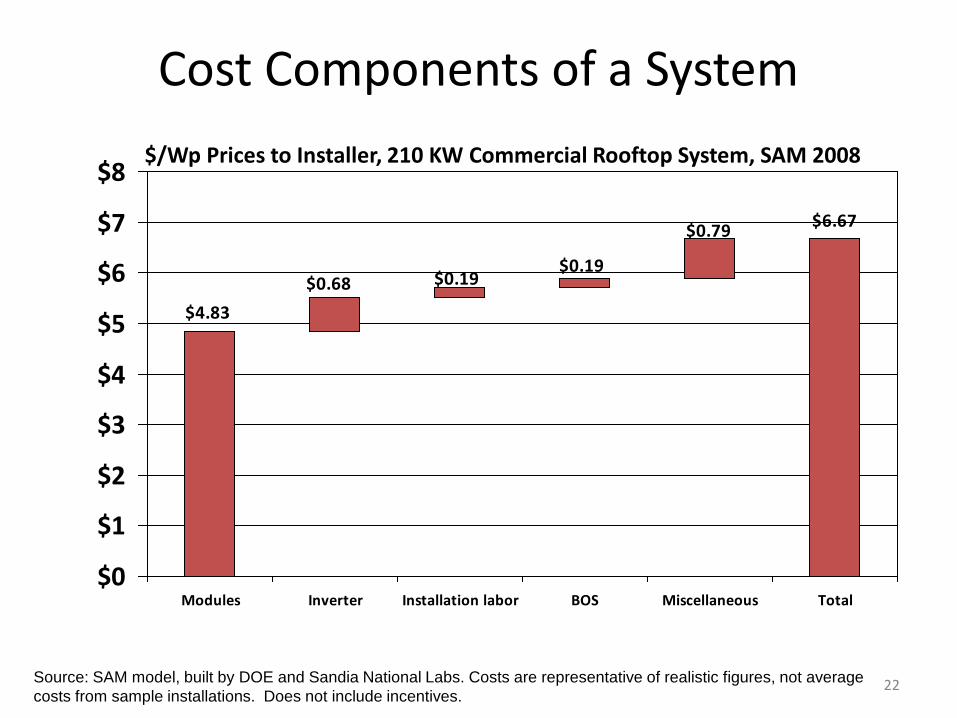
Cost Components of a System
$6.67$0.79
$0.19$0.19$0.68
$4.83
$0
$1
$2
$3
$4
$5
$6
$7
$8
Modules Inverter Installation labor BOS Miscellaneous Total
Source: SAM model, built by DOE and Sandia National Labs. Costs are representative of realistic figures, not average costs from sample installations. Does not include incentives.
$/Wp Prices to Installer, 210 KW Commercial Rooftop System, SAM 2008
2323
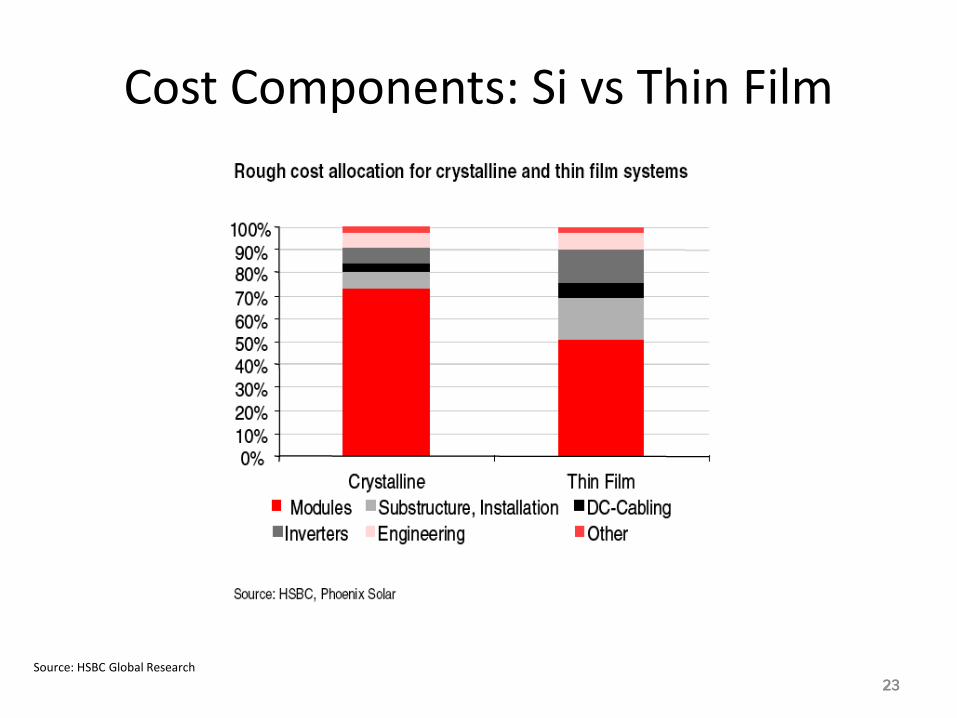
Cost Components: Si vs Thin Film
Source: HSBC Global Research
2424
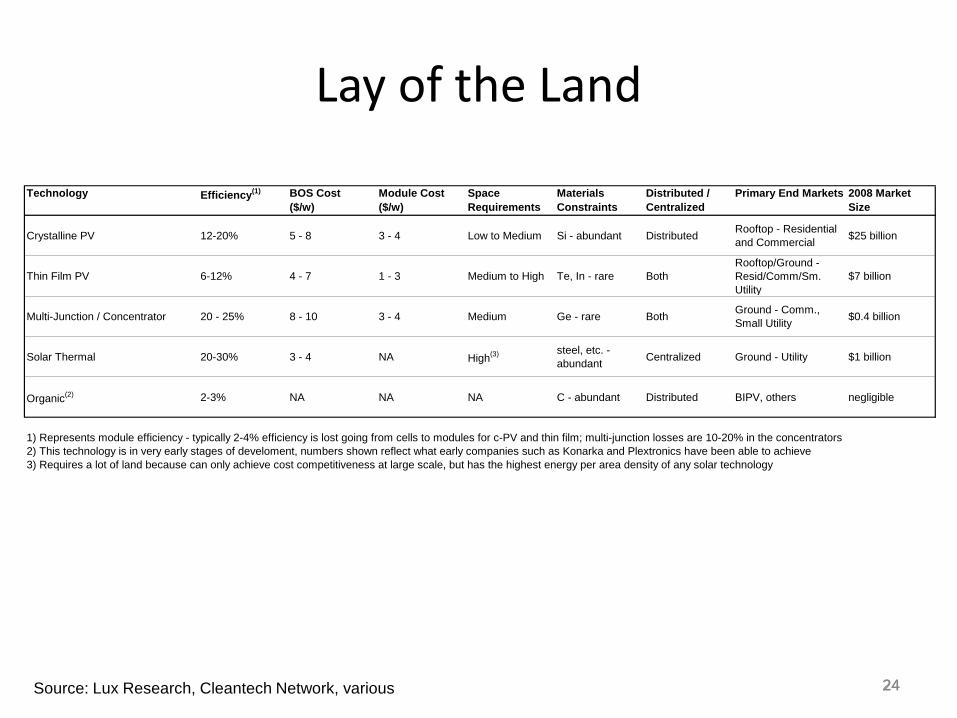
Lay of the Land
Source: Lux Research, Cleantech Network, various
Technology Efficiency(1) BOS Cost ($/w)
Module Cost ($/w)
Space Requirements
Materials Constraints
Distributed / Centralized
Primary End Markets 2008 Market Size
Crystalline PV 12-20% 5 - 8 3 - 4 Low to Medium Si - abundant Distributed Rooftop - Residential and Commercial $25 billion
Thin Film PV 6-12% 4 - 7 1 - 3 Medium to High Te, In - rare BothRooftop/Ground - Resid/Comm/Sm. Utility
$7 billion
Multi-Junction / Concentrator 20 - 25% 8 - 10 3 - 4 Medium Ge - rare Both Ground - Comm., Small Utility $0.4 billion
Solar Thermal 20-30% 3 - 4 NA High(3) steel, etc. - abundant Centralized Ground - Utility $1 billion
Organic(2) 2-3% NA NA NA C - abundant Distributed BIPV, others negligible
1) Represents module efficiency - typically 2-4% efficiency is lost going from cells to modules for c-PV and thin film; multi-junction losses are 10-20% in the concentrators2) This technology is in very early stages of develoment, numbers shown reflect what early companies such as Konarka and Plextronics have been able to achieve3) Requires a lot of land because can only achieve cost competitiveness at large scale, but has the highest energy per area density of any solar technology
2525
What We Need to Do…
• Drive down costs• Increase efficiency
• Reduce materials usage / use cheaper, abundant materials
• Scale and standardization
• Smarter design and automation
• Vertical and horizontal integration
• Increase adoption• Access to financing
• Creative business models
• Policies, ie price on carbon, RPS, etc.
Source: Various
2626
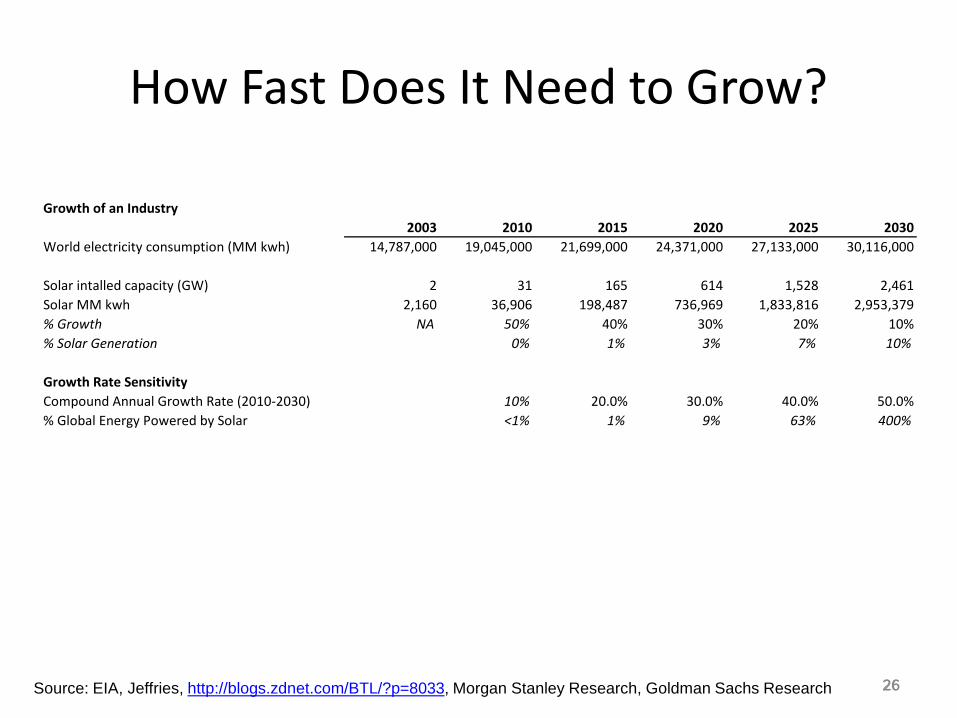
How Fast Does It Need to Grow?
Source: EIA, Jeffries, http://blogs.zdnet.com/BTL/?p=8033, Morgan Stanley Research, Goldman Sachs Research
Growth of an Industry2003 2010 2015 2020 2025 2030
World electricity consumption (MM kwh) 14,787,000 19,045,000 21,699,000 24,371,000 27,133,000 30,116,000
Solar intalled capacity (GW) 2 31 165 614 1,528 2,461Solar MM kwh 2,160 36,906 198,487 736,969 1,833,816 2,953,379% Growth NA 50% 40% 30% 20% 10%% Solar Generation 0% 1% 3% 7% 10%
Growth Rate SensitivityCompound Annual Growth Rate (2010-2030) 10% 20.0% 30.0% 40.0% 50.0%% Global Energy Powered by Solar <1% 1% 9% 63% 400%
2727
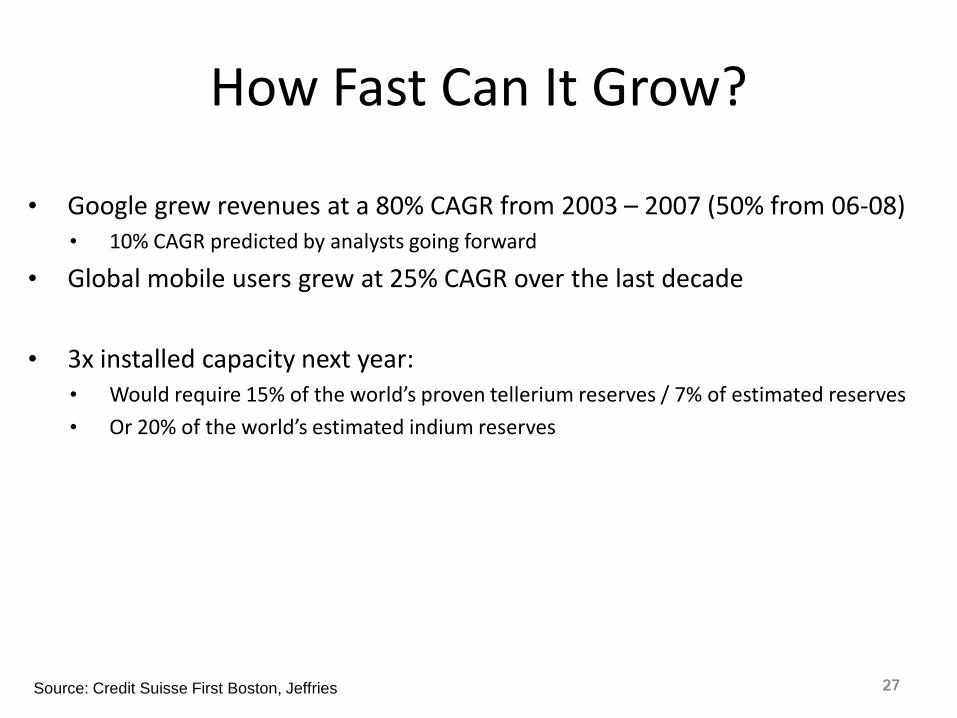
How Fast Can It Grow?
• Google grew revenues at a 80% CAGR from 2003 – 2007 (50% from 06-08)• 10% CAGR predicted by analysts going forward
• Global mobile users grew at 25% CAGR over the last decade
• 3x installed capacity next year: • Would require 15% of the world’s proven tellerium reserves / 7% of estimated reserves
• Or 20% of the world’s estimated indium reserves
Source: Credit Suisse First Boston, Jeffries
2828
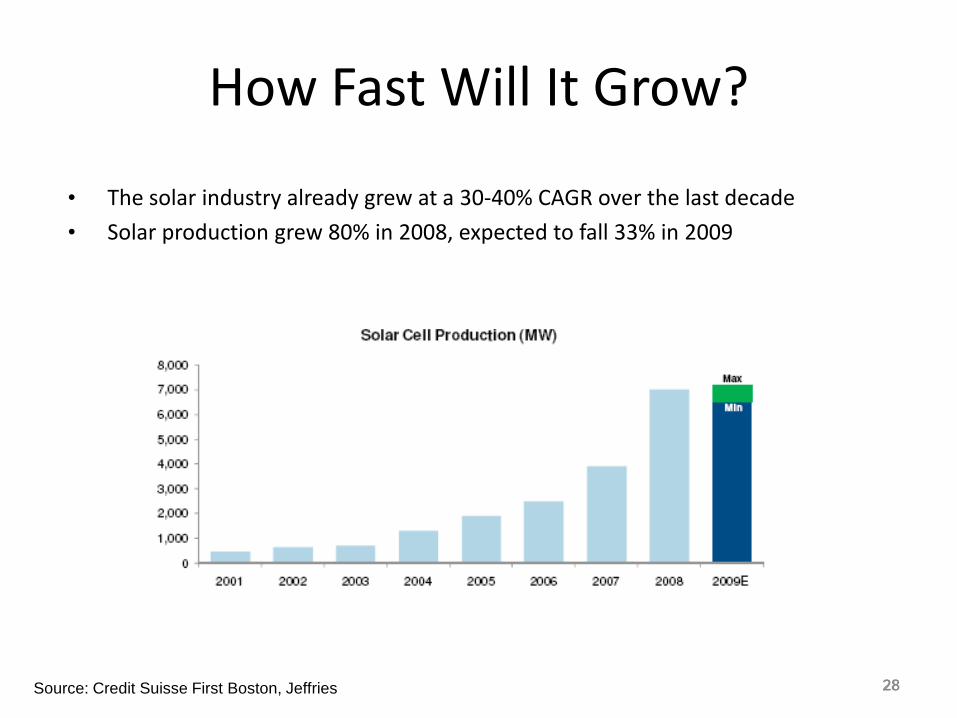
How Fast Will It Grow?
Source: Credit Suisse First Boston, Jeffries
• The solar industry already grew at a 30-40% CAGR over the last decade
• Solar production grew 80% in 2008, expected to fall 33% in 2009

2929
Current State of Solar Industry
Source: Jeffries Clean Tech Primer 2009
3030
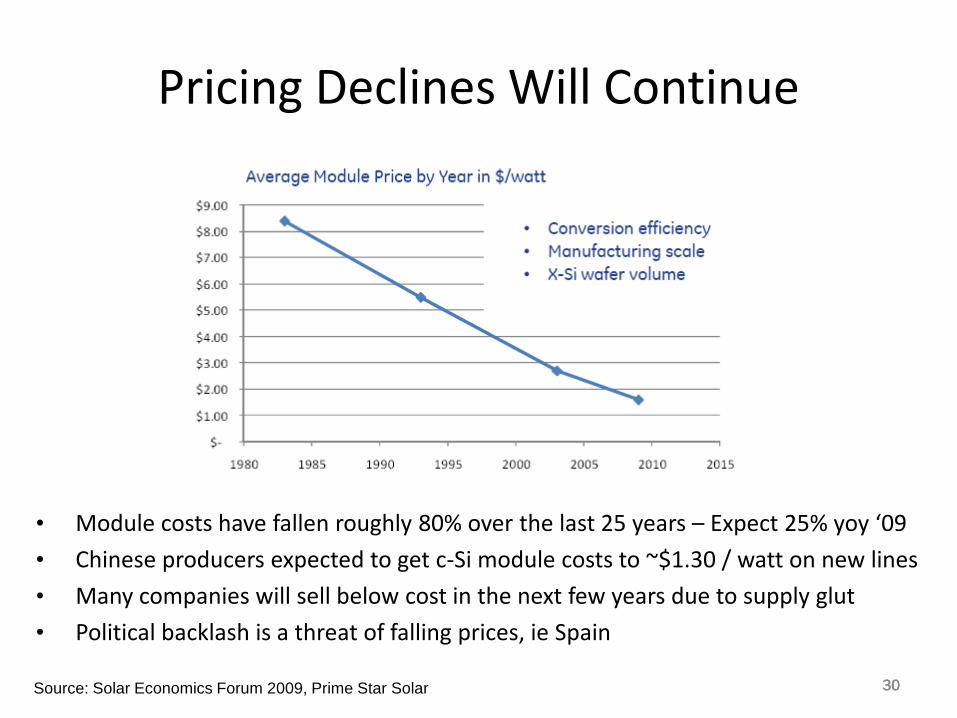
Pricing Declines Will Continue
Source: Solar Economics Forum 2009, Prime Star Solar
• Module costs have fallen roughly 80% over the last 25 years – Expect 25% yoy ‘09
• Chinese producers expected to get c-Si module costs to ~$1.30 / watt on new lines
• Many companies will sell below cost in the next few years due to supply glut
• Political backlash is a threat of falling prices, ie Spain
3131
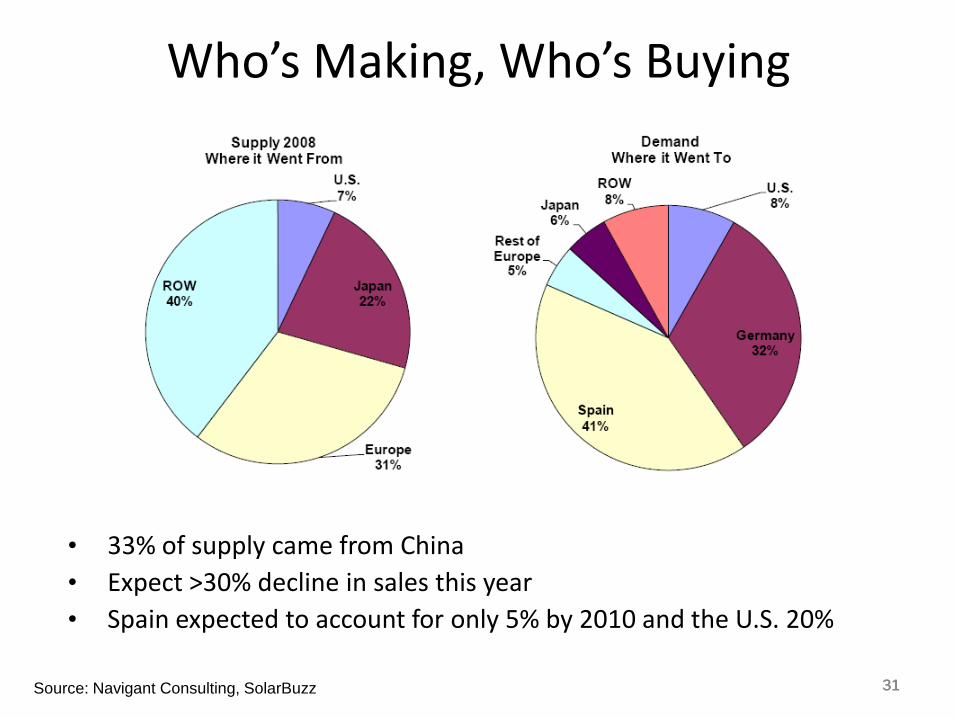
Who’s Making, Who’s Buying
Source: Navigant Consulting, SolarBuzz
• 33% of supply came from China• Expect >30% decline in sales this year• Spain expected to account for only 5% by 2010 and the U.S. 20%
3232
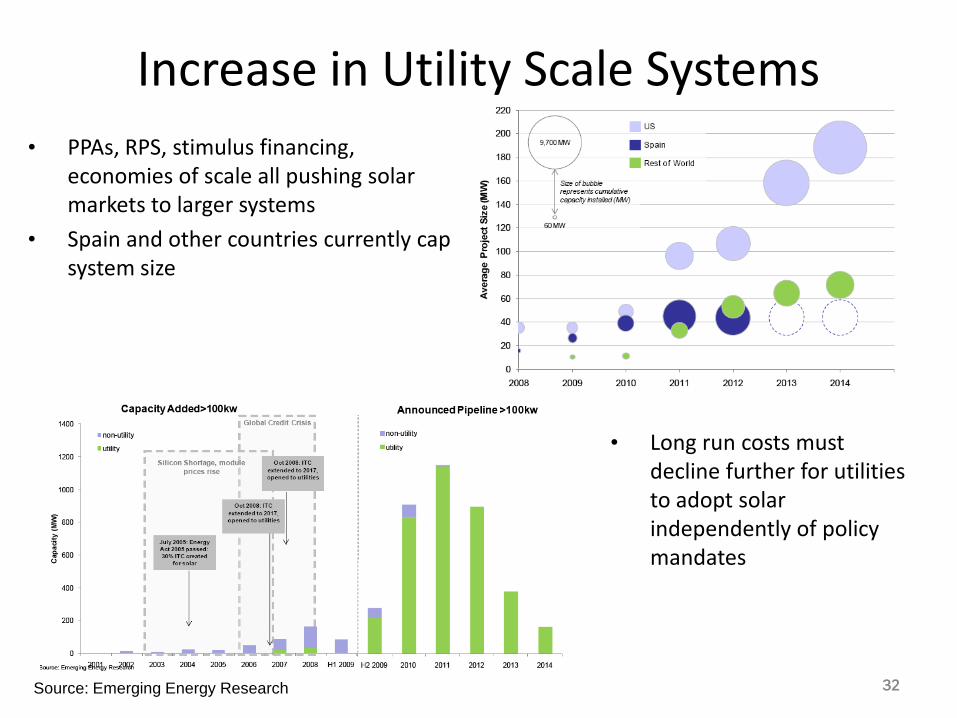
Increase in Utility Scale Systems
Source: Emerging Energy Research
• PPAs, RPS, stimulus financing, economies of scale all pushing solar markets to larger systems
• Spain and other countries currently cap system size
• Long run costs must decline further for utilities to adopt solar independently of policy mandates
3333
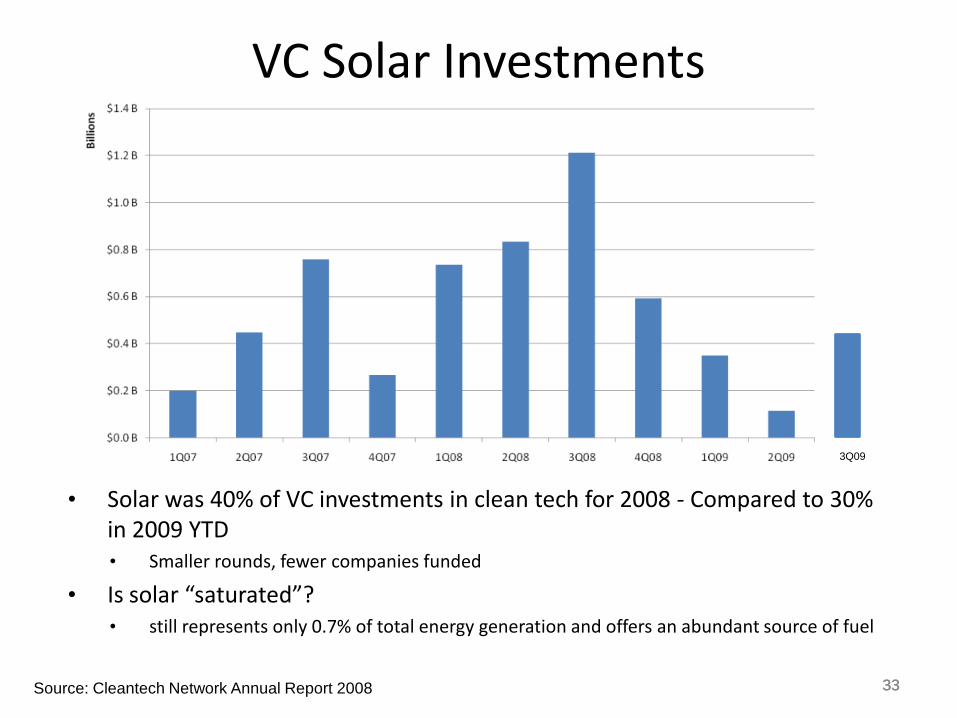
VC Solar Investments
• Solar was 40% of VC investments in clean tech for 2008 - Compared to 30% in 2009 YTD• Smaller rounds, fewer companies funded
• Is solar “saturated”? • still represents only 0.7% of total energy generation and offers an abundant source of fuel
Source: Cleantech Network Annual Report 2008
3Q09
3434
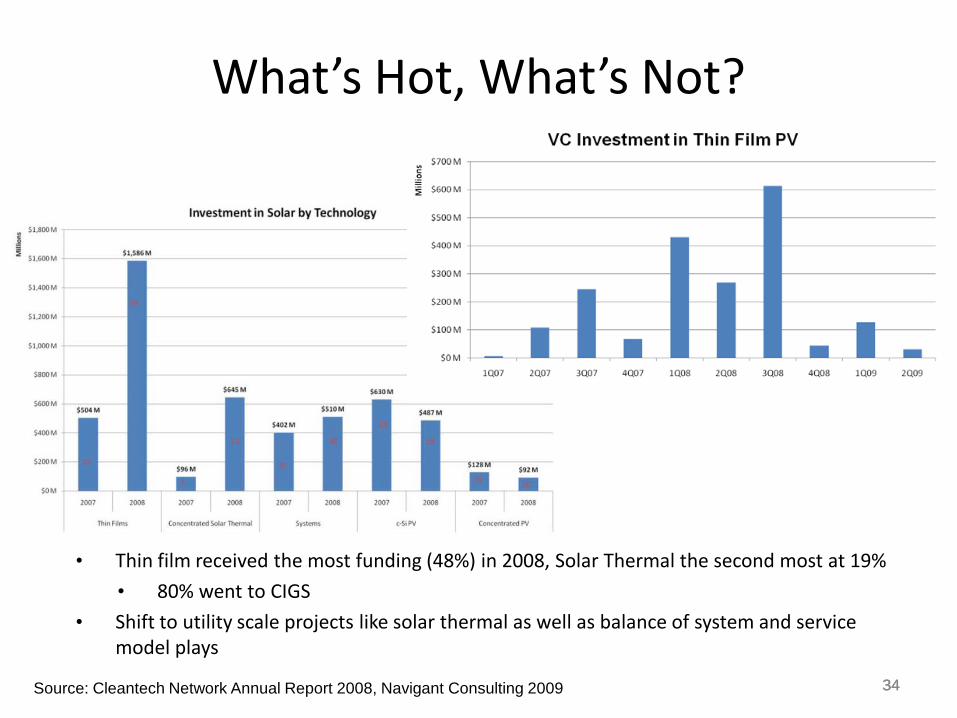
What’s Hot, What’s Not?
• Thin film received the most funding (48%) in 2008, Solar Thermal the second most at 19%
• 80% went to CIGS
• Shift to utility scale projects like solar thermal as well as balance of system and service model plays
Source: Cleantech Network Annual Report 2008, Navigant Consulting 2009
3535
What and Who to Watch• The big players
• First Solar, Sunpower, Suntech, etc.
• Low cost or high quality that will enable them to capture margins
• Emerging technologies• Thin film, solar thermal
• Chinese manufacturing• Access to low cost financing will drive capacity building
• Industry consolidation• First Solar acquired OptiSolar
• MEMC acquiring SunEdison
• Materials access• Tellerium and Indium could be constrained
• Creative business models and financing• SolarCity
• Smart grid integrated plays
• Global policies and incentives• Many European countries are capping subsidies by industry size
• Impact of stimulus funding in the U.S.
3636
“ The way we use energy strengthens our adversaries and threatens our planet” – President Obama 1/20/09