Embed Size (px)
Citation preview
Yutaka Harada
Member of the Policy Board
Economic Activity, Prices,
and Monetary Policy in Japan
Speech at a Meeting with Business Leaders in Ishikawa
Bank of Japan
J u l y 4 , 2 0 1 8
(English translation based on the Japanese original)
1
Introduction
Thank you for giving me this opportunity to exchange views with you and for having taken
the time to be here despite your busy schedules. It is indeed a great honor to be here today.
Please allow me to express my gratitude for your great cooperation with the business
operations of the Bank of Japan, particularly of the Kanazawa Branch.
The Bank introduced quantitative and qualitative monetary easing -- or QQE for short -- in
April 2013 with the aim of achieving the inflation target of 2 percent, and since then, has
strengthened the QQE framework.
As a result of the Bank's efforts, most economic indicators -- such as those of production,
employment, investment, exports, and fiscal conditions -- have improved.
Today, I would like to provide my views on the achievements thus far of the Bank's
monetary policy measures as well as on some critical opinions regarding QQE, and then
explain recent economic and financial developments as well as the path toward achieving
the price stability target of 2 percent.
I. The Achievements of Five Years of the Bank's Monetary Easing Policy
April 2018 marked five full years since the Bank introduced bold monetary easing with its
policy of QQE. For this reason, monetary policy over the past five years has been the
subject of a large number of articles in newspapers and magazines assessing QQE from a
variety of perspectives.1 Many of the assessments pointed out that the 2 percent price
stability target had not been achieved and argued that the dangers associated with monetary
easing had not been addressed.
However, as I have highlighted repeatedly, monetary easing has led to a continued
improvement in employment, to an increase in both real GDP growth and nominal GDP
growth, and to a rise in the year-on-year inflation rate from negative into positive territory
1 For example, such assessments were found in Fujita Tomoya, "Daikibo kanwa gonen, fukuramu
'fukusayō'," the Asahi Shimbun, April 4, 2018; and the 3-day series, Sakai Takayuki et al., "Shiren
no saishidō," The Mainichi, February 17, 18, and 20, 2018 and the series focusing on monetary
policy under the same title on April 10, 11, and 12, 2018.
2
although the rate has not yet reached 2 percent. In my speech today, I would like to focus on
how monetary easing has lifted productivity and, in a broader sense, has brought out
people's potential in Japan.
Improvement in Productivity
Since the bold monetary easing policy was launched, productivity has been improving. This
seems to conflict with standard textbook economic theory, which suggests that while
monetary policy can influence real variables such as real GDP, production, and employment
in the short run, in the long run it can only affect nominal variables such as nominal GDP,
prices, and the exchange rate.2
So, why did Japan's productivity rise as a result of monetary policy even though this seems
to run counter to economic theory? The reason generally given is that what economic theory
actually focuses on is differences in productivity levels arising due to differences in
productivity growth rates over the super long term. Looking at real purchasing power parity
GDP per capita, which provides a broad indicator of differences in productivity across
countries, the level between the poorest and richest countries may differ by a factor of more
than 100. Of course, such a gap is not due to differences in monetary policy. Returning to
the situation in Japan, however, if monetary policy had been well implemented, productivity
might have grown, over a period of a decade or more, at 2 percent rather than 1 percent.
Therefore, I would say one reason, first of all, is that in the short run capacity utilization
rises. In times of recession, orders fall and factories will decrease output. However, since
labor cannot simply be laid off, labor productivity will decline. The opposite occurs during
an economic expansion.
2 For details, see Nicholas G. Mankiw, Mankyū keizaigaku II makuro-hen, 3rd ed., trans. Adachi
Hideyuki, Ishikawa Jota, Ogawa Eiji, Jinushi Toshiki, Chuma Hiroyuki, and Yanagawa Takashi
(Tokyo: Toyo Keizai Inc., 2014), 374, 397. Originally published as Principles of Economics, 6th ed.
(Mason, Ohio: South-Western Cengage Learning, 2012), 650, 665. According to Mankiw, in the
long run, changes in the amount of money have important effects on nominal variables such as price
levels, but only negligible effects on real variables such as real GDP. He adds that, although
monetary policy is neutral in the long run (i.e. it does not have an effect on real variables), it has
profound effects on real variables in the short run.
3
Another reason is a reduction in low-productivity work in an economic environment where
monetary policy is producing its intended effects. In times of recession, sales fall, and stores
will try to increase demand, even if only a little, by extending their business hours. The
opposite occurs during an economic upturn. If there are labor shortages, restaurants that
used to stay open until midnight, for example, will start to close early. If they open only
during the busiest times during the day and in the evening, labor productivity will increase.
Furthermore, over the long term, there is the issue of hysteresis effects.3 In a recession,
firms reduce their investment, including that in employment and research and development
(R&D). The unemployed do not have the chance to accumulate work experience. For
example, many young people of the generation that entered the labor market during the
so-called "employment ice age" were unable to gain work experience. When the economy is
in recession, firms also reduce investment in training and human resource development. The
reduction of investment, especially in R&D, results in a decline in productivity for a
prolonged period. Reversing these developments takes quite a while. In fact, it may be
difficult to ever make up lost ground. Young people who were caught up in the
"employment ice age" and lost out in on-the-job training opportunities, especially from the
mid-1990s to the mid-2000s and following the global financial crisis in 2008, may struggle
to make up ground. Moreover, many of these people receiving low incomes have been
unable to pay sufficient taxes and social security contributions, possibly contributing to a
deterioration in fiscal conditions both at present and in the future. This impact is long
lasting. While it is difficult to estimate exactly how large the impact is, it is certain to be
considerable, judging by the increase in the share of non-regular employment during this
period and the wage difference between regular and non-regular employees. All of this
means that as the economy expands due to monetary easing policy, the negative hysteresis
effects of the past should be mitigated and productivity should rise.
3 Nakano Akihiro and Kato Ryo, "'Chōki teitai' ron o meguru saikin no giron: 'Rireki kōka' o
chūshin ni," Bank of Japan Review, no. 17-J-2, March 2017, https://www.boj.or.jp/research
/wps_rev/rev_2017/data/rev17j02.pdf.
4
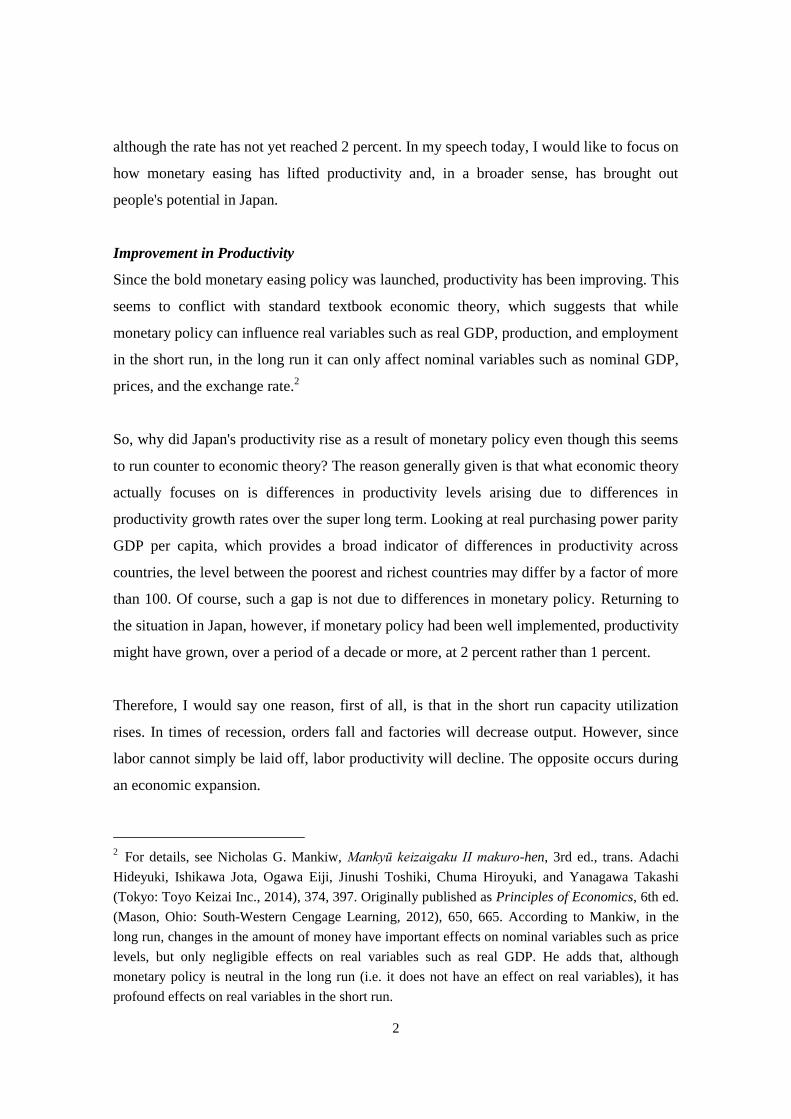
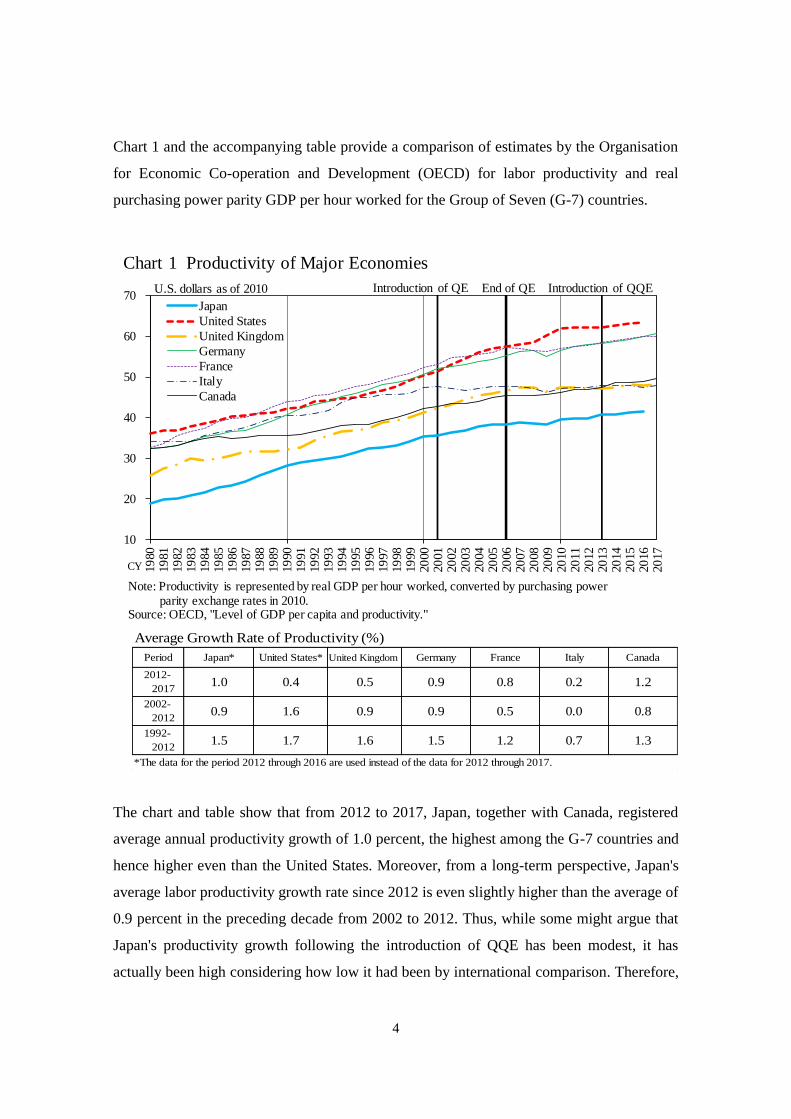
Chart 1 and the accompanying table provide a comparison of estimates by the Organisation
for Economic Co-operation and Development (OECD) for labor productivity and real
purchasing power parity GDP per hour worked for the Group of Seven (G-7) countries.
The chart and table show that from 2012 to 2017, Japan, together with Canada, registered
average annual productivity growth of 1.0 percent, the highest among the G-7 countries and
hence higher even than the United States. Moreover, from a long-term perspective, Japan's
average labor productivity growth rate since 2012 is even slightly higher than the average of
0.9 percent in the preceding decade from 2002 to 2012. Thus, while some might argue that
Japan's productivity growth following the introduction of QQE has been modest, it has
actually been high considering how low it had been by international comparison. Therefore,
10
20
30
40
50
60
70
19
80
19
81
19
82
19
83
19
84
19
85
19
86
19
87
19
88
19
89
19
90
19
91
19
92
19
93
19
94
19
95
19
96
19
97
19
98
19
99
20
00
20
01
20
02
20
03
20
04
20
05
20
06
20
07
20
08
20
09
20
10
20
11
20
12
20
13
20
14
20
15
20
16
20
17
Japan
United States
United Kingdom
Germany
France
Italy
Canada
U.S. dollars as of 2010
Note: Productivity is represented by real GDP per hour worked, converted by purchasing powerparity exchange rates in 2010.
Source: OECD, "Level of GDP per capita and productivity."
Introduction of QE End of QE Introduction of QQE
CY
Chart 1 Productivity of Major Economies
Average Growth Rate of Productivity (%)
Period Japan* United States* United Kingdom Germany France Italy Canada
*The data for the period 2012 through 2016 are used instead of the data for 2012 through 2017.
1992-
20121.5 1.7 1.6 1.5 1.2 0.7 1.3
2012-
20171.0 0.4 0.5 0.9 0.8 0.2 1.2
2002-
20120.9 1.6 0.9 0.9 0.5 0.0 0.8
5
while Japan also faced the global financial crisis in 2008, which pushed down its
productivity growth, I think it would be fair to say that productivity growth in Japan has
been relatively high by international comparison.
However, using labor productivity for comparison may be misleading. The reason is that
firms tend to hire the most productive people first. Therefore, one would expect countries
with a high unemployment rate to enjoy higher productivity, and this pattern tends to be
borne out in practice. Productivity in both Italy and France is higher than in Japan, but the
unemployment rate in those two countries is 11.3 percent and 9.4 percent, respectively.4
However, when the unemployment rate is high, there are people who cannot work although
they want to, which is unfortunate. Obviously, a better situation is one where the
unemployment rate is low and all the people who want to work can work. Therefore, I
thought it would be useful to look at real purchasing power parity GDP per working-age
person. This should reduce the distortion introduced by focusing on labor productivity,
since this indicator is higher when those who want to work do work, and lower when they
do not work.
In this context, it is worth quoting Dr. Osamu Shimomura, who was the brains behind the
period of high economic growth achieved under Prime Minister Hayato Ikeda. In 1968,
exactly 50 years ago, he said: "Why are we making such effort and putting up with such
hardship to pursue economic growth? More than anything, we want to derive satisfaction
from life and work. And isn't the greatest satisfaction in life being able to fully demonstrate
one's abilities? We should pursue a society that provides such opportunities to all citizens. If
we compare society today and society a hundred years ago, isn't the fundamental difference
that, today, finally, a large number of citizens are gradually being provided with the
opportunity to take advantage of their talents in one way or another?"5 I am not saying that
simply raising the employment rate is the same as the ideals expressed by Dr. Shimomura.
4 The figures are for 2017 and are taken from the World Economic Outlook Database April 2018,
available on the website of the International Monetary Fund (IMF): https://www.imf.org/external
/pubs/ft/weo/2018/01/weodata/index.aspx. 5 Kamikubo Satoshi, Hyōden, Nihon no keizai shisō, Shimomura Osamu, 'Nihon keizaigaku' no
jissensha (Tokyo: Nihon Keizai Hyouronsha Ltd., 2008), 227.
6
However, I believe that providing people with the opportunity to work is the starting point
for people to be able to fully demonstrate their abilities.
This can also be said, for example, with regard to women's entry into the labor market.
According to statistics released by the OECD, the labor force participation rate of women
aged between 25 and 54 in Japan was 75.3 percent in 2017; this figure is higher than that for
the United States -- which is 72.1 percent -- and the average of the G-7 countries -- which is
73.5 percent, with France at 75.2 percent, Germany at 80.0 percent, and the United
Kingdom at 78.1 percent.
Currently, the issue surrounding working women in Japan is not the labor force
participation rate itself, but the scarcity of opportunities for women to develop their career
at work, given that many women work as part-timers or non-regular employees. However,
without entry into the labor market in the first place, women cannot create career plans. I
believe that, as the number of working women increases, more women will become regular
employees, enabling them to develop their career; in fact, in 2016, the ratio of women in
managerial positions in establishments with 30 employees or more in Japan increased,
according to the fiscal 2016 Basic Survey of Gender Equality in Employment Management
(available only in Japanese) released on July 28, 2017 by the Ministry of Health, Labour
and Welfare.
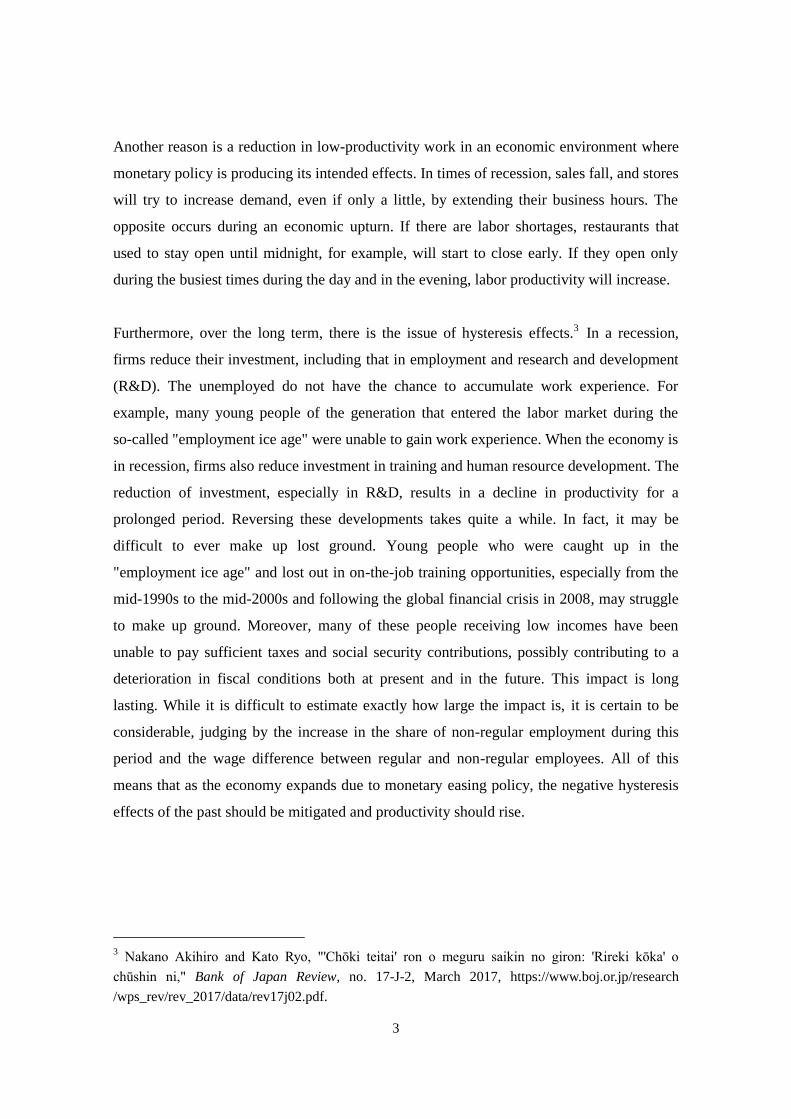
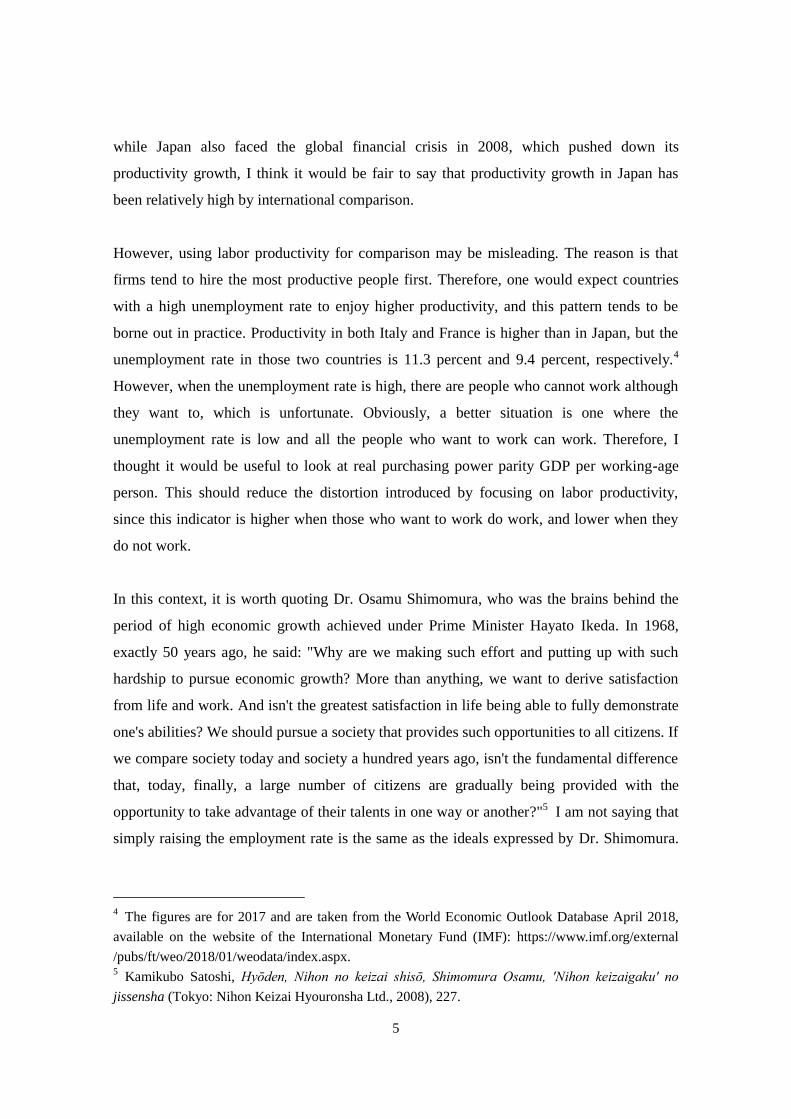
Chart 2 shows real purchasing power parity GDP per working-age person. As can be seen in
the chart and the accompanying table, since the introduction of QQE, Japan's growth rate
has been the highest among the G-7 countries, and has also been notably higher than during
the preceding decade from 2002 to 2012. This means that those who want to work are
increasingly able to work.
7
Of course, there are people who say this level of productivity growth in Japan is not ideal
and that productivity should be raised further by pushing ahead with the growth strategy
and structural reforms. However, people saying this do not seem to clearly explain what
kind of policy measures will produce how much productivity growth. To avoid any
misunderstandings, let me state that I strongly agree with structural reforms. All I am saying
is that it is good to conduct both monetary easing policy and structural reforms.
In addition to productivity, improvements can also be seen in many other indicators such as
production, employment, the unemployment rate, investment, exports, and the fiscal
30,000
40,000
50,000
60,000
70,000
80,000
90,000
19
80
19
81
19
82
19
83
19
84
19
85
19
86
19
87
19
88
19
89
19
90
19
91
19
92
19
93
19
94
19
95
19
96
19
97
19
98
19
99
20
00
20
01
20
02
20
03
20
04
20
05
20
06
20
07
20
08
20
09
20
10
20
11
20
12
20
13
20
14
20
15
20
16
20
17
Japan
United States
United Kingdom
Germany
France
Italy
Canada
International dollars as of 2011 Introduction of QE End of QE Introduction of QQE
Note: Annual figures for working-age person are obtained by linear interpolation of data for every fiveyears. Figures for Germany through 1990 are those for West Germany. Real GDP is converted bypurchasing power parity (international dollars as of 2011).
Sources: IMF, "World Economic Outlook Database"; United Nations, "World Population Prospects: 2017 Revision."
CY
Chart 2 Real PPP GDP per Working-Age Person of Major Economies
Average Growth Rate of the Real PPP GDP per Working-Age Person (%)
Period Japan United States United Kingdom Germany France Italy Canada
1992-
20121.2 1.5 1.6 1.4 1.3 0.8 1.5
2012-
20172.3 1.7 2.1 1.6 1.2 0.9 1.7
2002-
20121.4 0.8 0.6 1.4 0.8 -0.1 0.8
8
situation; moreover, perceptions that the economy is recovering, the income distribution,
and women's entry into the labor market provide further indications of improvement.6
II. Some Counterarguments to Critical Opinions on the Bank's Monetary Policy
As mentioned above, monetary policy has been clearly having an effect, but for some
reason, objections to the Bank's current policy persist.
Among the critics are some who argue that QQE is like the Battle of Imphal during the
Second World War and we should withdraw immediately.7 The Battle of Imphal took place
from March 1944 to early July and involved the Japanese army advancing from Burma with
the aim of capturing the city of Imphal in northeast India. The battle was an abject failure
entailing enormous sacrifice and is often cited as synonymous with a reckless strategy.
There was no food along the way, resulting in many deaths from starvation, there were
attacks by enemy fighter aircraft, and many soldiers contracted malaria, so that of the
100,000 Japanese troops, 30,000 died in battle, while 20,000 were sent back due to injury or
disease. Of the remaining 50,000 troops, more than half fell ill, and the Japanese army
suffered a devastating defeat.8 In contrast with such disastrous consequences, QQE is
clearly having a positive impact, with most economic indicators improving. Therefore, I
think this analogy between QQE and the Japanese army's Battle of Imphal is simply
inaccurate.
What is Dialogue with the Market?
In this context, it is often said that dialogue with the market is important for the conduct of
monetary policy. We must also engage with people who are critical of QQE. I suppose
dialogue normally helps to seek out the truth or discover what the vital interests of the other
6 Regarding improvements in these indicators, also see Yutaka Harada, "Economic Activity, Prices,
and Monetary Policy in Japan: Speech at a Meeting with Business Leaders in Fukushima," Bank of
Japan, November 2017. 7 See, for example, Kato Izuru, "Sensō makki to kasanaru Nichigin tettei kōsen, Kuroda sōsai ga
nerau wa 'ichigeki kōwa' ka," Diamond online, March 4, 2016, https://diamond.jp/articles/-/87079.
Kumano Hideo, "Deguchi no meiro, kin'yū seisaku o tou 6, Inpāru sakusen kara hayaku tettai o,"
Shūkan Ekonomisuto, November 14, 2017, https://www.weekly-economist.com/20171114bojexit6. 8
Tobe Ryoichi et al., Shippai no honshitsu, Nihongun no soshikiron-teki kenkyū (Tokyo:
Chuokoron-shinsha, 1991), 141-177.
9
party are and to what extent one is able to make compromises oneself. However, dialogue
with the market is different from regular dialogue.
There is no such thing as an abstract market; rather, the market consists of a collection of
different stakeholders, who, moreover, do not necessarily seek the truth. In addition,
because the market comprises a variety of stakeholders with different interests, it would be
misleading to say that something is or is not in the interest of the market as a whole. If the
Bank were to implement policy measures without listening to the views of stakeholders, it
could become complacent and create unnecessary confusion; at the same time, this does not
mean that the Bank will or should do everything stakeholders say.
For instance, sometimes it is said that the market is calling for an early rise in interest rates.
However, if the Bank were to indeed raise interest rates, bond and stock prices would
decline and the yen would appreciate, leading to a deterioration in firms' profits, credit costs
would increase, and financial institutions would suffer substantial damage. Moreover, even
if short-term interest rates were raised, long-term interest rates would not necessarily rise,
so that the spread between short-term and long-term interest rates might actually decline.
This is currently happening in the United States and has happened in Japan since 2006.9
The reason many market participants think that the yield curve will steepen and hence the
term spread will increase when the Bank raises interest rates is probably that they expect the
opposite to happen of the flattening of the yield curve seen at the time the Bank introduced
the negative interest rate policy on January 29, 2016. However, looking at the facts, we find
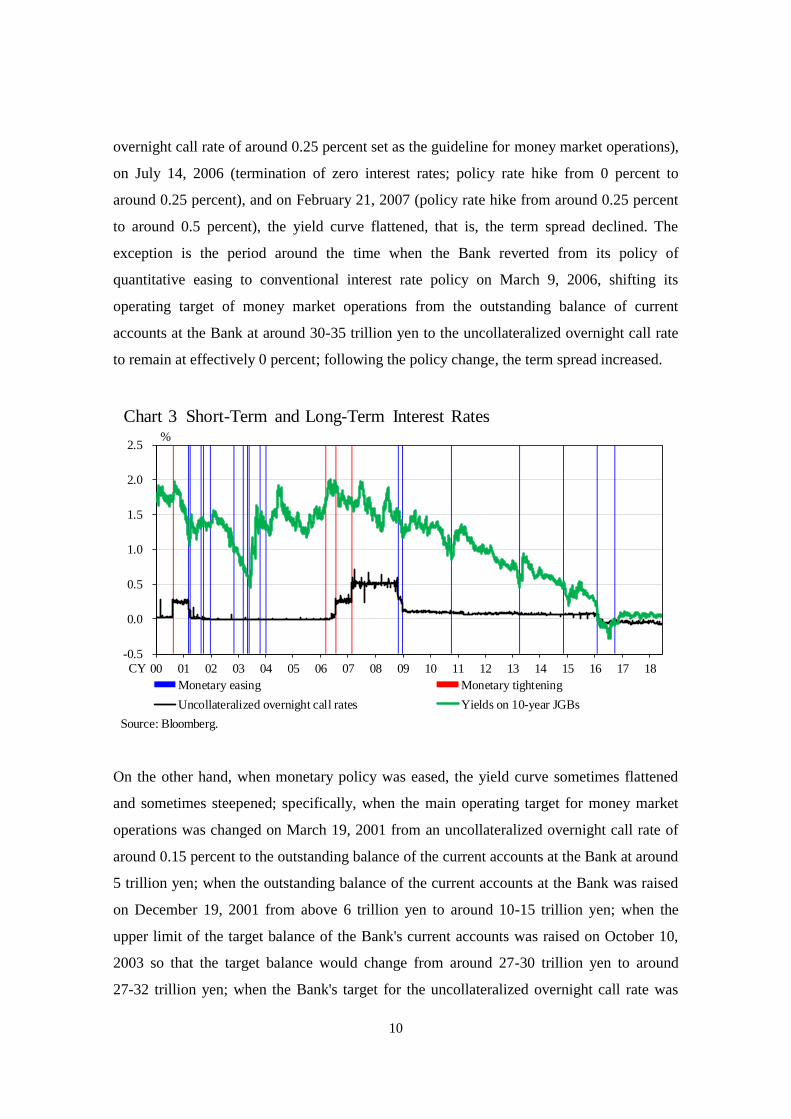
that the yield curve often tends to flatten when monetary policy is tightened. Chart 3 shows
the uncollateralized overnight call rate and long-term interest rates -- represented by 10-year
Japanese government bond yields -- from 2000 to the present. The chart shows that when
policy was tightened on August 11, 2000 (termination of the zero interest rate policy;
9 For instance, Reuters reported that the Federal Reserve Bank of St. Louis President James Bullard
said: "We are at some risk of a yield curve inversion, later this year, early 2019." See Gertrude
Chavez-Dreyfuss, "Fed's Bullard says U.S. yield curve might invert by early 2019," Reuters, May 15,
2018, https://www.reuters.com/article/usa-fed-bullard-yieldcurve/update-1-feds-bullard-says-us
-yield-curve-might-invert-by-early-2019-idUSL2N1SL10U. This, naturally, is not certain to happen,
but has happened before.
10
overnight call rate of around 0.25 percent set as the guideline for money market operations),
on July 14, 2006 (termination of zero interest rates; policy rate hike from 0 percent to
around 0.25 percent), and on February 21, 2007 (policy rate hike from around 0.25 percent
to around 0.5 percent), the yield curve flattened, that is, the term spread declined. The
exception is the period around the time when the Bank reverted from its policy of
quantitative easing to conventional interest rate policy on March 9, 2006, shifting its
operating target of money market operations from the outstanding balance of current
accounts at the Bank at around 30-35 trillion yen to the uncollateralized overnight call rate
to remain at effectively 0 percent; following the policy change, the term spread increased.
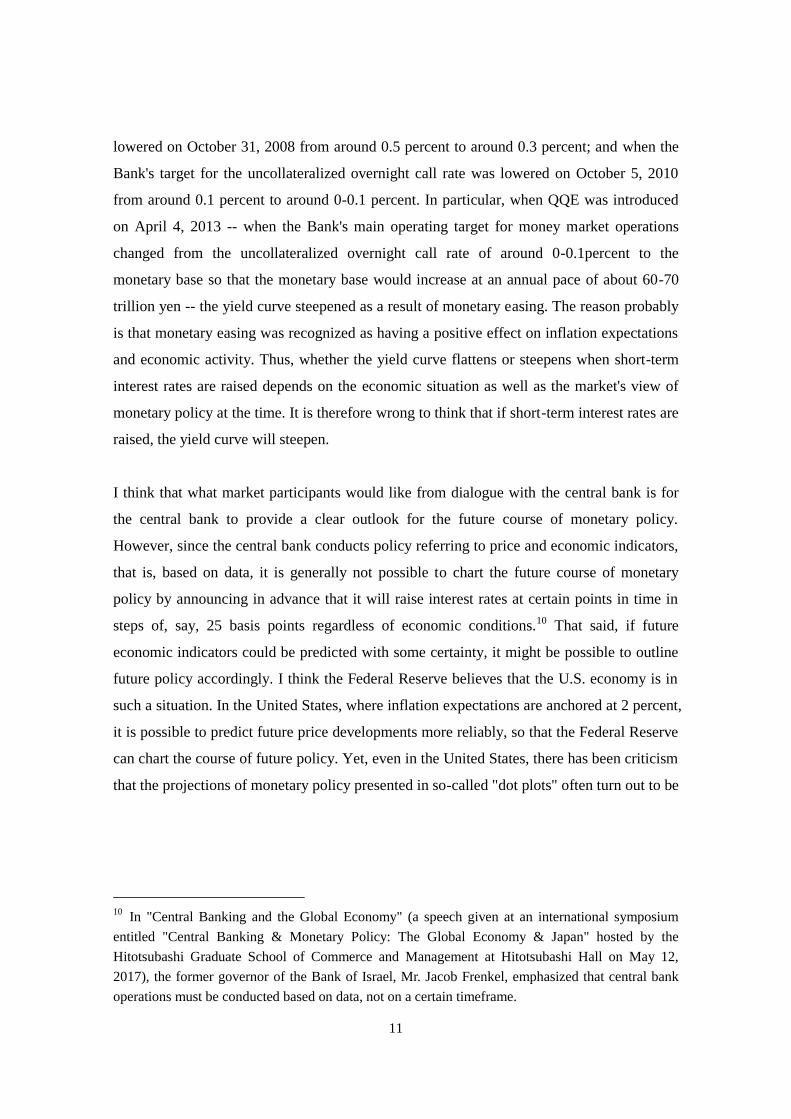
On the other hand, when monetary policy was eased, the yield curve sometimes flattened
and sometimes steepened; specifically, when the main operating target for money market
operations was changed on March 19, 2001 from an uncollateralized overnight call rate of
around 0.15 percent to the outstanding balance of the current accounts at the Bank at around
5 trillion yen; when the outstanding balance of the current accounts at the Bank was raised
on December 19, 2001 from above 6 trillion yen to around 10-15 trillion yen; when the
upper limit of the target balance of the Bank's current accounts was raised on October 10,
2003 so that the target balance would change from around 27-30 trillion yen to around
27-32 trillion yen; when the Bank's target for the uncollateralized overnight call rate was
Chart 3 Short-Term and Long-Term Interest Rates
-0.5
0.0
0.5
1.0
1.5
2.0
2.5
00 01 02 03 04 05 06 07 08 09 10 11 12 13 14 15 16 17 18
Monetary easing Monetary tightening
Uncollateralized overnight call rates Yields on 10-year JGBs
%
Source: Bloomberg.
CY
11
lowered on October 31, 2008 from around 0.5 percent to around 0.3 percent; and when the
Bank's target for the uncollateralized overnight call rate was lowered on October 5, 2010
from around 0.1 percent to around 0-0.1 percent. In particular, when QQE was introduced
on April 4, 2013 -- when the Bank's main operating target for money market operations
changed from the uncollateralized overnight call rate of around 0-0.1percent to the
monetary base so that the monetary base would increase at an annual pace of about 60-70
trillion yen -- the yield curve steepened as a result of monetary easing. The reason probably
is that monetary easing was recognized as having a positive effect on inflation expectations
and economic activity. Thus, whether the yield curve flattens or steepens when short-term
interest rates are raised depends on the economic situation as well as the market's view of
monetary policy at the time. It is therefore wrong to think that if short-term interest rates are
raised, the yield curve will steepen.
I think that what market participants would like from dialogue with the central bank is for
the central bank to provide a clear outlook for the future course of monetary policy.
However, since the central bank conducts policy referring to price and economic indicators,
that is, based on data, it is generally not possible to chart the future course of monetary
policy by announcing in advance that it will raise interest rates at certain points in time in
steps of, say, 25 basis points regardless of economic conditions.10 That said, if future
economic indicators could be predicted with some certainty, it might be possible to outline
future policy accordingly. I think the Federal Reserve believes that the U.S. economy is in
such a situation. In the United States, where inflation expectations are anchored at 2 percent,
it is possible to predict future price developments more reliably, so that the Federal Reserve
can chart the course of future policy. Yet, even in the United States, there has been criticism
that the projections of monetary policy presented in so-called "dot plots" often turn out to be
10
In "Central Banking and the Global Economy" (a speech given at an international symposium
entitled "Central Banking & Monetary Policy: The Global Economy & Japan" hosted by the
Hitotsubashi Graduate School of Commerce and Management at Hitotsubashi Hall on May 12,
2017), the former governor of the Bank of Israel, Mr. Jacob Frenkel, emphasized that central bank
operations must be conducted based on data, not on a certain timeframe.
12
inaccurate, causing unnecessary confusion.11 In Japan's current situation, where inflation
expectations are not anchored at 2 percent, it would likely be even more difficult to chart
future policy in advance.
In sum, while the central bank should communicate with the market, its focus should be on
conducting policies aimed at maintaining price stability, the sound development of the
national economy, and the stability of the financial system.
The Bank's Monetary Easing Policy and the Profitability of Private Banks
One subgroup of market participants is bank managers, and many of them have argued that
the low interest rates brought about by QQE have depressed banks' profits, and that this is a
side effect of QQE. They say that QQE undermines their business model, which is based on
the premise that interest rates are positive and consists of profiting from the difference
between high long-term interest rates and low short-term interest rates. This is equivalent to
saying that unless purchasing and selling prices are somehow preordained, you cannot
conduct business. However, every business derives its profits from the difference between
ever-changing costs and sales proceeds.
The reason why conditions for private banks are difficult is that there are few borrowers.
From a macroeconomic perspective, Japanese firms have sufficient cash and deposits at
private banks, so they do not need to borrow funds from them. According to the Bank's
Flow of Funds Accounts, as of end-March 2018, firms in Japan had cash and deposits of
261 trillion yen. Relative to the demand for funds, there is a glut of supply.
11
Bloomberg reported that Federal Reserve Bank of St. Louis President James Bullard in relation to
the dot plots observed that "[t]he whole idea that you're naming the number of rate hikes way out
into the future when you don't know what the data are going to be is something we should get out of
the business of doing." See Christopher Condon and Brendan Murray, "Bullard Laments Fed Dot
Plot, Yearns for Greenspan's Opacity," Bloomberg, May 17, 2018, https://www.bloomberg.com
/news/articles/2018-05-16/bullard-laments-fed-dot-plot-and-yearns-for-greenspan-s-opacity. Then
Federal Reserve Bank of San Francisco President, now Federal Reserve Bank of New York
President John Williams, commented that "the time is approaching to phase out" forward guidance,
which communicates the intended future path of the federal funds rate. See Jeanna Smialek,
"Williams Says Fed's Era of Market Hand-Holding Is Nearing an End," Bloomberg, May 17, 2018,
https://www.bloomberg.com/news/articles/2018-05-16/williams-says-fed-s-era-of-market-hand
-holding-nearing-an-end?in_source=video_page.
13
In addition, as mentioned earlier, if the Bank were to indeed raise interest rates, bond and
stock prices would decline and the yen would appreciate, leading to a deterioration in firms'
profits, and credit costs would increase, so that private banks would suffer substantial
damage. Also, we do not know whether the yield curve would steepen if short-term interest
rates were raised.
Meanwhile, another argument is that if monetary easing continues, not only the financial
situation of private banks but also that of the Bank of Japan would deteriorate, leading to
serious problems. However, this is not the case. Because I have already talked about this on
another occasion, I will not discuss it here today.12
12
Yutaka Harada, "Economic Activity, Prices, and Monetary Policy in Japan: Speech at a Meeting
with Business Leaders in Fukushima," Bank of Japan, November 2017.
14
III. Recent Economic Developments and Outlook for Prices
So far, I have talked about the long-term economic situation. I would now like to turn to the
more short-term situation.
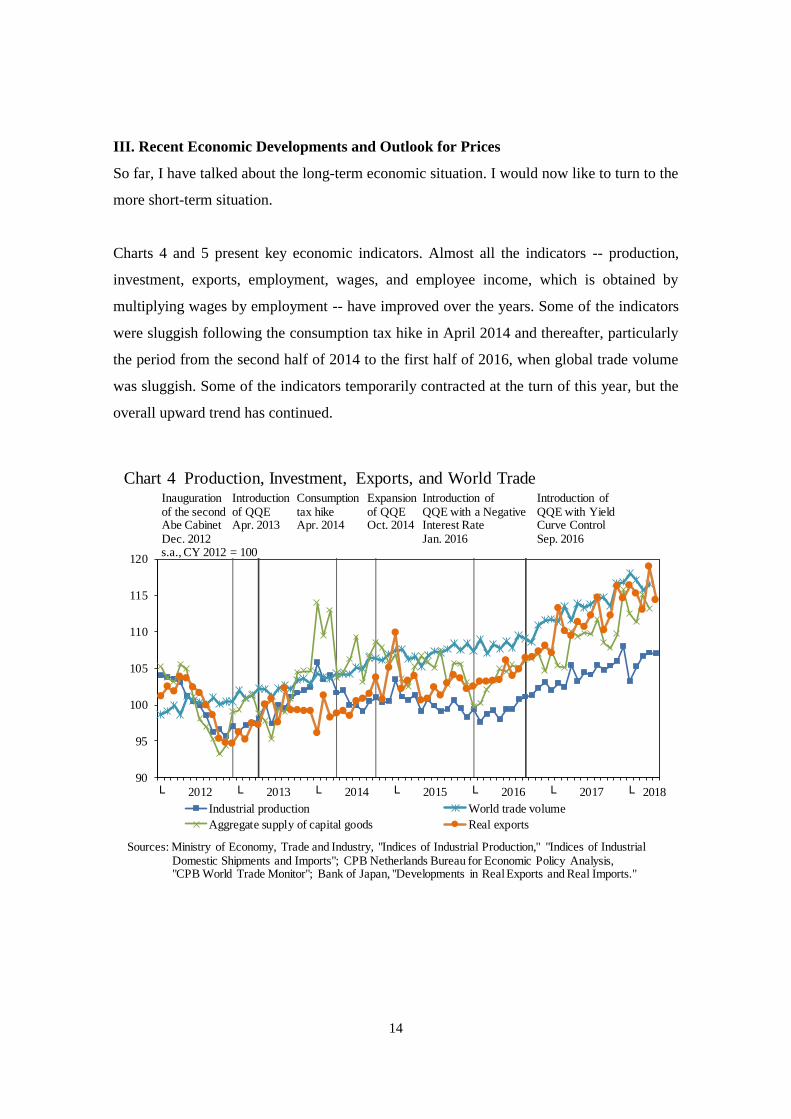
Charts 4 and 5 present key economic indicators. Almost all the indicators -- production,
investment, exports, employment, wages, and employee income, which is obtained by
multiplying wages by employment -- have improved over the years. Some of the indicators
were sluggish following the consumption tax hike in April 2014 and thereafter, particularly
the period from the second half of 2014 to the first half of 2016, when global trade volume
was sluggish. Some of the indicators temporarily contracted at the turn of this year, but the
overall upward trend has continued.
90
95
100
105
110
115
120
└ 2012 └ 2013 └ 2014 └ 2015 └ 2016 └ 2017 └
Industrial production World trade volume
Aggregate supply of capital goods Real exports
2018
s.a., CY 2012 = 100
Inauguration of the second Abe Cabinet Dec. 2012
Introductionof QQEApr. 2013
Consumptiontax hike Apr. 2014
Expansionof QQEOct. 2014
Introduction of QQE with Yield Curve ControlSep. 2016
Introduction of QQE with a Negative Interest RateJan. 2016
Sources: Ministry of Economy, Trade and Industry, "Indices of Industrial Production," "Indices of IndustrialDomestic Shipments and Imports"; CPB Netherlands Bureau for Economic Policy Analysis, "CPB World Trade Monitor"; Bank of Japan, "Developments in Real Exports and Real Imports."
Chart 4 Production, Investment, Exports, and World Trade
15
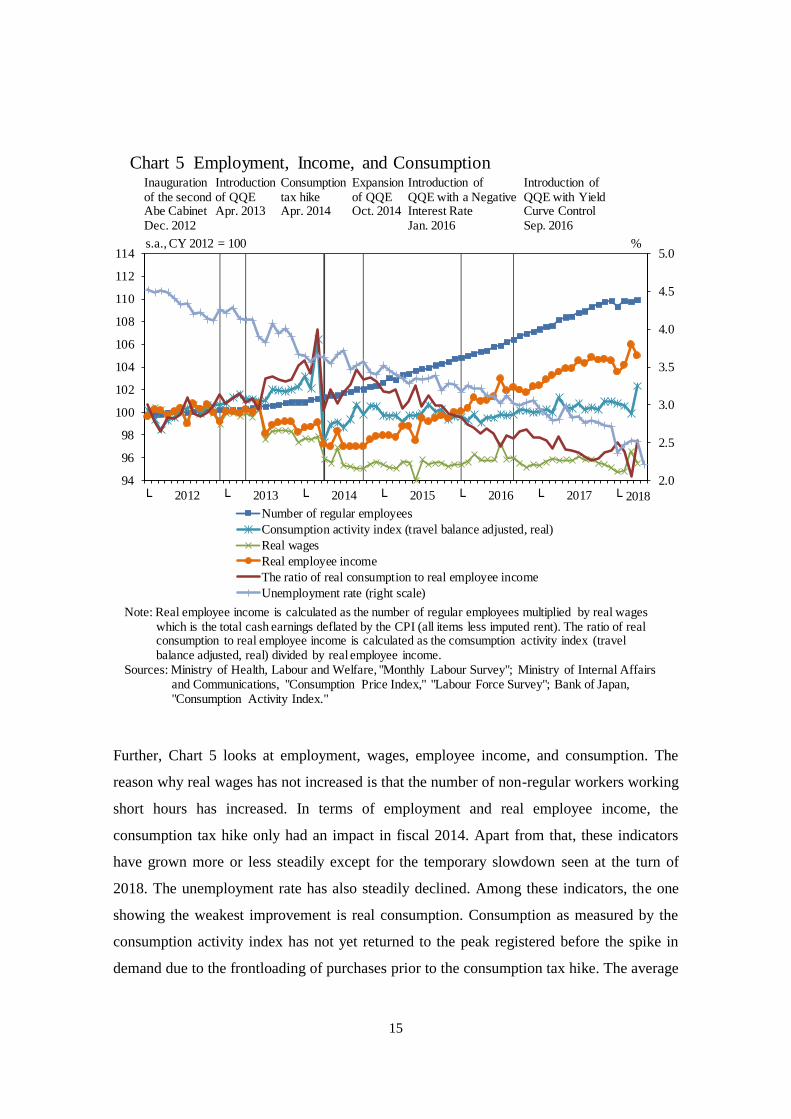
Further, Chart 5 looks at employment, wages, employee income, and consumption. The
reason why real wages has not increased is that the number of non-regular workers working
short hours has increased. In terms of employment and real employee income, the
consumption tax hike only had an impact in fiscal 2014. Apart from that, these indicators
have grown more or less steadily except for the temporary slowdown seen at the turn of
2018. The unemployment rate has also steadily declined. Among these indicators, the one
showing the weakest improvement is real consumption. Consumption as measured by the
consumption activity index has not yet returned to the peak registered before the spike in
demand due to the frontloading of purchases prior to the consumption tax hike. The average
2.0
2.5
3.0
3.5
4.0
4.5
5.0
94
96
98
100
102
104
106
108
110
112
114
└ 2012 └ 2013 └ 2014 └ 2015 └ 2016 └ 2017 └
Number of regular employees
Consumption activity index (travel balance adjusted, real)
Real wages
Real employee income
The ratio of real consumption to real employee income
Unemployment rate (right scale)
2018
Inauguration of the second Abe Cabinet Dec. 2012
Introductionof QQEApr. 2013
Consumptiontax hike Apr. 2014
Expansionof QQEOct. 2014
Introduction of QQE with Yield Curve ControlSep. 2016
Introduction of QQE with a Negative Interest RateJan. 2016
s.a., CY 2012 = 100 %
Note: Real employee income is calculated as the number of regular employees multiplied by real wages which is the total cash earnings deflated by the CPI (all items less imputed rent). The ratio of real consumption to real employee income is calculated as the comsumption activity index (travel balance adjusted, real) divided by real employee income.
Sources: Ministry of Health, Labour and Welfare, "Monthly Labour Survey"; Ministry of Internal Affairsand Communications, "Consumption Price Index," "Labour Force Survey"; Bank of Japan,"Consumption Activity Index."
Chart 5 Employment, Income, and Consumption
16
of the most recent three months, the February-April period of 2018, is still below the
average of the October-December quarter of 2013, the quarter before the demand spike
prior to the consumption tax hike. This is a bit strange given that real employee income, on
which consumption expenditure rests, has steadily increased, except for the fall at the start
of 2018. Although the ratio of real consumption to real employee income has been on a
declining trend, it is difficult to imagine that this ratio will continue to decline, so that
consumption can be expected to recover in the future.
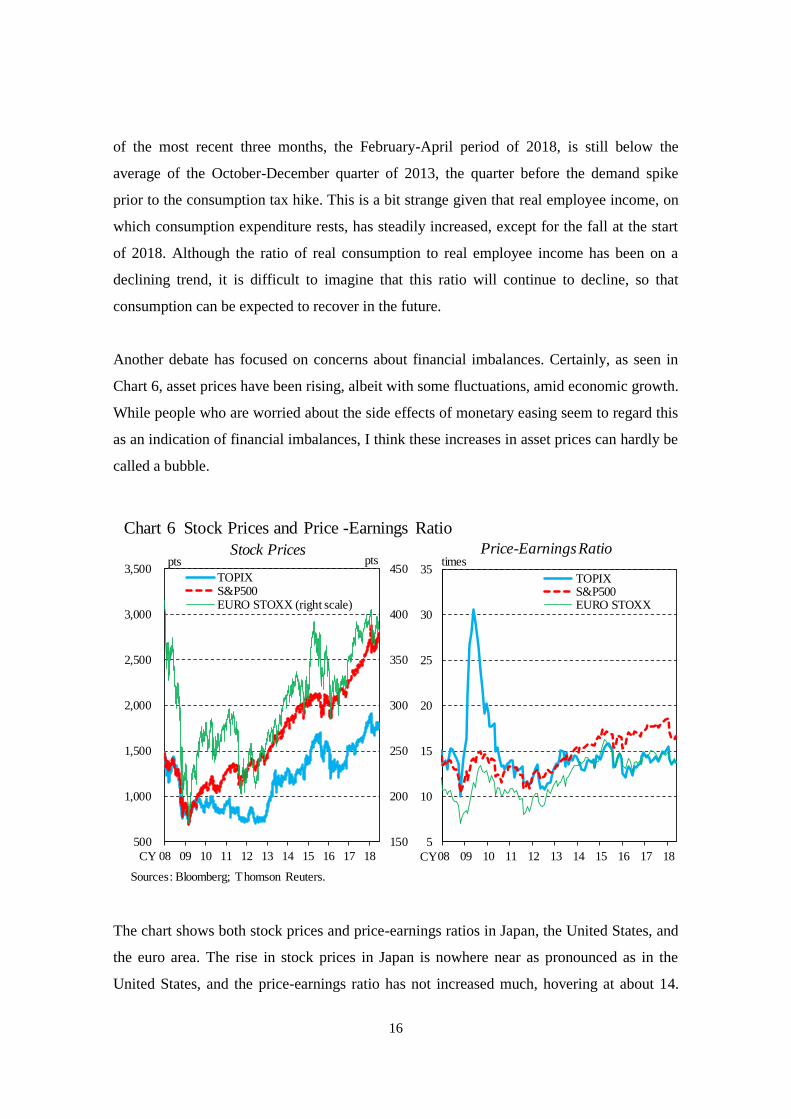
Another debate has focused on concerns about financial imbalances. Certainly, as seen in
Chart 6, asset prices have been rising, albeit with some fluctuations, amid economic growth.
While people who are worried about the side effects of monetary easing seem to regard this
as an indication of financial imbalances, I think these increases in asset prices can hardly be
called a bubble.
The chart shows both stock prices and price-earnings ratios in Japan, the United States, and
the euro area. The rise in stock prices in Japan is nowhere near as pronounced as in the
United States, and the price-earnings ratio has not increased much, hovering at about 14.
150
200
250
300
350
400
450
500
1,000
1,500
2,000
2,500
3,000
3,500
08 09 10 11 12 13 14 15 16 17 18
TOPIXS&P500EURO STOXX (right scale)
Stock Pricespts pts
Sources: Bloomberg; Thomson Reuters.
CY
5
10
15
20
25
30
35
08 09 10 11 12 13 14 15 16 17 18
TOPIXS&P500EURO STOXX
timesPrice-Earnings Ratio
CY
Chart 6 Stock Prices and Price -Earnings Ratio
17
Moreover, taking into account the Bank's April 2018 Financial System Report, it can be
judged that no major imbalances have built up in asset markets as a whole, although some
indicators such as stock prices, the real estate loans to GDP ratio, and the diffusion index of
lending attitudes of financial institutions have recently been close to the upper threshold of
their trend ranges reflecting the rapid pace of increase in these indicators.13 Needless to say,
it is essential that the Bank continues to constantly monitor for signs of financial
imbalances.
Path toward Achieving the Price Stability Target of 2 Percent
I mentioned earlier that consumption has been weak, and I would now like to turn to prices,
which have also been weak. However, if the economic recovery continues and employment
tightens, prices should rise eventually.
In this context, one often hears the question why prices are not rising even though the
unemployment rate has fallen to around 2.5 percent, well below 3.5 percent, which until
recently was widely regarded as the structural unemployment rate. My answer to this
question is simple: the decline in the unemployment rate is insufficient. Moreover, it would
be completely wrong to think that the structural unemployment rate is still the previously
estimated 3.5 percent.14
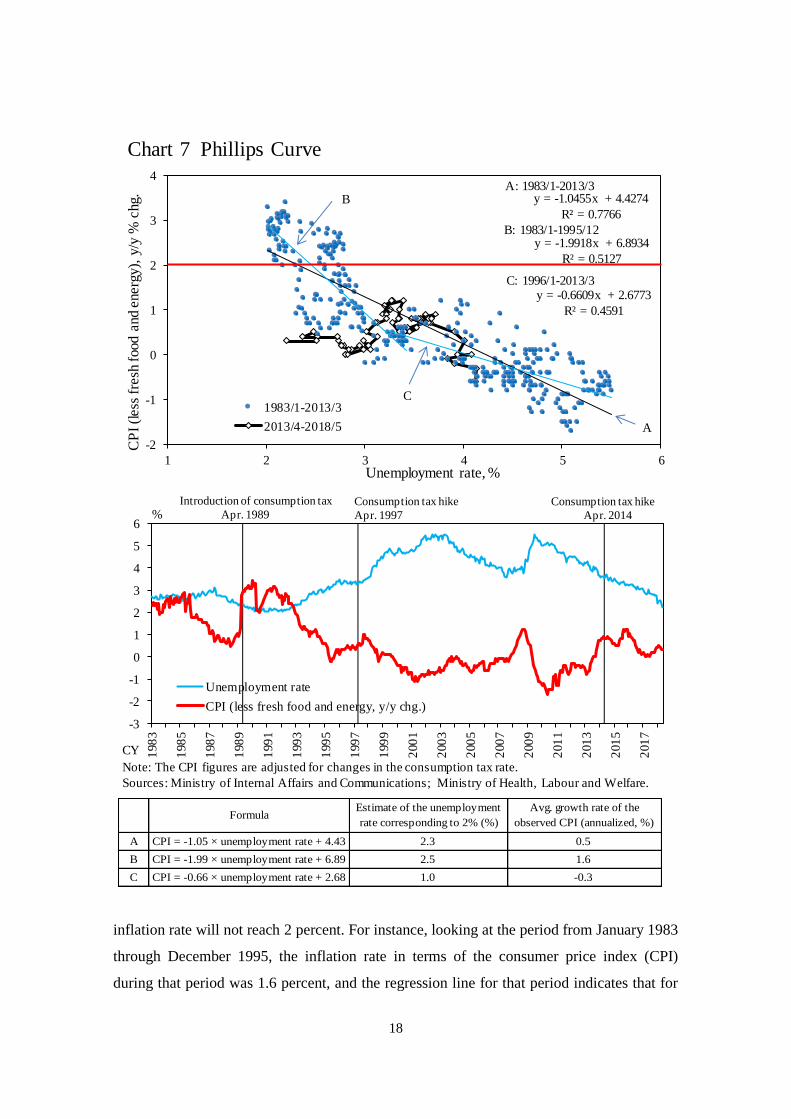
Chart 7 shows the Phillips curve for Japan, which depicts the relationship between the
inflation rate and the unemployment rate. The regression lines represent this relationship for
each of the following periods: from January 1983 through March 2013, from January 1983
through December 1995, and from January 1996 through March 2013. All of these
regression lines show that, unless the unemployment rate falls below 2.5 percent or so, the
13
Bank of Japan, Financial System Report, April 2018: 30-32, https://www.boj.or.jp/en/research
/brp/fsr/data/fsr180419a.pdf. 14
See footnote 19 in Yutaka Harada, "Economic Activity, Prices, and Monetary Policy in Japan:
Speech at a Meeting with Business Leaders in Fukushima," Bank of Japan, November 2017. Another
issue is output gap estimates. While estimates by the Bank's Research and Statistics Department and
the Cabinet Office each suggest that Japan's output gap is positive, the IMF's estimates for Japan are
negative, even for 2017, according to the World Economic Outlook Database April 2018, available
on the IMF website: https://www.imf.org/external/pubs/ft/weo/2018/01/weodata/index.aspx.
18
inflation rate will not reach 2 percent. For instance, looking at the period from January 1983
through December 1995, the inflation rate in terms of the consumer price index (CPI)
during that period was 1.6 percent, and the regression line for that period indicates that for
-3
-2
-1
0
1
2
3
4
5
6
198
3
198
5
198
7
198
9
199
1
199
3
199
5
199
7
199
9
200
1
200
3
200
5
200
7
200
9
201
1
201
3
201
5
201
7
Unemployment rate
CPI (less fresh food and energy, y/y chg.)
%Consumption tax hike
Apr. 2014
Consumption tax hike
Apr. 1997
Introduction of consumption tax
Apr. 1989
Note: The CPI figures are adjusted for changes in the consumption tax rate.
Sources: Ministry of Internal Affairs and Communications; Ministry of Health, Labour and Welfare.
CY
y = -1.0455x + 4.4274
R² = 0.7766
y = -1.9918x + 6.8934
R² = 0.5127
y = -0.6609x + 2.6773
R² = 0.4591
-2
-1
0
1
2
3
4
1 2 3 4 5 6
1983/1-2013/3
2013/4-2018/5
Unemployment rate, %
A: 1983/1-2013/3
B: 1983/1-1995/12
C: 1996/1-2013/3
A
B
C
CP
I (l
ess
fresh
food a
nd e
nerg
y),
y/y
% c
hg.
Chart 7 Phillips Curve
A
B
C
CPI = -1.99 × unemployment rate + 6.89 2.5 1.6
CPI = -0.66 × unemployment rate + 2.68 1.0 -0.3
FormulaEstimate of the unemployment
rate corresponding to 2% (%)
Avg. growth rate of the
observed CPI (annualized, %)
CPI = -1.05 × unemployment rate + 4.43 2.3 0.5
19
inflation to rise to 2 percent, the unemployment rate would need to fall to around 2.5
percent. Thus, as the regression line B in chart 7 suggests, if inflation rates rise continuously
at about 1.5 percent and the unemployment rate is at 2.5 percent, then 2 percent inflation
will be achieved. In order to achieve 2 percent inflation, the inflation rate, which was 0.3
percent for May 2018, would have to rise to around 1.6 percent, while the unemployment
rate, which was 2.2 percent for May 2018, would have to be maintained at around 2.5
percent.
Another issue is that the unemployment rate necessary to push up inflation has become even
lower, since there is room for a further increase in the employment rate. According to the
May 2018 Labour Force Survey released by the Ministry of Internal Affairs and
Communications, the number of employees increased by as many as 1.51 million from a
year earlier, although the number of the unemployed was only 1.58 million. Moreover, I
hear that, due to continued labor shortages, labor in low-productivity sectors and excess
labor at firms seems to be shifting to other industries or firms. This shift pushes up labor
supply in real terms. Thus, if productivity rises, an increase in inflation is delayed.15
Disregarding these factors and assuming that there is no labor slack by simply using the
employment rate and the labor force participation rate of men aged between 25 and 54 in
1992 -- when the employment rate among this group was at a historical high -- the
unemployment rate for 2017 is estimated to be 2.3 percent.
The unemployment rate in 1992 stood at 2.2 percent, but the proportion of young people
was higher at that time. Given that the unemployment rate among the young is usually
higher, and that among the middle-aged is usually lower, the estimated unemployment rate
for 1992 is 1.9 percent if it is adjusted based on the demographic structure in 2017.
The calculations imply that in order to achieve the level of inflation seen in 1992, which
was 2.2 percent in terms of the CPI for all items less fresh food and energy, the
15
The same idea is also provided in "II. Price Developments and their Outlook," Section II in
Hiroshi Nakaso, "Japan's Economy and Monetary Policy: Speech at a Meeting with Business
Leaders in Hiroshima," Bank of Japan, July 2017.
20
unemployment rate has to remain at its May 2018 level of 2.2 percent. While I am not
saying that I believe that these estimates are fully accurate, I do think that the current
unemployment rate needs to fall further in order to achieve the price stability target of 2
percent.
Just to be sure, I would like to add that I am not saying that monetary easing should
continue until the unemployment rate has fallen to 2 percent. In conducting monetary policy,
the Bank should pay close attention to price developments, and past observations on the link
between prices and the unemployment rate should be regarded merely as supplementary
information to help with making appropriate monetary policy decisions.
Since there is room for further increases in employment and production, the Bank needs to
continue with the current monetary policy measures in order to achieve the price stability
target of 2 percent. Needless to say, it is essential that the Bank continues to constantly
monitor for signs of financial imbalances, but for now, the likelihood of such imbalances is
small.
Now, I would like to briefly talk about the deletion of the description regarding when 2
percent inflation would be achieved in the Bank's April 2018 Outlook for Economic
Developments and Prices (Outlook Report), since the deletion became the subject of debate
among market participants. Specifically, the deleted description was that the timing "will
likely be around fiscal 2019." However, the timing mentioned in the Outlook Report was
merely a projection, and any changes in the projected timing were not automatically linked
to any changes in policy, nor was its deletion. In my view, prices are influenced by a variety
of factors; what is important is that the mechanism through which prices rise works well,
and policy decisions should be made in line with developments in this mechanism. In other
words, additional monetary easing might be necessary if inflation loses momentum, but
otherwise the current policy should be maintained.
Cognitive Dissonance with Respect to QQE
I sometimes feel that the attitude of those who are opposed to QQE shows signs of what can
be called "cognitive dissonance." Cognitive dissonance is, of course, a term from
21
psychology that is also used in marketing and refers to the mental discomfort experienced
by a person when new information contradicts their personal beliefs. In that case, many
people attempt to reduce the discomfort by denying the new information.
When confronted with information that the economy is actually improving despite their
strong belief that QQE will not help the economy grow, these critics will try to reduce such
dissonance by denying this information or by arguing that even though economic
developments are favorable at the moment, they will definitely deteriorate in the future. For
example, the argument that any future exit from monetary easing will cause major problems
also tries to reduce discomfort by referring to future possibilities. Since such arguments
focus not on the present but on the future, they allow these opponents of QQE to avoid
facing such dissonance for the time being.
Another confused psychological mindset is to cast doubt on the monetary easing measures
themselves. In this mindset, bold monetary easing is risky, and such measures should not be
taken. However, it seems to me that human beings may have had this kind of risk-averse
mindset since ancient times. Mythological stories around the world, from every culture,
describe the tragedy that befalls anyone who has the hubris to challenge the gods. You see
this for example in the stories of the Tower of Babel, of Daedalus and Icarus, and of golems.
Perhaps those critics who are most vocal in their critical opinions on QQE are afraid that the
economic gods will vent their anger over QQE.
And if it is not against the laws of the gods, perhaps opponents of QQE believe it is
somehow going against the laws of nature. This reminds me of a famous play in kabuki --
traditional Japanese theatre -- called Narukami Fudō Kitayama Zakura. One of the themes
of this story is that the laws of nature should not be broken. In order to prevent evil Prince
Hayakumo from succeeding to the throne, the Imperial Court in ancient Japan asked Saint
Narukami to perform an occult rite so that the girl that the empress was pregnant with
would be born as a boy. In exchange for his services, the court initially promised to build
Narukami a temple, but the promise was suddenly withdrawn because of his violation of the
laws of nature. However, is QQE a policy that violates the laws of nature?
22
Perhaps the unshakeable critics of QQE believe that monetary policy does not belong within
the human realm, but under the purview of a single omnipotent force. Asked whether it is
right to pay the imperial tax to Caesar, Jesus once asked for confirmation that the coin used
for paying the tax bore the image of Caesar and said: "So give back to Caesar what is
Caesar's, and to God what is God's." Monetary policy without doubt falls within the human
realm. And if it falls within the realm of humans, it should be discussed based on theory,
facts, and evidence.
Concluding Remarks
As stated so far, the Bank's bold monetary easing measures have been producing their
intended effects, leading to an improvement in production, employment, productivity, the
unemployment rate, investment, exports, and fiscal conditions. Further indicators are
perceptions that the economy is recovering, improvements in income distribution, and
women's entry into the labor market.
Although some people are critical of the Bank's monetary easing measures, their arguments
are not supported by empirical evidence. If the Bank were to conduct monetary policy in the
way they say it should, economic activity would deteriorate and markets would fall into
turmoil. In its assessment of recent economic developments and monetary policy, the Bank
concluded that it should continue with the current monetary easing with a view to achieving
the price stability target of 2 percent, given that, for now, there is still room for an
expansion in employment and that there are few signs of financial imbalances.
Thank you for your attention.