Embed Size (px)
Citation preview
Econ 102Spring 2013Macroeconomics
The Current Economy
Steven W. Rick
University of Wisconsin
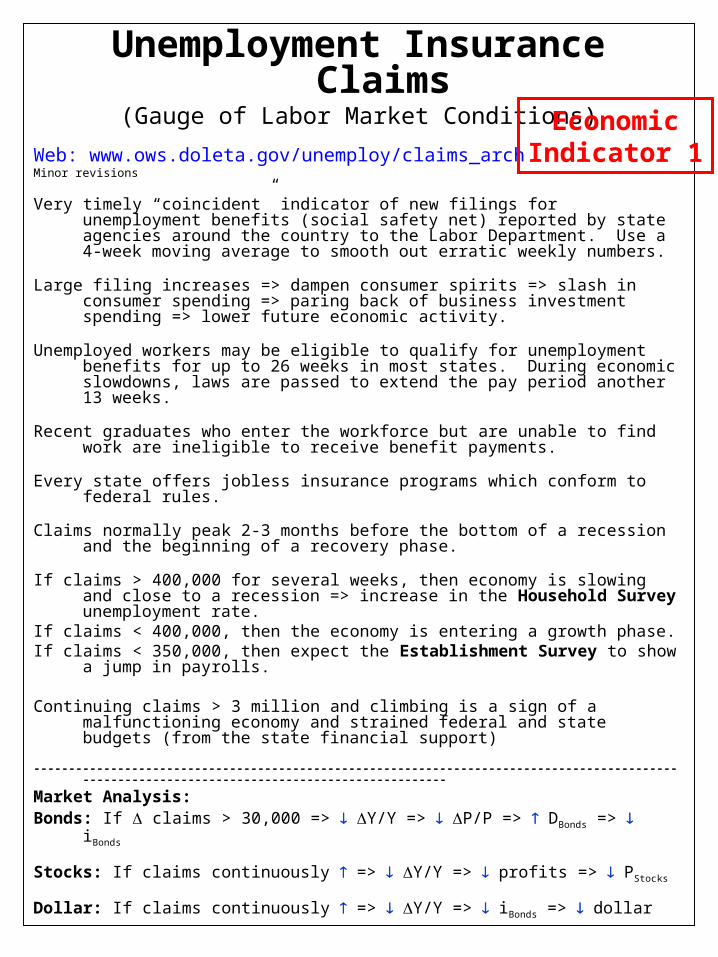
Unemployment Insurance Claims(Gauge of Labor Market Conditions)
Web: www.ows.doleta.gov/unemploy/claims_archMinor revisions
Very timely “coincident” indicator of new filings for unemployment benefits (social safety net) reported by state agencies around the country to the Labor Department. Use a 4-week moving average to smooth out erratic weekly numbers.
Large filing increases => dampen consumer spirits => slash in consumer spending => paring back of business investment spending => lower future economic activity.
Unemployed workers may be eligible to qualify for unemployment benefits for up to 26 weeks in most states. During economic slowdowns, laws are passed to extend the pay period another 13 weeks.
Recent graduates who enter the workforce but are unable to find work are ineligible to receive benefit payments.
Every state offers jobless insurance programs which conform to federal rules.
Claims normally peak 2-3 months before the bottom of a recession and the beginning of a recovery phase.
If claims > 400,000 for several weeks, then economy is slowing and close to a recession => increase in the Household Survey unemployment rate.
If claims < 400,000, then the economy is entering a growth phase.If claims < 350,000, then expect the Establishment Survey to show a jump in
payrolls.
Continuing claims > 3 million and climbing is a sign of a malfunctioning economy and strained federal and state budgets (from the state financial support)
------------------------------------------------------------------------------------------------------------------------------------------------
Market Analysis:Bonds: If claims > 30,000 => Y/Y => P/P => DBonds => iBonds
Stocks: If claims continuously => Y/Y => profits => PStocks
Dollar: If claims continuously => Y/Y => iBonds => dollar
EconomicIndicator 1
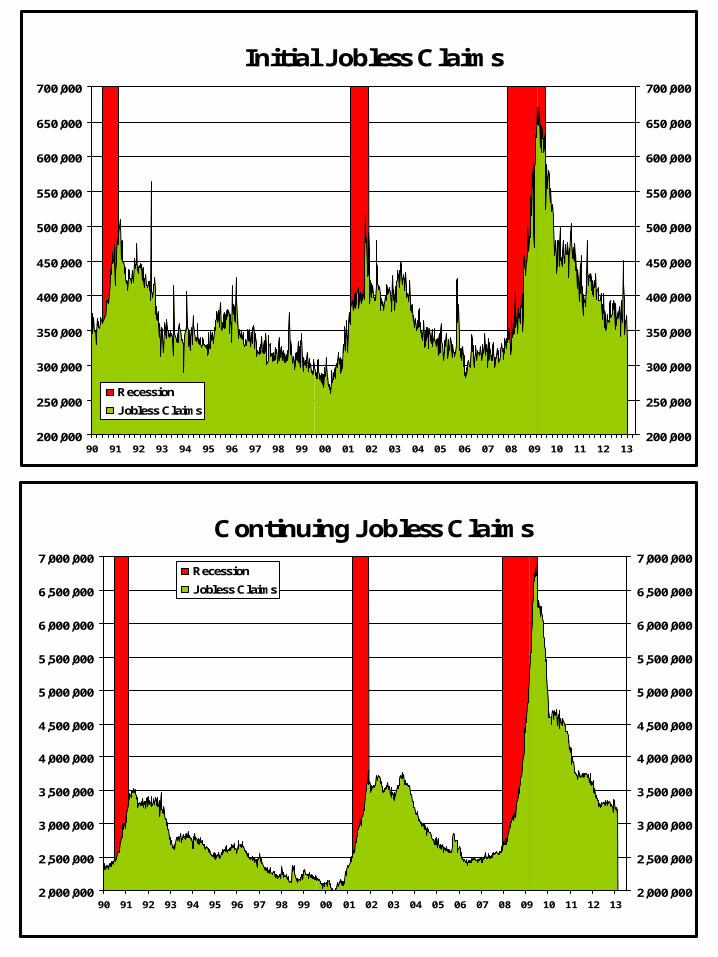
Initial Jobless Claims
200,000
250,000
300,000
350,000
400,000
450,000
500,000
550,000
600,000
650,000
700,000
90 91 92 93 94 95 96 97 98 99 00 01 02 03 04 05 06 07 08 09 10 11 12 13200,000
250,000
300,000
350,000
400,000
450,000
500,000
550,000
600,000
650,000
700,000
Recession
Jobless Claims
Continuing Jobless Claims
2,000,000
2,500,000
3,000,000
3,500,000
4,000,000
4,500,000
5,000,000
5,500,000
6,000,000
6,500,000
7,000,000
90 91 92 93 94 95 96 97 98 99 00 01 02 03 04 05 06 07 08 09 10 11 12 132,000,000
2,500,000
3,000,000
3,500,000
4,000,000
4,500,000
5,000,000
5,500,000
6,000,000
6,500,000
7,000,000Recession
Jobless Claims
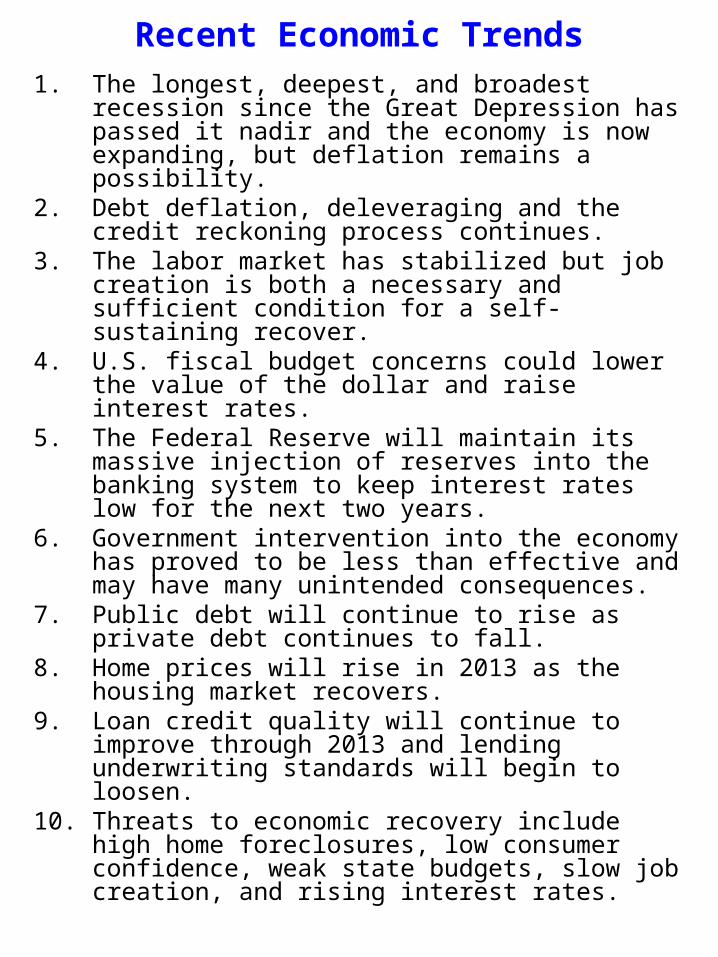
Recent Economic Trends1. The longest, deepest, and broadest recession since the
Great Depression has passed it nadir and the economy is now expanding, but deflation remains a possibility.
2. Debt deflation, deleveraging and the credit reckoning process continues.
3. The labor market has stabilized but job creation is both a necessary and sufficient condition for a self-sustaining recover.
4. U.S. fiscal budget concerns could lower the value of the dollar and raise interest rates.
5. The Federal Reserve will maintain its massive injection of reserves into the banking system to keep interest rates low for the next two years.
6. Government intervention into the economy has proved to be less than effective and may have many unintended consequences.
7. Public debt will continue to rise as private debt continues to fall.
8. Home prices will rise in 2013 as the housing market recovers.
9. Loan credit quality will continue to improve through 2013 and lending underwriting standards will begin to loosen.
10. Threats to economic recovery include high home foreclosures, low consumer confidence, weak state budgets, slow job creation, and rising interest rates.
3rd Quarter 2012 GDP
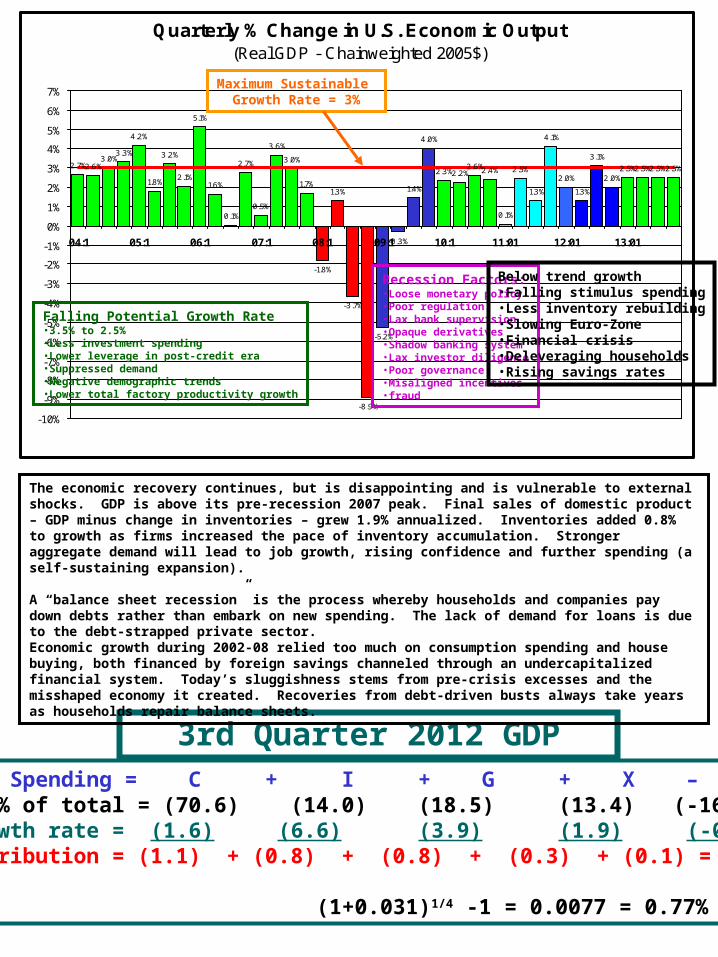
The economic recovery continues, but is disappointing and is vulnerable to external shocks. GDP is above its pre-recession 2007 peak. Final sales of domestic product – GDP minus change in inventories – grew 1.9% annualized. Inventories added 0.8% to growth as firms increased the pace of inventory accumulation. Stronger aggregate demand will lead to job growth, rising confidence and further spending (a self-sustaining expansion).
A “balance sheet recession” is the process whereby households and companies pay down debts rather than embark on new spending. The lack of demand for loans is due to the debt-strapped private sector.Economic growth during 2002-08 relied too much on consumption spending and house buying, both financed by foreign savings channeled through an undercapitalized financial system. Today’s sluggishness stems from pre-crisis excesses and the misshaped economy it created. Recoveries from debt-driven busts always take years as households repair balance sheets.
Spending = C + I + G + X – M % of total = (70.6) (14.0) (18.5) (13.4) (-16.4) Growth rate = (1.6) (6.6) (3.9) (1.9) (-0.6)Contribution = (1.1) + (0.8) + (0.8) + (0.3) + (0.1) = 3.1%
(1+0.031)1/4 -1 = 0.0077 = 0.77%
Quarterly % Change in U.S. Economic Output(Real GDP - Chainweighted 2005$)
2.7%2.6%3.0%
3.3%
4.2%
3.2%
2.1%
5.1%
1.6%
0.1%
2.7%
0.5%
3.6%
3.0%
1.7%
-1.8%
1.3%
-3.7%
-8.9%
-5.2%
-0.3%
1.4%
4.0%
2.3%2.2%2.6%2.4%
0.1%
2.5%
1.3%
4.1%
2.0%
1.3%
3.1%
2.0%2.5%2.5%2.5%2.5%
1.8%
-10%
-9%
-8%
-7%
-6%
-5%
-4%
-3%
-2%
-1%
0%
1%
2%
3%
4%
5%
6%
7%
04:1 05:1 06:1 07:1 08:1 09:1 10:1 11:01 12:01 13:01
Source: Department of Commerce.
Recession Factors:•Loose monetary policy•Poor regulation•Lax bank supervision•Opaque derivatives•Shadow banking system•Lax investor diligence•Poor governance•Misaligned incentives•fraud
Falling Potential Growth Rate•3.5% to 2.5%•Less investment spending•Lower leverage in post-credit era•Suppressed demand•Negative demographic trends•Lower total factory productivity growth
Maximum Sustainable Growth Rate = 3%
Below trend growth•Falling stimulus spending•Less inventory rebuilding•Slowing Euro-Zone•Financial crisis•Deleveraging households•Rising savings rates
6
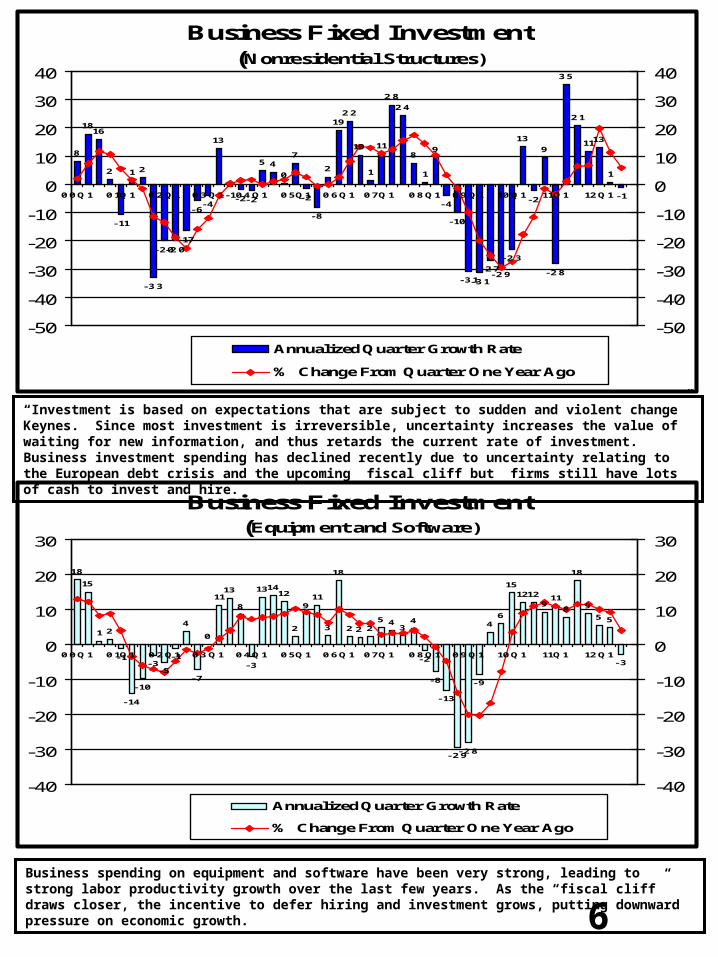
“Investment is based on expectations that are subject to sudden and violent change” Keynes. Since most investment is irreversible, uncertainty increases the value of waiting for new information, and thus retards the current rate of investment.Business investment spending has declined recently due to uncertainty relating to the European debt crisis and the upcoming fiscal cliff but firms still have lots of cash to invest and hire.
Business spending on equipment and software have been very strong, leading to strong labor productivity growth over the last few years. As the “fiscal cliff” draws closer, the incentive to defer hiring and investment grows, putting downward pressure on economic growth.
Business Fixed Investment(Nonresidential Structures)
8
1816
2
-11
1 2
-33
-20-20-17
-6-4
13
-1-2-2
5 4
0
7
-2
-8
2
1922
10
1
11
28
24
8
1
9
-4
-10
-31-31
-27-29
-23
13
-2
9
-28
35
21
1113
1
-1
-50
-40
-30
-20
-10
0
10
20
30
40
00Q1 01Q1 02Q1 03Q1 04Q1 05Q1 06Q1 07Q1 08Q1 09Q1 10Q1 11Q1 12Q1
-50
-40
-30
-20
-10
0
10
20
30
40
Annualized Quarter Growth Rate
% Change From Quarter One Year Ago
Business Fixed Investment(Equipment and Software)
18
15
1 2
-1
-14
-10
-3-5
-1
4
-7
0
1113
8
-3
131412
2
911
3
18
2 2 25 4
34
-2
-8
-13
-29-28
-9
46
151212
911
8
18
9
5 5
-3
-40
-30
-20
-10
0
10
20
30
00Q1 01Q1 02Q1 03Q1 04Q1 05Q1 06Q1 07Q1 08Q1 09Q1 10Q1 11Q1 12Q1
-40
-30
-20
-10
0
10
20
30
Annualized Quarter Growth Rate
% Change From Quarter One Year Ago
7
Real Personal Consumption Expenditures
(Durable Goods)
24.5
-7.0
7.1
3.0
7.0
-0.2
4.9
38.1
-4.5
4.2
12.3
-5.2
1.2
17.617.9
3.85.7
2.6
8.17.3
4.3
12.1
5.8
-9.8
16.5
0.3
6.15.65.15.75.2
2.3
-9.6
-2.9
-12.3
-25.4
1.3
-2.0
20.9
-6.1
5.5
10.5
7.2
15.3
7.3
-2.3
5.4
13.911.5
-0.2
8.7
-30
-20
-10
0
10
20
30
40
50
00Q1 01Q1 02Q1 03Q1 04Q1 05Q1 06Q1 07Q1 08Q1 09Q1 10Q1 11Q1 12Q1
-30
-20
-10
0
10
20
30
40
50Annualized Quarter Growth Rate
% Change From Quarter One Year Ago
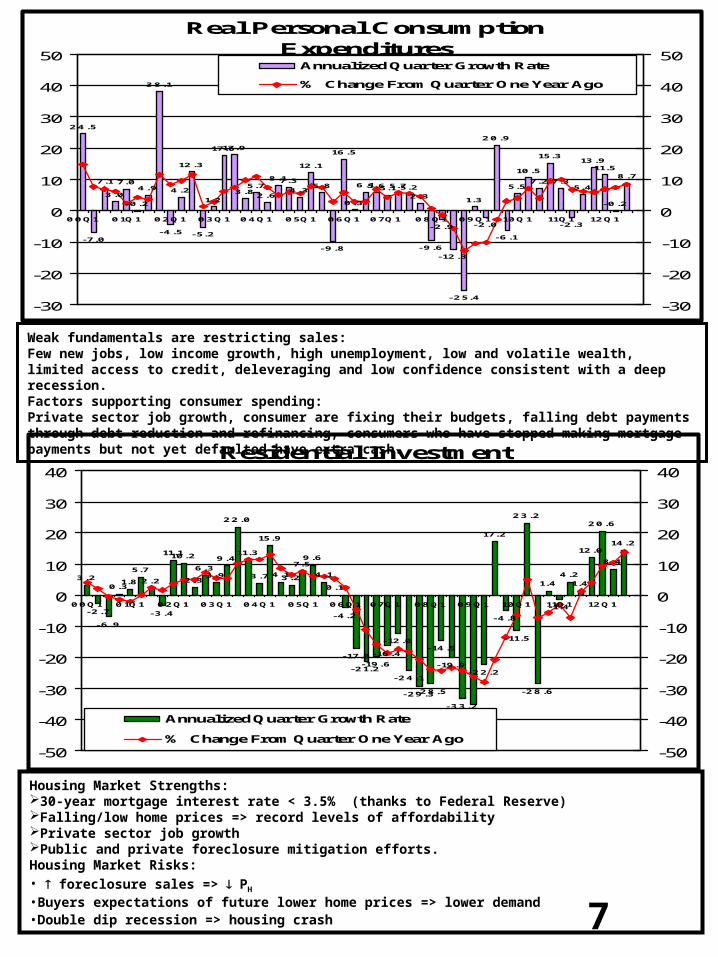
Weak fundamentals are restricting sales:Few new jobs, low income growth, high unemployment, low and volatile wealth, limited access to credit, deleveraging and low confidence consistent with a deep recession.Factors supporting consumer spending:Private sector job growth, consumer are fixing their budgets, falling debt payments through debt reduction and refinancing, consumers who have stopped making mortgage payments but not yet defaulted have extra cash.
Housing Market Strengths:30-year mortgage interest rate < 3.5% (thanks to Federal Reserve)Falling/low home prices => record levels of affordabilityPrivate sector job growthPublic and private foreclosure mitigation efforts.Housing Market Risks:• foreclosure sales => PH
•Buyers expectations of future lower home prices => lower demand•Double dip recession => housing crash
Residential Investment
3.2
-2.7
-6.9
0.31.8
5.7
2.2
-3.4
11.110.2
2.3
6.33.9
9.4
22.0
11.3
3.7
15.9
4.13.2
7.59.6
4.1
0.1
-4.2
-17.0
-21.2-19.6
-16.4
-12.0
-24.1
-29.3-28.5
-14.5
-19.9
-33.2-35.1
-22.2
17.2
-4.8
-11.5
23.2
-28.6
1.4
-1.4
4.21.4
12.0
20.6
8.4
14.2
-50
-40
-30
-20
-10
0
10
20
30
40
00Q1 01Q1 02Q1 03Q1 04Q1 05Q1 06Q1 07Q1 08Q1 09Q1 10Q1 11Q1 12Q1
-50
-40
-30
-20
-10
0
10
20
30
40
Annualized Quarter Growth Rate
% Change From Quarter One Year Ago
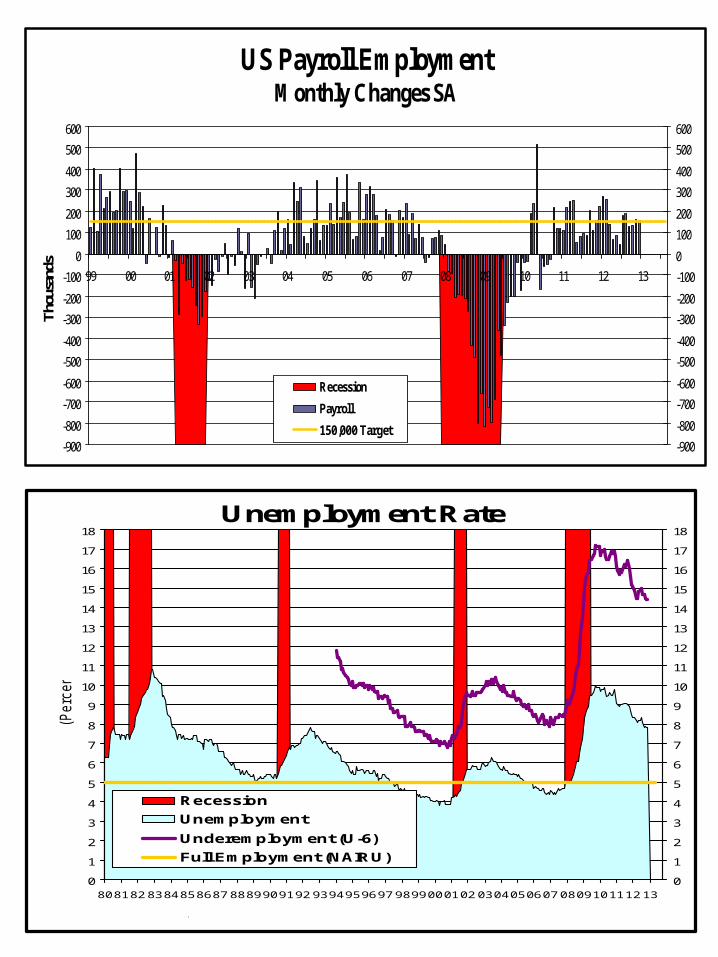
US Payroll Employment Monthly Changes SA
-900
-800
-700
-600
-500
-400
-300
-200
-100
0
100
200
300
400
500
600
99 00 01 02 03 04 05 06 07 08 09 10 11 12 13
Tho
usan
ds
-900
-800
-700
-600
-500
-400
-300
-200
-100
0
100
200
300
400
500
600
Recession
Payroll
150,000 Target
Unemployment Rate
0
1
2
3
4
5
6
7
8
9
10
11
12
13
14
15
16
17
18
808182 8384858687 8889909192 9394959697 9899000102 0304050607 0809101112 13
(Perc
en
t)
0
1
2
3
4
5
6
7
8
9
10
11
12
13
14
15
16
17
18
Recession
Unemployment
Underemployment (U-6)
Full Employment (NAIRU)
Source: Department of Labor.
9
Consumer Price Index 1970 to Present
5.6
3.33.4
8.7
12.3
6.9
4.9
6.7
9.0
12.5
8.9
3.83.84.04.44.44.7
6.1
3.12.92.72.72.5
3.3
1.71.6
2.6
3.4
1.6
2.41.9
3.33.5
2.5
4.1
-0.1
2.8
1.4
3.0
1.7
3.8
1.1
13.3
2 .5 2 .5 2 .5 2 .5 2 .5 2 .5 2 .5 2 .5 2 .5 2 .5 2 .5 2 .5 2 .5 2 .5 2 .5 2 .5 2 .5 2 .5 2 .5 2 .5 2 .5 2 .5 2 .5 2 .5 2 .5 2 .5 2 .5 2 .5 2 .5 2 .5 2 .5 2 .5 2 .5 2 .5 2 .5 2 .5 2 .5 2 .5 2 .5 2 .5 2 .5 2 .5 2 .5
-1
0
1
2
3
4
5
6
7
8
9
10
11
12
13
14
70 72 74 76 78 80 82 84 86 88 90 92 94 96 98 00 02 04 06 08 10 12
2.5% Target
Annual Percentage Change
Inflation (CPI)(year over year % growth)
-3%
-2%
-1%
0%
1%
2%
3%
4%
5%
6%
95 96 97 98 99 00 01 02 03 04 05 06 07 08 09 10 11 12 13
HeadlineCore (excludes food and energy)
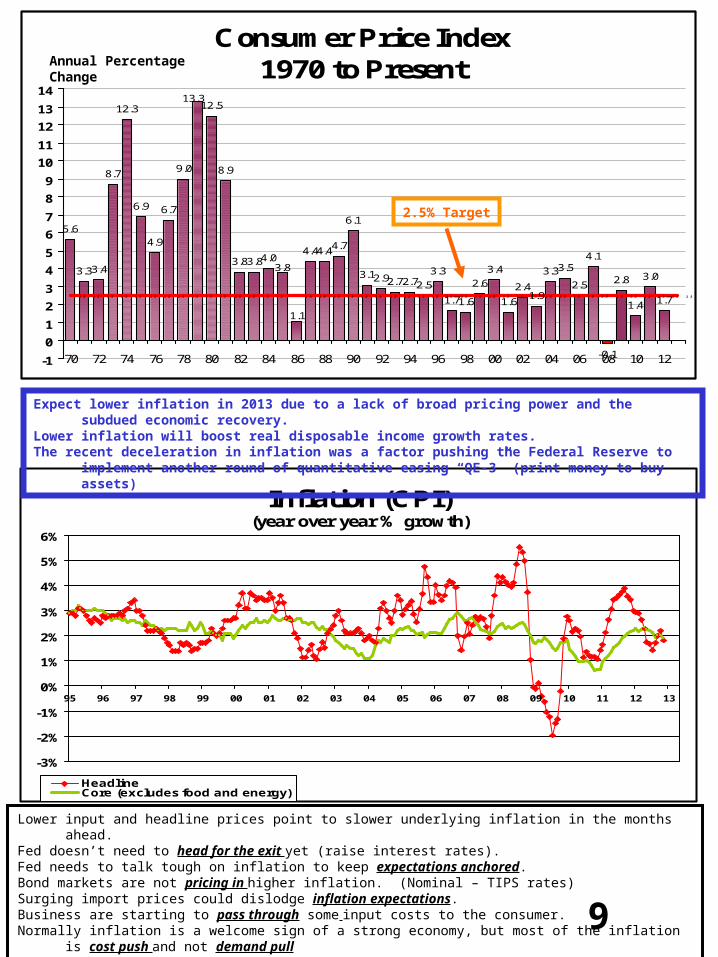
Lower input and headline prices point to slower underlying inflation in the months ahead.Fed doesn’t need to head for the exit yet (raise interest rates).Fed needs to talk tough on inflation to keep expectations anchored.Bond markets are not pricing in higher inflation. (Nominal – TIPS rates)Surging import prices could dislodge inflation expectations.Business are starting to pass through some input costs to the consumer.Normally inflation is a welcome sign of a strong economy, but most of the inflation is cost push and not demand pullDollar depreciated 6% over last year => lagged impact on import prices
Expect lower inflation in 2013 due to a lack of broad pricing power and the subdued economic recovery.Lower inflation will boost real disposable income growth rates.The recent deceleration in inflation was a factor pushing the Federal Reserve to implement another round of
quantitative easing “QE-3” (print money to buy assets)
10
Interest Rates and Recessions 1988-2012
0
1
2
3
4
5
6
7
8
9
10
88 89 90 91 92 93 94 95 96 97 98 99 00 01 02 03 04 05 06 07 08 09 10 11 12 13
0
1
2
3
4
5
6
7
8
9
10
Recession Baa Fed Funds 10-yr Treas
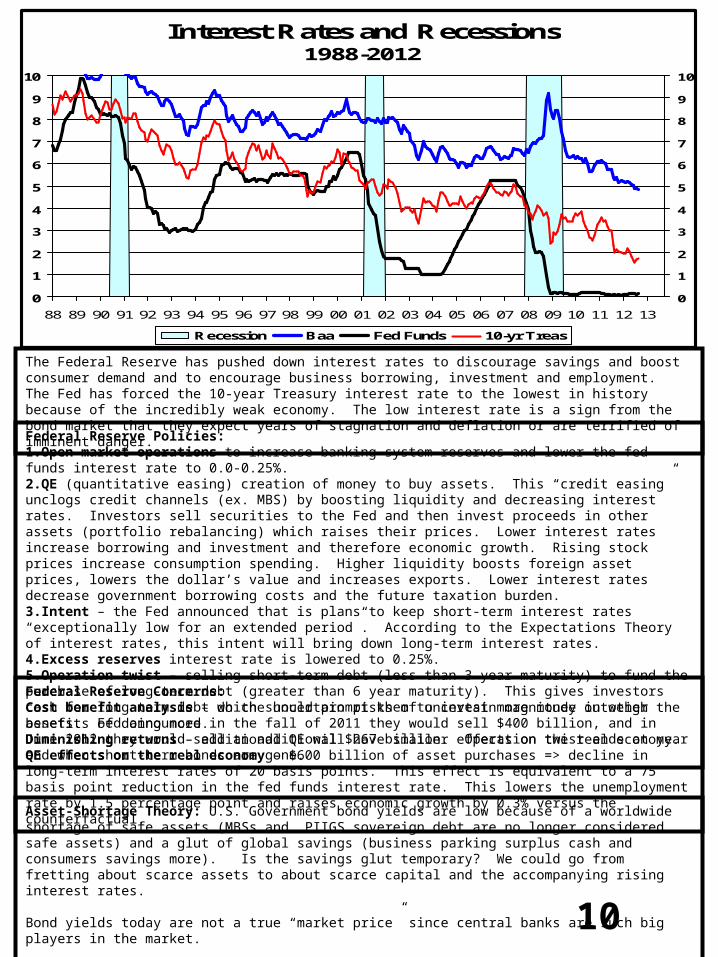
Asset-Shortage Theory: U.S. Government bond yields are low because of a worldwide shortage of safe assets (MBSs and PIIGS sovereign debt are no longer considered safe assets) and a glut of global savings (business parking surplus cash and consumers savings more). Is the savings glut temporary? We could go from fretting about scarce assets to about scarce capital and the accompanying rising interest rates.
Bond yields today are not a true “market price” since central banks are such big players in the market.
Asian central banks are helping to keep interest rates low as they recycle their foreign exchange reserves into government bonds.
The Federal Reserve has pushed down interest rates to discourage savings and boost consumer demand and to encourage business borrowing, investment and employment. The Fed has forced the 10-year Treasury interest rate to the lowest in history because of the incredibly weak economy. The low interest rate is a sign from the bond market that they expect years of stagnation and deflation or are terrified of imminent danger.
Federal Reserve Policies:1.Open market operations to increase banking system reserves and lower the fed funds interest rate to 0.0-0.25%.2.QE (quantitative easing) creation of money to buy assets. This “credit easing” unclogs credit channels (ex. MBS) by boosting liquidity and decreasing interest rates. Investors sell securities to the Fed and then invest proceeds in other assets (portfolio rebalancing) which raises their prices. Lower interest rates increase borrowing and investment and therefore economic growth. Rising stock prices increase consumption spending. Higher liquidity boosts foreign asset prices, lowers the dollar’s value and increases exports. Lower interest rates decrease government borrowing costs and the future taxation burden.3.Intent – the Fed announced that is plans to keep short-term interest rates “exceptionally low for an extended period”. According to the Expectations Theory of interest rates, this intent will bring down long-term interest rates.4.Excess reserves interest rate is lowered to 0.25%.5.Operation twist – selling short-term debt (less than 3 year maturity) to fund the purchase of long-term debt (greater than 6 year maturity). This gives investors cash for long-term debt which should prompt them to invest more money in other assets. Fed announced in the fall of 2011 they would sell $400 billion, and in June 2012 they would sell an additional $267 billion. Operation twist ends at year end when short-term bonds are gone.
Federal Reserve Concerns: Cost benefit analysis – do the uncertain risks of uncertain magnitude outweigh the benefits of doing more.Diminishing returns – additional QE will have smaller effects on the real economy.QE effects on the real economy - $600 billion of asset purchases => decline in long-term interest rates of 20 basis points. This effect is equivalent to a 75 basis point reduction in the fed funds interest rate. This lowers the unemployment rate by 1.5 percentage point and raises economic growth by 0.3% versus the counterfactual.
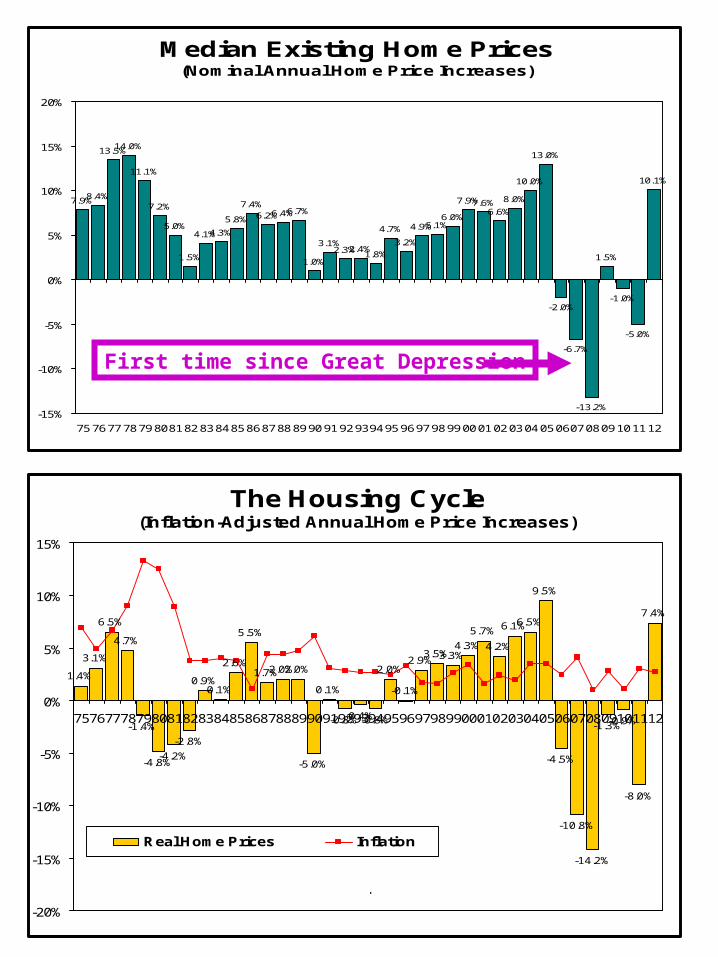
Median Existing Home Prices(Nominal Annual Home Price Increases)
7.9%8.4%
13.5%14.0%
11.1%
5.0%
1.5%
4.1%4.3%
5.8%
7.4%6.2%6.4%6.7%
1.0%
3.1%2.3%2.4%
1.8%
4.7%
3.2%
4.9%5.1%6.0%
7.9%7.6%6.6%
8.0%
10.0%
13.0%
-2.0%
-6.7%
-13.2%
1.5%
-1.0%
-5.0%
10.1%
7.2%
-15%
-10%
-5%
0%
5%
10%
15%
20%
7576777879808182838485868788899091929394959697989900010203040506070809101112Source: National Association of Realators.
First time since Great Depression
The Housing Cycle(Inflation-Adjusted Annual Home Price Increases)
1.4%
3.1%
6.5%
4.7%
-1.4%
-4.2%
-2.8%
0.9%0.1%
2.6%
5.5%
1.7%2.0%2.0%
-5.0%
0.1%
-0.8%-0.4%-0.8%
2.0%
-0.1%
2.9%3.5%3.3%
4.3%
5.7%
4.2%
6.1%6.5%
9.5%
-4.5%
-10.8%
-14.2%
-1.3%-0.9%
-8.0%
7.4%
-4.8%
-20%
-15%
-10%
-5%
0%
5%
10%
15%
7576777879808182838485868788899091929394959697989900010203040506070809101112
Real Home Prices Inflation
Source: National Association of Realators.
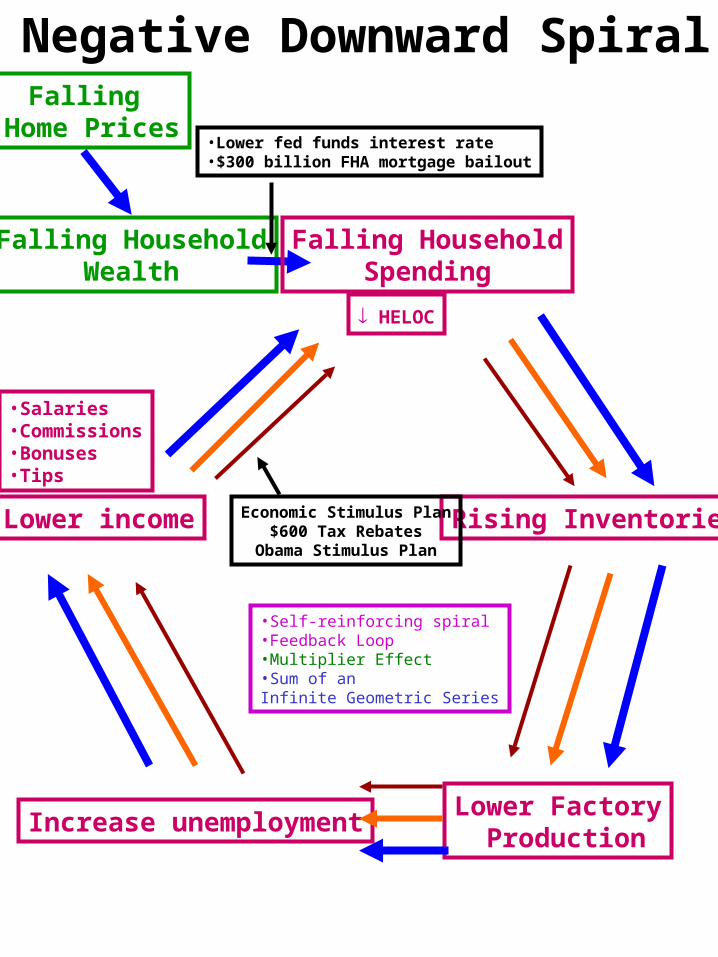
Falling Home Prices
Falling HouseholdWealth
Falling HouseholdSpending
Rising Inventories
Lower Factory Production
Increase unemployment
Lower income
Negative Downward Spiral
•Salaries•Commissions•Bonuses•Tips
Economic Stimulus Plan$600 Tax Rebates
Obama Stimulus Plan
•Lower fed funds interest rate•$300 billion FHA mortgage bailout
HELOC
•Self-reinforcing spiral•Feedback Loop•Multiplier Effect•Sum of an Infinite Geometric Series
13
Household Debt(As a Percent of Disposable Household Income)
40%
50%
60%
70%
80%
90%
100%
110%
120%
130%
140%
79 82 85 88 91 94 97 00 03 06 09 1240%
50%
60%
70%
80%
90%
100%
110%
120%
130%
140%
Source: BEA & Federal Reserve.
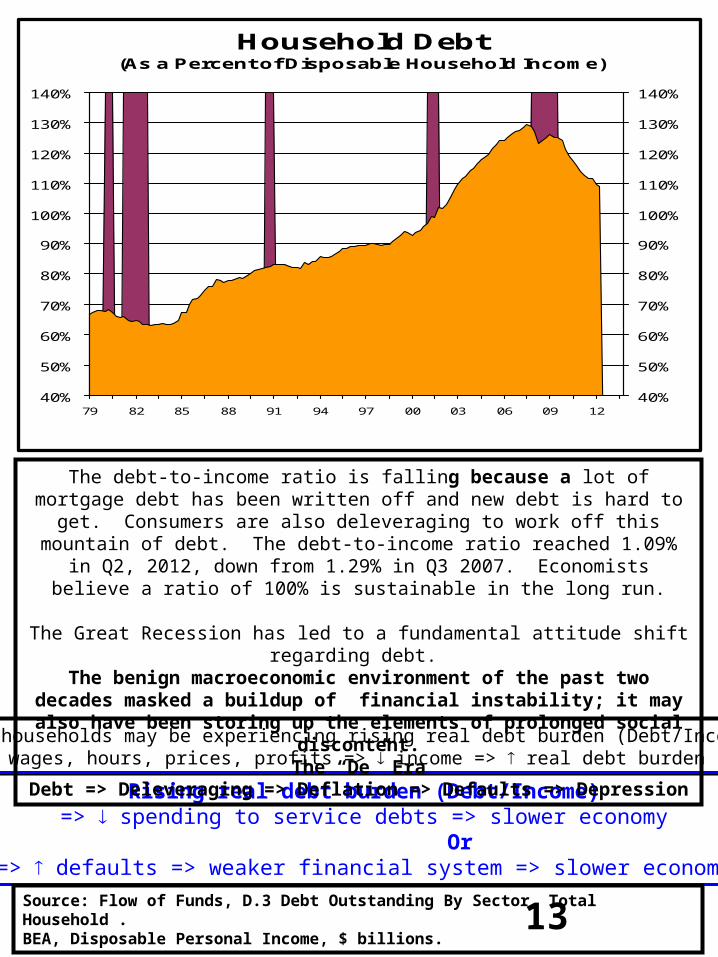
Some households may be experiencing rising real debt burden (Debt/Income) wages, hours, prices, profits => income => real debt burden
Rising real debt burden (Debt/Income)=> spending to service debts => slower economy
Or=> defaults => weaker financial system => slower economy
The debt-to-income ratio is falling because a lot of mortgage debt has been written off and new debt is hard to get. Consumers are also deleveraging to work off this mountain of debt. The debt-to-income ratio reached 1.09% in Q2, 2012, down from 1.29% in Q3
2007. Economists believe a ratio of 100% is sustainable in the long run.
The Great Recession has led to a fundamental attitude shift regarding debt. The benign macroeconomic environment of the past two decades masked a buildup of financial instability; it may also have been storing up the elements of prolonged
social discontent.The “De” Era
Debt => Deleveraging => Deflation => Defaults => Depression
Source: Flow of Funds, D.3 Debt Outstanding By Sector, Total Household . BEA, Disposable Personal Income, $ billions.
14
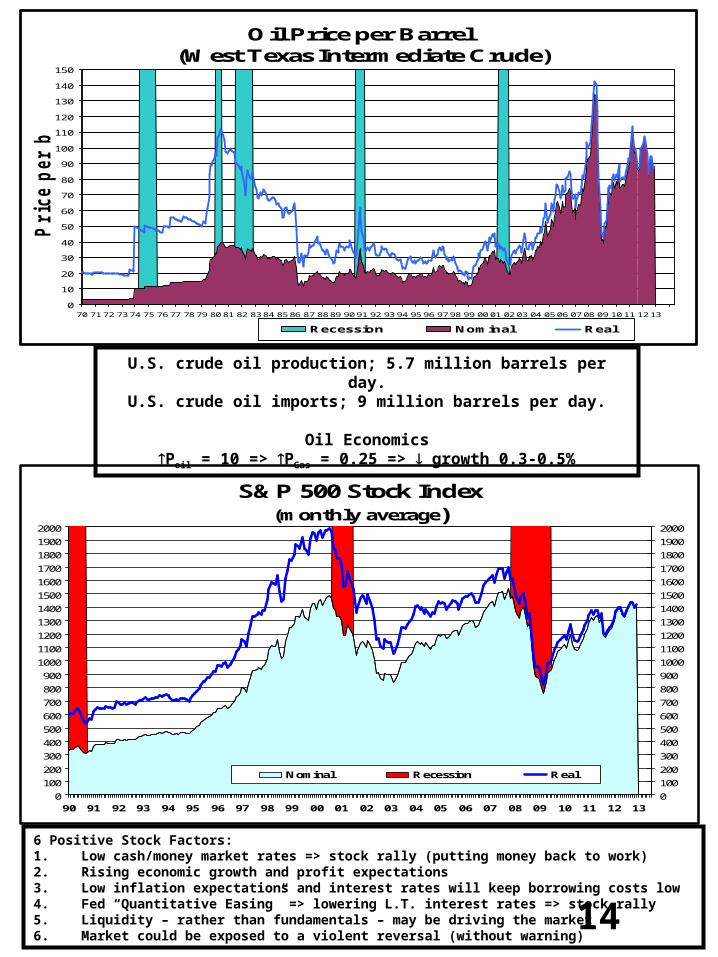
U.S. crude oil production; 5.7 million barrels per day.U.S. crude oil imports; 9 million barrels per day.
Oil EconomicsPoil = 10 => PGas = 0.25 => growth 0.3-0.5%
6 Positive Stock Factors: 1. Low cash/money market rates => stock rally (putting money back to work)2. Rising economic growth and profit expectations3. Low inflation expectations and interest rates will keep borrowing costs low4. Fed “Quantitative Easing” => lowering L.T. interest rates => stock rally5. Liquidity – rather than fundamentals – may be driving the market6. Market could be exposed to a violent reversal (without warning)
S&P 500 Stock Index(monthly average)
0
100
200
300
400
500
600
700
800
900
1000
1100
1200
1300
1400
1500
1600
1700
1800
1900
2000
90 91 92 93 94 95 96 97 98 99 00 01 02 03 04 05 06 07 08 09 10 11 12 130
100
200
300
400
500
600
700
800
900
1000
1100
1200
1300
1400
1500
1600
1700
1800
1900
2000
Nominal Recession Real
Oil Price per Barrel (West Texas Intermediate Crude)
0
10
20
30
40
50
60
70
80
90
100
110
120
130
140
150
70 71 72 73 74 75 76 77 78 79 80 81 82 83 84 85 86 87 88 89 90 91 92 93 94 95 96 97 98 99 00 01 02 03 04 05 06 07 08 09 10 11 12 13
Pric
e p
er b
arrel
Recession Nominal Real
Federal Government DebtHeld by Public
0.7 0.8 0.91.1
1.3
1.71.9
2.1 2.22.4
2.73.0
3.23.4
3.6 3.7 3.8 3.7 3.63.4 3.3
3.5
3.9
4.34.6
4.85.0
5.8
8.5
9.0
10.1
11.2
1.5
$0
$1
$2
$3
$4
$5
$6
$7
$8
$9
$10
$11
$12
$13
$14
80 84 88 92 96 00 04 08 12
$ T
rillio
n
20%
30%
40%
50%
60%
70%
80%
90%
100%
Per
cen
t
Dollar Amount
Percent of GDP
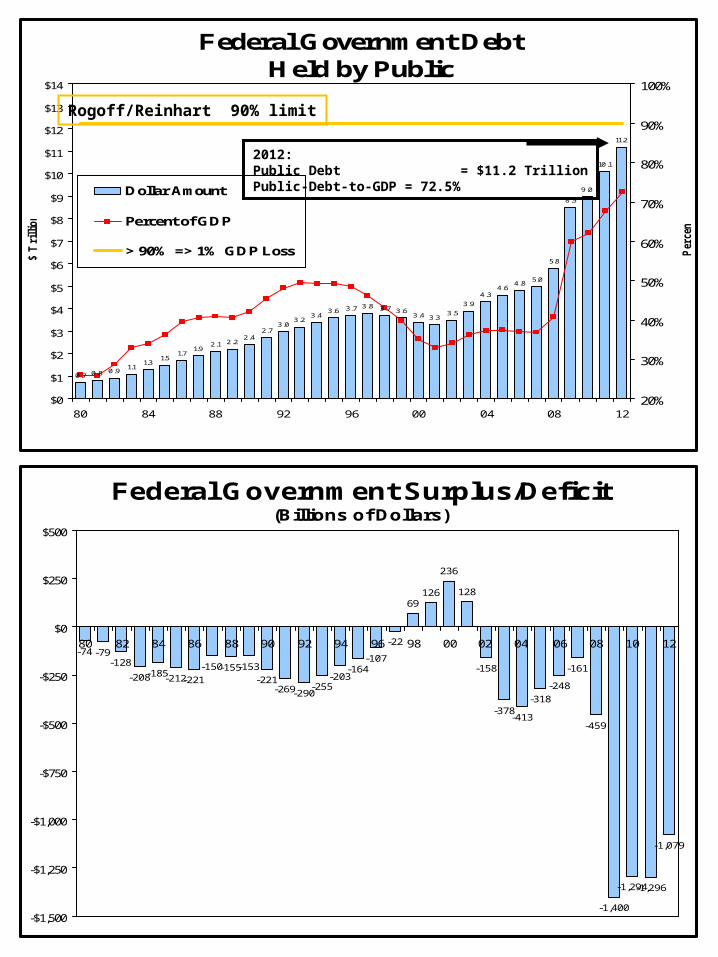
> 90% => 1% GDP Loss
2012:Public Debt = $11.2 TrillionPublic-Debt-to-GDP = 72.5%
Rogoff/Reinhart 90% limit
Federal Government Surplus/Deficit(Billions of Dollars)
-74 -79-128
-208-185-221
-150-155-153
-221-269-290
-255-203
-164-107
-22
69126
236
128
-158
-378-413
-318
-248
-161
-459
-1,400
-1,294-1,296
-1,079
-212
-$1,500
-$1,250
-$1,000
-$750
-$500
-$250
$0
$250
$500
80 82 84 86 88 90 92 94 96 98 00 02 04 06 08 10 12
Source: Congressional Budget Office.
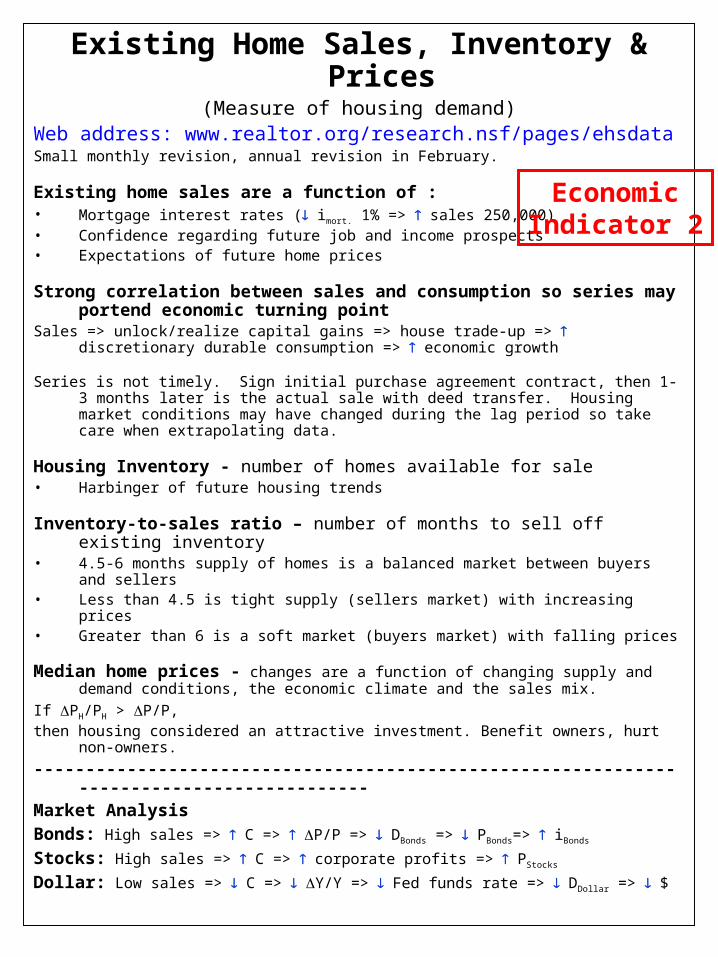
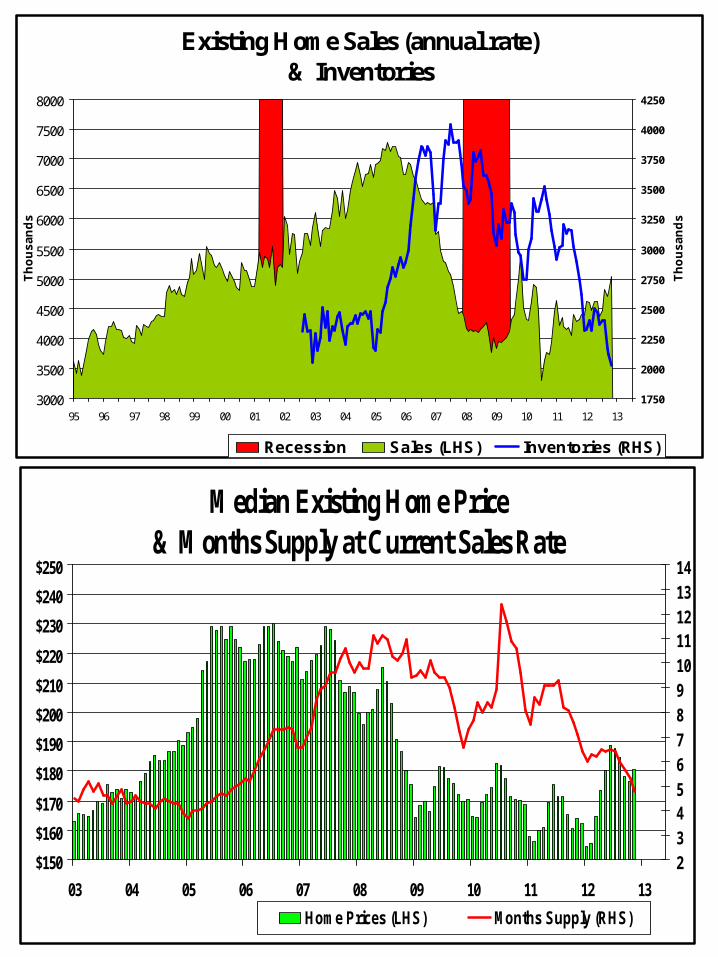
Existing Home Sales, Inventory & Prices(Measure of housing demand)
Web address: www.realtor.org/research.nsf/pages/ehsdataSmall monthly revision, annual revision in February.
Existing home sales are a function of :• Mortgage interest rates ( imort. 1% => sales 250,000)• Confidence regarding future job and income prospects• Expectations of future home prices
Strong correlation between sales and consumption so series may portend economic turning point
Sales => unlock/realize capital gains => house trade-up => discretionary durable consumption => economic growth
Series is not timely. Sign initial purchase agreement contract, then 1-3 months later is the actual sale with deed transfer. Housing market conditions may have changed during the lag period so take care when extrapolating data.
Housing Inventory - number of homes available for sale• Harbinger of future housing trends
Inventory-to-sales ratio – number of months to sell off existing inventory• 4.5-6 months supply of homes is a balanced market between buyers and sellers• Less than 4.5 is tight supply (sellers market) with increasing prices• Greater than 6 is a soft market (buyers market) with falling prices
Median home prices - changes are a function of changing supply and demand conditions, the economic climate and the sales mix.
If PH/PH > P/P, then housing considered an attractive investment. Benefit owners, hurt non-owners.
------------------------------------------------------------------------------------------Market AnalysisBonds: High sales => C => P/P => DBonds => PBonds=> iBonds
Stocks: High sales => C => corporate profits => PStocks
Dollar: Low sales => C => Y/Y => Fed funds rate => DDollar => $
EconomicIndicator 2
17
Existing Home Sales (annual rate)& Inventories
3000
3500
4000
4500
5000
5500
6000
6500
7000
7500
8000
95 96 97 98 99 00 01 02 03 04 05 06 07 08 09 10 11 12 13
Th
ou
sa
nd
s
1750
2000
2250
2500
2750
3000
3250
3500
3750
4000
4250
Th
ou
sa
nd
s
Recession Sales (LHS) Inventories (RHS)
Median Existing Home Price & Months Supply at Current Sales Rate
$150
$160
$170
$180
$190
$200
$210
$220
$230
$240
$250
03 04 05 06 07 08 09 10 11 12 13
234567891011121314
Home Prices (LHS) Months Supply (RHS)

Homework 1Due Tuesday, January 29 in Lecture
Pick one of the economic indicators presented in this handout and write a one page report on what impact it is having on the overall U.S. economy.