Embed Size (px)
Citation preview

Marine Pollution Bulletin 62 (2011) 1616–1621
Contents lists available at ScienceDirect
Marine Pollution Bulletin
journal homepage: www.elsevier .com/locate /marpolbul
Ecological status of seagrass ecosystems: An uncertainty analysis of themeadow classification based on the Posidonia oceanica multivariate index (POMI)
Scott Bennett a,⇑, Guillem Roca a, Javier Romero b, Teresa Alcoverro a
a Centro de Estudios Avanzados de Blanes, CSIC, C/ Acceso a la Cala St. Francesc 14, 17300 Blanes, Girona, Spainb Departamento de Ecología, Facultad de Biología, Universidad de Barcelona, Av. Diagonal 645, 08028 Barcelona, Spain
a r t i c l e i n f o
Keywords:Posidonia oceanicaSeagrassBiological indicatorsCoastal watersUncertainty analysisWater Framework Directive
0025-326X/$ - see front matter � 2011 Elsevier Ltd.doi:10.1016/j.marpolbul.2011.06.016
⇑ Corresponding author. Present address: UWA OceBiology, The University of Western Australia, 35 Sti6009, Australia. Tel.: +61 (0)8 6488 8118.
E-mail address: [email protected] (S.
a b s t r a c t
Quantifying the uncertainty associated with monitoring protocols is essential to prevent the misclassifi-cation of ecological status and to improve sampling design. We assessed the Posidonia oceanica multivar-iate index (POMI) bio-monitoring program for its robustness in classifying the ecological status of coastalwaters within the Water Framework Directive. We used a 7-year data set covering 30 sites along 500 kmof the Catalonian coastline to examine which version of POMI (14 or 9 metrics) maximises precision inclassifying the ecological status of meadows. Five factors (zones within a site, sites within a water body,depth, years and surveyors) that potentially generate classification uncertainty were examined in detail.Of these, depth was a major source of uncertainty, while all the remaining spatial and temporal factorsdisplayed low variability. POMI 9 matched POMI 14 in all factors, and could effectively replace it in futuremonitoring programs.
� 2011 Elsevier Ltd. All rights reserved.
1. Introduction
Degradation in water quality resulting from anthropogenic dis-turbance poses a large threat to both freshwater and marine eco-systems. In response to this, the European Union has developedthe Water Framework Directive (WFD), a trans-national strategyaimed at maintaining and, where necessary, recovering the waterquality of aquatic ecosystems across European member states.The main objective of the WFD is to achieve, at least, a ‘good eco-logical status’ for all water bodies across Europe by 2015. The con-cept of ‘ecological status’, as defined by the WFD, is the quality ofthe structure and functioning of aquatic ecosystems associatedwith surface waters. The ecological status is determined by moni-toring and assessing biological indicators relevant to the waterbody in question that are integrated into an index with the aimto detect temporal and spatial changes in water bodies. Underthe WFD, the values of this index, typically from zero to one, areused to classify each water body into one of five classes, frombad to high. However, a reliable biotic index should not only beable to detect change, but also know that the change it is detectingis meaningful and not an artefact of the methodology, sampling de-sign or execution. Uncertainty analyses are a useful tool to identifythe factors which contribute to the potential misclassification of
All rights reserved.
ans Institute, School of Plantrling Highway, Crawley, WA
Bennett).
the ecological status class of water bodies (Clarke and Hering,2006; Staniszewski et al., 2006), which could result in considerablesocial, economic and ecological losses to the region.
Within coastal waters, four biological quality elements (BQEs)have been identified: phytoplankton, macroalgae, angiospermsand benthic invertebrate fauna. These BQEs are sensitive to anthro-pogenic disturbances and, therefore, are potential indicators of theecological status within the water body. Seagrass ecosystems, andin particular for the Mediterranean Posidonia oceanica meadows,make an ideal BQE for monitoring ecological status because of theirhigh sensitivity to disturbance (Delgado et al., 1999; Francour etal., 1999; Ruiz et al., 2001; Ruiz and Romero, 2003), wide distribu-tion (Procaccini et al., 2003) and well understood biology and ecol-ogy (Romero et al., 2007). In regions of Spain and Croatia, the POMIindex (P. oceanica multivariate index; Romero et al., 2007) is usedto monitor, evaluate and classify the ecological status of coastalwater bodies. POMI incorporates 14 metrics from physiological,individual, population and community levels, making it sensitiveto both lethal and sub lethal stressors impacting multiple levelsof organisation (Martinez-Crego et al., 2008). These metrics areintegrated, using principal components analysis (PCA), into a singlevalue from which an EQR (ecological quality ratio, from zero toone) is obtained (Romero et al., 2007).
Posidonia oceanica meadows are dynamic systems, with a con-stant flux of intrinsic and extrinsic factors influencing their struc-ture and function over multiple spatial and temporal scales. Suchdynamics have the potential to obfuscate meaningful trends inecological status predictions, if the sources of variability are not
Mediterranean Sea
Catalonian coast
50 Km
1
12
17
15
13
1416
11
10
9
7654
32
8
Girona
Barcelona
Lleida
Tarragona
Fig. 1. Map of the location of the 30 sampling sites (small black dots) and 17 waterbodies along the Catalonian coast, where the index was applied.
S. Bennett et al. / Marine Pollution Bulletin 62 (2011) 1616–1621 1617
recognised and where possible, reduced. When designing a moni-toring program, decisions must be taken on how to assign the totalsampling effort within the allocated time and budget constraints.The number and distribution of replicates should be taken withthe objective of maximising precision in mind. For example, sea-grass meadows usually display horizontal heterogeneity (e.g. zonesof different density, structure, depth, etc.) within a meadow, andmultiple, spatially independent meadows may exist within a waterbody. Whilst it is expected that sites within a water body reflectsimilar ecological statuses, a certain level of variability among sitesis inevitable. Establishing a measure of the variability amongmeadows within a water body enables an estimation of the likelyprecision of ecological status estimates from water bodies whereonly a single site is present. Uncertainty analyses enable us to visu-alise how our sampling precision is influenced by alternative sam-pling designs. However, despite its fundamental importance, thereis little information on how these different scales and factors canbe used to minimise uncertainty in coastal waters, particularly inseagrass meadows.
The current study analyses uncertainty in classifying the eco-logical status of P. oceanica ecosystems, based on the POMI bio-monitoring program, with two key areas of focus. The first is tocompare POMI (hereafter referred to as POMI14) to a condensed9 metric version (POMI 9) to assess how uncertainty estimatesare affected by the reduction in the number of metrics. The secondarea of focus will be to determine which sources of variability (fac-tors) associated with the sampling design of the POMI monitoringprogram most greatly influence ecological status classifications ofP. oceanica meadows. The analyses will be based on a seven yeardata series that includes over 30 meadows and the factors analysedwill include spatial scales of sampling (variability among zoneswithin a meadow, among meadows within a water body, variabil-ity among depths), the temporal scale of sampling (variabilityamong years) and the human-associated source of error (variabil-ity between surveyors). These five factors represent some the keysources of variability associated with the design and implementa-tion of a regional scale bio-monitoring program, and highlight howcertain elements of a sampling design can influence the precisionand the probability of misclassifying the ecological status of coastalwater bodies.
2. Materials and methods
2.1. Site selection and sampling
Bio-monitoring data from P. oceanica meadows were collectedfrom 30 sites spanning 500 km of the Catalonian coastline (Spain).Sampling took place in autumn (September–October) throughoutthe years 2002–2009, with the exception of 2004, when samplingtook place during early summer (June) and was, therefore, ex-cluded from the analysis. Sites used in the study covered a wideenvironmental gradient and a broad ecological status range, repre-senting 17 coastal water bodies along the Catalonian coastline(Fig. 1). The spatial extent and division of coastal water bodyboundaries are classified by the WFD according to the water qual-ity and anthropogenic pressures to which the coastline is exposed,independent of the number, or status, of seagrass meadows withinthe area per se. The number of sites within a water body rangesfrom 1 to 7 along the Catalonian coastline and sites within a waterbody can be up to 50 km apart. Within each site, 14 biological met-rics were determined for POMI. Among them, 5 metrics are repre-sentative of the physiological level (phosphorous, nitrogen andsucrose content and d15N and d34S isotopic ratios in rhizomes); 2of the individual level (percentage of leaves with necrosis andshoot leaf surface area); 3 of the population level (meadow cover,
shoot density and percent of plagiotrophic rhizomes); 1 of thecommunity level (nitrogen content in the epiphytes) and 3 are pol-lution indicators (copper, lead and zinc concentration in rhizomes).POMI 9 was based on the same group of metrics as POMI 14,excluding, however, phosphorous and nitrogen content in rhi-zomes, copper and zinc concentrations in rhizomes and percentof plagiotrophic rhizomes. POMI 9 attempts to minimise theredundancy of metrics within the different organisational levelspresent in POMI 14, whilst retaining a high sensitivity to change.
2.2. Classification of the ecological status
To determine the ecological status class of P. oceanica meadows,each meadow (site) was scored on a scale from 0 (worst conditions,BQE severely damaged or missing) to 1 (optimal reference condi-tions of BQE). Scores were obtained as EQRs (ecological quality ra-tio), which is the ratio between the POMI scores from a given siteand the scores for the reference conditions. To do this (1) referenceconditions for each POMI metric were identified and (2) POMI met-rics were combined onto a single scale (see below). In the currentstudy, the reference conditions were taken to be the mean value ofthe best three scores for each respective metric, following Romeroet al. (2007). Similarly, the worst condition of each metric was re-corded as the mean value of the three worst scores for that partic-ular metric. Note that optimal conditions reflected either high orlow values depending on the metric in question (e.g. high shootdensity is optimal whilst low lead concentration is optimal). Met-rics for POMI 9 and POMI 14 were each combined onto a singlescale using principal component analyses (PCA). The resultantscore of each sampling site, on the first axis of the PCA was thenused to calculate its EQR and determine its ecological status class.EQRs were calculated for each site using the equation:
EQR0x ¼ ðCIx � CIworstÞ=ðCIoptimal � CIworstÞ ð1Þ
where EQR0 is the ecological quality ratio of site x, CIx, CIworst andCIoptimal are the scores of site x, the worst reference site and theoptimal reference site on the first component respectively.
The ecological status of each site was classified into one of fiveclasses from ‘high’ to ‘bad’, set within the 0–1 EQR scale. Because ofits sensitivity to anthropogenic disturbance, P. oceanica does notsurvive in extremely bad conditions, therefore, no matter how de-graded the meadow, all sites used in the current study were con-sidered better than ‘bad’ (because P. oceanica was present). TheEQR for the ‘‘bad’’ class was set to the range 0–0.1, and the upperfour status class boundaries were determined by dividing the

1618 S. Bennett et al. / Marine Pollution Bulletin 62 (2011) 1616–1621
remaining EQR scale (0.1–1) into four equal categories, followingRomero et al. (2007). The EQR of each site was, therefore, classifiedinto one of the upper four status classes using the equation:
EQRx ¼ ðEQR0 þ 0:11Þ=ð1þ 0:10Þ ð2Þ
2.3. Variability within factors
The five factors examined in the current study that potentiallycontribute to the uncertainty of the EQR estimations of coastalwater bodies include variability among (1) zones within a site(meadow), (2) sites within a water body, (3) depths, (4) yearsand (5) surveyors. In total, 30 sites were sampled from 17 waterbodies. Within each site three zones were sub-sampled. In the an-nual monitoring program, metric values are averaged among zonesto provide robust estimates within each site. For the purpose of thestudy, however, inter-zonal variation was estimated to establishestimates of small scale meadow heterogeneity. Inter-annual vari-ation in mean EQR scores was estimated among the years 2002–2009, with the exception of 2004 (to avoid potential inter-seasonalvariation). Variation in depth ranged between 10 and 17 m(14.63 ± 0.28 m, mean ± SE) among stations, throughout the stan-dard annual POMI monitoring program. In addition to this, how-ever, during 2002 POMI scores were estimated from 5 m zones infour sites. The 5 m POMI scores were included to observe the var-iability across a broad depth range. Variation between ‘surveyors’was estimated by comparing POMI values between two trained,skilled surveyors from 30 sites during 2008 and 16 sites during2009. Of the POMI metrics, only estimations of meadow cover weresubject to variation between surveyors. To account for that vari-ability each replicate quadrat was sampled by both divers (seeMartinez-Crego et al. (2008) for methodology). POMI 14 and POMI9 were calculated for each surveyor, by using their respective mea-dow cover estimates in the PCA, whilst maintaining the same val-ues for the remaining metrics.
The total variance and variance components associated witheach factor were estimated for POMI 14 and POMI 9 using a linearmixed effects model in the lme4 package of R (Bates, 2005, 2007,Version 2.10.1, R_Development_Core_Team 2009). The spatial fac-tors were treated as random nested intercepts, with zones nestedwithin sites and sites nested within water bodies. Note that thevariability among water bodies, whilst important in the analysisof variance components is not presented in the results of this studybecause the WFD is interested in the status of BQE’s up to the spa-tial scale of water bodies, not among water bodies, which by defi-nition should differ in their ecological status. The remaining threefactors, ‘year’, ‘depth’ and ‘surveyor’ were each treated as randomcrossed intercepts. Variance components were determined by cal-culating the proportion of the total variance (r2
T) explained by eachindividual factor. Total variance in EQR for each POMI was givenby:
r2T ¼ r2
Z þ r2Si þ r2
WB þ r2Y þ r2
Su þ r2D þ r2
R ð3Þ
where r2 = variance due to differences in mean EQR values amongzones (r2
Z) within a site, among sites (r2Si) within a water body,
among water bodies (r2WB), among years (r2
Y), between surveyors(r2
Su), among depths (r2D), and the residual variance (r2
R) in meanEQR values not explained by the model. The proportion of total var-iance (Psamp) explained by each factor was given by the equation,following Clarke et al. (2006):
Psamp ¼ 100r2x=r
2T ð4Þ
Finally, the total variance estimates associated with the classifi-cation within individual water bodies monitored by POMI wasdetermined for two different sampling designs by summing the
variances of the contributing factors. Ecological status predictionsbased on the current monitoring program along the Cataloniancoastline (controlled design, r2
CD) is subject to uncertainty in clas-sification based on the variability among meadow depths (10–17 m) and among sites within a water body
r2CD ¼ r2
Si þ r2D� ð5Þ
whereby r2D� is the variance due to differences in mean EQR value
among the different depths from sites used in the annual monitor-ing program (10–17 m). Inter-zonal, inter-annual and inter-sur-veyor variability was incorporated into this design by averagingmetric values among multiple replicate zones, multiple years andwith multiple surveyors to provide robust estimates of the ecolog-ical status class of each water body and, therefore, were not consid-ered in total variance estimations. Total variance estimates of asecond, hypothetical ‘uncontrolled design’ (r2
UD) where variabilityamong zones, years, surveyors and a broader depth range (5–15 m) are not controlled for, was simulated by the equation:
r2UD ¼ r2
Z þ r2Si þ r2
Y þ r2Su þ r2
D ð6Þ
This equation demonstrates the variability that would be impli-cit in a sampling design where depth was not controlled amongsites, or where only a single zone within a site was monitored.The resultant EQR score for a water body, under such a samplingdesign, would not account for the natural variability therein, andwould be exposed to a higher probability of misclassifying the eco-logical status of the water body. All data adequately satisfied theassumption of homogeneity of variance based on plots of the resid-uals against the fitted EQR values, therefore, no transformation ofthe data took place.
2.4. Analysis of uncertainty
Having calculated the variability within each factor and index,the uncertainty in ecological status classification was estimatedusing STARBUGS (STAR bioassessment uncertainty guidance soft-ware, Clarke, 2004). STARBUGS helps determine whether an ob-served ecological status classification is indeed the most probableclassification for a particular site, given the inherent sources of var-iability. STARBUGS sums the observed value for a given site with arandom standard normal deviate, of the known SD, with a mean ofzero (Clarke and Hering, 2006). It repeats this simulation 104 timesto produce a frequency distribution of possible EQR values for theparticular site or water body: The simulated EQR values aregrouped into their corresponding status classes, from which theprobability of misclassifying the original observed value can bedetermined. Because the current study was interested in the uncer-tainty in classification generated by particular factors (rather thanthe probability of misclassifying individual sites), the simulationwas repeated for the full range of possible observed EQR values(0–1).
3. Results
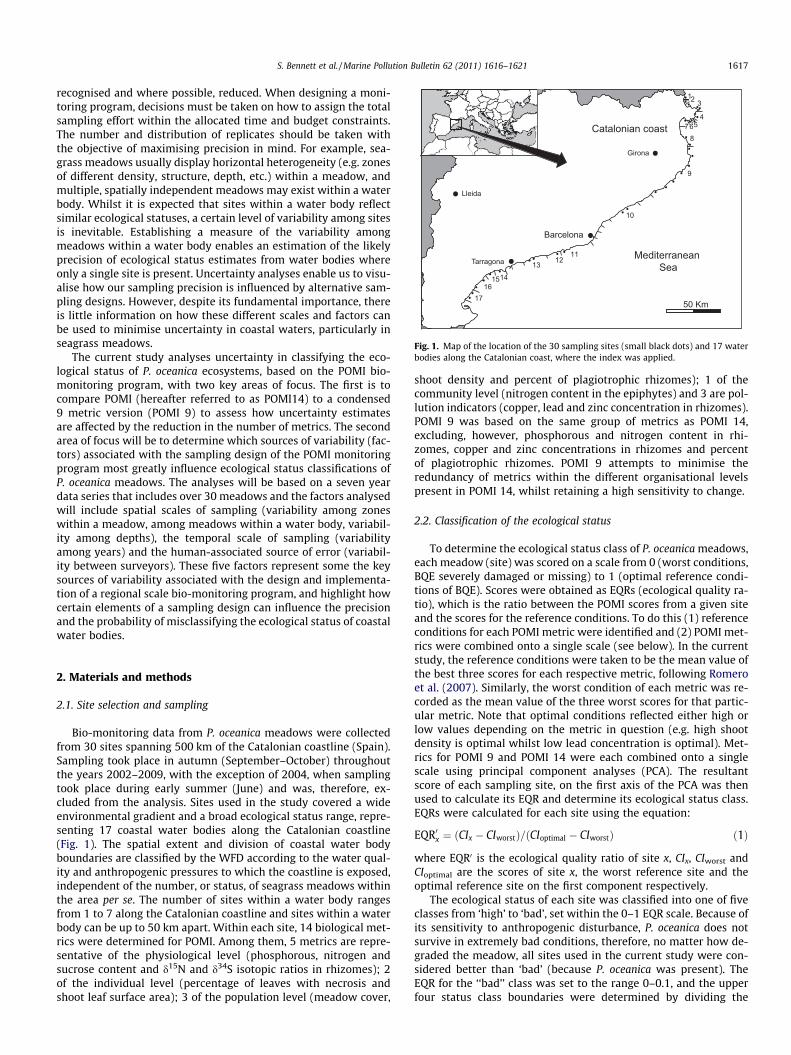
The factors ‘surveyor’, ‘year’, ‘site’ and ‘zone’ displayed rela-tively low levels of uncertainty in the ecological status classifica-tion of water bodies based on both POMI 9 and POMI14, whilst‘depth’ resulted in relatively high probability of misclassification(Fig. 2). The probability of misclassification, for all five factors,peaks when a site’s observed EQR score is very close to the bound-ary between two status classes, reaching values of 50%. Similarly,when the observed EQR falls in the middle of a status class theprobability of misclassification declines to as low as <0.001%,depending on the variability in EQR scores associated to the factor
Zone
0.0 0.2 0.4 0.6 0.8 1.00
10
20
30
40
50
60
70
Site
0.0 0.2 0.4 0.6 0.8 1.0
Year
0.0 0.2 0.4 0.6 0.8 1.0
Prob
abilit
y of
mis
clas
sify
ing
a w
ater
bod
y (%
)
0
10
20
30
40
50
60
70
DepthEQR
0.0 0.2 0.4 0.6 0.8 1.0
Surveyor
EQR
0.0 0.2 0.4 0.6 0.8 1.0
0
10
20
30
40
50
60
70
Bad Poor Moderate Good High Bad Poor Moderate Good High
Ecological status class
(a) (b)
(c)
(e)
(d)
Fig. 2. Probability of misclassifying the ecological status class given the variability among mean EQR values calculated by POMI; (a) among zones within sites, (b) among siteswithin water bodies (c) among years, (d) among surveyors and (e) among depths. Bold and dotted lines represent POMI 14 and POMI 9, respectively. Vertical dashed linesrepresent the boundaries of each status class. Bad = EQR values from 0 to 0.099, poor = 0.1 to 0.324, moderate = 0.325 to 0.54, good = 0.55 to 0.774 and high = 0.775 to 1.
Table 1Results of linear mixed effects model fit by restricted maximum likelihood (REML).Untransformed POMI EQR scores analysed as a function of six random effects. POMI14 (P14) and POMI 9 (P9) were analysed separately. Colon between factors representsnesting (i.e. Site:WB signifies that site is nested within water body).
Groups Name Variance Std. dev. Psamp
P14 P9 P14 P9 P14 P9
Zone:(Site:WB) (Intercept) 0.002 0.005 0.039 0.070 3.5 11.6Site:WB (Intercept) 0.002 0.000 0.044 0.009 4.6 <1WB (Intercept) 0.015 0.019 0.121 0.137 34.4 44.5Year (Intercept) 0.002 0.002 0.046 0.045 4.9 4.8Surveyor (Intercept) 0.000 0.000 0.003 0.005 <1 <1Depth (5–17 m) (Intercept) 0.011 0.010 0.106 0.098 26.4 22.7Residual 0.011 0.007 0.106 0.083 26.3 16.1
0Deptha (10–
17 m)(Intercept) 0.000 0.00 0.000 0.00 <1 0
a Depth represents the variability in mean EQR scores explained by depthsbetween 10 and 17 m and is based on the same analysis, without 5 m sites.
S. Bennett et al. / Marine Pollution Bulletin 62 (2011) 1616–1621 1619
in question. The higher the variability, the higher its probability ofmisclassification even in the centre of the status class ranges.
Among the nested factors, variability among zones and amongsites both demonstrated relatively low variability for both POMI14 and POMI 9 (Table 1). This corresponded with 610% probabilityof misclassification in the centre of the status class range, based onthe variability among zones (Fig. 2a), and <2% probability of mis-classification based on the variability among sites, for both POMI14 and POMI 9 (Fig. 2b). In contrast, the highest levels of variabilitywere observed in the mean EQR scores among different waterbodies, which explained 34.4% and 44.5% of total variability forPOMI 14 and POMI 9 respectively (Table 1). Among the crossedintercepts variability was low among years (�5% of total variabil-ity) and in particular among surveyors (<1% of total variability)for both POMI 14 and POMI 9 (Table 1). This corresponded to aminimum probability of misclassification of <2% for both factorsunder each version of POMI (Fig. 2c and d). ‘Depth’, in contrast gen-erated relatively high uncertainty, with mean EQR values amongdepths of 5–17 m explaining 26.4% and 22.7% of the total variance

EQR
0.0 0.2 0.4 0.6 0.8 1.0
Prob
abilit
y of
mis
clas
sify
ing
a W
B (%
)
0
10
20
30
40
50
60
70uncontrolled designcontrolled design
4
15
16
1217
7
7
12
17
13
13
1415
14
6 3
19
3
2
19
8
8
6
5
5
4
16 2
10
1011
11
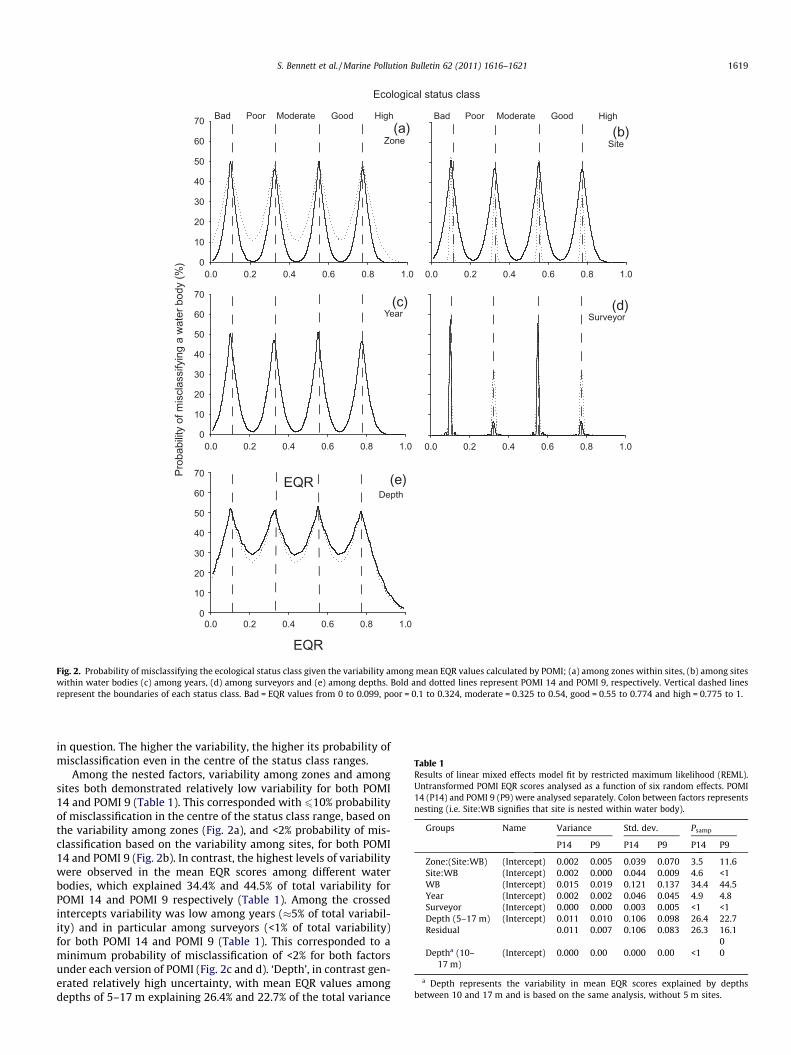
Fig. 3. Probability of misclassifying the ecological status class given the totalvariability among mean EQR values calculated by POMI 14 based on a ‘controlledsampling design’ and an ‘uncontrolled design’. The controlled design representsamong site variation and among depth (10–17 m) variation. The uncontrolleddesign represents cumulative variation, among zones, among sites, among years,among depths (5–17 m) and among surveyors. Full and open circles represent theactual probability of misclassification for 17 Catalonian coastal water bodies.Numbers represent the water body (Fig. 1). Probabilities are based on the 2008 dataseries.
1620 S. Bennett et al. / Marine Pollution Bulletin 62 (2011) 1616–1621
for POMI 14 and POMI 9 respectively and a minimum probability ofmisclassification of >25% for both versions of POMI (Fig. 2e).
The total within-water body variation based on the annualmonitoring program of Catalonian P. oceanica meadows wasSD = 0.04 for the ‘controlled design’ (Eq. (5)) and SD = 0.13 for the‘uncontrolled design’ (Eq. (6)). The probability of misclassifyingthe ecological status class of a water body ranged from a minimumof 1% for the controlled design, compared to a minimum of 38.4%probability of misclassification for the uncontrolled design. Thestark difference in uncertainty between the two sampling designsis made evident by observing the superimposed probabilities ofmisclassification of the EQR scores from 2008 (Fig. 3). Water bodieswith an EQR score close to the centre of the status class range (e.g.9, 11 and 13) vary by over 35% in their probability of misclassifi-cation. Water bodies with an EQR close to the status classboundary (e.g. 5), however, are prone to a high probability of mis-classification (� 50%) irrespective of the sampling design.
4. Discussion
Identifying and gauging the sources of uncertainty inherent inthe assessment of ecosystem health is critical in monitoring pro-grams, especially when these programs can result in managementdecisions with high social and economic costs. To the best of theauthors’ knowledge, the current study is the first uncertainty anal-ysis of its kind to have been conducted in coastal marine systemswithin the WFD member states. Overall, among the five factorsexamined, variations in depth between 5 and 15 m added the high-est levels of uncertainty to the ecological status classification of P.oceanica meadows, accounting for over 20% of total variabilityamong EQR scores and approximately 60% of total variability inestimation within water bodies. Depth, therefore, should remainfixed or be controlled in monitoring programs based on P. oceanica(see Montefalcone et al., 2007, 2009, 2010 for examples). The highlevels of uncertainty associated with classifying the status of a P.oceanica meadows based on monitoring at variable depths is con-sistent with previous reports on the effect of depth on seagrassmeadows. Seagrass meadows vary dramatically between depths
as a result of light attenuation (Duarte, 1991), nutrient availability(Alcoverro et al., 2001) and high rates of herbivory in shallow (5 m)depths compared to the deep sites (i.e. 15 m, Martinez-Crego et al.,2010; Prado et al., 2007; Tomas et al., 2005) which in turn can af-fect the leaf biomass (Olesen et al., 2002), shoot density (West,1990) and epiphytic community structure (Martinez-Crego et al.,2010). A meadow which has been sampled at multiple depths,therefore, results in highly variable EQR scores, independent ofany anthropogenic induced changes to the environment, therebyinhibiting the ability to assess the true ecological status of the sys-tem and greatly increasing the probability of misclassification.
For the remaining factors, the uncertainty surrounding esti-mates in ecological status classification, based on the POMI sam-pling design was very low within water bodies. This signifies thatas long as depth is fixed at approximately 15 m, POMI can be a pre-cise indicator of ecological health status at the water body scalealong the Catalonian coastline and that greater spatial replicationwill not dramatically influence the precision of water body statusestimations. However, certain factors are relatively easy to accountfor in a sampling design by increasing replication, without increas-ing the time or financial expense of the monitoring program. Forexample, monitoring multiple zones within a single meadow (i.e.at 0 m, 25 m and at 50 m along a transect) helps to absorb partof the within-meadow heterogeneity, by providing a more robustestimate of the values of the different metrics than if just a singlepoint is monitored. As this replication is achievable within a singlescuba dive, increasing the precision of ecological status estimatescan be achieved without incurring greater costs. Increasing thesampling effort in order to increase the precision of other factors,however, will substantially increase the time and expense of amonitoring program, without greatly reducing uncertainty and,therefore, should be considered in light of local or regional con-straints. For example, inter-annual variability over a 3-year periodis relatively low, contributing just 12% to total within water bodyvariability. If yearly sampling is not possible, due, for instance, tofinancial constraints, it should be taken into account that samplingonce every three years should not greatly reduce the precision ofecological status estimates, based on the two POMI indices exam-ined in the current study. Furthermore, POMI 9 and POMI 14 dem-onstrated similar estimates of uncertainty for each of the factorsobserved in the study. POMI 9 could, therefore, be a cost effectivealternative to POMI 14 pending further studies to test its viabilitydetecting meaningful ecological change.
It is important to keep in mind, however, that irrespective of thefactor or index in question, if the observed EQR score falls close to astatus class boundary the probability of misclassification may stillbe as high as 50%. For example, variability in mean EQR scores be-tween different surveyors was extremely low, explaining less than1% of total variability. In spite of such low variability, however,‘surveyor’ recorded up to 50% probability of misclassification atstatus class boundaries. The low variability between surveyors ob-served in the current study contrasts with a similar study on mac-rophyte communities in freshwater streams, which foundmoderate to high probability of misclassification of water bodiesamong surveyors (15–40% at the status class mid-point, Staniszew-ski et al., 2006). Unlike in Staniszewski et al. (2006), however,POMI is not based in any taxonomic identification; rather, the onlydirectly attributable source of variation among surveyors camefrom estimates of meadow cover. Raw differences in meadow cov-er estimates were relatively low among surveyors and combinedwith the 8–13 additional metrics to form POMI 9 and POMI 14,respectively, between surveyors variability is minimised in finalEQR estimations.
The current study has demonstrated how certain factors influ-ence the precision or uncertainty when classifying the ecologicalstatus classes for P. oceanica meadows. Such analyses, however,

S. Bennett et al. / Marine Pollution Bulletin 62 (2011) 1616–1621 1621
cannot describe the accuracy of the indices predictions. A func-tional index should be a balance between one that will detectchange at practical spatial and temporal scales for managementand one that will reduce uncertainty in classification. An index,for example, that only monitors meadow cover, may generate verylow uncertainty, however, respond too slowly to changes in waterquality to provide constructive feedback to managers. Future stud-ies must continue to weigh up the tradeoffs between detectingmeaningful change and reliable classification ecosystem health.
5. Conclusions
The findings from the current study indicate that variations indepth between 5 and 15 m contribute relatively high levels ofuncertainty to the ecological status classification P. oceanica mead-ows. These results emphasise the importance of controlling thesampling depth in P. oceanica meadows monitoring programs.Low variability among zones within sites and among sites withinwater bodies, suggests that both POMI 14 and POMI 9 are precisemonitoring indices at the scale of water bodies along the Catalo-nian coastline.
Acknowledgements
We thank all the different people involved in the long-termmonitoring for their work in the field and laboratory. We alsothank Ralph Clarke, Michael Dunbar and Jordi Pages for their assis-tance in statistical analyses. This research was financially sup-ported by l’Agencia Catalana de l’Aigua and WISER (Water bodiesin Europe: Integrative Systems to assess Ecological status andRecovery) funded under the 7th EU Framework Programme, Theme6, Environment including Climate Change, Contract No.: 226273).
References
Alcoverro, T., Cerbian, E., Ballesteros, E., 2001. The photosynthetic capacity of theseagrass Posidonia oceanica: influence of nitrogen and light. Journal ofExperimental Marine Biology and Ecology 261, 107–120.
Bates, D., 2005. Fitting linear mixed models in R. R News 5(1), 27–30. <http://CRAN.R-project.org/doc/Rnews/>.
Bates, D., 2007. lme4: Linear mixed-effects models using S4 classes. R packageversion 0.99875-9. <http://CRAN.R-project.org>.
Clarke, R.T., 2004. STARBUGS 1.1 (STAR bioassessment uncertainty guidancesoftware). Error/uncertainty module software, Centre for Hydrology andEcology in Dorset (CEH).
Clarke, R.T., Hering, D., 2006. Errors and uncertainty in bioassessment methods –major results and conclusions from the STAR project and their applicationusings STARBUGS. Hydrobiologia 566, 433–439.
Clarke, R.T., Davy-Bowker, J., Sandin, L., Friberg, N., Johnson, R.K., Bis, B., 2006.Estimates and comparisons of the effects of sampling variation using ‘national’macroinvertebrate sampling protocols on the precision of metrics used toassess ecological status. Hydrobiologia 566, 477–503.
Delgado, O., Ruiz, J.M., Pérez, M., Romero, J., Ballesteros, E., 1999. Effects of fishfarming on seagrass (Posidonia oceanica) beds in a Mediterranean bay: seagrassdecline after organic matter cessation. Oceanologica Acta 22 (1), 109–117.
Duarte, C.M., 1991. Seagrass depth limits. Aquatic Botany 40, 363–377.Francour, P., Ganteaume, A., Poulain, M., 1999. Effects of boat anchoring in Posidonia
oceanica seagrass bed in the Port-Cros National Park (north-westernMediterranean Sea). Aquatic Conservation: Marine and FreshwaterEcosystems 9, 391–400.
Martinez-Crego, B., Vergés, A., Alcoverro, T., Romero, J., 2008. Selection of multipleseagrass indicators for environmental biomonitoring. Marine Ecology ProgressSeries 361, 93–109.
Martinez-Crego, B., Prado, P., Alcoverro, T., Romero, J., 2010. Composition ofepiphytic leaf community of Posidonia oceanica as a tool for environmentalbiomonitoring. Estuarine, Coastal and Shelf Sciences 88, 199–208.
Montefalcone, M., Albertelli, G., Morri, C., Bianchi, C.N., 2007. Urban seagrass: statusof Posidonia oceanica facing the Genoa city waterfront (Italy) and implicationsfor management. Marine Pollution Bulletin 54, 206–213.
Montefalcone, M., Albertelli, G., Morri, C., Parravicini, V., Bianchi, C.N., 2009. Legalprotection is not enough: Posidonia oceanica meadows in marine protectedareas are not healthier than those in unprotected areas of the northwestMediterranean Sea. Marine Pollution Bulletin 58, 515–519.
Montefalcone, M., Albertelli, G., Morri, C., Bianchi, C.N., 2010. Pattern of wide-scalesubstitution within Posidonia oceanica meadows of NW Mediterranean sea:invaders are stronger than natives. Aquatic Conservation: Marine andFreshwater Ecosystems 20, 507–515.
Olesen, B., Enríquez, S., Duarte, C.M., Sand-Jensen, K., 2002. Depth-acclimation ofphotosynthesis, morphology and demography of Posidonia oceanica andCymodocea nodosa in the Spanish Mediterranean Sea. Marine Ecology ProgressSeries 236, 89–97.
Prado, P., Tomas, F., Alcoverro, T., Romero, J., 2007. Extensive direct measurementsof Posidonia oceanica defoliation confirm the importance of herbivory intemperate seagrass meadows. Marine Ecology Progress Series 340, 63–71.
Procaccini, G., Buia, M.C., Gambi, M.C., Pérez, M., Pergent-Marini, C., Romero, J.,2003. The seagrasses of the western Mediterranean. In: Green, E.P., Short, F.T.(Eds.), World Atlas of Seagrasses. University of California Press, Berkeley, USA,pp. 48–58, 298.
Romero, J., Martínez-Crego, B., Alcoverro, T., Pérez, M., 2007. A multivariate indexbased on the seagrass Posidonia oceanic (POMI) to assess ecological status ofcoastal waters under the Water Framework Directive (WFD). Marine PollutionBulletin 55, 196–204.
Ruiz, J., Pérez, M., Romero, J., 2001. Effects of fish farm loadings on seagrass(Posidonia oceanica) distribution, growth and photosynthesis. Marine PollutionBulletin 42 (9), 749–760.
Ruiz, J.M., Romero, J., 2003. Effects of disturbances caused by coastal constructionson spatial structure, growth dynamics and photosynthesis of the seagrassPosidonia oceanica. Marine Pollution Bulletin 46, 1523–1533.
Staniszewski, R., Szoszkiewicz, K., Zbierska, J., Lesny, J., Jusik, S., Clarke, R.T., 2006.Assessment of sources of uncertainty in macrophyte surveys and theconsequences for river classification. Hydrobiologia 566, 235–246.
Tomas, F., Turon, X., Romero, J., 2005. Seasonal and small-scale spatial variability ofherbivory pressure on the temperate seagrass Posidonia oceanica. MarineEcology Progress Series 301, 95–107.
West, R.J., 1990. Depth-related structural and morphological variations in anAustralian Posidonia seagrass bed. Aquatic Botany 36 (2), 153–166.