Embed Size (px)
Citation preview
Ecological Impact of Nutrients Ecological Impact of Nutrients from Shrimp Farmsfrom Shrimp Farms
Mark O’DonohueMark O’Donohue,, Adrian Jones, Simon CostanzoAdrian Jones, Simon Costanzo,, Michele Burford, Pat Glibert,Michele Burford, Pat Glibert, Judy O’Neil, Cindy HeilJudy O’Neil, Cindy Heil
& & William DennisonWilliam Dennison
Marine BotanyMarine Botany
THE UNIVERSITYOF QUEENSLAND
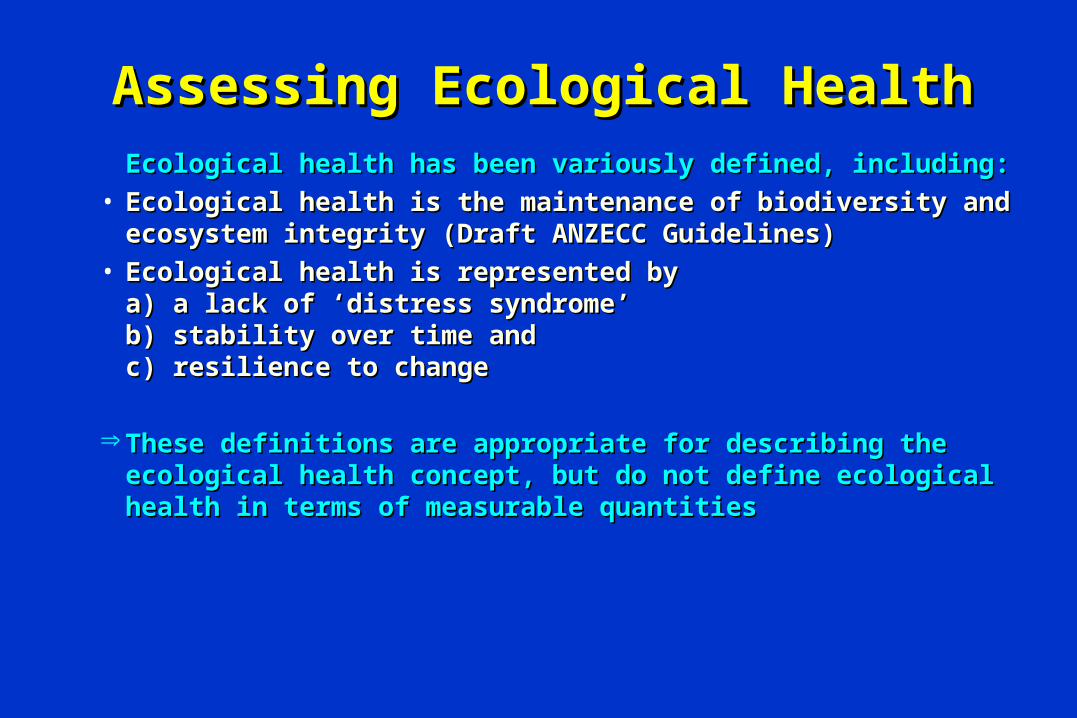
Assessing Ecological HealthAssessing Ecological Health Ecological health has been variously defined, including:Ecological health has been variously defined, including:• Ecological health is the maintenance of biodiversity and ecosystem Ecological health is the maintenance of biodiversity and ecosystem
integrity (Draft ANZECC Guidelines) integrity (Draft ANZECC Guidelines) • Ecological health is represented by Ecological health is represented by
a) a lack of ‘distress syndrome’a) a lack of ‘distress syndrome’b) stability over time andb) stability over time andc) resilience to changec) resilience to change
These definitions are appropriate for describing the These definitions are appropriate for describing the ecological health concept, but do not define ecological ecological health concept, but do not define ecological health in terms of measurable quantitieshealth in terms of measurable quantities
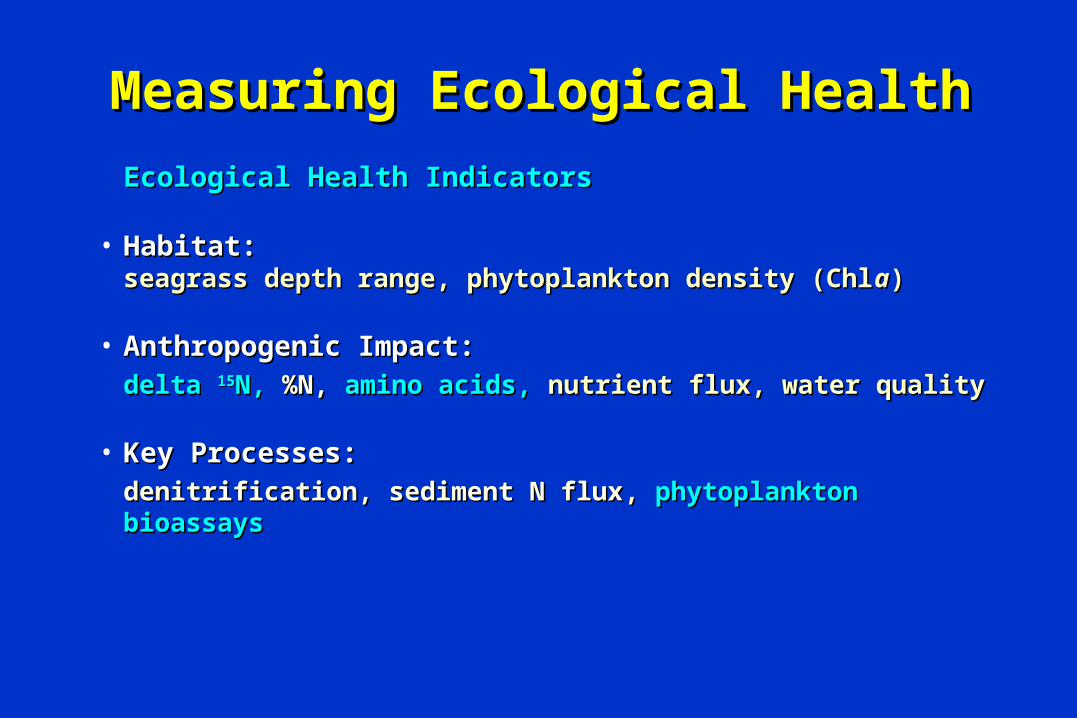
Measuring Ecological HealthMeasuring Ecological Health
Ecological Health IndicatorsEcological Health Indicators
• Habitat:Habitat:seagrass depth range, phytoplankton density (Chlseagrass depth range, phytoplankton density (Chlaa))
• Anthropogenic Impact:Anthropogenic Impact: delta delta 1515N, N, %N,%N, amino acids, amino acids, nutrient flux, water qualitynutrient flux, water quality
• Key Processes:Key Processes: denitrification, sediment N fluxdenitrification, sediment N flux,, phytoplankton bioassays phytoplankton bioassays

N Limitation in coastal watersN Limitation in coastal waters
Phytoplankton bioassay responsesPhytoplankton bioassay responses
N (not P) additions stimulateN (not P) additions stimulate
phytoplankton biomassphytoplankton biomass
Macroalgal tissue nutrient content*Macroalgal tissue nutrient content*
%N correlates with dissolved inorganic [N]%N correlates with dissolved inorganic [N]
rr22 = 0.68 = 0.68
%P does not correlate with dissolved inorganic [P]%P does not correlate with dissolved inorganic [P]rr22 = 0.08 = 0.08
*Horrocks et al. 94*Horrocks et al. 94
TreatmentTreatment Stimulation FactorStimulation Factor
Control 1DIN (NH4 + NO3) 6
PO4 1
SiO3 1All 11
DIBM 1998
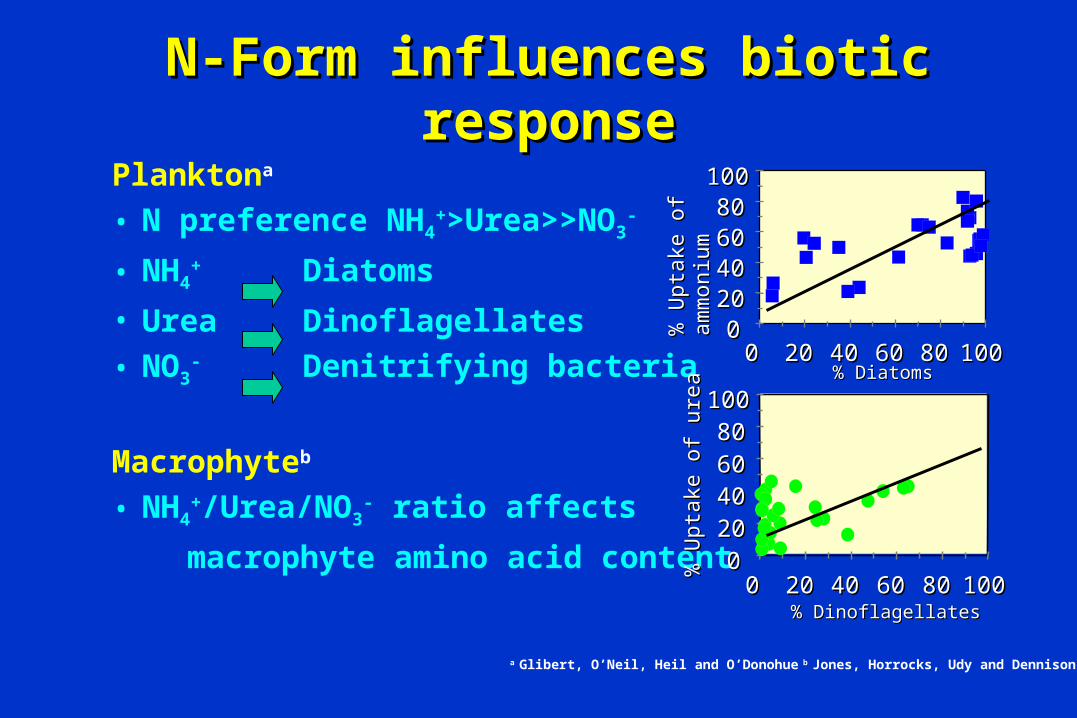
N-Form influences biotic responseN-Form influences biotic response
Planktona
• N preference NH4+>Urea>>NO3
-
• NH4+ Diatoms
• Urea Dinoflagellates• NO3
- Denitrifying bacteria
Macrophyteb
• NH4+/Urea/NO3
- ratio affects
macrophyte amino acid content
0 0 20 20 40 40 60 60 80 80
100 100
% U
ptak
e of
%
Upt
ake
of
amm
oniu
mam
mon
ium
0 0 20 20 40 40 60 60 80 80 100 100 % Diatoms% Diatoms
0 0 20 20 40 40 60 60 80 80
100 100
% U
ptak
e of
ure
a%
Upt
ake
of u
rea
0 0 20 20 40 40 60 60 80 80 100 100 % Dinoflagellates% Dinoflagellates
a Glibert, O’Neil, Heil and O’Donohue b Jones, Horrocks, Udy and Dennison
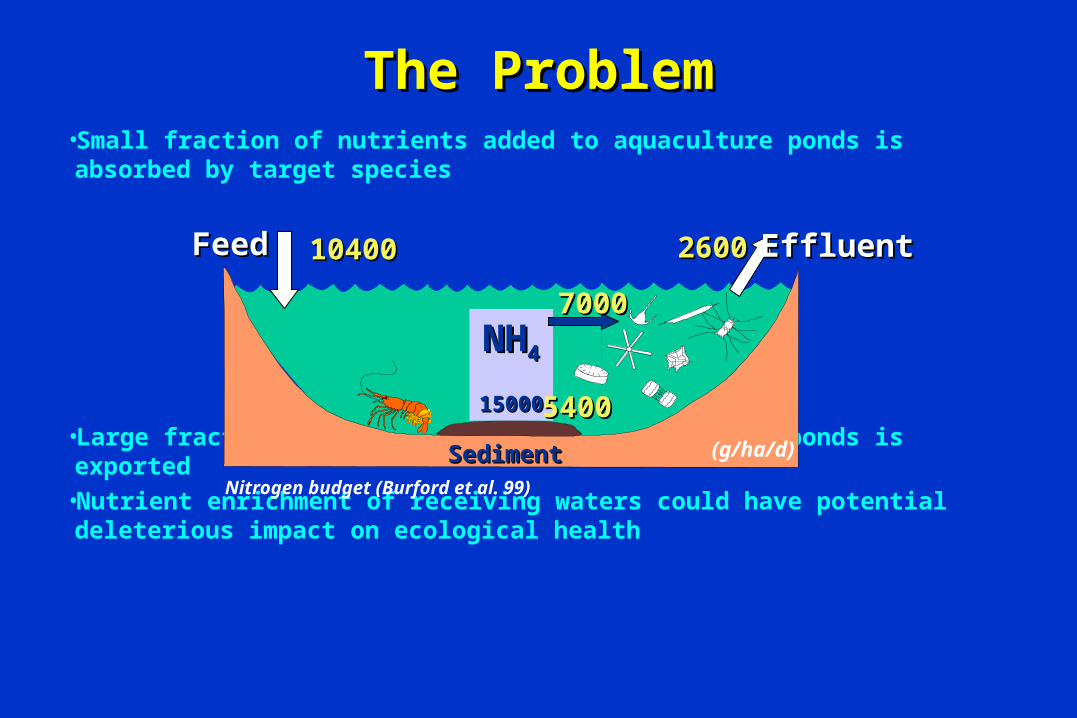
The ProblemThe Problem•Small fraction of nutrients added to aquaculture ponds is absorbed by target species
•Large fraction of nutrients added to aquaculture ponds is exported•Nutrient enrichment of receiving waters could have potential deleterious impact on ecological health
Nitrogen budget (Burford et al. 99)
SedimentSediment
NHNH44
1500015000
1040010400 EffluentEffluentFeedFeed 26002600
70007000
54005400(g/ha/d)
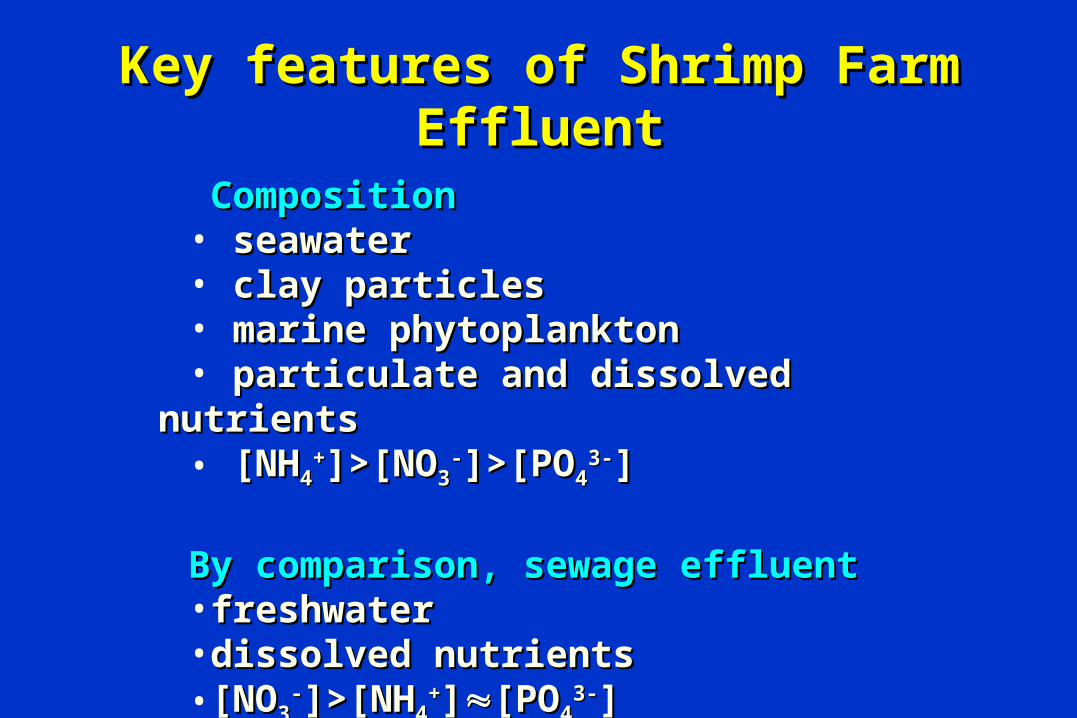
Key features of Shrimp Farm EffluentKey features of Shrimp Farm Effluent
CompositionComposition• seawaterseawater• clay particlesclay particles• marine phytoplanktonmarine phytoplankton• particulate and dissolved nutrientsparticulate and dissolved nutrients• [NH[NH44
++]>[NO]>[NO33--]>[PO]>[PO44
3-3-]]
By comparison, sewage effluentBy comparison, sewage effluent•freshwaterfreshwater•dissolved nutrientsdissolved nutrients•[NO[NO33
--]>[NH]>[NH44++]][PO[PO44
3-3-]]
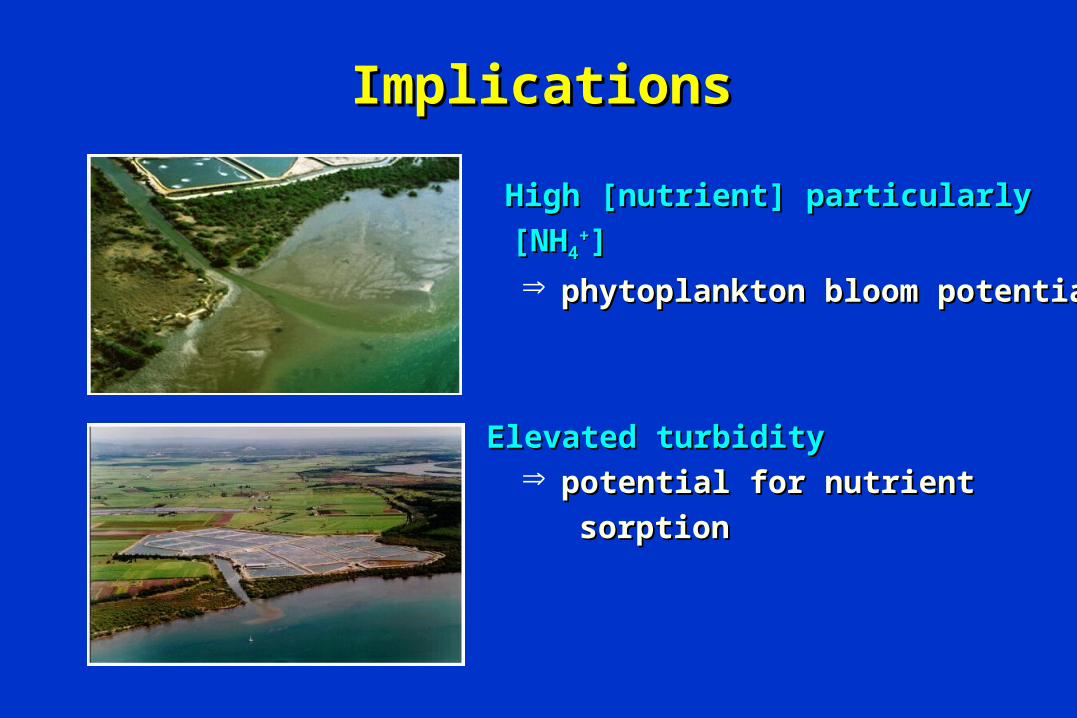
ImplicationsImplications
High [nutrient] particularly High [nutrient] particularly
[NH[NH44++] ]
phytoplankton bloom potentialphytoplankton bloom potential
Elevated turbidityElevated turbidity potential for nutrient potential for nutrient
sorptionsorption
AimsAims
• Develop & test ecological health indicators for Develop & test ecological health indicators for shrimp farm effluentshrimp farm effluent
• Using appropriate indicators, assess influence Using appropriate indicators, assess influence of shrimp farm effluent on ecological health of of shrimp farm effluent on ecological health of receiving watersreceiving waters
• Formulate recommendations for aquaculture Formulate recommendations for aquaculture effluent managementeffluent management
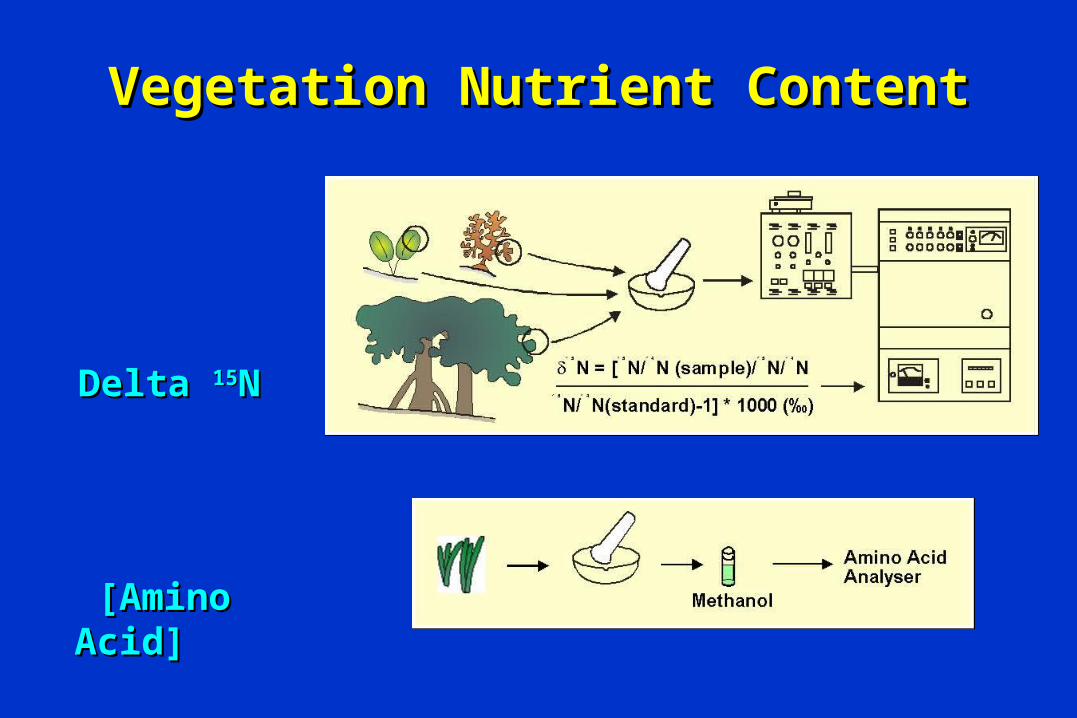
Vegetation Nutrient ContentVegetation Nutrient Content
[Amino Acid][Amino Acid]
Delta Delta 1515NN
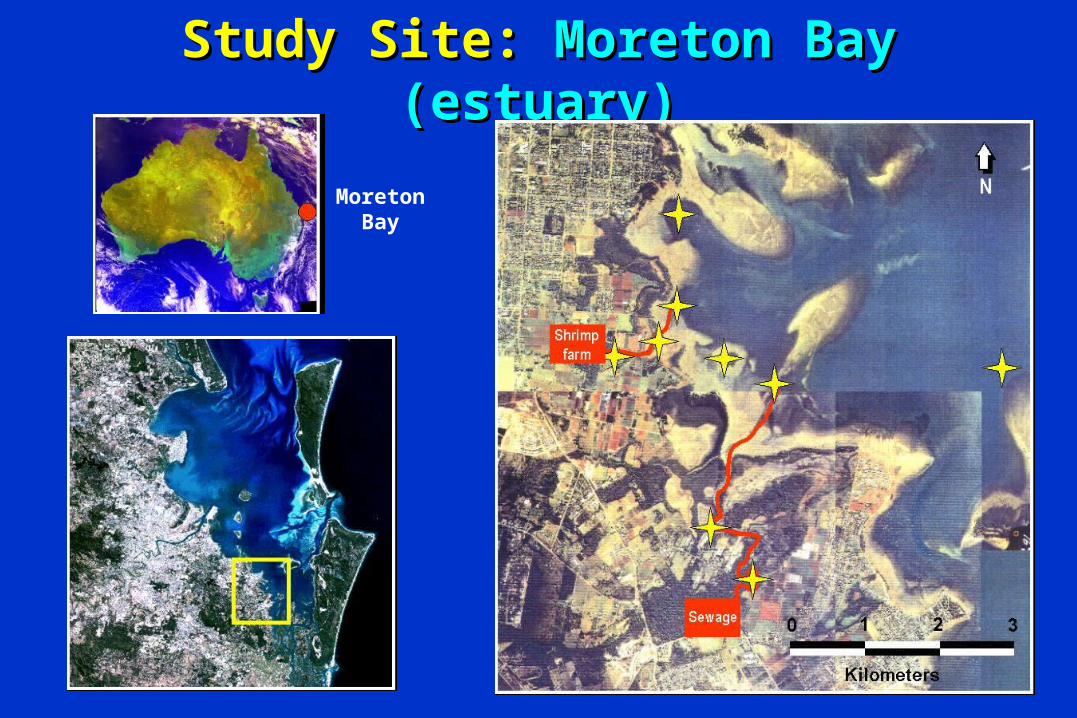
StudyStudy Site: Site: Moreton Bay (estuary)Moreton Bay (estuary)
MoretonBay
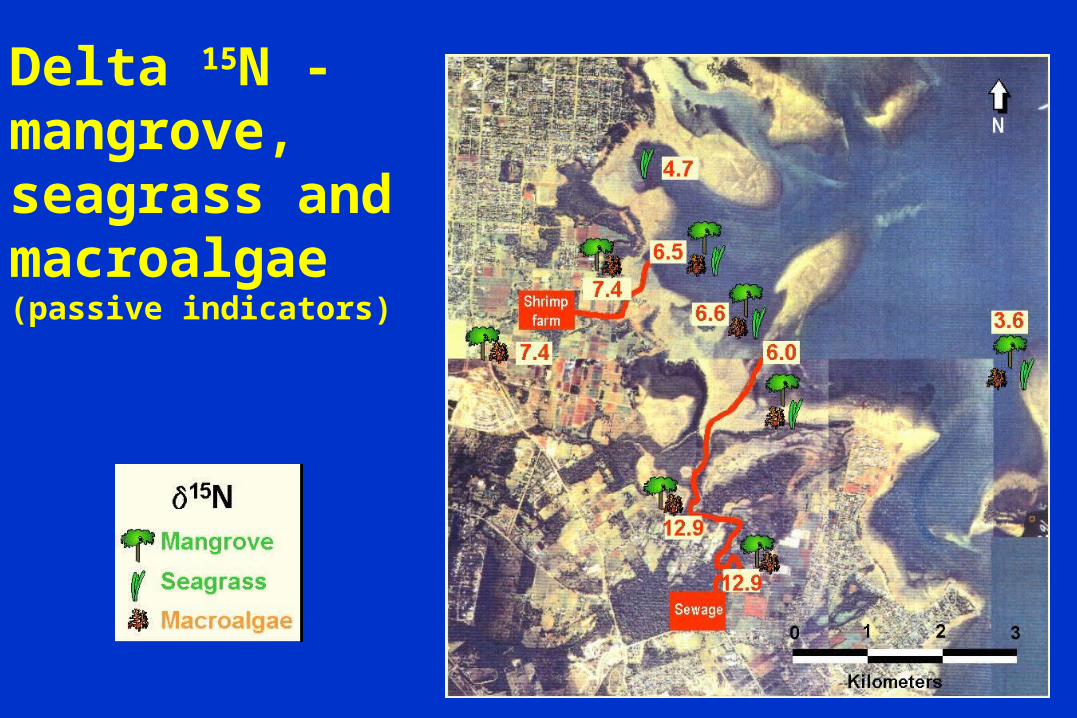
Delta 15N -mangrove, seagrass and macroalgae(passive indicators)
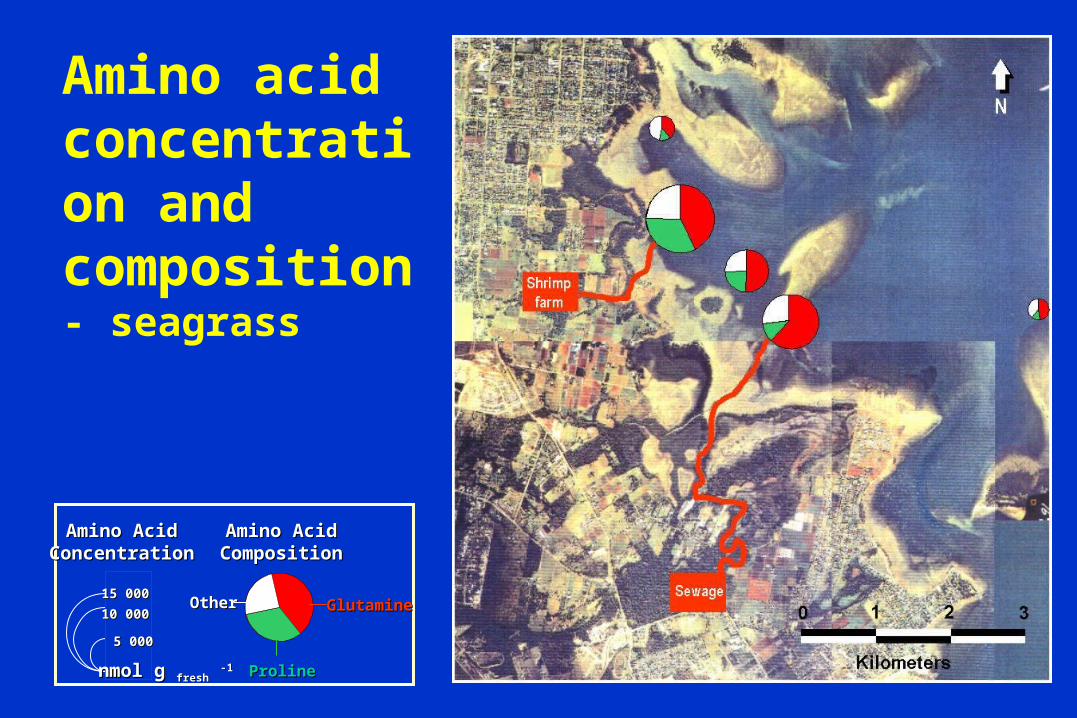
Amino acid concentration and composition - seagrass
nmol g nmol g freshfresh -1-1
Amino AcidAmino AcidConcentrationConcentration
15 00015 000
10 00010 000
5 0005 000
GlutamineGlutamineOtherOther
ProlineProline
Amino AcidAmino AcidCompositionComposition
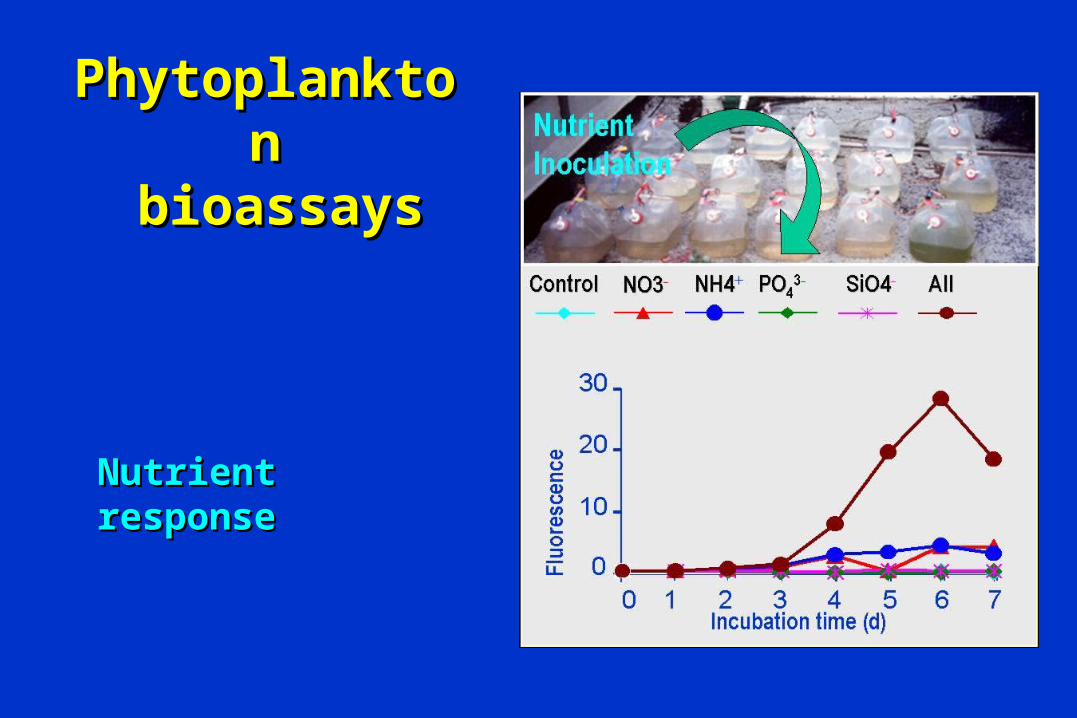
PhytoplanktonPhytoplankton bioassays bioassays
Nutrient responseNutrient response

StudyStudy Site: Site: Hinchinbrook Channel (tidal creek)Hinchinbrook Channel (tidal creek)
HinchinbrookHinchinbrookChannelChannel
0 5 10 15 20 25 30
Kilometers

Phytoplankton bioassays - Dry

Phytoplankton bioassay - Phytoplankton bioassay - Dry/WetDry/Wet
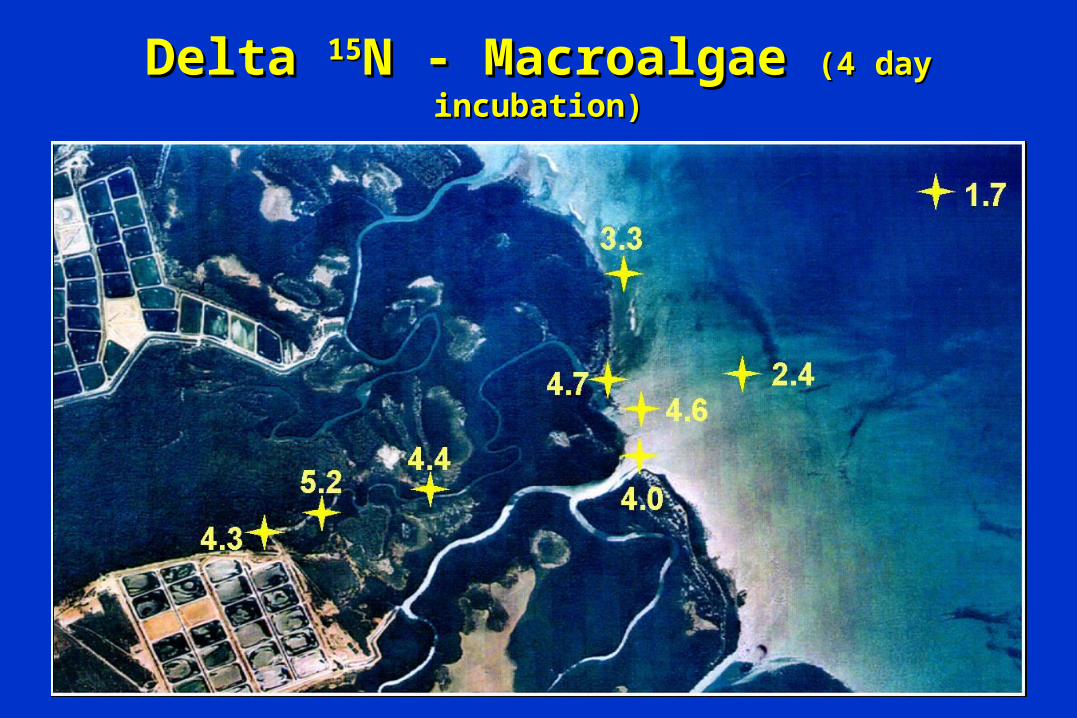
Delta Delta 1515N - MacroalgaeN - Macroalgae (4 day incubation)(4 day incubation)
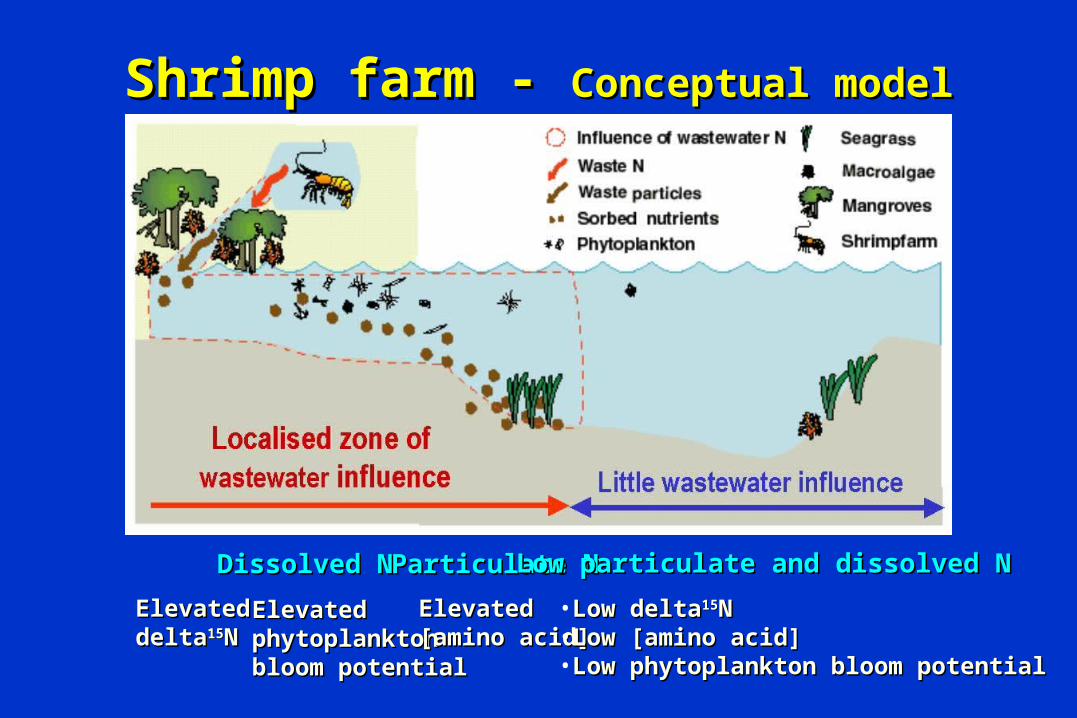
Shrimp farm - Shrimp farm - Conceptual modelConceptual model
Elevated Elevated phytoplanktonphytoplanktonbloom potentialbloom potential
Dissolved NDissolved N Particulate NParticulate N
Elevated Elevated deltadelta1515NN
Elevated Elevated [amino acid][amino acid]
Low particulate and dissolved NLow particulate and dissolved N
•Low deltaLow delta1515NN•Low [amino acid]Low [amino acid]•Low phytoplankton bloom potentialLow phytoplankton bloom potential
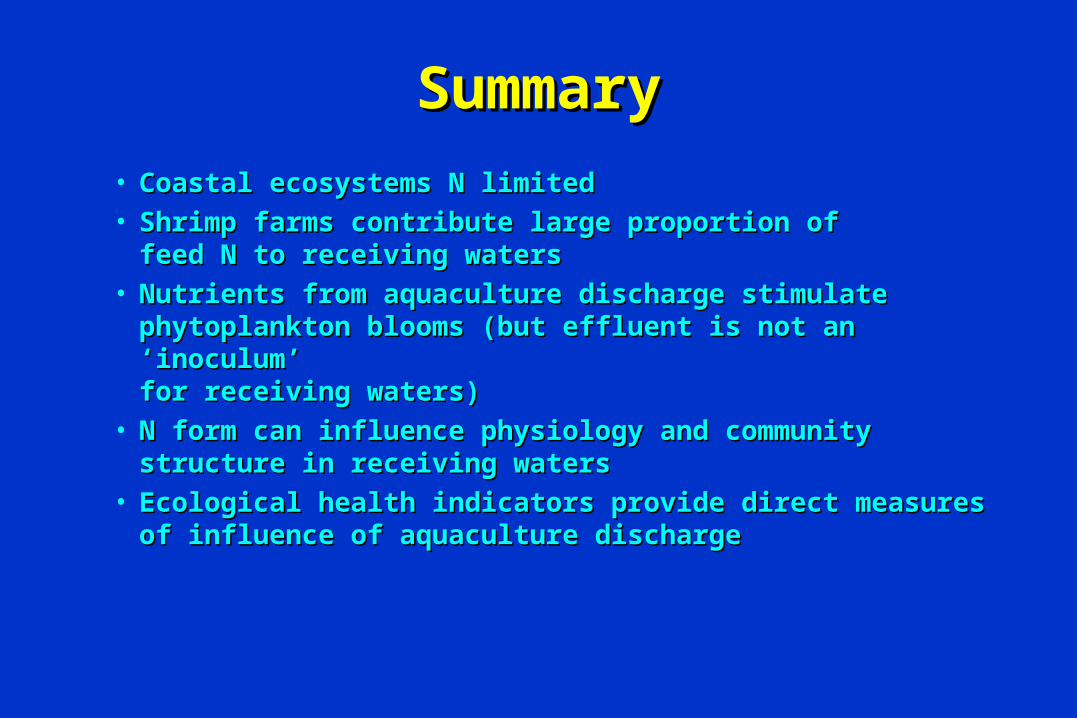
SummarySummary
• Coastal ecosystems N limitedCoastal ecosystems N limited• Shrimp farms contribute large proportion of Shrimp farms contribute large proportion of
feed N to receiving watersfeed N to receiving waters• Nutrients from aquaculture discharge stimulate phytoplankton Nutrients from aquaculture discharge stimulate phytoplankton
blooms (but effluent is not an ‘inoculum’ blooms (but effluent is not an ‘inoculum’ for receiving waters) for receiving waters)
• N form can influence physiology and community N form can influence physiology and community structure in receiving watersstructure in receiving waters
• Ecological health indicators provide direct measures Ecological health indicators provide direct measures of influence of aquaculture dischargeof influence of aquaculture discharge
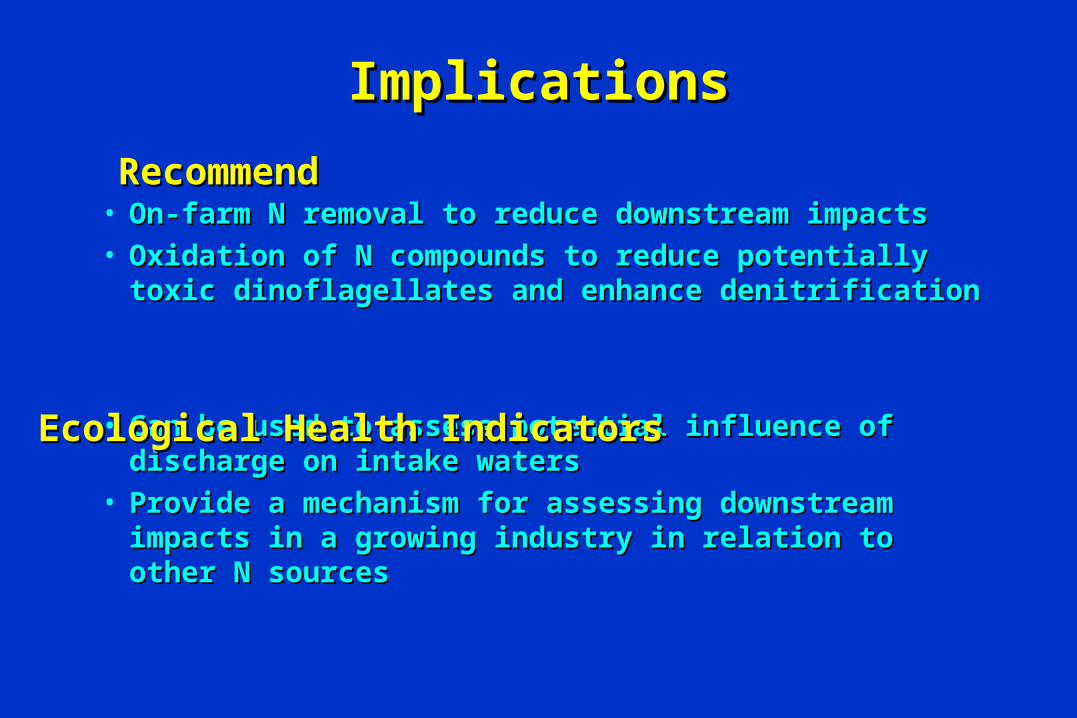
ImplicationsImplications
• On-farm N removal to reduce downstream impactsOn-farm N removal to reduce downstream impacts• Oxidation of N compounds to reduce potentially toxic Oxidation of N compounds to reduce potentially toxic
dinoflagellates and enhance denitrificationdinoflagellates and enhance denitrification
• Can be used to assess potential influence of discharge on Can be used to assess potential influence of discharge on intake watersintake waters
• Provide a mechanism for assessing downstream impacts in Provide a mechanism for assessing downstream impacts in a growing industry in relation to other N sourcesa growing industry in relation to other N sources
RecommendRecommend
Ecological Health IndicatorsEcological Health Indicators
Acknowledgments
• Cooperative Research Centre for Aquaculture• Marine Botany, University of Queensland• CSIRO Marine Research• Horn Pt Labs, University of Maryland