Embed Size (px)
Citation preview
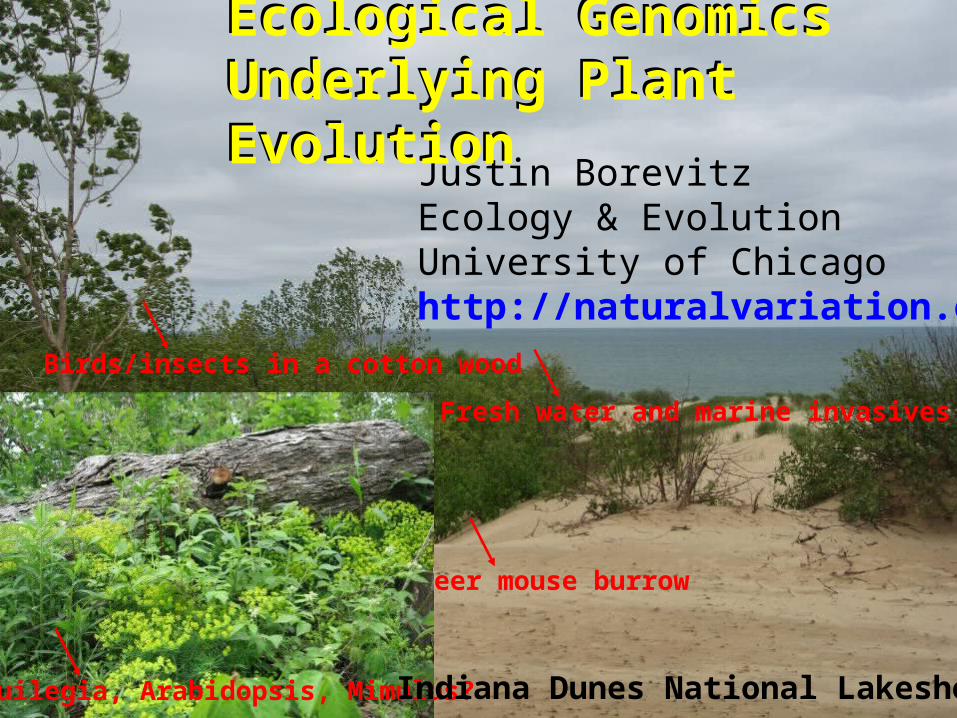
Ecological GenomicsUnderlying Plant Evolution
Deer mouse burrow
Birds/insects in a cotton wood
Fresh water and marine invasives
Aquilegia, Arabidopsis, Mimulus? Indiana Dunes National Lakeshore
Justin BorevitzEcology & EvolutionUniversity of Chicagohttp://naturalvariation.org/
Ecological GenomicsUnderlying Plant Evolution
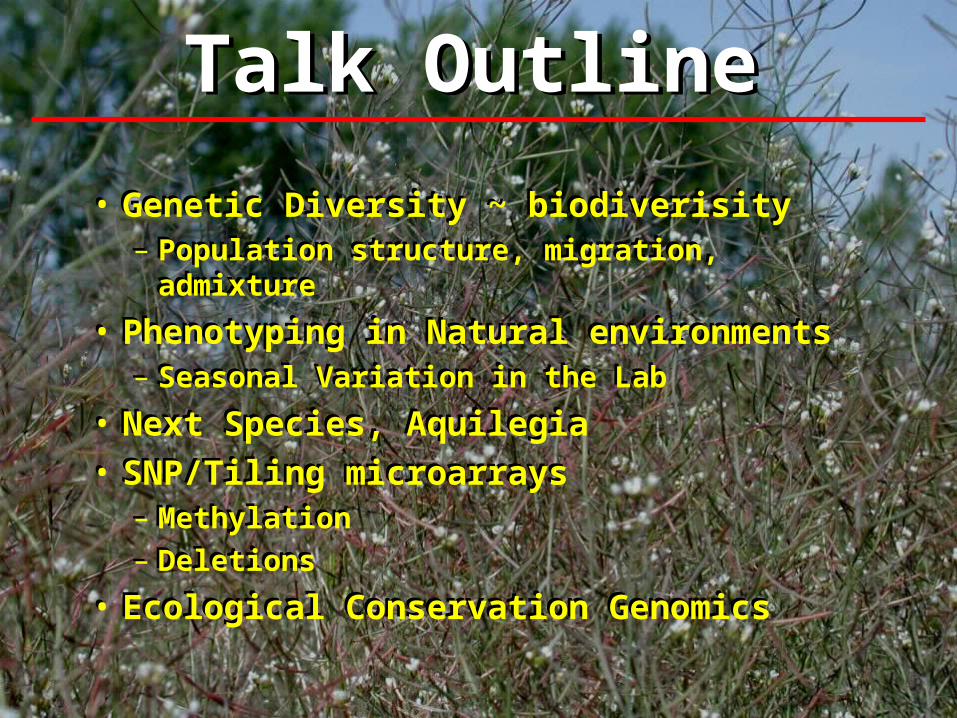
Talk OutlineTalk Outline
• Genetic Diversity ~ biodiverisity– Population structure, migration, admixture
• Phenotyping in Natural environments– Seasonal Variation in the Lab
• Next Species, Aquilegia
• SNP/Tiling microarrays– Methylation
– Deletions
• Ecological Conservation Genomics
• Genetic Diversity ~ biodiverisity– Population structure, migration, admixture
• Phenotyping in Natural environments– Seasonal Variation in the Lab
• Next Species, Aquilegia
• SNP/Tiling microarrays– Methylation
– Deletions
• Ecological Conservation Genomics
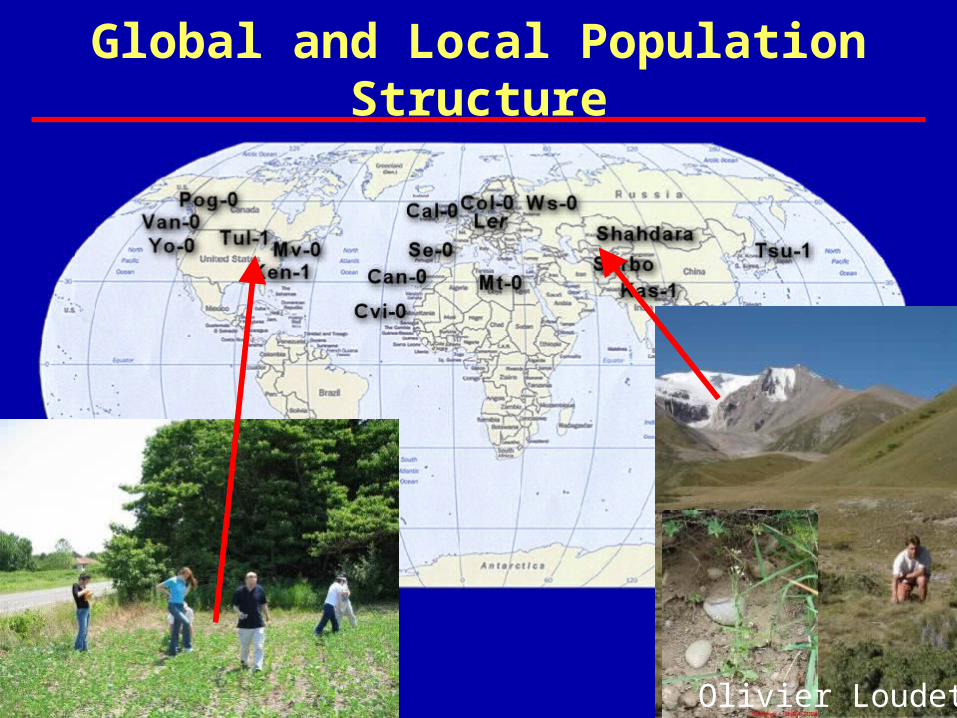
Global and Local Population Structure
Olivier Loudet
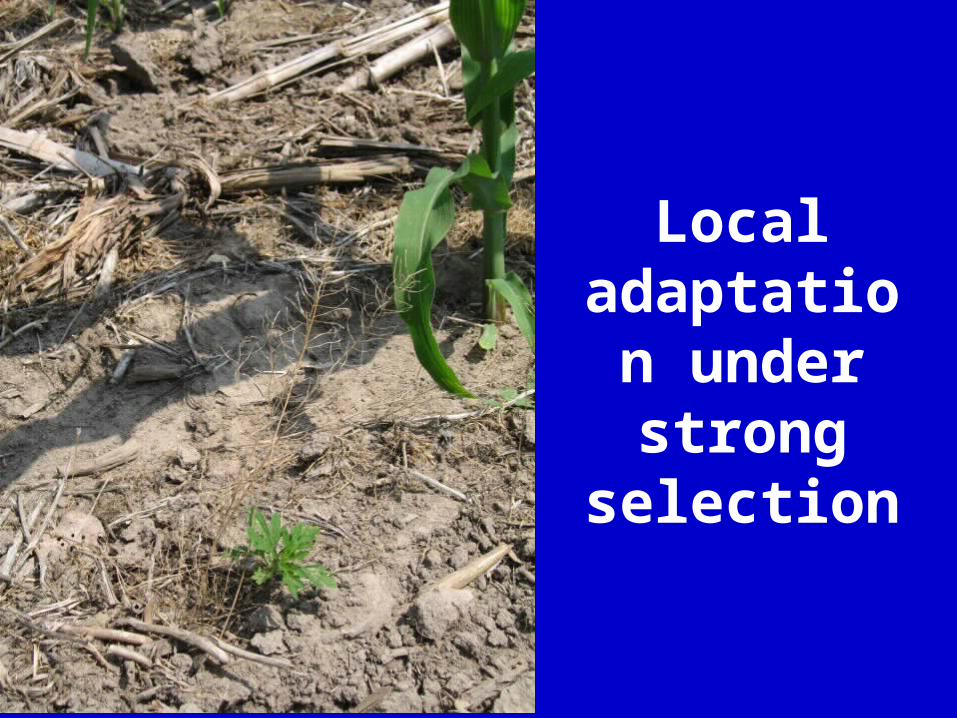
Local adaptation
under strong
selection
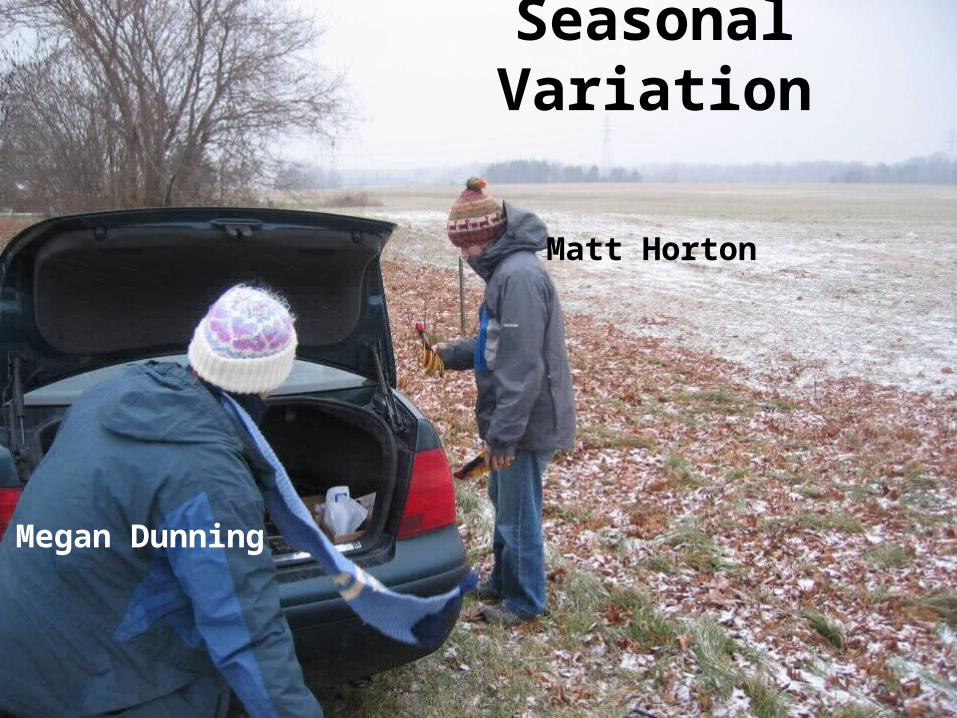
Seasonal Variation
Matt Horton
Megan Dunning
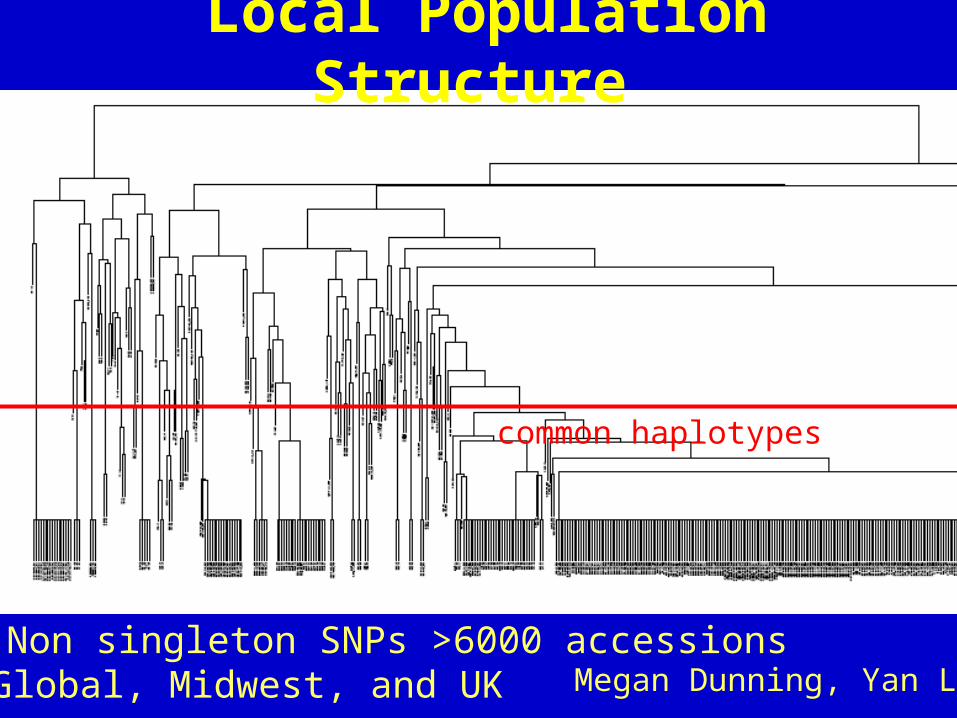
149 Non singleton SNPs >6000 accessions
Global, Midwest, and UK
common haplotypes
Local Population Structure
Megan Dunning, Yan Li
80 Major Haplotypes
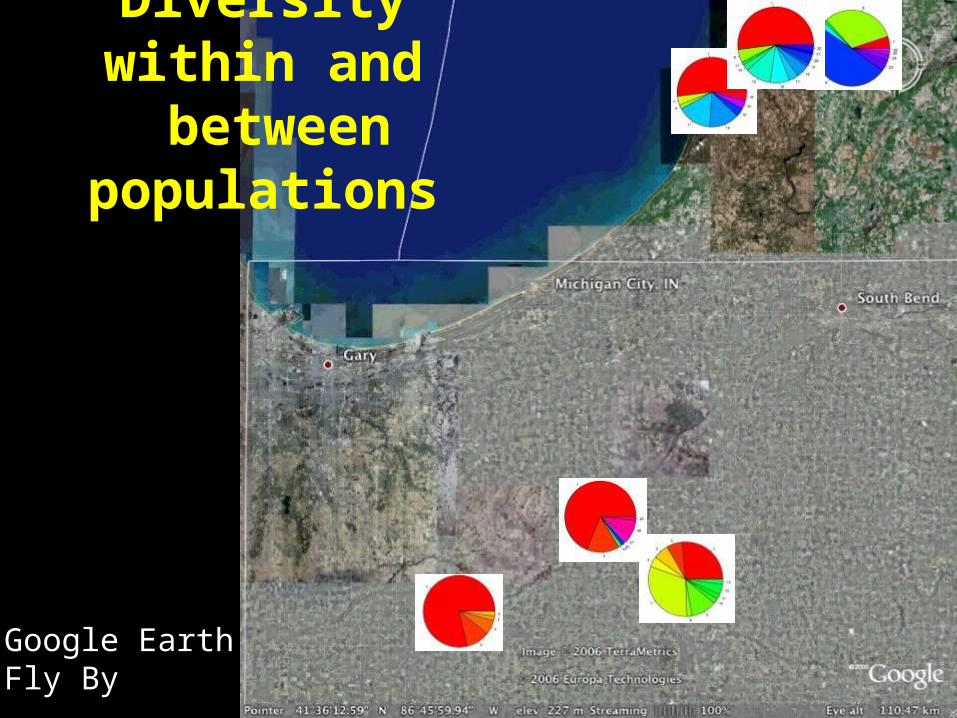
Diversity within and between populations
Google EarthFly By

17 Major Haplotypes
80 Major Haplotypes
Diversity within and between populations
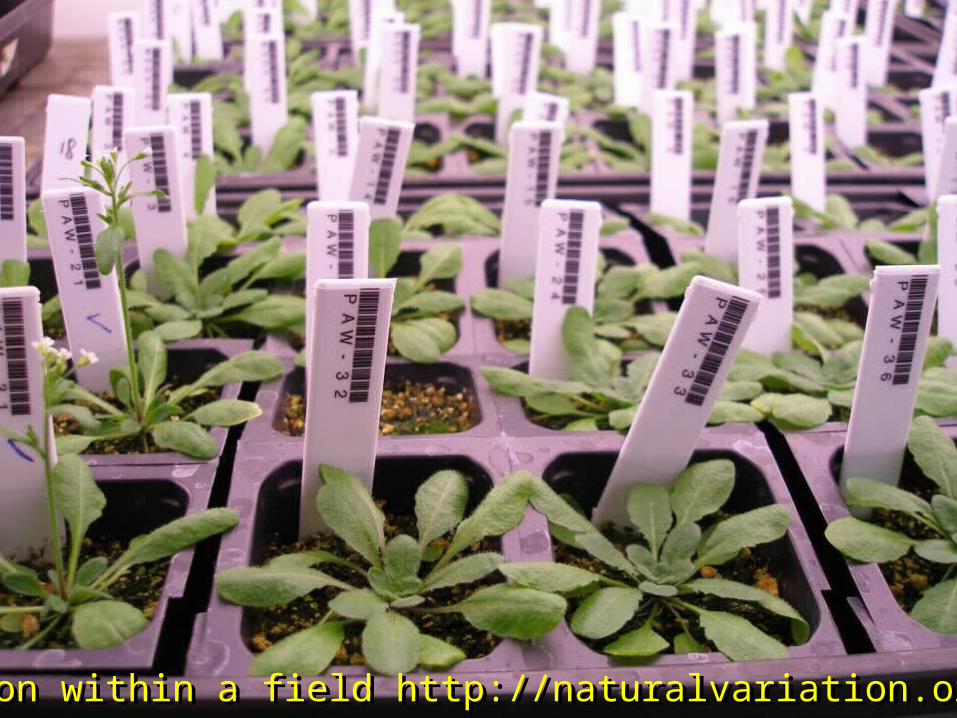
Variation within a field http://naturalvariation.org/hapmapVariation within a field http://naturalvariation.org/hapmap
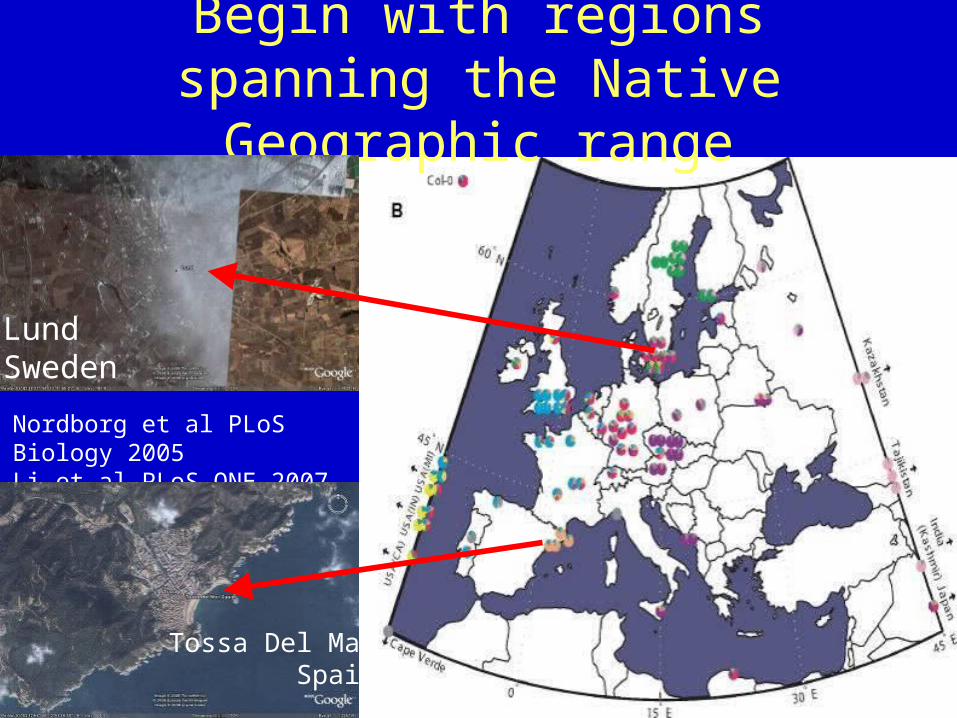
Begin with regions spanning the Native Geographic range
Nordborg et al PLoS Biology 2005Li et al PLoS ONE 2007
Tossa Del MarSpain
LundSweden
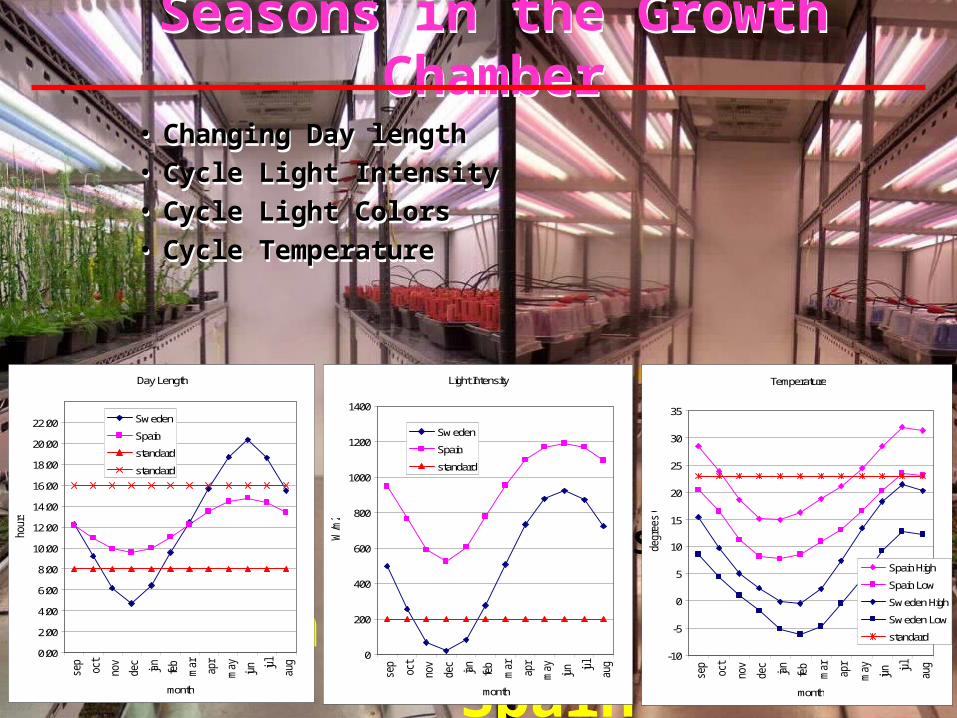
Seasons in the Growth Chamber
• Changing Day length• Cycle Light Intensity• Cycle Light Colors• Cycle Temperature
Sweden Spain
Seasons in the Growth Chamber
• Changing Day length
• Cycle Light Intensity
• Cycle Light Colors
• Cycle Temperature
GenevaScientific/ Percival
Day Length
0:00
2:00
4:00
6:00
8:00
10:00
12:00
14:00
16:00
18:00
20:00
22:00
sep
oct
nov
dec
jan
feb
mar
apr
may jun jul
aug
month
hour
s
Sweden
Spain
standard
standard
Light Intensity
0
200
400
600
800
1000
1200
1400
sep
oct
nov
dec
jan
feb
mar
apr
may jun jul
aug
month
W/m
2
Sweden
Spain
standard
Temperature
-10
-5
0
5
10
15
20
25
30
35
sep
oct
nov
dec
jan
feb
mar
apr
may jun jul
aug
month
degr
ees
C
Spain High
Spain Low
Sweden High
Sweden Low
standard
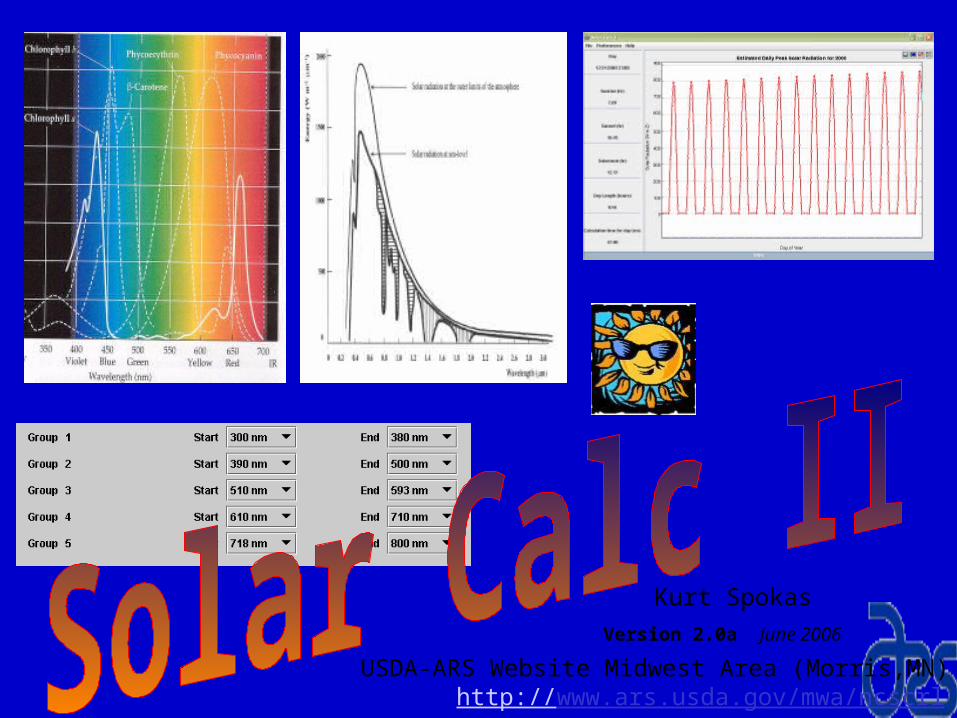
Kurt Spokas
Version 2.0a June 2006
USDA-ARS Website Midwest Area (Morris,MN)http://www.ars.usda.gov/mwa/ncscrl
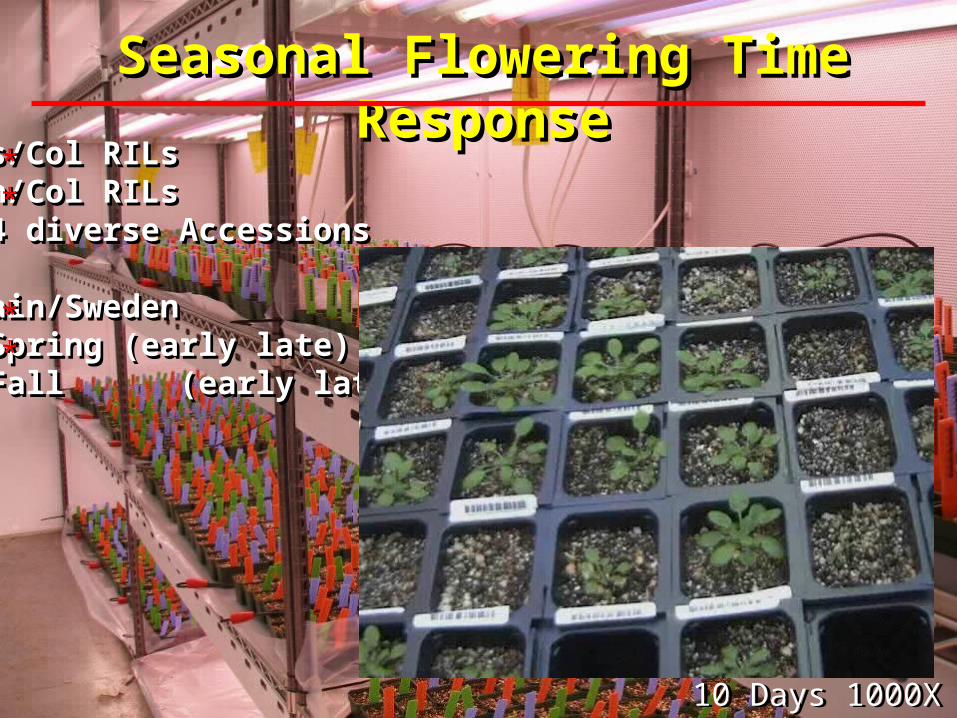
Seasonal Flowering Time ResponseSeasonal Flowering Time Response
Kas/Col RILsVan/Col RILs384 diverse Accessions
Spain/Sweden Spring (early late) Fall (early late)
Kas/Col RILsVan/Col RILs384 diverse Accessions
Spain/Sweden Spring (early late) Fall (early late)
**
**
**
**
10 Days 1000X10 Days 1000X
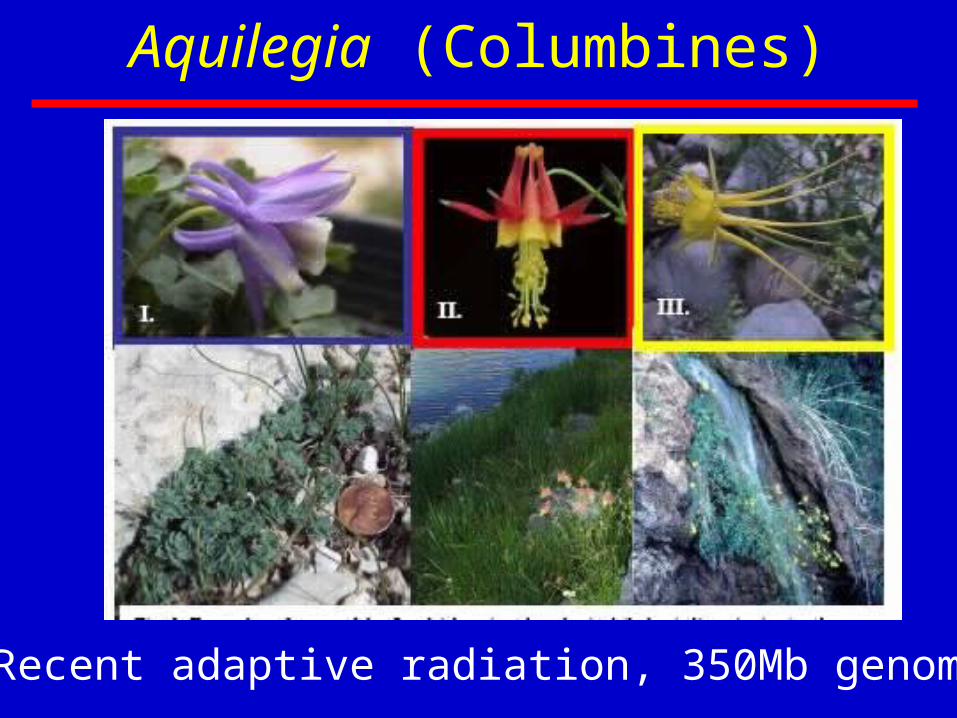
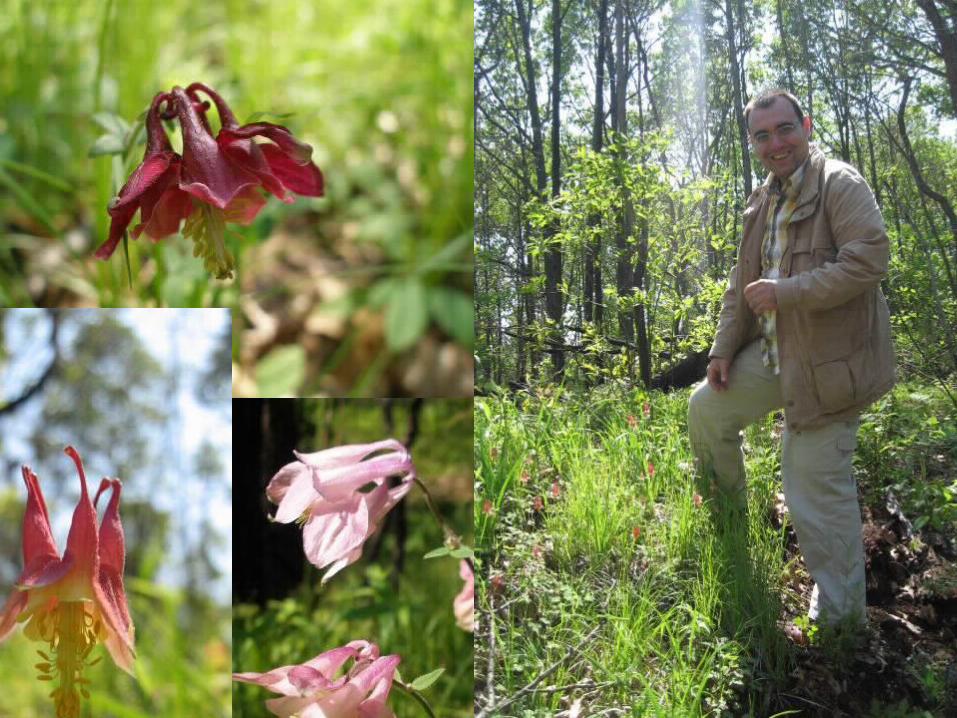
Aquilegia (Columbines)
Recent adaptive radiation, 350Mb genome
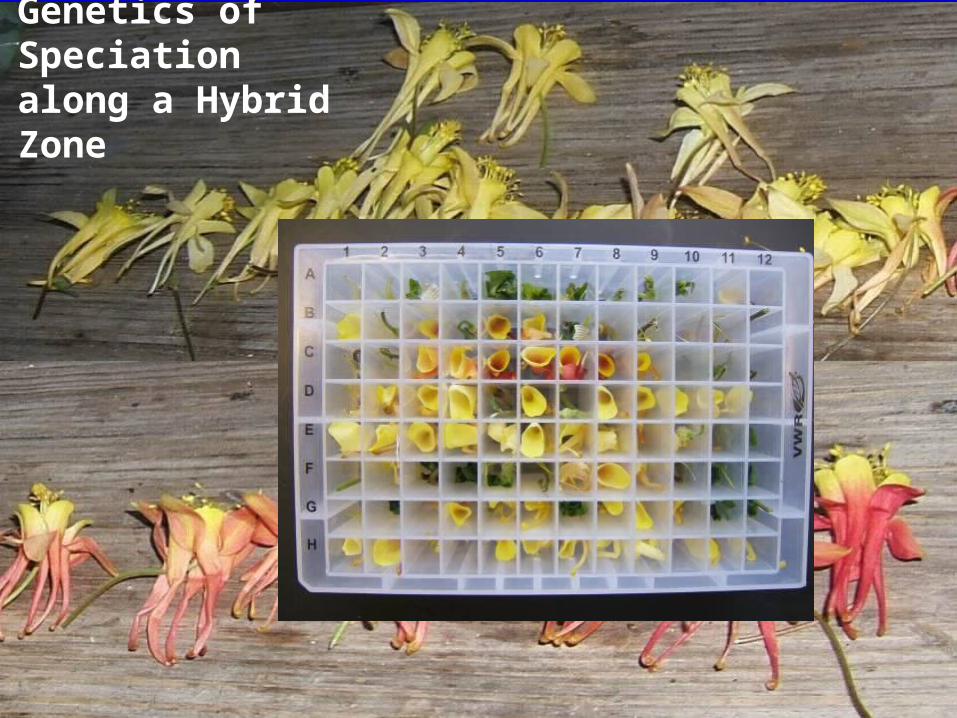
Genetics of Speciationalong a Hybrid Zone
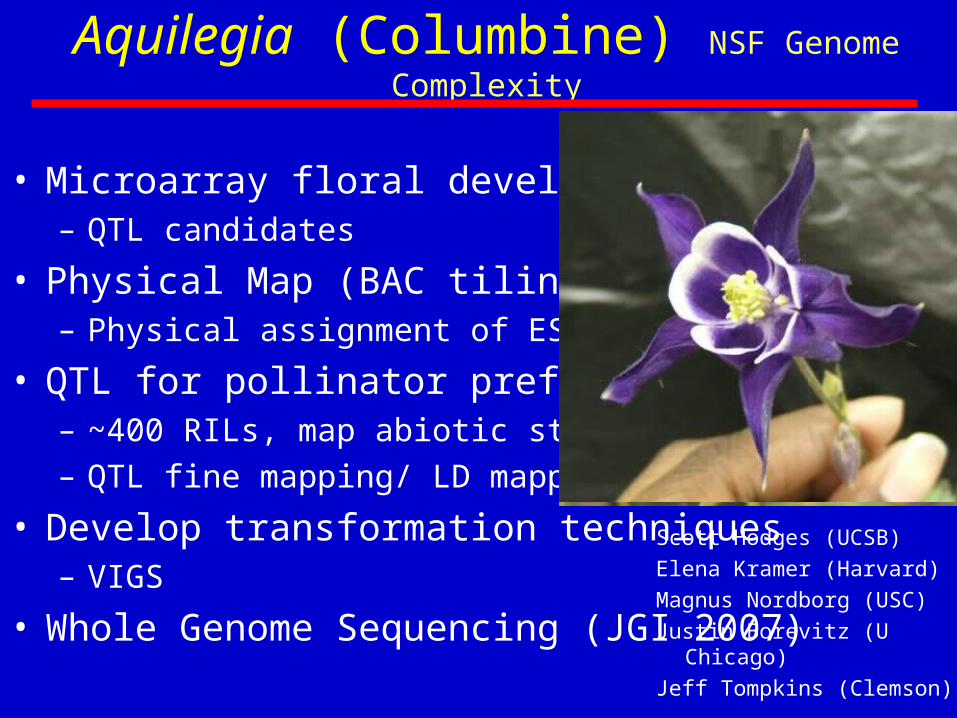
Aquilegia (Columbine) NSF Genome Complexity
• Microarray floral development – QTL candidates
• Physical Map (BAC tiling path)– Physical assignment of ESTs
• QTL for pollinator preference – ~400 RILs, map abiotic stress
– QTL fine mapping/ LD mapping
• Develop transformation techniques– VIGS
• Whole Genome Sequencing (JGI 2007)
Scott Hodges (UCSB)
Elena Kramer (Harvard)
Magnus Nordborg (USC)
Justin Borevitz (U Chicago)
Jeff Tompkins (Clemson)

SNP SFP MMMMM MSFP
SFP
MMMMM M
Chromosome (bp)
con
serv
atio
n
SNP
ORFa
start AAAAA
Tra
nsc
ripto
me
Atla
s
ORFb
deletion
The Genomic ResponseMediating the Environment
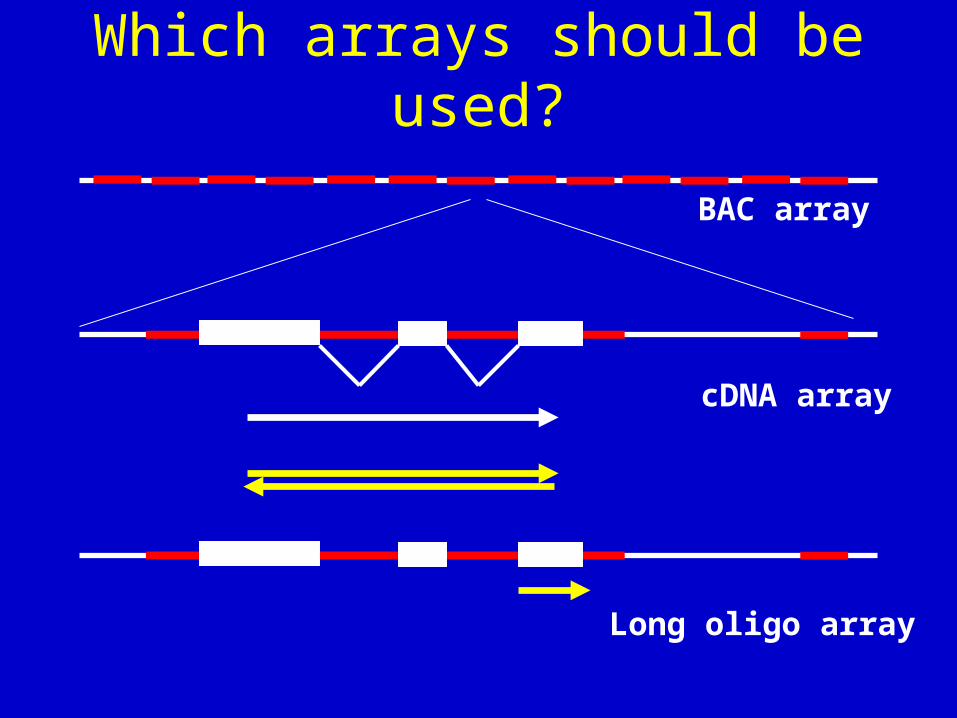
Which arrays should be used?
cDNA array
Long oligo array
BAC array
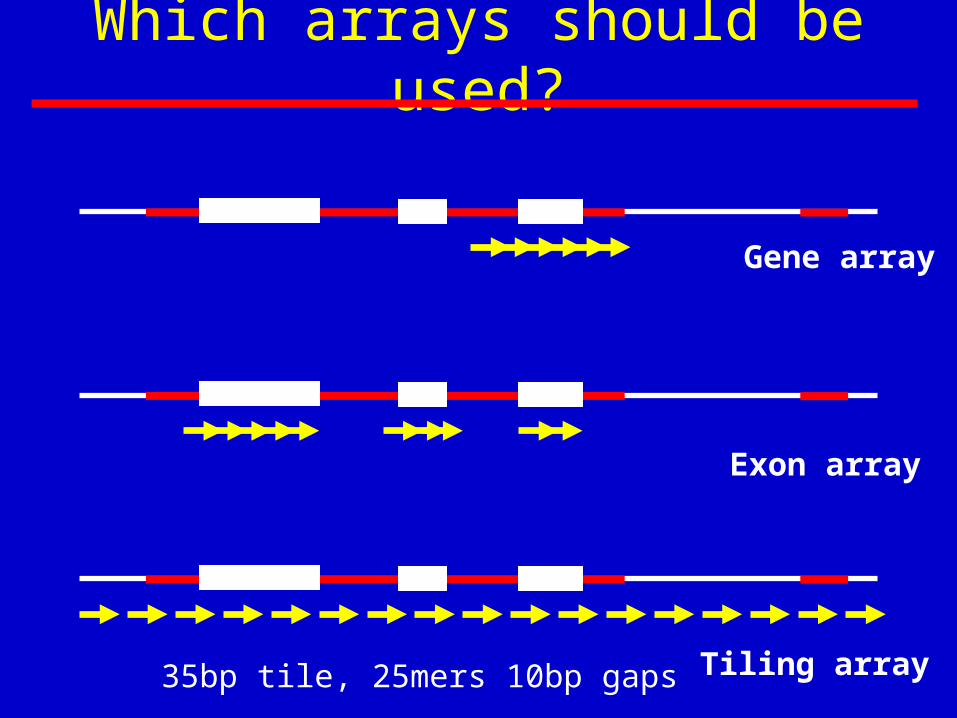
Which arrays should be used?
Gene array
Exon array
Tiling array35bp tile, 25mers 10bp gaps
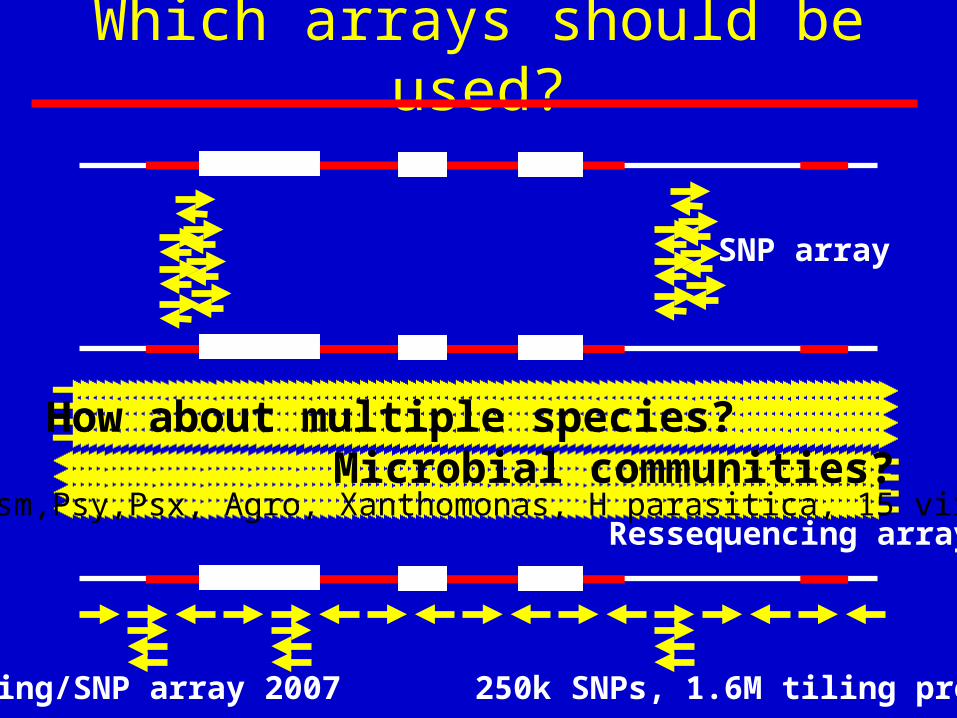
Which arrays should be used?
Tiling/SNP array 2007 250k SNPs, 1.6M tiling probes
SNP array
Ressequencing array
How about multiple species? Microbial communities?
Pst,Psm,Psy,Psx, Agro, Xanthomonas, H parasitica, 15 virus,
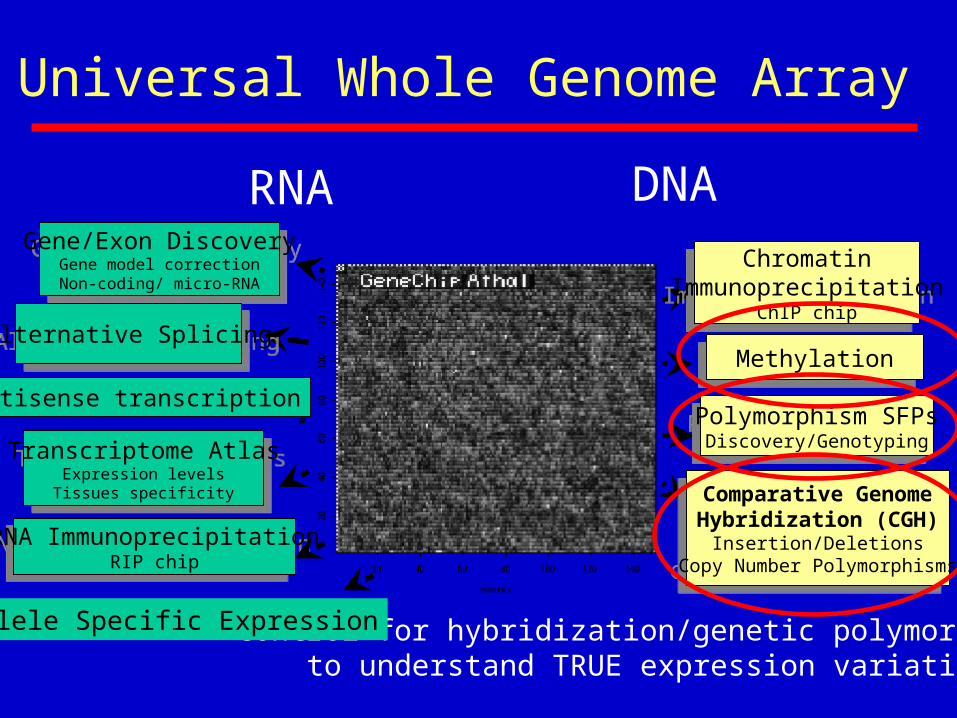
RNA DNA
Universal Whole Genome Array
Transcriptome AtlasExpression levelsTissues specificity
Transcriptome AtlasExpression levelsTissues specificity
Gene/Exon DiscoveryGene model correctionNon-coding/ micro-RNA
Gene/Exon DiscoveryGene model correctionNon-coding/ micro-RNA
Alternative SplicingAlternative Splicing
Comparative GenomeHybridization (CGH)
Insertion/DeletionsCopy Number Polymorphisms
Comparative GenomeHybridization (CGH)
Insertion/DeletionsCopy Number Polymorphisms
MethylationMethylation
ChromatinImmunoprecipitation
ChIP chip
ChromatinImmunoprecipitation
ChIP chip
Polymorphism SFPsDiscovery/Genotyping
Polymorphism SFPsDiscovery/Genotyping
Control for hybridization/genetic polymorphismsto understand TRUE expression variation
RNA ImmunoprecipitationRIP chip
RNA ImmunoprecipitationRIP chip
Antisense transcription
Allele Specific Expression
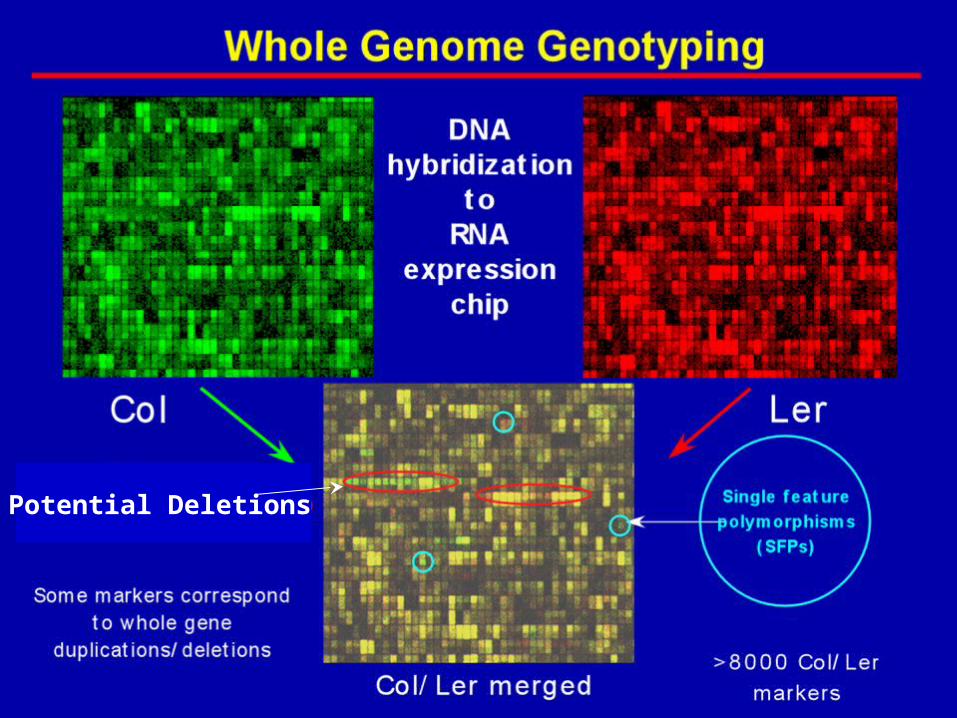
Potential Deletions

Delta p0 FALSE Called FDR
1.00 0.95 18865 160145 11.2%
1.25 0.95 10477 132390 7.5%
1.50 0.95 6545 115042 5.4%
1.75 0.95 4484 102385 4.2%
2.00 0.95 3298 92027 3.4%
SFP detection on tiling arrays
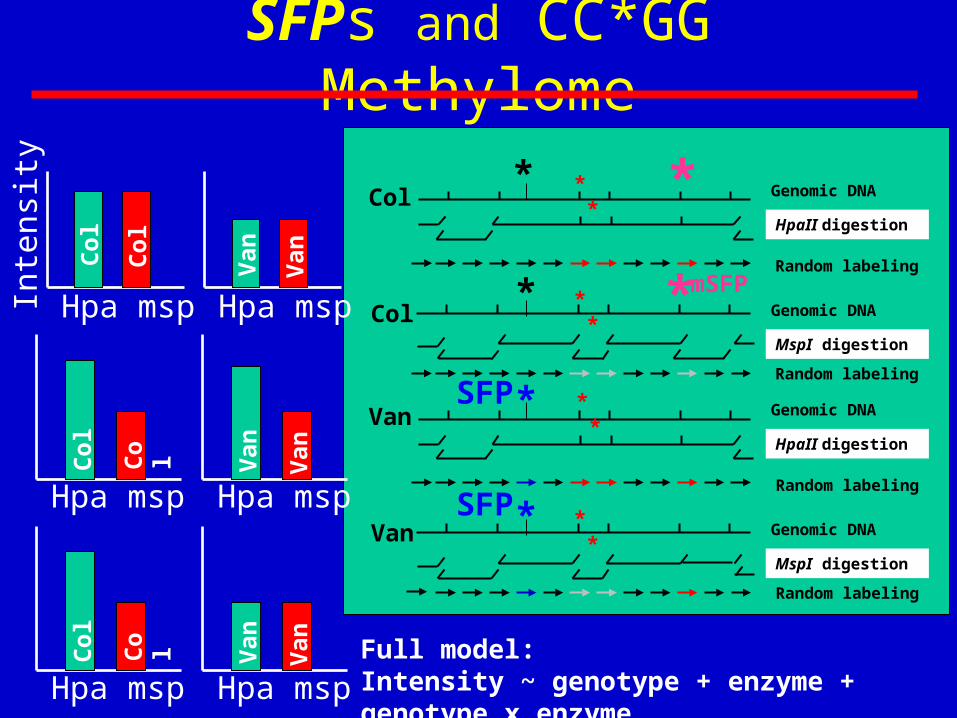
SFPs and CC*GG Methylome
HpaII digestion
Random labeling
Random labeling
MspI digestion
Col
Col
Genomic DNA
Genomic DNA
HpaII digestion
Random labeling
Random labeling
MspI digestion
Van
Van
Genomic DNA
Genomic DNASFP
Hpa msp
Inte
nsit
y
Col
Col
Hpa msp
Van
Van
*
SFP*
*
*
Hpa msp
Col
Col
Hpa msp
Van
Van
mSFP
*
*
* *
* *
* *Hpa msp
Col
Col
Hpa msp
Van
Van
* *
Full model: Intensity ~ genotype + enzyme + genotype x enzyme
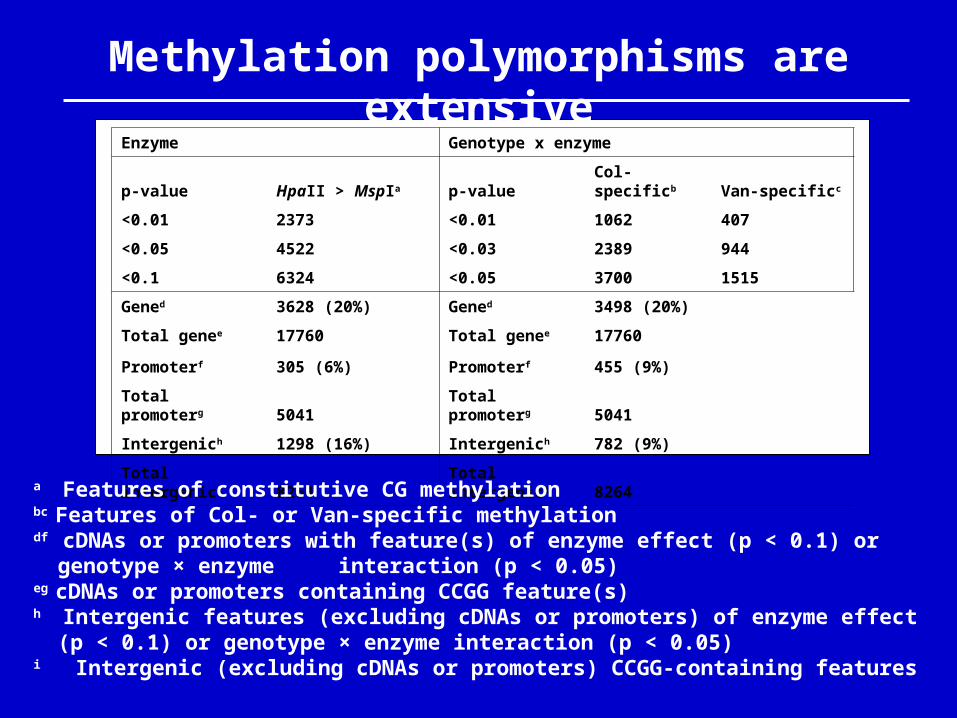
Enzyme Genotype x enzyme
p-value HpaII > MspIa p-value Col-specificb Van-specificc
<0.01 2373 <0.01 1062 407
<0.05 4522 <0.03 2389 944
<0.1 6324 <0.05 3700 1515
Gened 3628 (20%) Gened 3498 (20%)
Total genee 17760 Total genee 17760
Promoterf 305 (6%) Promoterf 455 (9%)
Total promoterg 5041 Total promoterg 5041
Intergenich 1298 (16%) Intergenich 782 (9%)
Total intergenici 8264 Total intergenici 8264
Methylation polymorphisms are extensive
a Features of constitutive CG methylation bc Features of Col- or Van-specific methylation df cDNAs or promoters with feature(s) of enzyme effect (p < 0.1) or genotype × enzyme
interaction (p < 0.05) eg cDNAs or promoters containing CCGG feature(s)h Intergenic features (excluding cDNAs or promoters) of enzyme effect (p < 0.1) or
genotype × enzyme interaction (p < 0.05)i Intergenic (excluding cDNAs or promoters) CCGG-containing features
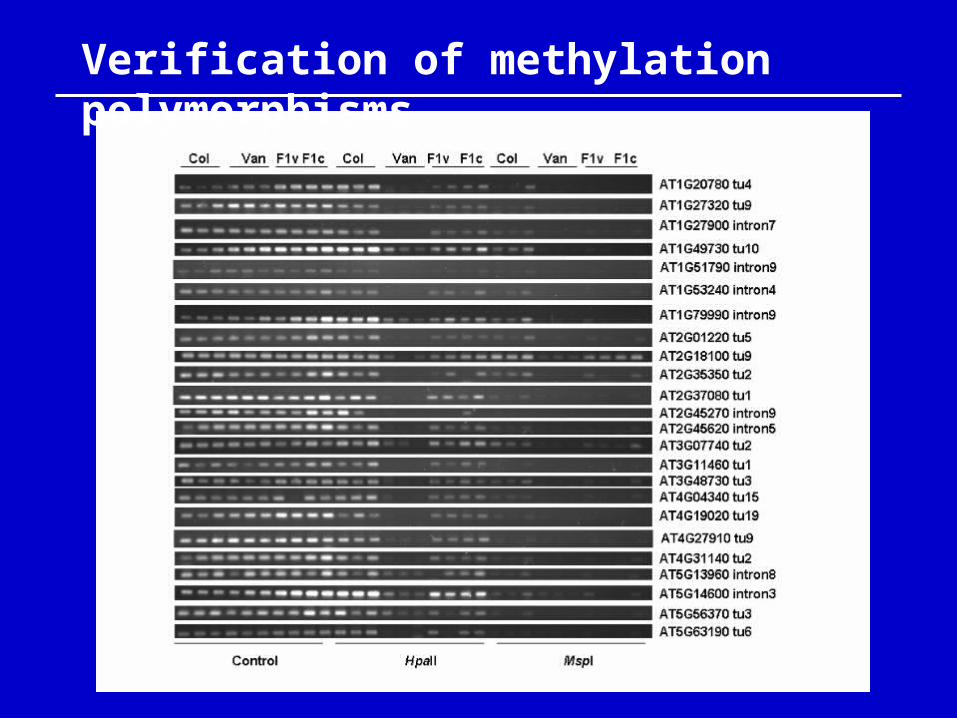
Verification of methylation polymorphisms
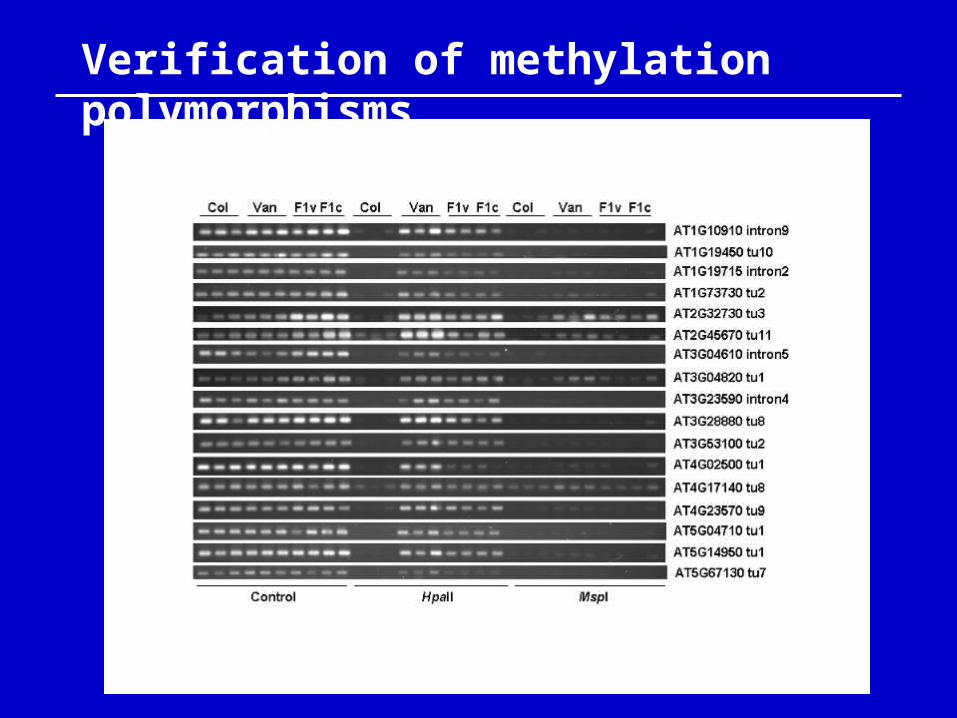
Verification of methylation polymorphisms
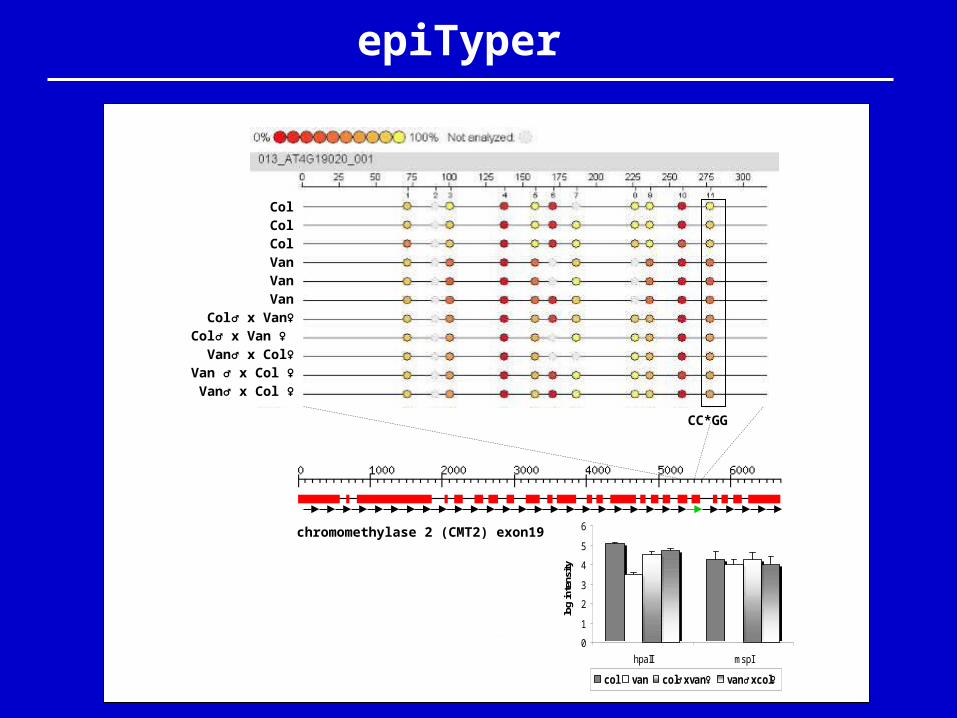
ColColColVanVanVan
Col♂ x Van♀Col♂ x Van ♀
Van♂ x Col♀Van ♂ x Col ♀Van♂ x Col ♀
CC*GG
chromomethylase 2 (CMT2) exon19
0
1
2
3
4
5
6
hpaII mspI
log
inte
nsity
col van col♂xvan♀ van♂xcol♀
epiTyper
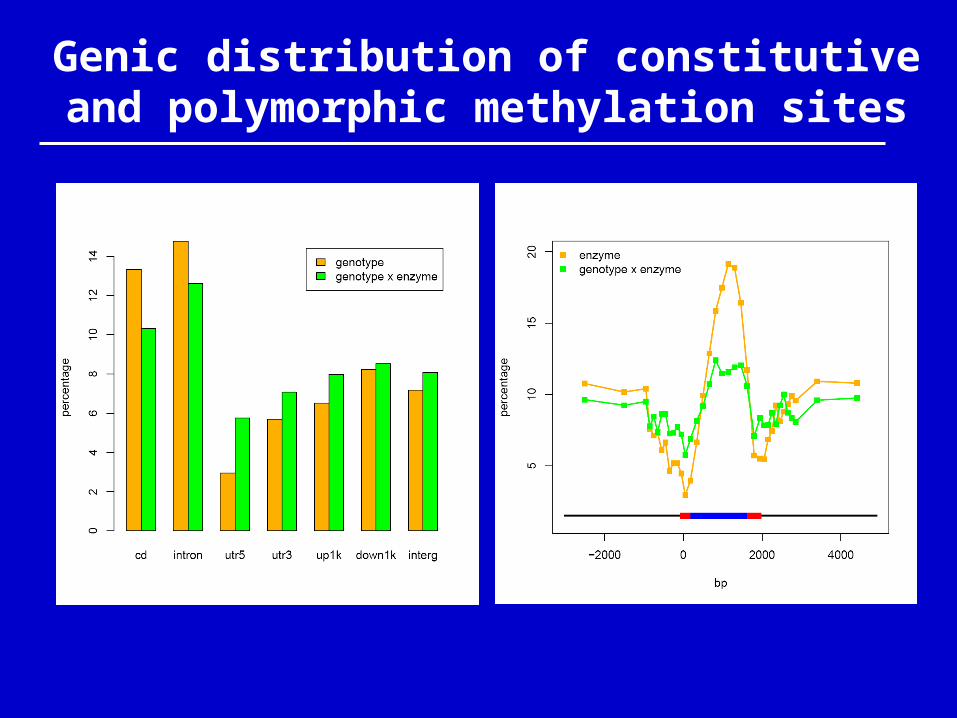
Genic distribution of constitutive and polymorphic methylation sites
bp
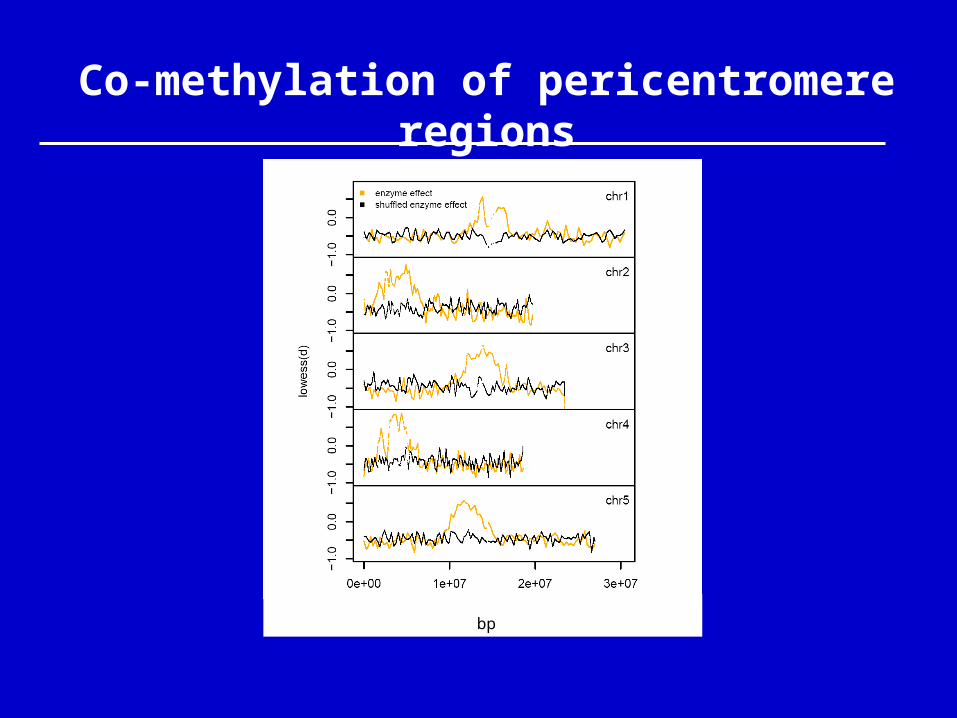
Co-methylation of pericentromere regions
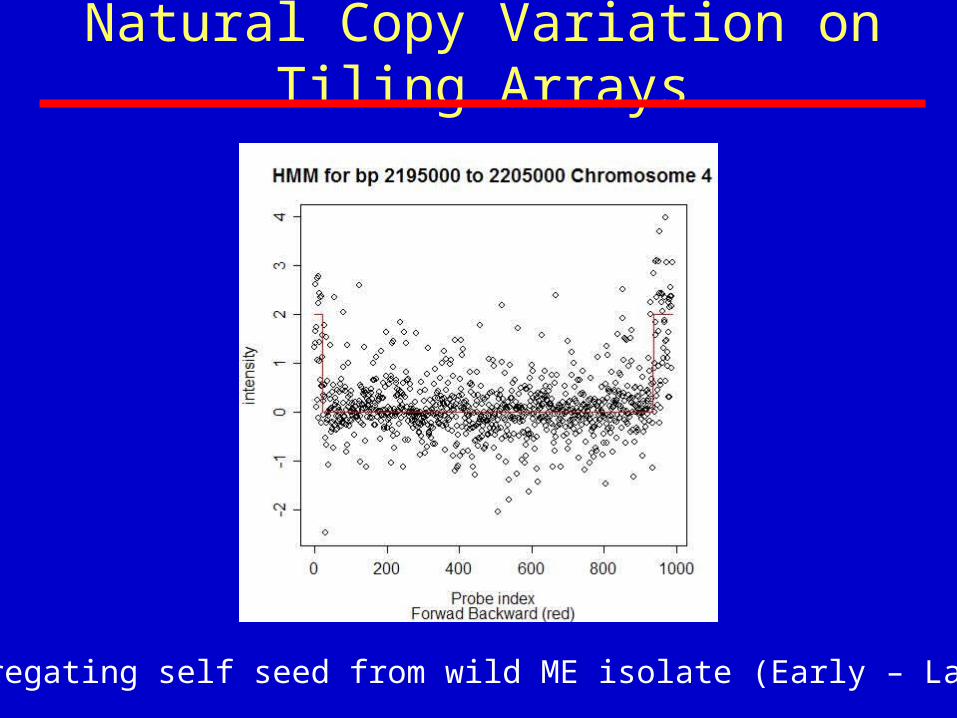
Natural Copy Variation on Tiling Arrays
Segregating self seed from wild ME isolate (Early – Late)
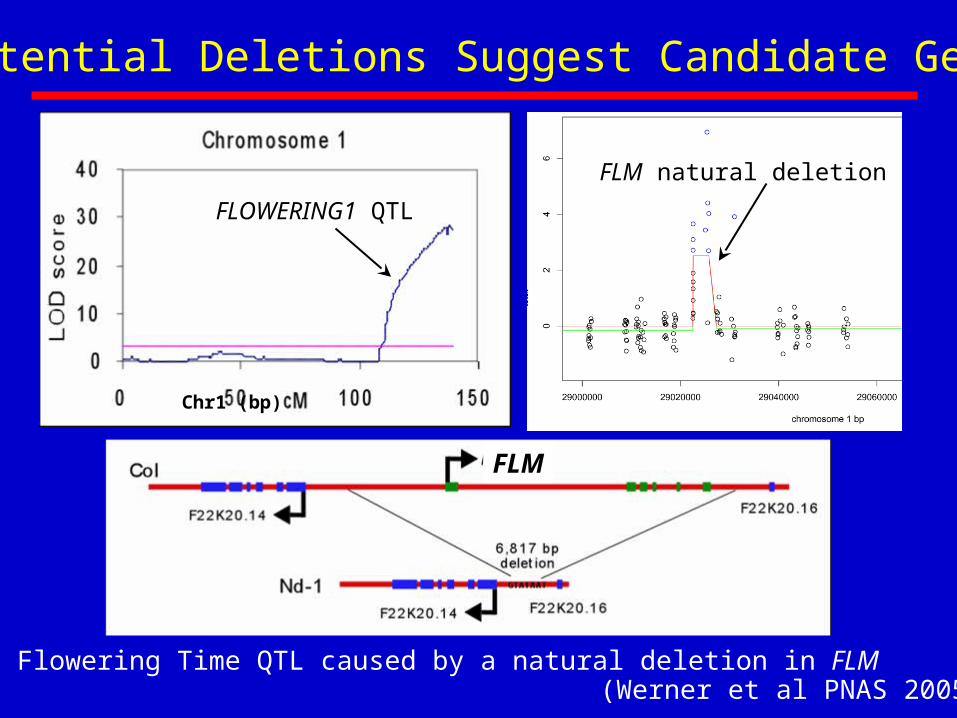
Potential Deletions Suggest Candidate Genes
FLOWERING1 QTL
Chr1 (bp)
Flowering Time QTL caused by a natural deletion in FLM
FLM
FLM natural deletion
(Werner et al PNAS 2005)

Chip genotyping of a Recombinant Inbred Line
Van x Col RIL 23
logLK
20
AA 20198
AB 587
BB 13064

Next Species….
Eco region diversity plant community population genomics.
Genetic variation within and between species and locations Remnant, restored, reconstructed, prairies savannahs Comparative population structure, in species assemblages Differential effects on annuals, perennials,
selfers, outcrossers
Categorize existing genetic diversity- Conservation GeneticsRestore with maximal regional diversity samples to allow natural selection breeding.
Next Species….
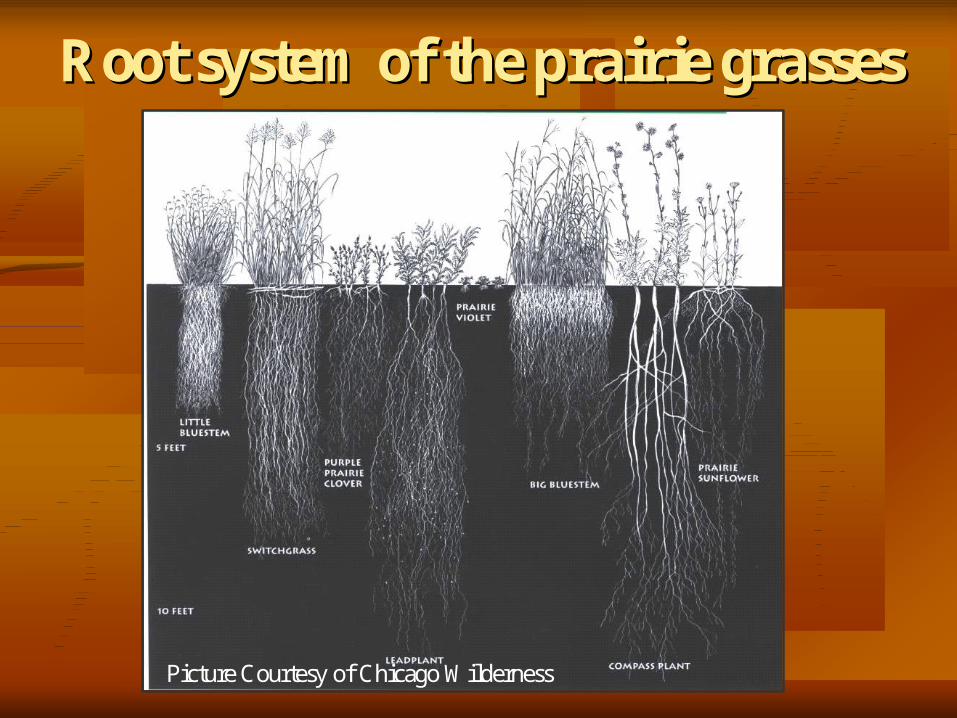
Root system of the prairie grassesRoot system of the prairie grasses
Picture Courtesy of Chicago Wilderness
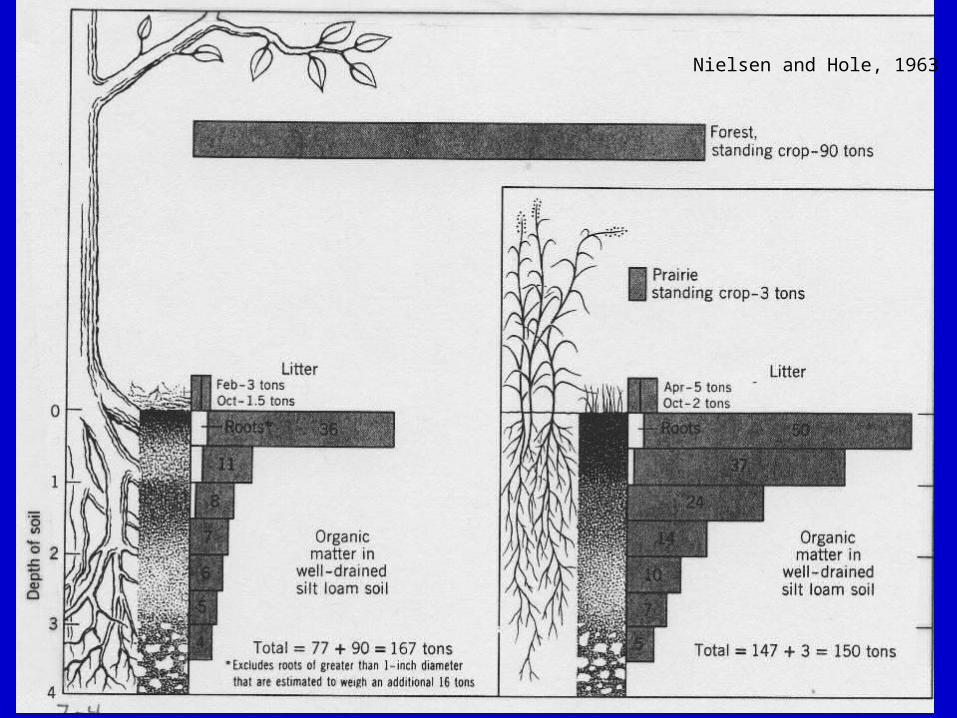
Nielsen and Hole, 1963

Are Biofuels the Answer?...
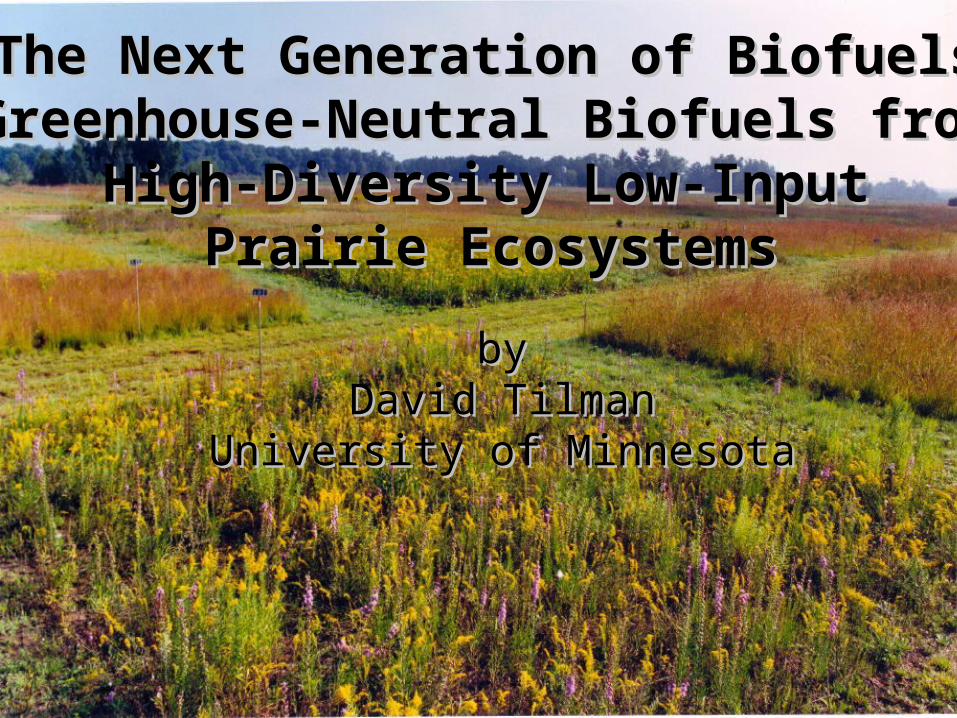
The Next Generation of Biofuels:The Next Generation of Biofuels:Greenhouse-Neutral Biofuels from Greenhouse-Neutral Biofuels from
High-Diversity Low-Input High-Diversity Low-Input Prairie EcosystemsPrairie Ecosystems
bybyDavid TilmanDavid Tilman
University of MinnesotaUniversity of Minnesota
http://www.plosone.org/

NaturalVariation.orgNaturalVariation.orgUSC
Magnus NordborgPaul Marjoram
Max Planck
Detlef Weigel
Scripps
Sam Hazen
University of Michigan
Sebastian Zoellner
USC
Magnus NordborgPaul Marjoram
Max Planck
Detlef Weigel
Scripps
Sam Hazen
University of Michigan
Sebastian Zoellner
University of Chicago
Xu ZhangYan Li
Peter RoycewiczEvadne Smith
Megan DunningJoy Bergelson
Michigan State
Shinhan Shiu
PurdueIvan Baxter
University of Chicago
Xu ZhangYan Li
Peter RoycewiczEvadne Smith
Megan DunningJoy Bergelson
Michigan State
Shinhan Shiu
PurdueIvan Baxter